Article

Basic Treatment in Natural Clinoptilolite for Improvement of Physicochemical Properties

by
Vanessa Castro De Souza
1,
Jhonny Villarroel-Rocha
2,
Maria José Gomes De Araújo
1,
Karim Sapag
2 and
Sibele B. C. Pergher
1,*
1
Laboratório de Peneiras Moleculares (LABPEMOL), Universidade Federal do Rio Grande do Norte, Campus de Lagoa Nova, CEP 59078-900 Natal, RN, Brazil
2
Laboratorio de Sólidos Porosos (LabSoP), INFAP-CONICET, Universidad Nacional de San Luis, CEP 5700 San Luis, Argentina
*
Author to whom correspondence should be addressed.
Minerals 2018, 8(12), 595; https://doi.org/10.3390/min8120595
Submission received: 30 September 2018 / Revised: 14 November 2018 / Accepted: 23 November 2018 / Published: 14 December 2018
(This article belongs to the Special Issue Natural Zeolites)

Abstract

:
Natural zeolites are low in cost and exhibit interesting properties for applications in adsorption and catalysis. However, the fact that they are natural materials, not obtained in pure form, and can incorporate various compensating ions can compromise their properties and restrict their use. As their textural and chemical properties are of great relevance for adsorption and catalysis applications, this work aims to study the modification of the natural zeolite clinoptilolite to obtain materials with better physicochemical properties. Clinoptilolite was treated with NaOH under various conditions. The treated material was characterized by X-ray diffraction, X-ray fluorescence, N2 adsorption and desorption at 77 K, CO2 adsorption at 273 K, and pyridine adsorption. The treatment allowed the removal of silicon from the material, improving the textural properties and preserving the structural Al. With the removal of Si, the Si/Al ratio decreased, and consequently, the number of acid and adsorptive sites increased. In addition, statistical planning revealed that the concentration of NaOH is the parameter that most influences the improvement of the textural properties.

1. Introduction

Zeolites are hydrated aluminosilicates that can be natural or synthetic and whose three-dimensional structures [1] include silicon and aluminum atoms bound by oxygen atoms arranged in tetrahedral units, arranged in a crystalline structure that contains channels and cavities that originate micropores [2,3,4]. The isomorphic substitution of Si by Al in the structure, in addition to imparting acidity to the material, generates negative charges, thus necessitating the presence of cations of alkaline and alkaline earth metals to adjust the structural charge [3,5].
The clinoptilolite is one of the zeolites most abundantly found in nature and, for this reason, is the most widely used natural zeolite [6,7,8,9]. It is a zeolite of the heulandite group, whose members present the same structure, differentiated only by the amount of aluminum present in the network and consequently differing in properties such as thermal stability; clinoptilolite is the most thermally stable [10]. The structure of clinoptilolite consists of three channels: A (0.72 nm × 0.44 nm) and B (0.41 nm × 0.44 nm), which are parallel, and C (0.40 nm × 0.55 nm), which intersects channels A and B as shown in Figure 1 [6,10].
Natural zeolite contains impurities that vary according to the area in which it is extracted and limit its application. An alternative is the use of treatments to eliminate these impurities and improve the physicochemical properties, thus enabling the application of these natural materials in a wider variety of processes. Textural characteristics, such as specific surface area, pore volume, pore size, and acidity, are extremely important for applications in adsorption and catalysis [6,11,12]. For this reason, bases, acids, and hydrothermal treatments can be applied post-synthesis to remove impurities and improve some physicochemical properties of natural materials [2]. In a previous study, our group examined the acid treatment of the natural clinoptilolite zeolite, which improved its textural properties, although it also decreased the Al content and consequently the acidity [13]. Thepost-synthesis basic treatment of zeolites is widely applied and involves the preferential extraction of Si from the structure by hydrolysis in the presence of OH. This treatment alters the specific surface area and pore size, generates mesoporosity, and improves the adsorption capacity and accessibility, and in addition, enriches the aluminum content and thus improves the acidic properties of the zeolite [11,12,14,15], which is very important for application in catalysis. In this sense, the parameters of the basic treatments applied to natural zeolite materials, such as concentration, time, and temperature, should be studied in order to improve the ability to obtain materials with improved and specific final properties.
Hence, the present work aims to evaluate the effects of those three parameters of the basic treatment using NaOH on the final properties of the natural clinoptilolite zeolitic material using the experimental statistical design tool. In order to describe statistically the studied responses for the understanding of the physicochemical properties of clinoptilolite in all the analyzed parameter ranges, a model and equation were used.

2. Materials and Methods

2.1. Raw Material

Natural clinoptilolite from Cuba was used, supplied by Celta Brasil, and this zeolite presented the following elemental composition: 13.13% Al2O3, 73% SiO2, 4.38% CaO, 2.45% Fe2O3, 4.6% K2O, 1.3% MgO, 0.4% Na2O, 0.03% MnO, 0.32% TiO2, 0.05% SrO, 0.03% ZrO2, and 0.06% SO3.

2.2. Modification of Materials

For the basic treatment, 2 g of natural zeolite (ZN) was used and 40 mL of 0.1 to 3 mol/L sodium hydroxide were added. The suspension was kept under stirring for 0.5–4 hat a temperature of 50 to 90 °C. After the treatments, the material was separated by filtration and washed with distilled water until the pH of the wash water reached approximately 7. Subsequently, the material was dried at 100 °C for 16 h.
An experimental design of factorial type (2k) 23 was performed for three independent variables (time, temperature, and base concentration); 11 experiments were performed including three central points in order to give statistical consistency to the mathematical model. Table 1 shows the experiments performed for the statistical experimental design (with real values).
Data analysis and determination of the polynomial (statistic model), response surfaces, and optimizations were carried out using Statgraphics commercial software.
Analysis of variance (ANOVA) was used to evaluate the quality of fit of the obtained statistical model. The model takes into account the algebraic decomposition of the deviations of the observed responses in relation to the average global response obtained, that is, deviations from the prediction made by the model and difference between the observed value and the expected value that should be small for the model to be well adjusted. Assuming that the errors obtained follow a normal distribution, and that the ratio of the square-mean values obtained in the analysis of variance follows a distribution F, we can compare this value of F obtained with the value of F tabulated at the desired confidence level (95%) and thus, validate or not, statistically the obtained model [16].

2.3. Characterization of Materials

X-ray diffraction analyses were performed on a Bruker D2 Phaser diffractometer (Billerica, MA, USA) from 5° to 45° using Cu (λ = 1.54 Å), a LynxEye detector (192 channels), and a 0.02 mm divergent groove. Analysis conditions: slit = 0.6 nm; ACS = 1; detector = 5.82 keV; time = 0.1 s; step size = 0.02°.
For the chemical analysis, a Bruker S2 Ranger (Billerica, MA, USA) was used with Pd or Ag radiation at max power = 50 W, max voltage = 50 kV, and max current = 2 mA and an XFlash® Silicon Drift Detector (Billerica, MA, USA).
For the infrared experiments, an FT-IR Nicolet 710 (Thermo Fisher Scientific, Waltham, MA, USA) was used with vacuum cells and shaped KBr pellet samples. The pellets were degassed overnight at 673 K under a vacuum of 10−3 Pa to avoid the presence of water and organic matter in the material. The base spectra were recorded at room temperature. For the acidity measurements, pyridine (vapor) was kept in contact with the sample at 6.5 × 10² Pa until equilibration. Desorption was carried out by heating for 1 h and vacuum at increasing temperatures of 423, 523, and 623 K, and after each desorption step, the spectrum was recorded at room temperature.
N2 (99.999%) adsorption/desorption analyses at 77 K were performed on an Autosorb-1MP manometric adsorption instrument (Quantachrome Instruments, Boynton Beach, FL, USA), using 0.3 g of the zeolites. Degassing was performed at a temperature of 353 K for 48 h up to 0.5 Pa of final pressure. The Brunauer–Emmett–Teller (BET) method [17] was used to calculate the specific surface area (SBET) of the samples from the N2 adsorption data, taking into account the criteria proposed by Rouquerol [18]. The αs-plot method using LiChrospher Si-1000 as reference material [19] was used to calculate the micropore volume (VμP) and the external surface area (SEXT). The Gurvich rule was used to measure the total pore volume (VTP) from the N2 adsorption data obtained at a relative pressure of 0.98. From the CO2 adsorption data obtained at 273 K, the micropore volume was obtained using the Dubinin–Radushkevich (DR) method [20], and the micropore size distribution was obtained using the Horvath and Kawazoe (HK) method [21].
The thermogravimetric analysis was performed with the objective of evaluating the thermal degradation characteristics. It was performed on a TGA with TA Instruments Q600 SDT analyzer (New Castle, DE, USA) with 100 mL·min−1 flow in an oxidizing atmosphere with a heating rate of 10 °C∙min−1 from room temperature to 1000 °C.

3. Results and Discussion
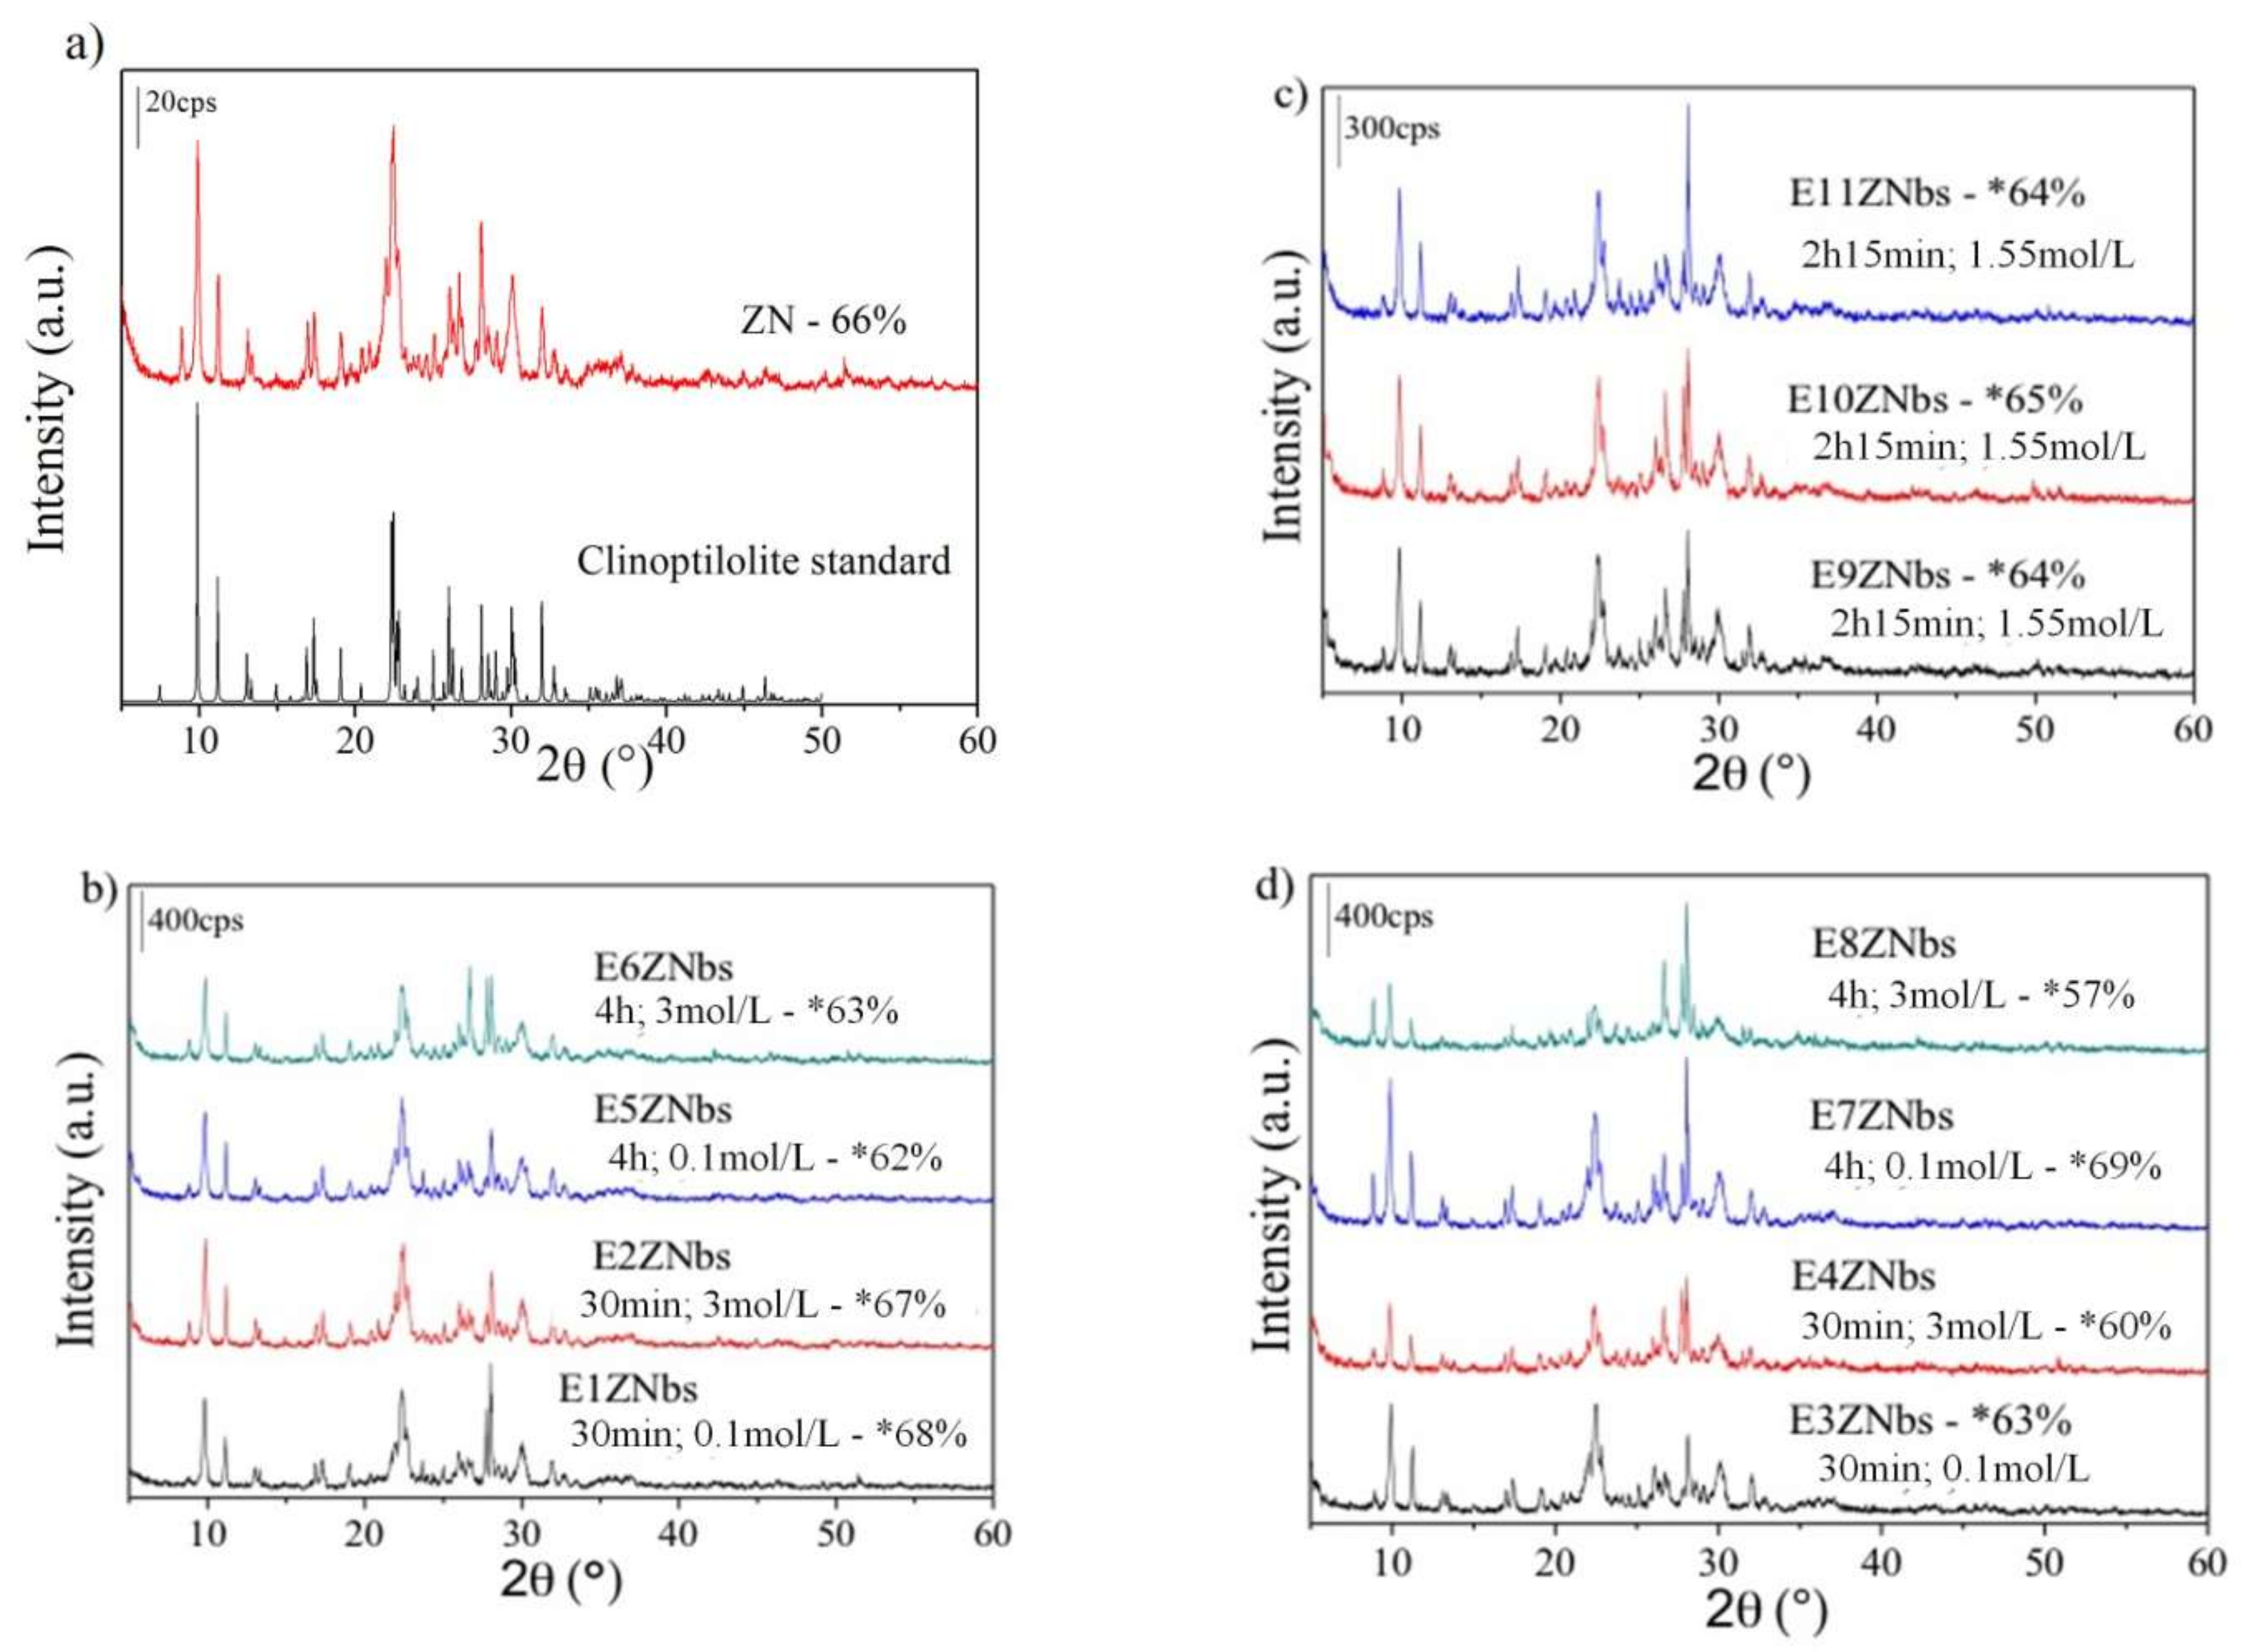
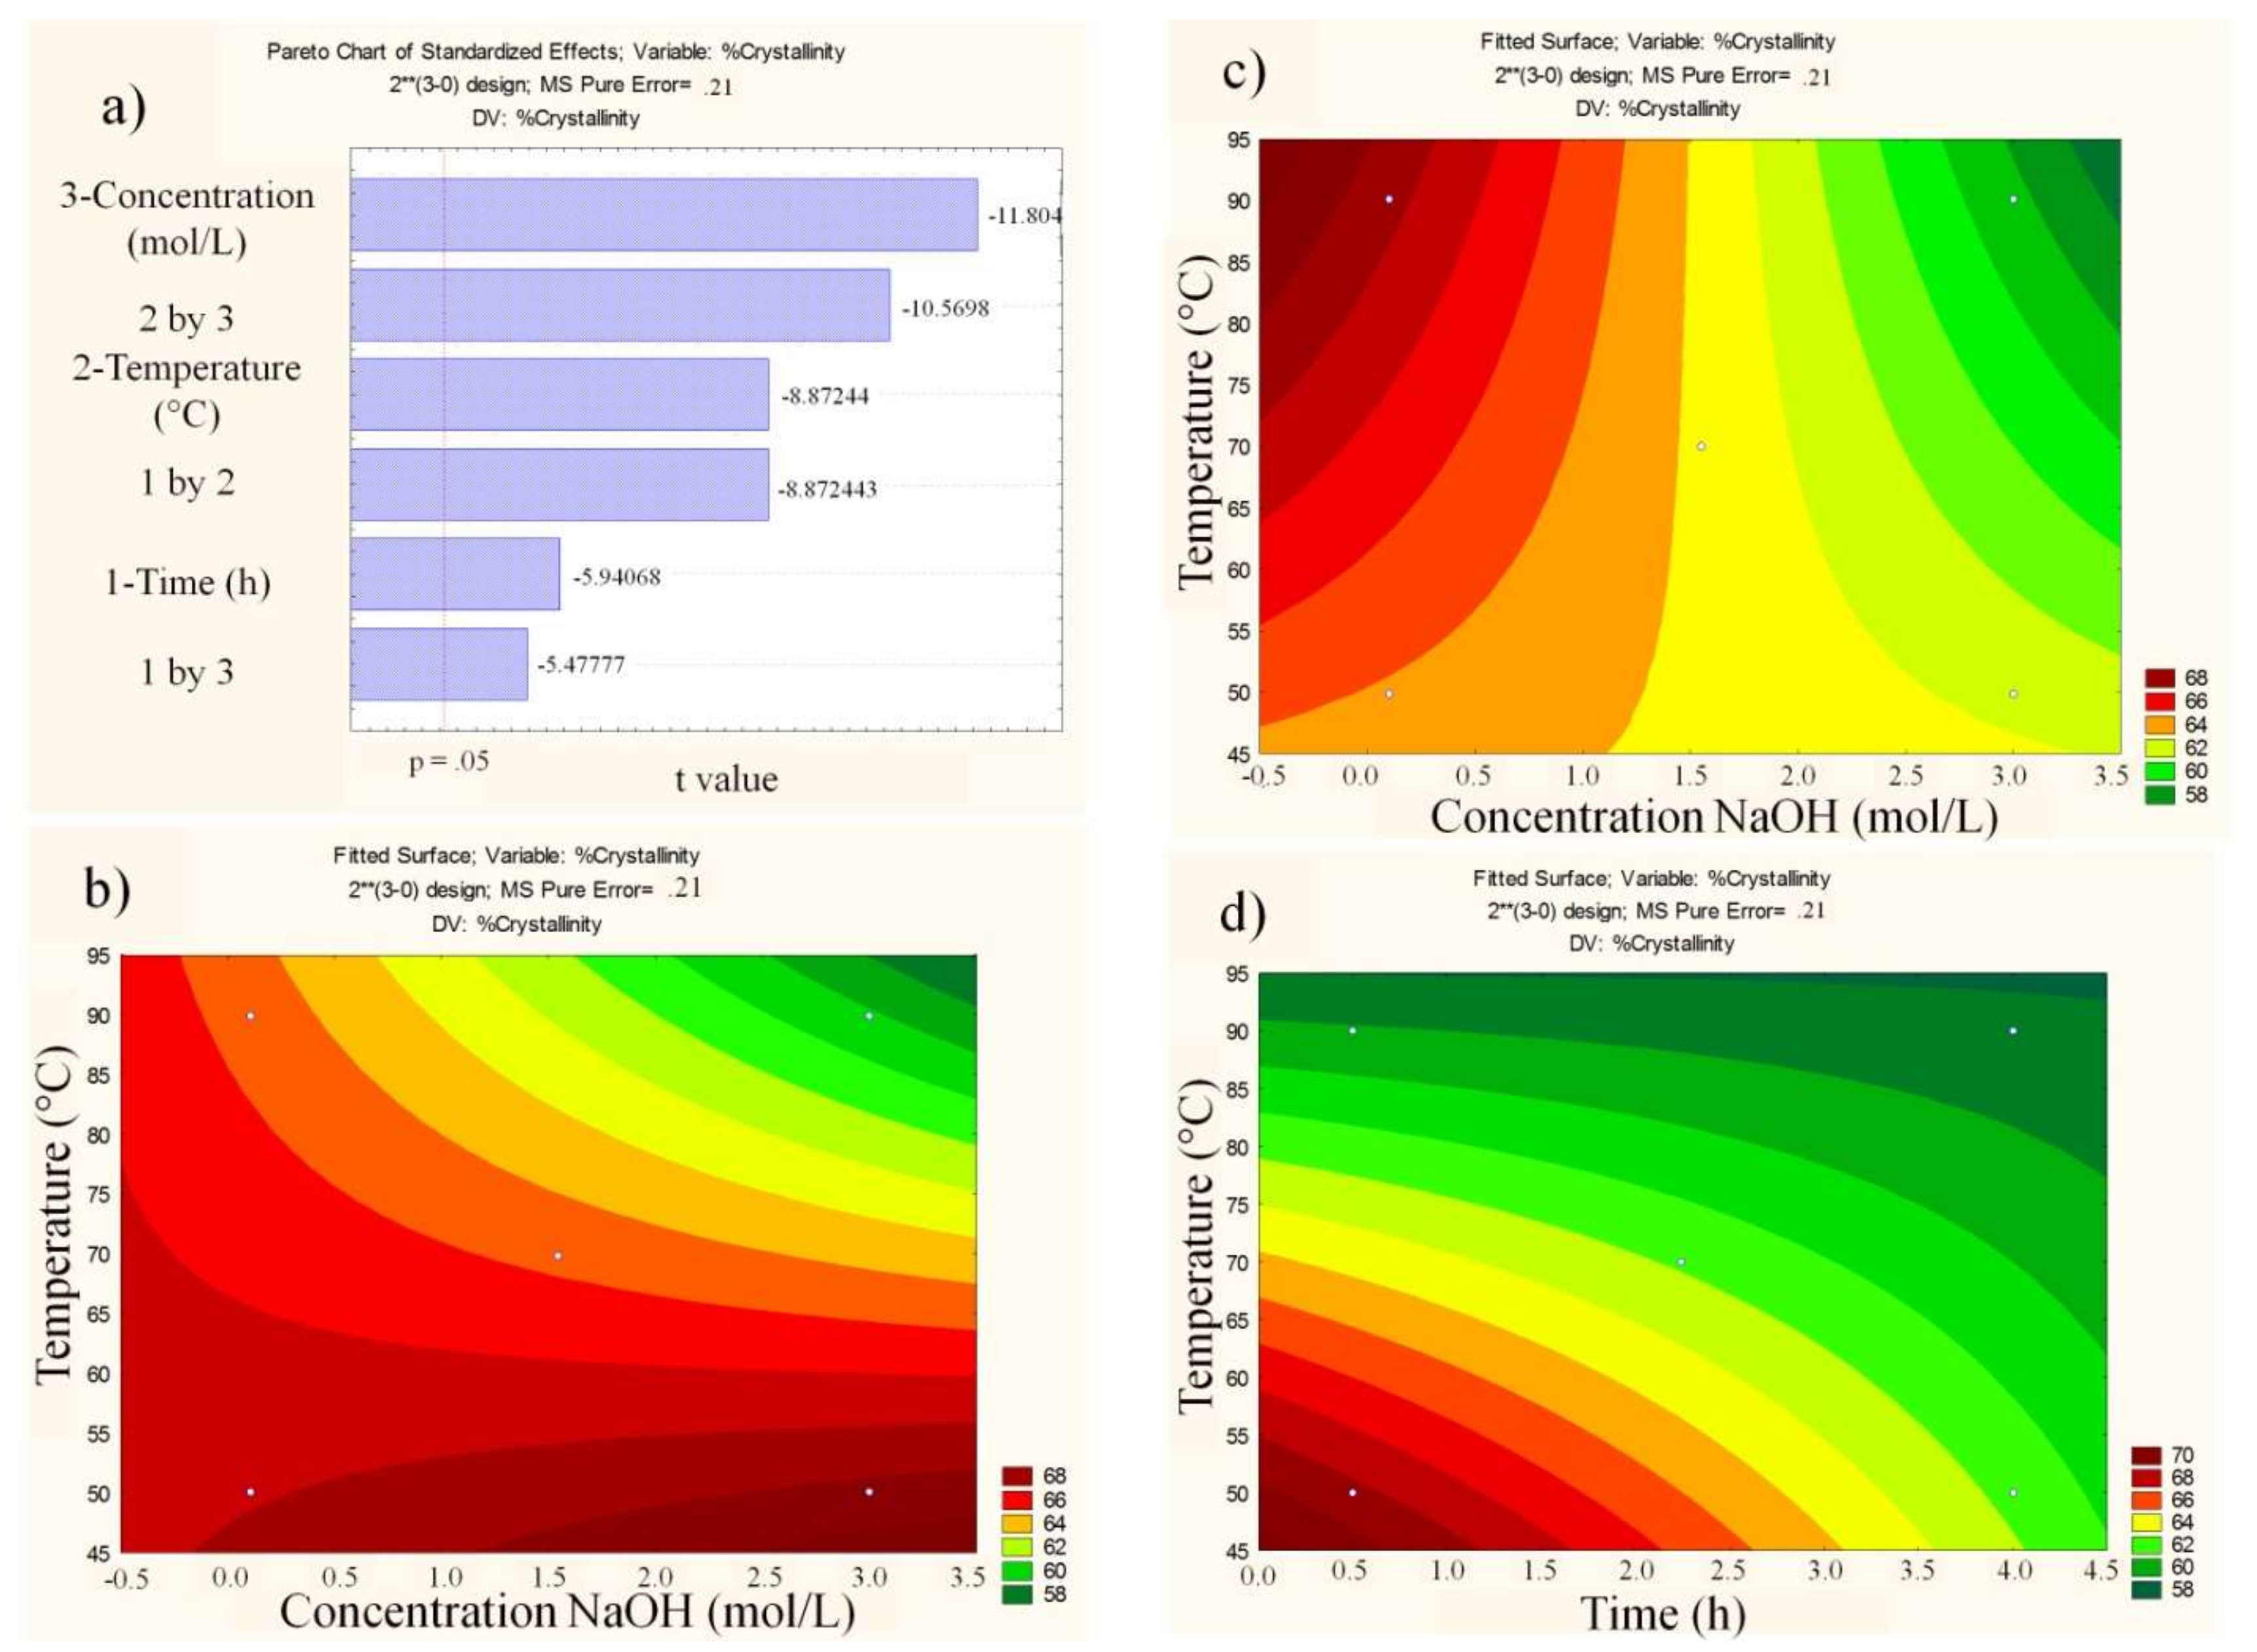
Statistical experimental design was the tool used to evaluate the effect of the parameters time, temperature, and NaOH concentration on the effectiveness of a basic treatment to improve the properties of natural zeolite in terms of crystallinity, Si/Al molar ratio, and textural properties. In addition, the influence of the basic treatment on the morphological properties and acidity of the zeolite was evaluated.

3.1. Crystallinity

The diffractograms of the natural and treated samples are shown in Figure 2. The percent crystallinity does not vary much with the treatment since the natural zeolite has a crystallinity of 66%. However, there is not such a great variation in crystallinity when comparing all treatments, as it is seen that the increase in temperature favors the formation of magnesium and aluminum silicate with reflection intensification 2θ = 28°. When analyzing the response of the experimental design in Figure 3a, all parameters (time, temperature, concentration, and interaction between them) show significant effects at 95% confidence, with the concentration (negative effect) being the parameter which influences the crystallinity. The interaction parameter between time and temperature is the only one with a positive effect, that is, the higher the two parameters, the greater the crystallinity. The crystallinity was calculated taking into account the area under all the reflections present in the diffractogram, being the natural material used as a reference.
In the ANOVA (analysis of variance), the calculated F (20.61) was larger than the tabulated F (4.46), and the lack of fit of the calculated F (14.99) was smaller than that of the tabulated F (19.33), showing that it was possible to obtain the response surface, as shown in Figure 3b–d, and the equation describing the model: %Crystallinity = 63.76 − 0.96∙t − 1.44∙T − 1.91∙C + 1.44∙tT − 0.89∙tC − 1.71∙TC, where t is time, T is temperature, and C is the concentration at the coded values.

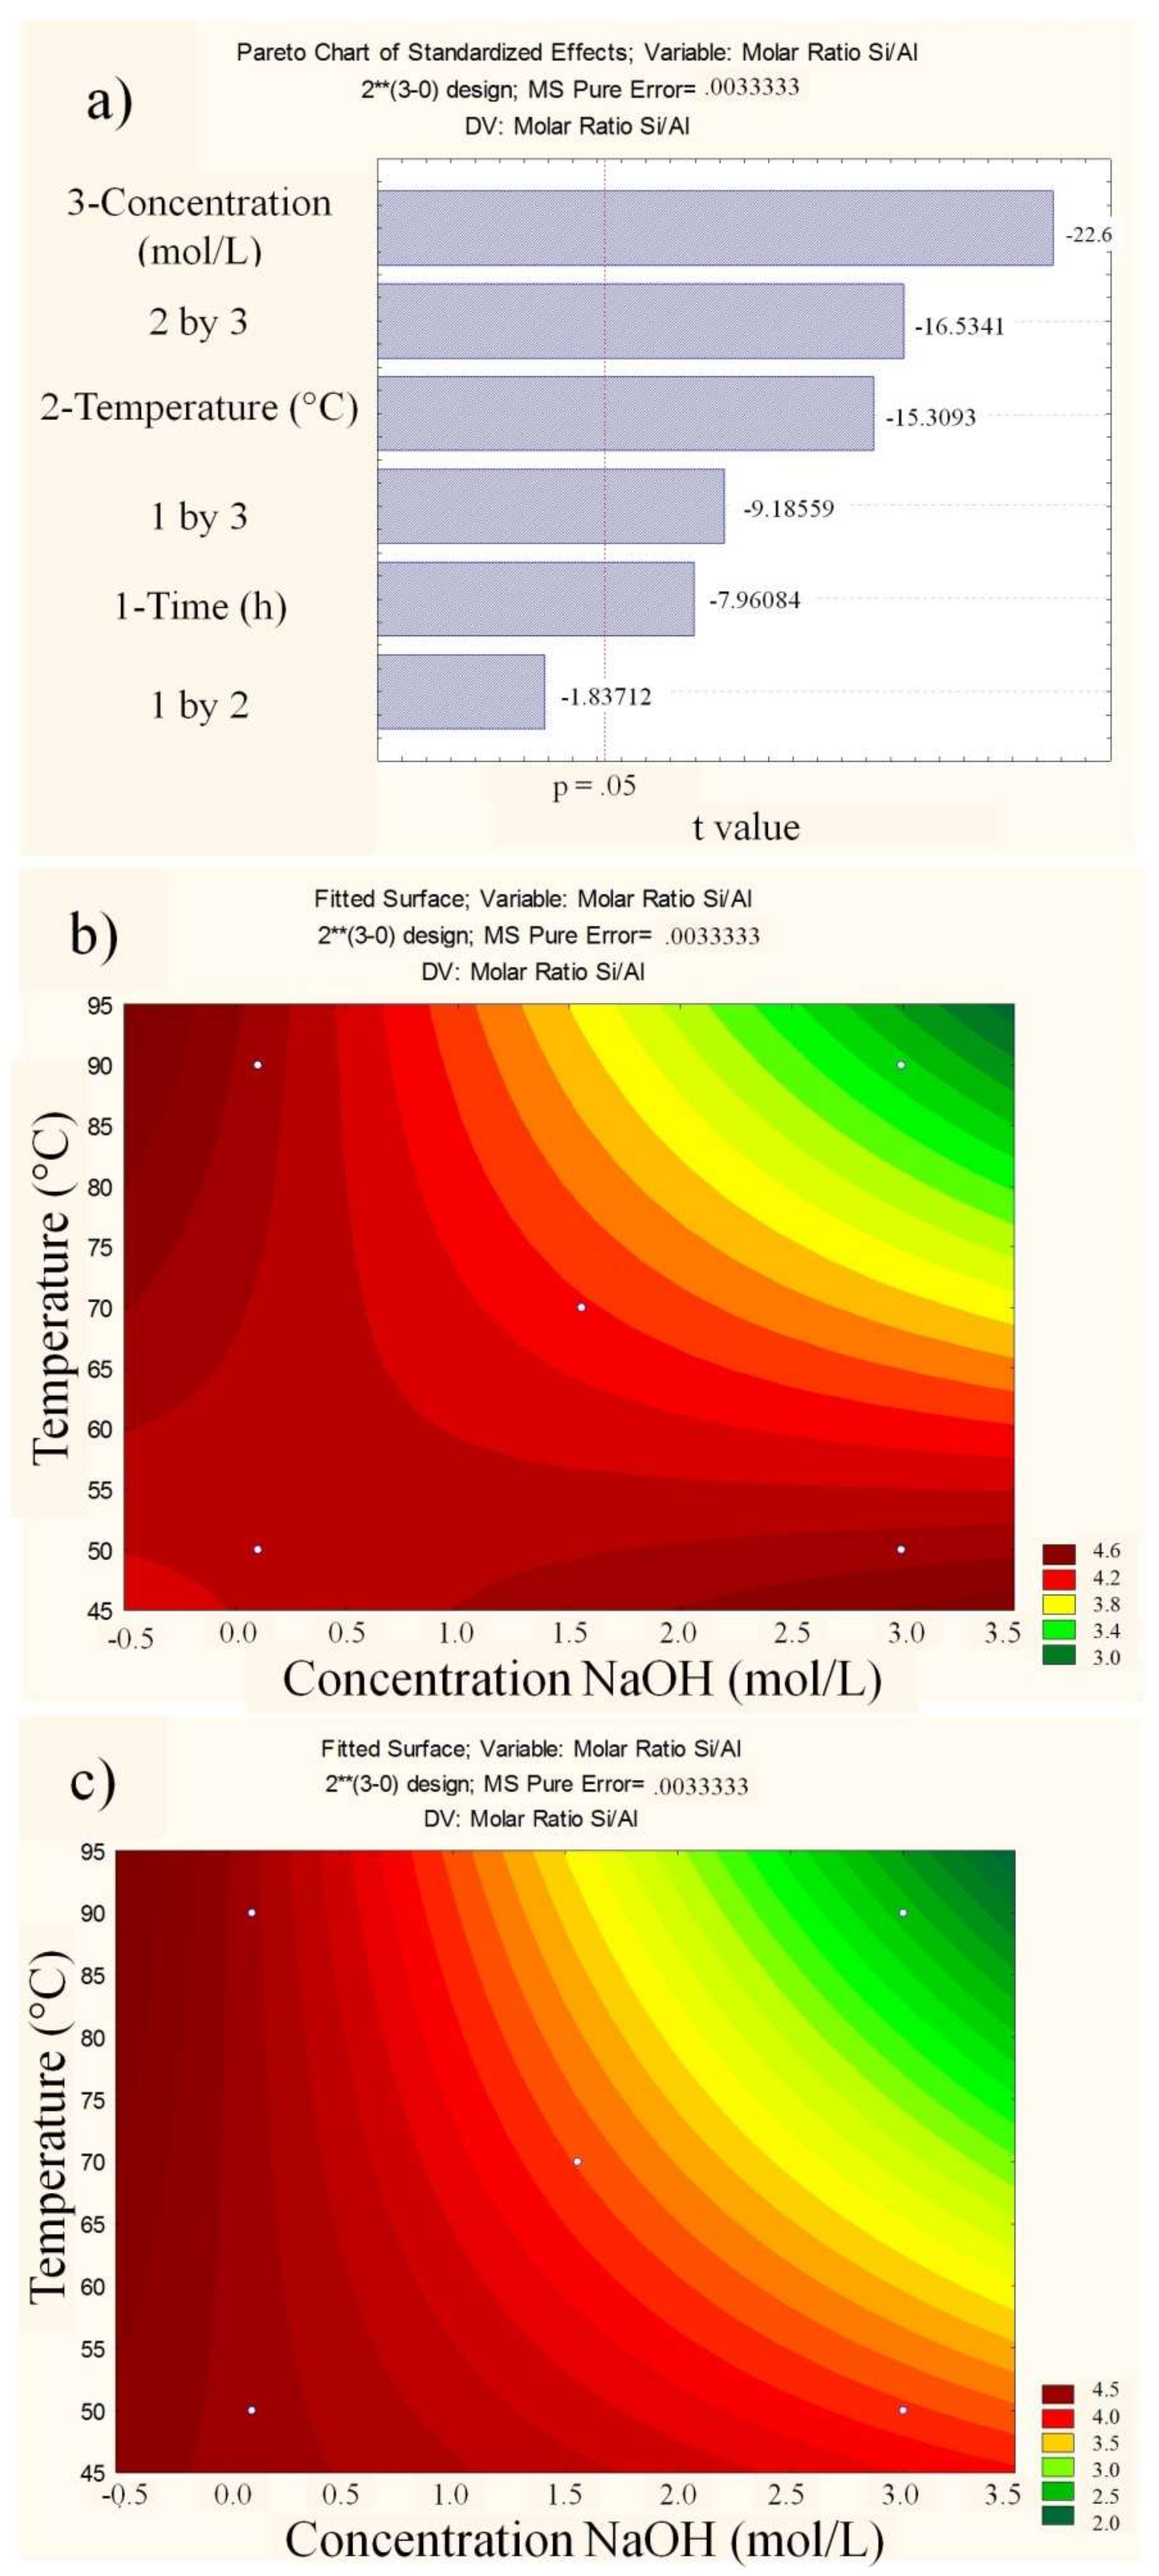
3.2. Si/Al Molar Ratio

The molar ratio Si/Al can be obtained from the values of silicon and aluminum obtained from the chemical analysis. In Table 2, we can see that under mild conditions of temperature, concentration, and time, there is practically no removal of silicon that becomes more effective under severe conditions. It is expected that under severe conditions of basic treatment leading to demetallization with the preferential removal of silicon, extreme conditions are required because the Si/Al ratio of clinoptilolite is low and presentsa large amount of aluminum in the structure [22]. Demetallization with silicon removal occurs with basic treatment because the negative charge of the AlO4 tetrahedron makes it difficult to cleave the Si–O–Al bond in the presence of OH, with the most easily cleaved Si–O–Si bond [14,23,24].
In Figure 4a, the interaction of time with temperature is the only parameter that is not significant for the Si/Al molar ratio response. In addition, all the parameters show a negative effect; that is, the higher the treatment conditions, the lower the Si/Al molar ratio, with the concentration being the most significant parameter. Time is the parameter with the least influence. The response surfaces for times of 0.5 h and 4 h are shown in Figure 4b,c. The time of 4 h, temperature of 90 °C, and concentration of 3.5 mol∙L−1 were the optimal conditions to obtain a material with a lower molar Si/Al ratio and lower energy cost. In ANOVA, the calculated F (10.50) is greater than the tabulated F, and for the lack of adjustment, the calculated F (17.65) is lower than the tabulated F (19.33). Thus, the response curves can be obtained, and the equation that describes the model is as follows: Si/Al = 3.95 − 0.16∙t− 0.31∙T− 0.46∙C− 0.18∙tC− 0.34∙TC, where t, T, and C are in coded values.

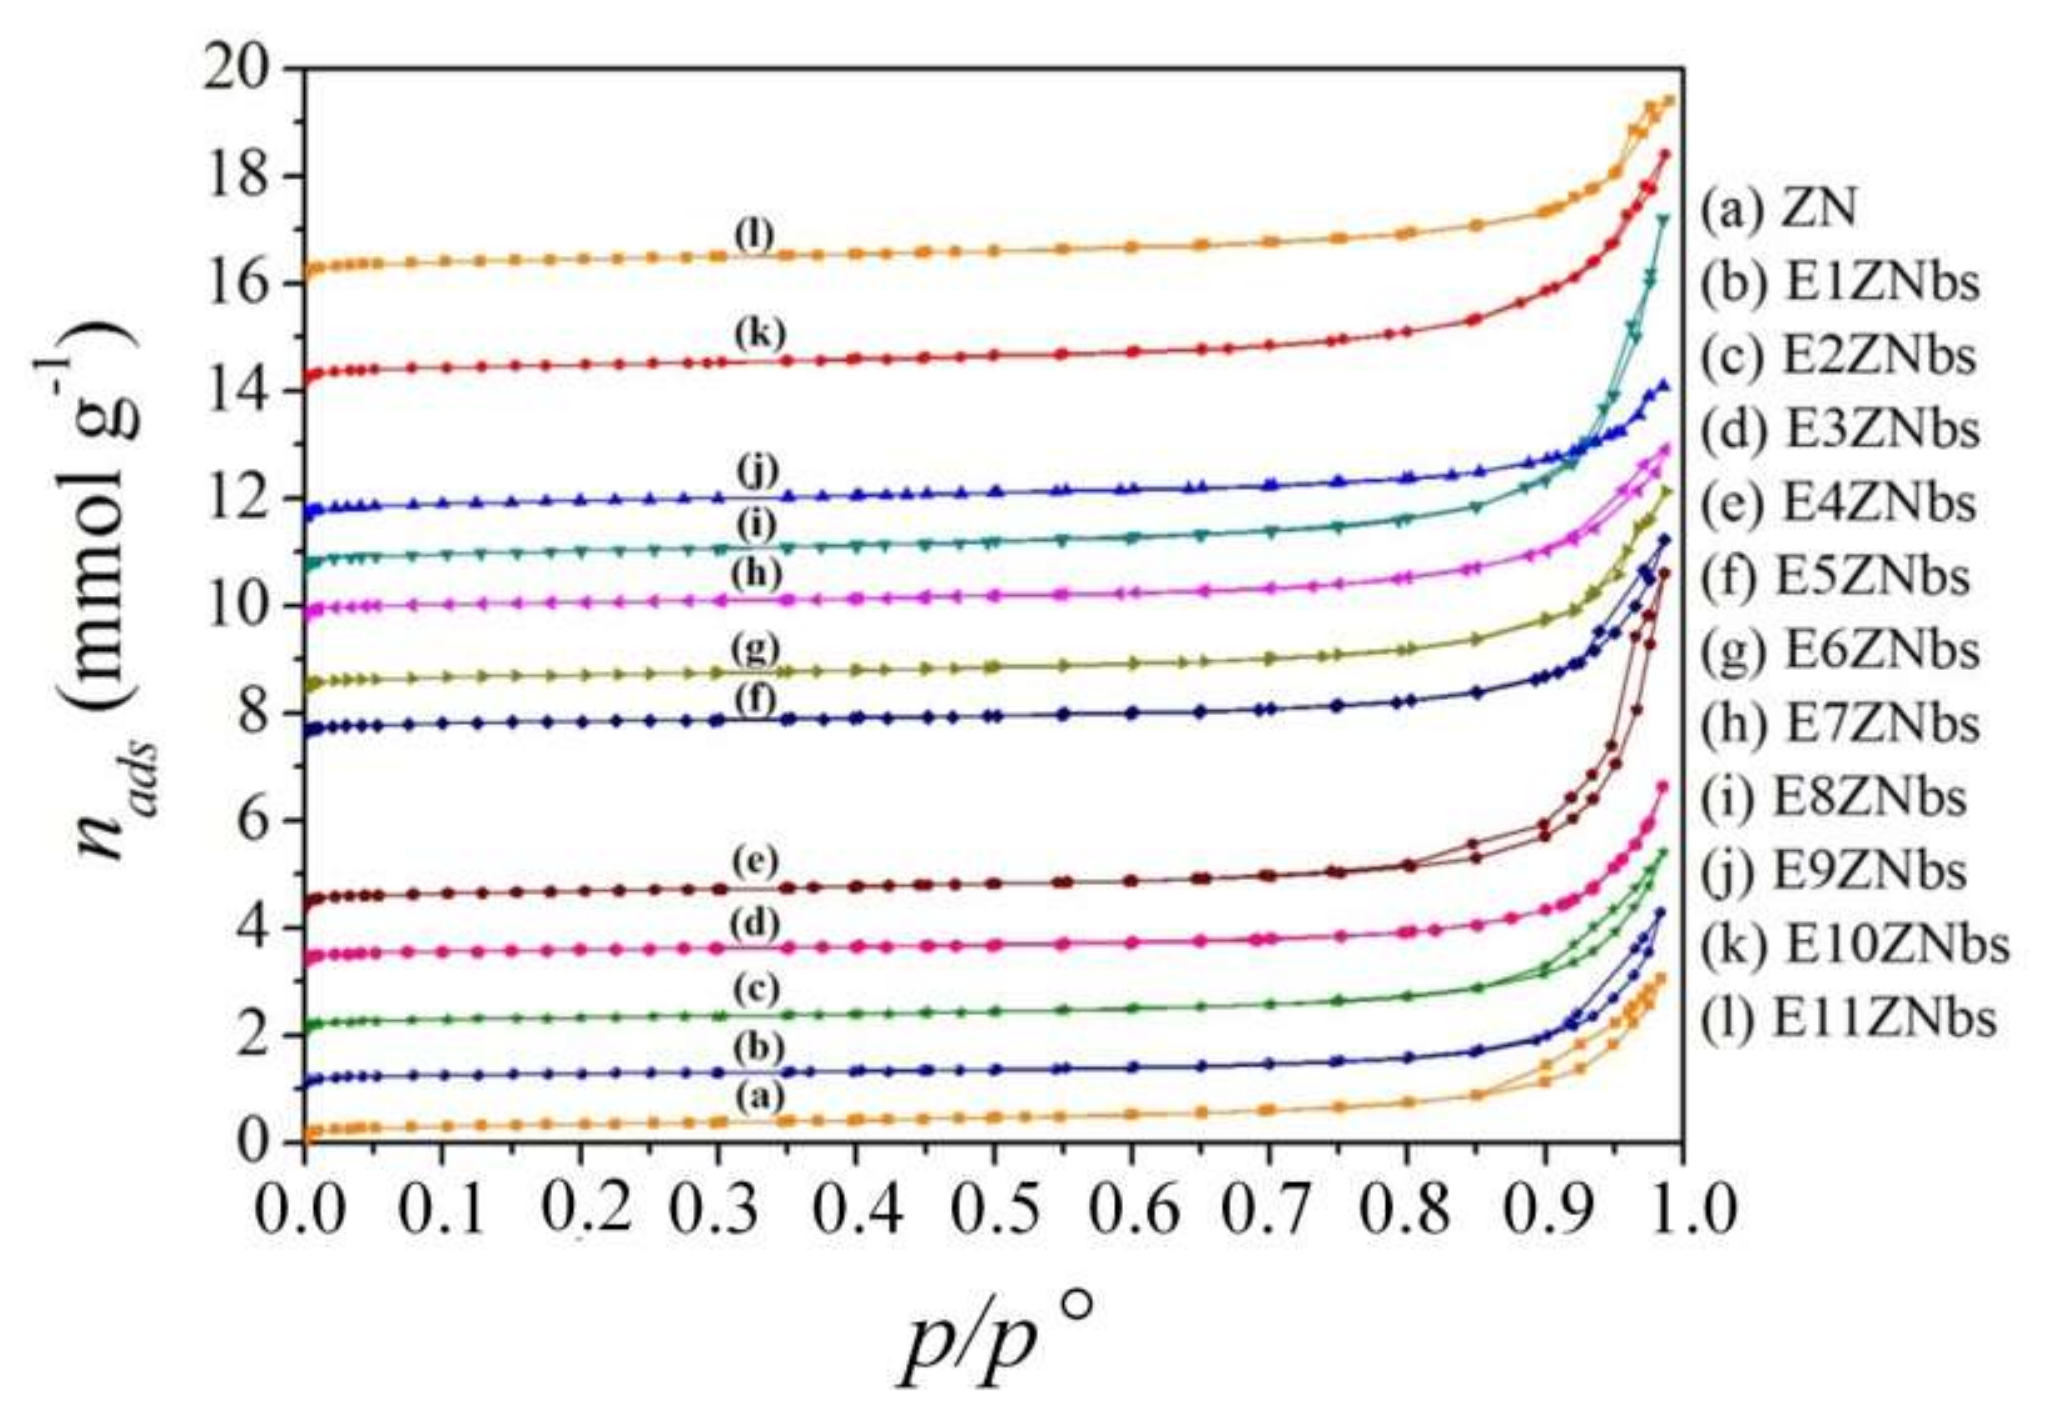
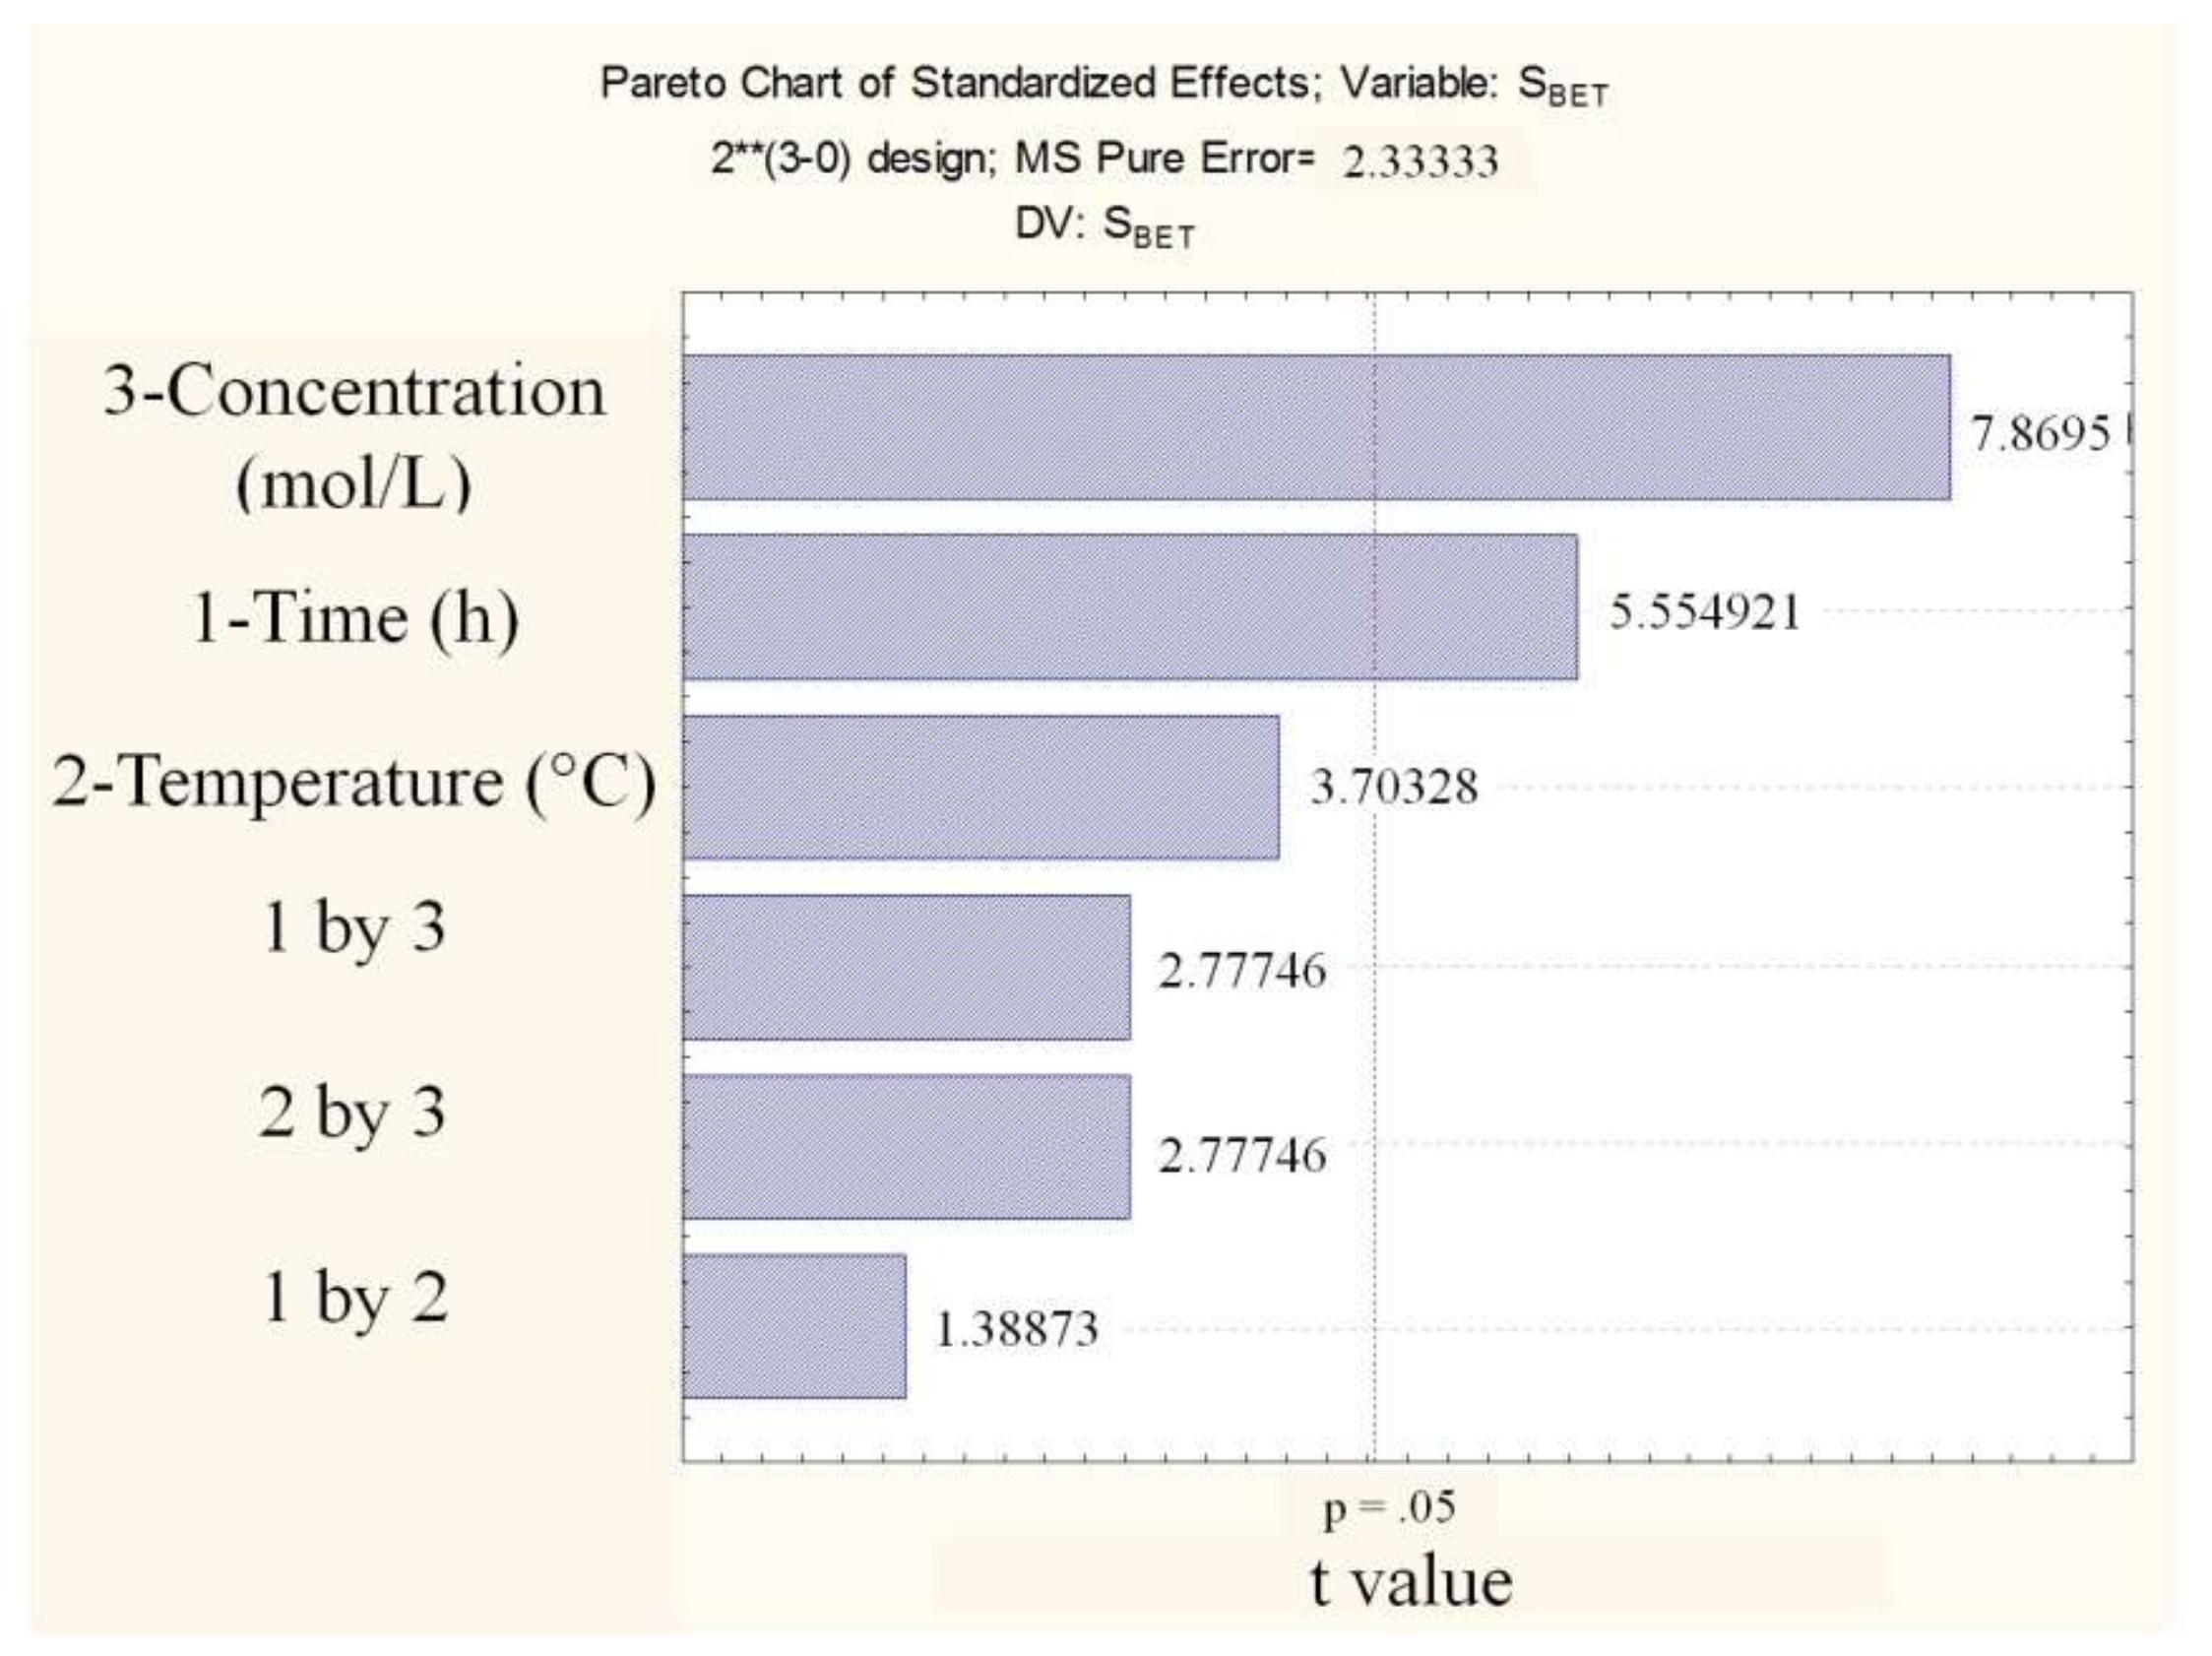
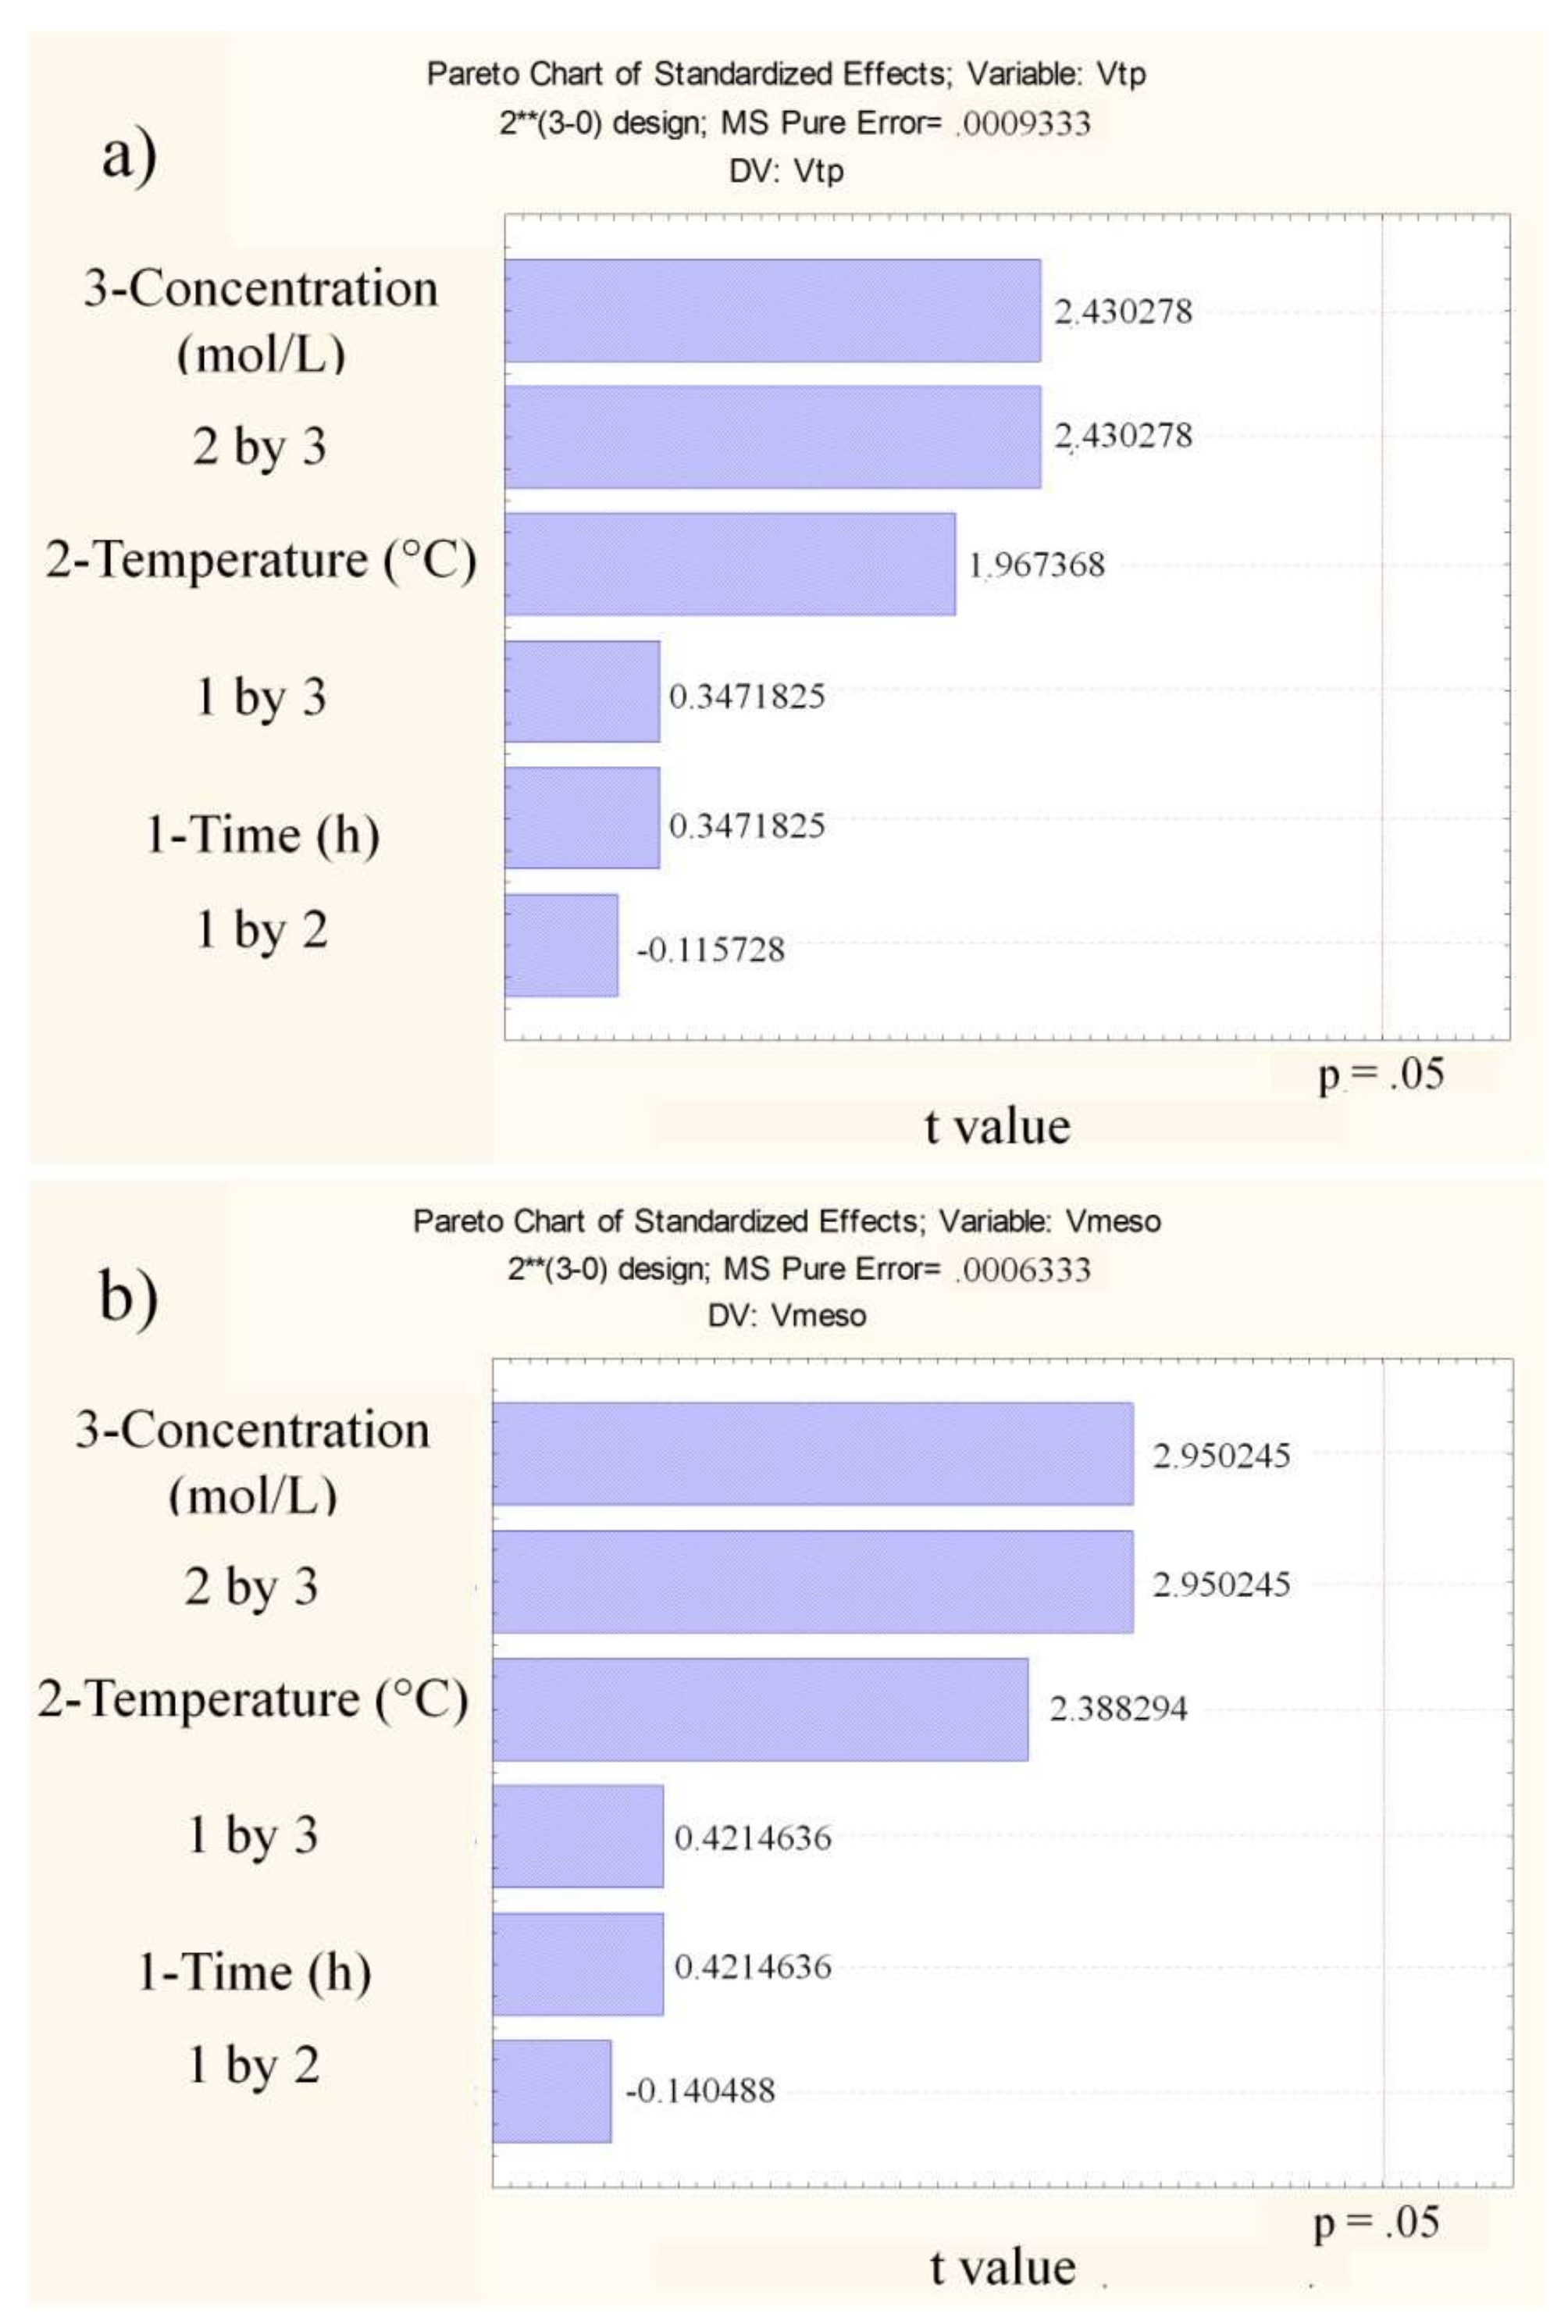
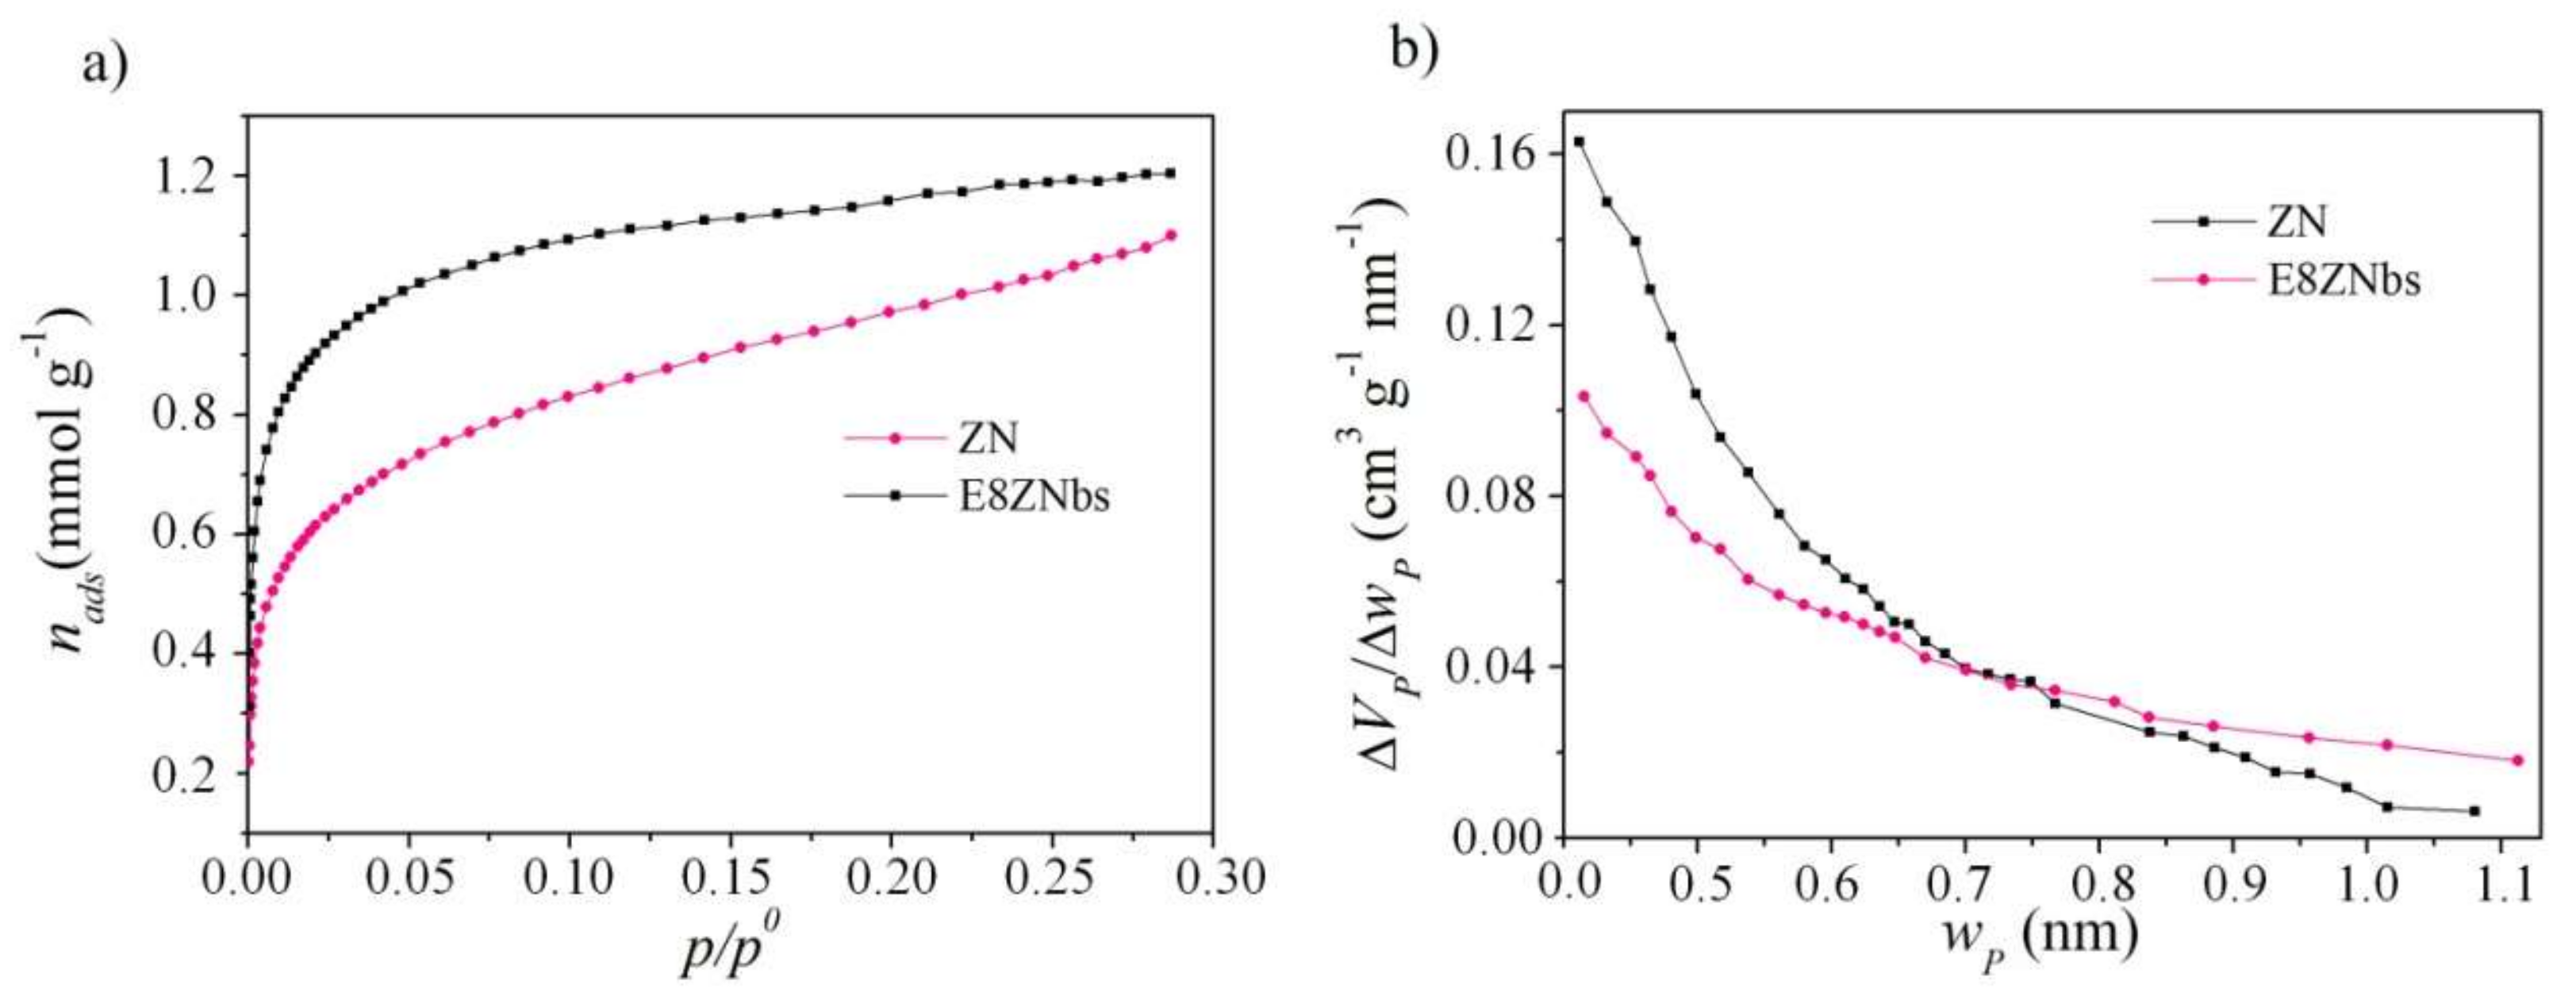
3.3. Textural Analysis

Comparing the crystallinity values obtained after the treatment with the specific surface area shows that the increase in crystallinity probably occurs due to the removal of amorphous Si, while the reduction in crystallinity occurs due to the removal of Si from the structure. Therefore, in this case, high crystallinity does not alter the textural properties.
Figure 5 shows the N2 adsorption/desorption isotherms, exhibiting low adsorption at low relative pressure and a hysteresis characteristic of interparticle mesopores of the aggregates present in the zeolites. The amount adsorbed increases with the treatment, as well as the total pore volume.
In Table 3, it is observed that the basic treatment favors the removal of silicon that directly influences the texture properties, with a slight increase in the specific surface area and mesopore volume, since the modification method is effective to generate secondary mesoporosity (interparticle mesopores) [6,15]. The mesopore volume increases from 0.10 cm³∙g−1 (ZN) to 0.22 cm³∙g−1 (E8ZNbs). There is an increase in the mesopore size when the natural zeolite was compared with the E8ZNbs, the pore size goes from 17 nm in the natural zeolite to 22.8 and 62 nm in the E8ZNbs.
Evaluating the influence of treatment parameters on the specific surface area response reveals that only concentration and time are significant, as shown in Figure 6. Time, which was the least influential parameter on the crystallinity and Si/Al molar ratio, now becomes important for the specific surface area response, showing the need to adjust all the parameters to address the combined properties of a material. Thus, to obtain better textural properties, the concentration and time values must be increased; however, these changes in turn decrease the crystallinity. Increasing the NaOH concentration decreases the crystallinity, increases demetallation, and increases some textural properties.
In the analysis of variance (ANOVA), the calculated F (4.26) is not four times greater than the tabulated F (4.46), and for lack of fit, the calculated F (8.89) is smaller than the tabulated F (19.33), thus allowing the response surface and the equation describing the model cannot be obtained.
For the total pore volume and the mesopore volume, none of the parameters is significant at the 95% confidence interval, as shown by the Pareto graph in Figure 7, but the concentration is the parameter with the greatest influence on the total pore volume.
The sample E8ZNbs had the best textural properties (obtained by N2 adsorption/desorption analysis). To better examine the microporosity of this sample, the CO2 adsorption was analyzed at 0 °C, as shown in Figure 8. The treatment decreased the micropore volume, as shown in Figure 8a, which was originally 0.05 cm3∙g−1 and decreased slightly to 0.04 cm3∙g−g after treatment. This change was to be expected because of the aggressiveness of the basic treatment, since it favors the formation of mesopores. Furthermore, in Figure 8b, we have the micropore size distribution obtained by the HK method, in which the zeolite prior to treatment and after treatment have a modal micropore size less than 0.42 nm.

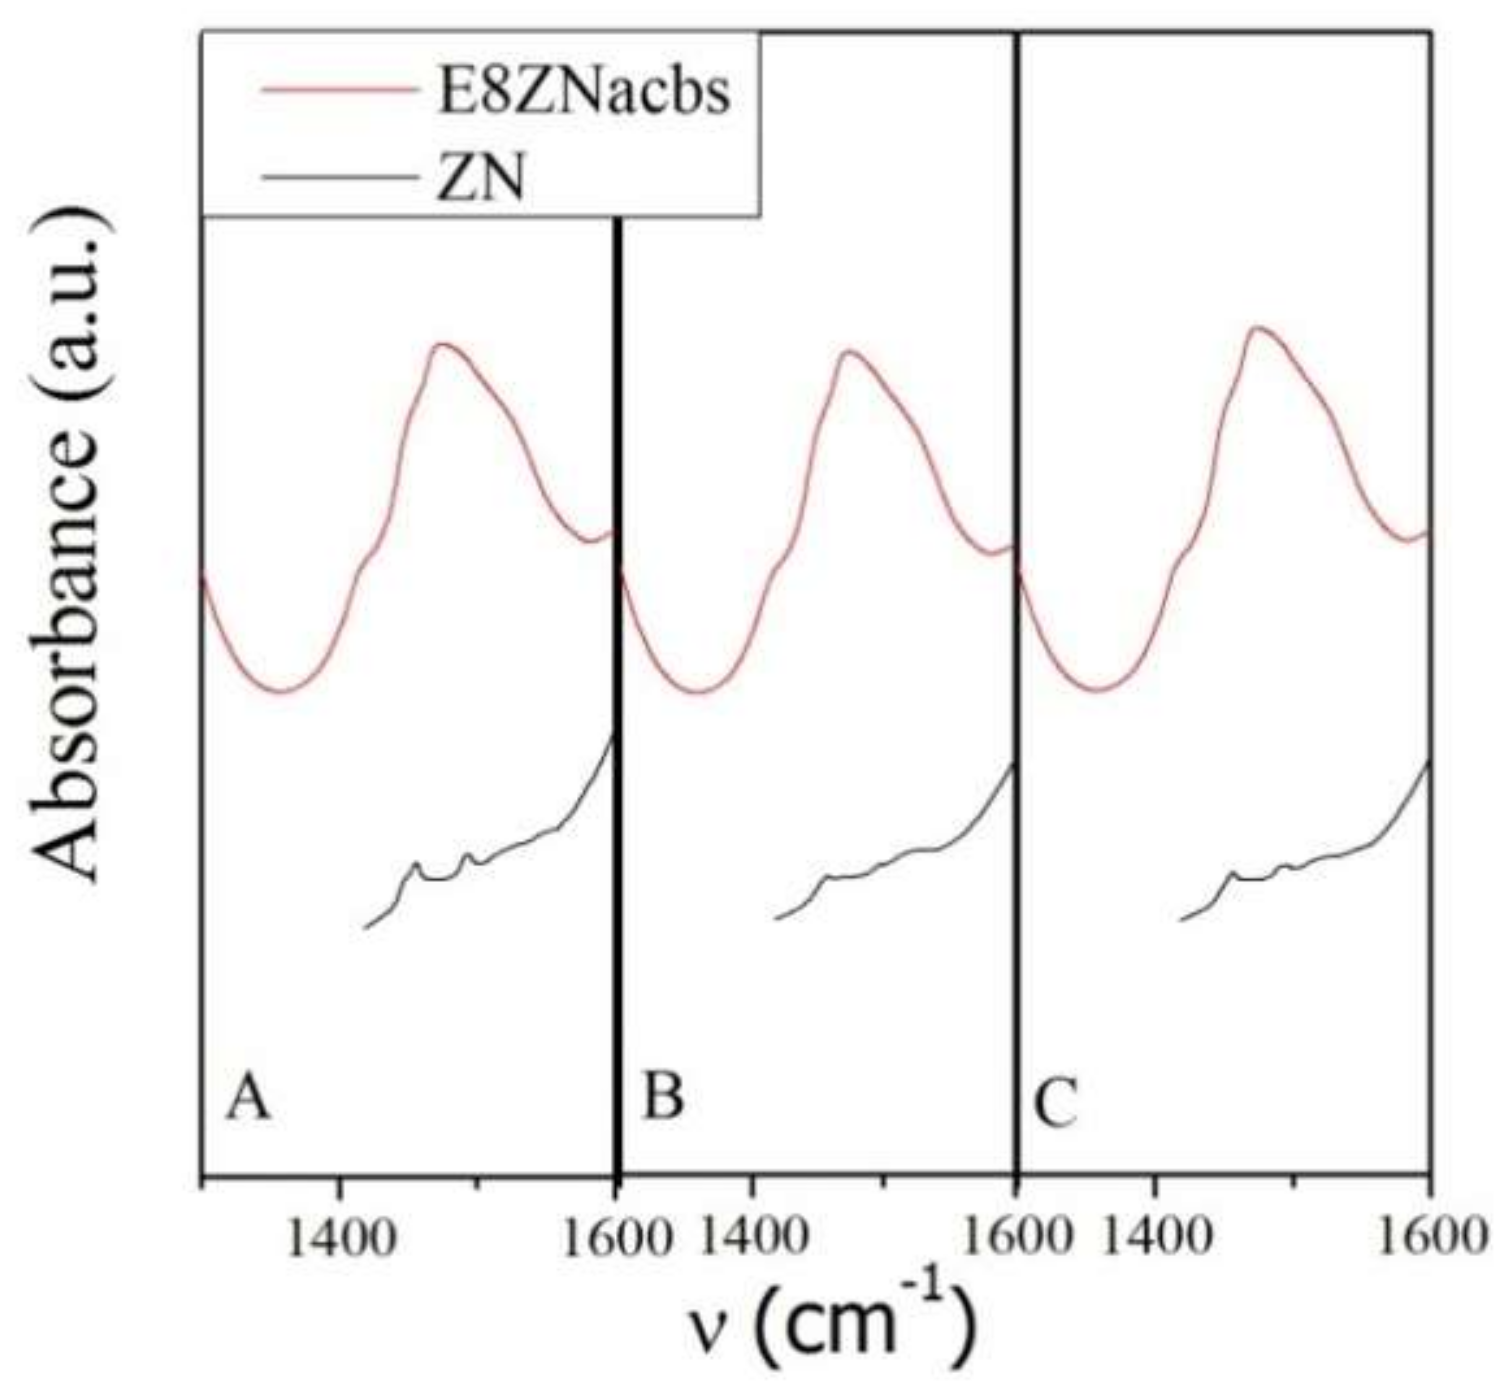
3.4. Acidity Analysis

The variation in the acidity of zeolitic materials can be due to several factors, including the variation in the electronegativity of the system, which is generated by the compensating cations, that is, greater electronegativity of these cations contributes to the acidity of the material. Another important factor is the ability of the ions to form hydroxyl groups of the Al–OH–Si type, in which the presence of H+ gives rise to the Brönsted acidity on the zeolite surface. Notably, divalent cations tend to generate this type of acidity by dehydroxylation of the coordinated water molecules in the zeolite [25].
Figure 9 shows that the basic treatment favored a considerable increase in the Brönsted and Lewis acidity of the material, since it promotes the extraction of silica, conserving the aluminum present in the network. The band at approximately 1450 cm−1 reflects the interaction of pyridine with Lewis acid sites. The band at approximately 1550 cm−1 reflects the interaction of pyridine with Brönsted acid sites, whereas the band at 1490 cm−1, as shown in Figure 9, is related to the interaction of pyridine with both Brönsted and Lewis acid sites [26,27].

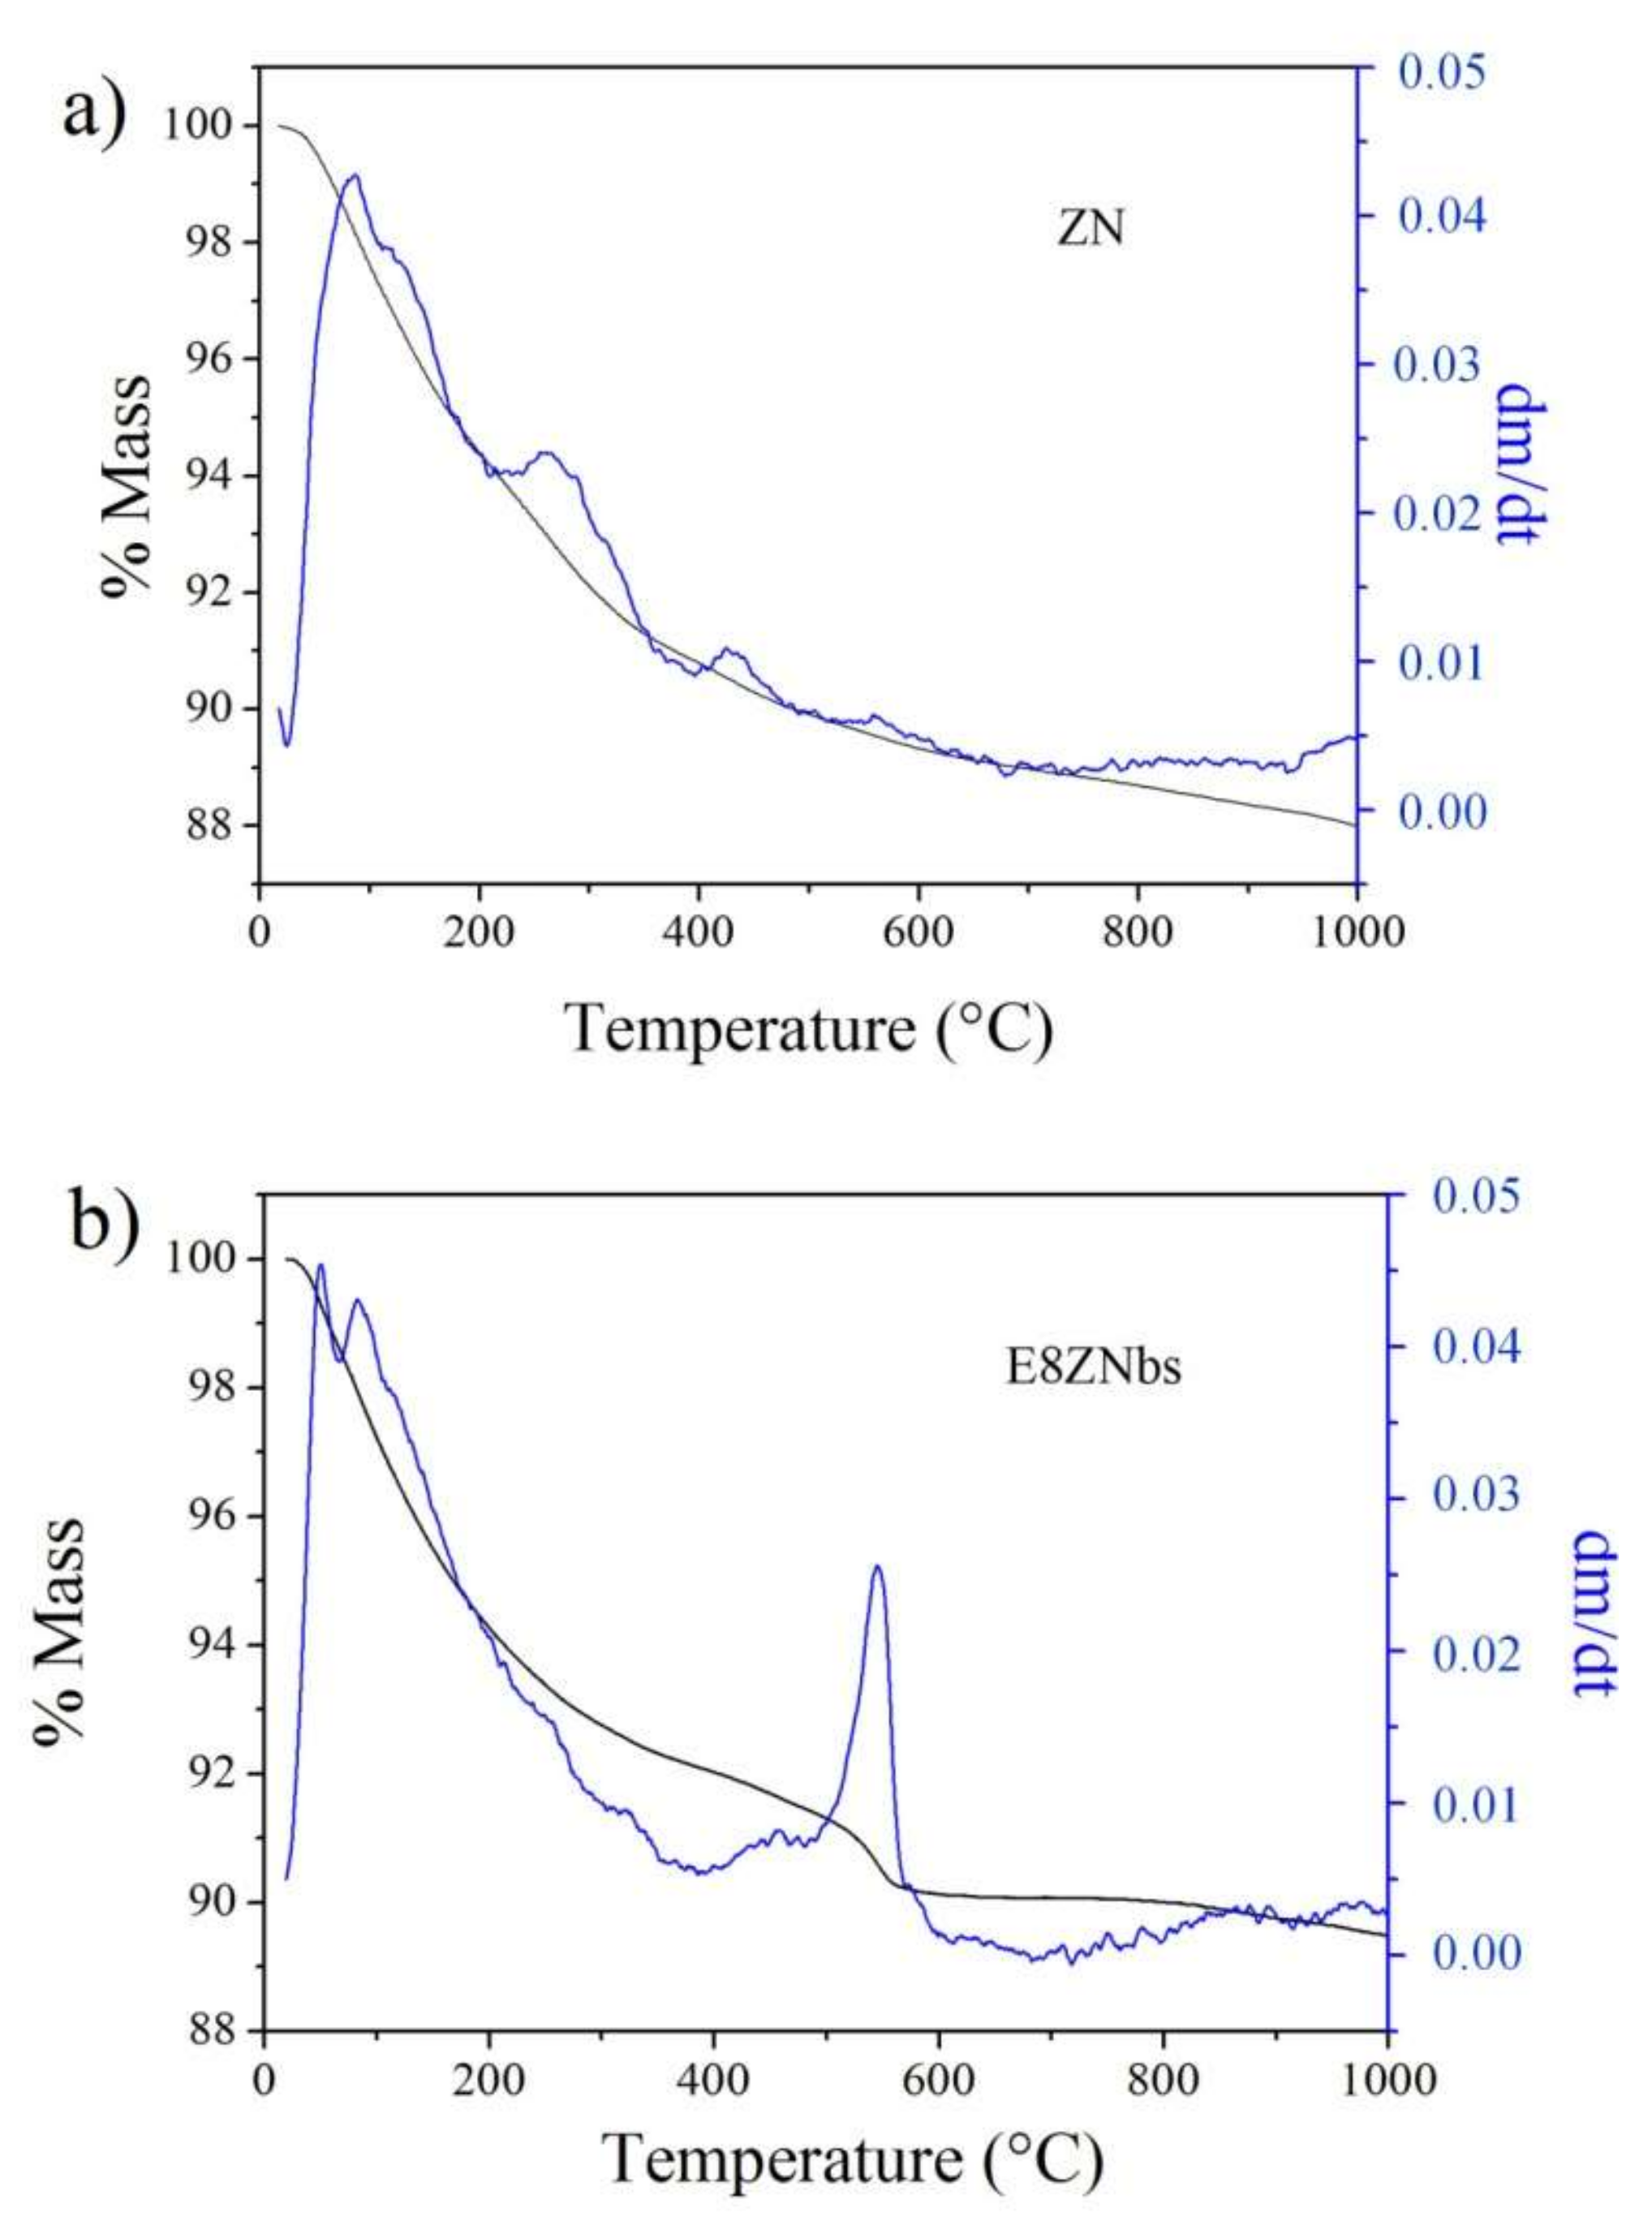
3.5. Thermogravimetric Analysis

In Figure 10a we can see the percentage of mass loss and its derivative of ambient temperature up to 1000 °C, where the material is stable with a small percentage of total mass loss of approximately 11%. Initially, two overlapping mass loss events from the water loss of the material with 6% mass loss are observed. In this way we can conclude the presence of clinoptilolite, but the material presents two phases of contraction between 200 and 450 °C, characteristic of heulandite, however the loss is very small with a percentage of 4% and 0.7% respectively. Thus, the technique corroborates the identification of a clinoptilolite with traces of heulandite (small amount). In Figure 10b we note that after treatment at severe conditions (E8ZNbs), the sample shows a total mass loss of approximately 10% indicating thermal stability of the treated material. The mass loss on 520 °C can be related to the loss of the hydroxyl groups via condensation. The alkaline treatment has a significant contribution to this mass loss. This can be explained as; more dehydroxylation occurs due to the formation of new Si–OH groups upon alkaline treatment [6].

4. Conclusions

Basic treatment is an alternative for improving the properties of natural zeolites that enables the removal of impurities and, consequently, an increase in the specific surface area and pore volume while retaining Al in the network and consequently preserving the acidity of the materials. However, extreme treatment conditions can lead to collapse of the structure and decrease the crystallinity of the material. Thus, the balance between properties must be taken into account, considering that the concentration is the treatment parameter of the treatment that influences all the properties, whether positively or negatively. The treatment conditions of 4 h, 3 mol∙L−1 NaOH, and 70 °C are favorable for increasing the specific area of the material.

Author Contributions

This research article was conceptualized by V.C.d.S. and S.B.C.P.; the methodology was made by V.C.d.S and M.J.G.d.A.; validation by V.C.d.S. and J.V.-R.; formal analysis, by all authors; investigation by all authors; resources by S.B.C.P. and K.S.; data curation by V.C.d.S. and J.V.-R.; writing—original draft preparation by V.C.d.S. and M.J.G.d.A.; writing—review and editing by S.B.C.P., J.V.-R. and K.S.

Funding

This study was financed in part by the Coordenação de Aperfeiçoamento de Pessoal de Nível Superior—Brasil (CAPES)—Finance Code 001; Universidad Nacional de San Luis (UNSL), Consejo Nacional de Investigaciones Cientificas y Tecnicas (CONICET) and Secretaría de Políticas Universitarias (SPU) fromArgentina.

Conflicts of Interest

The authors declare no conflict of interest.

References

  1. Johan, E.; Yamada, T.; Munthali, M.W.; Kabwadza-Cornerc, P.; Aono, H.; Matsue, N. Natural zeolites as potential materials for decontamination of radioactive cesium. Procedia Environ. Sci. 2015, 28, 52–56. [Google Scholar] [CrossRef]
  2. Huo, H.; Lin, H.; Dong, Y.; Cheng, H.; Wang, H.; Cao, L. Ammonia-nitrogen and phosphates sorption from simulated reclaimed waters by modified clinoptilolite. J. Hazard. Mater. 2012, 229–230, 292–297. [Google Scholar] [CrossRef] [PubMed]
  3. Doula, M.K. Synthesis of a clinoptilolite–Fe system with high Cu sorption capacity. Chemosphere 2007, 67, 731–740. [Google Scholar] [CrossRef] [PubMed]
  4. Rahmani, F.; Haghighi, M.; Amini, M. The beneficial utilization of natural zeolite in preparation of Cr/clinoptilolite nanocatalyst used in CO2-oxidative dehydrogenation of ethane to ethylene. J. Ind. Eng. Chem. 2015, 31, 142–155. [Google Scholar] [CrossRef]
  5. Ortíz, F.A.Q.; Valenzuela, J.T.; Reyes, C.A.R. Zeolitisation of Neogene sedimentary and pyroclastic rocks exposed in Paipa (Boyacá), in the Colombian Andes: Simulating their natural formation conditions. Earth Sci. Res. J. 2011, 15, 89–100. [Google Scholar]
  6. Akgul, M.; Karabakan, A. Promoted dye adsorption performance over desilicated natural zeolite. Microporous Mesoporous Mater. 2011, 145, 157–164. [Google Scholar] [CrossRef]
  7. Yeliz, Y.-A. Characterization of two natural zeolites for geotechnical and geoenvironmental applications. Appl. Clay Sci. 2010, 50, 130–136. [Google Scholar] [CrossRef]
  8. Motsa, M.M.; Mamba, B.B.; Thwala, J.M.; Msagati, T.A.M. Preparation, characterization, and application of polypropylene–clinoptilolite composites for the selective adsorption of lead from aqueous media. J. Colloid Interface Sci. 2011, 359, 210–219. [Google Scholar] [CrossRef]
  9. Bayat, M.; Sohrabi, M.; Royaee, S.J. Degradation of phenol by heterogeneous Fenton reaction using Fe/clinoptilolite. J. Ind. Eng. Chem. 2012, 18, 957–962. [Google Scholar] [CrossRef]
  10. Dziedzicka, A.; Sulikowski, B.; Ruggiero-Mikołajczyk, M. Catalytic and physicochemical properties of modified natural clinoptilolite. Catal. Today 2015, 259, 50–58. [Google Scholar] [CrossRef]
  11. Moradi, M.; Karimzadeh, R.; Moosavi, E.S. Modified and ion exchanged clinoptilolite for the adsorptive removal of sulfur compounds in a model fuel: New adsorbents for desulfurization. Fuel 2018, 217, 467–477. [Google Scholar] [CrossRef]
  12. Groen, J.C.; Jansen, J.C.; Moulijn, J.A.; Pérez-Ramírez, J. Optimal Aluminum-Assisted Mesoporosity Development in MFI Zeolites by Desilication. J. Phys. Chem. 2004, 108, 13062–13065. [Google Scholar] [CrossRef]
  13. Souza, V.C.; Villarroel-Rocha, J.; Araújo, M.J.G.; Sapag, K.; Pergher, S.B.C. Dealumination of Natural Clinoptilolite by Acid Treatment: Structural and Textural Characterization. Microporous Mesoporous Mater. 2018. (under review). [Google Scholar]
  14. Ates, A.; Akgül, G. Modification of natural zeolite with NaOH for removal of manganese in drinking water. Powder Technol. 2016, 287, 285–291. [Google Scholar] [CrossRef]
  15. Su, L.; Liu, L.; Zhuang, J.; Wang, H.; Li, Y.; Shen, W.; Xu, Y.; Bao, X. Creating mesopores in ZSM-5 zeolite by alkali treatment: A new way to enhance the catalytic performance of methane dehydroaromatization on Mo/HZSM-5 catalysts. Catal. Lett. 2003, 91, 155–167. [Google Scholar] [CrossRef]
  16. Barros Neto, B.; Scarminio, I.S.; Bruns, R.E. Como Fazer Experimentos Pesquisae Desenvolvimentona CiênciaenaIndústria, 2nd ed.; Editora da Unicamp: Campinas, Brazil, 2001; ISBN 85-268-0544-4. [Google Scholar]
  17. Brunauer, S.; Emmett, P.H.; Teller, E. Adsorption of Gases in Multimolecular Layers. J. Am. Chem. Soc. 1938, 60, 309. [Google Scholar] [CrossRef]
  18. Rouquerol, F.; Rouquerol, J.; Sing, K. Adsorption by Powder sand Porous Solids; Academic Press: San Diego, CA, USA, 1999; ISBN 978-0-08-097035-6. [Google Scholar]
  19. Jaroniec, M.; Kruk, M.; Olivier, J. Standard nitrogen adsorption data for characterization of nanoporous silicas. Langmuir 1999, 15, 5410–5413. [Google Scholar] [CrossRef]
  20. Dubinin, M.M. The Potential Theory of Adsorption of Gases and Vapors for Adsorbents with Energetically Nonuniform Surfaces. Chem. Rev. 1960, 60, 235. [Google Scholar] [CrossRef]
  21. Horváth, G.; Kawazoe, K. Method for the calculation of effective pore size distribution in molecular sieve carbon. J. Chem. Eng. Jpn. 1983, 16, 470–475. [Google Scholar] [CrossRef]
  22. Verboekend, D.; Pérez-Ramíriz, J. Design of hierarchical zeolite catalysts by desilication. Catal. Sci. Technol. 2011, 1, 879–890. [Google Scholar] [CrossRef]
  23. Taffarel, S.R.; Rubio, J. Removal of Mn2+ from aqueous solution by manganese oxidecoated zeolite. Miner. Eng. 2010, 23, 1131–1138. [Google Scholar] [CrossRef]
  24. Loiola, A.R.; Andrade, J.C.R.A.; Sasaki, J.M.; Da Silva, L.R.D. Structural analysis of zeolite NaA synthesized by a cost-effective hydrothermal method using kaolin and its use as water softener. J. Colloid Interface Sci. 2012, 367, 34–39. [Google Scholar] [CrossRef] [PubMed]
  25. Guisnted, M.; Ribeiro, F.R. Um Mundo a Serviço da Catálise; Edição da Fundação Calouste Gulbenkian: Lisboa, Portugal, 2004; ISBN 972-31-1071-7. [Google Scholar]
  26. Castañeda, R.; Corma, A.; Fornés, V.; Martínez-Triguero, J.; Valencia, S. Direct synthesis of a 9×10 member ring zeolite (Al-ITQ-13): A highly shape-selective catalyst for catalytic cracking. J. Catal. 2006, 238, 79–87. [Google Scholar] [CrossRef]
  27. Emeis, C.A. Determination of Integrated Molar Extinction Coefficients for Infrared Adsorption Bands of Pyridine Absorbed on Solid Acid Catalysts. J. Catal. 1993, 141, 347–354. [Google Scholar] [CrossRef]
Figure 1. Three-dimensional structure of clinoptilolite, (a) [001] and (b) [100].
Minerals 08 00595 g001
Figure 2. Diffractograms of natural zeolite and standard (a) and natural zeolites treated at: (b) 50 °C, (c) 70 °C, and (d) 90 °C.
Minerals 08 00595 g002
Figure 3. Statistical analysis. (a) Effect of the parameters on the response % crystallinity (Pareto chart). Response surface for (b) time = 0.5 h, (c) time = 4 h, and (d) concentration = 3 mol∙L−1.
Minerals 08 00595 g003
Figure 4. Statistical analysis. (a) Effect of the parameters on the response Si/Al molar ratio. Response surface for (b) time = 0.5 h, (c) time = 4 h.
Minerals 08 00595 g004
Figure 5. N2 adsorption and desorption isotherms at 77 K for the zeolites before and after basic treatments. The isotherms of E1ZNbs, E2ZNbs, E3ZNbs, E4ZNbs, E5ZNbs, E6ZNbs, E7ZNbs, E9ZNbs, E10ZNbs, and E12ZNbs samples were vertically offset by 1, 2, 3.3, 4.3, 7.5, 8.3, 9.7, 10.5, 11.5, 14, and 16 mmol∙g−1, respectively.
Minerals 08 00595 g005
Figure 6. Statistical analysis. Effect of the parameters on the specific surface area response.
Minerals 08 00595 g006
Figure 7. Pareto graphs of (a) the total pore volume and (b) the mesopore volume.
Minerals 08 00595 g007
Figure 8. Characterization of micropores. (a) CO2 adsorption isotherm at 273 K and (b) micropore size distribution by HK method.
Minerals 08 00595 g008
Figure 9. Pyridine adsorption: A = 150 °C, B = 250 °C, C = 350 °C.
Minerals 08 00595 g009
Figure 10. Thermogravimetric analysis of the (a) natural sample and the (b) E8ZNbs sample.
Minerals 08 00595 g010
Table 1. Experimental design for basic treatment with NaOH.
SamplesTime (h)Temperature (°C)Concentration (mol·L−1)
E1ZNbs0.50500.10
E2ZNbs0.50503.00
E3ZNbs0.50900.10
E4ZNbs0.50903.00
E5ZNbs4.00500.10
E6ZNbs4.00503.00
E7ZNbs4.00900.10
E8ZNbs4.00903.00
E9ZNbs2.25701.55
E10ZNbs2.25701.55
E11ZNbs2.25701.55
Table 2. Si/Al ratio for samples without and with basic treatment. ZN: zeolite.
SamplesSi/AlT (°C)t (h)C (mol·L−1)
ZN4.7000
E1ZNbs4.4500.50.1
E2ZNbs4.6500.53.0
E3ZNbs4.6900.50.1
E4ZNbs3.3900.53.0
E5ZNbs4.6504.00.1
E6ZNbs3.9504.03.0
E7ZNbs4.5904.00.1
E8ZNbs2.6904.03.0
E9ZNbs3.7702.251.55
E10ZNbs3.6702.251.55
E11ZNbs3.7702.251.55
Table 3. Textural properties of natural zeolite and treated zeolites.
SamplesTextural Properties
aSBET
(m2·g−1)
bSEXT
(m2·g−1)
cVTP
(cm3·g−1)
dVμP
(cm3·g−1)
eVmeso
(cm3·g−1)
fwP
(nm)
ZN27220.100.000.100.41
E1ZNbs23160.110.000.11-
E2ZNbs26210.110.000.11-
E3ZNbs23180.110.000.11-
E4ZNbs31230.200.000.20-
E5ZNbs25210.120.000.12-
E6ZNbs33250.120.000.12-
E7ZNbs27210.100.000.10-
E8ZNbs42310.220.000.220.42
E9ZNbs36310.090.000.09-
E10ZNbs38270.150.010.14-
E11ZNbs35280.110.000.11-
a Brunauer–Emmett–Teller method, b,d αS-plot method, c Gurvich rule, e VTP-VμP and f Horvath and Kawazoe (HK) method.

