Abstract
Tourmalines are a group of minerals which may concentrate various accessory components, e.g., Cu, Ni, Zn, Bi, Ti, and Sn. The paper presents fluor-elbaite and elbaite from a dyke of the Julianna pegmatitic system at Piława Górna, at the NE margin of the Bohemian Massif, SW Poland, containing up to 6.32 and 7.37 wt % ZnO, respectively. Such high amounts of ZnO are almost two times higher than in the second most Zn-enriched tourmaline known to date. The compositions of the Zn-rich tourmalines from Piława Górna, studied by electron micropropy and Raman spectroscopy, correspond to the formulae: X(Na0.733Ca0.013☐0.254)Σ1Y(Al1.033Li0.792Zn0.755Fe2+0.326Mn0.094)Σ3ZAl6(TSi6O18)(BO3)3V(OH)3W(F0.654OH0.344), and X(Na0.779Ca0.015☐0.206)Σ1Y(Al1.061Li0.869Zn0.880Fe2+0.098Mn0.094)Σ3ZAl6(TSi6O18)(BO3)3V(OH)3W(OH0.837F0.163), respectively, with Zn as one of the main octahedral occupants. A comparison with other tourmalines and associated Zn-rich fluor-elbaite and elbaite from the pegmatite indicates that atypically high Zn-enrichment is not a result of Zn-Fe fractionation, but dissolution and reprecipitation induced by a late (Na,Li,B,F)-bearing fluid within the assemblage of gahnite spinel and primary schorl-type tourmaline. This strongly suggests Na-Li-B-F metasomatism of gahnite-bearing mineral assemblages as that is the only environment that can promote crystallization of a hypothetical Zn-dominant tourmaline. The compositions of the Zn-rich fluor-elbaite and elbaite suggest three possible end-members for such a hypothetical tourmaline species: NaZn3Al6(Si6O18)(BO3)3(OH)3(OH), ☐(Zn2Al)Al6(Si6O18)(BO3)3(OH)3(OH) and Na(Zn2Al)Al6(Si6O18)(BO3)3(OH)3O by analogy with other tourmalines with divalent Y occupants, such as schorl/foitite/oxy-schorl and dravite/magnesio-foitite/oxy-dravite.
1. Introduction
Tourmalines are a supergroup of accessory minerals, common in various igneous, metamorphic and sedimentary rocks. They are complex borosilicates with the generalized chemical formula XY3Z6(T6O18)(BO3)3V3W [1], where X, Y, Z, T, B, V (=O3) and W (=O1) denote structural sites occupied by:
- X—Na+, K+, Ca2+, Pb2+, ☐ (vacancy),
- Y—Fe2+, Mg2+, Mn2+, Al3+, Li+, Fe3+, Cr3+, V3+, Ti4+, Zn2+, Cu2+, Ni2+, …
- Z—Al3+, Fe3+, Cr3+, V3+, Mg2+, Fe2+, ...
- T—Si4+, Al3+, B3+,
- B—B3+;
- V—OH−, O2−,
- W—OH−, F−, O2−.
An extremely complex chemical composition results in a number of minerals accepted as valid species by the Commission on New Minerals, Nomenclature and Classification of the International Mineralogical Association (IMA CNMNC), or reported but not IMA-approved, e.g., an unnamed Pb-dominant tourmaline (up to 17.5 wt % PbO; [2]). Varieties atypically enriched in other elements, which do not attain the status of the dominant component in any structural site in any tourmaline species, are also occasionally found. For example, apart from the relatively common (Fe2+, Mg2+, Mn2+, Al3+, Al3++Li+, Fe3+, Cr3+ or V3+)-dominant tourmalines, there are also known crystals enriched in Ti4+ (up to 4.07 wt % TiO2; [3]), Sn4+ (up to 0.42 wt % SnO2; [4]), Bi3+ (up to 0.49 wt % Bi2O3; [5]), Cu2+ (up to 3.51 wt % CuO; [6]), Ni2+ (up to 3.96 wt % NiO; [7]), and Zn2+. Other admixtures may also be present although they do not attain such spectacular concentrations. Exceptional diversity of chemical composition results in numerous color varieties, and the most beautiful tourmaline crystals are precious gems. In geological sciences, tourmalines are highly treasured as records of a signature of the conditions and chemistry of their environments due to their (1) widespread occurrence and stability over a significant portion of the pressure-temperature-composition space of the crust; (2) accommodation of exceptional range of geochemically different elements; (3) response and reflection of physical and chemical formation conditions by their trace element and isotopic compositions and of element source-reservoirs; and (4) negligible intracrystalline element diffusion over geologic time, even at high temperatures [8].
Zinc is found in numerous tourmalines, although commonly at amounts not exceeding a few tenths of wt %. Rare findings of tourmalines with ZnO > 1 wt % have been reported, for instance, from Cross Lake, MB, Canada (1.24 wt %; [9]), Minas Gerais (1.72 wt %; [10]; 1.88 wt %; [11]) and Rio Grande do Norte (2.15 wt %; [12]; 2.43 wt %; [13]; 3.01 wt %; [14]) in Brazil, and from Congo (2.85 wt %; [15]). The most Zn-enriched tourmaline (3.83 wt % ZnO) has been described from Russia [16].
In this paper, we describe fluor-elbaite and elbaite with almost 7.5 wt % ZnO from the Julianna system of anatectic pegmatites at Piława Górna, Góry Sowie Block, SW Poland. We discuss their chemistry and Raman spectra especially in the range of OH vibrations, propose possible explanations for such high Zn enrichment and suggest the most probable environments for formation of even more Zn-rich crystals.
2. Geological Setting
Zinc-enriched tourmaline was found in a pegmatite of the Julianna pegmatitic system exposed in an amphibolite-migmatite quarry (50°42′11.77″ N, 16°44′12.36″ E) near Piława Górna, ~50 km southwest of Wrocław, SW Poland (Figure 1 and Figure 2). The quarry is located in the Góry Sowie Block (GSB), a tectono-stratigraphic unit that is mostly built of a polymetamorphic metasedimentary-metavolcanic sequence and is situated at the north-eastern periphery of the Bohemian Massif in the European Variscides. The Piława Górna quarry exploits the migmatite-amphibolite rock deposit with over 320 millions Mt of estimated resources for crushing rocks aggregates. Migmatite accounts for about 72% of the raw rock and the rest is mainly amphibolite, with minor bodies of granitic pegmatite. The Julianna pegmatitic system is composed of coeval and cogenetic dykes, apophyses and lenticular bodies, up to 6–7 m thick, extending along 30–40 m in vertical section, 80–100 m in planar view along a NNE–SSW running zone of strongly tectonized amphibolite [17]. The pegmatites show a broad range of textural differentiation from homogeneous and subhomogeneous to simply zoned bodies (border zone + wall zone + graphic intermediate zone + blocky-feldspar intermediate zone + quartz core ± quartz-albite zone ± spodumene–“lepidolite” core). Geochemical variability varies from primitive and moderately fractionated pegmatites, enriched in Nb-REE-Be-B and belonging to the NYF (niobium-yttrium-fluorine) pegmatitic family, to rare and much more strongly fractionated pods located in the axial parts of the largest dykes that contain Li-Cs-Ta-Be-B mineralization of the LCT (lithium-cesium-tantalum) type [17,18,19,20]. The pegmatites are formed mainly of microcline, Na-plagioclase, quartz, “biotite” and muscovite, accompanied by schorl, almandine-spessartine garnet and beryl. Rare-element mineralization of the prevalent NYF-affiliated pegmatites includes, among others, columbite-group minerals, ixiolite, ferrowodginite, samarskite-, euxenite- and fergusonite-group minerals, pyrochlore-supergroup minerals, cassiterite, ilmenite and titanite, gadolinite-group minerals, hellandite-(Y), keiviite-(Y), pilawite-(Y), allanite-group minerals, xenotime-(Y), and monazite-(Ce). Highly fractionated pods with the LCT-type mineralization contain, among others, “zinnwaldite”, “lepidolite”, a Cs-bearing dark mica, spodumene, pollucite, cassiterite, spessartine, tantalite-(Mn), minerals of the microlite group, elbaite–liddicoatite–rossmanite tourmaline, Cs-bearing beryl and pezzottaite. Mineralogy and petrography of the Julianna pegmatites have been systematically studied [17,19,21,22,23] and the occurrence is the type locality for pilawite-(Y), bohseite and żabińskiite [24,25,26].
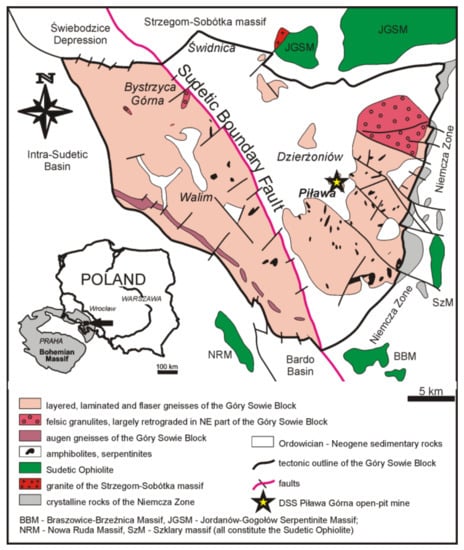
Figure 1.
Simplified geological map of the Góry Sowie Block with the location of the Piława Górna quarry (modified after Szuszkiewicz et al. [17]).
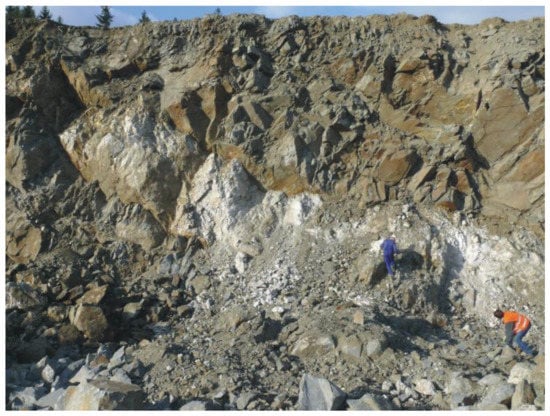
Figure 2.
A fragment of the Julianna pegmatitic system in a migmatite-amphibolite quarry at Piława Górna; (year 2010).
Dating of Julianna pegmatites gave an emplacement age of 377.6 ± 1.3 Ma [U-Th-Pb; monazite-(Ce)] and 380.7 ± 2.4 Ma (U-Pb-Th; uraninite) [20,27]. These ages point to their formation by the anatectic melting of the metasedimentary-metavolcanic GSB rocks during tectonic exhumation at 385–370 Ma [28,29,30]. Recent studies of trace elements in quartz from the Julianna pegmatites and their host rocks comply with this model and suggest that the pegmatite-forming melt was most probably generated at pressures ~500 MPa, at a slightly greater depth than the present day exposure level [31]. The geochemical diversity of the metasedimentary-metavolcanic protolith, similar to paragneisses and amphibolites exposed in the Piława Górna quarry, is a plausible source for highly enriched partial melts with hybrid NYF + LCT characteristics.
3. Occurrence
The pegmatite dyke with the Zn-rich tourmaline was exposed in the Piława Górna quarry in 2010, when it could be observed along a few tens of meters in horizontal section with a maximum thickness of ~3–4 m. The dyke showed typical zoning, and the assemblage of accessory minerals locates it as transitional between NYF- and LCT-type pegmatites. Fan-shaped aggregates of muscovite, a few centimeters in length, in the graphic zone are a characteristic feature of this pegmatite. Short prismatic crystals of light-grey-bluish beryl, up to 5 cm long, occur together with quartz in interstices among feldspar crystals in the blocky feldspar zone and in the quartz core [22]. The blocky feldspar zone and the quartz core contain also up to 7 cm long intergrowths and radial aggregates of black tourmaline, up to 4–5 cm large quartz–garnet (almandine–spessartine series) symplectitic intergrowths, a few centimeter sized books of pale greenish muscovite, relatively abundant cassiterite (up to 3 cm large) and columbite-group minerals (up to 4 cm in length), as well as subordinate, a few millimeter sized dark greenish crystals of gahnite. Lithium-bearing tourmalines were found only occasionally in the form of small, up to 2 cm long, dark green crystals within the books of greenish K-mica. Electron microprobe studies of the collected material reveal also the presence of columbite-(Fe) and columbite-(Mn), ferrowodginite and wodginite, various pyrochlore-supergroup minerals (fluorcalciomicrolite, hydroxylcalciomicrolite or kenocalciomicrolite, hydroxylplumbomicrolite or oxyplumbomicrolite, hydromicrolite and hydropyrochlore grading to zero-valence-dominant microlite and pyrochlore, and fluorcalcioroméite), Fe-bearing Cs-dominant dark mica, genthelvite, uraninite, monazite-(Ce), xenotime-(Y), cheralite, zircon, scheelite, sphalerite, ferronigerite and zinconigerite, lithiophilite, alluaudite, hydroxylapatite, mitridatite and other unrecognized phosphates, pucherite, and probably also cookeite and chamosite. Zinc-rich tourmaline was found only along the contact between adjacent pale greenish, transparent gahnite and primary schorl-type tourmaline evolving to secondary fluor-elbaite. This Zn-rich tourmaline, like other Li-tourmalines of the pegmatite system at Piława Górna, has no gemological value not only due to its very small dimensions and exceptional rarity, but mainly due to numerous inclusions and general nontransparency. Its pale greenish color originates from the presence of traces of Fe2+ and Mn2+, whereas Zn2+ as an element of the first transition series with electron configuration [Ar] 3d104s2 is not a coloring agent.
4. Methods
4.1. Electron Microprobe Analysis (EMPA)
Electron microprobe analyses of tourmalines and other rare minerals of the pegmatite were performed at the Inter-Institute Analytical Complex for Minerals and Synthetic Substances at the University of Warsaw, Poland, using a Cameca SX 100 electron microprobe (CAMECA, Cedex, France). Samples were prepared as 1-inch discs containing small fragments of the pegmatite with crystals designed for analyses, with grinded and polished surface. Polished surfaces of the discs were coated with carbon. Zinc-rich tourmaline was found during analyzing crystals of transparent, pale greenish gahnite associated with dark tourmaline. The microprobe operated in wavelength-dispersive mode under the following conditions: accelerating voltage of 15 kV, beam current of 10 nA, beam diameter of 2 μm, peak count-time of 20 s, background time of 10 s. Standards, diffracting crystals, analytical lines and mean detection limits (in wt %) were as follows: fluorophlogopite—F (PC0, Kα, 0.12), albite—Na (TAP, Kα, 0.03), diopside—Mg (TAP, Kα, 0.02), Si (TAP, Kα, 0.03) and Ca (PET, Kα, 0.02), orthoclase—Al (TAP, Kα, 0.03) and K (PET, Kα, 0.02), rutile—Ti (LPET, Kα, 0.02), rhodonite—Mn (LIF, Kα, 0.09), hematite—Fe (LIF, Kα, 0.08), V2O5—V (LIF, Kα, 0.06), Cr2O3—Cr (LPET, Kα, 0.02), and sphalerite—Zn (LIF, Kα, 0.09). The raw data were reduced with the PAP routine of Pouchou and Pichoir [32].
Atomic contents were normalized to 15 Y + Z + T atoms per formula unit (apfu) for schorl-type tourmalines with Y + Z > 9 apfu (Licalc. = 0 apfu), and on the basis of 6 Si apfu for Li-bearing tourmalines, with B2O3 calculated with the assumption of 3 B apfu, Li = 9 − (Y + Z)EMPA apfu, where (Y + Z)EMPA denotes the total of all octahedral Y- and Z-site occupants determined by EMPA, Fetotal = Fe2+, and H2O occurring as OH groups calculated by stoichiometry based on electroneutrality of the formulae. For analyses showing OH + F > 4 apfu due to excesses of microprobe determined SiO2 (quartz nanoinclusions), the amount of the component was reduced to a value for which the stoichiometric OH + F = 4 apfu was achieved, i.e., the highest content accepted for the tourmaline structure. The estimation of the Li2O amounts from EMPA on the basis of a multiple regression equation given by Pesquera et al. [33] is not applicable in our case, because the calculated Li2O amount seems to be ZnO dependent for high ZnO contents (Figure 3). Comparing the contents of Li2O obtained from our calculation procedure and the amounts from the regression equation by Pesquera et al. [33], all data points corresponding to Zn-rich tourmaline deviate distinctly from the 1:1 trend and, in our opinion it is due to high contents of ZnO, a component which was not included as an important independent variable in the multiple regression by Pesquera et al. [33].
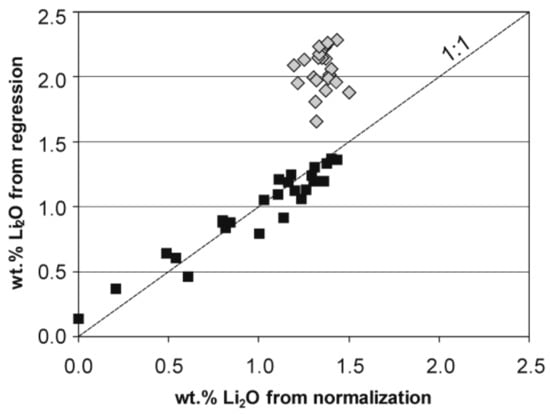
Figure 3.
Covariation between wt % Li2O of fluor-elbaite and elbaite calculated on the basis of the used normalization vs. amounts calculated from the regression equation of Pesquera et al. [33]. Symbols: dark squares—analyses with ZnO < 1.20 wt %, grey diamonds—analyses with ZnO > 3.50 wt %.
4.2. Raman Spectroscopy
Raman spectra were collected in back-scattered geometry at the Faculty of Materials Science and Ceramics, AGH UST, Cracow, Poland, with a Horiba Labram HR spectrometer integrated with an Olympus BX 40 confocal microscope equipped with a Nd: YAG, 532 nm (10 mW) laser and 1800 g/mm grating. The spectra were recorded in the range 4000–50 cm−1 on randomly oriented surfaces of crystals mounted in epoxy resin in a 1-inch disc that was used also for EMPA studies. The Raman measurements were carried out with an estimated analytical spot size of ~1 µm, the microscope magnification 100×, an acquisition time of 600 s and accumulation of 2 scans. Calibration was done using the 520.7 cm−1 line of Si, and for deconvolution of the recorded spectra we used the commercially available program SPECTRA-CALC™ (sc) [34].
5. Results
5.1. Primary Tourmalines
The only tourmalines discernible by naked eye in hand specimens are a few centimeters large, black, and sometimes radially intergrown crystals of primary schorl (Tur I; the used abbreviations for mineral names according to Whitney and Evans [35]). The crystals display almost constant FeO contents [13.27(30)–12.66(29) wt %; 1.88(4)–1.81(4) Fe apfu on average] and small Si deficiency [5.97(2) and 5.94(3) Si apfu, respectively] (Table 1). However, they show some heterogeneity in other chemical components as well as some Mn-Fe fractionation. The most primitive variety is Tur IA, with Mn/(Mn + Fe) = 0.010(2), and depletion in Al [6.14(6) apfu on average]. More evolved, is Tur IB that show Mn/(Mn + Fe) = 0.029(14)–0.034(4), and much higher Al content of 6.79(11)–6.91(4) apfu. Compared to Tur IB, Tur IA is also enriched in Na [0.66(3) vs. 0.58(3)–0.54(5) apfu] and Mg [0.81(6) vs. 0.26(11)–0.23(5) apfu], and shows higher contents of such trace components as Ca [0.09(2) vs. 0.01(1) apfu] and Ti [0.14(4) vs. 0.011(4) apfu], and lower amounts of Mn [0.020(4) vs. 0.056(26) apfu] and Zn [0.009(8) vs. 0.038(12) apfu]. Fluorine contents are almost the same in Tur IA and Tur IB [0.08(3) vs. 0.07(4)–0.12(2) apfu, respectively] and the W site in both types of schorl is dominated by monovalent anions (OH− + F−) with OH− > F−, with slightly increasing WO2− in the more evolved variety [0.24(5) vs. 0.36(9) apfu in Tur IA and Tur IB, respectively].

Table 1.
Average compositions of primary schorl-type tourmaline.
5.2. Secondary Dark Bluish Li-Bearing Tourmaline in Quartz
Anhedral inclusions (<1 mm) of dark bluish Li-bearing tourmaline (Tur IIA) in quartz, replacing schorl and fluor-schorl, are discernible under a stereomicroscope or in back-scattered-electron (BSE) images. The schorl-type primary tourmaline is slightly enriched in Li2O (up to ~0.61 wt %; 0.404 Li apfu) (Table 2; anal. 223/9 and 217/3). However, low contents of Ca (0.006–0.021 apfu) and Ti (up to 0.019 apfu), depletion in Fe down to 1.400 apfu, enrichment in Al (6.834–7.030 apfu), Mn (0.098–0.173 apfu) and Zn (0.059–0.069 apfu; 0.49–0.56 wt % ZnO), as well as the degree of Mn-Fe fractionation [Mn/(Mn + Fe) = 0.066–0.103] indicate that it corresponds to the primary Al-bearing Tur IB. The WO2− content in this tourmaline reaches 0.46 apfu.
Table 2.
Representative compositions of dark bluish (Tur IIA) and dark green (Tur IIB) tourmaline.
Secondary Tur IIA represents elbaite and fluor-elbaite with rather constant Na (0.721–0.802 apfu). Compared to its Tur IB precursor, it has generally higher, although partly overlapping Mn/(Mn + Fe) ratio of 0.079–0.183, similar or slightly higher contents of Al (up to 7.069 apfu) and Mn (0.091–0.170 apfu), a noticeable increase of Zn (0.044–0.141 apfu; up to 1.17 wt % ZnO), decrease of Fe (down to 0.704 apfu) and constant low contents of Ca (0.026–0.043 apfu), Mg (up to 0.011 apfu) and Ti (up to 0.010 apfu). Lithium can increase up to 0.941 apfu and F up to 0.676 apfu.
5.3. Secondary Dark Greenish Fluor-Elbaite in Muscovite Books
Dark greenish translucent Li-tourmaline (Tur IIB) is extremely rare, although relatively large, with euhedral crystals being up to 2 cm in length and 0.5 cm in diameter. In spite of the differences in color and size, the crystals are compositionally close to Tur IIA, except that the most Fe-enriched domains with 8.24–7.39 wt % FeO (1.141–1.013 Fe apfu) are even more Al-enriched (up to 7.293 apfu) (Table 2). With increasing Mn-Fe fractionation [Mn/(Mn + Fe) = 0.082–0.161], Tur IIB shows a decrease of Fe down to 0.684 apfu, coupled with an increase of Al and Mn up to 7.315 apfu and 0.131 apfu, respectively. Simultaneously, the calculated Li content increases from 0.526 apfu to 0.875 apfu. The amounts of Mg and Ti are negligible, 0.014–0.038 apfu and 0.006–0.012 apfu, respectively. The contents of Zn vary randomly (0.13–0.93 wt % ZnO; up to 0.111 Zn apfu), although generally, they increase in sectors with higher Mn-Fe fractionation degrees. With fluorine contents from 0.382 up to 0.591 apfu and WOH− << WF−, Tur IIB classifies as fluor-elbaite. Only several Al-poorest and Fe-richest compositions, with lowest measured F and calculated Li contents and WO2− > WF− + WOH−, might be classified as Fe-bearing darrelhenryite [the end-member composition Na(LiAl2)Al6B3Si6O27(OH)3O].
5.4. Zn-Rich Tourmaline from Gahnite Dissolution—Fluor-Elbaite + Elbaite Reprecipitation Zones
Zn-rich tourmaline (Tur III) was found as a secondary phase in a metasomatically altered assemblage of adjacent Tur IB (oxy-schorl to fluor-schorl) and gahnite. Highly fractionated pale greenish gahnite with composition Zn(Al1.98Fe3+0.02)O4 [Zn/(Zn + Fe) = 0.965(3)], typically occurs as fractured crystals, up to a few hundred micrometers in size, that are partly overgrown by Tur III (Figure 4). Tur IB is usually largely dissolved and replaced by Tur IIIA (Zn-rich fluor-elbaite), forming clearly zoned crystals up to 1 millimeter in size (Figure 4). Compositional maps (Figure 5) present elemental distribution of Fe, Mn, Zn and Al in two areas, in which Zn-enriched tourmaline was detected. In both cases, Fe concentration decreases gradually, coupled with increasing Zn and Al from the center of the zoned crystals outwards (i.e., from Tur IB to Tur IIIA) and towards the adjacent gahnite. A local increase in Mn content in Tur IIIA is also marked. Tur IIIB (Zn-rich elbaite) occurs only as tiny domains, with the the highest Zn concentration marked in Figure 5 (Zn) as yellowish points within the greenish matrix of Tur IIIA. The Zn-rich fluor-elbaite (Tur IIIA) and elbaite (Tur IIIB) appear only along the gahnite margins as a discontinuous zone with a maximum thickness of ~100 μm. Secondary Tur III sometimes contains relics of the primary Tur IB and numerous inclusions of mainly quartz and albite, sometimes gahnite, and very rarely sphalerite. Table 3 presents representative analyses of primary tourmaline and both secondary Zn-rich tourmalines. The chemical compositions of Tur IB in the gahnite-tourmaline assemblage do not differ from typical compositions of primary schorl Tur IB (Table 1). Tur IIIA corresponds to fluor-elbaite with 0.535–0.658 apfu F and contains 6.993–7.051 apfu Al, 0.256–0.567 apfu Fe and 0.082–0.113 apfu Mn. Tur IIIB, on the other hand, classifies as elbaite with 0.163–0.388 apfu F, and has slightly higher contents of Al (7.042–7.150 apfu), and similar amounts of Fe (0.058–0.198 apfu) and Mn (0.054–0.097 apfu). Magnesium and Ti are below detection limits in both secondary tourmalines.
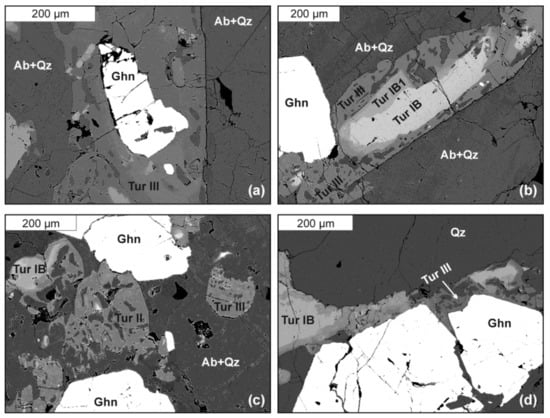
Figure 4.
Back-scattered-electron images of Zn-rich tourmaline (Tur III): (a) Tur III overgrowing gahnite; (b,c) Tur III overgrowing primary schorl-type Tur IB and Tur IB1; (d) a zone of Tur III around gahnite. Abbreviations: Ab—albite, Qz—quartz, Ghn—gahnite, Tur IB—primary, schorl-type tourmaline, Tur IB1—fluor-schorl, Tur III—Zn-rich fluor-elbaite.
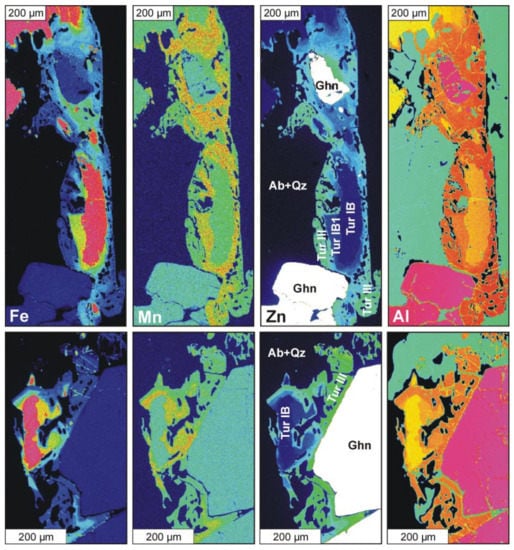
Table 3.
Representative compositions of tourmalines of the Zn-rich assemblage.
The content of Zn, generally below 0.20 apfu in primary Tur IB, increases up to 0.755 Zn apfu (6.32 wt % ZnO) in Tur IIIA and up to 0.880 Zn apfu (7.37 wt % ZnO) in Tur IIIB. Thus, in the absence of Mg, the content of bivalent cations Zn + Fe2+ + Mn2+ varies from 0.990 to 1.175 apfu in Tur IIIA and from 0.933 to 1.148 apfu in Tur IIIB, with Zn >> Fe2+ > Mn2+. However, because in all acquired compositions Zn + Fe2+ + Mn2+ <1.5 apfu, they do not correspond to Zn-dominant tourmaline of the hypothetical formula NaZn3Al6B3Si6O27(OH)3(OH) (Figure 6). This hypothetical end-member reaches the maximum content of about 40 mol %, and Zn can only be the most important second-rank component in the tourmalines. The most Zn-enriched compositions yield the formulae: X(Na0.733Ca0.013☐0.254)Σ1Y(Al1.033Li0.792Zn0.755Fe2+0.326Mn0.094)Σ3ZAl6(TSi6O18)(BO3)3V(OH)3W(F0.654OH0.344) for Tur IIIA and X(Na0.779Ca0.015☐0.206)Σ1Y(Al1.061Li0.869Zn0.880Fe2+0.098Mn0.094)Σ3ZAl6(TSi6O18)(BO3)3V(OH)3 W(OH0.837F0.163) for Tur IIIB.
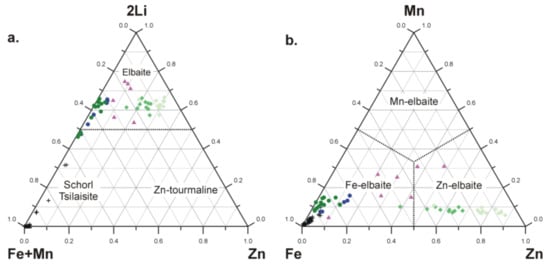
Figure 6.
Compositional plots of tourmalines from the pegmatite that contain Zn-rich fluor-elbaite and Zn-rich elbaite in the system: (a) schorl+tsilaisite—elbaite—hypothetical Zn-tourmaline; (b) Fe–Mn–Zn, showing relationships between second-rank divalent Y-site occupants. Symbols: dark crosses—primary schorl-type tourmaline Tur I, dark blue circles—inclusions of dark blue elbaite and fluor-elbaite (Tur IIA), dark green circles—green fluor-elbaite from mica books (Tur IIB), green diamonds—Zn-rich fluor-elbaite (Tur IIIA), pale green diamonds—Zn-rich elbaite (Tur IIIB), violet triangles—Zn-bearing tourmalines from the mineralogical literature [10,11,12,13,14,16].
The extent of Mn-Fe fractionation increases from Tur IIIA to Tur IIIB, with Mn/(Mn+Fe) ranging from 0.166 to 0.286 and from 0.293 to 0.517, respectively. However, because Zn fractionates along with Mn, the ratio (Mn + Zn)/(Mn + Zn + Fe + Mg) is a better fractionation index yielding, respectively, 0.490–0.759 and 0.827–0.938.
5.5. Compositional Relationships
Figure 7 presents variations in concentrations of the most important elements in the tourmalines as functions of Mn + Zn fractionation expressed by the ratio (Mn + Zn)/(Mn + Zn + Mg + Fe). Mafic elements, such as Mg, Fe2+ and Ti display rather coherent decreasing trends (Figure 7a–c). While present as minor components in Tur IA, Mg and Ti disappear in Tur IB, and may be present only as traces in more fractionated Tur II and Tur III. Iron decreases rapidly from Tur IA to Tur IIB, reaching a relatively constant content of ~0.70–0.75 apfu. Tur III shows a further steady decrease down to 0.058 Fe apfu along with Mn + Zn fractionation. Calcium, a subordinate component in Ti-bearing Tur IA, decreases very rapidly to a trace level in Tur IB (Figure 7d). However, there is a weak increase in Tur IIA–IIB at the (Mn + Zn)/(Mn + Zn + Mg + Fe) of 0.30–0.40, followed by a regular decrease in more fractionated compositions. Zinc, Mn, YAl, Na and F show, at least partly, opposite tendencies (Figure 7e–i). There is a sharp increase of Mn and Al contents in Tur I owing to Mn-Fe fractionation, as well as dehydroxylation and alkali-vacant substitutions: Al3+ + O2− → Y(Fe,Mg)2+ + OH− and Al3+ + ☐ → Y(Fe,Mg)2+ + XNa+, respectively. In Zn-poor Tur IIA and Tur IIB, both components fluctuate around values of 0.10–0.15 Mn apfu and ~1.0–1.3 Al apfu. The appearance of Li in tourmaline (from Tur IB to Tur III) changes the compositional relationships between YAl and divalent Y-site cations due to the coupled substitution Li+ + Al3+ + F− → 2 YFe2+ + WOH− at the Y and W sites. This leads to the crystallization of fluor-elbaite and elbaite (some compositions of Tur II). As a result, Al, Li and Fe2+ + Mn2+ + Zn become the only significant Y-site occupants in more fractionated tourmalines. Further compositional evolution is a result of local fluctuation among activities of these components, especially due to dissolution and reprecipitation caused by the (Na,Li,F,B)-enriched fluid, and Mn + Zn vs. Fe fractionation.
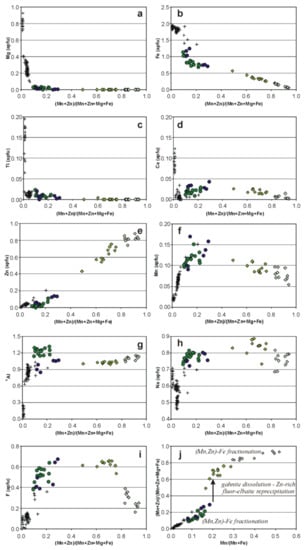
Figure 7.
Compositional relationships in tourmalines evolving to Zn-rich fluor-elbaite and elbaite: (a) Mg vs. (Mn + Zn)/(Mn + Zn + Mg + Fe); (b) Fe vs. (Mn + Zn)/(Mn + Zn + Mg + Fe); (c) Ti vs. (Mn + Zn)/(Mn + Zn + Mg + Fe); (d) Ca vs. (Mn + Zn)/(Mn + Zn + Mg + Fe); (e) Zn vs. (Mn + Zn)/(Mn + Zn + Mg + Fe); (f) Mn vs. (Mn + Zn)/(Mn + Zn + Mg + Fe); (g) YAl vs. (Mn + Zn)/(Mn + Zn + Mg + Fe); (h) Na vs. (Mn + Zn)/(Mn + Zn + Mg + Fe); (i) F vs. (Mn + Zn)/(Mn + Zn + Mg + Fe), (j) (Mn + Zn)/(Mn + Zn + Mg + Fe) vs. Mn/(Mn + Fe). Symbols as in Figure 6.
With fractionation, zinc forms a well-defined increasing trend (Figure 7e), reaching 0.020 apfu (0.16 wt % ZnO) in Tur IA, 0.061 apfu (0.48 wt % ZnO) in Tur IB, 0.141 apfu (1.17 wt % ZnO) in Tur IIA, and 0.111 apfu (0.93 wt % ZnO) in Tur IIB. Dissolution of gahnite and primary Tur IB and crystallization of secondary Zn-rich Tur III are marked by a sharp increase of Zn content up to 6.32 wt % ZnO (0.755 Zn apfu) in Tur IIIA and to 7.37 wt % (0.880 Zn apfu) in Tur IIIB. The stage of atypically high enrichment in Zn in these tourmalines is clearly shown in the (Mn + Zn)/(Mn + Zn + Mg + Fe) vs. Mn/(Mn + Fe) plot (Figure 7j). These two parameters show a simple linear relationship in all tourmaline generations, in which the increasing content of Zn can be attributed only to geochemical fractionation. In the relatively less evolved tourmalines (Tur I–IIB), the maximum values of the two ratios are relatively low, less than 0.20 and 0.30 for Mn/(Mn + Fe) and (Mn + Zn)/(Mn + Zn + Mg + Fe), respectively. In Tur III adjacent to gahnite, Zn suddenly increases, which is marked by the interruption of the trend and a sudden jump of the (Mn + Zn)/(Mn + Zn + Mg + Fe) value to ~0.5–0.7. However, the trend is back to normal at the stage of Tur IIIB crystallization, which suggests the dominance of Mn and Zn fractionation over dissolution–reprecipitation. Such behavior is synchronous with a distinct decrease in F activity, reflected in a gradual transition from the crystallization of fluor-elbaite (Tur IIIA) to elbaite (Tur IIIB) (Figure 7i).
5.6. Raman Spectroscopy
Raman spectroscopy is a widely applied method for the identification of minerals as well as recognition of their compositional relationships; it is also used frequently in studies of tourmalines [36,37,38,39,40,41,42,43,44]. Because of the particular location of OH groups, which are bound to the octahedral Y and Z cations in the tourmaline structure, the OH vibration bands code crystallochemical information on occupation of both octahedral sites. Therefore, interpretation of the bands is useful in discussing distribution of octahedral cations between the Y and Z sites (e.g., [39,40,42,43,44,45]).
Figure 8 shows representative unoriented Raman spectra recorded on relicts of primary Li,Al-bearing schorl Tur IB and secondary fluor-elbaite Tur IIIA (with compositions close to analyses 225/2 and 225/4 presented in Table 3). Generally, the spectra resemble those for schorl and fluor-elbaite presented by Watenphul et al. ([44]; Figure 3), with bands in the wavenumber range of 50–1200 cm−1 interpreted as results from Me–O stretching vibrations on the Y and Z sites, Si–O vibrations in the Si6O18 ring, and stretching vibrations of the B–O bonds [37,38,39,40,41,42,43,44,45].
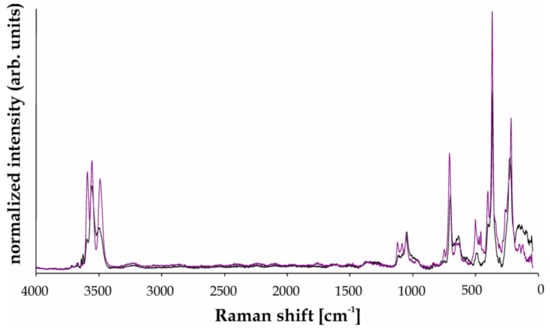
Figure 8.
Raman spectra of schorl-type tourmaline Tur IB (black) and Zn-rich fluor-elbaite Tur IIIA (violet) in the range 50–4000 cm−1.
In the range of OH stretching vibration modes (3350–3800 cm−1), the spectrum of Zn-rich Tur IIIA has three intense peaks with maxima at 3497, 3561 and 3597 cm−1 (Figure 9a). Peaks with similar Raman shifts in the spectrum of fluor-elbaite (3494 ± 8, 3562 ± 4 and 3593 ± 4 cm−1) were related by Watenphul et al. [44] to the most probable variants of configurations of the octahedral cations in this tourmaline variety: YLiZAlZAl-2YAlZAlZAl, 2YFe*2+ZAlZAl-YAlZAlZAl and 2YLiZAlZAl-YAlZAlZAl, where YFe*2+ denotes the total of all divalent Y-site occupants (YFe*2+ = YFe2+ + YMn2+ + YZn2+ + YMg2+). A visible small asymmetry of the peak 3497 cm−1 centered at ~3475 cm−1 could come from YFe*2+ZAlZAl-2YAlZAlZAl complexes of Y and Z octahedra in the interpretation of Watenphul et al. [44].
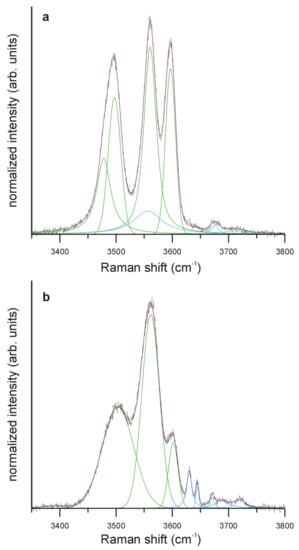
Figure 9.
Representative Raman spectra of: (a) primary schorl-type tourmaline (Tur IB) and (b) Zn-rich fluor-elbaite (Tur IIIA) in the range of OH stretching vibrations. Line colors: black—the recorded spectrum, red—the fitted spectrum; green—bands dominated by VOH stretching vibrations, blue—bands dominated by WOH stretching vibrations.
However, we would like to discuss the positions and intensities of the observed bands adopting a slightly different approach (Table 4). Because in the tourmaline structure, VOH groups occur with an at least 75% abundance relative to the total content of hydroxyls [3VOH + W(OH,F,O)], the resulting Raman bands have relatively high intensities. The VOH groups are bound to one Y and two Z atoms in the tourmaline structure. Therefore, in all Li-bearing tourmalines, with the Z site occupied exclusively by Al, only YAlZAlZAl, YFe*2+ZAlZAl and YLiZAlZAl arrangements are possible for the YZZ triad around the V=O(3) site. The ZAl–O(3) and YAl–O(3) are the longest bonds in the Z and Y octahedra, e.g., [46], but the differences with other Z–O or Y–O bonds seems rather too small among various tourmaline species to explain such significant differences in Raman shift of the resulting bands. Similarly, this spectral differentiation cannot be explained by different atomic masses of the Y occupants (Li = 6.94, Al = 26.98, Fe = 55.85, Zn = 65.38, …), because the positions of the absorption bands assigned to different variants of configurations of octahedral cations do not correlate with these data. Therefore, the only plausible explanation seems to be that when distribution of electrons around their nuclei is not-fully spherical, different positive charges of the Y-occupants (3+, 2+ or 1+) draw the electron density away from the VO–H bond. As a result, the bond length increases, but its strength decreases, in accordance with the sequence YAl3+…VO–H (the largest O–H distance; the lowest Raman shift), YFe*2+…VO–H, and YLi+…VO–H (the shortest O–H distance; the highest Raman shift). This interpretation model is consistent with some previous explanations of OH stretching vibration modes in various tourmaline varieties (e.g., [40,42,45]). The peak around 3497 cm−1 with visible small asymmetry in the spectrum of Zn-rich fluor-elbaite Tur IIIA, related generally to VOH-YAlZAlZAl, we interpret as superposition of two bands corresponding to VOH vibrations modified by the YAlZAlZAl arrangement associated with the Na-occupied or vacant X site.
Table 4.
Assignments of the O–H stretching bands in the Raman spectra of Tur IB (fluor-schorl) and Tur IIIA (Zn-rich fluor-elbaite).
The spectrum of Li,Al-bearing schorl-type tourmaline Tur IB (Figure 9b), with three visible maxima in the range of Raman shift below 3600 cm−1, is dominated by 3562 cm−1 absorption, which is interpreted as dominantly coming from stretching vibrations in the VOH-YFe*2+ZAlZAl arrangement. The two remaining maxima are related to VOH-YLiZAlZAl (3602 cm−1) and a relatively wide unresolved band (3503 cm−1), which we interpret as a superposition of VOH-YAlZAlZAl-XNa and VOH-YAlZAlZAl-X⃞ bands, similarly as in the case of Tur IIIA.
The WOH group is bound to three Y occupants. The presence of Al, Fe*2+ and Li at the Y site of the described Zn-rich fluor-elbaite results in eight allowed models of the YYY triad (LiLiLi and LiLiFe*2+ local arrangements are not allowed because local anion bond valence requirements around the W=O(1) site would not be satisfied [47]). It should be expected that with the small proportion of WOH in the total OH content (<25%) the abundances of individual YYY arrangements should be subordinate and the resulting intensities of the respective stretching vibration bands should be low. Therefore, they only have the potential to modify the basic pattern of the spectrum configured essentially by VOH bands. Applying to the YYY cationic arrangements the same reasoning as the one used above for the YZZ triad, it can be observed that the strongest effect of shifting the electron density away from the WO–H bond would take place in the YAlYAlYAl arrangement, and the weakest for the YLiYLiYAl triad. Consequently, the WO–H bond should be the weakest in case of the first-type triad, and the strongest for the last.
In the case of absence of Na or Ca at the X site (i.e., the presence of X-site vacancy as e.g., in foitite), Watenphul et al. ([44]; Figure 5) observed a few subordinate bands at wavenumbers generally above 3600 cm−1. They assigned them to stretching vibrations in WOH groups bound to a YYY triad and associated with an unoccupied X site (YYY-X☐) or the site occupied by Na (YYY-XNa). The X-site vacancy is a result of a common substitution in the tourmaline structure: ☐ + Me3+ → XNa+ + YMe2+. In this substitution, Me3+ cation replaces Me2+ in one octahedron of the Y triad. This means that the only valid YYY cationic arrangements in the structure of various tourmaline species with vacancy at the X site are: YAlYAlYAl-X☐, YFe*2+YAlYAl-X☐, YFe*2+YFe*2+YAl-X☐, YLiYFe*2+YAl-X☐ and YLiYAlYAl-X☐. As a consequence, weak peaks at 3630, 3644 and 3671 cm−1 in the Raman spectrum of primary schorl-type tourmaline Tur IB can be interpreted as caused by, respectively, YFe*2+YAlYAl-X☐, YFe*2+YFe*2+YAl-X☐ and YLiYFe*2+YAl-X☐ arrangements, as was proposed by Watenphul et al. [44]. However, the bands are almost invisible in the spectrum of Zn-bearing fluor-elbaite Tur IIIA, although the EMPA data suggest that the X site is not fully occupied in this tourmaline (Table 3 and Table 4). We interpret it as an indication that the W site in the arrangements is essentially occupied by fluorine. The very weak band at 3676 cm−1, related mainly to the YLiYFe*2+YAl-X☐ arrangement, is the only one of this group to appear in the spectrum of Zn-rich fluor-elbaite Tur IIIA. It can easily be explained by the fact that the three cations are the main Y-constituents in this tourmaline. Low intensity bands around 3688 and 3710–3720 cm−1 are assigned to the WOH-YFe*2+YFe*2+YAl-XNa and WOH-YFe*2+YFe*2+YFe*2+-XNa arrangements, whereas an additional band at 3556 cm−1 in the spectrum of Zn-rich fluor-elbaite Tur III A is related to vibrations of WOH group, probably bound with some Al-dominant YYY arrangements associated with Na-occupied X sites.
6. Discussion: Is Natural Zn-Dominant Tourmaline Possible?
The Zn-rich tourmaline from the Julianna system of anatectic pegmatites at Piława Górna is fluor-elbaite (Tur IIIA) and elbaite (Tur IIIB) with a composition close to Na(LiAlZn)Al6B3Si6O27(OH)3F, where Zn can be partly replaced by Fe2+ and Mn2+ (Zn >> Fe > Mn). Sokolov et al. [16], described a Zn-bearing tourmaline with a Zn content about half of that measured in the Piława Górna tourmaline, and suggested the possible end-member composition NaZn3Al6B3Si6O27(OH)3(OH) for a hypothetical Zn-tourmaline. However, two other hypothetical end-members are also possible: ☐(Zn2Al)Al6B3Si6O27(OH)3(OH) and Na(Zn2Al)Al6B3Si6O27(OH)3O4 by analogy with other tourmalines with divalent Y-occupants, such as schorl/foitite/oxy-schorl and dravite/magnesio-foitite/oxy-dravite. In order to discuss the possibility of the existence of natural Zn-tourmaline two issues should be considered: (1) whether Zn alone or Zn + 0.5Al could dominate the Y site; and (2) which anion might be expected to be dominant at the W site of this tourmaline.
Zinc is only a very subordinate incompatible component of silicate magmas, and its lithophile affinity is restricted by the presence of sulphide species. Geochemical fractionation leads to the enrichment of granitic melts, particularly peralkaline magmas, in Zn and favors crystallization of gahnite as a minor accessory mineral in peraluminous leucogranites, pegmatitic granites and granitic pegmatites, as well as incorporation of traces of Zn into crystal structures of some primary phosphates, e.g., triphylite, lithiophilite, sarcopside or graftonite-group minerals [48]. Lithophile behavior of Zn in the Piława Górna pegmatitic system is evidenced by the crystallization of accessory Zn-bearing ilmenite-pyrophanite and gahnite in moderately fractionated dykes, and the assemblage of gahnite, Zn-bearing ferronigerite and zinconigerite, as well as genthelvite and Zn-bearing helvine in highly-fractionated ones.
In tourmaline-supergroup minerals, Zn is an accessory component commonly occurring in amounts of up to a few tenths of ZnO wt %. Such low concentrations indicate that Zn only slightly fractionates versus Fe in the tourmaline structure. In the Piława Górna pegmatites, even tourmalines from highly-fractionated dykes only occasionally have more than 1 wt % ZnO. This fact suggests that hypothetical Zn-dominant tourmaline will rather not form due to Zn-Fe fractionation even in geochemically highly-evolved environments. Thus, it seems that the only specific mechanism that can promote crystallization of Zn-rich tourmaline is Na-Li-B-F metasomatism of a gahnite-bearing mineral assemblage. The Zn-rich fluor-elbaite + elbaite (Tur III) from Piława Górna are an example, where the local crystallization environment was controlled by dissolution of gahnite by aggressive (Na,Li,F,B)-bearing fluids. Crystallization of Zn-rich tourmaline was, however, limited to a relatively narrow 0.1-millimetre-sized zone around gahnite, which suggests low diffusion of Zn toward fluor-elbaite overgrowths. Therefore, single crystals of Zn-dominant tourmaline seem rather unlikely in nature and intergrowths of gahnite with Li-bearing tourmalines (Na-Li-B-F metasomatism around gahnite) might be the most favorable environment where zones/domains of Zn-dominant tourmaline could form.
All known tourmalines with elevated Zn contents are elbaite or fluor-elbaite ([10,11,12,13,14,15,16]; present study). The excesses of Al over Li and high amounts of X-site vacancies or WO2− could favor the formation of Zn-tourmaline with dominance of the end-members ☐(Zn2Al)Al6B3Si6O27(OH)3(OH) or Na(Zn2Al)Al6B3Si6O27(OH)3O. However, Zn-rich fluor-elbaite with the presence of significant X-site vacancies or WO2− could also be interpreted as a solid solution of NaZn3Al6B3Si6O27(OH)3(OH) tourmaline with fluor-elbaite + rossmanite or darrelhenryite end-members, and such a case is shown by the Raman spectrum of Zn-rich fluor-elbaite Tur IIIA (the absences of OH vibration bands, which would originate from YZnYAlYAl-X☐, YZnYZnYAl-X☐ arrangements). This implies that fluorine, as a significant component of the Zn-rich tourmalines, should be intimately related to the fluor-elbaite constituent, and the W site in Zn-dominant tourmaline should rather be dominated by OH or O.
7. Conclusions
Atypically high Zn enrichment in tourmaline is generally connected with certain elbaites and fluor-elbaites. The enrichment in Zn does not result from Zn-Fe fractionation, but rather from dissolution of gahnite by (Na,Li,F,B,Be)-bearing fluid and reprecipitation of Zn-bearing secondary fluor-elbaite or elbaite in the nearest neighborhood of the decomposing gahnite. As fluorine is incorporated into tourmaline by the fluor-elbaite component, three potential Zn-dominant end-members for Zn-tourmaline are possible: NaZn3Al6B3Si6O27(OH)3(OH), ☐(Zn2Al)Al6B3Si6O27(OH)3(OH) and Na(Zn2Al)Al6B3Si6O27(OH)3O. Future structural studies are needed to determine which of the hypothetical end-members is more likely.
Acknowledgments
We thank three anonymous reviewers for their comments on this manuscript. The studies were supported by the National Science Centre (Poland) grant 2015/19/B/ST10/01809 to AP.
Author Contributions
A.P. designed the scientific topic of the work, made all compositional recalculations and wrote the paper; A.W. and E.S. performed the EMP analysis; B.G. and P.J. recorded and resolved Raman spectra of the tourmalines; and A.S. edited text of the manuscript and prepared graphs.
Conflicts of Interest
The authors declare no conflict of interest. The founding sponsors had no role in the design of the study; in the collection, analyses, or interpretation of data; in the writing of the manuscript, and in the decision to publish the results.
References
- Henry, D.J.; Novák, M.; Hawthorne, F.C.; Ertl, A.; Dutrow, B.L.; Uher, P.; Pezzotta, F. Nomenclature of the tourmaline-supergroup minerals. Am. Mineral. 2011, 96, 895–913. [Google Scholar] [CrossRef]
- Sokolov, M.; Martin, R.F. A Pb-dominant member of the tourmaline group, Minh Tien granitic pegmatite, Luc Yen District, Vietnam. Estudos Geol. 2009, 19, 352–353. [Google Scholar]
- Lottermoser, B.G.; Plimer, I.R. Chemical variation in tourmalines, Umberatana, South Australia. N. Jahrb. Mineral. Mon. 1987, 7, 314–326. [Google Scholar]
- Yu, J.M.; Jiang, S.Y. Chemical composition of tourmaline from the Yunlong tin deposit, Yunnan, China: Implications for ore genesis and mineral exploration. Miner. Petrol. 2003, 77, 67–84. [Google Scholar] [CrossRef]
- Johnson, M.L.; Wentzell, C.Y.; Elen, S. Multicolored bismuth-bearing tourmaline from Lundazi, Zambia. Gems Gemol. 1997, 33, 204–211. [Google Scholar] [CrossRef]
- Vereshchagin, O.S.; Rozhdestvenskaya, I.V.; Frank-Kamenetskaya, O.V.; Zolotarev, A.A.; Mashkovtsev, R.I. Crystal chemistry of Cu-bearing tourmalines. Am. Mineral. 2013, 98, 1610–1616. [Google Scholar] [CrossRef]
- Baksheev, I.A.; Kudryavtseva, O.E. Nickeloan tourmaline from the Berezovskoe gold deposit, Middle Urals, Russia. Can. Mineral. 2004, 42, 1065–1078. [Google Scholar] [CrossRef]
- Van Hinsberg, V.J.; Henry, D.J.; Dutrow, B.L. Tourmaline as a petrologic forensic mineral: A unique recorder of its geologic past. Elements 2011, 7, 327–332. [Google Scholar] [CrossRef]
- Grice, J.D.; Ercit, T.S. Ordering of Fe and Mg in the tourmaline crystal structure: The correct formula. N. Jahrb. Miner. Abh. 1993, 165, 245–266. [Google Scholar]
- Federico, M.; Andreozzi, G.B.; Lucchesi, S.; Graziani, G. Compositional variation of tourmaline in the granitic pegmatite dykes of the Cruzeiro Mine, Minas Gerais, Brazil. Can. Mineral. 1998, 36, 415–431. [Google Scholar]
- Hawkins, K.D.; MacKinnon, I.D.R.; Schneeberger, H. Influence of chemistry on the pyroelectric effect in tourmaline. Am. Mineral. 1995, 80, 491–501. [Google Scholar] [CrossRef]
- Adusumilli, M.S.; Castro, C.; Bhaskara Rao, A. Blue and green gem tourmalines from Gregório pegmatite, Rio Grande do Norte State, Brazil. In Proceedings of the 16th General Meeting, IMA, Pisa, Italy, 4–9 September 1994; pp. 1–13. [Google Scholar]
- Soares, D.R. Contribuição à Petrologia de Pegmatitos Mineralizados em Elementos Raros e em Elbeítas Gemológicas da Província Pegmatítica da Borborema, Nordeste do Brasil. Ph.D. Thesis, UFPE, Recife, Brazil, 2004. [Google Scholar]
- Ferreira, A.C.M.; Ferreira, V.P.; Soares, D.R.; Vilarroel-Leo, H.S. Chemical and mineralogical characterization of elbaite from the Alto Quixaba pegmatite, Seridó Province, NE Brazil. An. Acad. Bras. Ciênc. 2005, 77, 729–743. [Google Scholar] [CrossRef] [PubMed][Green Version]
- Jedwab, J. Tourmaline zincifere dans une pegmatite de Muika (Congo). Bull. Soc. Belge Géol. Paléontol. D’hydrol. 1962, 71, 132–135. [Google Scholar]
- Sokolov, P.B.; Gorskaya, M.G.; Kretser, Y.L. Zinc-bearing tourmalines from rare-metal pegmatites. Zap. Vses. Mineral. Obshchest. 1988, 117, 70–74. (In Russian) [Google Scholar]
- Szuszkiewicz, A.; Szełęg, E.; Pieczka, A.; Ilnicki, S.; Nejbert, K.; Turniak, K.; Banach, M.; Łodziński, M.; Różniak, R.; Michałowski, P. The Julianna pegmatite vein system at the Piława Górna mine, Góry Sowie Block, SW Poland–preliminary data on geology and descriptive mineralogy. Geol. Q. 2013, 57, 467–484. [Google Scholar] [CrossRef]
- Pieczka, A.; Łodziński, M.; Szełęg, E.; Ilnicki, S.; Nejbert, K.; Szuszkiewicz, A.; Turniak, K.; Banach, M.; Michałowski, P.; Różniak, R. The Sowie Mts. pegmatites (Lower Silesia, SW Poland): A current knowledge. Acta Mineral. Petrogr. Szeged 2012, 7, 105–106. [Google Scholar]
- Pieczka, A.; Szuszkiewicz, A.; Szełęg, E.; Nejbert, K.; Łodziński, M.; Ilnicki, S.; Turniak, K.; Banach, M.; Hołub, W.; Michałowski, P.; et al. (Fe,Mn)–(Ti,Sn)–(Nb,Ta) oxide assemblage in a little fractionated portion of a mixed (NYF + LCT) pegmatite from Piława Górna, the Sowie Mts. block, SW Poland. J. Geosci. 2013, 58, 91–112. [Google Scholar] [CrossRef]
- Pieczka, A.; Szuszkiewicz, A.; Szełęg, E.; Janeczek, J.; Nejbert, K. Granitic pegmatites of the Polish part of the Sudetes (NE Bohemian massif, SW Poland). In Fieldtrip Guidebook, Proceedings of the 7th International Symposium on Granitic Pegmatites, PEG 2015, Książ, Poland, 17–19 June 2015; Gadas, P., Novák, M., Szuszkiewicz, A., Cempírek, J., Eds.; Czech Republic: Brno, Czech Republic, 2015; pp. 73–103. [Google Scholar]
- Pieczka, A.; Szuszkiewicz, A.; Szełęg, E.; Ilnicki, S.; Nejbert, K.; Turniak, K. Samarskite-group minerals and alteration products: An example from the Julianna pegmatitic system, Piława Górna, SW Poland. Can. Mineral. 2014, 52, 303–319. [Google Scholar] [CrossRef]
- Pieczka, A.; Szełęg, E.; Szuszkiewicz, A.; Gołębiowska, B.; Zelek, S.; Ilnicki, S.; Nejbert, K.; Turniak, K. Cs-bearing beryl evolving to pezzottaite from the Julianna pegmatitic system, SW Poland. Can. Mineral. 2016, 54, 115–124. [Google Scholar] [CrossRef]
- Szuszkiewicz, A.; Pieczka, A.; Szełęg, E.; Turniak, K.; Ilnicki, S.; Nejbert, K. The euxenite-group minerals and products of their alteration in the hybrid Julianna granitic pegmatite, Piława Górna, Sudetes, southwestern Poland. Can. Mineral. 2016, 54, 879–898. [Google Scholar] [CrossRef]
- Pieczka, A.; Hawthorne, F.C.; Cooper, M.A.; Szełęg, E.; Szuszkiewicz, A.; Turniak, K.; Nejbert, K.; Ilnicki, S. Pilawite-(Y), Ca2(Y,Yb)2[Al4(SiO4)4O2(OH)2], a new mineral from the Piława Górna granitic pegmatite, southwestern Poland: Mineralogical data, crystal structure and association. Mineral. Mag. 2015, 79, 1143–1157. [Google Scholar] [CrossRef]
- Szełęg, E.; Zuzens, B.; Hawthorne, F.C.; Pieczka, A.; Szuszkiewicz, A.; Turniak, K.; Nejbert, K.; Ilnicki, S.S.; Friis, H.; Makovicky, E.; et al. Bohseite, ideally Ca4Be4Si9O24(OH)4, from the Piława Górna quarry, the Góry Sowie Block, SW Poland. Mineral. Mag. 2017, 81, 35–46. [Google Scholar] [CrossRef]
- Pieczka, A.; Hawthorne, F.C.; Ma, C.; Rossman, G.; Szełęg, E.; Szuszkiewicz, A.; Turniak, K.; Nejbert, K.; Ilnicki, S.S. Żabińskiite, ideally Ca(Al0.5Ta0.5)(SiO4)O, a new mineral of the titanite group from the Piława Górna pegmatite, the Góry Sowie Block, southwestern Poland. Mineral. Mag. 2017, 81, 591–610. [Google Scholar] [CrossRef]
- Turniak, K.; Pieczka, A.; Kennedy, A.K.; Szełęg, E.; Ilnicki, S.; Nejbert, K.; Szuszkiewicz, A. Crystallisation age of the Julianna pegmatite system (Góry Sowie Block, NE margin of the Bohemian massif): Evidence from U–Th–Pb SHRIMP monazite and CHIME uraninite studies. In Fieldtrip Guidebook, Proceedings of the 7th International Symposium on Granitic Pegmatites, PEG 201, Książ, Poland, 17–19 June 2015; Gadas, P., Novák, M., Szuszkiewicz, A., Cempírek, J., Eds.; Czech Republic: Brno, Czech Republic, 2015; pp. 111–112. [Google Scholar]
- Van Breemen, O.; Bowes, D.R.; Aftalion, M.; Żelaźniewicz, A. Devonian tectonothermal activity in the Sowie Góry gneissic block, Sudetes, southwestern Poland: Evidence from Rb–Sr and U–Pb isotopic studies. Ann. Geol. Soc. Pol. 1988, 58, 3–10. [Google Scholar]
- Timmermann, H.; Parrish, R.R.; Noble, S.R.; Kryza, R. New U–Pb monazite and zircon data from the Sudetes Mountains in SW Poland: Evidence for a single-cycle Variscan orogeny. J. Geol. Soc. 2000, 157, 265–268. [Google Scholar] [CrossRef]
- Kryza, R.; Fanning, C.M. Devonian deep-crustal metamorphism and exhumation in the Variscan Orogen: Evidence from SHRIMP zircon ages from the HT–HP granulites and migmatites of the Góry Sowie (Polish Sudetes). Geodin. Acta 2007, 20, 159–176. [Google Scholar] [CrossRef]
- Müller, A.; Szuszkiewicz, A.; Ilnicki, S.; Nejbert, K. Quartz chemistry of the Julianna pegmatites and their wall rocks, Piława Górna, Poland: Implications for the origin of pegmatite melts. In Abstracts, Proceedings of the 8th International Symposium on Granitic Pegmatites, PEG2017, Kristiansand, Norway, 13–15 June 2017; Müller, A., Rosing-Schow, N., Eds.; Norsk Geologisk Forening: Trondheim, Norway, 2017; pp. 84–88. [Google Scholar]
- Pouchou, I.L.; Pichoir, F. “PAP” (phi-rho-z) procedure for improved quantitative microanalysis. In Microbeam Analysis; Armstrong, I.T., Ed.; San Francisco Press: San Francisco, CA, USA, 1985; pp. 104–106. [Google Scholar]
- Pesquera, A.; Gil-Crespo, P.P.; Torres-Ruiz, F.; Torres-Ruiz, J.; Roda-Robles, E. A multiple regression method for estimating Li in tourmaline from electron microprobe analyses. Mineral. Mag. 2016, 80, 1129–1133. [Google Scholar] [CrossRef]
- SPECTRA-CALC V2.23. Galactic Industries Corp.: Main St., NH, USA.
- Whitney, D.L.; Evans, B.W. Abbreviations for names of rock-forming minerals. Am. Mineral. 2010, 95, 185–187. [Google Scholar] [CrossRef]
- Alvarez, M.A.; Coy-Yli, R. Raman spectra of tourmaline. Spectrochim. Acta A 1978, 34, 899–908. [Google Scholar] [CrossRef]
- Gasharova, B.; Mihailova, B.; Konstantinov, L. Raman spectra of various types of tourmalines. Eur. J. Mineral. 1997, 9, 935–940. [Google Scholar] [CrossRef]
- McKeown, D.A. Raman spectroscopy, vibrational analysis, and heating of buergerite tourmaline. Phys. Chem. Miner. 2008, 35, 259–270. [Google Scholar] [CrossRef]
- Hoang, L.H.; Hien, N.T.M.; Chen, X.B.; Minh, N.V.; Yang, I.-S. Raman spectroscopis study of various types of tourmalines. J. Raman Spectrosc. 2011, 42, 1443–1446. [Google Scholar] [CrossRef]
- Skoggby, H.; Bosi, F.; Lazor, P. Short-range order in tourmaline: A vibrational spectroscopic approach to elbaite. Phys. Chem. Miner. 2012, 39, 811–816. [Google Scholar] [CrossRef]
- Zhao, C.; Liao, L.; Xia, Z.; Sun, X. Temperature-dependent Raman and infrared spectroscopy study on iron-magnesium tourmalines with different Fe content. Vib. Spec. 2012, 62, 28–34. [Google Scholar] [CrossRef]
- Fantini, C.; Tavares, M.C.; Krambrock, K.; Moreira, R.L.; Righi, A. Raman and infrared study of hydroxyl sites in natural uvite, fluor-uvite, magnesio-foitite, dravite and elbaite tourmalines. Phys. Chem. Miner. 2014, 41, 247–254. [Google Scholar] [CrossRef]
- Berryman, E.J.; Wunder, B.; Ertl, A.; Koch-Müller, M.; Rhede, D.; Scheidl, K.; Giester, G.; Heinrich, W. Influence of the X-site composition tourmaline’s crystal structure: Investigation of synthetic K-dravite, dravite, oxy-uvite, and magnesio-foitite using SREF and Raman spectroscopy. Phys. Chem. Miner. 2016, 43, 83–102. [Google Scholar] [CrossRef]
- Watenphul, A.; Burgdorf, M.; Schlüter, J.; Horn, I.; Malcherek, T.; Mihailova, B. Exploring the potential of Raman spectroscopy for crystallochemical analyses of complex hydrous silicates: II. Tourmalines. Am. Mineral. 2016, 101, 970–985. [Google Scholar] [CrossRef]
- Mercurio, M.; Rossi, M.; Izzo, F.; Cappelletti, P.; Germinario, C.; Grifa, C.; Petrelli, M.; Vergara, A.; Langella, A. The characterization of natural gemstones using non-invasive FT-IR spectroscopy: New data on tourmalines. Talanta 2018, 178, 147–159. [Google Scholar] [CrossRef] [PubMed]
- Choi, J.B.; Hawthorne, F.C. Characterization of tourmaline crystals by Rietveld and single-crystal structure refinement: A comparative study. Geosci. J. 2002, 6, 237–243. [Google Scholar] [CrossRef]
- Hawthorne, F.C. Structural mechanism for light-element variations in tourmaline. Can. Mineral. 1996, 34, 123–132. [Google Scholar]
- Černý, P.; Meintzer, R.E.; Anderson, A.J. Extreme fractionation in rare-element granitic pegmatites: Selected examples of data and mechanism. Can. Mineral. 1985, 23, 381–421. [Google Scholar]
© 2018 by the authors. Licensee MDPI, Basel, Switzerland. This article is an open access article distributed under the terms and conditions of the Creative Commons Attribution (CC BY) license (http://creativecommons.org/licenses/by/4.0/).