Molecular Simulation of Minerals-Asphalt Interfacial Interaction


1
School of Transportation Science and Engineering, Harbin Institute of Technology, Harbin 150090, China
2
Engineering Technology and Materials Research Center, China Academy of Transportation Sciences, Beijing 100029, China
3
College of Architecture and Civil Engineering, Beijing University of Technology, Beijing 100124, China
*
Authors to whom correspondence should be addressed.
Minerals 2018, 8(5), 176; https://doi.org/10.3390/min8050176
Submission received: 29 March 2018
/
Revised: 20 April 2018
/
Accepted: 20 April 2018
/
Published: 24 April 2018
(This article belongs to the Special Issue Molecular Simulation of Mineral-Solution Interfaces)
Abstract
:The interfacial interaction between asphalt binder and mineral aggregate makes different components have different diffusion behavior. It influences the performance of interface and consequently that of the mix. In this research, the models of four asphalt components (asphaltene, resin, aromatics and saturate) and five minerals were constructed individually, and then the Al2O3-asphalt interface model was constructed by adding the asphalt layer and mineral layer together. The interfacial behavior at molecular scale was simulated by setting boundary conditions, optimizing the structure and canonical ensemble. The mean square displacement (MSD) and diffusion coefficient of particles were selected as indicators to study the diffusion of asphalt components on the surface of Al2O3. The results show that when the temperature was 65 °C, asphalt binder showed more viscosity, the diffusion speed of asphalt components ranked according to their molecular mass, which was saturate > aromatics > resin > asphaltene. At 25 °C and 165 °C, the resin had the fastest diffusion speed, which was nearly twice of asphaltene. The interaction between asphalt components and Al2O3 mineral surface can make the diffusion of asphalt components independent on temperature.
1. Introduction
Molecular dynamics simulation technology is a computer modeling approach. This approach employs classical mechanics model of molecular interactions as a foundation. With the development of computer technology, molecular dynamics (MD) simulation is widely being used in the fields of material science, biology, medicine and physical chemistry. In this research, molecular dynamics simulation technology was used to study the interfacial adsorption between asphalt binder and mineral aggregate. This is significantly important to understand the interfacial mechanism between asphalt binder and mineral aggregate at nanoscale [1,2,3,4,5].
The nano-mechanics method has recently emerged as a powerful computational approach to model from nano to macro microstructure deformation and failure behaviours in materials, including asphaltic materials. Bhasin et al. [6] used the molecular simulation techniques to investigate the correlation of chain length and chain branching to self-diffusivity of binder molecules. The findings reported by them were consistent with observations reported in previous studies and expanded on the understanding of the relationship between molecular architecture, self-diffusivity, and self-healing properties of asphalt binders. Sun et al. [7] used molecular dynamics simulation to examine the hypothesis of healing mechanism and to evaluate the self-healing capability of neat and Styrene Butadiene Styrene (SBS) modified asphalt binders. Densities and glass transition temperatures of neat and SBS modified asphalt binders were obtained by them based on the MD simulation results. They created an artificial crack in MD model to simulate the diffusion of molecules across a crack interface. They proposed three indices calculated to evaluate the self-healing capability of asphalt binders, including diffusion coefficient, activation energy, and pre-exponential factor. They also compared the values of these three indices obtained from MD results with the values derived from fatigue-rest-fatigue test, to assess the reliability of above indices as self-healing performance indicators. Xu and Wang [8] used molecular dynamics simulation to investigate the effect of oxidative aging on asphalt binder. They used mean square displacement (MSD) and radial distribution function (RDF) of molecules and diffusion coefficient to analyze molecular structures of virgin and aged asphalt. They found that the molecular structure of asphalt was in agreement with the colloidal theory. Aging weakened the nano-aggregation behavior of asphaltene molecules and reduces the translational mobility of asphalt molecules. Compared to virgin asphalt, aged asphalt had the higher activation energy barrier for self-healing. Inclusion of water molecules in the asphalt-aggregate interface caused degradation of work of adhesion and this effect was more significant for aged asphalt.
Some researchers used MD method to interfacially investigate the interaction between asphalt binder and mineral aggregate. Lu and Wang [9] used the molecular mechanics method to calculate the quartz bulk elastic constants, e.g. stiffness matrix, shear modulus, Young’s modulus and Poisson's ratio. They also used the MD simulations to model the deformation and failure behavior of asphalt-rock interfaces when subject to uniaxial tension. A 3D asphalt-quartz interface structure model was proposed in terms of density, position and thickness. The interfacial atom trajectories were visualized to represent the properties in simulations that characterized those of the asphalt-rock interface under uniaxial tension at nanoscale. Interfacial debonding characteristics or the adhesive failure was implemented with a large-scale MD simulation technology. They found that highly anisotropic elastic properties of a quartz structure will appear from atomistic scale and tensile strength of the asphalt-quartz interface system was controlled by the stress state at the asphalt-rock interface layer. Asphalt-rock interface adhesive failure appeared to be ductile at freezing environmental temperature and low strain rate. Later, Lu and Wang [10] reviewed the advances of nano-mechanics modelling method. They introduced the recent advances of their research on the molecular origin of deformation and failure processes of asphalt-aggregate interfaces, including studies of bulk mechanical properties of asphalt and mineral aggregate, as well as asphalt-aggregate interface properties under tensile or confined shear loading. Their nanoscale modelling work focused on understanding the mechanical quantities of hierarchical asphalt/mineral materials to develop atomic scale structure-property relations. The large-scale atomistic simulation provided a powerful approach in studying mechanical properties of asphalt concrete materials. They also concluded a discussion of the significance of nanoscale structure-properties relationship of the interface structure under various loading conditions and water affinities of specific asphalt-aggregate pairs. Li et al. [11] used MD to establish the molecular models of asphaltene and four oxides, and calculated the interfacial energy. They found that the interfacial energy between asphaltene and oxide reaches the maximum value at 25 °C and 80 °C and the minimum value at 40 °C. Dong et al. [12] used the MD simulation and the peak force quantitative nano-mechanics atomic force microscopy (PFQN-AFM) to characterize the nanostructure of the asphalt-aggregate interface. They found that that the intermolecular gaps can be filled by naphthene aromatics, and molecular micelles can be lubricated by saturates. Xu and Wang [13,14] used MD to study thermodynamic and cohesive properties of asphalt binder, such as density, solubility parameter, cohesive energy density, and surface free energy. They analyzed the adhesion properties by calculating the interaction energy and the work of adhesion at asphalt-aggregate interface for the first time. They also performed tensile simulations to obtain the stress-separation responses to analyze the interfacial mechanical behavior. They found that the interface failure was mainly adhesive failure although large air voids were formed in the bulk asphalt as the loading rate decreases to a certain level.
The objective of this research is to build an effective interfacial model between asphalt binder and minerals and study the factors that influence interfacial interaction.
2. Materials and Methods
2.1. Model Construction
2.1.1. The Construction of Asphalt Model
The molecular structure of four asphalt components selected in this research can be seen in Reference [15]. The molecular weight of different asphalt component can be calculated, and their mass ratio was selected according to the Reference [16]. The relative atomic mass of C, H, O, N, S are 12, 1, 16, 14, 32 respectively. The weight of element equals atomic weight multiplying atomic number. The molecular weight can be obtained by accumulating all elements weights. The calculated results are 2048 for asphalt molecular, 824 for resin, 618 for aromatic and 310 for saturate. Accordingly, the ratio of the four asphalt components can be calculated as follows: asphaltenes:resin:aromatics:saturate = 1:3:7:5.
2.1.2. The Construction of Mineral Model
Other researchers have already found that SiO2, Al2O3, CaO, MgO and Fe2O3 are the most important components affecting the performance of aggregate, particularly for the tensile strength and adhesion behavior [17,18]. Therefore, this research mainly focused on the crystal structure of Al2O3, and analyzed the interfacial diffusion behavior between it and asphalt binder.
(1) Construction of crystal unit cell
Crystal unit cell is the smallest unit in crystal. Its size and shape can be characterized by the edge length and crossing angle. The lattice constants used in this research can be found in Reference [15].
(2) Interception and optimization of lattice planes
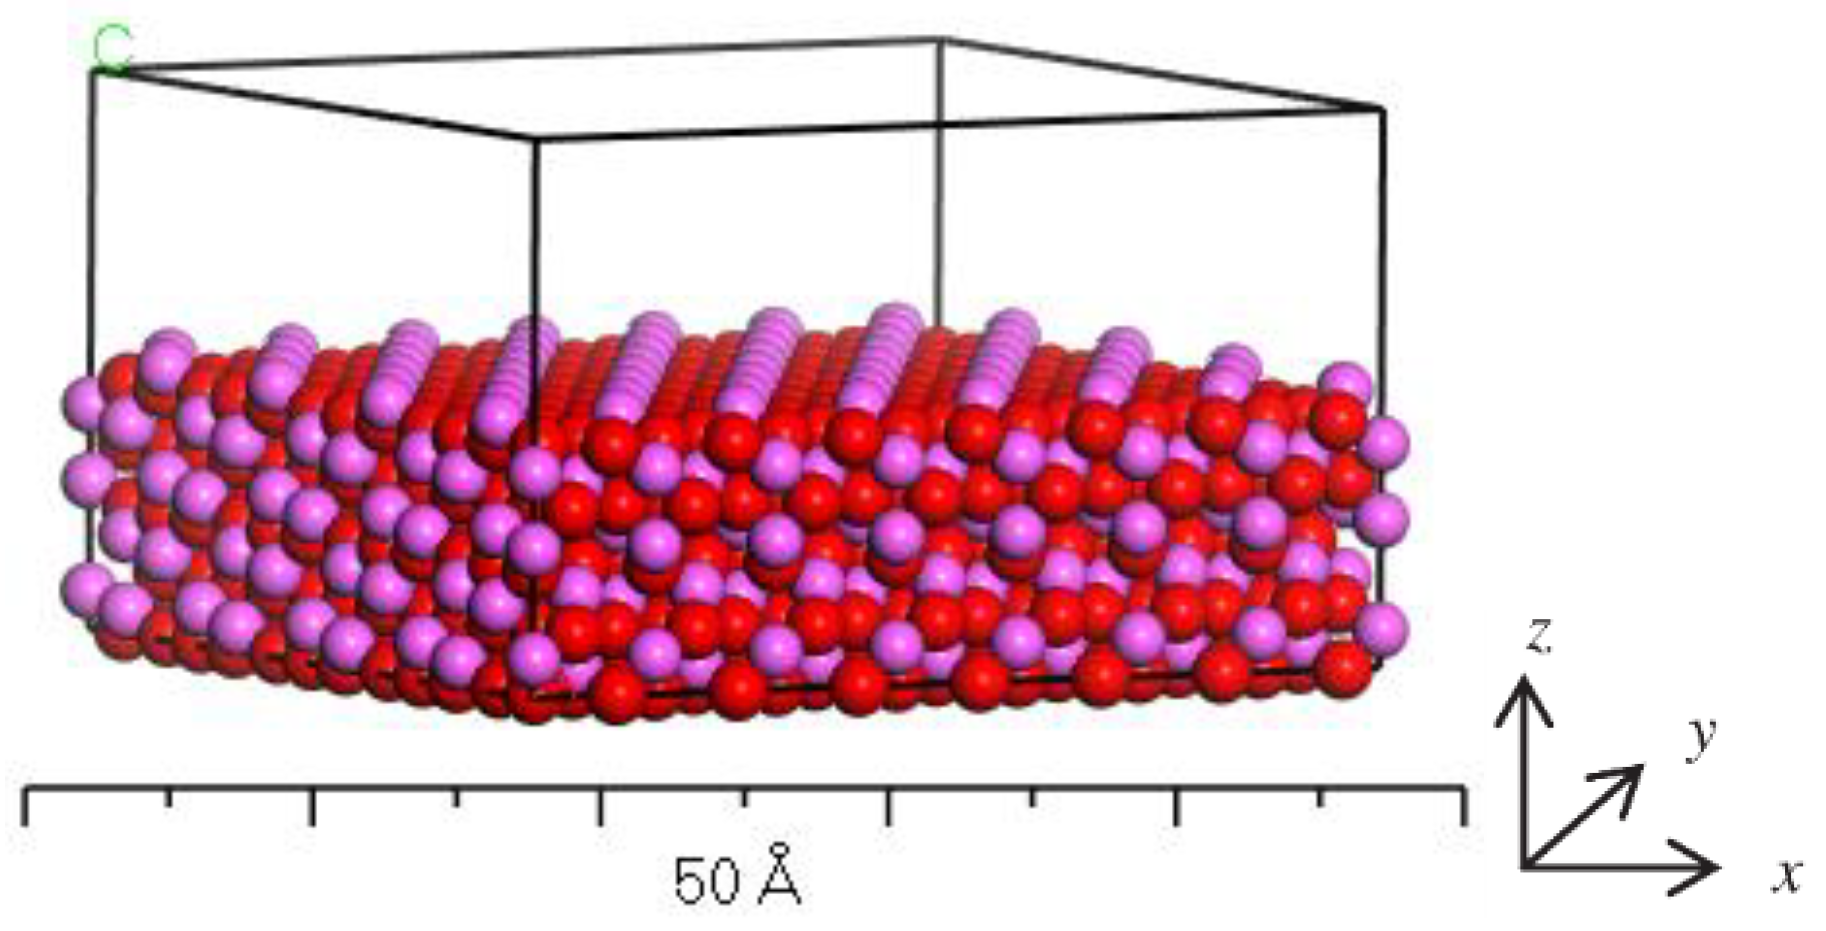
In order to describe the structure of crystal unit cell clearly, a plane was first intercepted. For example, the (001) lattice plane of Al2O3 was intercepted and its thickness was set as 10 Å. The energy minimization procedure was used to optimize the structure, and then the supercell was constructed, followed by adding a vacuum layer with 10 Å thickness. The finally constructed Al2O3 mineral surface model is shown in Figure 1.
2.1.3. The Construction of Interface Model
The interface model was obtained by overlaying the following three layers. The first layer was mineral crystal surface. The second layer was asphalt layer. The third layer was a 30 Å vacuum layer. The constructed models have a size 35 Å × 35 Å × 75 Å. The details and verification on effectiveness of the models can be found in the following section.
2.2. Molecular Dynamic Simulation
Condensed-phase optimized molecular potentials for atomistic simulation studies (COMPASS) force field was selected in this research. Its potential energy function is shown in Equation (1).
where, is the potential energy function of bond length; is the potential energy function of bond angle; is the potential energy function of dihedral angle; is the potential energy function of oscillation angle to plane; is the potential energy function of interaction item; is the Interaction energy caused by coulomb electrostatic force (kcal/mol); is the interaction energy caused by Van der Waals force (kcal/mol).
and can be determined by Equations (2) and (3).
where, i and j are different atoms; q is the atomic charge (C); r is the distant between different atoms (m); ε is the potential well depth (eV).
More detailes about structure optimization, boundary conditions and molecular dynamic simulation can be found in Reference [19]. Particularly this research selected a single cell for the molecular dynamics simulation and a periodic boundary condition was used. A 12.5 Å Cut-off radius was used to calculate the non-bonded remote force.
3. Results and Discussion
3.1. Verification of Model Effectiveness
The verification of effectiveness of asphalt model could be found in Guo et al.’s previous work [15]. In this paper, the effectiveness of mineral crystal models is discussed.
In this research, the elastic constants of constructed structure models were calculated as follows: (i) the surface model of mineral crystals was input by Materials Studio software (version 8.0, BIOVIA, San Diego, CA, USA); (ii) the Calculation function in the Forcite module was selected; (iii) the mechanical properties was selected in the task window. The calculated accuracy was Medium, and the calculated method was Constant Strain. The calculation principle was as follows: (i) First, select a value for strain tensor according to the principle that the relationship between strain amplitude, elastic constant and stress tensor should be the simplest. (ii) According to the relationship between strain tensor and lattice matrix vector, the lattice matrix vector after strain was obtained. (iii) The fractional coordinates of atoms between different strains were selected as the atom position, and the stress tensor was calculated after optimizing the atom position. (iv) The elastic constant was obtained by analyzing the relationship between stress tensor, strain amplitude and elastic constant.
The elastic constants of different mineral crystal models in this research were calculated as follows.
The elastic stiffness constant SiO2 crystal structure model:
The elastic stiffness constant Al2O3 crystal structure model:
The elastic stiffness constant CaO crystal structure model:
The elastic stiffness constant MgO crystal structure model:
The elastic stiffness constant Fe2O3 crystal structure model:
It can be seen from the above matrix of elastic stiffness constant of different minerals that the elastic stiffness constants of SiO2, CaO and MgO were same at three principal directions. It indicates that the structure of SiO2, CaO and MgO were symmetry, and the hardness were same at the a, b and c edge-length directions. However, the C33 of Al2O3 was 488.3 GPa, a little bit larger than C11 = C22 = 479.1 GPa. This indicates that it was more difficult for Al2O3 crystal to deform along the c direction than the a and b direction. The C33 of Fe2O3 was 185.1GPa, smaller than C11 = C22 = 533.8 GPa. It means that it was much easier for Fe2O3 crystal to deform along the c direction than the a and b direction.
The physical properties of different minerals calculated in this research are shown in Table 1.
It can be seen from Table 1 that the calculated shear modulus of SiO2 was 46.7GPa, which was similar with the quartz’s shear modulus 44.5 GPa reported in Reference [20]. The Young’s modulus of SiO2 were all 130.2 GPa along three directions, which were larger than the tested value 76–97 GPa reported in Reference [20]. It was due to that the purity of the practical material was poorer than the simulated material and the practical material had more defects. The calculated shear modulus of CaO was 76.8 GPa, larger than the tested value 35 GPa. The Young’s modulus of CaO were all 193.9 GPa along three directions, which were larger than the tested value 72.4–88.2 GPa reported in Reference [20]. Huang et al. found that the Young’s modulus of kaolin mainly comprised of SiO2 and Al2O3 was between 31 GPa and 70 GPa [21]. This was smaller than the calculated results in this research. The difference between the simulated results and tested results was due to: (i) the simulated mineral was not exactly the same with the practical mineral, and the latter had more impurities; (ii) the practical mineral structure had more crystal defects compared to the simulated minerals. Overall, the simulated values in this research are acceptable compared to the practical tested values. To some extent, they can reflect the practical situation.
3.2. Diffusion of Asphalt Components on the Surface of Al2O3
Mean square displacement (MSD) was used to study the diffusion trend of four asphalt components on the surface of Al2O3. MSD can be calculated as follows:
where, ri(t) is the displacement of particle i at t time (m); ri(0) is the displacement of particle i at the initial time (m); <> is the average of all particles.
The bigger the slope of MSD curve, the faster the migration of the particle. The diffusion coefficient of particles can be calculated according to Equations (5).
where, N is the number of diffusion particles in the system; D is the diffusion coefficient of particle (m2/s).
If the differential in Equation (5) can be approximated as the slope of correlation between MSD and time, the diffusion coefficient of particles can be revised as follows:
where, a is the slope of the curve between MSD and time.
The relationship between MSD of four asphalt components on the surface of Al2O3 and time are shown in Figure 2 and Figure 3.
It can be seen from Figure 2 that the diffusion speed of saturate is the fastest on the surface of Al2O3. It was not dependent on the temperature. At 25 °C, resin had a similar diffusion speed with saturate, obviously faster than asphaltene and aromatic. At 65 °C, asphaltene, resion and aromatic had similar diffusion speed. At 165 °C, the resin diffused slower than saturate, followed by aromatic. The asphaltene diffused the slowest. The diffusion speeds of different asphalt components are consistent with the ranking of the relative molecular mass. It indicates that the interaction between asphalt components and SiO2 at 165 °C became too weak to influence the diffusion of asphalt components.
Figure 3 indicates that the diffusion speeds of asphaltene, resin and aromatic on surface of Al2O3 were not sensitive to temperature. For saturate, the diffusion speed at 165 °C was obviously higher than the diffusion speeds at 25 °C and 65 °C. This is due to that the higher temperature can result in the faster diffusion. The slope of curves in Figure 2 and Figure 3 can be obtained by fitting the relationship between MSD and time. The diffusion coefficients of four asphalt components at different temperature can be calculated according to Equation (6). The results are shown in Figure 4.
It can be seen from Figure 4 that at 65 °C, around the softening point of asphalt with penetration 60–100, the diffusion speed of asphalt components ranked according to their molecular weight, that is the larger the molecular weight, the faster the diffusion would be. At 25 °C and 165 °C, the rule also applied except resin. This may due to that the resin was adsorbed around the asphaltene. The interaction between different components made the resin diffused faster. By comparing the diffusion speeds at different temperatures, it can be known that the diffusion of four asphalt components were not sensitive to the temperature. This was due to the interaction between asphalt components and Al2O3 mineral crystal.
4. Conclusions
In this research, molecular dynamic simulation was used to build the asphalt-mineral interface models. The models’ effectiveness was evaluated by comparing to the test values. The mean square displacement (MSD) and diffusion coefficient of particles were selected as indicators to study the diffusion of asphalt components on the surface of Al2O3 mineral. The effect factors of diffusion behavior of asphalt components on minerals were analyzed. The following are the main findings from this study:
- (1)
- When the asphalt binder show more viscosity (temperature equals 65 °C), the diffusion speed of asphalt components would rank according to their molecular mass, which was saturate > aromatics > resin > asphaltene.
- (2)
- At 25 °C and 165 °C, the resin had the fastest diffusion speed, which was nearly twice of asphaltene.
- (3)
- The interaction between asphalt components and Al2O3 mineral crystal can make the diffusion of asphalt components independent on temperature.
Author Contributions
Daisong Luo and Meng Guo conceived and established the models; Yiqiu Tan provided the model parameters; Yiqiu Tan and Meng Guo analyzed the data; Daisongluo and Meng Guo wrote the paper.
Acknowledgments
This study was supported by Beijing Natural Science Foundation (8174071).
Conflicts of Interest
The authors declare no conflict of interest.
References
- Tan, Y.Q.; Guo, M. Using surface free energy method to study the cohesion and adhesion of asphalt mastic. Constr. Build. Mater. 2013, 47, 254–260. [Google Scholar] [CrossRef]
- Tan, Y.Q.; Guo, M. Interfacial thickness and interaction between asphalt and mineral fillers. Mater. Struct. 2014, 47, 605–614. [Google Scholar] [CrossRef]
- Guo, M.; Motamed, A.; Tan, Y.Q.; Bhasin, A. Investigating the interaction between asphalt binder and fresh and simulated RAP aggregate. Mater. Des. 2016, 105, 25–33. [Google Scholar] [CrossRef]
- Guo, M.; Tan, Y.Q.; Yu, J.X.; Hou, Y.; Wang, L.B. A Direct characterization of interfacial interaction between asphalt binder and mineral fillers by atomic force microscopy. Mater. Struct. 2017, 50, 141. [Google Scholar] [CrossRef]
- Guo, M.; Bhasin, A.; Tan, Y.Q. Effect of mineral fillers adsorption on rheological and chemical properties of asphalt binder. Constr. Build. Mater. 2017, 141, 152–159. [Google Scholar] [CrossRef]
- Bhasin, A.; Bommavaram, R.; Greenfield, M.L.; Little, D.N. Use of molecular dynamics to investigate self-healing mechanisms in asphalt binders. J. Mater. Civ. Eng. 2011, 23, 485–492. [Google Scholar] [CrossRef]
- Sun, D.Q.; Lin, T.B.; Zhu, X.Y.; Tian, Y.; Liu, F.L. Indices for self-healing performance assessments based on molecular dynamics simulation of asphalt binders. Comp. Mater. Sci. 2016, 114, 86–93. [Google Scholar] [CrossRef]
- Xu, G.J.; Wang, H. Molecular dynamics study of oxidative aging effect on asphalt binder properties. Fuel 2017, 188, 1–10. [Google Scholar] [CrossRef]
- Lu, Y.; Wang, L.B. Nanoscale modelling of mechanical properties of asphalt-aggregate interface under tensile loading. Int. J. Pavement Eng. 2010, 11, 393–401. [Google Scholar] [CrossRef]
- Lu, Y.; Wang, L.B. Nano-mechanics modelling of deformation and failure behaviours at asphalt–aggregate interfaces. Int. J. Pavement Eng. 2011, 12, 311–323. [Google Scholar] [CrossRef]
- Li, R.; Du, H.; Fan, Z.P.; Pei, J.Z. Molecular dynamics simulation to investigate the interaction of asphaltene and oxide in aggregate. Adv. Mater. Sci. Eng. 2016, 2016, 3817123. [Google Scholar] [CrossRef]
- Dong, Z.J.; Liu, Z.Y.; Wang, P.; Gong, X.B. Nanostructure characterization of asphalt-aggregate interface through molecular dynamics simulation and atomic force microscopy. Fuel 2017, 189, 155–163. [Google Scholar] [CrossRef]
- Xu, G.J.; Wang, H. Study of cohesion and adhesion properties of asphalt concrete with molecular dynamics simulation. Comp. Mater. Sci. 2016, 112, 161–169. [Google Scholar] [CrossRef]
- Xu, G.J.; Wang, H. Molecular dynamics study of interfacial mechanical behavior between asphalt binder and mineral aggregate. Constr. Build. Mater. 2016, 121, 246–254. [Google Scholar] [CrossRef]
- Guo, M.; Tan, Y.Q.; Bhasin, A.; Wei, J.M.; Yang, X.; Hou, Y. Using molecular dynamics to investigate interfacial adhesion between asphalt binder and mineral aggregate. In Proceedings of the 4th Chinese-European Workshop on Functional Pavement Design, Delft, The Netherlands, 29 June–1 July 2016; p. 60. [Google Scholar]
- Sultana, S.; Bhasin, A. Effect of chemical composition on rheology and mechanical properties of asphalt binder. Constr. Build. Mater. 2014, 72, 293–300. [Google Scholar] [CrossRef]
- Ozkahraman, H.T.; Isik, E.C. The effect of chemical and mineralogical composition of aggregates on tensile adhesion strength of tiles. Constr. Build. Mater. 2005, 19, 251–255. [Google Scholar] [CrossRef]
- Horgniesa, M.; Darque-Ceretti, E.; Fezai, H.; Felder, E. Influence of the interfacial composition on the adhesion between aggregates and bitumen: Investigations by EDX, XPS and peel tests. Int. J. Adhes. Adhes. 2011, 31, 238–247. [Google Scholar] [CrossRef]
- Guo, M.; Tan, Y.Q.; Hou, Y.; Wang, L.B. Diffusion of asphaltene, resin, aromatic and saturate components of asphalt on mineral aggregates surface: molecular dynamics simulation. Road Mater. Pavement Des. 2017, 18, 149–158. [Google Scholar] [CrossRef]
- Amorosi, A.; Rampello, S. An experimental investigation into the mechanical behaviour of a structured stiff clay. Geotechnique 2007, 57, 153–166. [Google Scholar] [CrossRef]
- Huang, E.; Lin, J.F.; Xu, J.; Huang, T.; Jean, Y.C.; Sheu, H.S. Compression studies of gibbsite and its high-pressure polymorph. Phys. Chem. Miner. 1999, 26, 576–583. [Google Scholar] [CrossRef]
Figure 1.
Model of Al2O3 surface.

Figure 2.
The relationship between mean square displacement (MSD) of four asphalt conponents on the surface of Al2O3 and time: (a) Temperature is 25 °C; (b) Temperature is 65 °C; (c) Temperature is 165 °C.
Figure 2.
The relationship between mean square displacement (MSD) of four asphalt conponents on the surface of Al2O3 and time: (a) Temperature is 25 °C; (b) Temperature is 65 °C; (c) Temperature is 165 °C.

Figure 3.
Effects of temperature on MSD of four asphalt components on the surface of Al2O3: (a) Asphaltene; (b) Resin; (c) Aromatics; (d) Saturate.
Figure 3.
Effects of temperature on MSD of four asphalt components on the surface of Al2O3: (a) Asphaltene; (b) Resin; (c) Aromatics; (d) Saturate.

Figure 4.
Diffusion coefficient of four asphalt components on the surface of Al2O3 at different temperatures.
Figure 4.
Diffusion coefficient of four asphalt components on the surface of Al2O3 at different temperatures.


Table 1.
The physical parameters of crystal structure model of different mineral.
| Minerals | SiO2 | Al2O3 | CaO | MgO | Fe2O3 | |
|---|---|---|---|---|---|---|
| Bulk modulus (GPa) | 203.1 | 246.7 | 135.8 | 131.0 | 352.5 | |
| Shear modulus (GPa) | 46.7 | 158.3 | 76.8 | 128.3 | 82.4 | |
| Young‘s modulus (GPa) | X | 130.2 | 410.0 | 193.9 | 290.1 | 129.6 |
| Y | 130.2 | 410.0 | 193.9 | 290.1 | 129.6 | |
| Z | 130.2 | 446.6 | 193.9 | 290.1 | 101.7 | |
| Poisson’s ratio | Exy | 0.47 | 0.30 | 0.22 | 0.22 | 1.29 |
| Exz | 0.47 | 0.17 | 0.22 | 0.22 | −0.54 | |
| Eyx | 0.47 | 0.30 | 0.22 | 0.22 | 1.29 | |
| Eyz | 0.47 | 0.17 | 0.22 | 0.22 | −0.54 | |
| Ezx | 0.47 | 0.18 | 0.22 | 0.22 | 0.42 | |
| Ezy | 0.47 | 0.18 | 0.22 | 0.22 | 0.42 | |
| Compression coefficient (1/GPa) | 0.0049 | 0.0041 | 0.0088 | 0.0058 | 0.0022 | |
© 2018 by the authors. Licensee MDPI, Basel, Switzerland. This article is an open access article distributed under the terms and conditions of the Creative Commons Attribution (CC BY) license (http://creativecommons.org/licenses/by/4.0/).
Share and Cite
MDPI and ACS Style
Luo, D.; Guo, M.; Tan, Y. Molecular Simulation of Minerals-Asphalt Interfacial Interaction. Minerals 2018, 8, 176. https://doi.org/10.3390/min8050176
AMA Style
Luo D, Guo M, Tan Y. Molecular Simulation of Minerals-Asphalt Interfacial Interaction. Minerals. 2018; 8(5):176. https://doi.org/10.3390/min8050176
Chicago/Turabian StyleLuo, Daisong, Meng Guo, and Yiqiu Tan. 2018. "Molecular Simulation of Minerals-Asphalt Interfacial Interaction" Minerals 8, no. 5: 176. https://doi.org/10.3390/min8050176
Note that from the first issue of 2016, this journal uses article numbers instead of page numbers. See further details here.