Article

Geophysical Investigation of the Pb–Zn Deposit of Lontzen–Poppelsberg, Belgium

1
Argenco Department, GeMMe (Minerals Engineering, Materials and Environment), University of Liège, 4000 Liège, Belgium
2
Argenco Department, Applied Geophysics, University of Liège, 4000 Liège, Belgium
3
Department of Geology, Ghent University, 9000 Ghent, Belgium
4
Department of Civil, Geological and Mining Engineering, Montreal Polytechnic School, Montreal, QC H3T 1J4, Canada
5
Faculty of Sciences, Technology and Communication, University of Luxembourg, L-4364 Esch-sur-Alzette, Luxembourg
*
Authors to whom correspondence should be addressed.
Minerals 2018, 8(6), 233; https://doi.org/10.3390/min8060233
Submission received: 2 May 2018 / Revised: 22 May 2018 / Accepted: 25 May 2018 / Published: 29 May 2018
(This article belongs to the Special Issue Mining and Mineral Exploration Geophysics)

Abstract

:
The drillhole information from the Lontzen–Poppelsberg site has demonstrated three orebodies and has allowed the estimation of the extension of the lodes, their dip, and the location at the ground surface. The localisation of the lodes makes them excellent targets for further exploration with geophysics. This deposit is classified as a Mississippi Valley Type (MVT) deposit. It consists mainly of Pb–Zn–Fe sulphides that display contrasting values in resistivity, chargeability, density, and magnetic susceptibility, with regards to the sedimentary host rocks. The dipole–dipole direct current (DC) resistivity and induce polarization (IP) profiles have been collected and inverted to successfully delineate the Pb–Zn mineralization and the geological structures. Short-spacing EM34 electromagnetic conductivity data were collected mainly on the top of Poppelsberg East lode and have revealed a conductive body matching with the geologically modelled mineralization. Gravity profiles have been carried out perpendicularly to the lode orientation; they show a strong structural anomaly. High resolution ground magnetic data were collected over the study area, but they showed no anomaly over the ore deposits. The geophysical inversion results are complementary to the model based on drill information, and allow us to refine the delineation of the mineralization. The identification of the geophysical signatures of this deposit permits targeting new possible mineralization in the area.

1. Introduction

Mississippi Valley Type ore deposits (MVT) are epigenetic ore deposits that are precipitated from dense brines at temperature between 75 and 200 °C. MVT deposits are typically located in platform carbonate sequences, commonly in foreland thrust belt, and they lack genetic affinities to igneous activity [1]. They can be found on the five continents, but the largest and most widely studied deposits occur in North America [2]. MVT deposits represent 24% of the global resources for Pb and Zn and 38% of the global tonnage for sedimentary-hosted deposits (MVT and sedimentary exhalative sandstone Pb) [2]. The Zn mining production was estimated at 11.9 Mt in 2016 and the world reserves have been estimated to be 220 Mt [3]. The global production of Zn decreased last year because of the closure of major mines, such as Lisheen (Ireland), Brunswick 12 (Canada), Skorpion mine (Canada), and Century (Australia). These closures reduced the production by 700,000 t of Zn per year, which was around 15% to 20% of the world production [3,4]. Major companies have not invested in zinc ore deposit exploration and no world class deposits have been found since 1990, excluding the discoveries in geopolitically risky areas, such as South Africa and Iran [4]. In parallel, the world consumption of zinc will increase from 3% to 5% per year until 2025, because of the demand from the BRIC (Brazil, Russia, India, and China) countries. An increasing production of 3–3.5 Mt of zinc metal is expected within the next five years [3,4].
The member countries of the European Union are increasingly dependent on metal imports, which has led to a list of critical elements being established [5]. Among this list of 41 mineral/elements are Indium, Gallium, and Germanium, which are typical by-products of Pb–Zn deposits. Many raw material projects have been launched by the European Commission, for example, “ExplOre” [6], “Mineral4EU” [7], “Promine” [8], and “Blue mining” [9].
In the context of the security of metal supply within the European Union, the identification of new deposits and the characterization of abandoned old deposits is crucial. It is in this context that the present study was conceived. The paper addresses the prospecting of Pb–Zn deposits in a favourable mining region of Eastern Belgium, using geophysical techniques.
In general, four ground-based geophysical methods are used to detect and characterize the MVT deposits, namely: geoelectrical (DC resistivity and IP), gravimetric, electromagnetic, and magnetic methods [10].
Despite decades of studies, (e.g., [11,12,13,14,15]), Pb–Zn ore deposits remain amongst the most difficult to map using geophysical exploratory methods. The mineralogy, texture, and shape of the ore is highly variable from place to place, even within a mining district [1,16]. This variability results from the wide diversity of geological environments in which Pb–Zn sulphides can precipitate, namely: the filling of faults; filling of karstic pockets/networks, at the stratigraphic contact, in porous limestone/dolostone; or filling of breccias [2,16]. Those setups are all hosts in which the MVT deposits occur through brine movements within the various zones of preferential flow paths.
For example, in the Pine Point District (Northwest Territories, Canada), the ore deposits can be found as tabular or prismatic in interconnected paleokarst networks [2], whereas in Robb Lake (British Columbia, Canada), the mineralization is tabular and massive sphalerite-rich at the depth and galena-rich in stockwork texture at the surface [16]. The mineralogy of the Pb–Zn deposit may be very variable with the presence of Pb–Zn sulphides and/or oxides and iron bearing sulphides.
In the Verviers Synclinorium District (Belgium), the deposit of La Calamine was exclusively composed of massive Zn oxides, while the deposit of Plombières located 3 km to the north consists of sphalerite and galena lodes in equal proportions [17]. The variability in ore deposits yields a similar variability in geophysical signature, using ground based geophysical techniques (Figure 1). Iron sulphides are good conductors and can help to detect the associated Pb–Zn deposits. They can be abundant in some districts (Nanisivik deposit, Nunavut, and Canada) or they can be inexistent (Daniel’s harbour deposit, USA) [16].
In the Lennard Shelf ore deposit (Western Australia, Australia), the Pb–Zn mineralization is associated with abundant marcasite haloes generating induced polarization anomalies [19]. For example, the IP survey gives the best results on the Blendevale ore deposit (the biggest deposit of the district) as a result of the large amount of pyrite that is strongly associated with the Pb–Zn sulphides; even if the strongest IP signal does not always correspond to the highest Pb–Zn content [20]. Dissociated iron sulphides from the Pb–Zn sulphides can help to indirectly target a deposit [13]. Gravity was an efficient method to target this deposit, thanks to the strong density contrast between the limestones and the sulphides ore [20]. Geophysics was not used to discover the deposit, but rather to target other deposits in the area [20].
The Wagon Pass deposit in the Lennard Shelf District is conductive and chargeable because of to the presence of pyrite and marcasite with the sphalerite and galena [21]. In the Pine Point District, the largest majority of the Pb–Zn ore is not a conductive marker because of the poor electrical connectivity of the disseminated sulphides (EM survey unsuccessful), while the IP survey gives the best results, helping to discover numerous new orebodies in the district [13]. Nevertheless, within this district, the Pyramid ore bodies are chargeable and conductive. This can be explained by the high amount of massive marcasite in association with galena and sphalerite that are present in the ore [12].
The Zn-oxides ore deposit of Beltana (South Australia) is very resistive, chargeable, and easily detectable by gravity survey [22] because of the strong density contrast between the massive ore and the dolostones. In contrast, the Zn deposits may be weakly chargeable, non-conductive, nonmagnetic, and display no significant gravity anomaly because of the low contrast of density, such as in the Century Deposit (Sediment-Hosted type) in Queensland, Australia (Figure 1) [18]. In some cases, the gravity survey is unsuccessful because the signal is lost in a complex fractured background as a result of the small size of the deposit [18] or in the presence of sinkholes [13,18].
The Pb–Zn deposit of Lontzen is located in the structural entity known as the Verviers Synclinorium in Eastern Belgium (Figure 2). This former mining district was the most prolific in Belgium and, until the beginning of the 20th century, it produced the overwhelming majority of the Belgian Pb–Zn concentrates (more than 3.2 Mt) [17,23].
The mine ceased its activities in 1934, but some unexploited ore is still present. The mining of the deposit started in 1852, after the discovery of iron gossans at the ground surface and it was closed in 1934 because of the dewatering issue of the galleries, after reaching the depth of −112 m below the surface. Rich Pb–Zn mineralization is still present in the basement [17]. During the 1980s, a drilling campaign was led by the “Syndicat de Moresnet” (S.M.O.R) in order to re-evaluate the mining potential of the area. Several dozen boreholes were drilled in the area of Lontzen–Poppelsberg. We have access to the borehole logs for 62 of them.
In this paper, we analyze the geophysical signature of the Lontzen–Poppelsberg ore deposit using electrical (DC resistivity and time-domain IP), gravity, magnetic, and electromagnetic techniques. Nevertheless, only the Pb–Zn lodes of Poppelsberg East and West are targeted using geophysics, because the deposit of Lontzen is located under the homonym village. Geophysical surveys allowed us to complement the drilling information and to improve the delineation and evaluation of the Pb–Zn deposit. Based on our observations, we propose a 3D model of the mineralized lodes.
The paper is organized as follows: Firstly, we describe the geological context of the area of Lontzen. Then, we give a brief overview of the geophysical techniques that are used to target the deposit, before analyzing the processed results. From these results, we discuss an improved conceptual model. Finally, some conclusions and new perspectives are drawn.

2. Geological Context

The Verviers synclinorium consists of a sedimentary bedrock, that aged from between early Devonian to early Carboniferous period, as follows: Famennian shales/sandstones, Tournaisian dolostones, Visean limestones, and Namurian shales. These rocks folded during the Hercynian orogeny, creating NW–SE thrust faults. They were then covered with Cretaceous sediments. The extension of the Rhine graben, from Permian until today, has generated normal faults.
The mineralizing process is similar for all of the MVT deposits of the district of the Verviers synclinorium. The mineralizing fluids, originating from seawater evaporation during the Givetian to the Carboniferous period, percolated down to the Cambro-Silurian basement, causing a dolomitization of the limestones [26]. The mineralized dense brines were then expulsed during the Jurassic period [24,27,28], through normal faults that were generated by the Rhine graben extension [26,29]. The fluids then precipitated in Pb–Zn sulphides, mainly within the carbonated formations (Figure 3) as a result of a pump suction mechanism [24]. The Pb–Zn mineralization is mainly composed of sphalerite and galena. Furthermore, calcite, pyrite, marcasite, chalcopyrite, and Zn and Pb oxides are also present [17]. As with many of Belgian MVT ore deposits, the studied deposit is structurally controlled by extensional faults and it is lithologically controlled by the permeability contrast between the shales/sandstones and dolostones/limestones [17,28].
The only information we have about the mineralogy of the Pb–Zn lode of Poppelsberg is the Zn, Pb, and silver weight content from the core samples analyses and some detailed drilling information regarding the mineralogy of the gangue (calcite, pyrite, and marcasite content). Galena, pyrite, and marcasite are excellent conductive minerals that may help to detect the Zn-bearing minerals [18], even sometimes indirectly [13].
From a structural point of view, the study area of Lontzen–Poppelsberg is located at the Northern flank of a syncline, with a Namurian core (Figure 3). The study area is crossed by two thrust faults with an orientation of SW–NE, as follows: one in the Northern part that links the Namurian shales anticline to the Visean limestone, and the other in the Southern part that links the Visean limestone to the Famennian sandstones, “skipping” the Tournaisian dolostones.
Four main NNW–SSE normal faults, which are generated by the extension of the Rhine graben, cross the area. The mineralizing fluids come from the basement of the sedimentary basin and migrate via these normal faults, to the surface. Locally, the fluids also migrated to the thrust fault because of a specific reopening. The E–W extensional movement generated local voids where the extensional fault crosses the “old” thrust faults.

3. Methods

Geophysical Surveys

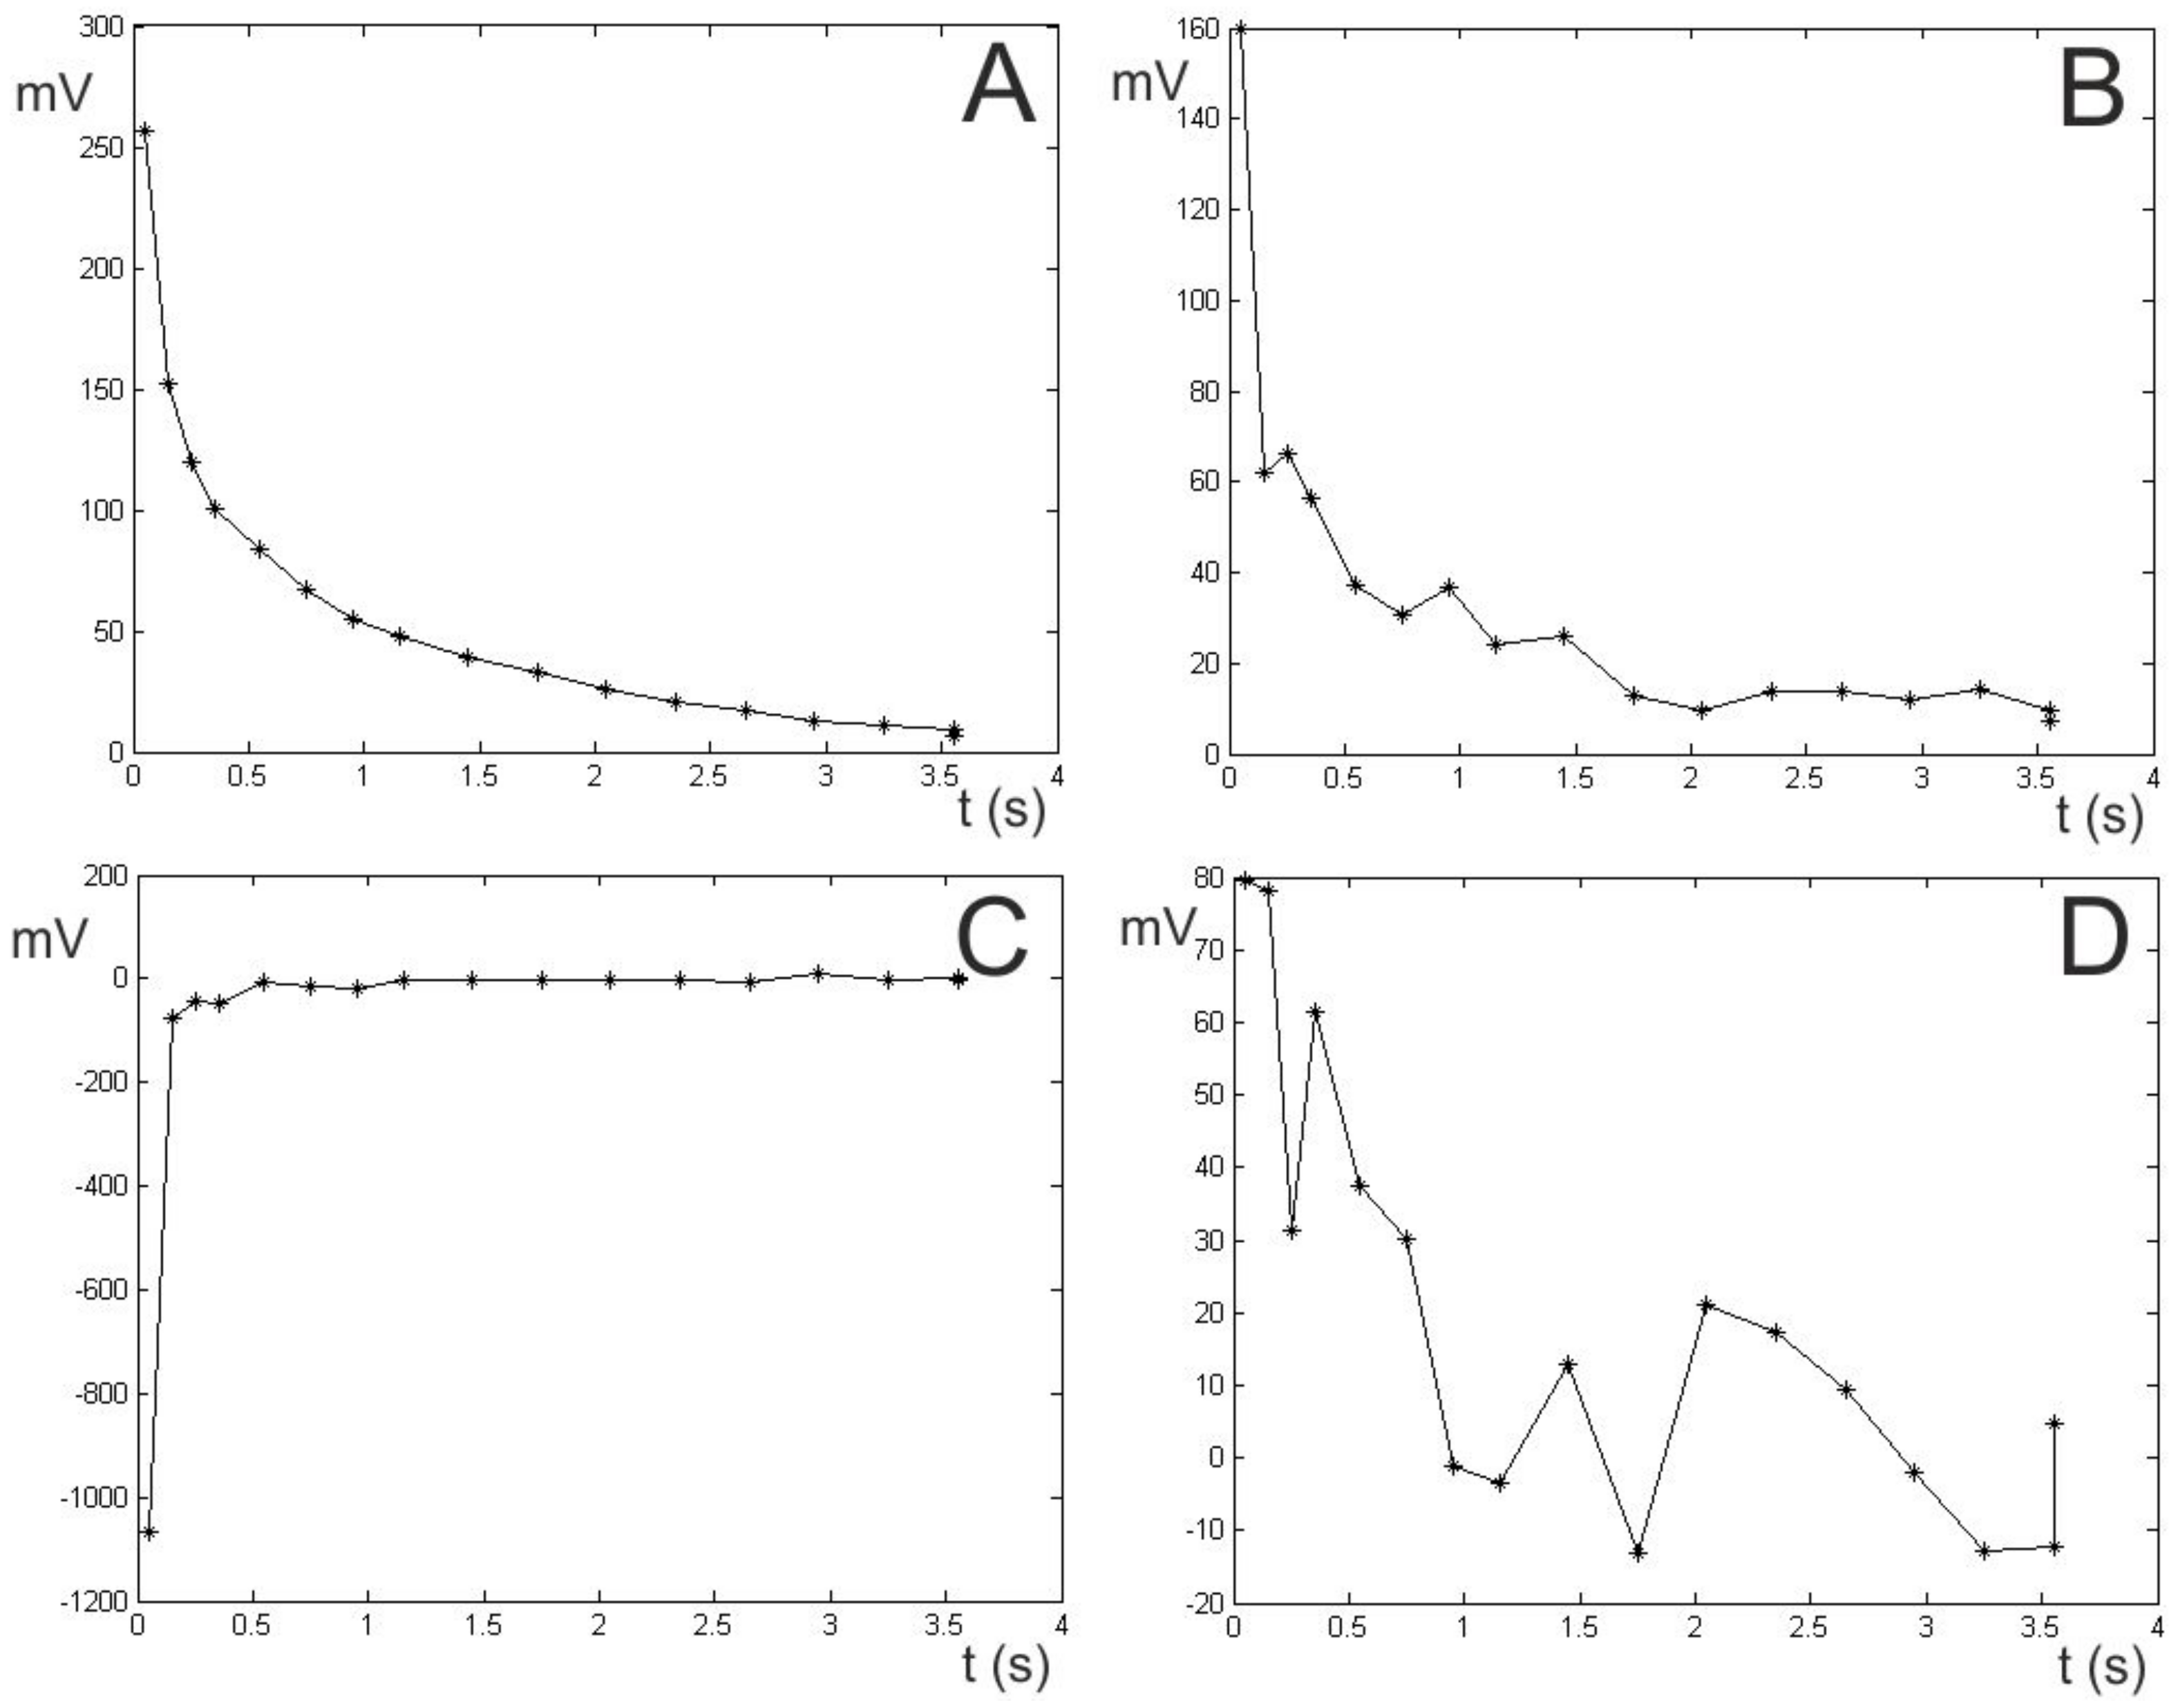
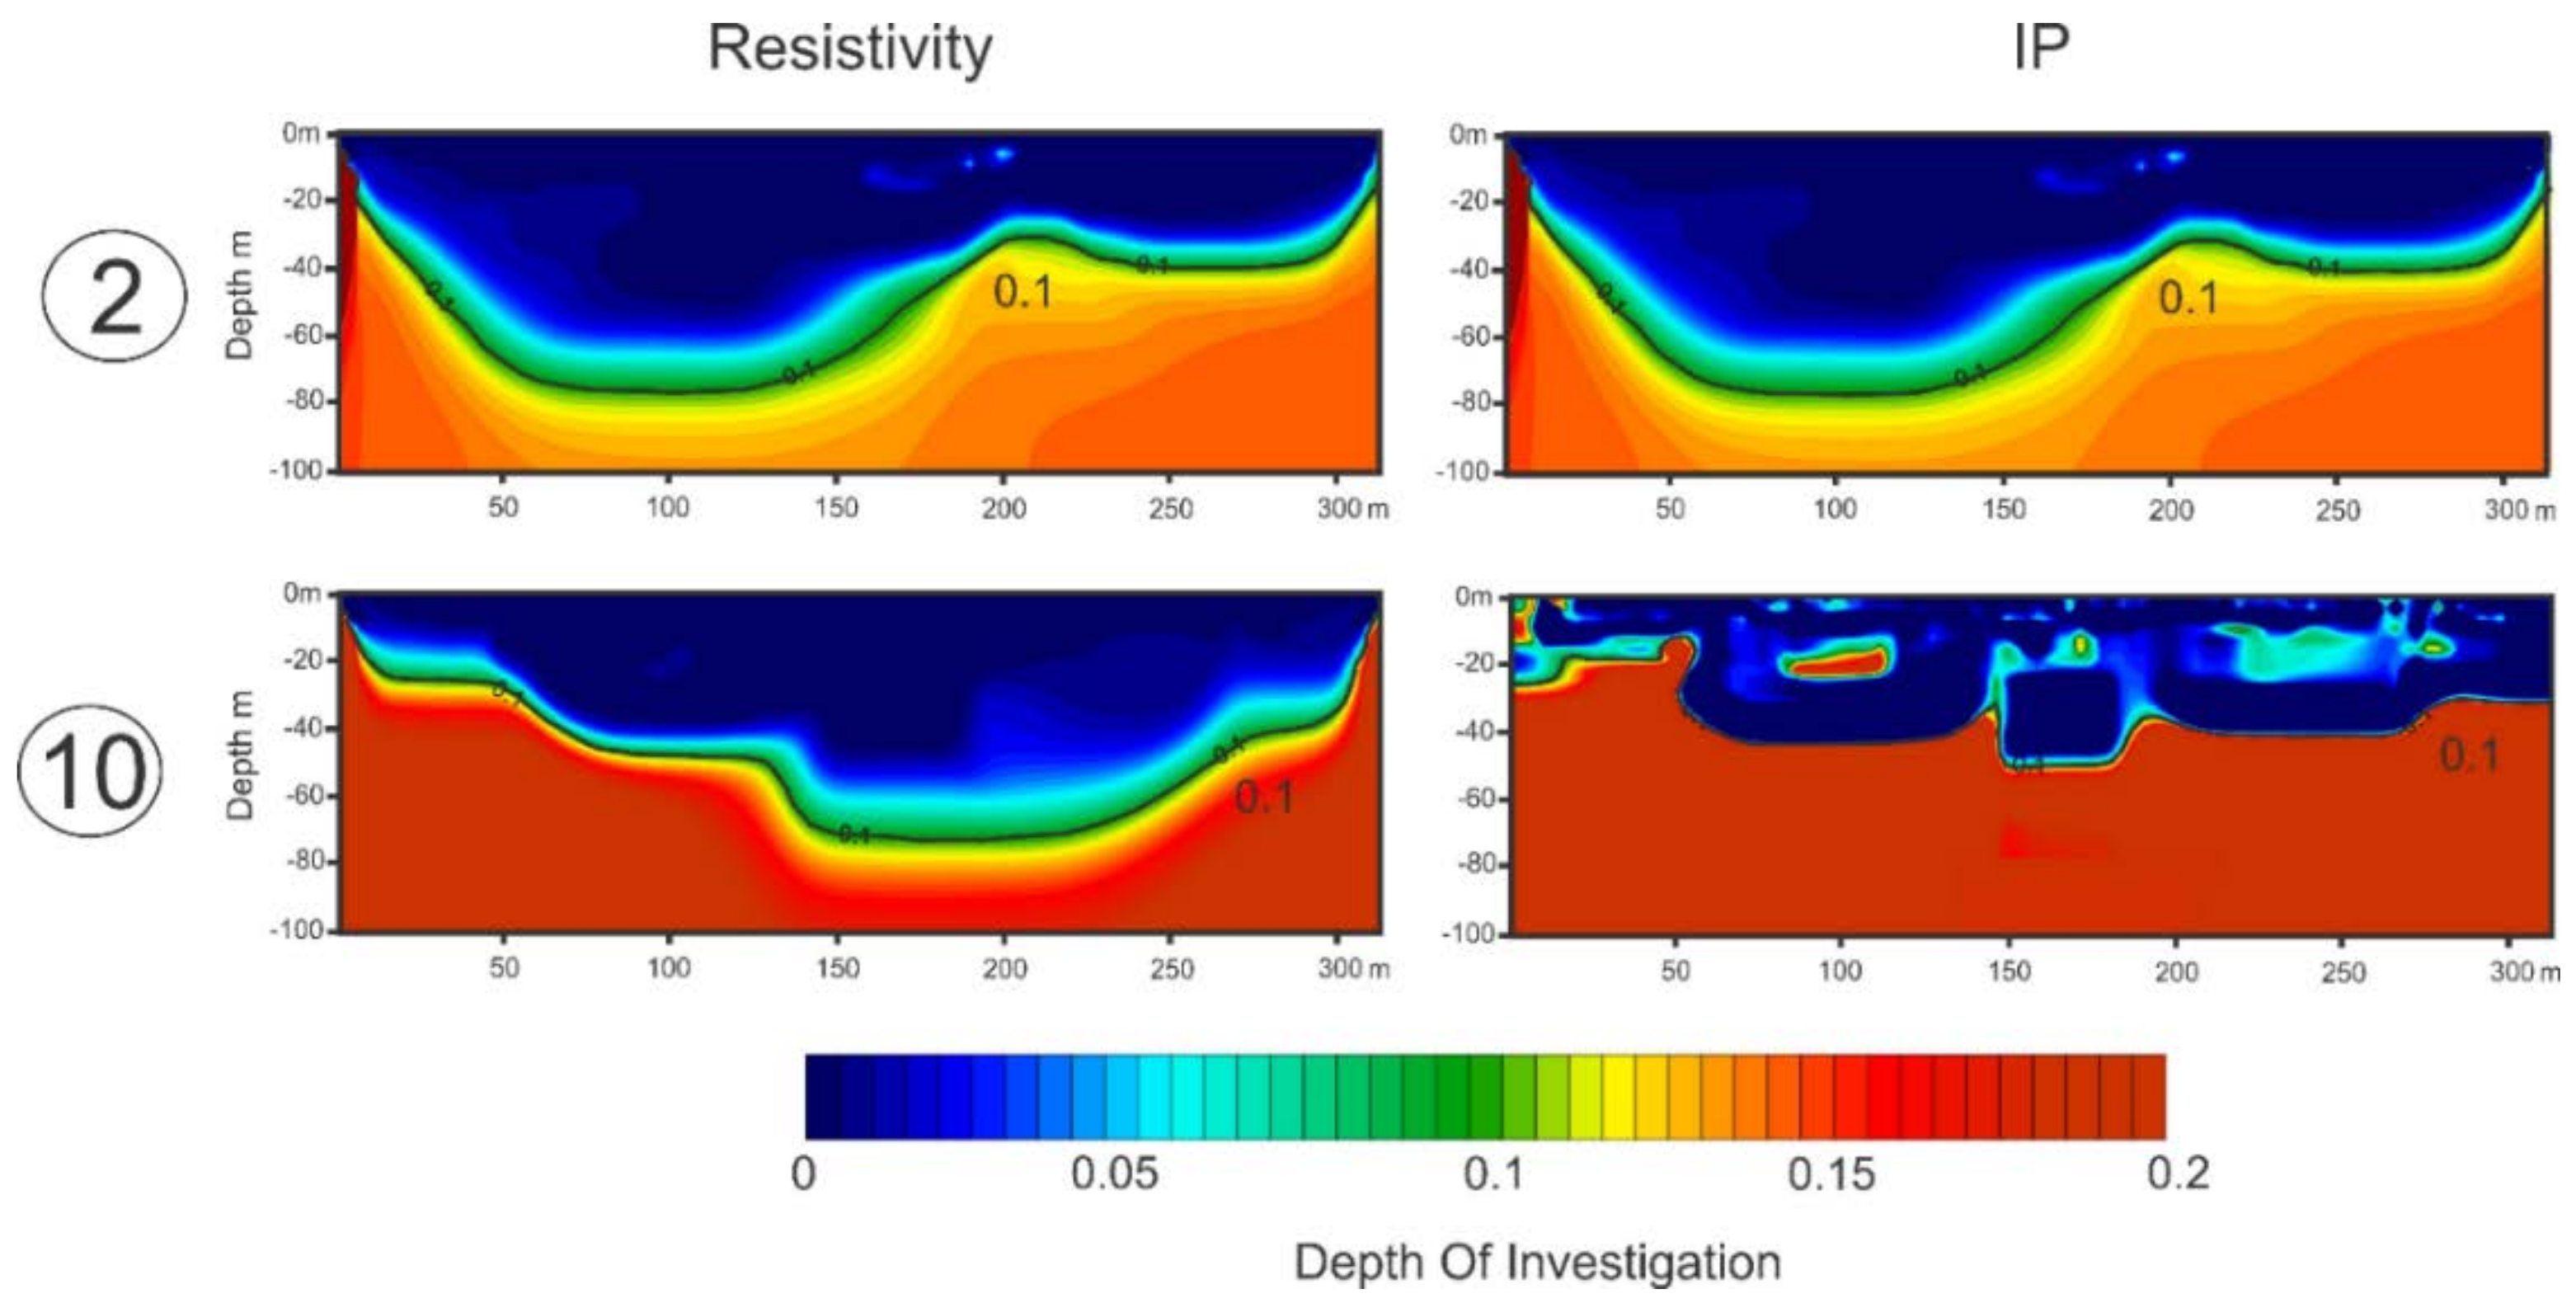
3.1.1. Electrical Resistivity/Induced Potential

The electrical resistivity tomography (ERT) allowed for the mapping of the distribution of bulk electrical resistivity in the subsurface. The method was based on the measurement of the electric potential distribution (ΔV), which resulted from the injection of an electric current (I) in the soil [31,32]. The measurements were typically carried out with quadrupoles (although other configurations were possible), which consisted of two current electrodes and two potential electrodes. The choice of the geometry of the quadrupole influenced the measures in terms of spatial resolution, depth of investigation, and robustness to the electrical noise, which made the design phase particularly important. Nowadays, hundreds or thousands of data have been acquired and interpreted to build a 2D/3D model of the electrical resistivity distribution of the subsurface [33,34]. These physical parameters were mainly influenced by the solid matrix features (type, porosity, and texture) and the pore fluids features (water content and salinity).
The method of induced potential (IP)—also called induced polarization—measured the storage of the electrical charges in the ground. It could be acquired during an electrical resistivity tomography (ERT) survey for a limited additional cost. To assess the IP in the time domain, the decrease in potential difference between two electrodes was measured after the injection of the electric current was stopped. The IP acquisition was always combined with resistivity measurements. The measured physical parameter was called chargeability (mV/V) (which could be seen as an electrical capacitance) [35]. Unlike the electrical resistivity signature, very few materials produced a strong IP response. For natural soils, clay (membrane potential) and mineralized rocks (electrode potential) were characterized by a high chargeability. However, limestones and sandstones were characterized by a low chargeability.
For the present survey, we used both the dipole–dipole and the multi-gradient protocols inorder to take advantage of the multi-channel ability of the ABEM® Terrameter LS. A total of 17 electrical profiles (ERT/IP) were acquired at 45 depth levels, with various configuration (protocol, electrode number and electrode spacing, injection, and measurement time), as follows:
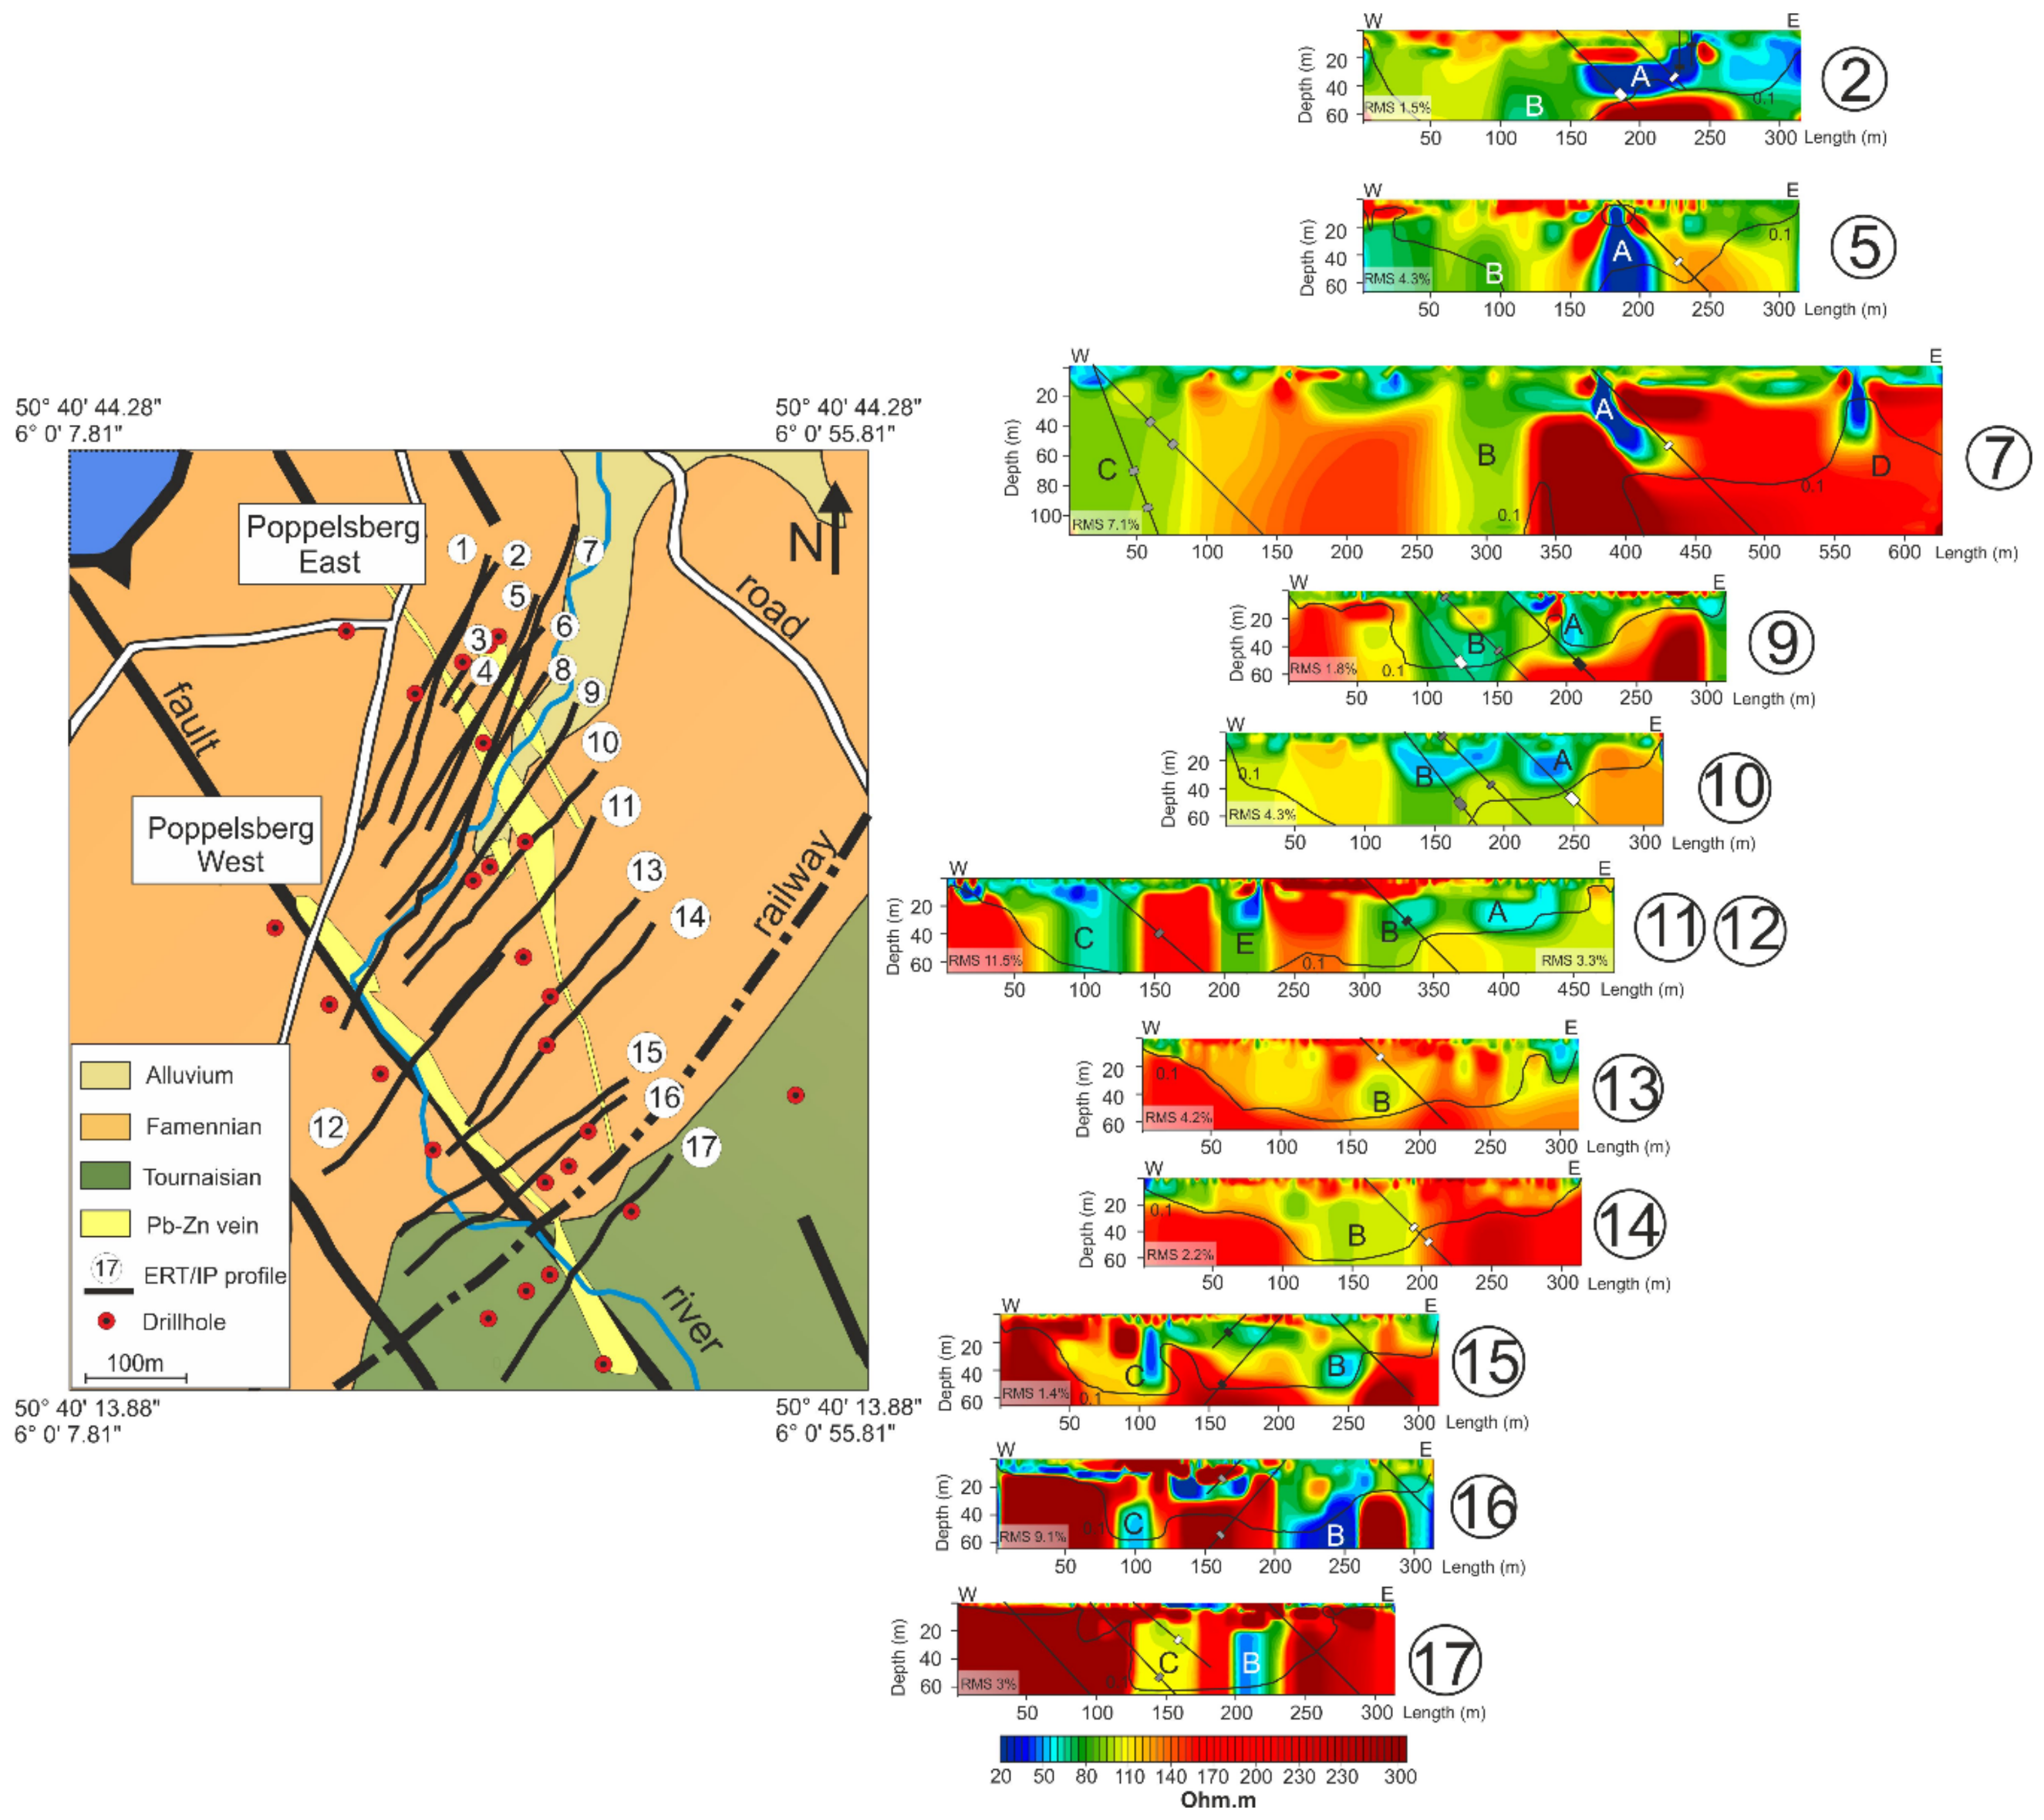
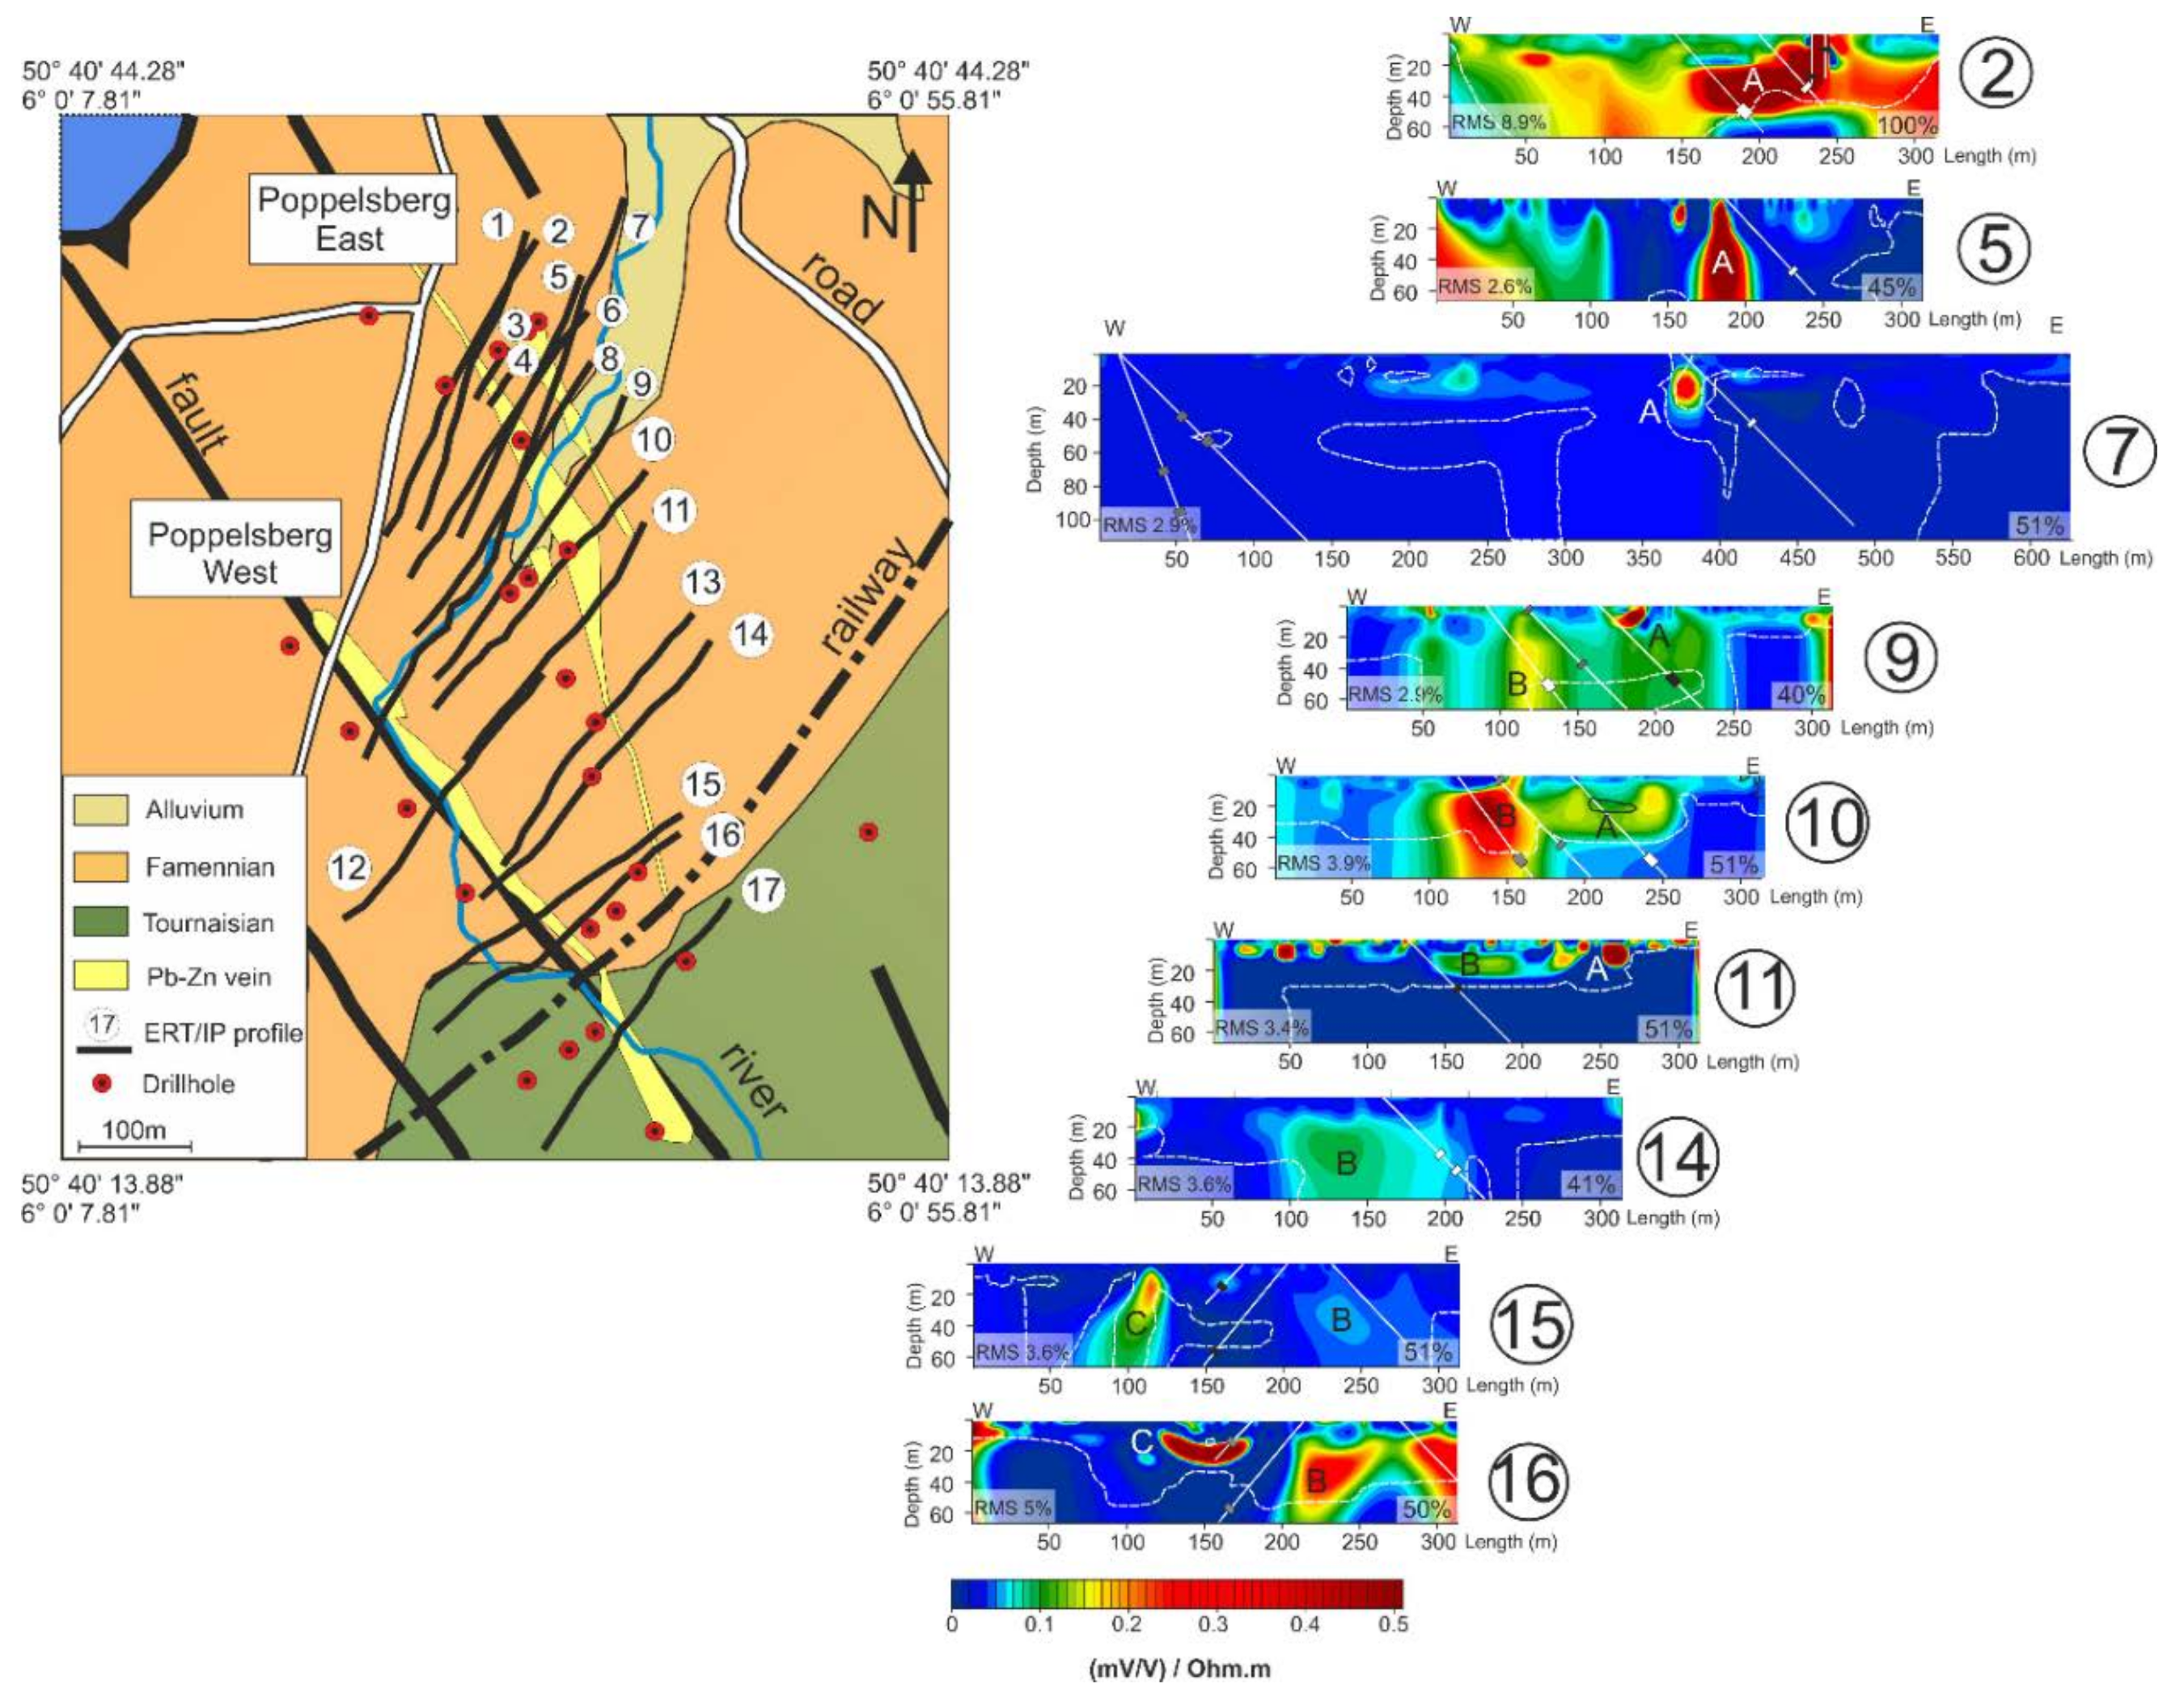
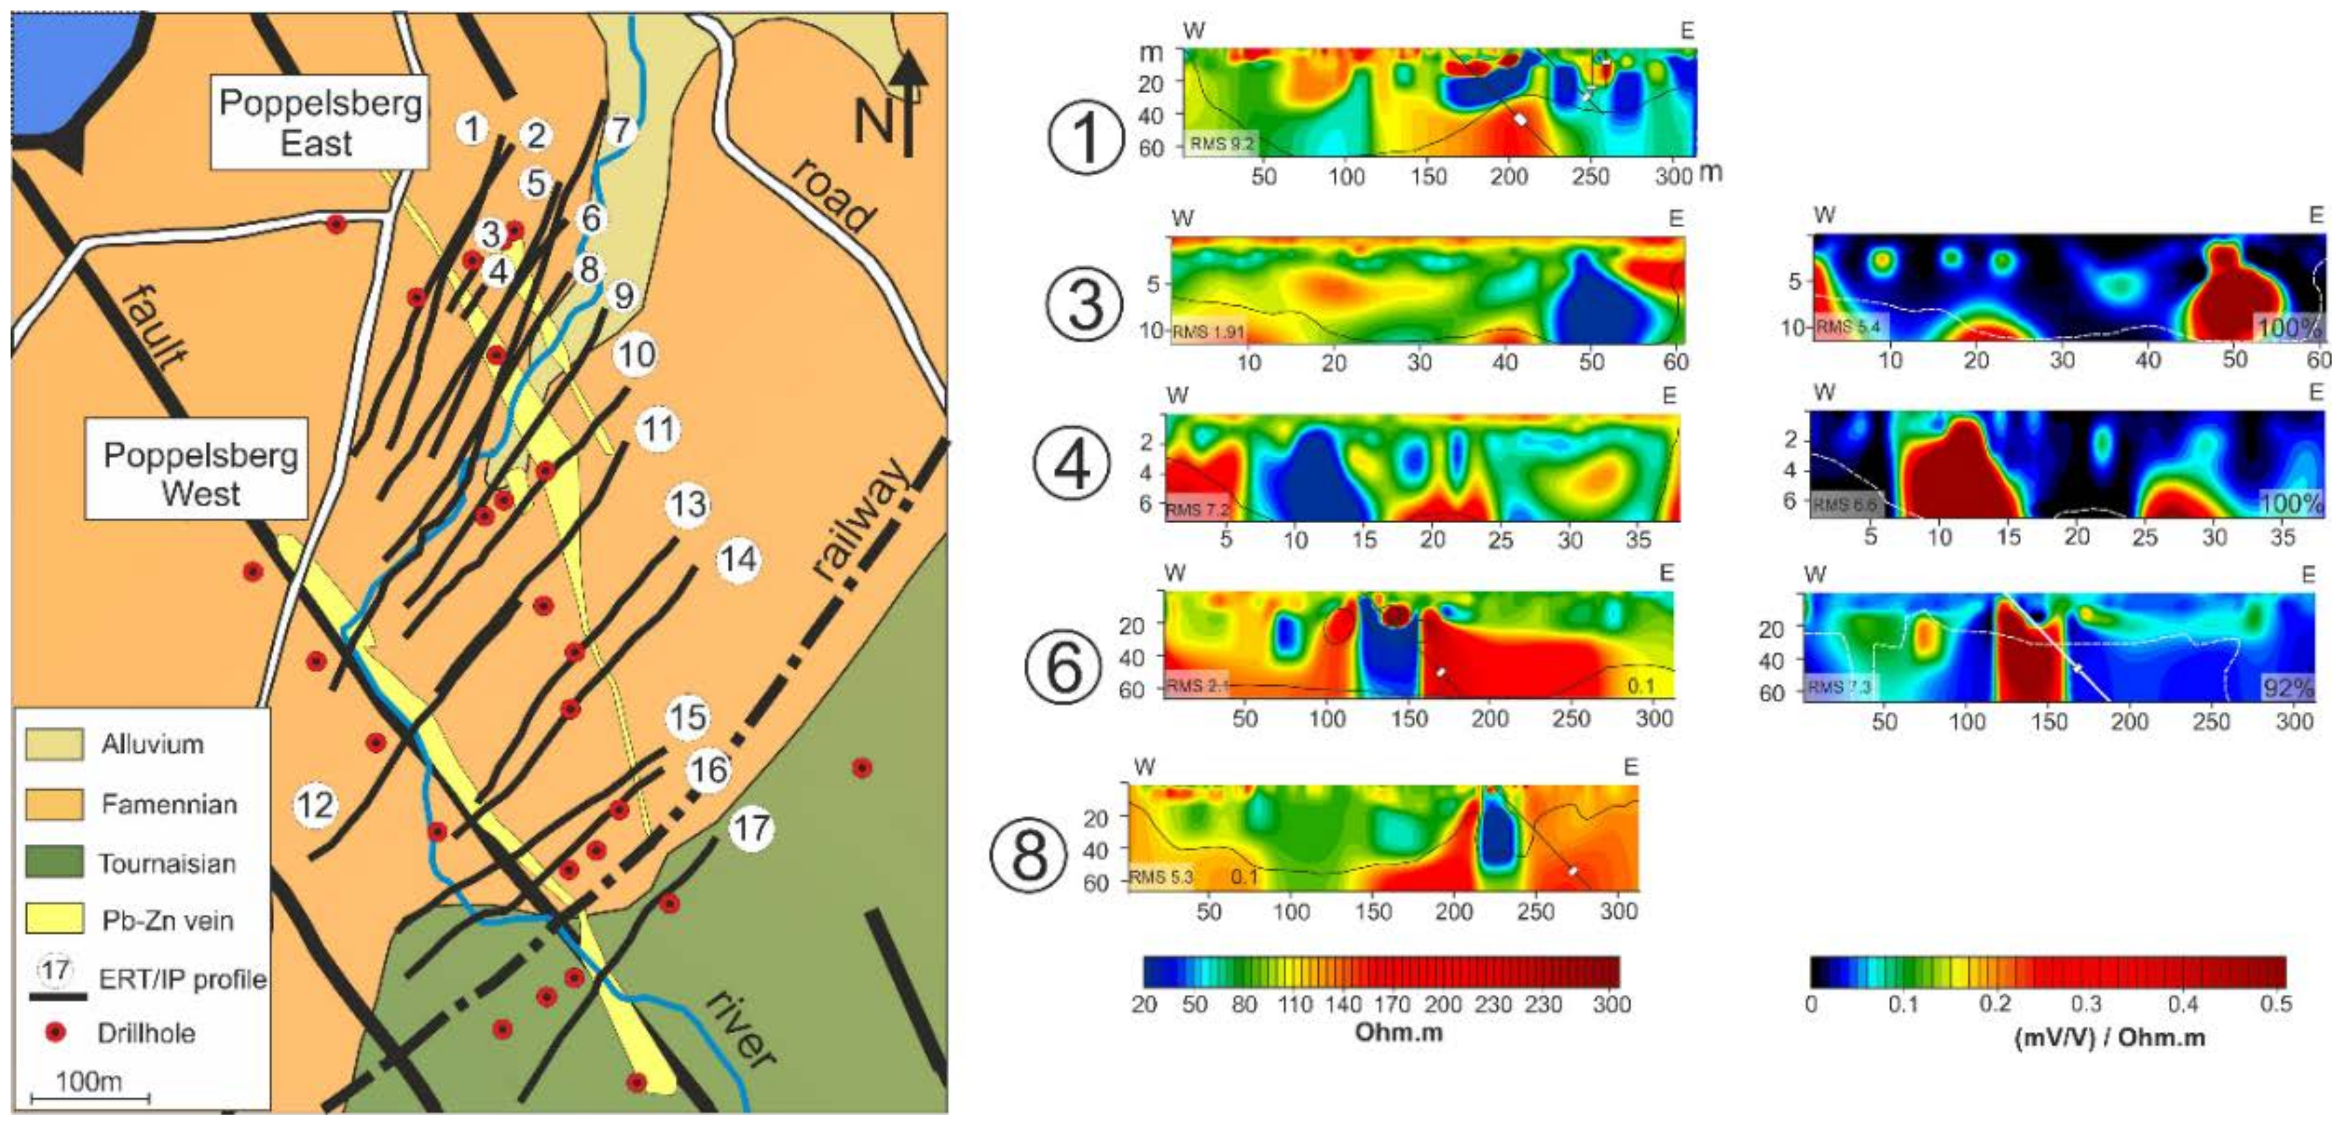
  • Twelve 320 m long profiles in a dipole–dipole array, with 5 m spacing (64 electrodes) (Profiles 1, 5, 8, 9, 10, 11, 12, 13, 14, 15, 16, and 17).
  • Two 320 m long profiles in a gradient array, with 5 m spacing (64 electrodes) (Profiles 2 and 6).
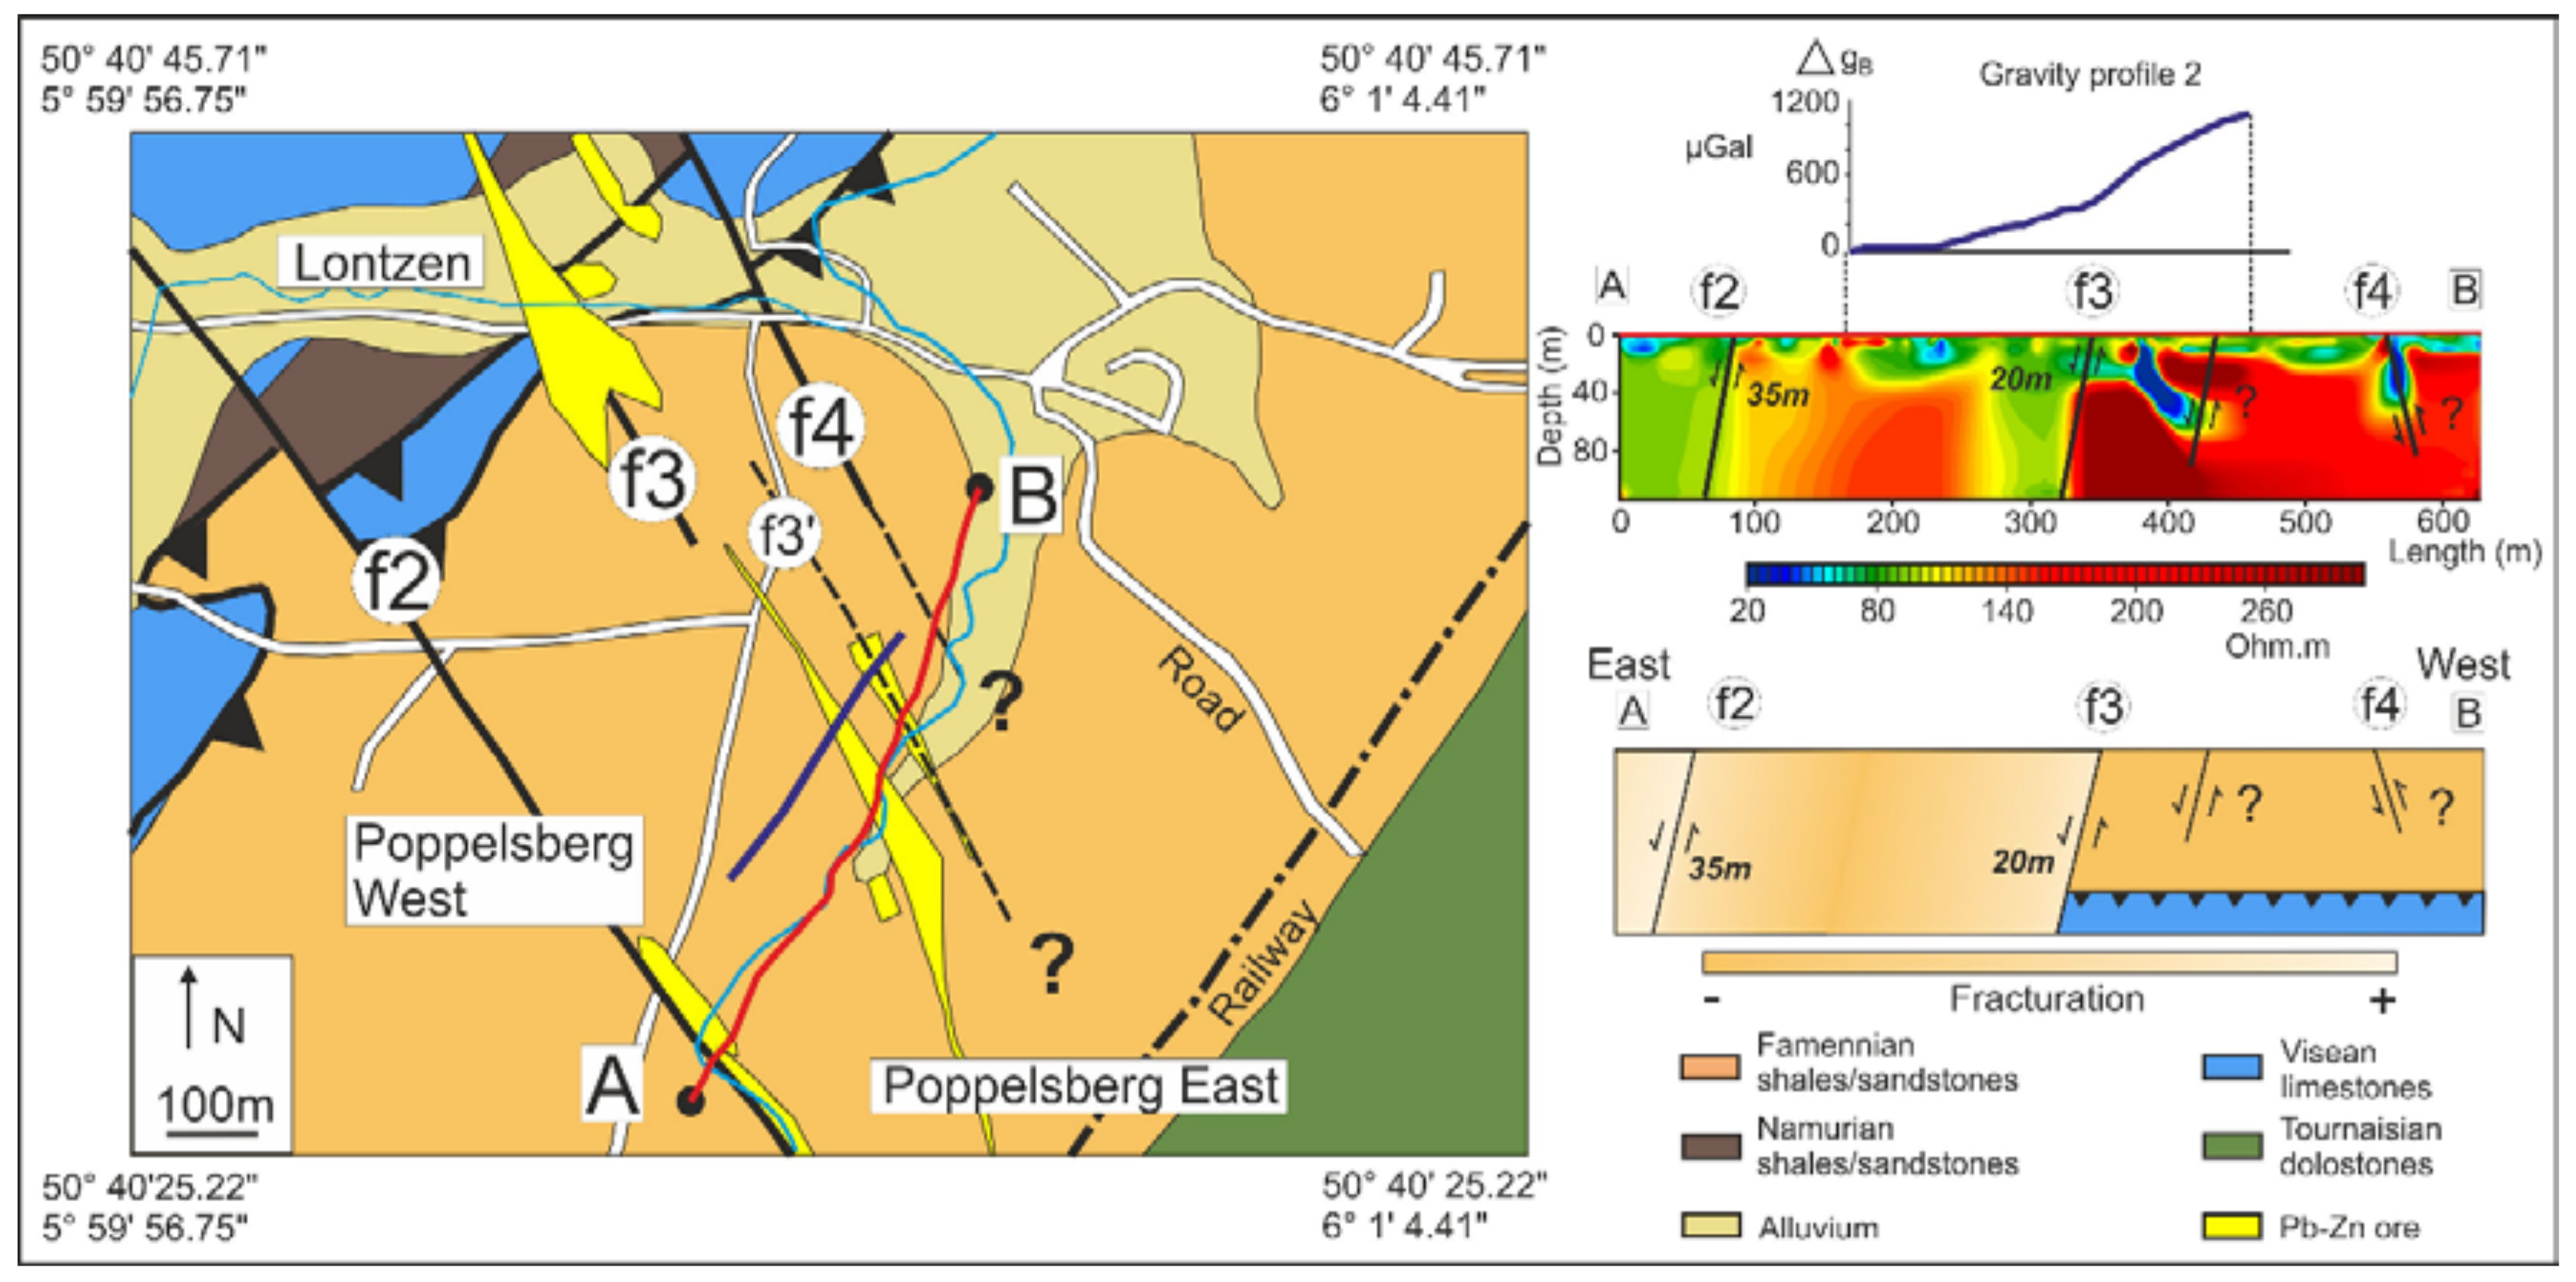
  • A 640 m long profile (ERT/IP), with 5 m spacing (128 electrodes) in a dipole–dipole array (Profile 7).
  • A 40 m-long profile with 32 electrodes and 1.25 m spacing in dipole-dipole array (Profile 3)
  • A 64 m-long profile with 32 electrodes and 2 m spacing in a dipole-dipole configuration (Profile 4).
For the time-domain IP, an injection time of 1.3 s and an acquisition time of 3.95 s were used for all of the profiles, except for Profiles 3 and 4, where the acquisition and injection times were set to 4 s each. The length variability of the electrical profiles chosen to collect the data at different resolutions.
The ERT data with negative apparent resistivity values or with a coefficient of variation greater than 0.2% were discarded. This figure was the normalized standard deviation of the stacked data, but we only had two stacks by profile for our case study, which is why it was more appropriate to discuss a coefficient of variation. These rejected data represented less than 1% of the total dataset. The IP data were selected individually by evaluating their decay curves, as shown in Figure 4. Only the data points with decreasing exponential decay curves were kept. The rejected data represents between 10% and 70% of the global IP dataset, depending on the profiles. For this reason, the IP profiles with more than 70% of the deleted data (1, 8, 12, 13, and 17) were not presented because of a lack of data to invert.
When the ERT and IP data were acquired from the surface, the sensitivity to electrical resistivity changed in the underground, as it decreased with depth. The depth of investigation (DOI) index [36] estimated the depth below, for which the obtained model was influenced by a reference model rather than the collected data, by inverting the same dataset twice with different reference models (m1r and m2r) (typically 0.1 and 10 times the average soil resistivity). At a shallow depth, the inversion converged at the same resistivity values (m1 and m2), whatever the reference model that was used, and the DOI was almost 0. At a great depth, the inversion results were identical to the reference models, and the DOI equaled 1 [36].
D O I ( x , z ) =   m 1 ( x , z ) m 2 ( x , z ) m 1 r m 2 r
High reliability was accorded to the areas where the DOI was closed to 0, and a low reliability for the areas where the DOI approached 1 [36]. The DOI was evaluated for each profile, for both ERT and IP, using the approach of Oldenburg and Li [36], with a threshold of 0.1, to define the depth of the investigation [37,38]. The depth of investigation was much smaller for the IP dataset than for resistivity, only because of the limited number of available data (Figure 5).
The filtered ERT (98–100% of the initial dataset) and IP (45% to 100% on the initial dataset) data were separately inverted, using the commercial software Res2DInv [39]. The inversion process was based on the minimization of an objective function [40], using the least-square inversion parameters (L1 norm) [41]. The number of iterations varied from 5 to 8, depending on the profiles, with the root mean square (RMS) reaching 1.5% to 11% (Figure 6 and Figure A1). The RMS was a measure of the variation between the calculated and the measured apparent resistivity value, by adjusting the resistivity of the model blocks [37]. We chose to stop the iterations for the inversion of resistivity and IP when the RMS error value did not change significantly (<0.5%). The IP models were converted into normalized chargeability (chargeability/resistivity). It allowed for better targeting of the sulphides, as reported by [42]. Based on a DOI threshold equal to 0.1, the inverted resistivity models were constrained by the datasets, up to a depth limit of 50 to 100 m (depending on the profiles) [36,37] (Figure 6 and Figure 7).
Except for Profiles 15, 16, and 17, which were partly located in the Tournaisian dolostones, all of the profiles were located in the Famennian sandstones perpendicularly to the modelled Pb–Zn lodes.

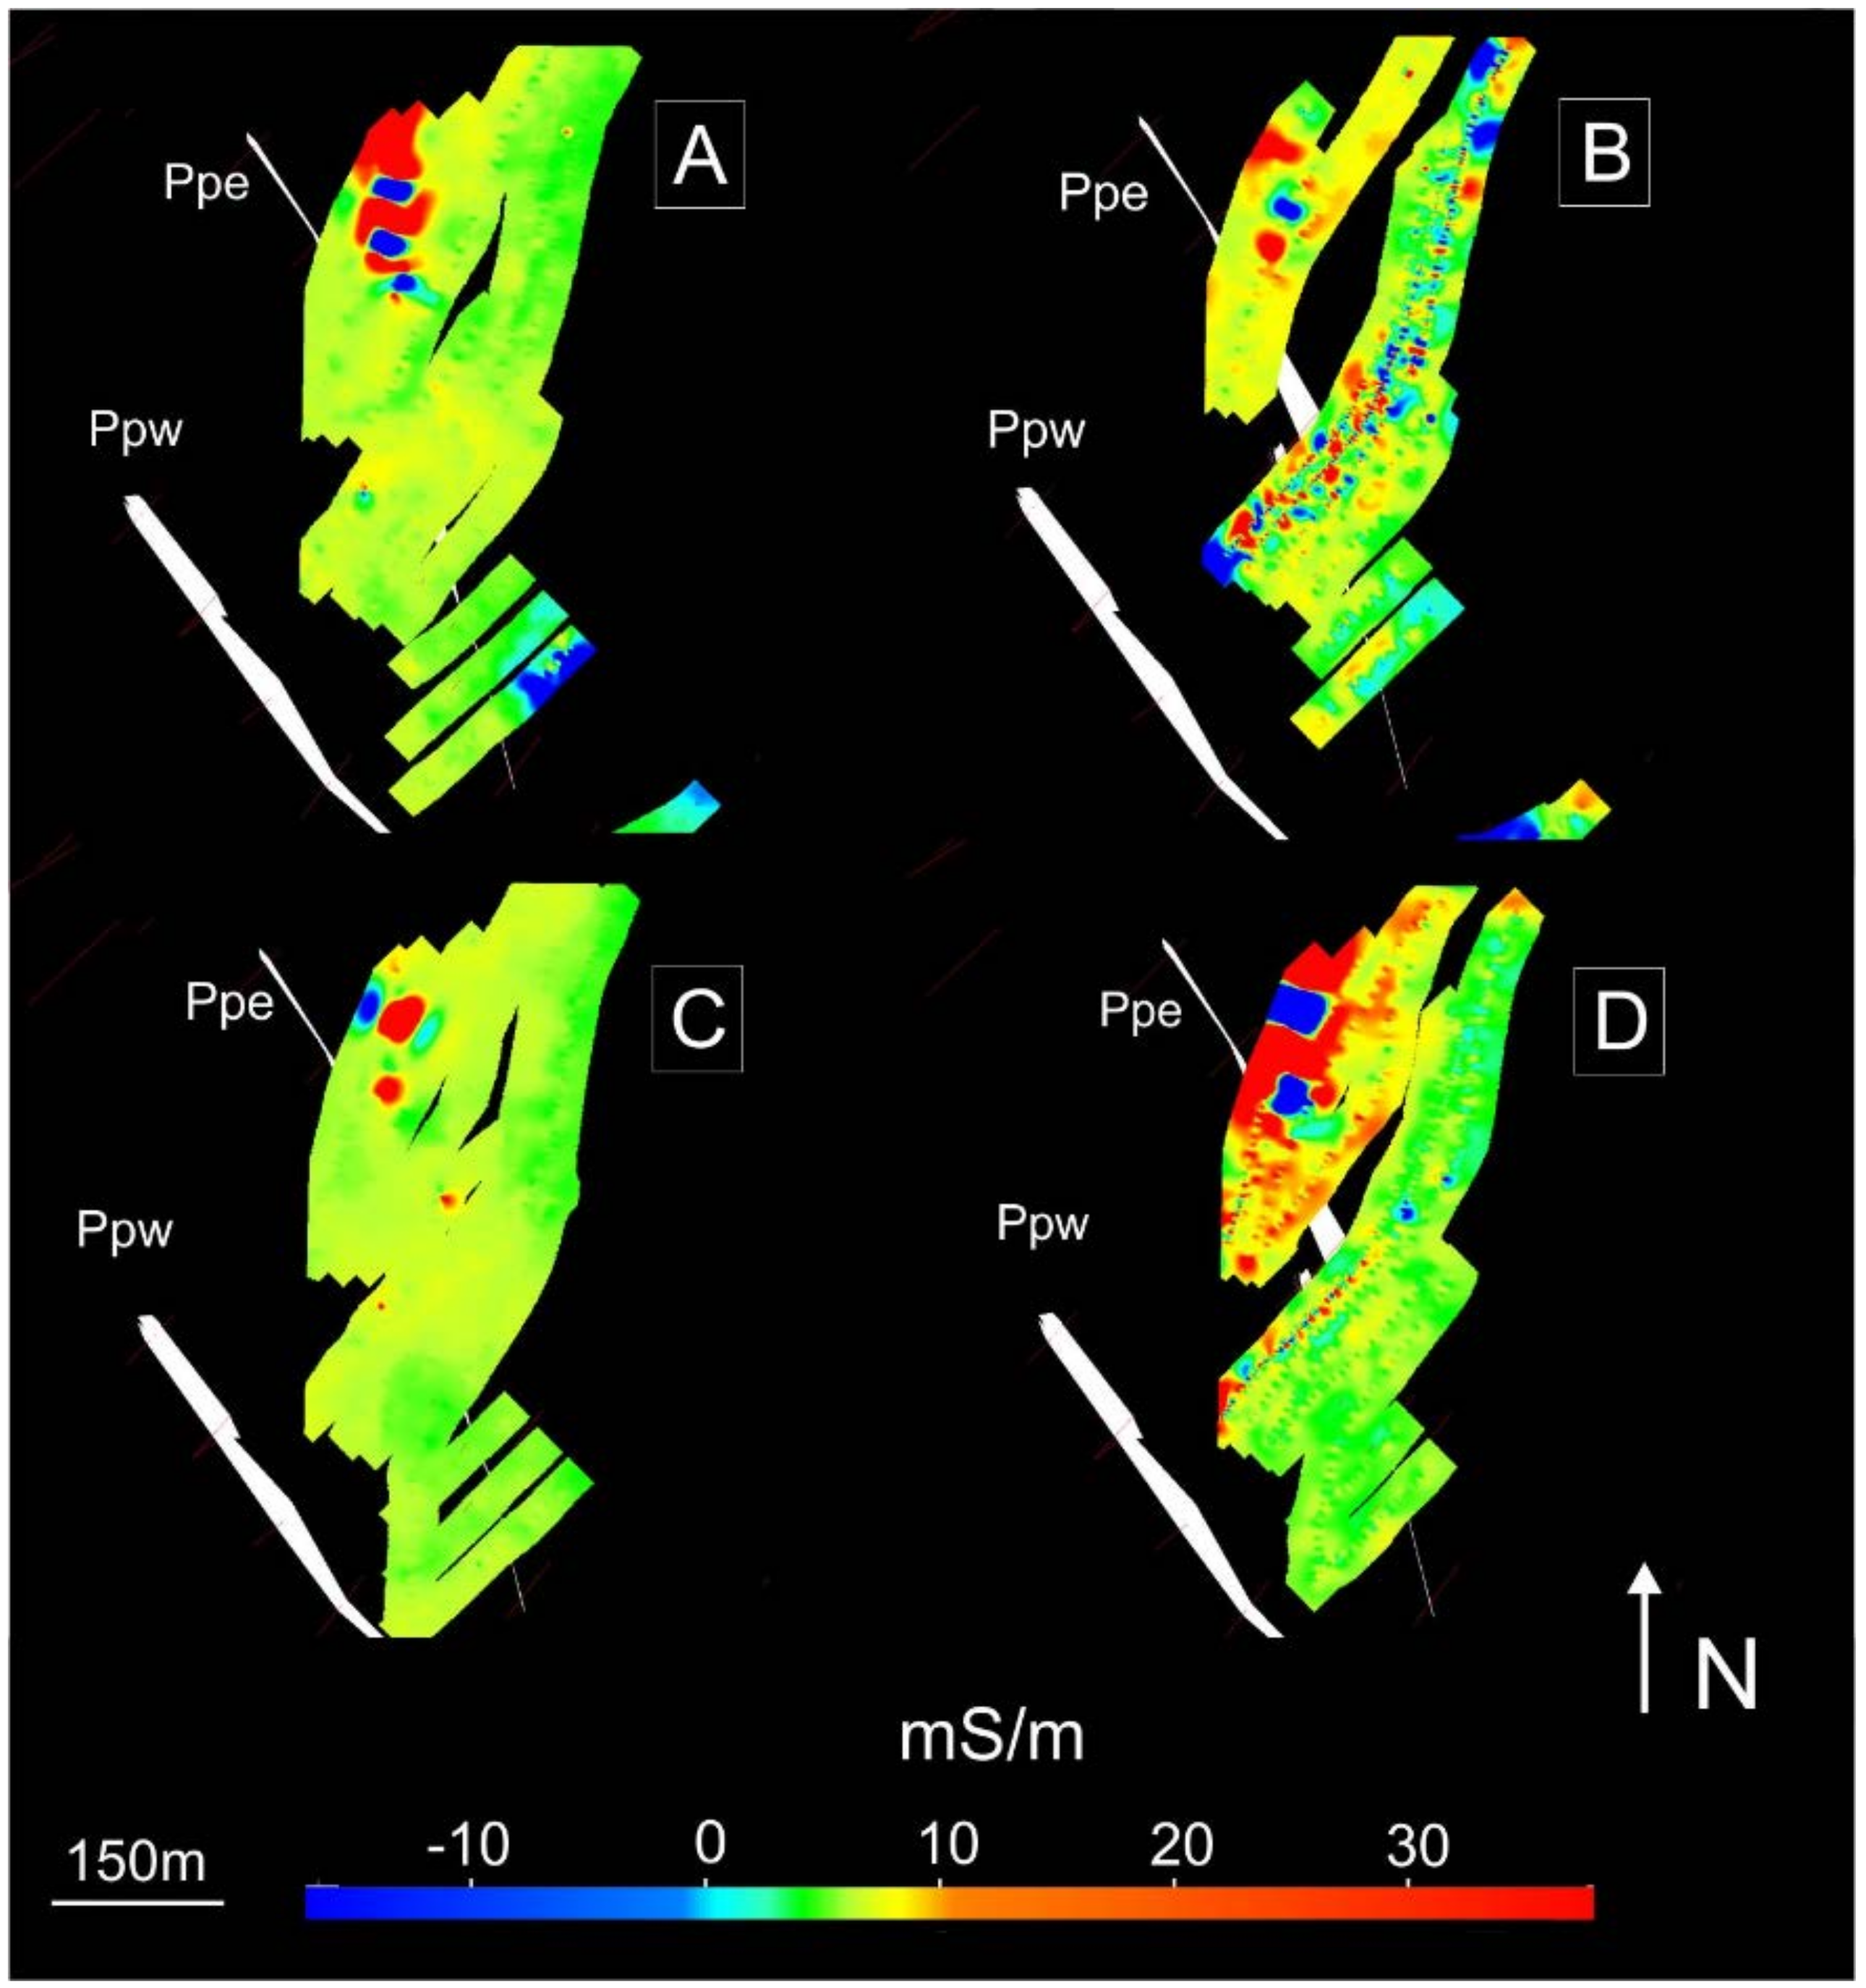
3.1.2. Electromagnetic Survey

The electromagnetic techniques (EM) allowed the detection of conductive objects or bodies, based on the electromagnetic induction principle. In our study, we used the Frequency Domain Electromagnetic method (FDEM), which consisted of emitting an alternating electromagnetic field via the transmitter that generated an eddy current in the subsoil [43,44].
The EM survey was carried out using a Geonics EM 34-3, with coaxial and coplanar configurations with 20 m and 40 m spacing between the two coils. The depth of investigation was about ¾ of the distance between the coils in the coplanar configuration, while this ratio was 1.5 in the coaxial configuration. The frequency was set depending on coil spacing, as follows: 1.6 KHz for 20 m spacing and 0.4 KHz for 40 m spacing.

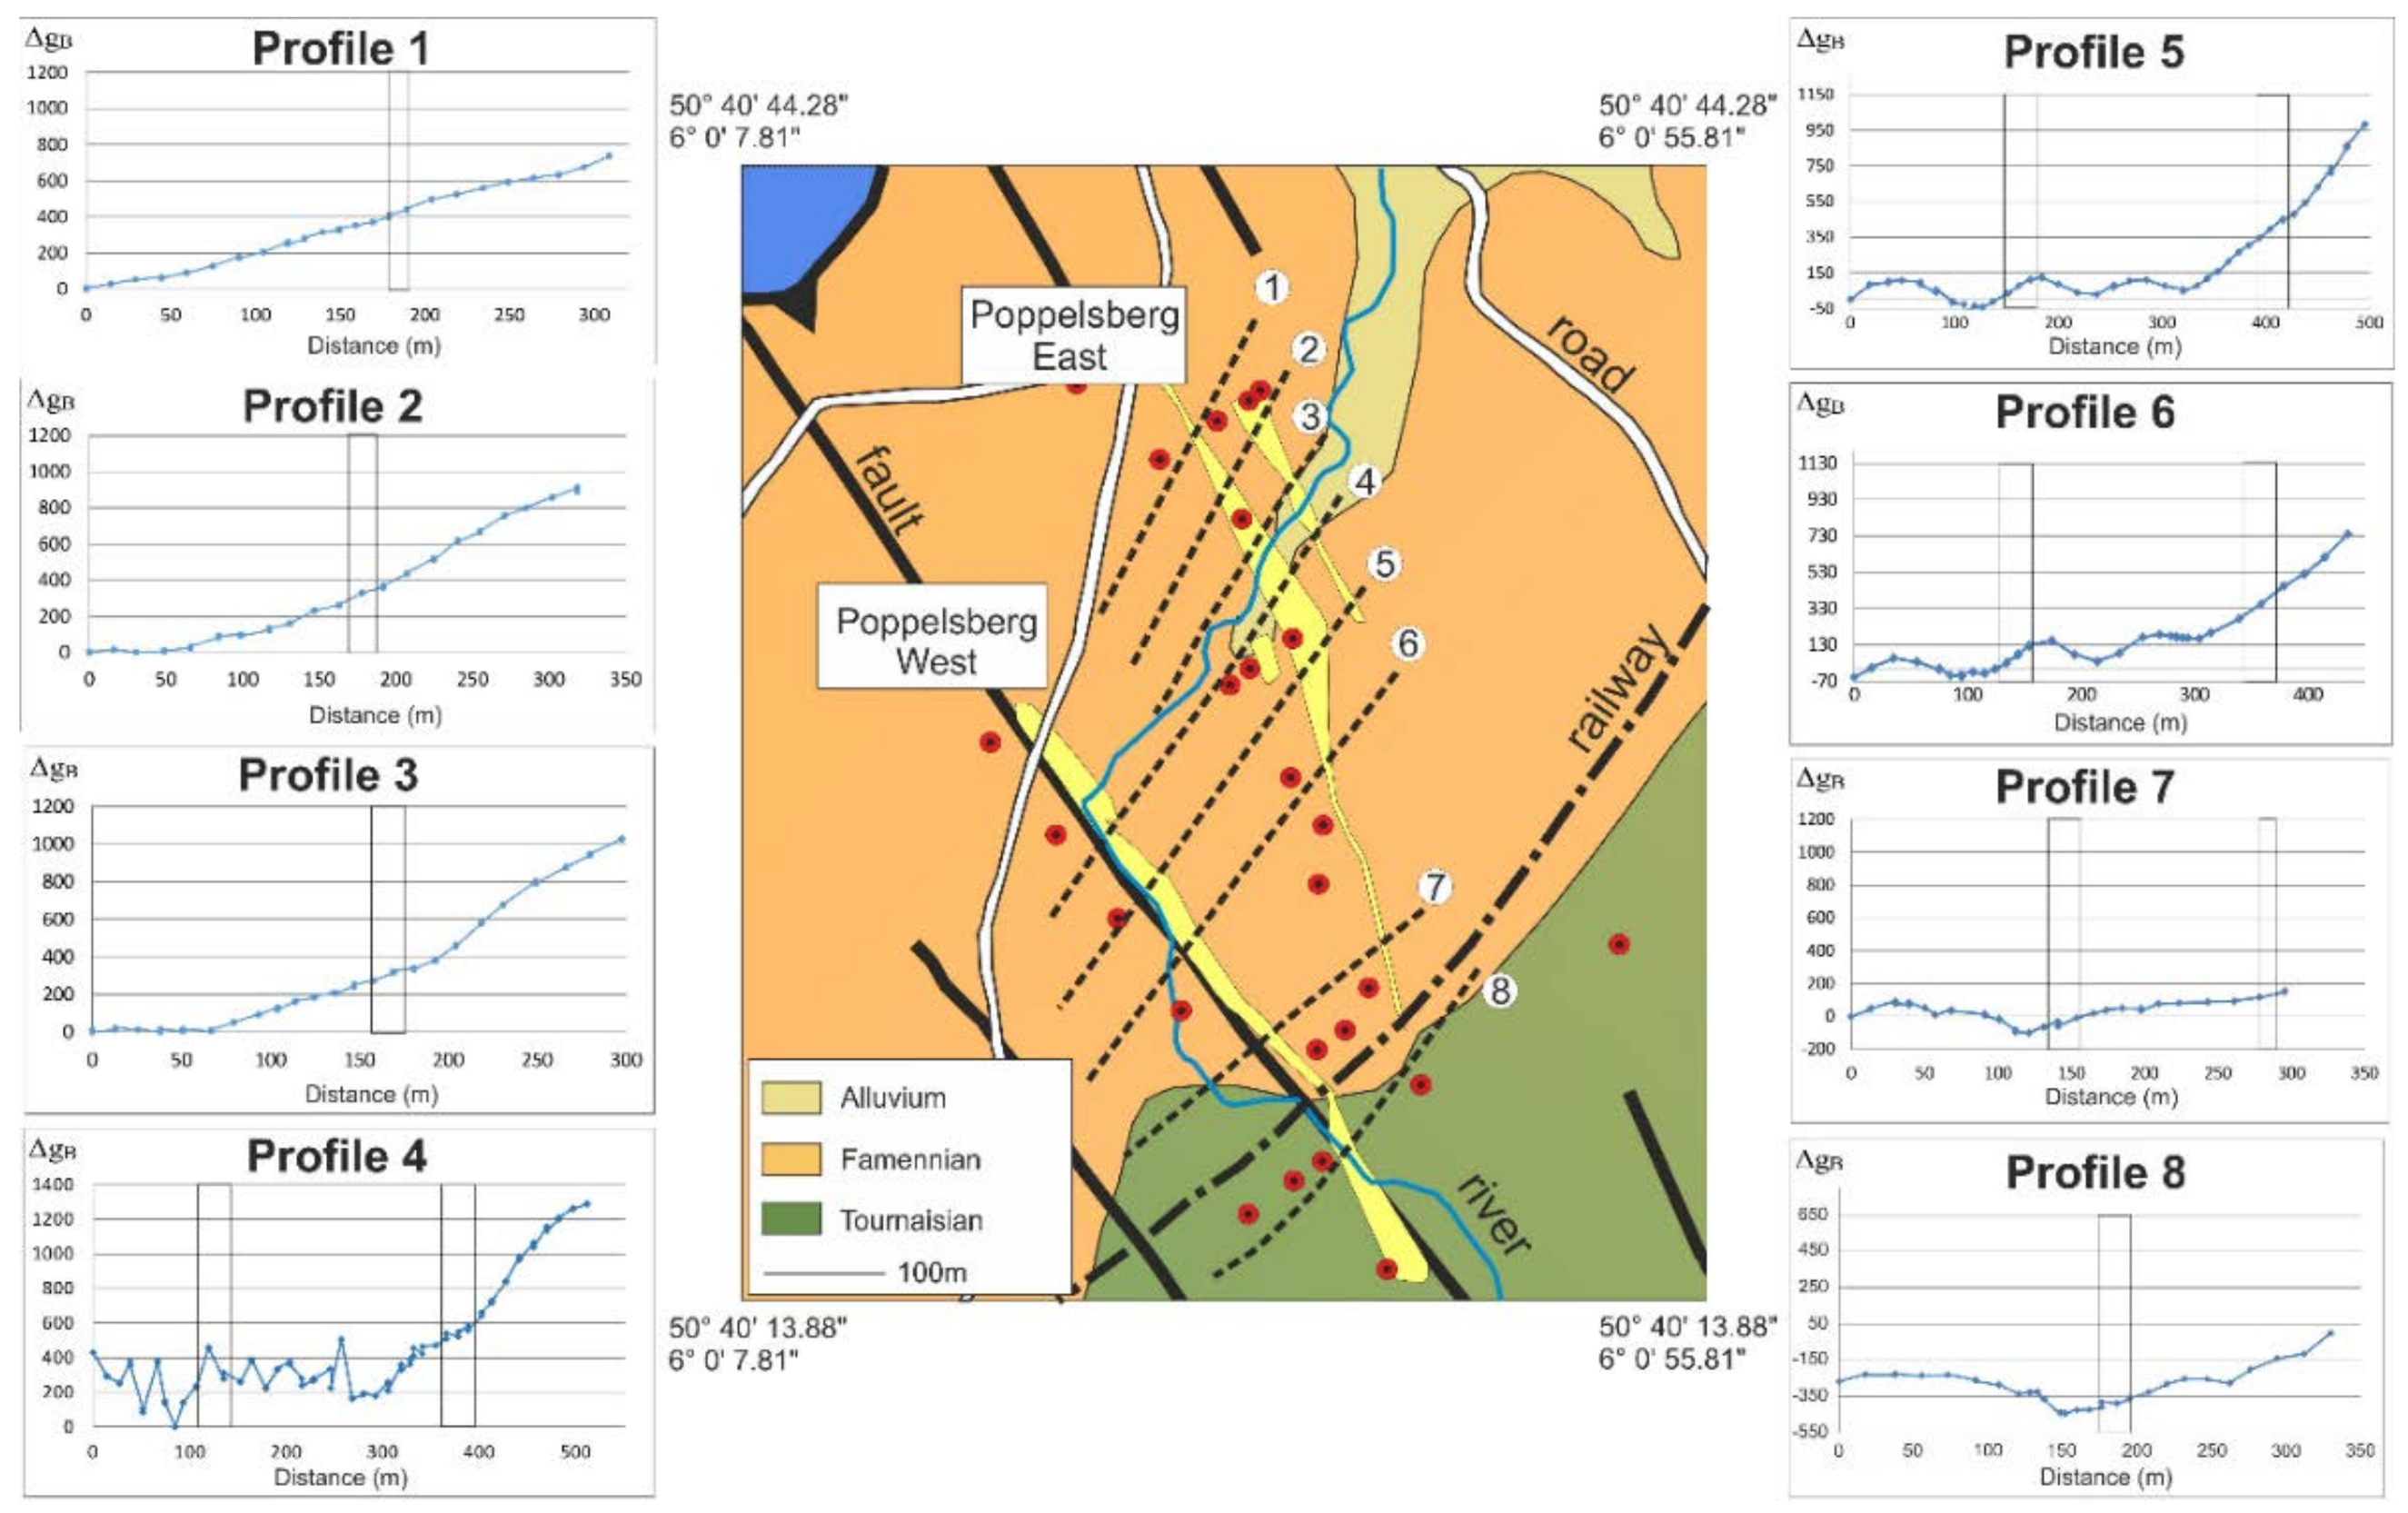
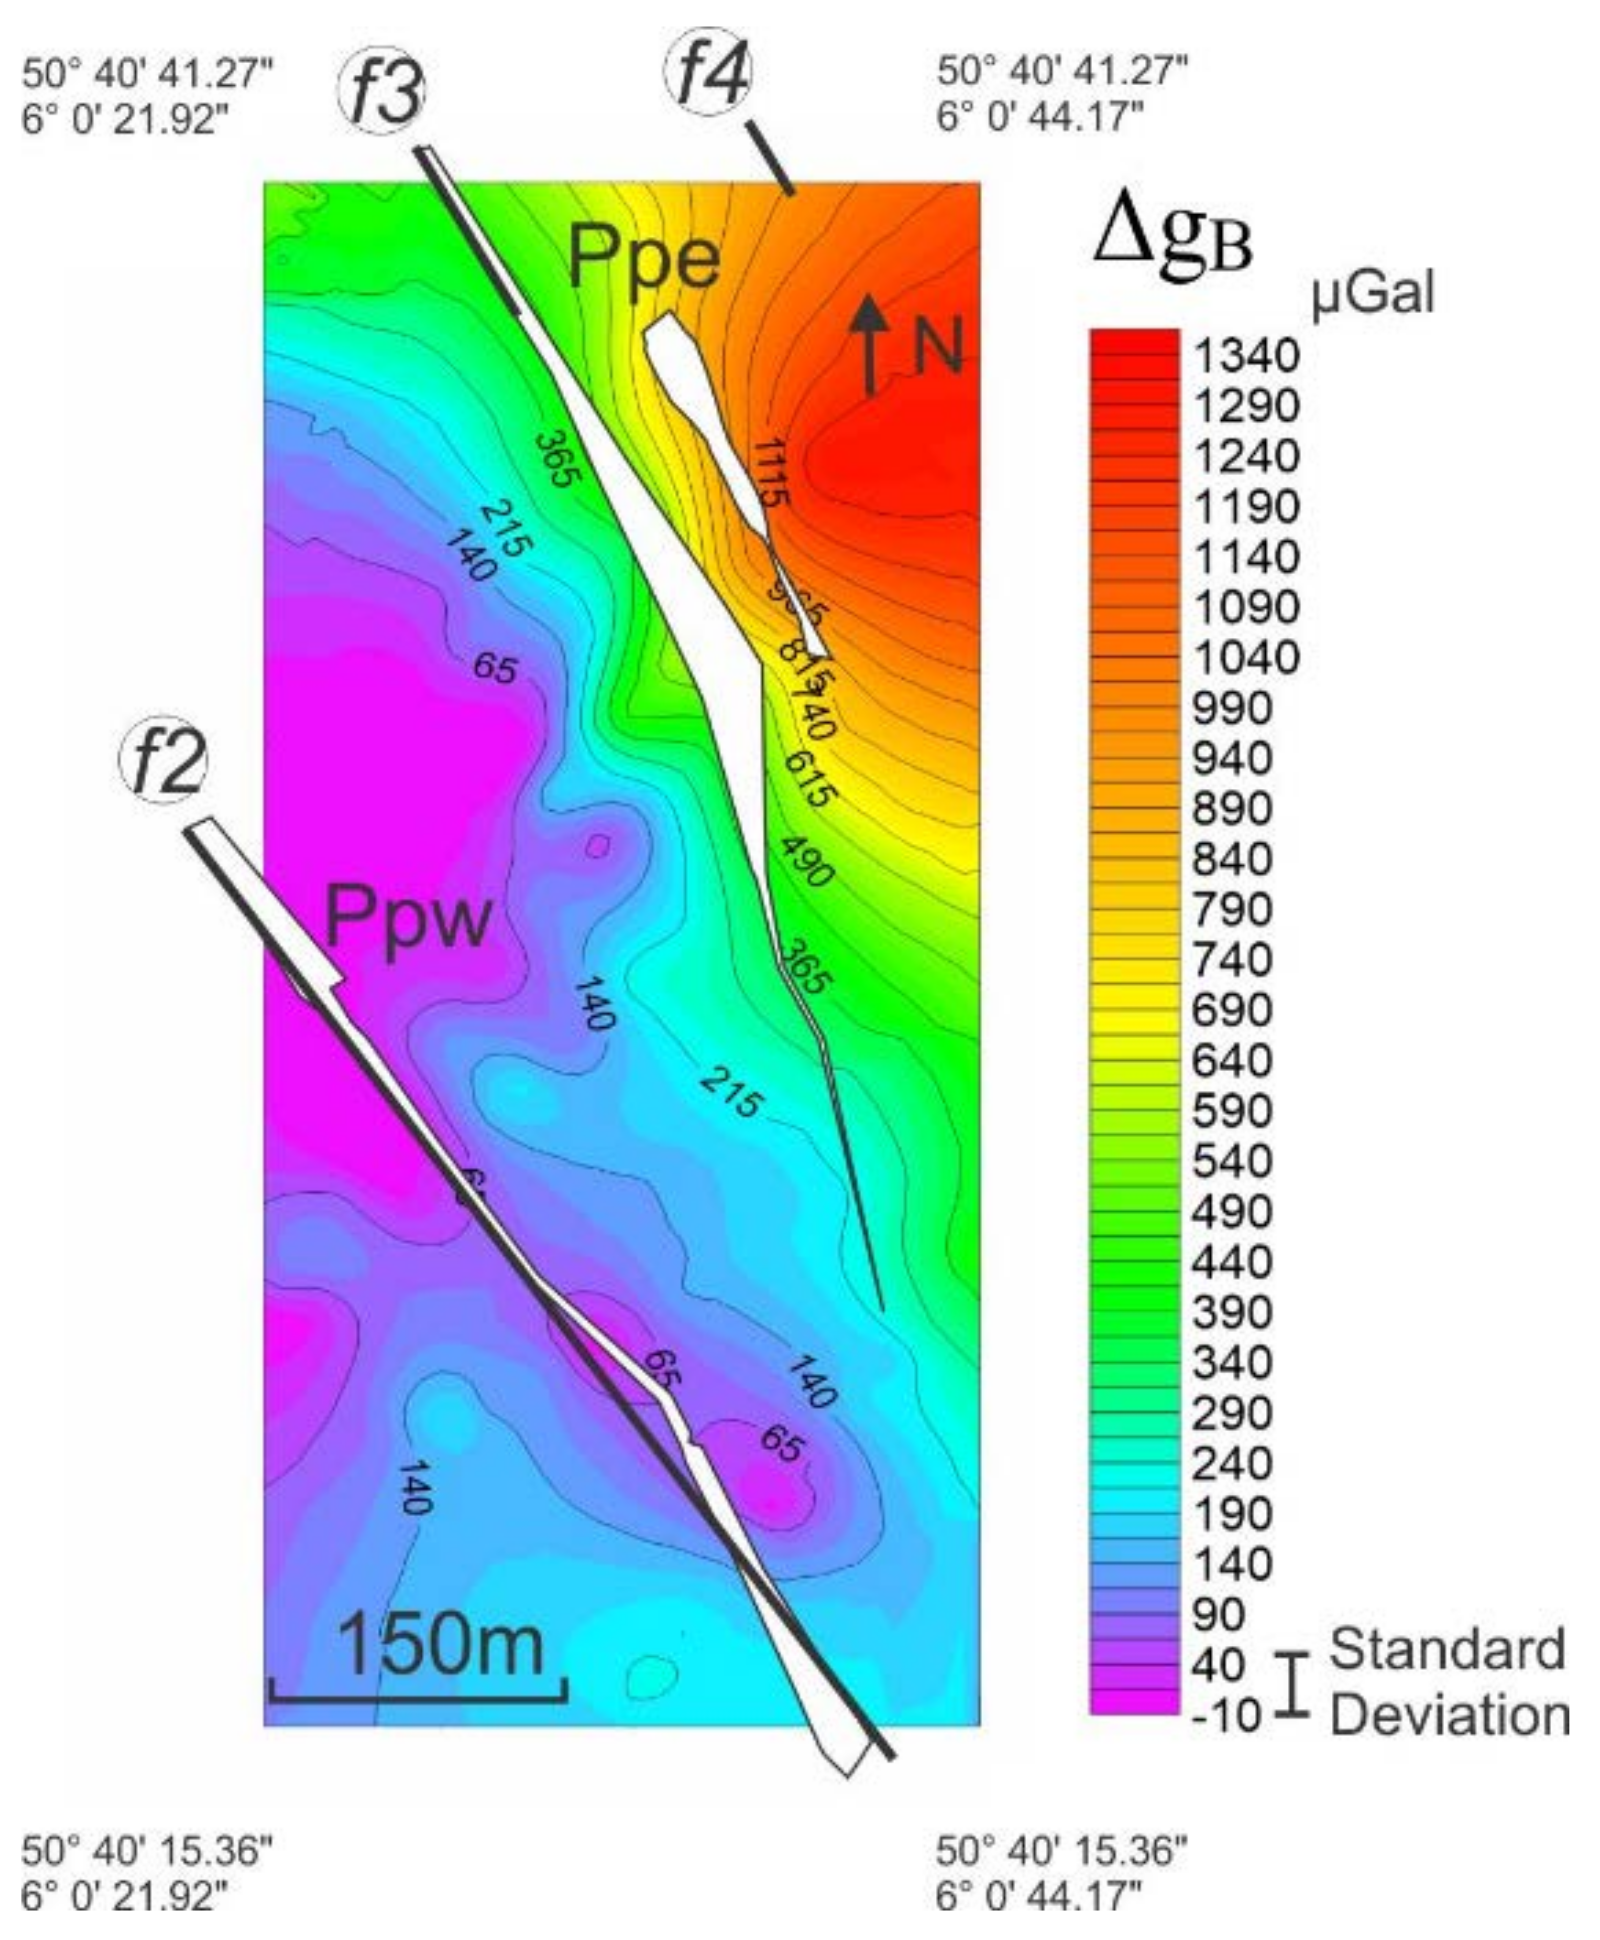
3.1.3. Gravity Survey

Gravimetric methods were based on the sensitivity of the gravity field, with respect to the lateral density change of the subsoil. This lateral change could have been linked to geological anomalies, such as magmatic intrusion or ore deposit [45,46].
A gravity campaign was performed using a Scintrex CG-5 AUTOGRAV gravimeter. Eight gravity profiles, of 300 m to 850 m long, were measured with a gravity station every 20 m, perpendicularly to the Pb–Zn veins, so as to investigate the Poppelsberg East and West lodes.
The gravity data were influenced by several factors, such as the earth tide (corrected using the “Berger” correction [47]), instrumental drift, latitude, elevation, and topography. These needed to be corrected for in order to reveal the gravity anomaly that resulted from the geological causes. All these corrections, except for terrain (topography), were applied so as to obtain the Bouguer anomaly [46]. The terrain correction was not applied, because the difference in elevation within a gravity profile was too small, being less than 1m inner within a radius of 20 m [46].
One gravity observation consisted of the integration of over 85 s of measurements that were taken at a rate of 6 Hz. At each station, three observations were taken to limit the possible acquisition errors (soil compaction, drift of the device, and external noise). The final observation was obtained by taking the mean value of the second and third measurements. The first one was systematically discarded so as to mitigate the effect of the relaxation of the spring, which was caused by the transport of the gravimeter. The instrumental drift was estimated by reoccupying the base station every 50 min. The average standard deviation of the measurements were around 3 µGal (1 Gal = 10−2 m/s2). In addition, a precise levelling of each gravity station was performed with a Leica Differential Global Positioning System. The measured heights had a precision of about 1 cm and were used to correct for the elevation difference, with a constant admittance of −3 µGal/cm (the so-called free air anomaly).

4. Results

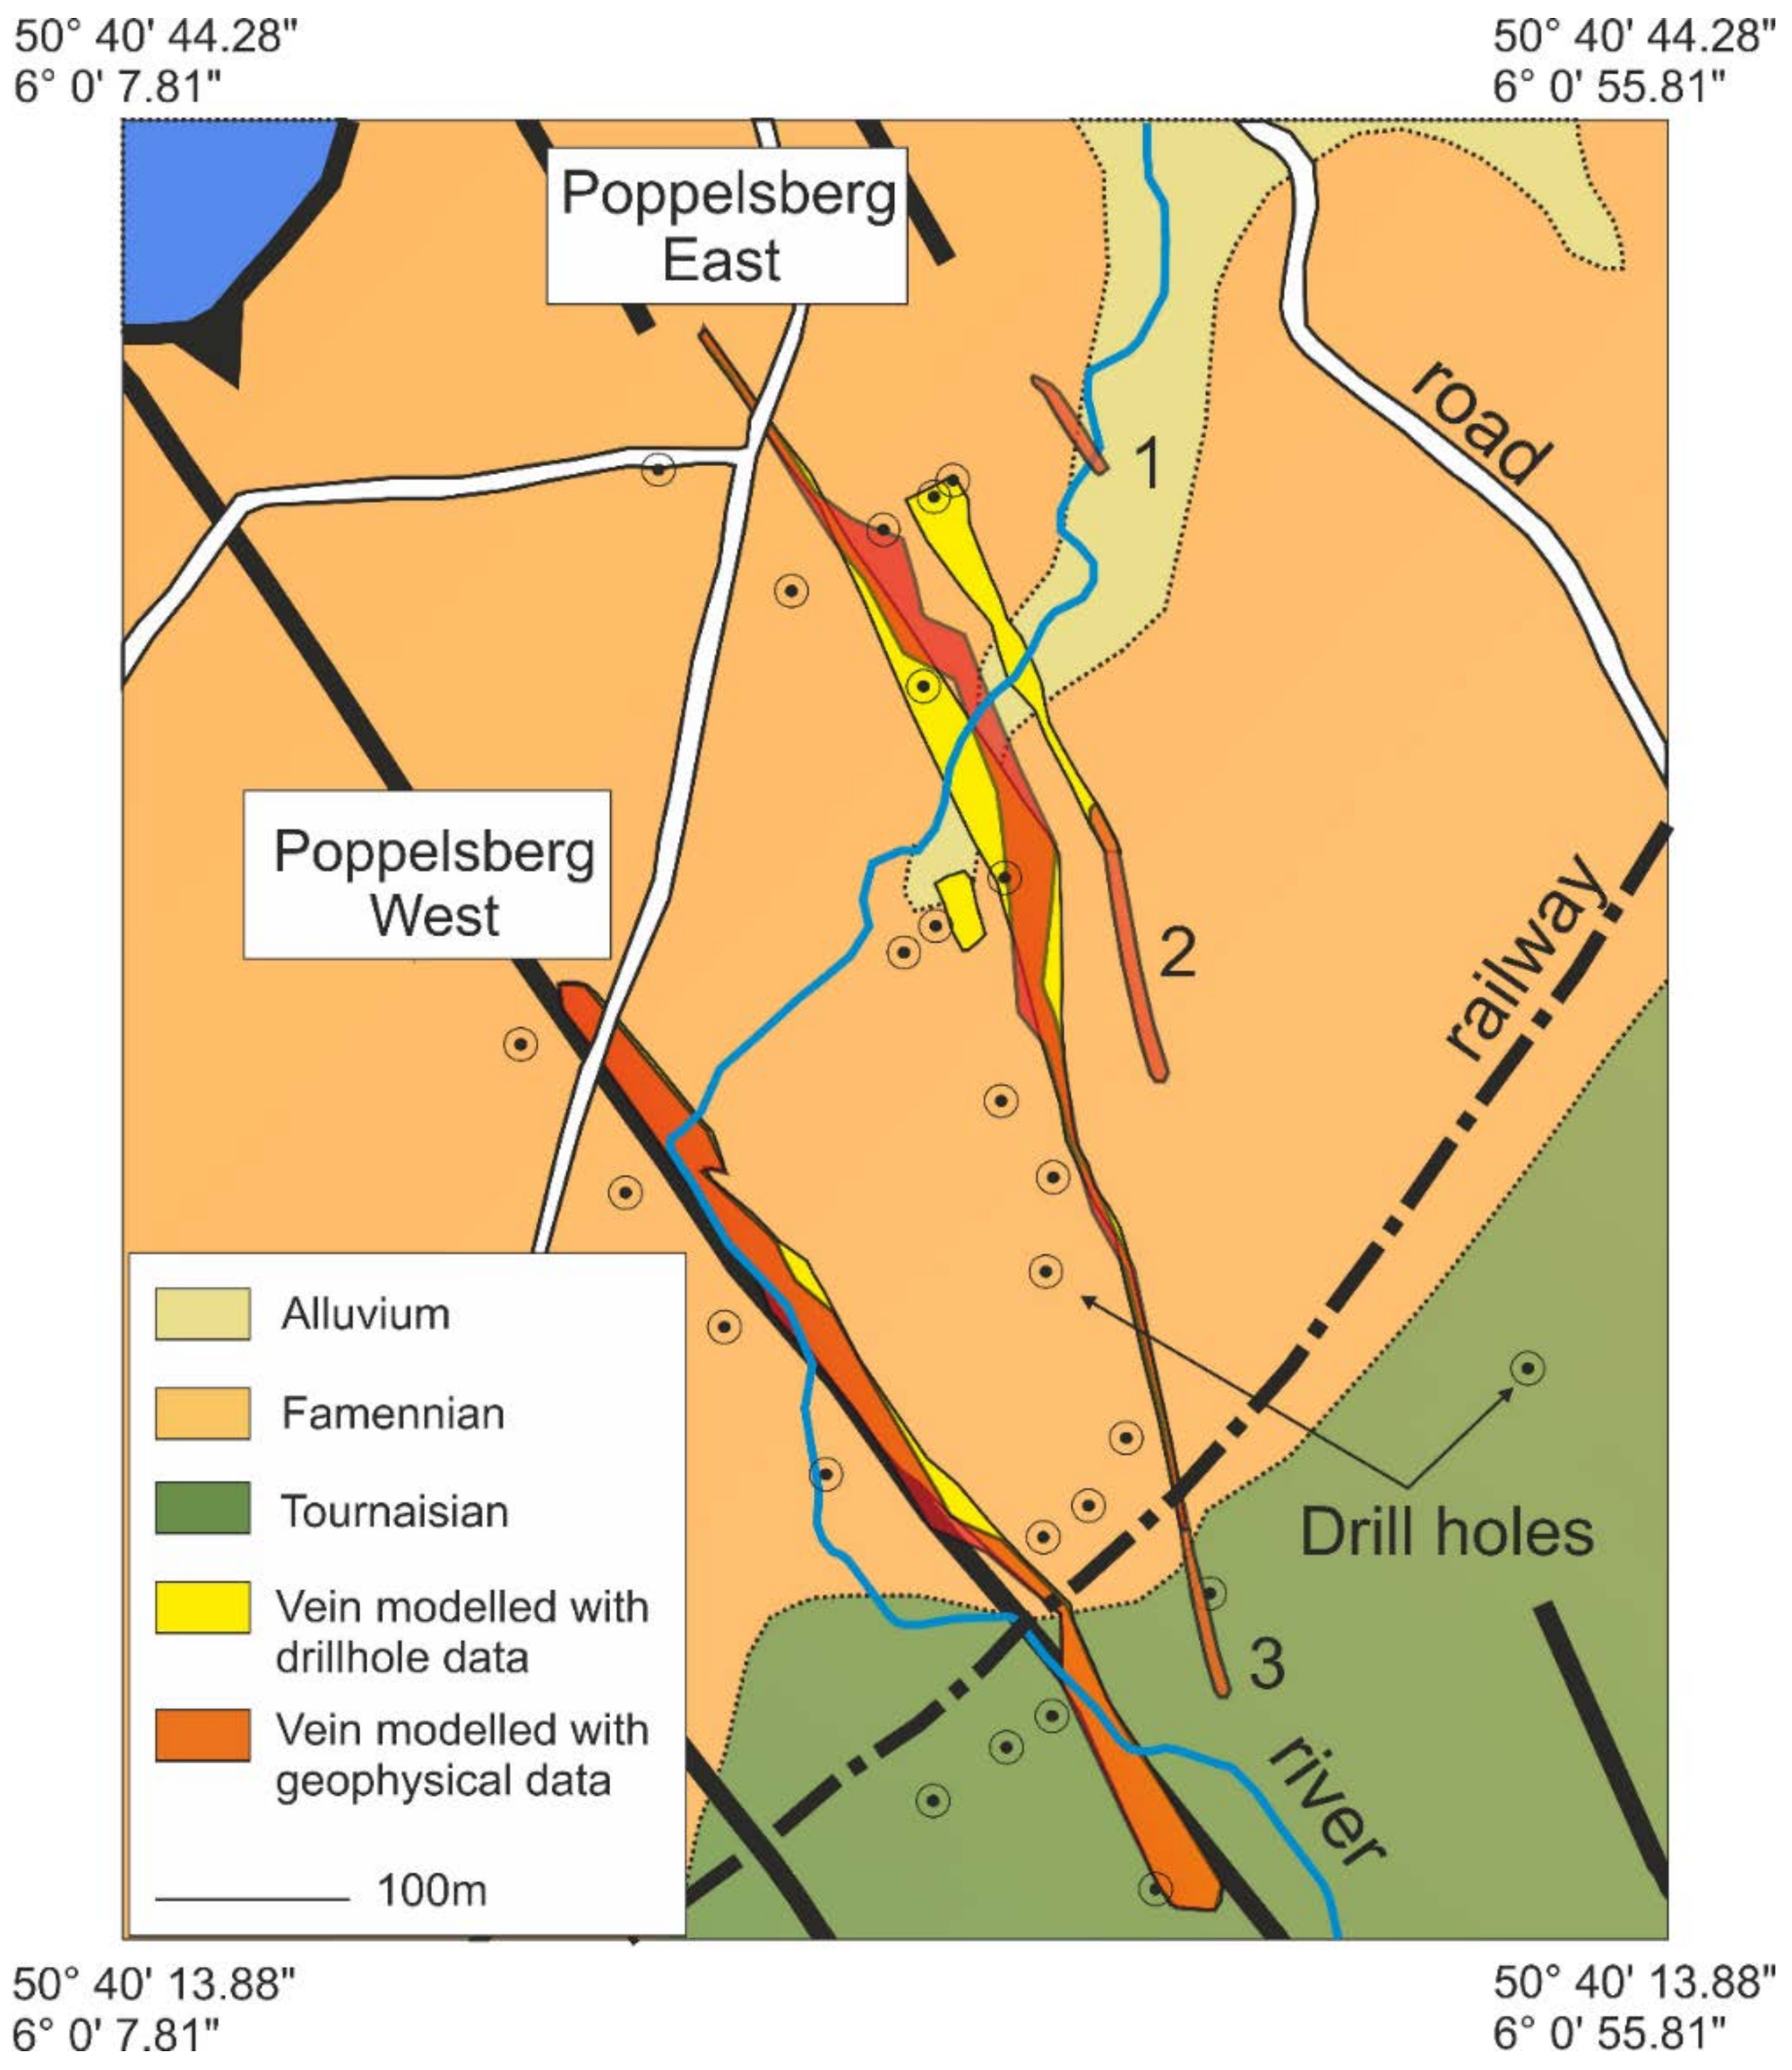
4.1. 3D Geological Modelling and Mineralization Analysis

A 3D geological model was developed using the data of the 62 drillings (a plan view is provided on Figure 3), which had a crosscut Pb–Zn mineralization between 10 m and 290 m deep. The 3D modelling consisted of linking the mineralized areas in the different boreholes; considering the lithological and structural controls; and supposing that the lodes were continuous between the drillings, with a thickness that was equivalent to the thickness of the crossed lodes. No lateral or vertical extrapolation were made, which probably underestimated the volume of the Pb–Zn lodes, as shown when using geophysics.
The 3D model evidenced three non-connected ore bodies, namely, Lontzen, Poppelsberg East, and Poppelsberg West. They presented lode shapes that were located along the extensional faults f2 and f3 (Figure 3), mainly within breccia. The model helped to delineate the ore deposit between the drillings and gave a better idea about the vertical and lateral extension of the lodes, their dip, and the exact location of the mineralization at the ground surface. This 3D information was useful for designing the geophysical survey targets. Only the Pb–Zn lodes of Poppelsberg East and West were targeted using geophysics, because the deposit of Lontzen was located under the homonym village.
The Poppelsberg East lode (specification in Table 1) was estimated as a 635 m long Pb–Zn lode, with an 80–90° inclination to the East, according to the 3D model. The mineralization of this lode was mainly composed of colloform sphalerite, with galena and pyrite in a thin argileous matrix. Two parallel lodes were present on each side of the Poppelsberg East lode (Figure 3). The Eastern parallel lode extended for nearly 250 m long, with a dip of 70–90° to the West. The lode was characterized by a 0.3–3 m thickness and grades from 0.7% to 30% Zn. The ore in this lode was mainly composed of massive pyrite bearing sphalerite and galena.
The Poppelsberg West lode (specifications in Table 1) was estimated from the drillings of a 625 m long Pb–Zn lode, with a 75° dip to the West. The ore, which was hosted in Famennian sandstones, was mainly composed of colloform sphalerite, with galena and pyrite in a thin argileous matrix, but oxides were also present. The mineralization that was hosted in the Tournaisian dolostones in the Southern part were mainly composed of sphalerite and galena in calcite lodes (0.5 to 5 min depth).
The sparseness of drillholes along the lodes and the tortuosity of the Pb–Zn lodes in this area, probably caused an underestimation of the real shape and volume of the lodes.
Overall, the mineralization at the site mainly consisted of sulphides, such as galena, sphalerite, pyrite, and marcasite ([17] and drillings information). These minerals presented petrophysical properties that were very distinct from the sedimentary host rocks (Table 2). The electrical chargeability and resistivity between the sedimentary host rocks and sulphide mineralization were expected to be greatly contrasted (more than 20 ms and 100 Ohm·m respectively) and detectable. According to gravity simulation that was based on the 3D model of the lode extension with Fastgrav software, a difference of density of min 0.3 g/cm3 was expected between the host rocks and mineralization, which could have led to an anomaly of up to 0.2 mGal. The magnetic susceptibility of the MVT ore deposit was highly dependent of the presence and proportion of the magnetite and pyrrhotite content in the ore. Occurrences of pyrrhotite in trace concentrations were listed in the Verviers Synclinorium [17,23]. In Lontzen–Poppelsberg, this method was unsuccessful.

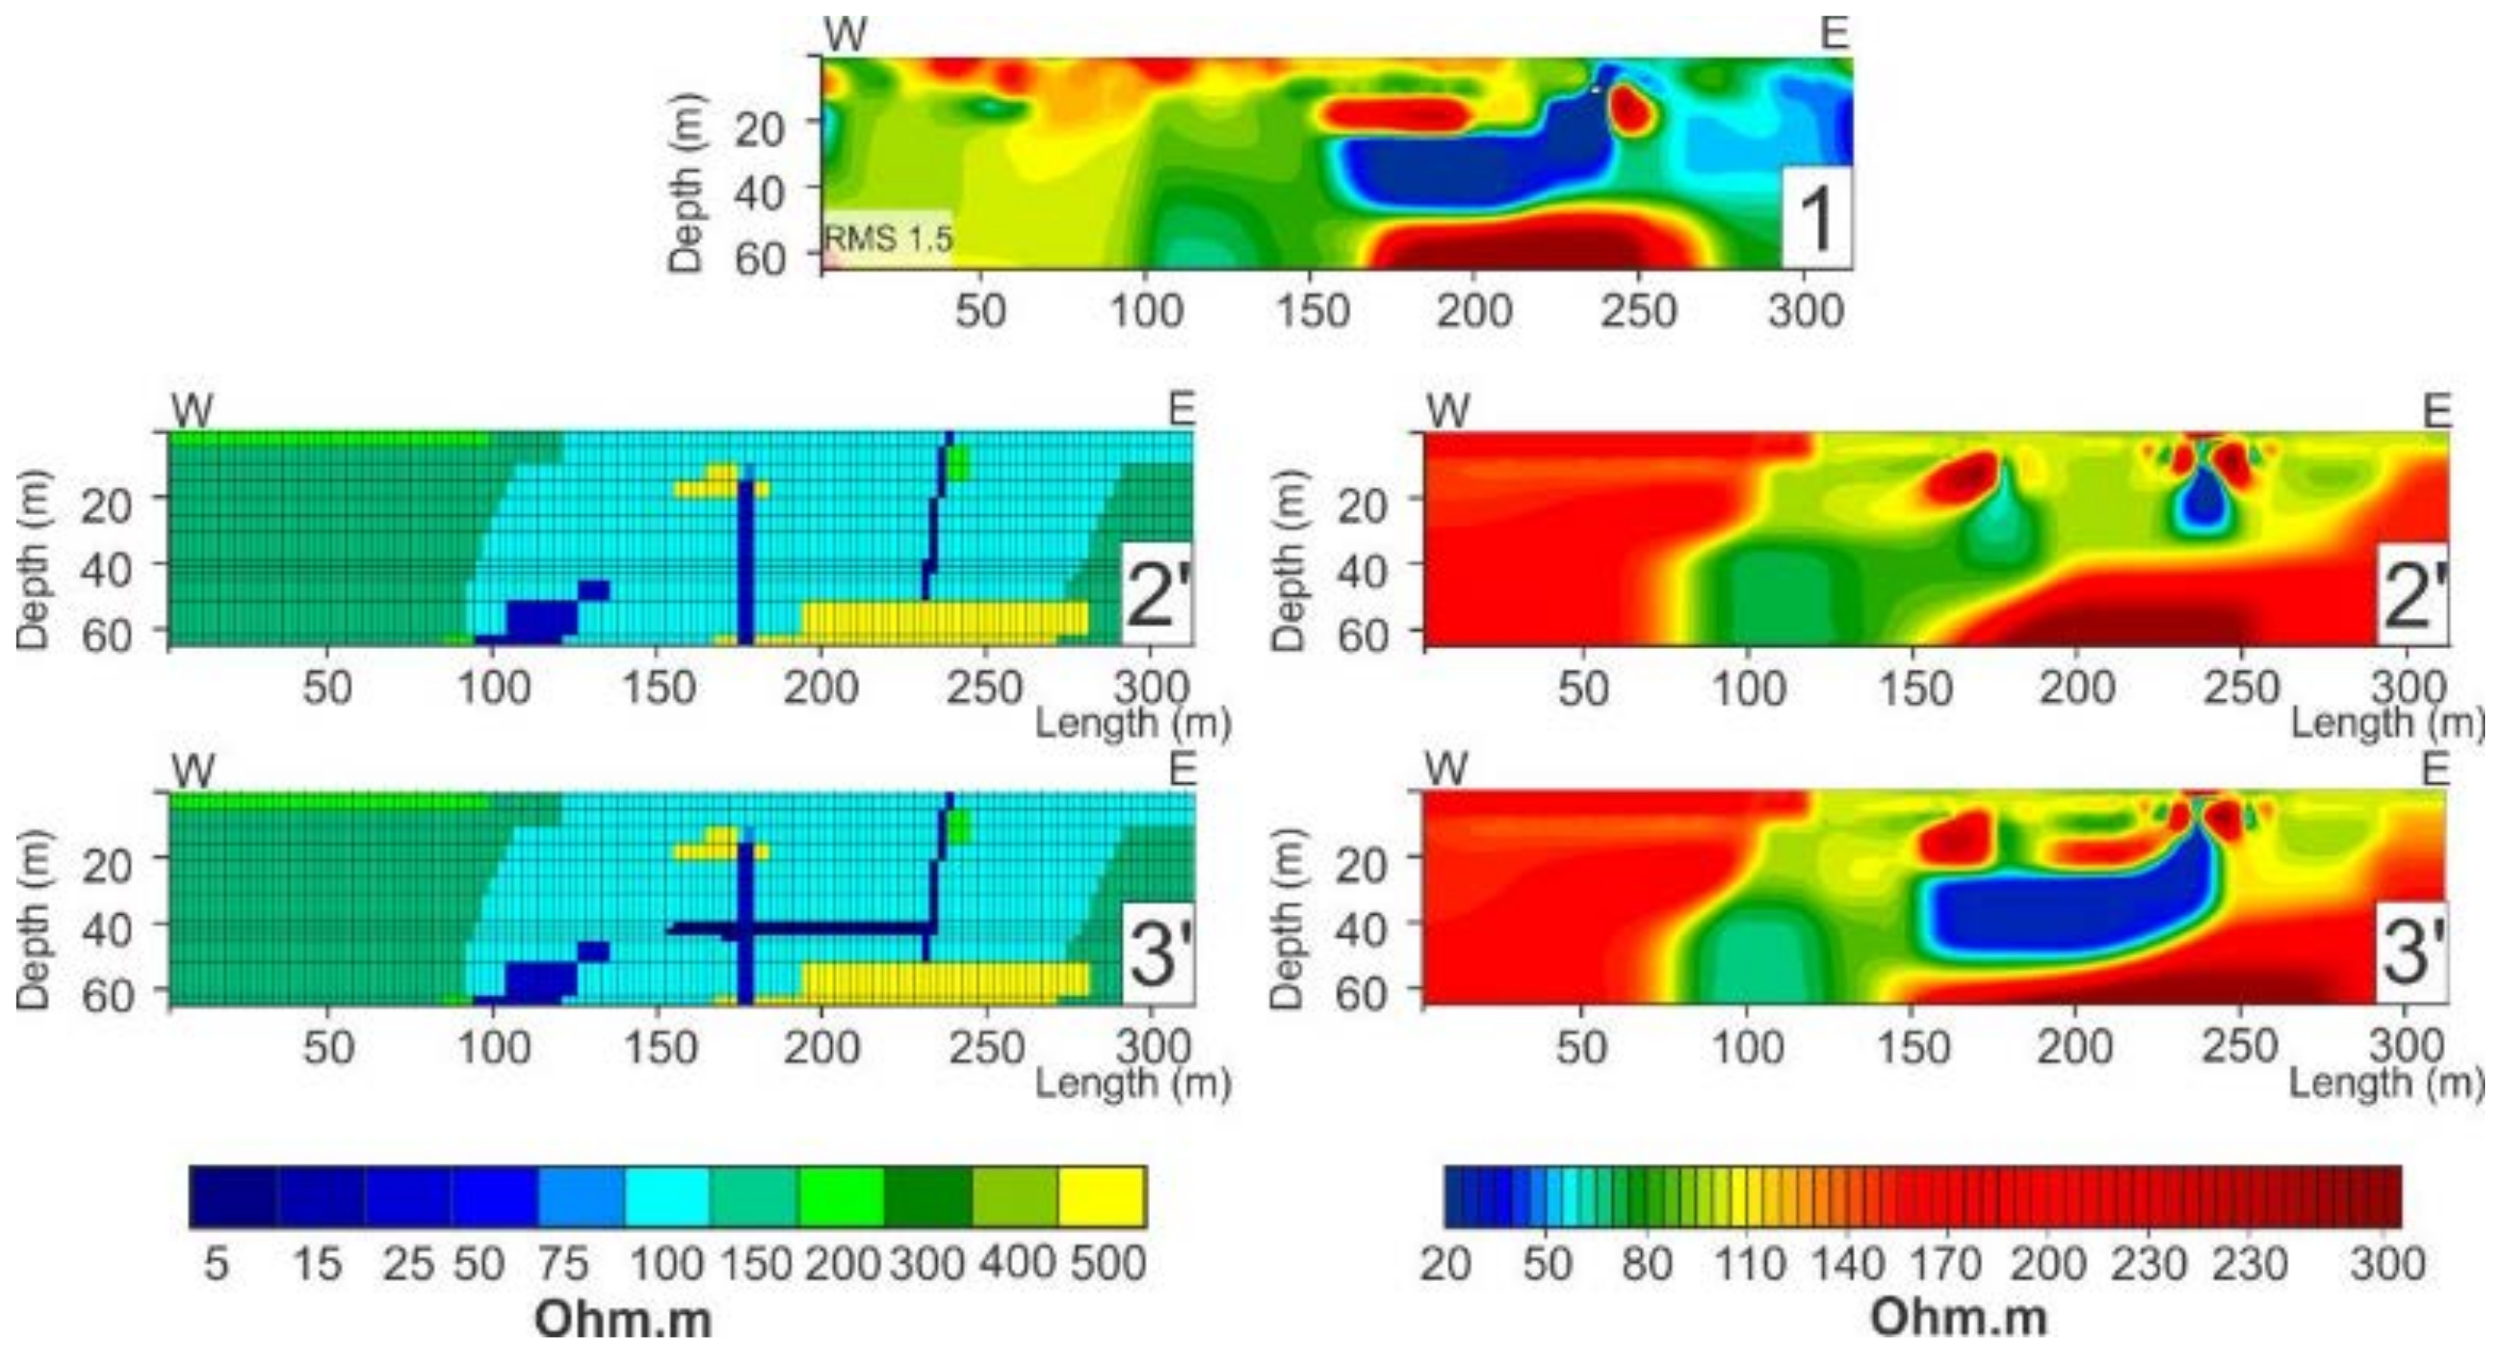
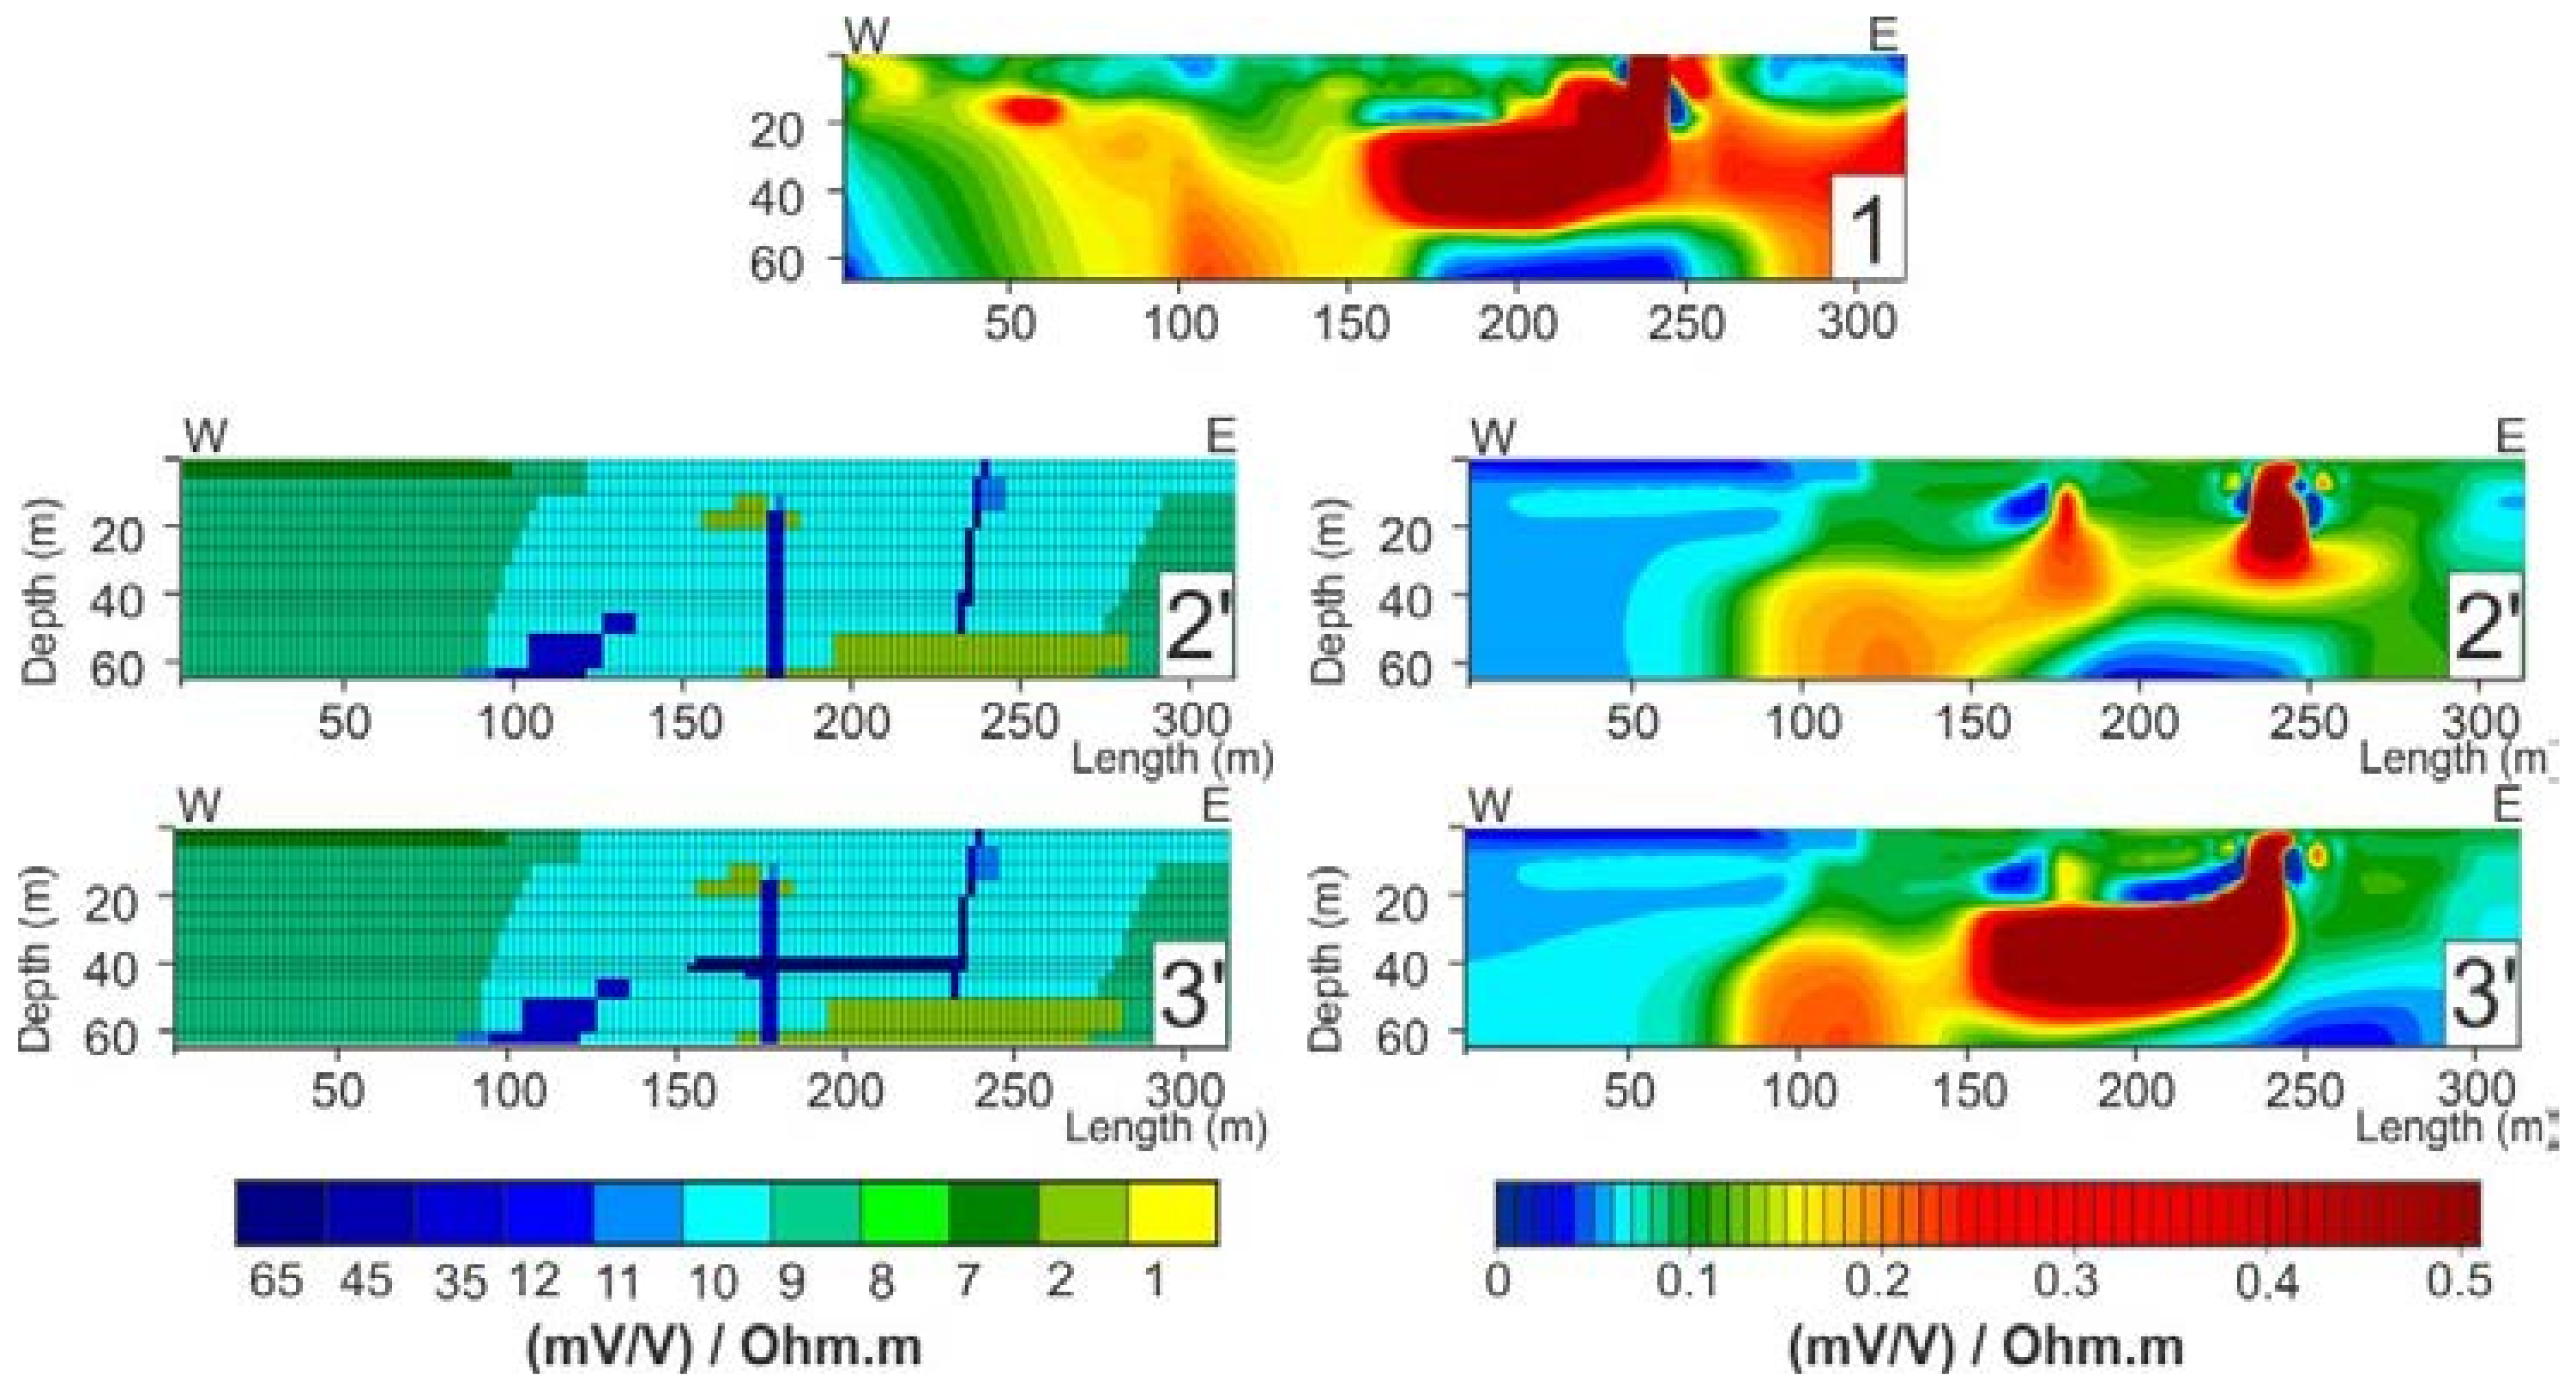
4.2. Electrical Resistivity/IP

The drillings logs were projected perpendicularly onto the ERT profiles from their initial location so as to compare the resistivity images with the projected location and characteristics of the mineralization (Figure 6, Figure 7 and Figure A1).
The ERT and IP tomography allowed for the detection of the Poppelsberg East (Figure 6A,B and Figure 7A,B) and the Poppelsberg West mineralized zones (Figure 6C and Figure 7C). Other low resistivity anomalies were also detected (Figure 6D,E).
Note that the distance between the boreholes and the ERT/IP profiles could exceed 35 m, which could have biased the reliability of the borehole information once it was projected on the tomography section. This was indicated by white, grey, and dark rectangles on the projected boreholes. A, B, C, D, and E, in Figure 6, were areas with low resistivity values (5–80 Ohm·m), which were globally located near the drilling-based Pb–Zn mineralization for most of the profiles. For Profiles 2, 9, 10, and 17, the position of the observed mineralization in the drillholes corresponded to a low resistivity area. The match was not complete for Profiles 15 and 16, probably because of the large distance (35 m) between the drillings and the ERT section. The ERT profiles indicated that the mineralized zone that was cut by drillholes was not strictly linear from one drilling to another. Therefore, they did not perfectly match with the drillings-based Pb–Zn model, especially in the Northern part of Poppelsberg East lode (because of the lack of drilling information in the area and the assumption that was made during modelling).
A, B, and C, in Figure 7, corresponded to high normalized chargeability areas (value > 0.1 (mV/V)/Ohm·m) and were located in the vicinity of the modelled Pb–Zn lodes. However, they did not systematically correspond to the projected mineralization (white rectangles in Figure 7). This could have resulted from several factors, namely, poor projection of the drillholes because of the distance between the profiles and the boreholes (Profile 15), very punctual information, lack of drillhole information (Profiles 5 and 7), or lack of sensitive information at depth (Profile 16) because of the data quality. Note the strong correlation between the low resistivity and high chargeability areas for most of the profiles (Figure 6, Figure 7 and Figure A1).
The Southern part of the Poppelsberg East lode (Profiles 13 and 14 in Figure 6) did not display a significant resistivity anomaly (between 80 and 120 Ohm·m) when compared to the observed values in the other profiles (<80 Ohm·m). This was probably because of the absence of pyrite and marcasite, combined with a narrowing of the Pb–Zn lode, as supported by the drillings.
On Profile 3 (shown in complementary Figure A1), a strong chargeability anomaly (50 m from the beginning of the profile) which correlated to a low resistivity area was detected in the near surface (2 m depth) and corresponded to the top of the Poppelsberg East lode. This anomaly, which was confirmed by the auger drillings, revealed conductive clays bearing hematite and goethite nodules with Zn trace (detected by X-ray Diffraction (XRD) analysis). The top of this chargeability anomaly was representative of the alteration of the Pb–Zn sulphide ore [49].
A large low resistivity values area that corresponded to the trace of Poppelsberg East lode was present on Profile 7 at 375 m along the profile (Figure 6A), which indicated a depth extension from 10 to 65 m. Three other low resistivity anomalies were observed on this section (Figure 6B–D).
As seen on profiles 9 to 12, low resistivity and high chargeability values (B anomaly on Figure 6 and Figure 7), which were located on the Eastern part seemed to match with the Southern extension of the Poppelsberg East lode, which was located in fault f3. This fault was probably much longer than it was originally drawn on the geological map, as confirmed by the presence of the mineralization of Poppelsberg East on its Southern part, which was hosted in fractured sandstones (drilling information). The Pb–Zn mineralization in Famennian sandstones were mainly the lodes that were located within the extensional faults [17]. The low resistivity and high chargeability values matched with the sulphides area, which were locally present within a small amount of clays. According to the core log information, clays could be found as a weathering product of the Famennian rocks on the top of the bedrock, or locally within breccia in the filling of faults, excluding the presence of argileous pockets at the depth in non-fractured rocks.

4.3. Electromagnetic Survey

Because of a large number of anthropogenic structures in the study area, the prospected area had been restricted to the Poppelsberg East lode, the Southern part of the Poppelsberg West lode and the Southern part of the extension of the Poppelsberg East lode. Unfortunately, there were no drillholes available in this area.
An electromagnetic anomaly was detected on the Northern part of the Poppelsberg East lode by the four EM configurations (Figure 8), in agreement with the ERT anomalies that were observed on Profiles 2, 5, and 7 (Figure 6 and Figure 7). This anomaly covered the main Pb–Zn lode of Poppelsberg East and its parallel Eastern extension. The coaxial configuration, with 20 m spacing, seemed to give the clearest signal (Figure 8A).
The Poppelsberg West lode was not prospected using the EM technique, because of the presence of the small river flowing on top of the lode and the presence of electric fences along that river.

4.4. Gravity Survey

The Bouguer gravity anomaly (Figure 9) displayed a positive trend of 800 to 1400 µGal (1 Gal = 10−2 m/s2) on 300 m from the West to East, for Profiles 1 to 6 (all located in Famennian sandstones/shales and nearly parallel to the strike of the rock unit), whereas Profiles 7 and 8 did not show the same anomaly. A density of 2.7 was used to compute the Bouguer correction. In comparison, a gravity anomaly of a much larger Pb–Zn ore deposit, such as Pyramid or Polaris in Canada, was estimated from 500 µGal to 1000 µGal [10,12]. At Pyramid, the massive ore presented a tabular shape located at near surface (<10 m) within a sedimentary host rock composed of shales, sandstones, and dolostones [12]. The Polaris deposit was made up of massive breccia-fill and veins of Pb–Zn ore in a carbonate environment [50].
A Bouguer anomaly map that was obtained by a minimum curvature interpolation (Figure 10) showed that the anomalies were mostly parallel to the fault planes. They clearly started a little bit to the west of the Poppelsberg East lode. A negative anomaly was even observed along the Poppelsberg West lode and between the two lodes (Figure 10). This anomaly could be because of the presence of the faults f2 and the Southern extension f3, which fractured the rocks and thus decreased the average density, despite the presence of Pb–Zn mineralization. The positive gravity anomaly could have also been because of the normal fault system, which had fractured the majority of the area, but not beyond the Poppelsberg East lode.

5. Discussion and Implications for the Genesis of the MVT Ore Deposit

A schematic conceptual model based on geological, geophysical and metallogenic information is presented in Figure 11. Three extensional faults—f2, f3 and f4—can be interpreted from the ERT profiles (Figure 6) based on the geological information and the genesis of the mining district Pb–Zn ore.
The vertical displacement of f2 was estimated as 35 m minimum on its Southern part, while this displacement of the f3 faults was estimated as 20 m, according to the information from the drillings crossing perpendicularly the extensional faults.
The contrast between the fractured hanging wall (resistivity <100 Ohm·m and low density) and the non-fractured footwall (resistivity >300 Ohm·m and denser) of the f3 fault was interpreted from the ERT tomography. This could have been the cause of the gravity anomaly, such as it was observed in gravity exploration surveys [51,52,53]. The fault f2 was more difficult to interpret on the ERT tomography, but we interpreted its smooth resistivity contrast as a fractured hanging wall with a footwall less resistive than for the f3 fault.
Furthermore, the high offsets of f2 and f3 faults had also reduced the thickness of the Famennian sandstones on the Eastern part of f3 faults, which increased the bulk density of the block, knowing that the Visean limestones (density of 2.68 g/cm3) were located under the Famennian shales/sandstones (density 2.6 g/cm3) [47]. These denser rocks were therefore located closer to the surface and might have also contributed to this positive gravity anomaly. The gravity survey was indeed efficient evidence for graben faulting systems [51,52,53].
The mineralization along the fault f2 (Poppelsberg West) was not clearly visible on the resistivity profile, as opposed on the one along the fault f3 (Poppelsberg East). Anomaly D in Figure 6 had the same low resistivity anomaly as the Northern part of the Poppelsberg East lode, but without being chargeable, it could have corresponded to the track of fault f4. The gravity results cannot be directly linked with the presence of the Pb–Zn mineralization, but with the block faulting system. The small volume of the dense Pb–Zn mineralization (estimated density of 3 g/cm3) was located at the border between the large volume of fractured (density < 2.6 g/cm3) and non-fractured rocks (density 2.6 g/cm3), according to the ERT Profiles 5 to 9 (Figure 6 and Figure 7 and complementary Figure A1). The gravity signature of the mineralization was probably hidden by the signal of these large volumes.
The correlation between the electromagnetic and resistivity/IP anomaly in the Northern part of Poppelsberg East lode was probably caused by the local presence at a relatively shallow depth of the very conductive sulphides, such as pyrite/marcasite within the Pb–Zn ore. The manual auger drilling revealed that the presence of hematite, goethite, and Zn-bearing oxides had originated from oxidation of sulphides.
The 2D modelling of the resistivity and IP data evidenced and confirmed that this anomaly was unlikely to have resulted from the presence of two distinct vertical conductive lodes, but rather from a thin horizontal conductive structure of (here modelled at 4 m) having had the same conductive and chargeability properties, down to a 40 m depth (Figure 12 and Figure 13). This lode was observed on the ERT Profiles 1 to 10 (Figure 6 and Figure 7), but the connectivity between the two lodes was less obvious for the ERT Profiles 7 to 10, which explained the presence of the two separated lodes on the conceptual model (Figure 14). The Pb–Zn mineralization was probably also present in the Southern extension of the Poppelsberg East lode (3 in Figure 14). The geophysical signature was similar to the one in the mineralized area that was confirmed by drillholes, and mineralization was likely to occur in the extension of fault f4 (Figure 1 and Figure 11 in Figure 14).
The location of the modelled Pb–Zn lode, based on the drilling information, could have been corrected using our interpretation of the ERT/IP and EM data. The emplacement of the Poppelsberg East lode was redrawn and the ore deposit extension was re-evaluated (Figure 14). In the Northern part of Poppelsberg East (1 on Figure 14), the resistivity and IP tomography revealed the presence of a lode that could have been the result of an ‘outpouring’ of the Pb–Zn sulphides from the extensional fault, and not because of the presence of two vertical lodes (Figure 12 and Figure 13). This phenomenon had been observed in many MVT ore deposits, such as in the Toussit-Bou Beker mining district (Marocco) [55], in the Reocin deposit (Spain) [56], in the Lisheen deposit (Ireland) [56], and in the former Verviers synclinorium district [17]. The geophysical signal of this lode was similar to the one of the mineralized area that was shown by the drillholes.
The depth of investigation and precise shape of the mineralization were the limitations of the EM and electrical techniques that were used to fully characterize our deposit. The 3D inversion of the ERT data and the addition of prior information (physical properties of the ore) from the drillholes would have allowed the decreased artefacts and uncertainty of the inverted models and a better interpretation of the results. This work was in progress and results will be presented in a further paper. The extra gravity field measurements that were achieved on the Eastern lateral extension of the anomaly, coupled with a 3D gravity inversion, would have allowed verifying that the gravity anomaly was linked with the extensional faults hypothesis that was developed here. Further surveys would be undertaken in the near future.

6. Conclusions

Four geophysical techniques (ERT/IP, gravity, electromagnetic, and magnetic) have been applied on the top of the deposit of Lontzen/Poppelsberg, which was modelled in 3D using drillhole information. It allowed for the characterizing of the geophysical signature of the Pb–Zn deposit and to better target mineralization.
We report here low resistivity and high chargeability anomalies where borehole information intercepts the Pb–Zn sulphides mineralization. We interpret these anomalies as a result of the Fe–Pb–Zn sulphides, which compose the Lontzen–Poppelsberg mineralization. In addition to the borehole data, we supported our hypothesis by a forward modelling and inversion approach, which accounted for geological and borehole information. The conceptual model that results from the interpretation of the geophysical models consists in two main blocks that are separated by an extensional fault. A decreasing density of the Western block is the result of this fracturing and hides the presence of the Pb–Zn mineralization to the gravity survey. Although rarely observed [12,13,20], Pb–Zn MVT mineralization may be of a conductive/chargeable nature because of the presence of pyrite/marcasite which is strongly associated with the Pb–Zn mineralization. The low amount or the absence of these iron-bearing sulphides that are described in boreholes can be evidenced by a (strong) decreasing of the observed conductive signal (Profiles 13 and 14, in Figure 6). The use of the electromagnetic method gives a strong response only in the Northern part of the Poppelsberg East lode. We have interpreted this signature with the presence of pyrite and marcasite with the sphalerite and galena. Where these iron-bearing sulphides are present in low amounts or absent in boreholes, such as in the Southern part of this lode, the EM response is not observed. In other parts of the prospected area, where the mineralization is nearly exclusively composed of sphalerite, no significant anomalies have been evidenced.
The magnetic survey wasn’t efficient to detect the mineralization of Lontzen–Poppelsberg. This failure can be attributed to the absence of ferro-and paramagnetic minerals such as hematite, magnetite and pyrrhotite associated with the Pb–Zn mineralization.
In this case study, geophysics has allowed us to complete and improve the drillings-based 3D mineralization model. The interpretation of these results gave us a better qualitative estimation of the resources and the shape of the mineralization. The surface contour of the modelled lode has been redrawn, taking into account our interpretation of the geophysical signal, such as the presence of a massive conductive sulphide lode in the Northern part of the Poppelsberg East lode.
Despite the fact that the mineralogy of the Belgian MVT ore deposit is very variable from one deposit to another, this study of the Pb–Zn deposit of Lontzen–Poppelsberg could be used as a guide for the future geophysical exploration of the Belgian Pb–Zn deposits, so as to better target them and better understand their genesis. It could also be used in metallogenic research to better characterize the genesis of these deposits.

Author Contributions

M.E., G.D., and E.P., conceived and designed the experiments; T.H. took part to the field campaigns; O.F., M.C., and F.N., analyzed the data; M.E., and F.N., wrote the paper and made the figures. All authors discussed about the results and contributed to the manuscript.

Acknowledgments

Funding for this research was provided by the FRIA (Fonds pour la recherche dans l’ industrie et l’agriculture). We thank Ahmad Allaaeddine, Alexis Guérin, Thomas Krémer, and Sophie Leroy for their help with the geophysical measurements on the field.

Conflicts of Interest

The authors declare no conflict of interest.

Appendix A

Figure A1. On the left: Resistivity results showing DOI 0.1 isolines and drillholes. The rectangles on the drillings represent mineralized area. On the right: IP profiles (normalized chargeability) displaying drillings and mineralized area. Rectangles represent the thickness and location of the Pb–Zn mineralization. The percentage on the right of each profile indicates the proportion of remaining data after data selection (see Figure 4). The white dashed lines represent the DOI limit corresponding to a value of 0.1.
Minerals 08 00233 g0a1

References

  1. Leach, D.L.; Sangster, D.F. Mississippi Valley type lead zinc deposits. In Mineral Deposit Models; Special Paper; Kirkham, R.V., Sinclair, W.D., Thorpe, R.I., Duke, J.M., Eds.; Geological Association of Canada: St. John’s, NL, Canada, 1993; Volume 40, pp. 289–314. [Google Scholar]
  2. Leach, D.L.; Taylor, R.D.; Fey, D.L.; Diehl, S.F.; Saltus, R.W. A Deposit Model for Mississippi Valley-Type Lead Zinc Ores: Chap. A of Mineral Deposit Models for Resources Assessment; U.S. Geological Survey Scientific Investigation Report; United States Geological Survey: Reston, VA, USA, 2010. [Google Scholar]
  3. USGS. ZINC, Mineral Commodity Summaries; USGS: Reston, VA, USA, 2017; pp. 192–193. [Google Scholar]
  4. Zinc Outlook 2018: Will Prices Continue to Rally? Available online: http://investingnews.com/daily/resource-investing/base-metals investing/zinc-investing/zinc-outlook/ (accessed on 8 January 2018).
  5. European Commission. Report on Critical Raw Material for the EU: Report of the Ad Hoc Working Group on Defining Critical Raw Materials, 2014. Available online: http://www.catalysiscluster.eu/wp/wp-content/uploads/2015/05/2014_Critical-raw-materials-for-the-EU-2014.pdf (accessed on 2 November 2017).
  6. IEP on Raw Materials. Available online: https://ec.europa.eu/growth/tools-databases/eip-raw-materials/en/content/european-exploration-project (accessed on 11 November 2017).
  7. Mineral4EU. Available online: http://www.minerals4eu.eu/ (accessed on 11 November 2017).
  8. The Promine Project. Available online: http://promine.gtk.fi/index.php/about (accessed on 9 November 2017).
  9. Blue Mining. Available online: http://www.bluemining.eu/ (accessed on 11 November 2017).
  10. Ford, K.; Keating, P.; Thomas, M.D. Overview of geophysical signatures associated with Canadian ore deposits. In Mineral Deposits of Canada: A Synthesis of Major Deposit Types, District Metallogeny, the Evolution of Geological Provinces, and Exploration Methods; Goodfellow, W.D., Ed.; Geological Association of Canada, Mineral Deposits Division: St. John’s, NL, Canada, 2007; pp. 939–970. [Google Scholar]
  11. Hambleton, W.W.; Lyden, J.P.; Broockie, D.C. Geophysical investigation in the Tri-State Zinc and Lead Mining district. Symp. Geophys. Kansas Kansas Geol. Surv. 1959, 137, 357–375. [Google Scholar]
  12. Seigel, H.O.; Hill, H.L.; Baird, J.G. Discovery case history of the pyramid ore bodies Pine Point, Northwest Territories, Canada. Geophysics 1968, 33, 645–656. [Google Scholar] [CrossRef]
  13. Lajoie, J.J.; Klein, J. Geophysical exploration at the Pine Point Mines Ltd, zinc-lead property, Northwest Territories, Canada. In Geophysics and Geochemistry in the Search for Metallic Ores; Hood, P.J., Ed.; Geological Survey of Canada: Ottawa, ON, Canada, 1979; Volume 31, pp. 653–664. [Google Scholar]
  14. Mutton, A.L. The application of geophysics during the evaluation of the Century zinc deposit. Geophysics 2000, 65, 1946–1960. [Google Scholar] [CrossRef]
  15. Dewing, K.; Turner, E.; Harrison, J.C. Geological history, mineral occurrences and mineral potential of the sedimentary rocks of the Canadian Arctic Archipelago. In Mineral Deposits of Canada: A Synthesis of Major Deposit Types, District Metallogeny, the Evolution of Geological Provinces, and Exploration Methods; Goodfellow, W.D., Ed.; Geological Association of Canada, Mineral Deposits Division: St. John’s, NL, Canada, 2007; Volume 5, pp. 733–753. [Google Scholar]
  16. Paradis, S.; Hannigan, P.; Dewing, K. Mississippi Valley-Type Lead-Zinc deposits (MVT). In Mineral Deposits of Canada: A Synthesis of Major Deposit Types, District Metallogeny, the Evolution of Geological Provinces, and Exploration Methods; Goodfellow, W.D., Ed.; Geological Association of Canada, Mineral Deposits Division: St. John’s, NL, Canada, 2007; Volume 5, pp. 185–203. [Google Scholar]
  17. Dejonghe, L.; Ladeuze, F.; Jans, D. Atlas des gisements plombo-zincifères du Synclinorium de Verviers (Est de la Belgique). Mémoire-Service géologique de Belgique 1993, 33, 1–483. [Google Scholar]
  18. Bishop, J.R.; Emerson, D. Geophysical properties of zinc-bearing deposits. Aust. J. Earth Sci. 1999, 46, 311–328. [Google Scholar] [CrossRef]
  19. Scott, R.L.; Turner, R.; Whiting, T.H. Role of geophysics in exploration for MVT lead-zinc deposits on the Lennard Shelf, Western Australia. Explor. Geophys. 1994, 25, 163–163. [Google Scholar] [CrossRef]
  20. Isles, D.; Watt, M.; Harman, P.; Lebel, A. Geophysical experience from the Blendevale deposit WA. Explor. Geophys. 1987, 18, 108–110. [Google Scholar] [CrossRef]
  21. Buchhorn, I.J. Geology and mineralization of the Wagon Pass prospect, Napier Range, Lennard Shelf, Western Australia. In Geological Aspects of the Discovery of Some Important Mineral Deposits in Australia; Glasson, K.R., Rattigan, J.H., Eds.; Australian Institute of Mining and Metallurgy: Carlton, VIC, Australia, 1986; Volume 17, pp. 163–172. [Google Scholar]
  22. Krahenbuhl, A.; Hitzman, M. Geophysical modeling of two willemite deposits, Vazante (Brazil) and Beltana (Australia). In Proceedings of the 74th SEG Annual Meeting, Denver, CO, USA, 10–15 October 2004. [Google Scholar]
  23. Dejonghe, L. Mineral Deposits of Belgium. Bull. Soc. Belge Géol. 1985, 95, 203–212. [Google Scholar]
  24. Redecke, P.; Friedrich, G. Constraints for sulphides mineralization in the Lower Rhine Basin, Germany. In Source, Transport and Deposition of Metals; Pagel, M., Leroy, O., Eds.; CRC Press/Balkema: Rotterdam, The Netherlands, 1991; pp. 481–484. [Google Scholar]
  25. Dewaele, S.; Muchez, P.; Banks, D. Fluid evolution along multistage composite fault systems at the southern margin of the Lower Paleozoic Anglo-Brabant fold belt, Belgium. Geofluids 2004, 4, 1–16. [Google Scholar] [CrossRef]
  26. Muchez, P.; Sintubin, M.; Swennen, R. Origin and migration pattern of paleofluids during orogeny: Discussion on the Variscides of Belgium and Northern France. J. Geochem. Explor. 2000, 69–70, 47–51. [Google Scholar] [CrossRef]
  27. De Magnée, I. Contribution à l’étude génétique des gisements belges de plomb, zinc et barytine. Econ. Geol. Monogr. 1967, 3, 255–266. [Google Scholar]
  28. Dejonghe, L. Zinc-lead deposits of Belgium. Ore Geol. Revue 1998, 2, 329–354. [Google Scholar] [CrossRef]
  29. Muchez, P.; Heijlen, W.; Banks, D.; Blundell, C.; Boni, M.; Grandia, F. Extensional tectonics and the timing and formation of basin-hosted deposits in Europe. Ore Geol. Rev. 2005, 27, 241–267. [Google Scholar] [CrossRef]
  30. Laloux, M.; Geukens, F.; Ghysel, P.; Hance, L. Carte Géologique de Wallonie Henri-Chapelle-Raeren 43/1-2; Service géologique de Belgique: Bruxelles, Belgium, 2010. [Google Scholar]
  31. Dahlin, T. The development of DC resistivity imaging techniques. Comput. Geosci. 2001, 27, 1019–1029. [Google Scholar] [CrossRef]
  32. Loke, M.H.; Chambers, J.E.; Rucker, D.F.; Kuras, O.; Wilkinson, P.B. Recent developments in the direct-current geoelectrical imaging method. J. Appl. Geophys. 2011, 95, 135–156. [Google Scholar] [CrossRef]
  33. Telford, W.M.; Geldart, L.P.; Sheriff, R.E. Applied Geophysics; Cambridge University Press: Cambridge, UK, 1990. [Google Scholar]
  34. Zonge, K.; Wynn, J.; Urquhart, S. Chapter 9, Resitivity, Induced Polarization, and Compex Resistivity. In Near-Surface Geophysics; Society of Exploration Geophysicists: Tulsa, OK, USA, 2005; p. 36. [Google Scholar]
  35. Sumner, J.S. The induced-polarization exploration method. In Geophysics and Geochemistry in the Search for Metallic Ores; Geological Survey of Canada, Economic Geology Report; Peter, J.H., Ed.; Canadian Society of Petroleum: Calgary, AB, Canada, 1979; Volume 31, pp. 123–133. [Google Scholar]
  36. Oldenburg, D.W.; Li, Y. Estimating depth of investigation in dc resistivity and IP surveys. Geophysics 1999, 64, 403–416. [Google Scholar] [CrossRef]
  37. Marescot, L.; Loke, M.H.; Chapellier, D.; Delaloye, R.; Lambiell, C.; Reynard, E. Assessing Reliability of 2D Resistivity Imaging in Mountain Permafrost Studies Using the Depth of Investigation Index Method; Near Surface Geophysics; European Association of Geoscientists and Engineers: Houten, The Netherlands, 2003; pp. 57–67. [Google Scholar]
  38. Caterina, D.; Hermans, T.; Nguyen, F. Case studies of incorporation of prior information in electrical resistivity tomography: Comparison of different approaches. Near Surf. Geophys. 2014, 12, 451–465. [Google Scholar] [CrossRef]
  39. Geotomo Software. RES2DINV ver. 4.0. Rapid 2-D Resistivity & IP Inversion Using the Least Squares Method; Geotomo Software: Gelugor, Malaysia, 2011. [Google Scholar]
  40. Tikhonov, A.N.; Arsenin, V.A. Solution of Ill-Posed Problems; Winston & Sons: New York, NY, USA, 1977. [Google Scholar]
  41. Claerbout, J.F.; Muir, F. Robust modeling with erratic data. Geophysics 1973, 38, 826–844. [Google Scholar] [CrossRef]
  42. Pierwola, J. Using Geoelectrical Imaging to Recognize Zn-Pb Post-Mining Waste Deposits. Pol. J. Environ. Stud. 2015, 24, 2127–2137. [Google Scholar] [CrossRef]
  43. Frischknecht, F.C. Fields about an oscillating magnetic dipole over a two-layer earth, and application to ground and airborne electromagnetic surveys. Quart. Colo. Sch. Min. 1967, 65, 1–326. [Google Scholar]
  44. Zhdanov, M.S. Electromagnetic geophysics: Notes from the past and the road ahead. Geophysics 2010, 75, A49–A66. [Google Scholar] [CrossRef]
  45. Seigel, H.O. A Guide to High Precision Land Gravimeter Surveys; Scintrex Limited: Concord, ON, Canada, 1995. [Google Scholar]
  46. Chouteau, M. Géophysique Appliquée I: Gravimétrie; Ecole polytechnique de Montreal: Montreal, QC, Canada, 2002. [Google Scholar]
  47. Van Camp, M. Efficiency of tidal corrections on absolute gravity measurements at the Membach station. In IMG-2002 Instrumentation and Metrology in Gravimetry, Cahiers du Centre Européen de Géodynamique et de Séismologie; Centre Européen de Géodynamique et de Séismologie: Luxembourg, 2003; Volume 22, pp. 99–103. [Google Scholar]
  48. Union Minière. Traitement du Préconcentré Gravimétrique du Minerai de Lontzen par Séparation Magnétique à Haute Intensité et Par Milieu Dense; Archives of Union Minière Company: Bruxelles, Belgium, 1984. [Google Scholar]
  49. Coppola, V.; Boni, M.; Gilg, H.A.; Balassone, G.; Dejonghe, L. The “calamine” nonsulfide Zn-Pb deposits of Begium: Petrographical, mineralogical and geochemical characterization. Ore Geol. Rev. 2008, 33, 187–210. [Google Scholar] [CrossRef]
  50. Dewing, K.; Sharp, R.J.; Muraro, T. Exploration History and Mineral Potential of the Central Arctic Zn-Pb District, Nunavut. Arctic 2006, 59, 415–427. [Google Scholar] [CrossRef]
  51. Slowey, E. Technical Report on the Mallow Base Metal Exploration Project, County Cork, Ireland, Rathdowney Resources Limited; 04/10; Rathdowney Resources Limited: Dublin, Ireland, 2010. [Google Scholar]
  52. Carvalho, D.L.; Vidotti, R.M.; Araujo Filho, J.O.; Meneses, P.R. Geology, airborne geophysics and ground gravity of the central graben of Agua Bonita, Brazil. Rev. Bras. Geofis. 2011, 30, 483–494. [Google Scholar] [CrossRef]
  53. Hasanah, L.; Aminudin, A.; Ardi, N.D.; Utomo, A.S.; Yuwono, H.; Kamtomo; Wardhana, D.D.; Gaol, K.L.; Iryanti, M. Graben Structure Identification Using Gravity Method. IOP Conf. Ser. Earth Environ. Sci. 2016, 29, 6. [Google Scholar] [CrossRef]
  54. Loke, M.H.; Barker, R.D. Rapid least-squares inversion of apparent resistivity pseudosections using a quasi-Newton method. Geophys. Prospect. 1996, 44, 131–152. [Google Scholar] [CrossRef]
  55. Bouabdellah, M.; Brown, AC.; Sangster, D.F. Mechanisms of formation of internal sediments at the Beddiane lead-zinc deposit, Toussit mining district, north-eastern Morocco. In Carbonate-Hosted Lead-Zinc Deposits; Sangster, D.F., Ed.; Society of Economic Geologists Special Publication: Littleton, CO, USA, 1996; Volume 4, pp. 356–363. [Google Scholar]
  56. Leach, D.L.; Sangster, D.F.; Kelley, K.D.; Large, R.R.; Garven, G.; Allen, C.R.; Gutzmer, J.; Walters, S.G. Sediment-hosted lead-zinc deposits: A global perspective. Econ. Geol. 2005, 100, 561–607. [Google Scholar]
Figure 1. Petrophysical properties of Pb–Zn sedimentary ore deposits, represented by black rectangles (modified after [18]). Geophysical properties are represented by white rectangles.
Minerals 08 00233 g001
Figure 2. Location of the Belgian Mississippi Valley Type (MVT) ore deposit (top) (modified after [23]) and their formation process (after [23,24,25,26,27,28,29]) (bottom).
Minerals 08 00233 g002
Figure 3. Geology of the Lontzen–Poppelsberg ore deposit showing projection of the drillhole and modelling of the deposit (geological map modified from Laloux et al. [30]).
Minerals 08 00233 g003
Figure 4. Typical chargeability decay curves (Time domain induce polarization (IP)). (A,B) exponential curves type are kept while non-exponential decreasing curves (C,D) type are rejected.
Minerals 08 00233 g004
Figure 5. Depth of investigation (DOI) models for electrical resistivity tomography (ERT) and IP data after processing for Profiles 2 and 10. High reliability areas have DOI lower than 0.1.
Minerals 08 00233 g005
Figure 6. Resistivity results showing DOI 0.1 isolines and drillholes. The rectangles on the drillings represent mineralized area. Colour of these rectangles indicate the distance to the drillholes from the tomographic section, as follows: white rectangles: <10 m; grey rectangles: between 10 m to 20 m; and dark rectangles >20 m. A, B, C, D and E correspond to the anomalies which could be attributed to Pb–Zn mineralization (geological map modified from Laloux et al. [30]). Profiles 11 and 12 were combined in one single profile by juxtaposition.
Minerals 08 00233 g006
Figure 7. IP profiles (normalized chargeability) displaying drillings and mineralized area. Rectangles represent the thickness and location of the Pb–Zn mineralization. Colour of these rectangles indicate the distance of the drillings from the tomographic section, as follows: white rectangles: <10 m; grey rectangles: between 10 m to 20 m; and dark rectangles >20 m. The percentage on the right of each profile indicates the proportion of remaining data after data selection (see Figure 4). The white dashed lines represent the DOI limit corresponding to a value of 0.1. A, B, and C corresponds to the anomalies attributed to Pb–Zn mineralization (geological map modified from Laloux et al. [30]).
Minerals 08 00233 g007
Figure 8. Electromagnetic results on the Poppelsberg East lode. (A) 20 m coaxial, (B) 40 m coaxial, (C) 20 m coplanar, and (D) 40 m coplanar. Ppe—Poppelsberg East lode; Ppw—Poppelsberg West lode.
Minerals 08 00233 g008
Figure 9. Bouguer gravity anomaly after processing of the dataset (geological map modified from Laloux et al. [30]). Units are µGal. The rectangles present on the profiles correspond to the supposed location of the Pb–Zn vein according to the 3D modelling.
Minerals 08 00233 g009
Figure 10. Bouguer anomaly map of the survey area. Gravity data were interpolated using the minimum curvature method with a cell size of 2.5 m2. Ppe—Poppelsberg East mineralization; Ppw—Poppelsberg West mineralization. Circled f2, f3, and f4 correspond to extensional faults. First 300 m of gravity Profile 4 have been removed in this map because they correspond to inconstant measures in swamp area.
Minerals 08 00233 g010
Figure 11. Conceptual model (right down) from gravity and ERT observation along Profile A–B oriented SSW–NNE (geological map modified from Laloux et al. [30]).
Minerals 08 00233 g011
Figure 12. 2D modelling of resistivity data of Profile 2 (1) with Res2DMOD [54]. Inversion of the two parallel lodes model (2) and the horizontal lode model (3) are represented at (2′) and (3′), respectively. As seen in (2′), the only presence of two conductive lodes, as supposed in the 3D model, cannot reproduce the low resistivity anomaly (1). The presence of a horizontal conductive layer between the two vertical lodes (3) is more appropriate to explain the geophysical signature of (1).
Minerals 08 00233 g012
Figure 13. 2D modelling of the IP data in the case of Profile 2 (1) with Res2DMOD [54]. Inversion of the two parallel lodes model (2) and the horizontal lode model (3) are represented at (2′) and (3′). As seen in (2′), the presence of only the two conductive lodes, as assumed in the 3D model, cannot explain the low chargeability anomaly (1). The presence of a horizontal conductive layer between the two vertical lodes (3) is more appropriate to explain the geophysical signature of (1).
Minerals 08 00233 g013
Figure 14. Redrawing of the Pb–Zn lodes at the ground surface using geophysical survey information. Areas 1–3 represent possible extensions of the ore deposit according to geophysical investigation (geological map modified from Laloux et al. [30]).
Minerals 08 00233 g014
Table 1. Characteristics of the Poppelsberg East and West lodes.
Min Depth (m)Max Depth (m)Average Vertical ThicknessAverage % ZnAverage % PbAverage Ag ppmkTons of Ore
Lode West18115.51.758.283.754.9282
Lode East12651.689.50.53.25221
Table 2. Petrophysical properties of minerals and rocks. (1) [48]; (2) [18]; (3) field observation; (4) [48]; (5) [11,14]; and (6) [13].
PropertyMineralizationHost Rocks
Electrical resistivity Pyrite: 3 × 10⁻⁵–1.5 Ohm·m (1)
Chalcopyrite: 1.2 × 10⁻⁵–0.3 Ohm·m (1)
Galena: 3 × 10⁻⁵–300 Ohm·m (1)
Sphalerite: 3.8 × 10¹¹ Ohm·m (2)
Native silver: 1.6 × 10⁻⁸ Ohm·m (1)
Sulphides ore: 10–50 Ohm·m
Famennian sandstones/shales: 50–800 Ohm·m (3)
Tournaisian dolostones: 250–1000 Ohm·m (3)
DensityPb–Zn sulphides: 3–3.5 (4)Famennian sandstones/shales: 2.6 (4)
Tournaisian dolostones: 2.78 (4)
Magnetic susceptibilityIf present,
Magnetite: 10 SI (2)
Pyrrhotite: 0.01–0.5 SI (2)
None (3, 4)
Electrical chargeabilitySulphides ore: 20–200 ms (5, 6)Sedimentary rocks: 5–15 ms (3)

