Article

Transition from Endothermic to Exothermic Dissolution of Hydroxyapatite Ca5(PO4)3OH–Johnbaumite Ca5(AsO4)3OH Solid Solution Series at Temperatures Ranging from 5 to 65 °C

Faculty of Geology, AGH University of Science and Technology, Geophysics and Environmental Protection, al. Mickiewicza 30, 30-059 Cracow, Poland
*
Author to whom correspondence should be addressed.
Minerals 2018, 8(7), 281; https://doi.org/10.3390/min8070281
Submission received: 29 May 2018 / Revised: 23 June 2018 / Accepted: 26 June 2018 / Published: 30 June 2018
(This article belongs to the Section Environmental Mineralogy and Biogeochemistry)

Abstract

:
Five crystalline members of the hydroxyapatite (HAP; Ca5(PO4)3OH)–johnbaumite (JBM; Ca5(AsO4)3OH) series were crystallized at alkaline pH from aqueous solutions and used in dissolution experiments at 5, 25, 45, and 65 °C. Equilibrium was established within three months. Dissolution was slightly incongruent, particularly at the high-P end of the series. For the first time, the Gibbs free energy of formation Δ G f 0 , enthalpy of formation Δ H f 0 , entropy of formation S f 0 , and specific heat of formation C p f 0 were determined for HAP–JBM solid solution series. Based on the dissolution reaction, Ca5(AsO4)m(PO4)3−mOH = 5Ca2+(aq) + mAsO43−(aq) + (3 − m)PO43−(aq) + OH(aq), their solubility product Ksp,298.15 was determined. Substitution of arsenic (As) for phosphorus (P) in the structure of apatite resulted in a linear increase in the value of Ksp: from HAP logKsp,298.15 = −57.90 ± 1.57 to JBM logKsp,298.15 = −39.22 ± 0.56. The temperature dependence of dissolution in this solid solution series is very specific; in the temperature range of 5 °C to 65 °C, the enthalpy of dissolution ΔHr varied around 0. For HAP, the dissolution reaction at 5 °C and 25 °C was endothermic, which transitioned at around 40 °C and became exothermic at 45 °C and 65 °C.

1. Introduction

In the general chemical formula of minerals belonging to the apatite group A5(XO4)3Z, position A represents cations (Ca, Ba, Ce, K, Na, Pb, Sr, and Y), atom X includes P, As, or V and occasionally S or Si. In position Z, several anionic substitutions are possible, mostly F, Cl, Br, I, OH, O, or H2O. Additionally, partial substitution of CO32− in both anionic positions has been commonly observed [1]. Relatively low solubility, high durability, and the accommodation of a wide range of substitutions allow for the application of various apatites to remediation technologies involving immobilization of toxic elements such as Cd, Cu, Pb, U, Ni, Zn, I, Br, or As from polluted water, soil, and waste [2,3,4]. Construction of partly permeable reactive barriers comprising hydroxyapatite is an evolving low-cost remediation technology [5].
Calcium phosphate hydroxyapatite, Ca5(PO4)3OH (HAP), is the primary component of bones and teeth. It is used, among others, as luminophosphor and in the production of phosphate-based fertilizers. Calcium phosphate hydroxyapatite is showing promise for use as a bioceramic material and as a catalyst or sorbent [6]. Ionic substitution for Ca2+, PO43−, and OH in hydroxyapatite (HAP) is relatively extensive. However, our knowledge regarding the properties of apatite solid solutions is still fragmentary. Substitution of AsO43− for PO43− results in formation of phases that are isostructural and isoelectronic with apatite. The end member is an arsenate hydroxyapatite Ca5(AsO4)3OH mineral johnbaumite (JBM). The presence of both arsenates and phosphates in the source aqueous solution may result, under certain conditions, in the precipitation of intermediate phases represented by the general formula Ca5(AsO4)m(PO4)3−mOH. This is a continuous solid solution series [7]. An As ion can replace P in the structure of apatite in bones due to the long-term intake of small doses of arsenic. This can lead to the development of cancer in the human body [8]. Thus, there is a need to better understand the reactions that govern the mobility of As in the environment. Therefore, this research was conducted to determine (1) the effects of As substitution on the solubility of Ca-hydroxyapatites, (2) the effects of temperature on the solubility within Ca5(PO4)3OH–Ca5(AsO4)3OH solid solution series, and (3) to determine the variability of the following thermodynamic properties with temperature for the phases in question: Gibbs free energy of formation Δ G f 0 , enthalpy of formation Δ H f 0 , entropy of formation S f 0 , and specific heat of formation C p f 0 . These new findings will serve as an important source of basic knowledge for future research as well as for applications in bioengineering, water treatment procedures, and management of As-bearing hazardous materials and wastes.

2. Materials and Methods

2.1. Synthesis

The following five phases of HAP–JBM were synthesized using a modified Baker method [9]: (0.0 As HAP) Ca5(PO4)3OH; (1.0 As) Ca5(PO4)2(AsO4)OH, (1.5 As) Ca5(PO4)1.5(AsO4)1.5OH, (2.0 As) Ca5(PO4)(AsO4)2OH, and (3.0 As JBM) Ca5(AsO4)3OH. The synthesis was performed by the dropwise addition of aqueous solutions of Ca(NO3)2, (NH4)H2PO4, and Na2AsHO4∙7H2O. The Ca/(As + P) and (As + P)/OH molar ratios in the mixed solution were maintained at 1.67 and 3.00, respectively. Table 1 presents the concentrations and volumes of the solutions. Pure HAP and samples containing 1.0 and 1.5 As (atoms per formula unit, apfu), were synthesized at 25 °C at a pH between 8.5 and 9.0. The solutions were added dropwise at a rate of 2 mL/min and the pH was maintained using 1 M solution of NH4OH or HNO3. All solutions were prepared with double-distilled water. Pure JBM and a sample containing 2.0 As were synthesized at 65 °C and at pH between 10.0 and 11.5, maintained with a 23% solution of NH4OH [8]. The elevated temperature resulted in better crystallinity of the product. After the synthesis, the suspensions were aged for the next 72 h, centrifuged, and washed once with double-distilled water. After an additional two weeks of aging in water, the suspension was washed five times with water, centrifuged, and air dried.

2.2. Dissolution Experiments

All dissolution experiments were performed in a low solid to solution ratio of 500 mg solid per 250 mL of 0.05 M NH4NO3 background solution in polycarbonate bottles immersed in water bath with thermostatic control (25, 45, and 65 °C) or placed in a refrigerator (5 °C) for 120 days. The bottles were manually stirred at least twice a week. For technical reasons, the dissolution experiment with JBM at 65 °C was terminated prematurely due to providing no results. The initial pH of all solutions was adjusted to 4.5 using 0.1 M HNO3. A 5 mL sample of each solution was withdrawn periodically and filtered using a 0.2 μm polycarbonate filter to remove the suspended solids. The evolution patterns of [Ca], [AsO4], and [PO4] were observed to determine the steady state. The system was considered to be in equilibrium when at least three consecutive samples showed identical concentrations within an experimental error expressed as two standard deviations. The residual solids were recovered at the end of experiment by filtration through 0.2 µm polycarbonate filter, washed with acetone, air-dried, and characterized using powder X-ray diffraction (XRD) and scanning electron microscope with energy-dispersive analyzer (SEM-EDS).

2.3. Analytical Methods

XRD patterns of the precipitates were recorded using a Philips PW 3020 X’Pert instrument (PANalytical, Almelo, The Netherlands) equipped with curved crystal graphite monochromator and Cu radiation at a range of 3°–73° 2θ and a constant step of 0.05° 2θ per second. The end members of the analyzed solid solution were identified using XRAYAN software (version 4.0.5), Rigaku Corporation, Tokyo, Japan) [10] and the International Centre for Diffraction Data (ICDD) powder diffraction patterns database. Lattice parameters were calculated from powder XRD patterns using UnitCell [11] software (1997), University of Cambridge, Cambridge, UK) for the hexagonal crystal system (space group P63/m) based on the position of up to 17 diffraction lines. To determine the chemical composition and morphology of the precipitated solids, FEI QUANTA FEG 200 SEM-EDS (Thermo Fisher Scientific, Waltham, MA, USA) was used. Samples prepared as air-dried powders mounted on metal stubs with double stick carbon tape were imaged at low vacuum with no conductive coating applied. Chemical composition based on average EDS measurements (wt % of oxides) was recalculated to molar content of the elements Ca, As, and P. The infrared (IR) spectra were collected using the Diffuse Reflectance for Infrared Fourier Transform Spectroscopy (DRIFTS) technique (Praying Mantis accessory—Harrick) at Nicolet 6700 spectrometer (Thermo Fisher Scientific, Waltham, MA, USA). This is the method of choice for fine powders due to the simple sample preparation. The diffuse reflectance resulted from the penetration of the incident radiation into the particles and subsequent scatter from the bulk sample. The measurement involved the analysis of IR radiation scattered from the sample, collected by mirrors in an integrating sphere that directed the energy to the detector in the spectrometer. The spectra of the samples (3 wt % sample/KBr) were collected in the range of 4000 to 400 cm−1, with a 4 cm−1 resolution (64 scans). Raman spectra were collected using a DXR Raman microscope (Thermo Fisher Scientific, Waltham, MA, USA) using 10,000 scans at 2 cm−1 resolution with Nd laser YAG at 720 nm.
The concentrations of Ca and As in solution were determined by atomic absorption spectroscopy (AAS) using a SavantAA AAS spectrometer (GBC Scientific Equipment, Braeside, Australia). Concentration of dissolved phosphates was determined by colorimetry using the molybdenum blue method [12]. To avoid interference, As(V) was reduced to As(III) prior to the analysis using a mixture of 20 mL solution containing 2.8 g Na2S2O5 mixed with 20 mL of 0.28 g Na2S2O3 and 10 mL of 0.1 M H2SO4. A HITACHI U-1800 UV-Vis Spectrophotometer (Hitachi High-Tech Science Corporation, Tokyo, Japan) was used to measure the absorbance at 870 nm. An ELMETRON CPI 501 meter and glass electrode (Elmetron Sp.j, Zabrze, Poland) were used for pH measurements.

3. Results

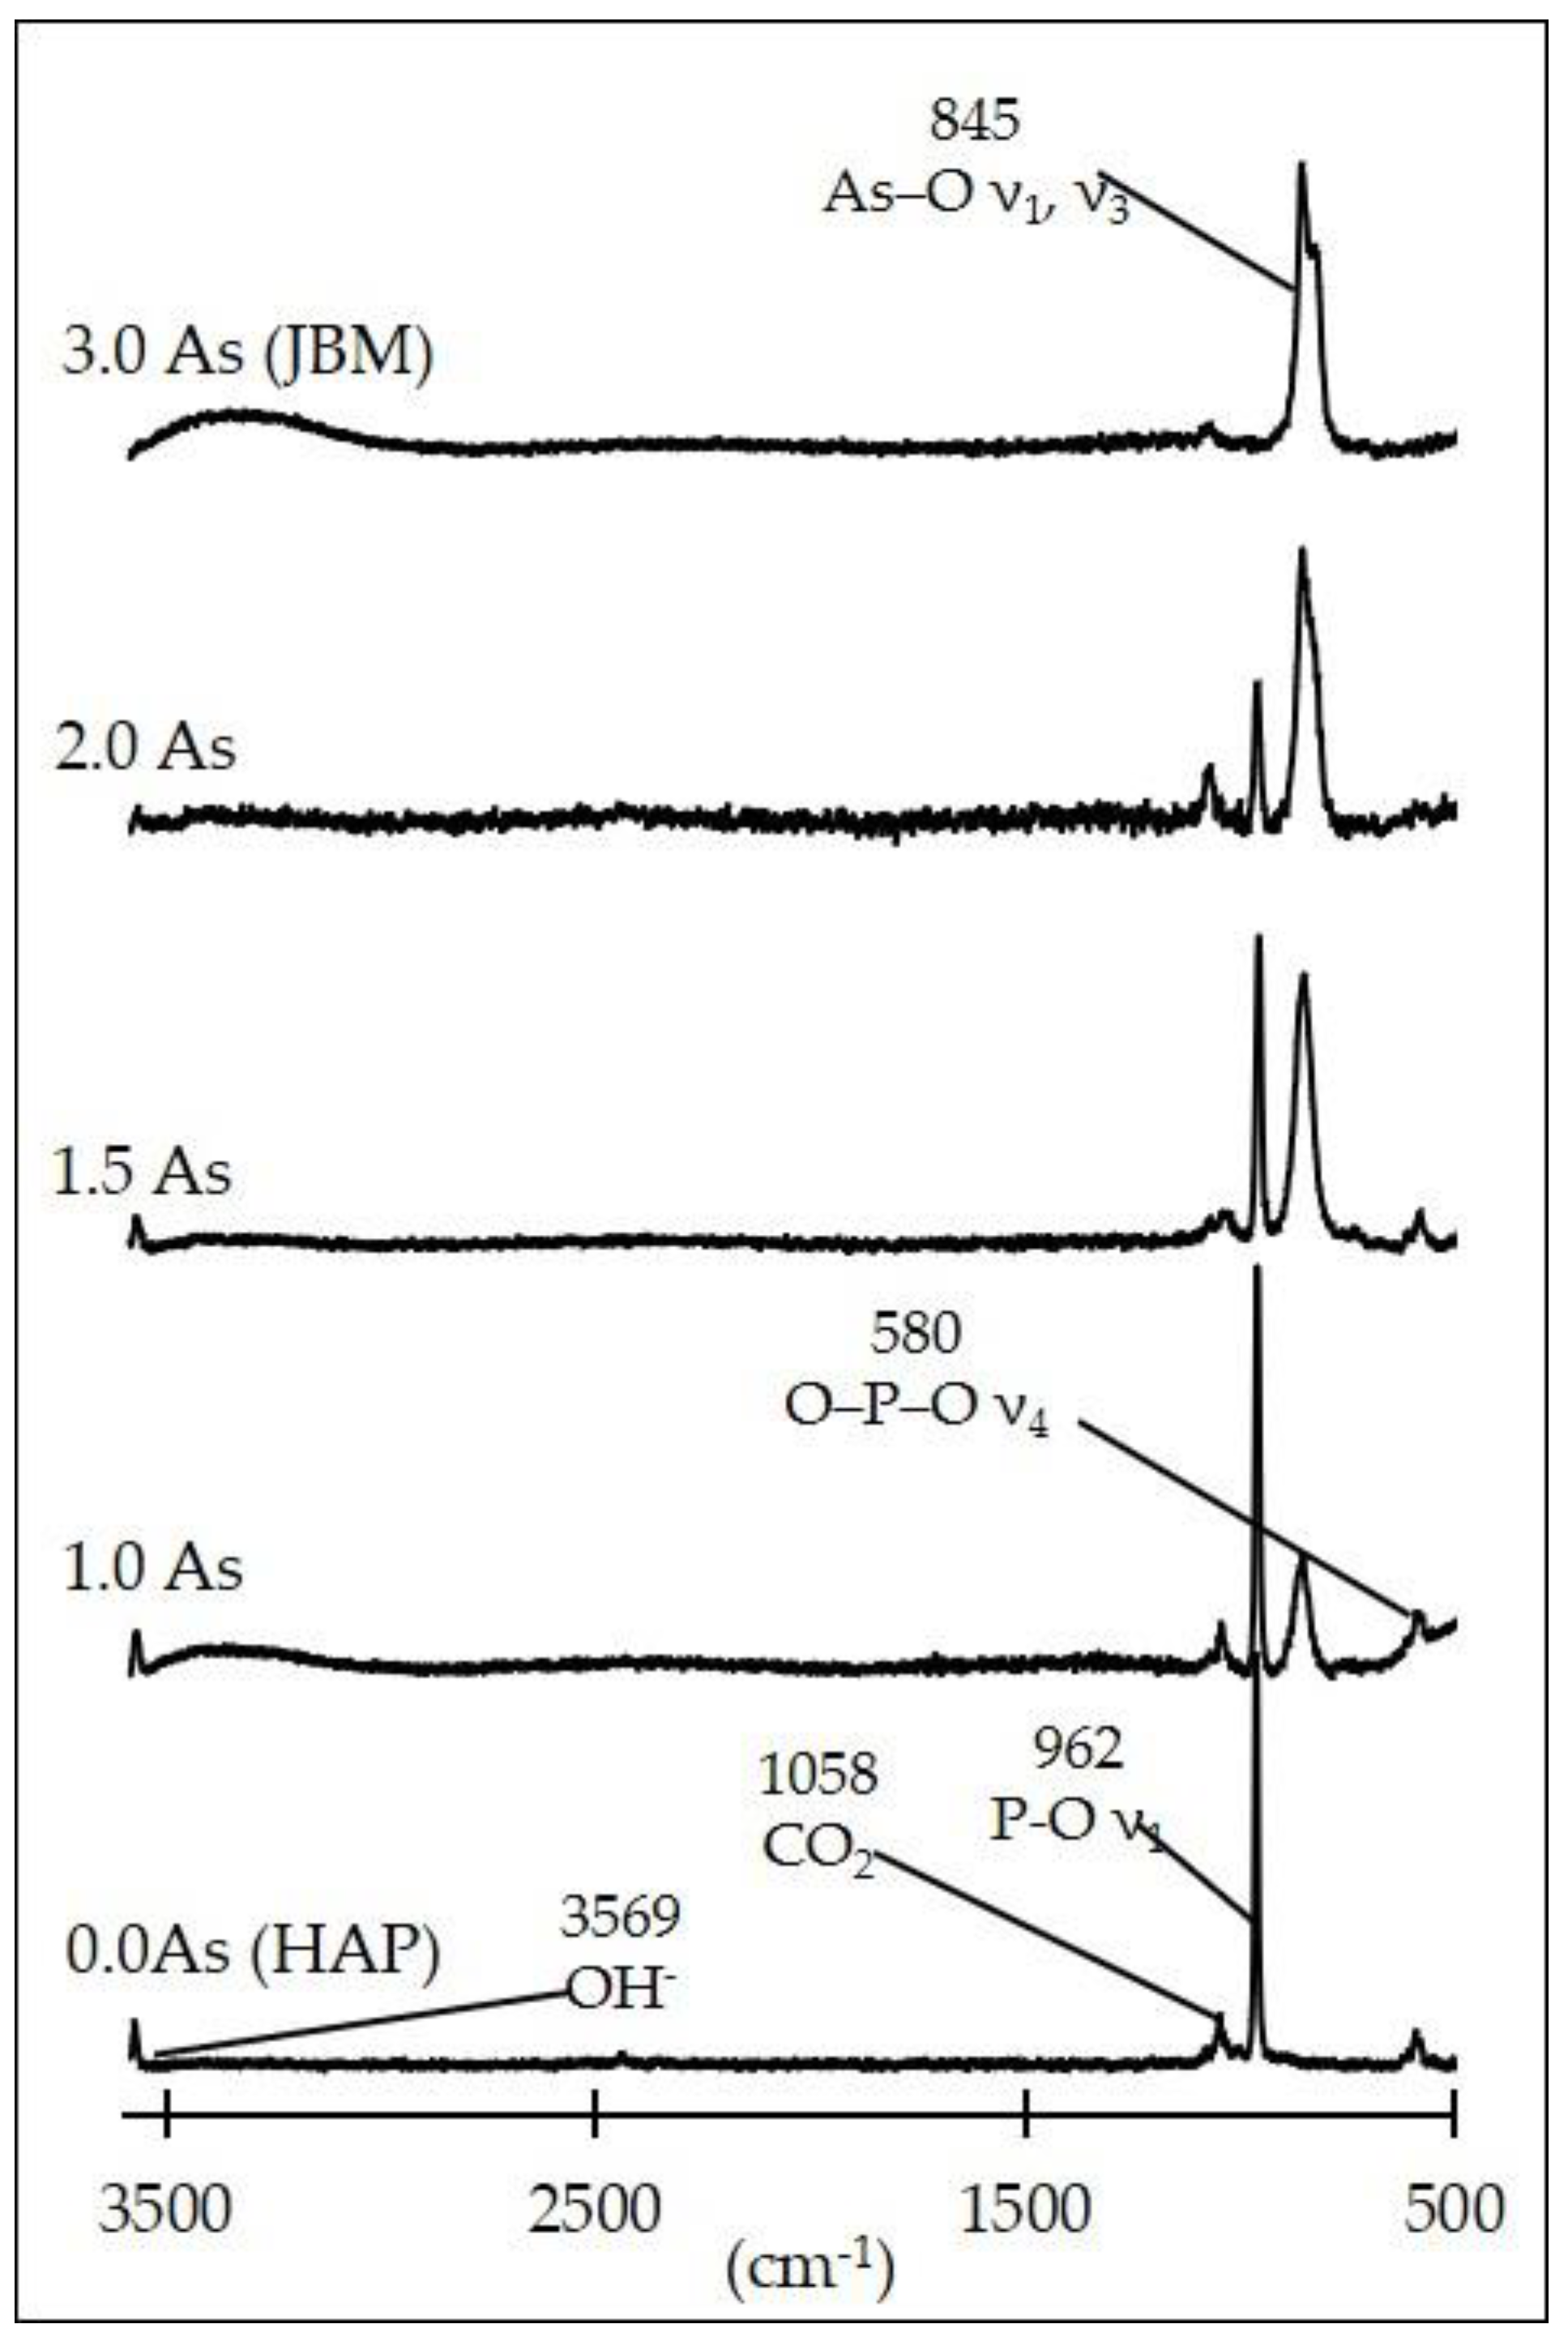
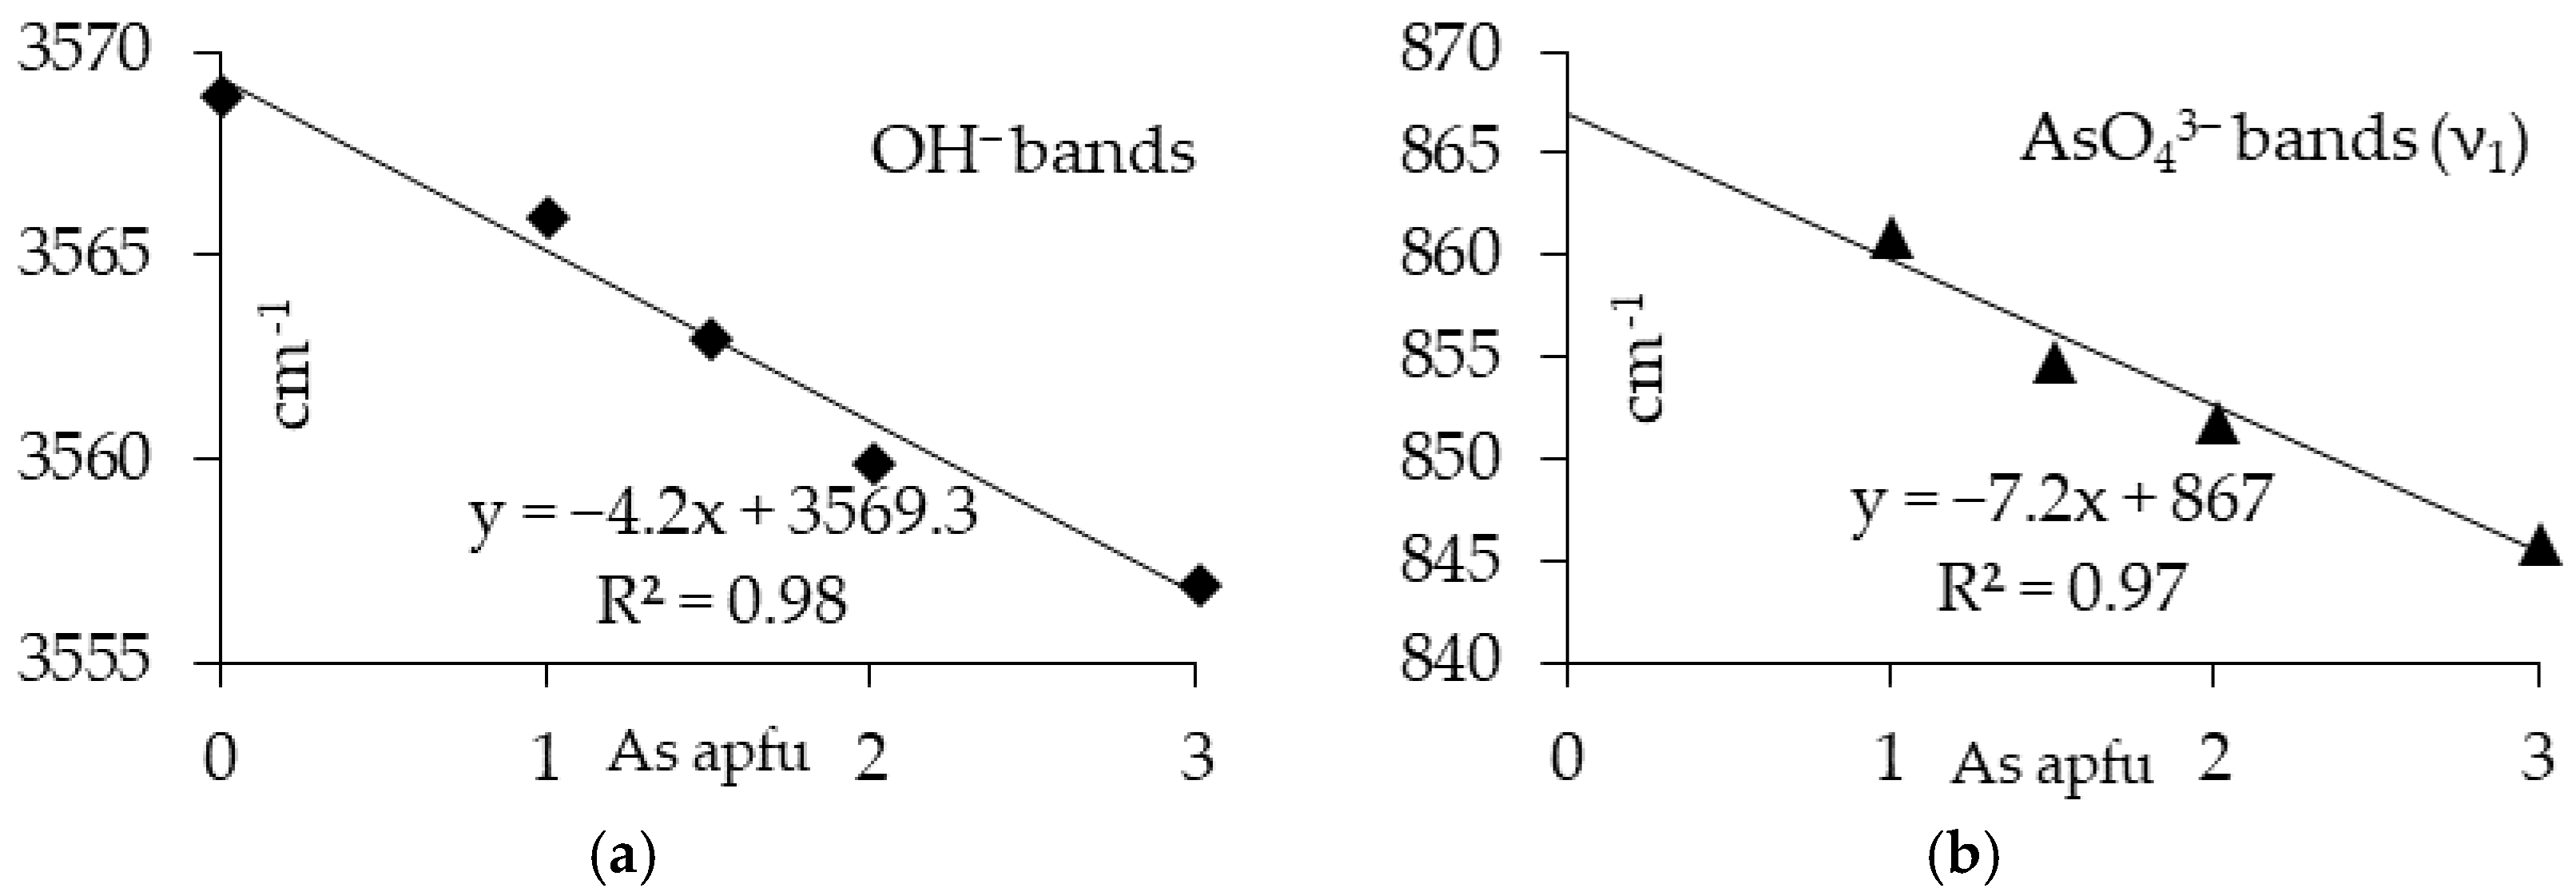
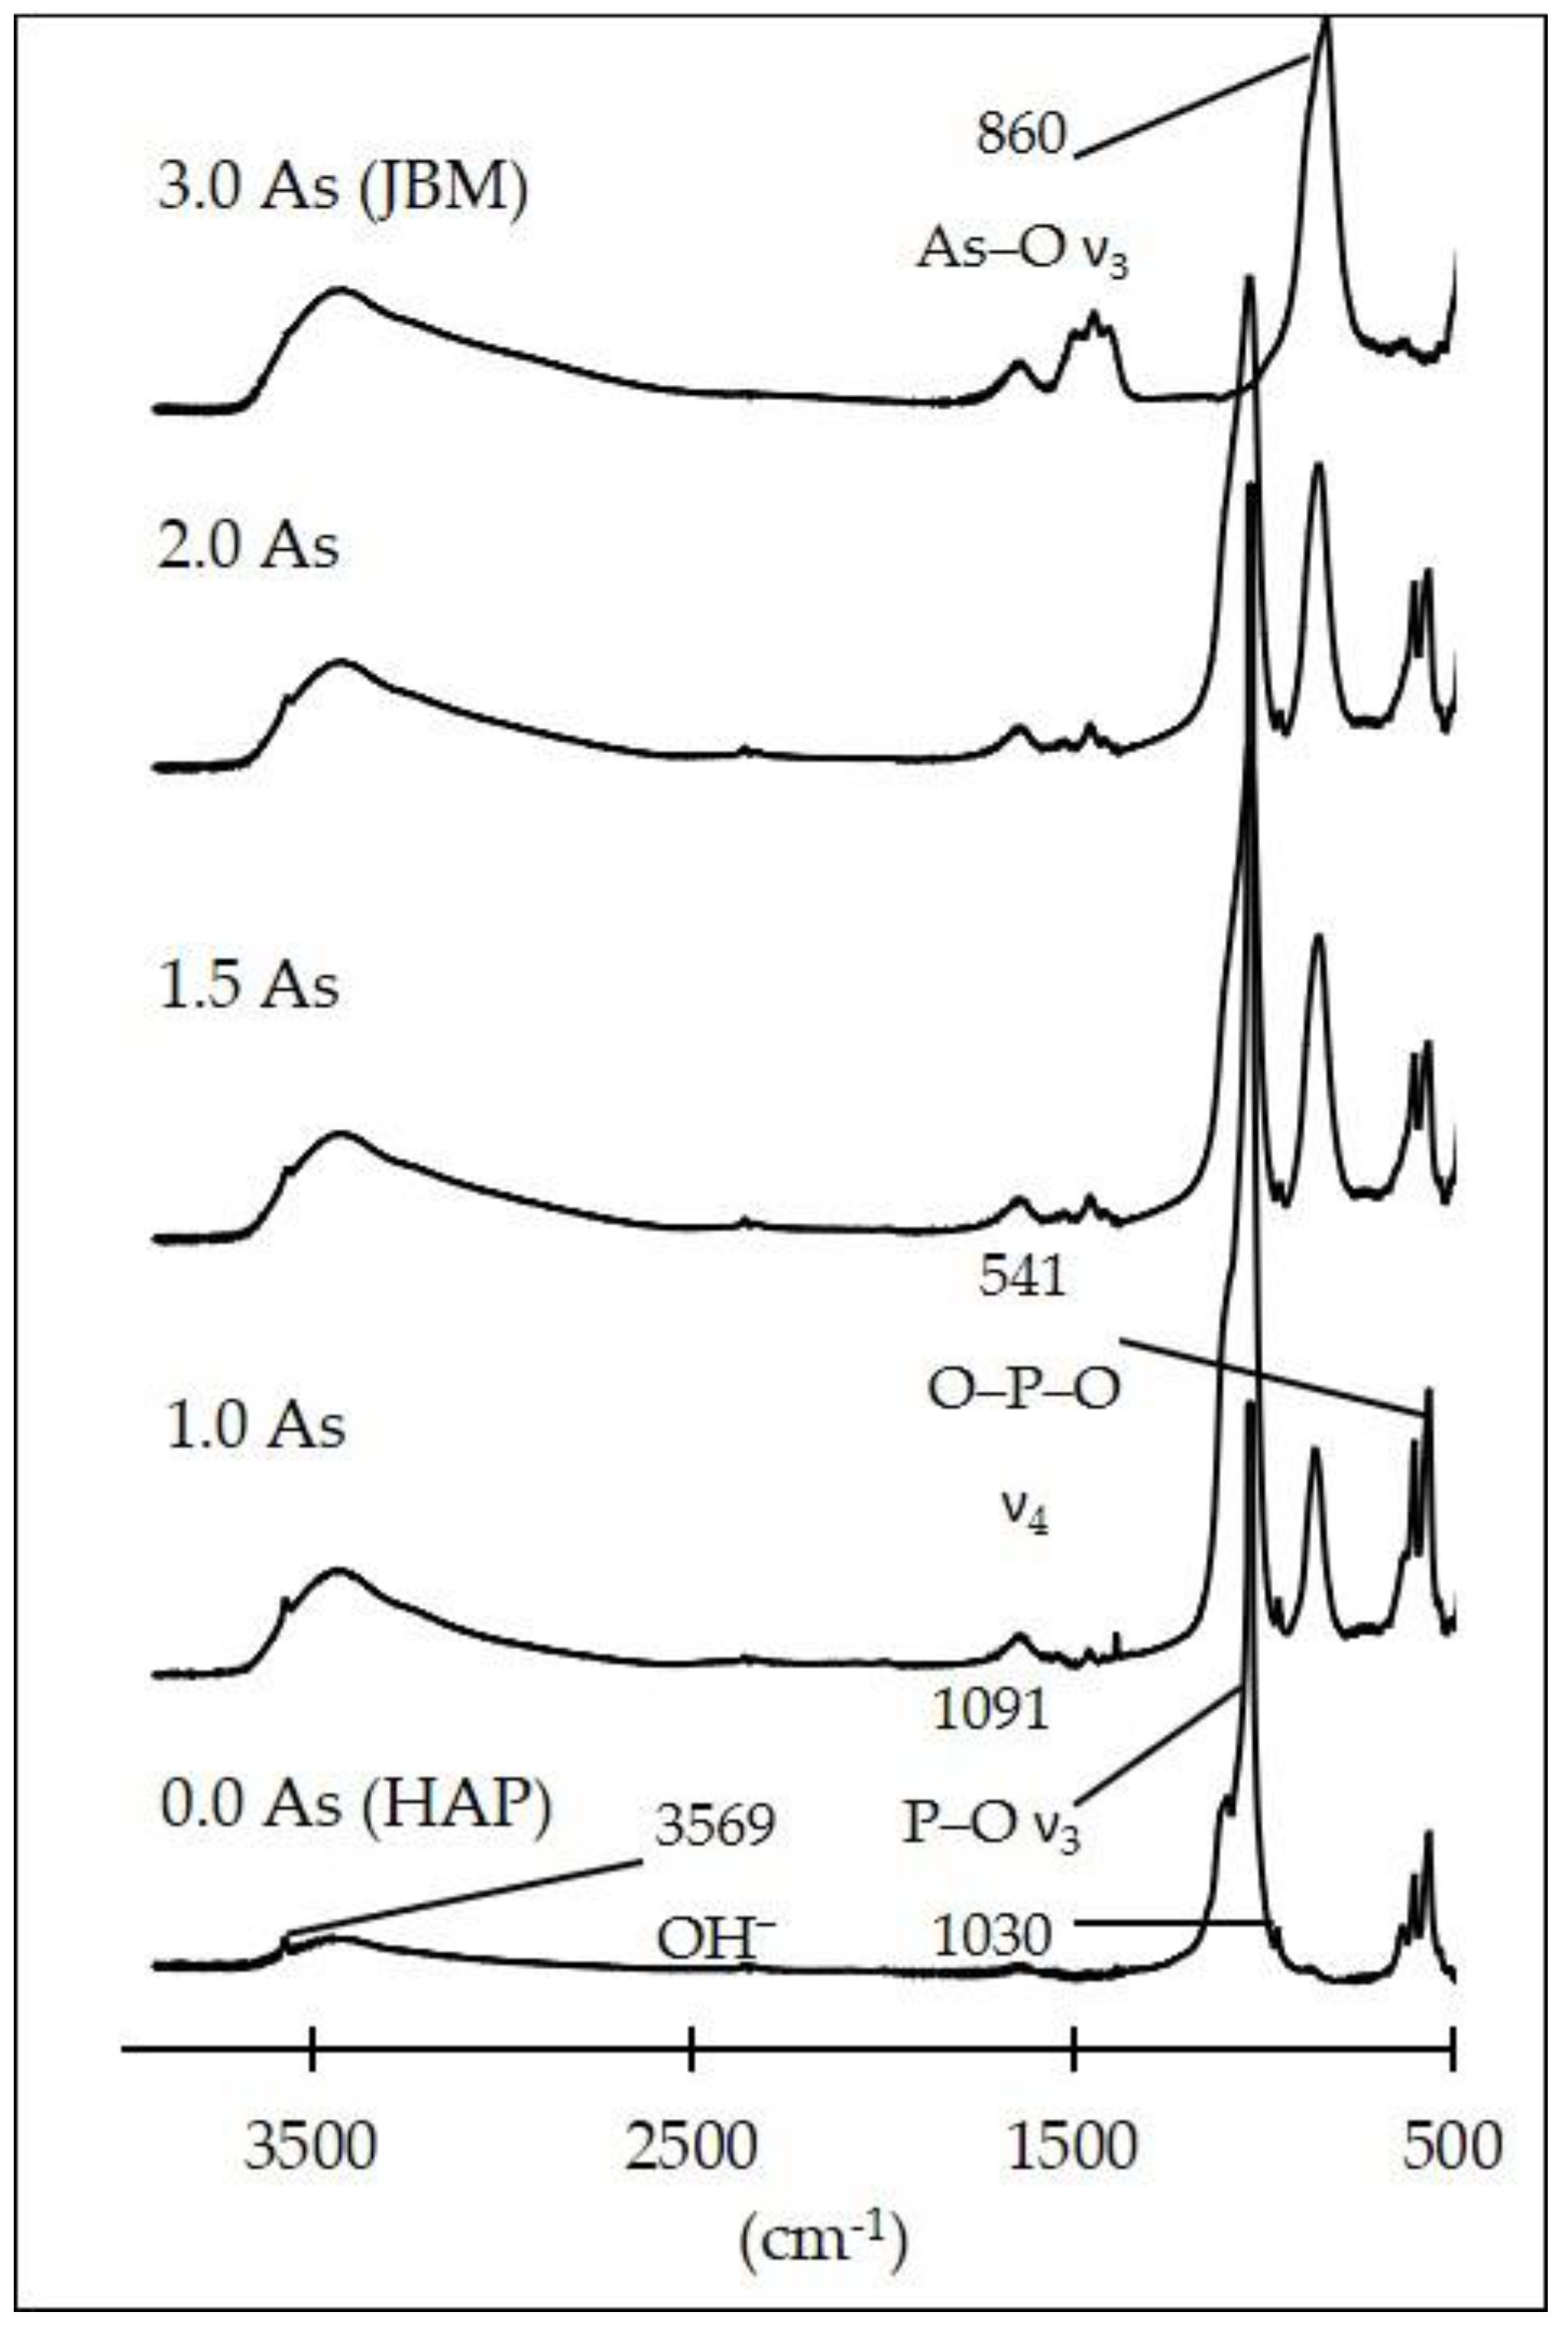
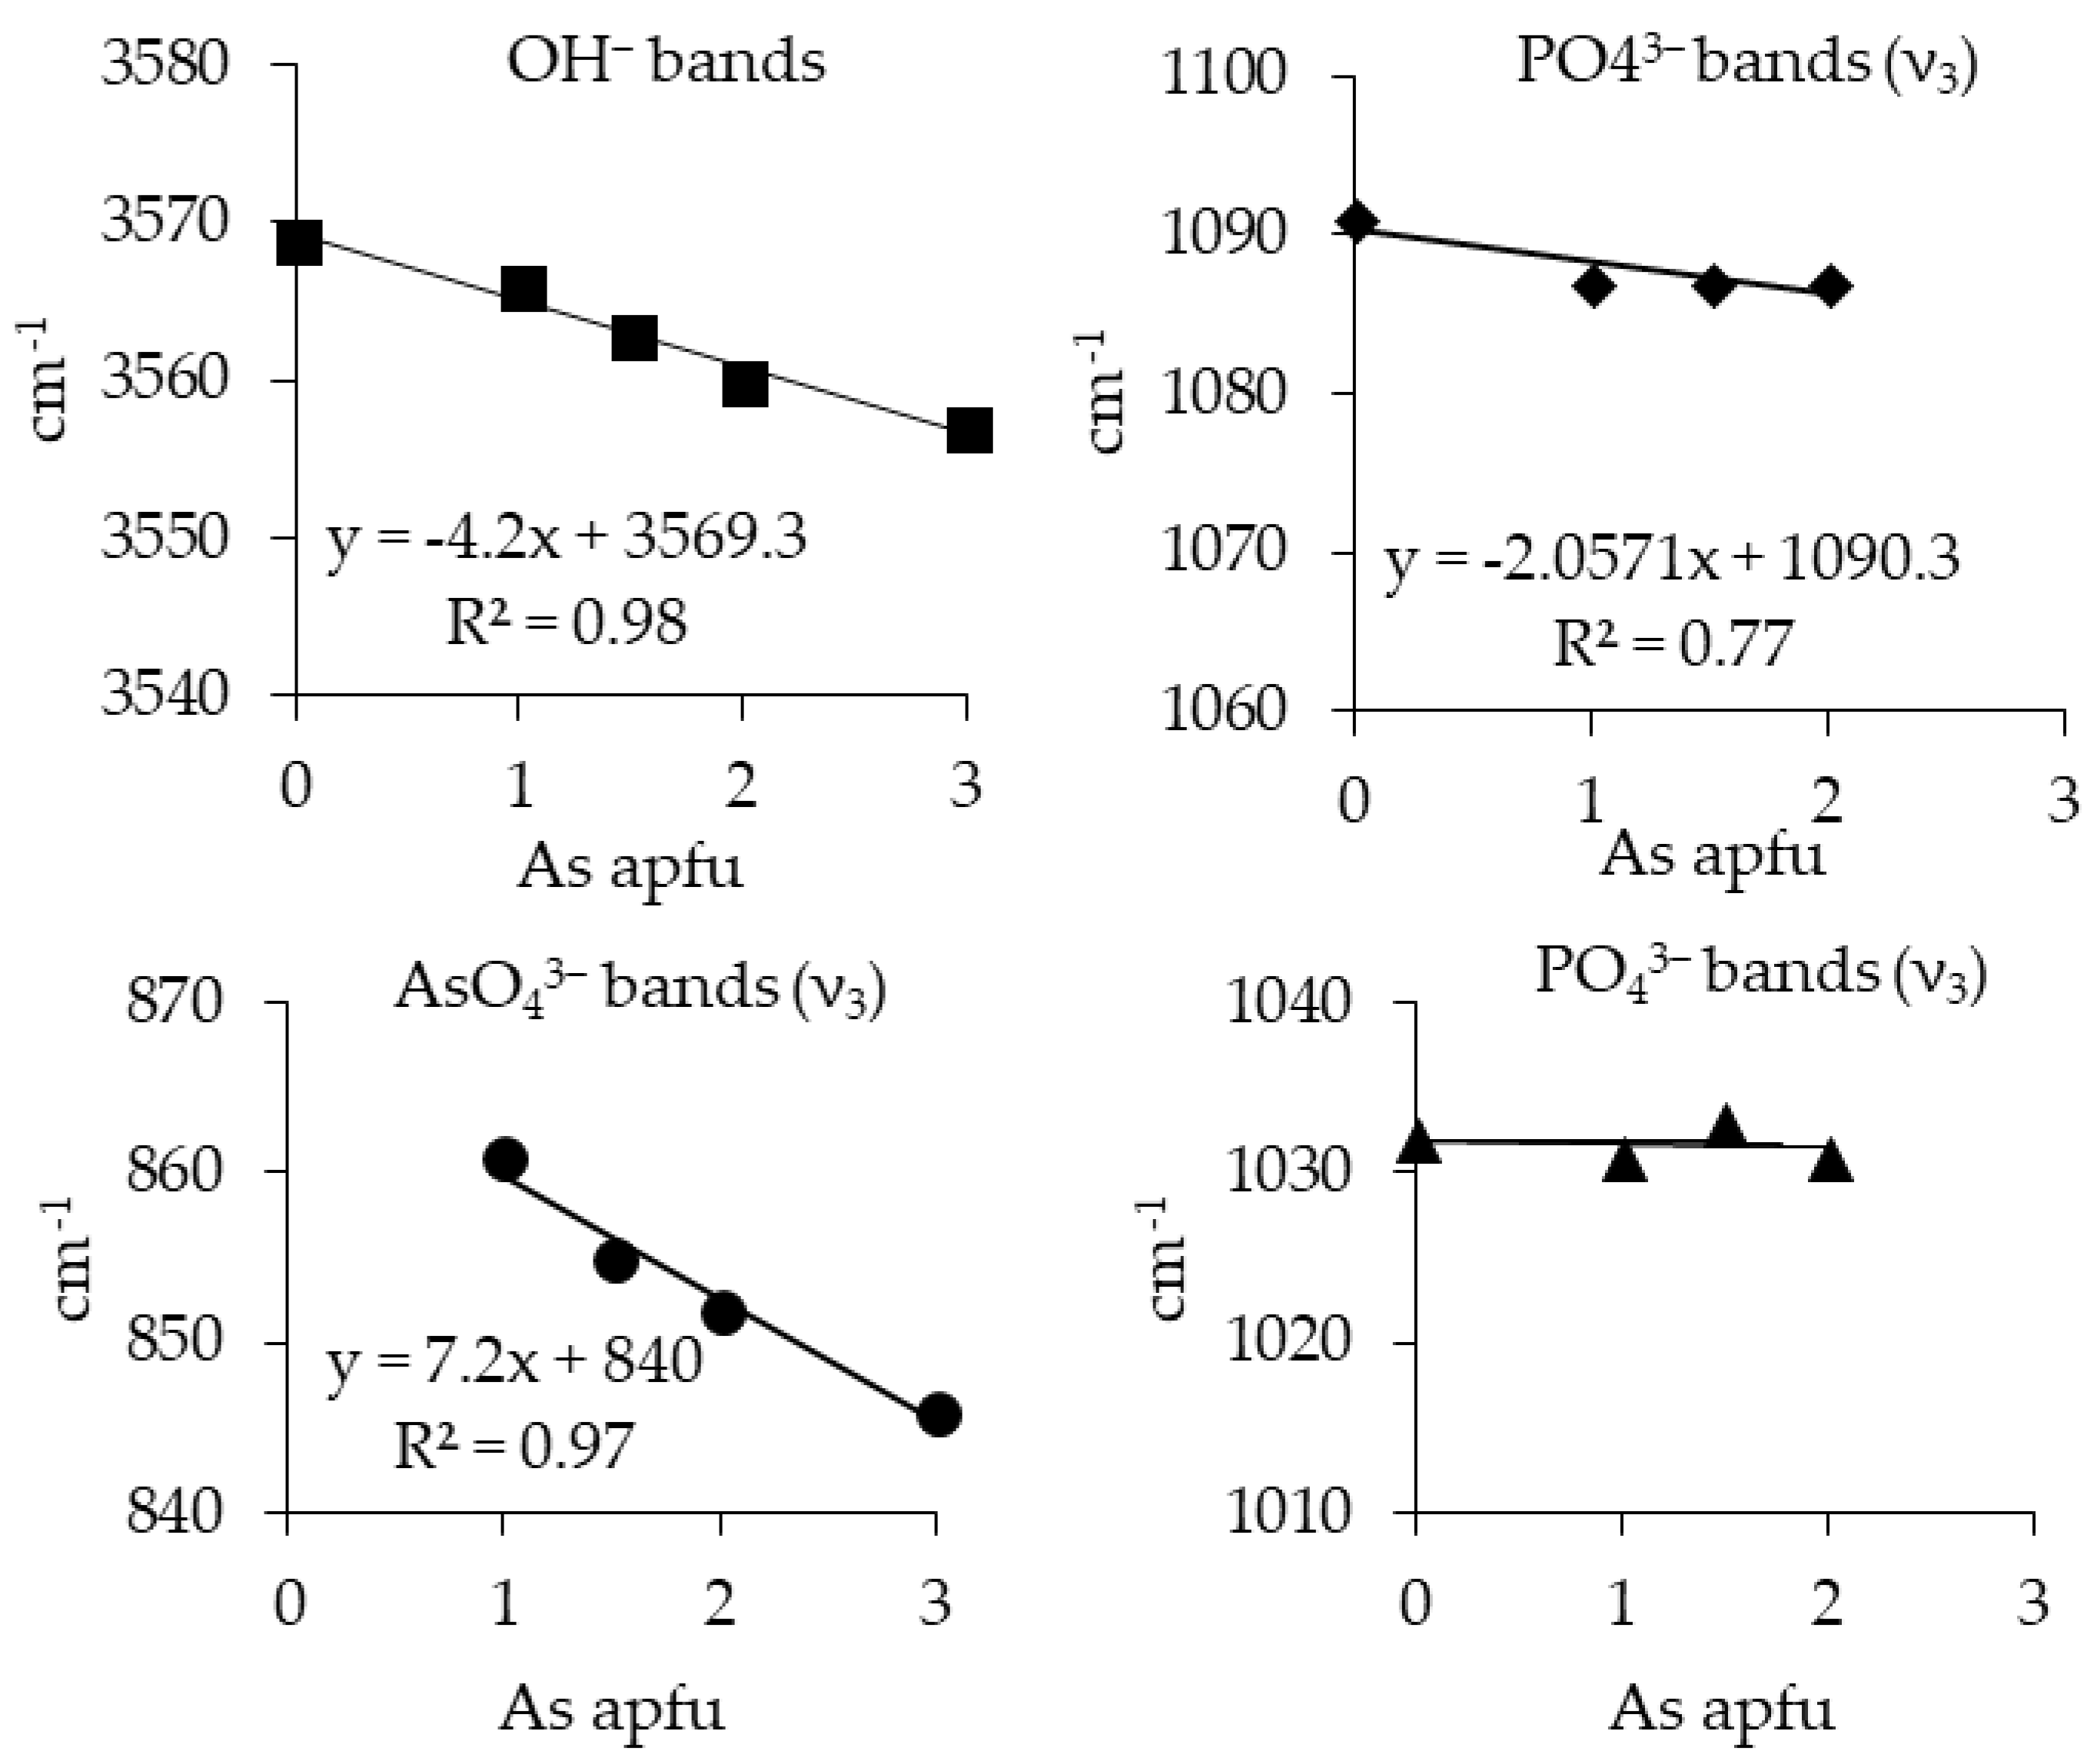
3.1. Characterization of the Synthesis Products

The synthesis resulted in the precipitation of very fine, white, and crystalline powders. SEM imaging indicated that the products were homogeneous aggregates of crystals: only one population of crystals in each sample was apparent in the form of elongated rods (Figure 1). The particles had a maximum size of one µm. A small difference in particle size along the johnbaumite–hydroxyapatite (JBM–HAP) solid solution series was observed; the number of small particles decreased with decreasing P content in the structure. Qualitative and semi-quantitative EDS analysis confirmed the expected chemical composition of each synthetic phase (Table 2). The molar ratio Ca/(As + P) varied from 1.66 to 1.67 and was almost identical to the stoichiometric ratio of 1.67.
The positions of the diffraction peaks (Figure 2) of the end members of the series correspond to HAP (Joint Committee on Powder Diffraction Standards (JCPDS) card number 09-0432) and JBM (JCPDS card number 33-0265). The regular shifting of the position of the peaks toward the higher 2θ values are observed from HAP to JBM with the increase in the content of arsenic in the structure. The position of an intense reflection (211) moved from 31.69° 2θ for HAP to 33.17° 2θ for JBM. The observed systematic shift in the XRD lines reflects the systematic changes in the geometry of the unit cell resulting from the substitution of the AsO43− for the PO43− anion. The values of the unit cell parameters and the volume of the unit cell decreased slightly with the increasing content of AsO4 (Figure 3). The trends in these changes were linear, which is consistent with the literature [13,14,15]. Figure 4 shows the position of the Raman bands for all synthetic phases. The most intensive band in the HAP spectrum (962 cm−1) corresponds to the nondegenerate symmetric P–O stretching vibration ν1; whereas in the JBM spectrum, the highest band (845 cm−1) corresponds to both ν1 and ν3 modes of As–O bond [8,16]. The peak around 580 cm−1 probably results from ν4 vibrations of the O–P–O bonds [16]. The band attributed to the OH mode is apparent between 3557 and 3569 cm−1. The small peak in the range of 1055–1058 cm−1 most likely corresponds to the vibrations of the CO32− molecules. Small amounts of CO2 dissolved from the air are usually incorporated into the structure of synthetic calcium apatites synthesized from aqueous solutions open to the air [17]. Figure 5 shows the variations in the average positions of major AsO43 and OH bands. The positions of these bands in the Raman spectra depend linearly on the content of arsenates being shifted to lower wave numbers with the increasing substitution of AsO43 for PO43. This shift probably results from the decreasing strength of the X–O bond (where X = P or As) and the higher atomic mass of As than P. The As–O bond is longer and weaker than that of P–O due to the larger ionic radius: 0.46 Å for As5+ and 0.17 Å for P5+ [18]. In contrast, the shift in the Raman bands attributed to P–O vibrations was irregular; we could not determine the reason for this behavior.
The IR spectra of apatites have been investigated by many authors [2,18,19,20,21,22,23,24]. The most intense absorption bands observed in the spectra are derived from PO4 and AsO4 (Figure 6). The vibrational spectra of P-apatites exhibit modes v1 in the range of 932 to 913 cm−1, v3 in the range of 1091 to 953 cm−1, and v4 in the range of 595 to 541 cm−1 [25]. In turn, the As-apatite spectrum exhibits v1 modes between 817 and 806 cm−1, v3 mode between 860 and 747 cm−1, and v4 mode between 424 and 369 cm−1 [23]. The OH stretching mode in apatites can be detected in the 3500–3600 cm−1 range [2]. Both the position of these bands and their intensity vary according to the chemical composition and isomorphic substitutions. Some of the bands are more sensitive to substitution than others. The increase in the content of As substituting for P in HAP results in a slight shift of PO4 absorption bands toward the lower wave numbers and a much more pronounced shift in the OH vibration modes. The trend in the variation was linear with the increase in the molar content of As (Figure 7). The band position recorded for the OH group shifts linearly in a similar manner as the band derived from PO4, from higher wave numbers in HAP (3569 cm−1) to lower in JBM (3555 cm−1). All the SEM-EDS results, along with XRD and spectroscopic data, confirm the absence of impurities in the synthesis products within the detection limits of the methods.

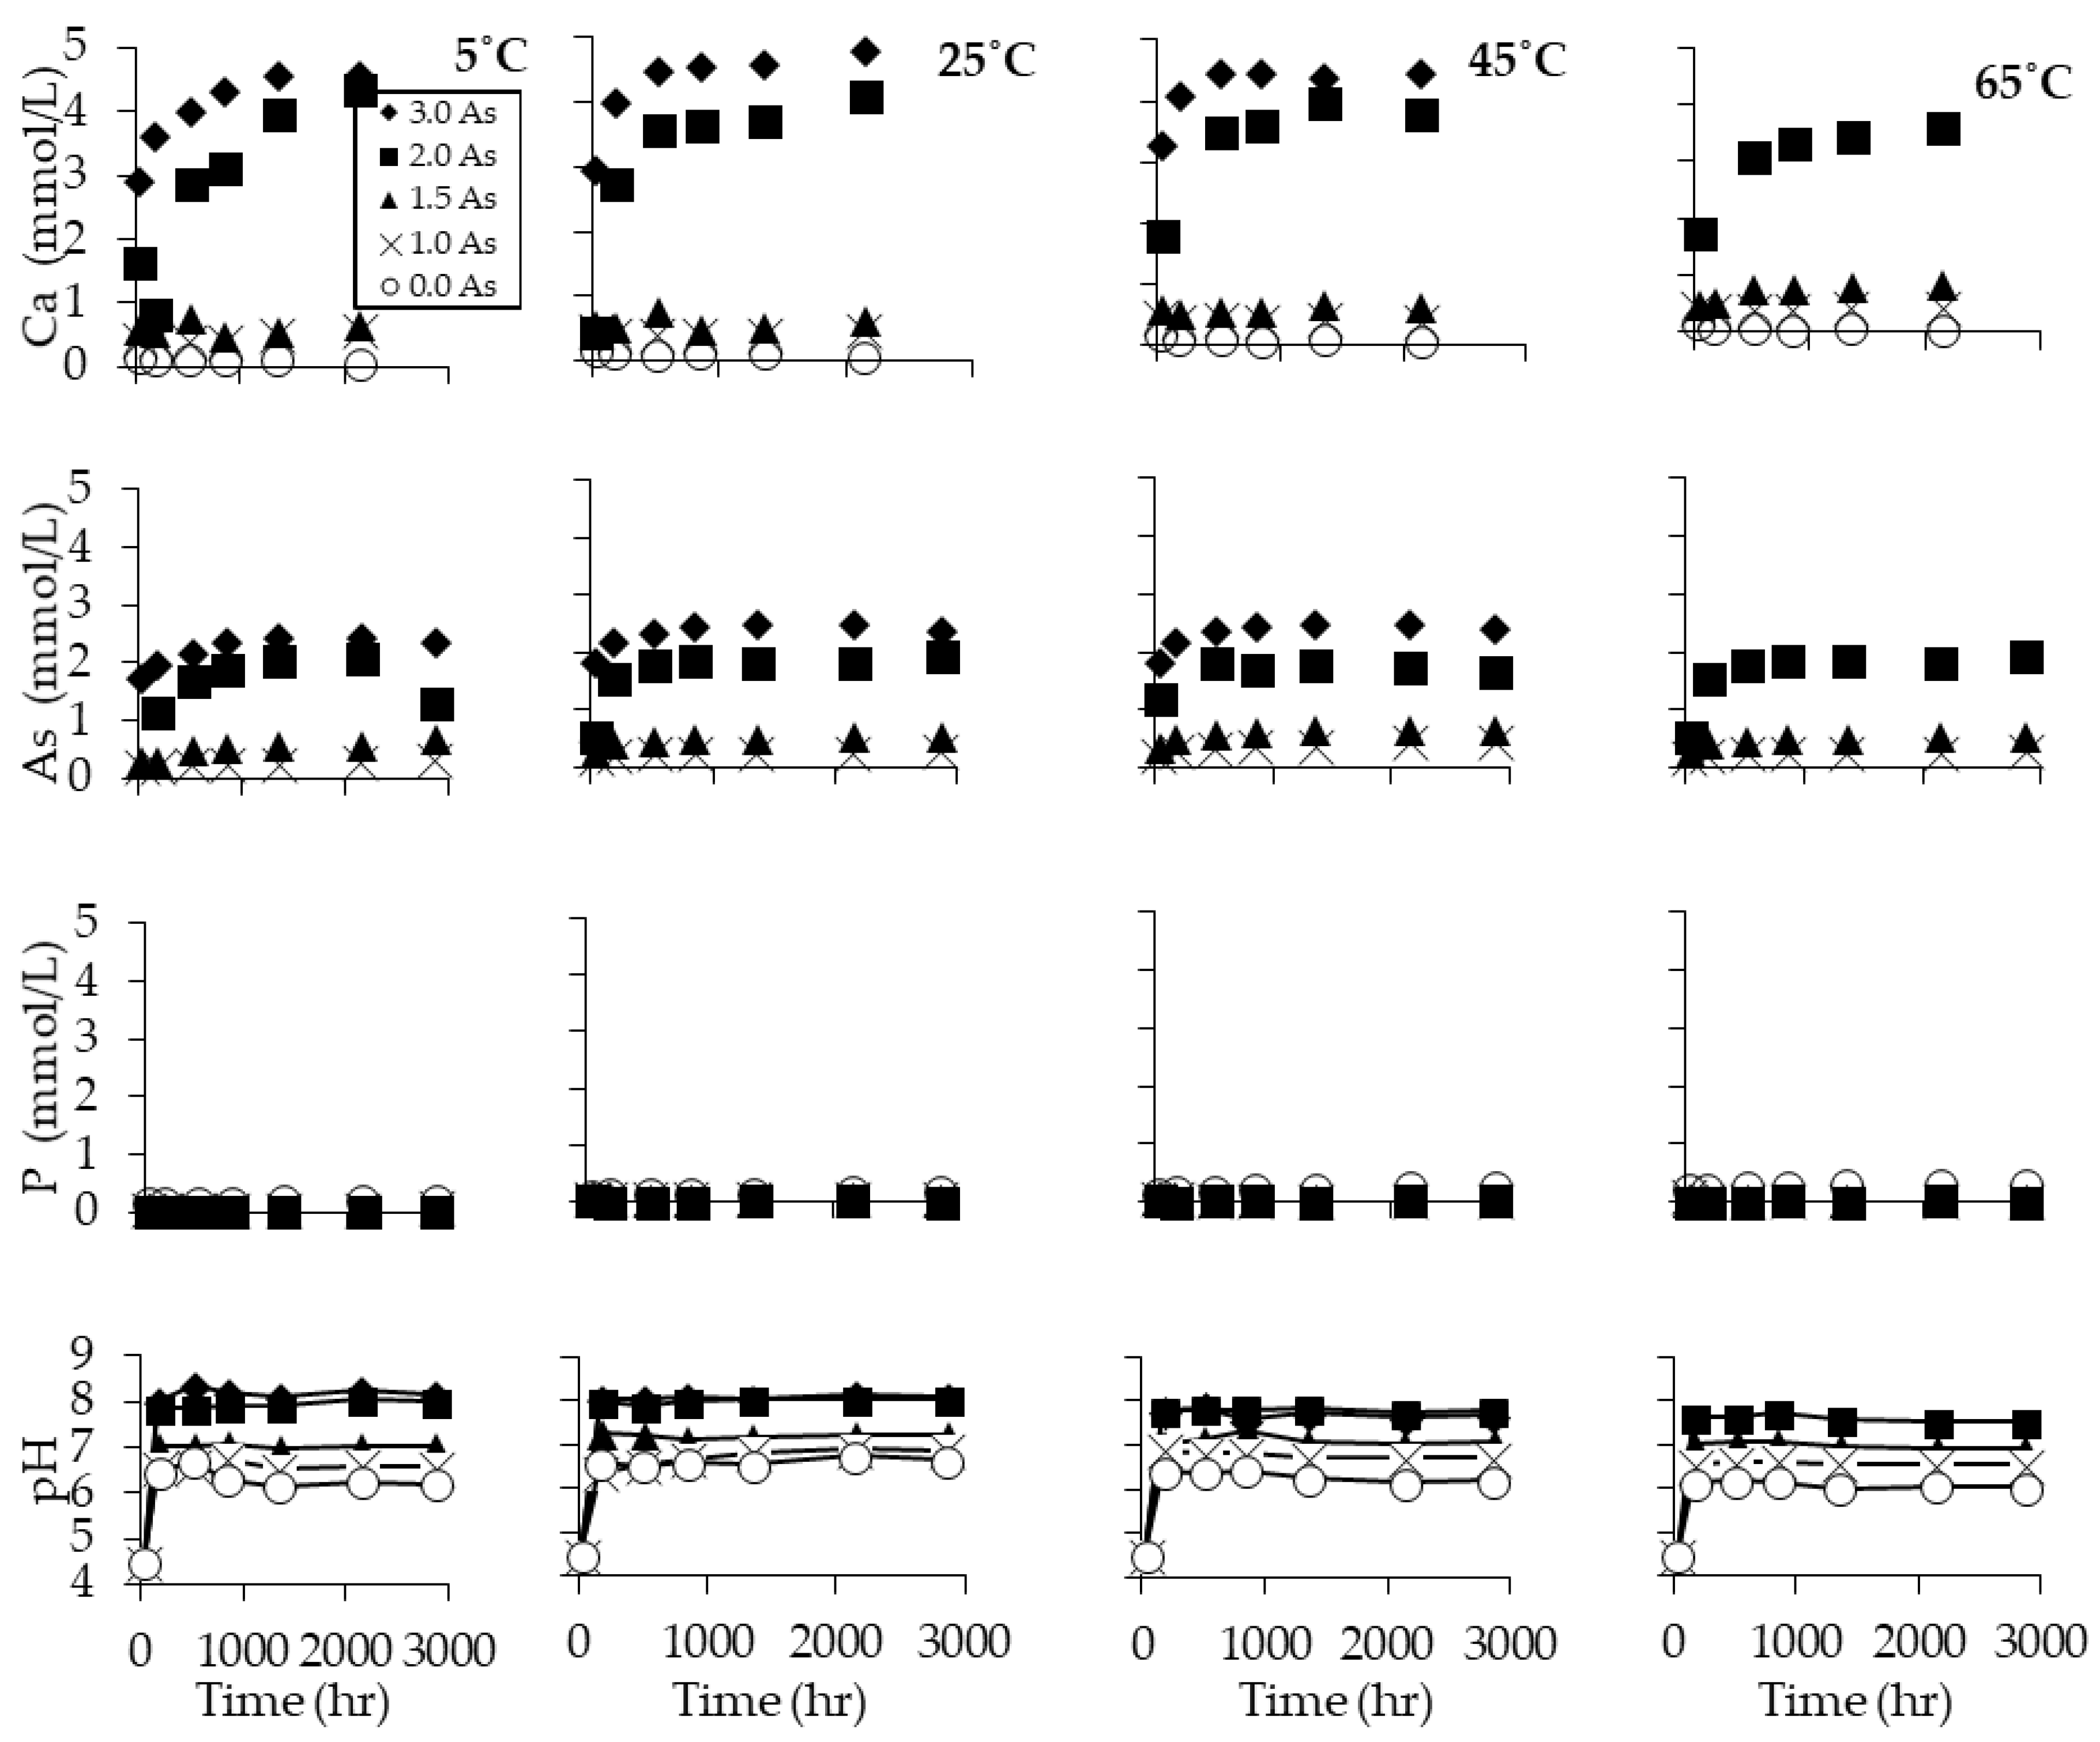
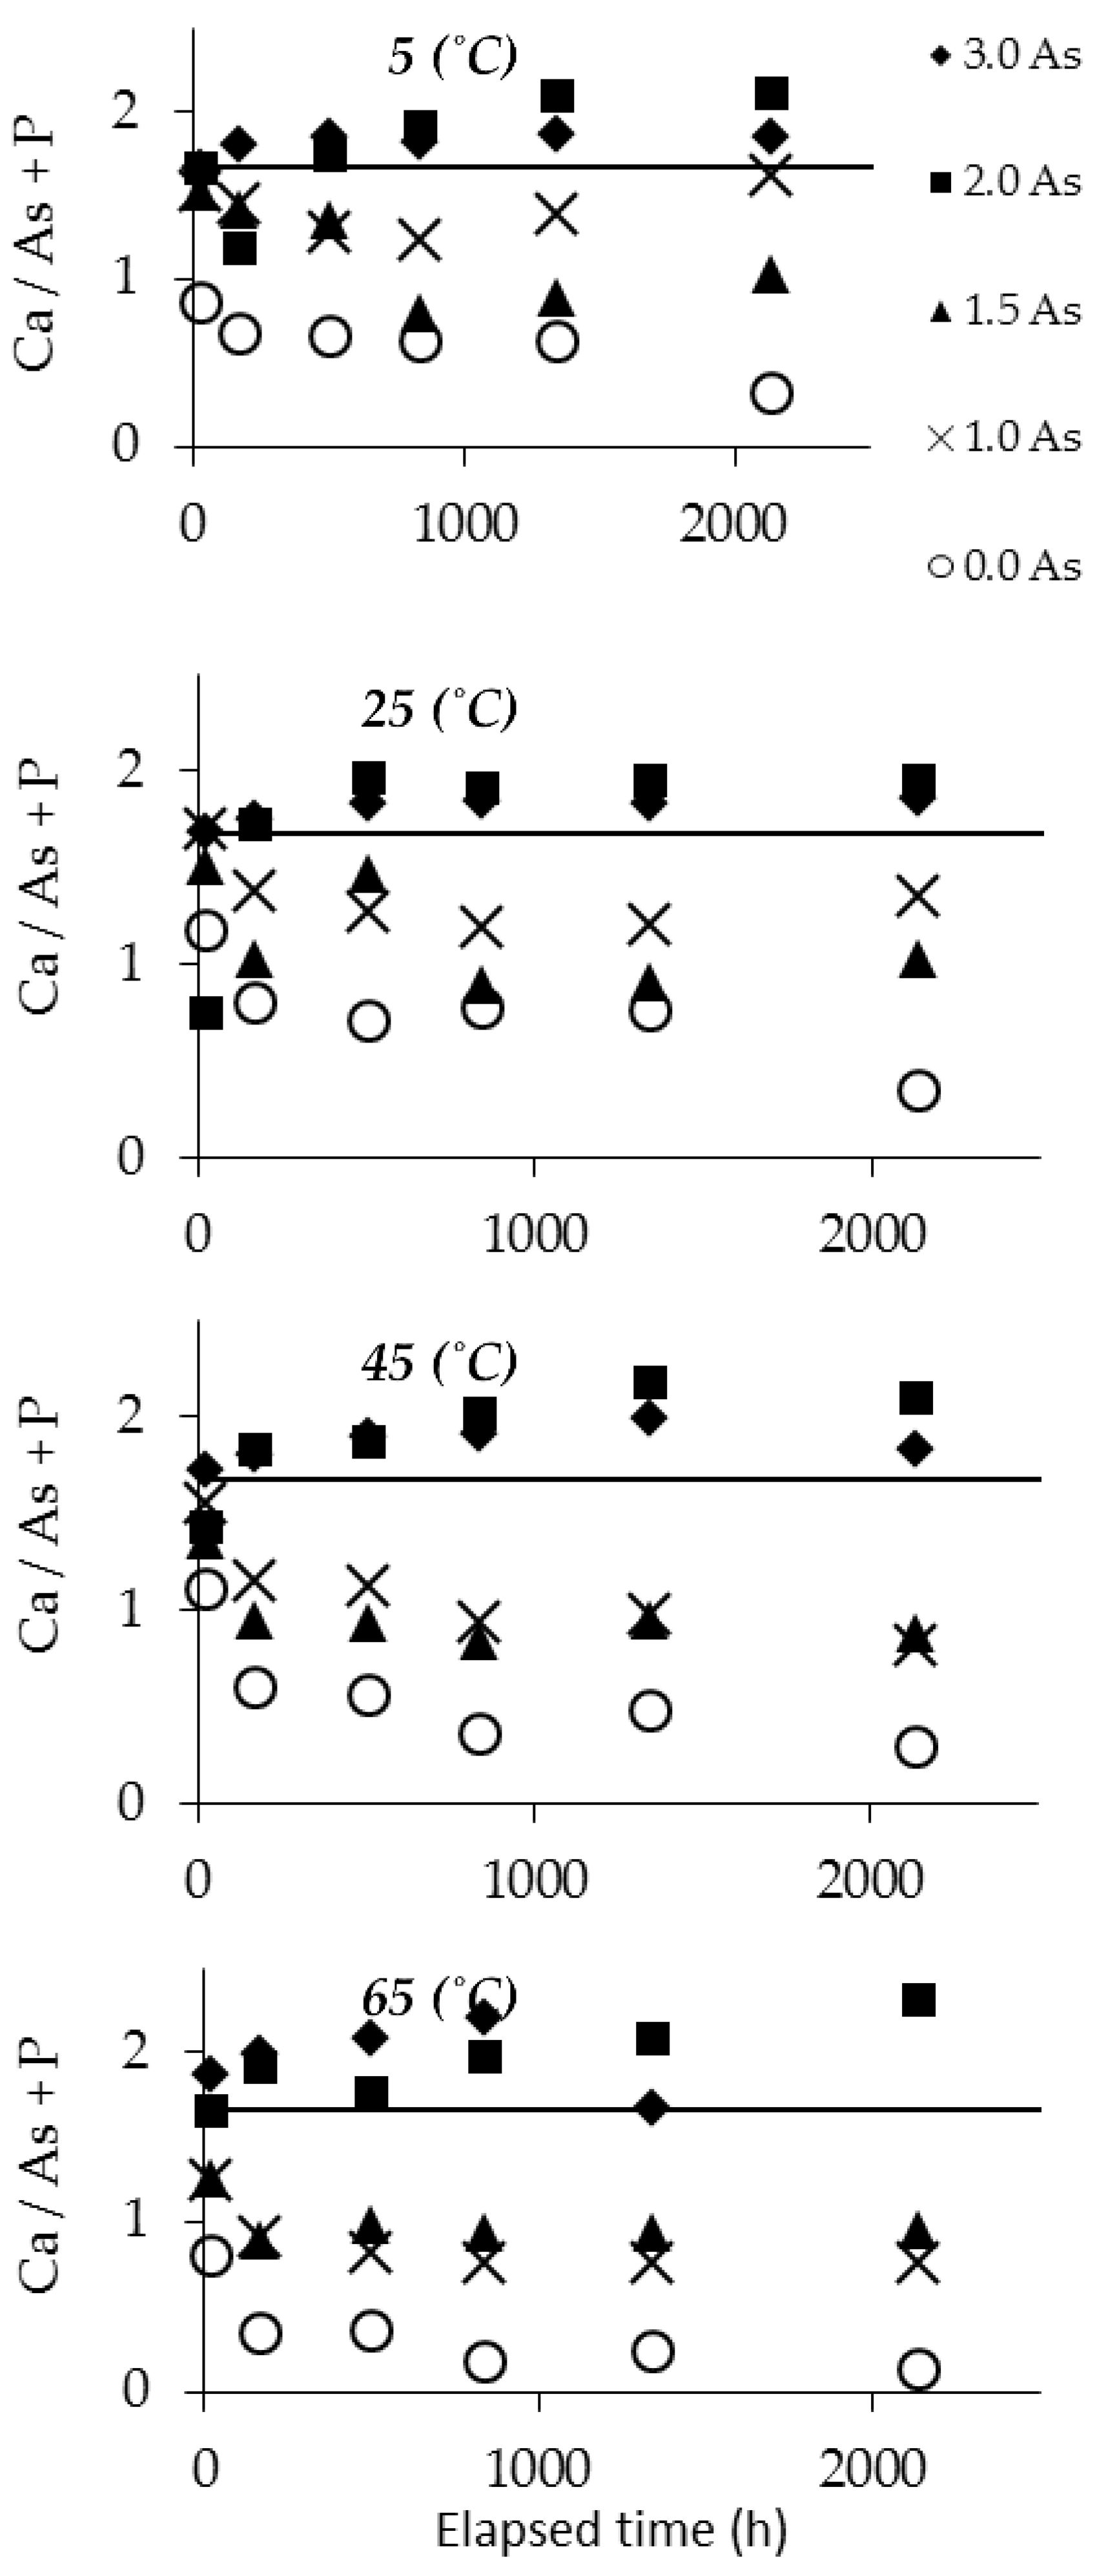
3.2. Dissolution Experiments Results

SEM-EDS analysis of the solids before and after the dissolution experiment indicated slight recrystallization resulting in the increase in crystal size (Figure 1). Sporadically, the presence of secondary products was apparent in the sediment after the experiment. The aggregates of crystals exhibiting plate morphology were distinctly different from the hexagonal needles of the primary apatite precipitates. This was apparent only within the As-rich phases. The morphology may be consistent with CaHAsO4. This indicates slightly incongruent dissolution during the experiment. However, the identification of secondary phases was unsuccessful during this stage of research.
Figure 8 illustrates the changes in pH of the solution and the evolution of aqueous concentrations of Ca, P, and As versus time. The pH of all systems increased rapidly during the initial stages of the experiment and then leveled. The final pH depended on the chemical composition of the dissolved solids rather than on temperature. The final pH of JBM and HAP were 8.09 and 6.64, respectively. pH was higher for the phases containing more As because As-rich phases are more soluble. This was confirmed by speciation modeling using PHREEQC computer code. At pH 4.5 and under the experimental conditions, the most abundant phosphate and arsenate species were H2PO4 and H2AsO4 (Table 3). The results of modeling indicated that the release of one millimole of PO4 into one kg of solution as a result of apatite dissolution at pH 4.5 resulted in a concentration of 0.91 mM of H2PO4, 0.09 mM of H3PO4, and 0.0001 mM of HPO42−. The concentration of PO43− was negligible (ca. 2 × 10⁻¹⁶ mM). Similarly, the speciation of one millimole of AsO4 released to the solution results in concentrations equal to 0.89 mM H2AsO4, 0.1 mM H3AsO4, and 0.00035 mM HAsO42−. The concentration of AsO33− was negligible (ca. 3 × 10⁻¹⁵ mM). These reactions consume H+, increasing the pH of the solution, creating a buffering effect. In addition, each phase released an OH ion from the structure of the mineral upon dissolution. More soluble phases release more PO43–, AsO43–, and OH ions into the solution, having a stronger effect on the increase in pH.
The concentrations of all components increased relatively fast for the first 10 to 40 days and then stabilised (Figure 8). The evolution patterns indicated that the system reached a steady state within 17 weeks. As expected, the final concentration of Ca was the highest for the most soluble JBM and systematically decreased in the solid solution series toward the least soluble HAP (Figure 8). The effect of temperature on the solubility, however, was not directly apparent from these patterns. Based on the evolution of the solution composition, assessing whether the solubility increased or decreased with the increase in temperature was difficult. This indicates that the effect of temperature is relatively small in comparison with the compositional effect.
The equilibrium molar concentrations of As and P released to the solution should reflect, to some extent, the content of these elements in each solid phase. However, the molar concentration of P was surprisingly low, lower than the molar concentration of As in equivalent phases. For example, the final molar concentrations of P (0.1 mmol·L−1) and As (0.8 mmol·L−1) resulting from dissolution of Ca5(PO4)1.5(AsO4)1.5OH (sample 1.5 As in Figure 8) should be equal to each other. This phosphate deficiency indicates some degree of incongruent dissolution characteristic. The evolution curves for AsO43− ion were the most regular; they follow the logarithmic trend and reached a steady state plateau. Synthetic phases containing more arsenic dissolve in more stoichiometric proportions (Figure 9). Therefore, to minimize the effect of incongruent dissolution, the molar concentrations of As were used as a basis for further calculations. The equivalent concentrations of Ca2+ and PO43− were calculated based on theoretical stoichiometric proportions to arsenic. Only in the case of HAP were the measured molar concentrations of P released into the solution used.

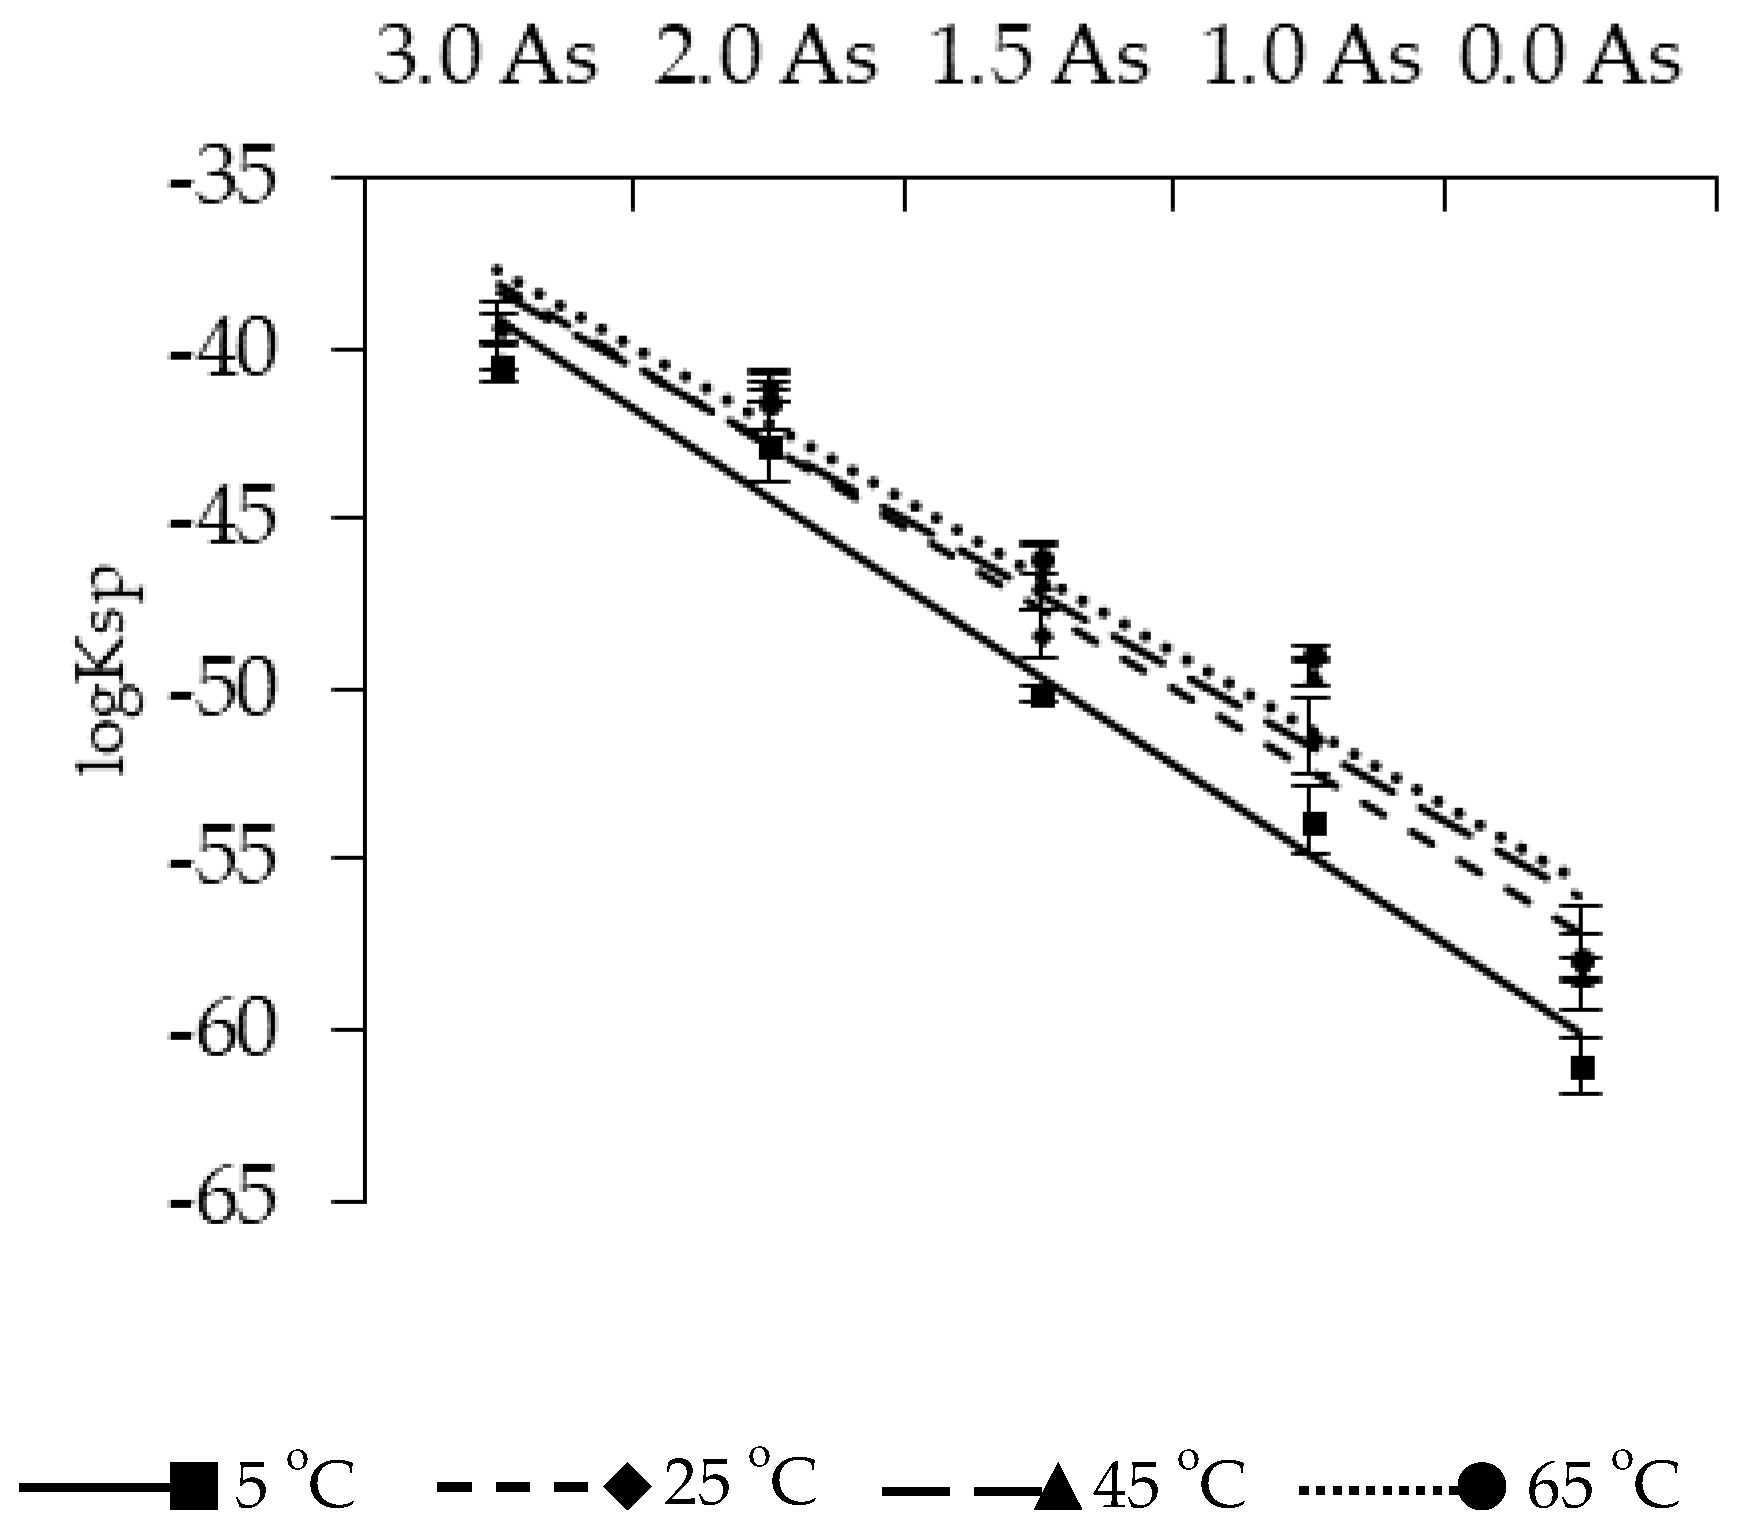
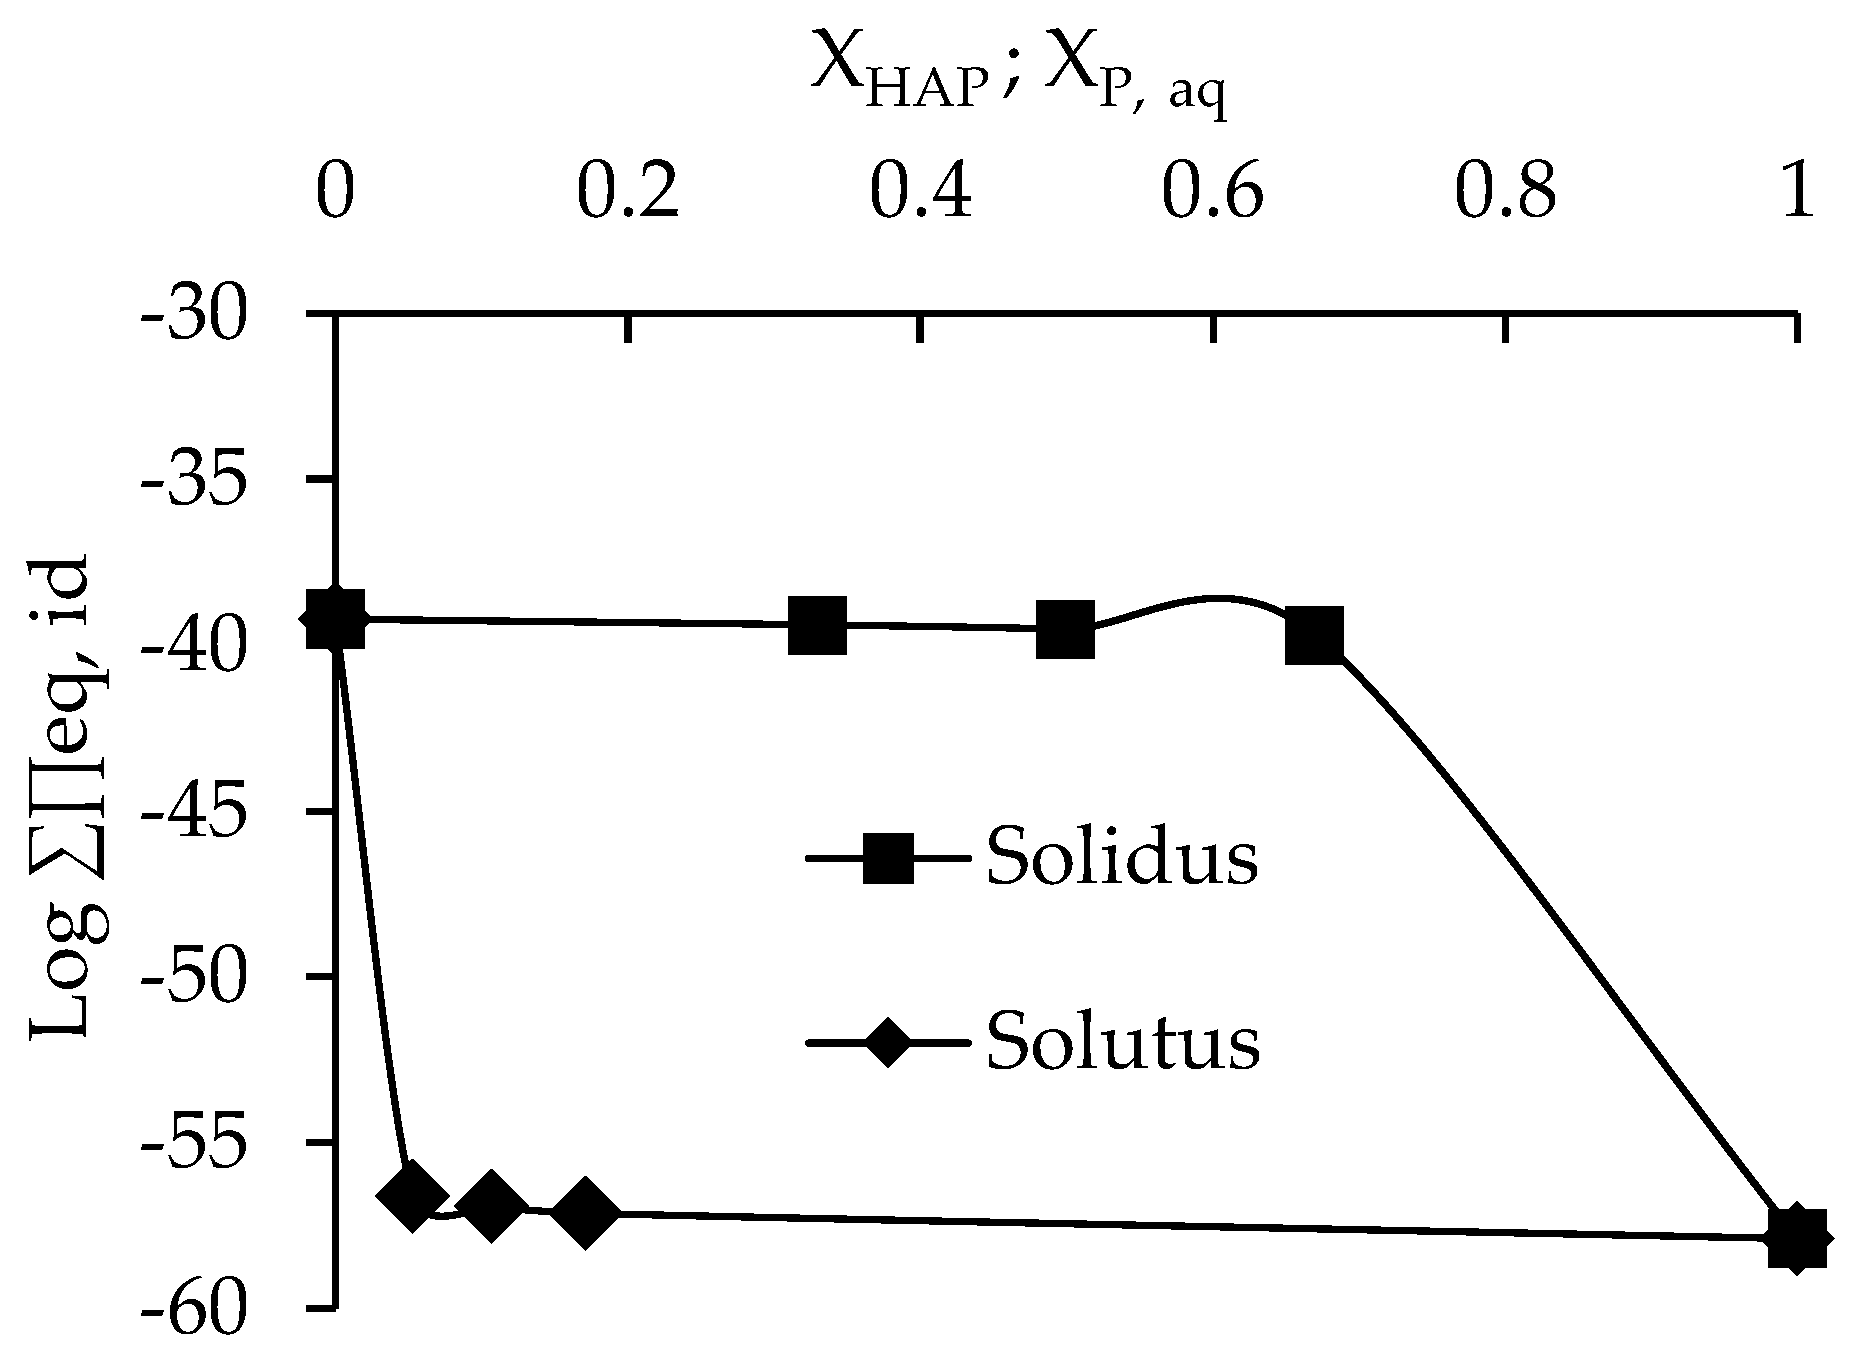
3.3. Determination of Solubility and Thermodynamic Properties

The dissolution reaction is expressed by the general equation [27]:
Ca5(AsO4)m(PO4)3−mOH = 5Ca2+(aq) + mAsO43−(aq) + (3 − m)PO43−(aq) + OH(aq)
Following Equation (1), based on the total molar concentration of As, Ca, and P calculated stoichiometrically with respect to arsenates and based on the equilibrium pH, the experimental ionic activity products (IAPs) for JBM, HAP, and their solid solutions were calculated using the general equation [28]:
logKsp = logIAP = 5log{Ca2+} + m × log{AsO43−} + (3 − m) × log{PO43−} + log{OH}
where {} denotes activity. Since the dissolving solids are the only source of ions in this system and assuming that incongruency of dissolution is insignificant, the IAP equals Ksp. The activities of the particular ions were calculated with the geochemical speciation model PHREEQC-2 [29] using the modified “lnll” thermodynamic database [26]. All experiments were open to the air, so the system in the modeling was assumed to be equilibrated with the atmospheric CO2. Based on the calculated activities and by using Equation (2), the solubility products were calculated with experimental error represented by two standard deviations of triplicate measurements (Table 4).

4. Discussion

The solubility constants were calculated for the end members, Ksp = 10−39.22 for JBM and Ksp = 10−57.90 for HAP, compare well with the data in the literature (10−38.04 for JBM [30] and 10−57.72, 10−57.00, and 10−58.57 for HAP [31,32,33]). In the solid solution series, the value of Ksp increased linearly with the increase in the As content in the structure of the apatite (Figure 10). In comparison, the effect of the temperature was much less pronounced. For all five phases, the solubility constant slightly increased with increasing temperature in the range of 5 to 65 °C (Figure 10). This temperature dependence was the strongest for HAP (from 10−61.04 at 5 °C to 10−57.83 at 65 °C) and was less pronounced at higher As contents (Table 4). This contradicts the results of Zhu et al. [7], who reported the decrease in HAP solubility with the increase in temperature from 10−53.41 at 25 °C to 10−56.85 at 45 °C. This can be explained by the fact that the temperature range used in their experiment was narrow. In contrast, the experiments of McDowell et al. [34], performed at a temperature range of 5 to 37 °C, revealed a slight increase in the solubility of HAP with increasing temperature.
At equilibrium, the ionic activity product of the solid solution became equal to the so-called stoichiometric solubility product KST [35]. For an ideal solid solution, this parameter can be expressed in terms of the solubility products of the end members of the series by the following equation:
K ST , id = ( K JBM X JBM ) X JBM ( K HAP X HAP ) X HAP
where KJBM is the solubility product of JBM (10−39.22), XJBM is the molar ratio of JBM in the solid phase, KHAP is the solubility product of HAP (10−57.90), and XHAP is the molar ratio of HAP in the solid phase. To determine the mixing properties of the JBM–HAP solid solution, and consequently its ideal or nonideal character, the calculated KST and IAP were plotted as a function of chemical composition of the dissolved solids (Figure 11). In most cases, the values of KST and IAP of a given synthetic phase were identical within the experimental error. This implies that the solid solution series was close to the ideal (id), as the two end members are isostructural and isomorphous in nature. From a chemical point of view, the important conclusion is that the elemental composition of each solid phase in the JBM–HAP series reflects the composition of the aqueous solution exactly from which it crystallized. This is consistent with the identification of the products of synthesis; the precipitates reflect the mixed As-P composition rather than the physical mixture of JBM with HAP. Therefore, it can be safely assumed for further calculations that the variations in the enthalpy of mixing ΔHM are independent of the distribution of the substituting anions in the series. The enthalpy of mixing for an ideal solid solution ΔHM,id is 0.
To better understand the thermodynamics of JBM–HAP solid solution series, we constructed the Lippmann diagram (Figure 12). The patterns of solidus and solutus were calculated using Equations (4) and (5) [35]:
Π eq , id = ( K JBM × X JBM ) + ( K HAP × X HAP )
Π eq , id = 1 X PO 4 3 , aq K HAP + X AsO 4 3 , aq K JBM
where Π eq , id is the total solubility product, X PO 4 3 , aq is the aqueous activity fraction of PO43− in equilibrium solution, X AsO 4 3 , aq is the aqueous activity fraction of AsO43− in equilibrium solution, K HAP is the solubility product of HAP (10−57.90), K JBM is the solubility product of JBM (10−39.22), X HAP is the molar component of HAP in the solid phase, and X JBM is the molar component of JBM in the solid phase. In addition, the equilibrium distribution of substituting PO43− anions between the solid and aqueous phases was visualized on the Roozeboom diagram presented in Figure 13. The equilibrium X PO 4 3 , aq X HAP pairs were obtained using Equation (6) [36]:
X HAP = K JBM X PO 4 3 , aq ( K JBM K HAP ) X PO 4 3 , aq + K HAP
The shape of the Lippmann curve was typical for an ideal solid solution with extremely different solubility products of the end members (in this case 18.7 orders of magnitude). The solidus and solutus curves were plotted far from each other [35]. The strong tendency of the less soluble HAP to partition into the solid phase in the series is apparent. As presented in Figure 13, two nearly straight lines approximate the Roozeboom curve. This implies that in the case of the JBM–HAP solid solution series, even a negligible amount of aqueous phosphates in the system can alter the thermodynamic equilibrium to promote the formation of HAP-rich solids [32,37,38]. The increase in the phosphate content in the structure of JBM improves its stability. Considering the ideal character of the solid solution, this observation can be explained based on the thermodynamic parameters determining the dissolution of the JBM–HAP series.
Similar to other apatites, the temperature variability in the logIAP within JBM–HAP solid solution series was nonlinear. Therefore, since IAP is at equilibrium equal to the solubility product Ksp, the results were fit to a nonlinear model (Figure 14) assuming constant heat capacity of the dissolution reaction [39,40]:
logK sp = A ( B T ) + D log T
where T is temperature (K) and A, B, and D are nonlinear regression coefficients. The errors were calculated at a 95% confidence level. IBM SPSS Statistics 23 software was used to perform both statistical and mathematical calculations. Table 5 presents the values of logKsp calculated from regression equations. The Gibbs free energy, heat capacity, entropy, and enthalpy of reaction for the dissolution reaction in Equation (1) were calculated using the following relationships [38]:
Δ G r 0 = RTln ( 10 ) logK sp
Δ C p , r 0 = DR
Δ H r 0 = RBln ( 10 ) + T × Δ C p , r 0
Δ S r 0 = RAln ( 10 ) + Δ C p , r 0 ln ( 10 ) × logT + Δ C p , r 0
where R is the gas constant (8.31447 J∙mol−1∙K−1) and superscript o denotes normal conditions. The results are presented in Table 6. The errors represent two standard deviations of the results determined for the last three samplings at equilibrium state. A positive enthalpy of reaction indicates that the dissolution is endothermic. This contrasts the theoretical calculations of Δ H r 0 completed by Marcus who reported the exothermic dissolution of HAP [41]. However, the enthalpy of dissolution reaction Δ H r 0 calculated for HAP based on the results by McDowell was 88 kJ/mol, also indicating endothermic dissolution [34].
Based on the dissolution reaction in Equation (1) and the thermodynamic data for reaction and ions presented in Table 6 and Table 7, the Gibbs free energy of formation Δ G r 0 , enthalpy of formation Δ H r 0 , entropy of formation Δ S r 0 , and heat capacity of formation Δ C p , r 0 for JBM–HAP solid solution series at standard conditions were calculated using the following equations:
Δ G f , apatite 0 = 5 Δ G f , Ca 2 + 0 + ( 3 m ) Δ G f , PO 4 3 0 + m Δ G f , AsO 4 3 0 + Δ G f , OH 0 Δ G r 0
Δ H f , apatite 0 = 5 Δ H f , Ca 2 + 0 + ( 3 m ) Δ H f , PO 4 3 0 + m Δ H f , AsO 4 3 0 + Δ H f , OH 0 Δ H r 0
S f , apatite 0 = 5 S f , Ca 2 + 0 + ( 3 m ) S f , PO 4 3 0 + mS f , AsO 4 3 0 + S f , OH 0 Δ S r 0
Δ C p f , apatite 0 = 5 Δ C p f , Ca 2 + 0 + ( 3 m ) Δ C p f , PO 4 3 0 + m Δ C p f , AsO 4 3 0 + Δ C p f , OH 0 Δ C p , r 0
The results are presented in Table 8. Only sparse literature data for JBM are available for comparison (Table 7). Our experimental results for HAP and JBM agree well with Δ G r 0 and Δ H r 0 determined previously.
Although only sparse thermodynamic data are available for comparison (Table 7), our results for HAP and JBM agree well with the Δ G r 0 and Δ H r 0 values determined previously. The Gibbs free energy, the enthalpy, and the entropy of formation increased almost linearly with an increase in the content of As in calcium apatites (Figure 15). This indicates an increase in the thermodynamic stability that correlates well with the increase in the solubility constant determined experimentally. The thermodynamic functions of the state of the phosphate ion have lower values than those of arsenates. This might be responsible for the increase in the stability of P-rich phases in solid solution series. The entropy of equally charged aqueous ions (XO4)3− depends proportionally on their size [51]. The phosphate (PO43−) anion is approximately 10% smaller than arsenate (AsO43−) [9]. The small size of the phosphate anion might promote the preferential precipitation of P-rich phases, resulting in the thermodynamic stability of the system.

5. Conclusions

The experimentally determined solubility constants for JBM Ksp (10−39.22±0.56) and HAP Ksp (10−57.90±1.57) agree well with the data from Bothe [30] and Stumm [32]. The solubility increased linearly with the substitution of As for P. A comprehensive experimental set of thermodynamic data for JBM–HAP solid solution series was obtained. The Δ G r 0 and Δ H r 0 at normal conditions determined for the end members of the solid solution are in good agreement with previously reported data. The increase in the solubility constant (Ksp) with As content correlates well with the decrease in the thermodynamic stability reflected by an increase in Δ G r 0 . This trend is linear, consistent with near perfectly ideal mixing of the end members.
For the first time, a very specific temperature dependence of the solubility product and enthalpy of dissolution was determined for HAP and HAP–JBM solid solution series. Ksp depends much more on chemical composition (As and P content) than on temperature. The solubility increases with temperature at lower temperature ranges and decreases with temperature at higher ranges. This reflects a peculiar behavior of the enthalpy of dissolution reaction: in the temperature range between 5 and 65 °C, the ΔHr varies around zero. At lower temperatures (5 to 45 °C), the dissolution is endothermic and at higher temperatures (45 to 65 °C), the dissolution is exothermic. This is probably the reason for the inconclusive reports on HAP in this area. This is also why the Ksp in this solid solution series depends much more on chemical composition (As and P content) than on temperature. This specific thermodynamic behavior of HAP and similar isostructural phases requires more detailed study in the future.

Author Contributions

M.M. conceived the idea of this work and reviewed background research. M.K.-K. supervised data acquisition and compilation. B.P. carried out the experiments, data reduction and calculations. All authors contributed to the interpretation of the results as well as writing and editing of the paper.

Funding

Financial support for the research was provided to B.P. by the Polish National Science Centre (NCN) grant No. 2017/27/N/ST10/00776. M.M. and M.K.-K. were partly funded by AGH University of Science and Technology statutory research program No. 11.11.140.158.

Acknowledgment

The authors are thankful to A. Gaweł for performing the XRD analysis and valuable comments on the results and M. Młynarska and J. Poliwka for help in the syntheses. The authors are grateful to A. Koteja for good-builded and criticial remarks regarding the manuscript. We thank two anonymous experts for their detailed reviews that helped us to improve the quality of the manuscript.

Conflicts of Interest

The authors declare no conflict of interests.

References

  1. Elliott, J.C. Structure and Chemistry of the Apatites and Other Calcium Phosphates; Elsevier: Amsterdam, The Netherlands, 1994; ISBN 0-444-81582-1. [Google Scholar]
  2. Li, Z.; Zhou, M.; Lin, W. The Research of Nanoparticle and Microparticle Hydroxyapatite Amendment in Multiple Heavy Metals Contaminated Soil Remediation. J. Nanomater. 2014, 2014, 1–8. [Google Scholar] [CrossRef]
  3. Valsami-Jones, E.; Ragnarsdottir, K.V.; Putnis, A.; Bosbach, D.; Kemp, A.J.; Cressey, G. The dissolution of apatite in the presence of aqueous metal cations at pH 2–7. Chem. Geol. 1998, 151, 215–233. [Google Scholar] [CrossRef]
  4. Matusik, J.; Bajda, T.; Manecki, M. Immobilization of aqueous cadmium by addition of phosphates. J. Hazard. Mater. 2008, 152, 1332–1339. [Google Scholar] [CrossRef] [PubMed]
  5. Giammar, D.E.; Xie, L.Y.; Pasteris, J.D. Immobilization of lead with nanocrystalline carbonated apatite present in fish bone. Environ. Eng. Sci. 2008, 25, 725–735. [Google Scholar] [CrossRef]
  6. Zhu, Y.; Zhang, X.; Chen, Y.; Xie, Q.; Lan, J.; Qian, M.; He, N. A comparative study on the dissolution and solubility of hydroxylapatite and fluorapatite at 25 °C and 45 °C. Chem. Geol. 2009, 268, 89–96. [Google Scholar] [CrossRef]
  7. Lee, Y.J.; Stephens, P.W.; Tang, Y. Arsenate substitution in hydroxylapatite: Structural characterization of the Ca5(PxAs1−xO4)3(OH) solid solution. Am. Mineral. 2009, 94, 666–675. [Google Scholar] [CrossRef]
  8. Mushak, P.; Crocetti, A.F. Risk and revisionism in arsenic cancer risk assessment. Environ. Health Perspect. 1995, 103, 684–689. [Google Scholar] [CrossRef] [PubMed]
  9. Baker, W.E. An X-ray diffraction study of synthetic members of the pyromorphite series. Am. Mineral. 1966, 51, 1712–1721. [Google Scholar]
  10. Marciniak, H.; Diduszko, R.; Kozak, M. XRAYAN. Program do Rentgenowskiej Analizy Fazowej, Wersja 4.0.1; Koma: Warszawa, Poland, 2006. (In Polish) [Google Scholar]
  11. Holland, J.B.; Redfern, S.A.T. UNITCELL: A nonlinear least-squares program for cell parameter refinement implementing regression and deletion diagnostics. J. Appl. Cryst. 1997, 30, 84. [Google Scholar] [CrossRef]
  12. Lenoble, V.; Deluchat, V.; Serpaud, B.; Bollinger, J.C. Arsenite oxidation and arsenate determination by the molybdene blue method. Talanta 2003, 61, 267–276. [Google Scholar] [CrossRef]
  13. Leroy, N.; Bres, E. Structure and Substitutions in Fluorapatite. Eur. Cell Mater. 2001, 2, 36–48. [Google Scholar] [CrossRef] [PubMed]
  14. Zhu, Y.; Zhang, X.; Long, F.; Liu, H.; Qian, M.; He, N. Synthesis and characterization of arsenate/phosphate hydroxyapatite solid solution. Mater. Lett. 2009, 63, 1185–1188. [Google Scholar] [CrossRef]
  15. Kim, I.Y.; Koichi, K.; Ohtsuki, C. Hydroxyapatite formation through dissolution-precipitation reaction: Effects of solubility of starting materials. Ceram. Int. 2014, 40, 14385–14390. [Google Scholar] [CrossRef]
  16. Giera, A.; Manecki, M.; Bajda, T.; Rakovan, J.; Kwaśniak-Kominek, M.; Marchlewski, T. Arsenate substitution in lead hydroxyl apatites: A Raman spectroscopic study. Spectrochim. Acta Part A Mol. Biomol. Spectrosc. 2016, 152, 370–377. [Google Scholar] [CrossRef] [PubMed] [Green Version]
  17. Kwaśniak-Kominek, M.; Manecki, M.; Matusik, J.; Lempart, M. Carbonate substitution in lead hydroxyapatite Pb5(PO4)3OH. J. Mol. Struct. 2017, 1147, 594–602. [Google Scholar] [CrossRef]
  18. Flis, J.; Manecki, M.; Bajda, T.; Klasa, J. Synchrotron-based X-ray diffraction of the lead apatite series Pb10(PO4)6Cl2–Pb10(AsO4)6Cl2. J. Synchrotron Radiat. 2010, 17, 207–214. [Google Scholar] [CrossRef] [PubMed]
  19. Ren, F.; Ding, Y.; Leng, Y. Infrared spectroscopic characterization of carbonated apatite: A combined experimental and computational study. J. Biomed. Mater. Res. 2014, 102, 496–505. [Google Scholar] [CrossRef] [PubMed]
  20. Farzadi, A.; Bakhshi, F.; Solati-Hashjin, M.; Asadi-Eydivand, M.; Azuan abu Osman, N. Magnesium incorporated hydroxyapatite: Synthesis and structural properties characterization. Ceram. Int. 2014, 40, 6021–6029. [Google Scholar] [CrossRef]
  21. Masaoka, M.; Kyono, A.; Hatta, T.; Kimata, M. Single crystal growth of Pb5(PxAs1−xO4)3Cl solid solution with apatite type structure. J. Cryst. Growth 2004, 292, 129–135. [Google Scholar] [CrossRef]
  22. Zhang, Y.; Reddy Venugopal, J.; El-Turki, A.; Ramakrishna, S.; Su, B.; Lim, C.T. Electrospun biomimetic nanocomposite nanofibers of hydroxyapatite/chitosan for bone tissue engineering. Biomaterials 2008, 29, 4314–4322. [Google Scholar] [CrossRef] [PubMed]
  23. Bajda, T.; Mozgawa, W.; Manecki, M.; Flis, J. Vibrational spectroscopic study of mimetite-pyromorphite solid solutions. Polyhedron 2011, 30, 2479–2485. [Google Scholar] [CrossRef]
  24. Flis, J.; Manecki, M.; Bajda, T. Solubility of pyromorphite Pb5(PO4)3Cl-mimetite Pb5(AsO4)3Cl solid solution series. Geochim. Cosmochim. Acta 2011, 75, 1858–1868. [Google Scholar] [CrossRef]
  25. Bakan, F.; Laçin, O.; Sarac, H. A novel low temperature sol-gel synthesis process for thermally stable nanocrystalline hydroxyapatite. Powder Technol. 2013, 233, 295–302. [Google Scholar] [CrossRef]
  26. Johnson, J.; Anderson, G.; Parkhurst, D. Database ‘Thermo. com. V8. R6. 230,’Rev. 1.11; Lawrence Livermore National Laboratory: Livermore, CA, USA, 2000.
  27. Glynn, P.D.; Reardon, E.J. Solid solution aqueous solution equilibria: Thermodynamic theory and representation. Am. J. Sci. 1990, 278, 164–201. [Google Scholar] [CrossRef]
  28. Zhang, X.; Zhu, Y.; Zeng, H.; Wang, D.; Liu, J.; Liu, H.; Qian, M.; Xu, L. Dissolution and solubility of the arsenate-phosphate hydroxylapatite solid solution [Ca5(PxAs1−xO4)3(OH)] at 25 °C. Environ. Chem. 2011, 8, 133–145. [Google Scholar] [CrossRef]
  29. Parkhurst, D.L.; Appelo, C.A.J. User’s guide to PHREEQC-A computer program for speciation, reaction-path, 1D-transport, and inverse geochemical calculations. US Geol. Surv. Water Resour. Investig. Rep. 1999, 95–4227. [Google Scholar]
  30. Bothe, J.V., Jr.; Brown, P.W. The stabilities of calcium arsenates at 23 ± 1 °C. J. Hazard. Mater. 1999, 69, 197–207. [Google Scholar] [CrossRef]
  31. Wei, C.; Zhu, Y.; Yang, F.; Li, J.; Zhu, Z.; Zhu, H. Dissolution of hydroxylapatite and fluoroapatite at 25 °C at different pH. Res. J. Chem. Environ. 2013, 11, 57–61. [Google Scholar]
  32. Stumm, W.; Morgan, J.J. Aquatic Chemistry, Chemical Equilibria and Rates in Natural Waters; Wiley: New York, NY, USA, 1996; ISBN 0-471-511184-6. [Google Scholar]
  33. Moreno, E.C.; Gregory, T.M.; Brown, W.E. Preparation and Solubility of Hydroxyapatite. J. Res. Natl. Bur. Stand. 1968, 72A, 773–782. [Google Scholar] [CrossRef]
  34. McDowell, H.; Gregory, T.M.; Brown, W.E. Solubility of Ca5(PO4)3OH in the system Ca(OH)2–H3PO4–H2O at 5, 15, 25, and 37.8 °C. J. Res. Natl. Bur. Stand. 1977, 81, 273. [Google Scholar] [CrossRef]
  35. Prieto, M. Thermodynamics of solid solution-aqueous solution systems. Rev. Mineral. Geochem. 2009, 70, 47–85. [Google Scholar] [CrossRef]
  36. Prieto, M.; Putnis, A.; Fernandez-Diaz, L. Crystallization of solid solutions from aqueous solutions in a porous medium: Zoning in (Ba, Sr)SO4. Geol. Mag. 1993, 130, 289–299. [Google Scholar] [CrossRef]
  37. Chaϊrat, C.; Oelkers, E.H.; Schott, J.; Lartigue, J.E. Fluorapatite surface composition in aqueous solution deduced from potentiometric, electrokinetic, and solubility measurements, and spectroscopic observations. Geochim. Cosmochim. Acta 2007, 71, 5888–5900. [Google Scholar] [CrossRef]
  38. Dorozhkin, S.V. A review on the dissolution models of calcium apatites. Prog. Cryst. Gr. Char. Mater. 2002, 44, 45–61. [Google Scholar] [CrossRef]
  39. Nordstrom, D.K.; Munoz, J.L. Geochemical Thermodynamics; Blackwell: Boston, MA, USA, 1994. [Google Scholar]
  40. Topolska, J.; Manecki, M.; Bajda, T.; Borkiewicz, O.; Budzewski, P. Solubility of pyromorphite Pb5(PO4)3Cl at 5–65 °C and its experimentally determined thermodynamic parameters. J. Chem. Thermodyn. 2016, 98, 282–287. [Google Scholar] [CrossRef]
  41. Marcus, Y. The thermodynamics of solvation of ions. Part 2—The enthalpy of hydration at 298.15 K. J. Chem. Soc. Faraday Trans. 1987, 2, 231–569. [Google Scholar] [CrossRef]
  42. Jemal, M. Thermochemistry and relative stability of apatite phosphates. Phosphor. Res. Bull. 2004, 15, 119–124. [Google Scholar] [CrossRef]
  43. Zhu, Y.; Huang, B.; Zhu, Z.; Liu, H.; Huang, Y.; Zhao, X.; Liang, M. Characterization, dissolution and solubility of the hydroxypyromorphite-hydroxyapatite solid solution [(PbxCa1−x)5(PO4)3OH] at 25 °C and pH 2–9. Geochem. Trans. 2016, 17, 2. [Google Scholar] [CrossRef] [PubMed]
  44. Drouet, C. A comprehensive guide to experimental and predicted thermodynamic properties of phosphate apatite minerals in view of applicative purposes. J. Chem. Thermodyn. 2015, 81, 143–159. [Google Scholar] [CrossRef] [Green Version]
  45. Vieillard, P.; Tardy, Y. Thermochemical properties of phosphates. In Phosphate Minerals; Nriagu, J., Moore, P., Eds.; Springer: Berlin, Germany, 1984; pp. 171–198. [Google Scholar]
  46. Cruz, F.; Da Piedade, M.E.; Calado, J.C.G. Standard molar enthalpies of formation of hydroxy-, chlor-, and bromapatite. J. Chem. Thermodyn. 2005, 37, 1061–1070. [Google Scholar] [CrossRef]
  47. Shock, E.L.; Sassani, D.C.; Willis, M.; Sverjensky, D.A. Inorganic species in geology fluids: Correlations among standard molal thermodynamics properties of aqueous ions and hydroxide complexes. Geochim. Cosmochim. Acta 1997, 61, 950–970. [Google Scholar] [CrossRef]
  48. Novikov, A.N.; Rassokhina, L.Y. Heat Capacity and Density of Solutions of Calcium and Cadmium Nitrates in N-Methylpyrrolidone at 298.15 K. Russ. J. Phys. Chem. 2013, 87, 1318–1321. [Google Scholar] [CrossRef]
  49. Bianchi, H.; Tremaine, P.R. Thermodynamics of aqueous phosphate solutions: Apparent molar heat capacities and volumes of sodium and tetramethyloammonium salt at 25 °C. J. Solut. Chem. 1995, 24, 439–463. [Google Scholar] [CrossRef]
  50. Wagman, D.D.; Evans, W.H.; Parker, V.B.; Schumm, R.H.; Halow, I.; Bailey, S.M.; Churney, K.L.; Nuttall, R.L. The NBS Tables of Chemical Thermodynamic Properties. J. Phys. Chem. Ref. Data 1989, 18, 1807–1812. [Google Scholar] [CrossRef]
  51. Sienko, M.J.; Plane, R.A. Chemia. Podstawy i Własności; Wydawnictwo Naukowo-Techniczne: Warsaw, Poland, 1980; p. 788. (In Polish) [Google Scholar]
Figure 1. Scanning electron micrographs of synthetic Ca5(AsO4)m(PO4)3−mOH solid solutions (left) before and (right) after the dissolution experiment. Secondary phases possibly resulting from incongruent dissolution are marked with circles.
Minerals 08 00281 g001
Figure 2. X-ray diffraction patterns of the synthetic johnbaumite–hydroxyapatite (JBM–HAP) solid solution series.
Minerals 08 00281 g002
Figure 3. Linear variation of the unit cell parameters a, c, and V in the JBM–HAP solid solution series.
Minerals 08 00281 g003
Figure 4. Raman spectra of the JBM–HAP solid solution series.
Minerals 08 00281 g004
Figure 5. Systematic linear variations in the positions of the major Raman bands: (a) O–H vibrations and (b) symmetric stretching ν1 As–O vibrations in the JBM–HAP solid solution series.
Minerals 08 00281 g005
Figure 6. Fourier-transform infrared spectroscopy (FTIR) spectra of the JBM–HAP solid solution series.
Minerals 08 00281 g006
Figure 7. Linear variations in the position of the FTIR bands in the JBM–HAP solid solution series.
Minerals 08 00281 g007
Figure 8. Evolution of solution composition and pH with time during the 119-day dissolution of JBM–HAP solid solution series at 5, 25, 45, and 65 °C and at an initial pH of 4.50.
Minerals 08 00281 g008
Figure 9. The variability in the congruency of dissolution during the dissolution experiment based on molar proportion of ions in solution. From top to bottom: 5, 25, 45, and 65 °C. The horizontal lines correspond to ideal stoichiometric character of dissolution, 1.67.
Minerals 08 00281 g009
Figure 10. The variability and linear trends of solubility constant Ksp in the isomorphic series JBM–HAP at four temperatures: 5, 25, 45, and 65 °C.
Minerals 08 00281 g010
Figure 11. Calculated and experimentally determined ionic activity products (IAPs) of synthetic phases from the HAP–JBM series as a function of their chemical composition.
Minerals 08 00281 g011
Figure 12. The Lippmann diagram for the JBM–HAP solid solution series.
Minerals 08 00281 g012
Figure 13. The Roozeboom diagram for the JBM–HAP solid solution series.
Minerals 08 00281 g013
Figure 14. Nonlinear regression of experimentally determined ion activity products logIAP vs. temperature T for synthetic JBM–HAP solid solution series. The error bars represent two standard deviations of the average calculated from three distinct experimental results at steady state. R2 represents the coefficient of determination. A, B, and D are the parameters in Equation (7).
Minerals 08 00281 g014
Figure 15. The variability in standard thermodynamic functions of the formation in JBM–HAP solid solution series. The error bars represent two standard deviations of the average calculated from three distinct experimental results at steady state. R2 represents the coefficient of determination.
Minerals 08 00281 g015
Table 1. The reagents used in the synthesis.
Synthetic PhasesMass of the Reagents (g/400 mL of Water)
Ca(NO3)2∙4H2O(NH4)H2PO4Na2AsHO4∙7H2O
0.0 As (HAP): Ca5(PO4)3OH41.0113.74-
1.0 As: Ca5(PO4)2(AsO4)OH21.624.215.71
1.5 As: Ca5(PO4)1.5(AsO4)1.5OH20.783.078.24
2.0 As: Ca5(PO4)(AsO4)2OH20.012.2410.55
3.0 As (JBM): Ca5(AsO4)3OH37.24-29.52
Table 2. Elemental composition of the synthesized phases.
SampleTheoretical FormulaCaO
wt %
P2O5
wt %
As2O3
wt %
Ca/(P + As)
Molar Ratio
0.0 As HAPCa5(PO4)3OH52.1947.81-1.67
1.0 AsCa5(PO4)2(AsO4)OH49.1134.4916.391.67
1.5 AsCa5(PO4)1.5(AsO4)1.5OH48.7323.9127.361.66
2.0 AsCa5(PO4)(AsO4)2OH52.013.9334.081.66
3.0 As JBMCa5(AsO4)3OH46.76-53.251.67
Table 3. Selected ionic speciation reactions and equilibrium constants (logK298.15) resulting from dissolution of the solid solution series [26].
Equilibrium ReactionlogK298.15
Ca5(PO4)3OH + 4H+ = 5Ca2+(aq) + 3HPO43−(aq) + H2O−56.00
Ca5(AsO4)3OH + 4H+ = 5Ca2+(aq) + 3HAsO43−(aq) + H2O10.75
PO43−(aq) + H+ = HPO42−(aq)12.34
PO43−(aq) + 2H+ = H2PO4(aq)19.53
PO43−(aq) + 3H+ = H3PO40(aq)21.70
H2AsO4(aq) = AsO43−(aq) + 2H+−18.36
H2AsO4(aq) = HAsO42−(aq) + H+−6.76
H3AsO40(aq) = H2AsO4(aq) + H+2.25
Table 4. Equilibrium activities and average solubility product determined experimentally from dissolution at various temperatures and atmospheric pressure.
Sample IDTemperaturelog Activitylog Activitylog Activitylog ActivityAverage logKsp
(K)Ca2+PO43−AsO43−OH
3.0 As
(JBM)
278.15−2.766-−6.667−6.542−40.37 ± 0.56
298.15−2.761-−6.495−5.930−39.22 ± 0.56
318.15−2.800-−6.833−5.783−40.28 ± 0.37
338.15-----
2.0 As278.15−2.747−8.197−7.021−6.762−42.74 ± 1.20
298.15−2.743−7.951−6.698−6.004−41.07 ± 0.11
318.15−2.770−8.065−6.798−5.637−41.15 ± 0.40
338.15−2.816−8.214−6.947−5.324−41.51 ± 0.88
1.5 As278.15−3.088−9.436−8.550−7.702−50.12 ± 1.02
298.15−3.134−9.066−8.144−6.850−48.33 ± 1.10
318.15−3.046−8.872−7.913−6.277−46.69 ± 0.39
338.15−2.975−8.929−7.931−5.934−46.10 ± 0.47
1.0 As278.15−3.227−10.083−9.419−8.106−53.83 ± 1.02
298.15−3.225−9.560−8.876−7.217−51.34 ± 1.10
318.15−3.082−9.369−8.642−6.687−49.48 ± 0.39
338.15−2.998−9.455−8.685−6.698−49.28 ± 0.20
0.0 As
(HAP)
278.15−3.804−11.174-−8.496−61.04 ± 0.83
298.15−3.897−10.339-−7.397−57.90 ± 1.57
318.15−3.758−10.442-−7.023−57.14 ± 0.32
338.15−3.681−10.857-−6.854−57.83 ± 0.68
Table 5. Comparison of solubility products logKsp calculated from the experiment a, determined from a nonlinear regression b, and reported in the literature c for JBM–HAP solid solution series.
Sample IDLog IAP aLog IAP bLog IAP c
3.0 As (JBM)−39.22 ± 0.56−39.22−38.04 [30]
2.0 As−41.07 ± 0.11−41.24-
1.5 As−48.33 ± 1.10−48.18-
1.0 As−51.34 ± 1.10−51.21-
0.0 As (HAP)−57.90 ± 1.57−58.46−57.00 [32]
Table 6. Experimentally determined thermodynamic functions of the dissolution reaction in JBM–HAP solid solution series at temperature T of 298.15 K and pressure p of 0.1 MPa.
Sample ID Δ G r 0 (kJ·mol−1) Δ H r 0 (kJ·mol−1) Δ S r 0 (J·mol−1·K−1) Δ C p , r 0 (J·mol−1·K−1)
3.0 As (JBM)224 ± 4−5 ± 41−766 ± 127−9370 ± 3790
2.0 As235 ± 269 ± 81−558 ± 268−4452 ± 1985
1.5 As275 ± 2139 ± 40−457 ± 129−1848 ± 591
1.0 As292 ± 5177 ± 18−387 ± 64−3361 ± 3615
0.0 As (HAP)334 ± 8132 ± 58−678 ± 211−5838 ± 2206
Table 7. Referenced thermodynamic data of formation for johnbaumite, hydroxyapatite, and selected aqueous species (temperature T is 298.15 K and pressure p is 0.1 MPa).
Species Δ G r 0
(kJ·mol−1)
Δ H r 0
(kJ·mol−1)
Δ S r 0
(J·mol−1·K−1)
Δ C p , r 0
(J·mol−1·K−1)
Johnbaumite (JBM)−5087 [30]---
Hydroxyapatite (HAP)−6310.45 [42]
−6287 [43]
−6255 [44]
−6654.5 [44]
−6762.5 [45]
390.35 [46]347 [46]
Ca2+−553.5 [47]−542.8 [47]−53.1 [47]−169 [48]
PO43−−1001.6 [47]−1259.6 [47]−222 [47]−497 [49]
AsO43−−648.4 [47]−888.1 [47]−162.8 [47]−486.1 [47]
OH−157.3 [50]−230 [50]−10.71 [50]−138.6 [49]
Table 8. Standard thermodynamic functions of formation determined experimentally for JBM–HAP solid solution series (temperature T of 298.15 K and pressure p of 0.1 MPa).
Sample ID Δ G r 0
(kJ·mol−1)
Δ H r 0
(kJ·mol−1)
Δ S r 0
(J·mol−1·K−1)
Δ C p , r 0
(J·mol−1·K−1)
3.0 As (JBM)−5094 ± 4−5604 ± 412 ± 1276928 ± 3790
2.0 As−5459 ± 2−6049 ± 81−266 ± 2681999 ± 1985
1.5 As−5675 ± 2−6304 ± 40−396 ± 129−610 ± 591
1.0 As−5869 ± 5−6528 ± 18−496 ± 64898 ± 3615
0.0 As (HAP)−6263 ± 8−6855 ± 58−264 ± 2113363 ± 2206

