Article

Origin of the Granite Porphyry and Related Xiajinbao Au Deposit at Pingquan, Hebei Province, Northeastern China: Constraints from Geochronology, Geochemistry, and H–O–S–Pb–Hf Isotopes

1
School of Resources and Safety Engineering, Central South University, Changsha 410083, China
2
Key Laboratory of Metallogenic Prediction of Non-Ferrous Metals and Geological Environment Monitoring, Central South University, Ministry of Education, Changsha 410083, China
3
School of Geosciences and Info-Physics, Central South University, Changsha 410083, China
4
China Non-Ferrous Metals Geological Survey, Beijing 100012, China
*
Author to whom correspondence should be addressed.
Minerals 2018, 8(8), 330; https://doi.org/10.3390/min8080330
Submission received: 13 June 2018 / Revised: 25 July 2018 / Accepted: 26 July 2018 / Published: 31 July 2018

Abstract

:
The Xiajinbao gold deposit is a medium-sized gold deposit in the Jidong gold province. Ore bodies mainly occur within the Xiajinbao granite porphyry and along the contact zone between the intrusion and Archean plagioclase hornblende gneiss. The zircon LA-ICP-MS age of the Xiajinbao granite porphyry yields 157.8 ± 3.4 Ma, which reflects the metallogenic age of the gold mineralization. Its petrographic features, major and trace element contents, zircon Hf isotopic model ages and compositional features all demonstrate that the Xiajinbao granitic magma is derived from partial melting of the Changcheng unit. The results of H–O isotopic analyses of auriferous quartz veins indicate that the ore-forming fluids are derived from magmatic waters that gradually mixed with meteoric waters during the evolution of the ore-forming fluids. S–Pb isotopic data indicate that the ore-forming fluids were mainly provided by the magma and by plagioclase hornblende gneisses. The gold metallogeny of the Xiajinbao gold deposit is temporally, spatially, and genetically associated with the high-K calc-alkaline-shoshonitic granitic magma emplaced during the Yanshanian orogeny and intruding the Archean plagioclase hornblende gneisses. These magmatic events mainly occurred during the period of 223–153 Ma and comprise three peak periods in the late Triassic (225–205 Ma), the early Jurassic (200–185 Ma) and the middle–late Jurassic (175–160 Ma), respectively. The metallogenic events in this area mainly occurred during the period of 223–155 Ma with the peak periods during the late Triassic (223–210 Ma) and the middle–late Jurassic (175–155 Ma), respectively. Both mineralization and magmatism occurred in a post-collisional tectonic setting related to the collision between the Mongolian plate and the North China plate at the end of the Permian. The magmatism of the early Jurassic occurred during the collision between the Siberian plate and the Mongolian plate, which caused the thickening and melting of the northern margin of the North China plate. The middle and late Jurassic magmatism and metallogenic activities are products of crustal thickening and partial melting during the Yanshanian intra-continental orogeny at the northern margin of the North China plate.

1. Introduction

More than 70% of China’s gold resources occur along the margins of the North China Craton (NCC) and in adjacent orogenic belts [1]. These include China’s most important gold deposits of the Jiaodong Peninsula, which is located along the eastern side of the NCC, and the Daqingshan, Yan-Liao, and Changbaishan gold provinces, which are located along the northern margin of the NCC [1]. In the Yan-Liao gold field, there is an EW-trending gold province which yielded about 1000 t of gold [1]. Recent studies reveal that the gold deposits in the NCC formed as a result of multiple orogenic events [2]. Approximately 70% of the gold deposits in the Yan-Liao gold field are hosted by Precambrian metamorphic rocks, while 30% of the gold deposits occur in Paleozoic and Mesozoic intrusive rocks [3]. The Jidong gold province (or eastern Hebei Province; Easting 117°30′–119°00′, Northing 40°00′–40°40′) belongs to the Yan-Liao gold field. Tectonically, this area is located at the SE margin of the Yanshanian tectonic belt, and at the northern part of the North China plate (Figure 1a). In total, 29 gold deposits and 118 gold occurrences are documented in this area, with an accumulated proven gold reserve of 129.5 tons, which constitutes 2.4% of China’s total gold reserves [4]. The economically viable gold deposits in the Jidong area all occur within Mesozoic units and are spatially linked to the intruding felsic intrusions [5], including the large Yuerya gold deposit (Au: 50 t), the large Jinchangyu gold deposit (Au: 10 t), and the medium Huajian (or Niuxinshan) gold deposit (Au: 10 t), Dongliang gold deposit (Au: 19.53 t), Tangzhangzi gold deposit (Au: 1.025 t; Ag: 1 t; Mo: 47 t) and Xiajinbao gold deposit (Au: 3.9 t), respectively (Figure 1b).
The Xiajinbao gold deposit is an important gold deposit located in the Jidong area at the northern margin of the NCC, with an approximate grade of 1.91 g/t. The fission track dating of zircon and apatite reveal that the metallogenic age is about 153.9 Ma [6], which is close to the molybdenite Re–Os model age (163.4 Ma, [7]). The molybdenite Re–Os model age is close to the upper limit of gold mineralization in Xiajinbao deposit. The ore-forming fluid is characterized by moderate–high temperatures and moderate–high salinities, and it is enriched in CO2 [8]. Previous studies suggest that the Xiajinbao gold deposit represents a porphyry-style gold deposit [7,8,9,10]. However, further study of the Xiajinbao Au deposit is required to properly constrain the origin of the Au mineralization and the temporal relationships between mineralization and magmatism, as well as the tectonic setting of this deposit.
In this paper, we present geochemical data, zircon U–Pb age, Hf isotopic compositions and H–O–S–Pb isotopes of the deposit; we discuss the magmatic evolution, the source of the magma and ore-forming fluids, and the geodynamic setting. Based on our new data and in the context of published data, this paper attempts to elucidate the geodynamic setting and hydrothermal evolution of this Mesozoic gold deposit, and we establish a Mesozoic gold metallogenic model.

2. Regional Geology

The Jidong area is an important gold mining province in China. Located at the southeastern part of the Yanshanian tectonic belt (Figure 1b,c) along the northern margin of the North China block, the Jidong area sits at the junction between the North China block, the Siberian plate and the Pacific plate [11]. This area has experienced several tectonic events between 3800 Ma and 1600 Ma [12,13]. During the Mesozoic, the area experienced extensive magmatic activity and related gold, molybdenum, copper, lead, zinc, silver mineralization [14,15].
Widespread Precambrian rocks host most of the gold mineralization in this region, including the Jinchangyu, Yuerya, Huajian, and Dongliang Au deposits. The early Precambrian units consist of metamorphic gneisses that are dated at ca. 3.5 Ga [16,17]. The gneisses include the Paleo- to Mesoarchean Qianxi and Zunhua groups, which consist of granulite- to amphibolite-facies ortho- and paragneisses, as well as the Qian’an Terrane, comprising granulites and retrograde amphibolites [5]. The middle–upper Proterozoic strata can be divided into three units, i.e., the Changcheng units, the Jixian units and the Qingbaikou units. The strata mainly comprise a series of unmetamorphosed or weakly metamorphosed platform-type marine-facies Mg-rich carbonates, breccias, and mudstones that represent the oldest sedimentary units on top of the crystalline basement in this area. The Paleozoic strata at Jidong mainly include Cambrian, Ordovician and Permian units. The Cambrian and Ordovician strata comprise a set of platform-type neritic-facies sediments, which have a faulted contact with the underlying middle–upper Proterozoic strata. The Permian strata comprise a set of intra-continental basin sediments, which are mainly composed of fluvial-, lacustrine-, and swamp-facies and coal-bearing clastic rocks and continental red beds. The Jurassic mainly comprises middle Jurassic and upper Jurassic strata. The Triassic and lower Jurassic are not recorded. Only rare outcrops of Cretaceous strata are present in the eastern part. The middle Jurassic represents a set of volcanic-sedimentary rocks composed of continental red beds, intermediate volcanic rocks and volcaniclastic units. The upper Jurassic consists of intermediate to acidic sub-alkaline volcanic rocks. Folding is observed in the Archean crystalline basement. The early stage folding is characterized by tight homoclinal overturned folds with axial plane of the N–S-trending and west-dipping. The late-stage folding is characterized by open folds with axial plane of the SE or ENE trending and west-dipping [18]. Since the Triassic, the area experienced several tectonic cycles, including the Indo-China tectonic cycle, the Yanshanian tectonic cycle and the Himalaya tectonic cycle. The main fold in the area is the EW-oriented Malanyu anticlinorium, which formed during the late Jurassic. The faults in this area can be divided into three categories based on their time of formation and tectonic setting: (1) Archean faults, which represent the products of the intensive ductile compression and deformation of strata; (2) Faults that formed during the Proterozoic–Paleozoic and reactivated faults that formed during the Archean, including EW-striking compressive faults, N–S extensional faults and NE or NW-striking faults that formed under SN directed compression; (3) Faults that have formed since the Mesozoic are represented by NE–NNE compressional faults as well as NW extensional faults. The intrusions of the Jidong area are mainly presented by an arc-shaped belt. These intrusions mainly formed during the neo-Archean–Proterozoic, and the Triassic–Jurassic. The neo-Archean Shuichang granite has been dated at 3000 Ma [4]. The Yangyashan granite is dated at 2980 Ma [4]. The gray gneisses at Caozhuang and Huangbaiyu are dated ta 3300 Ma [4]. The Triassic magmatic rocks mainly occur in the eastern part of the Jidong area, such as the Dushan complex (210–223 Ma) [19]. The Yanshanian intrusions are widely distributed in this area and include the Wangpingshi monzonite granite (162.3 ± 1.3 Ma) [20], the Qianfenshuiling monzonite granite (153.8 ± 2.7 Ma [20], the Maoshan monzonite granite (162.7 ± 1.5 Ma) [20], the Tangzhangzi granite porphyry (173 ± 2 Ma) [21] and the Yuerya granite (174–175 Ma) [19], respectively.

3. Ore Deposit Geology

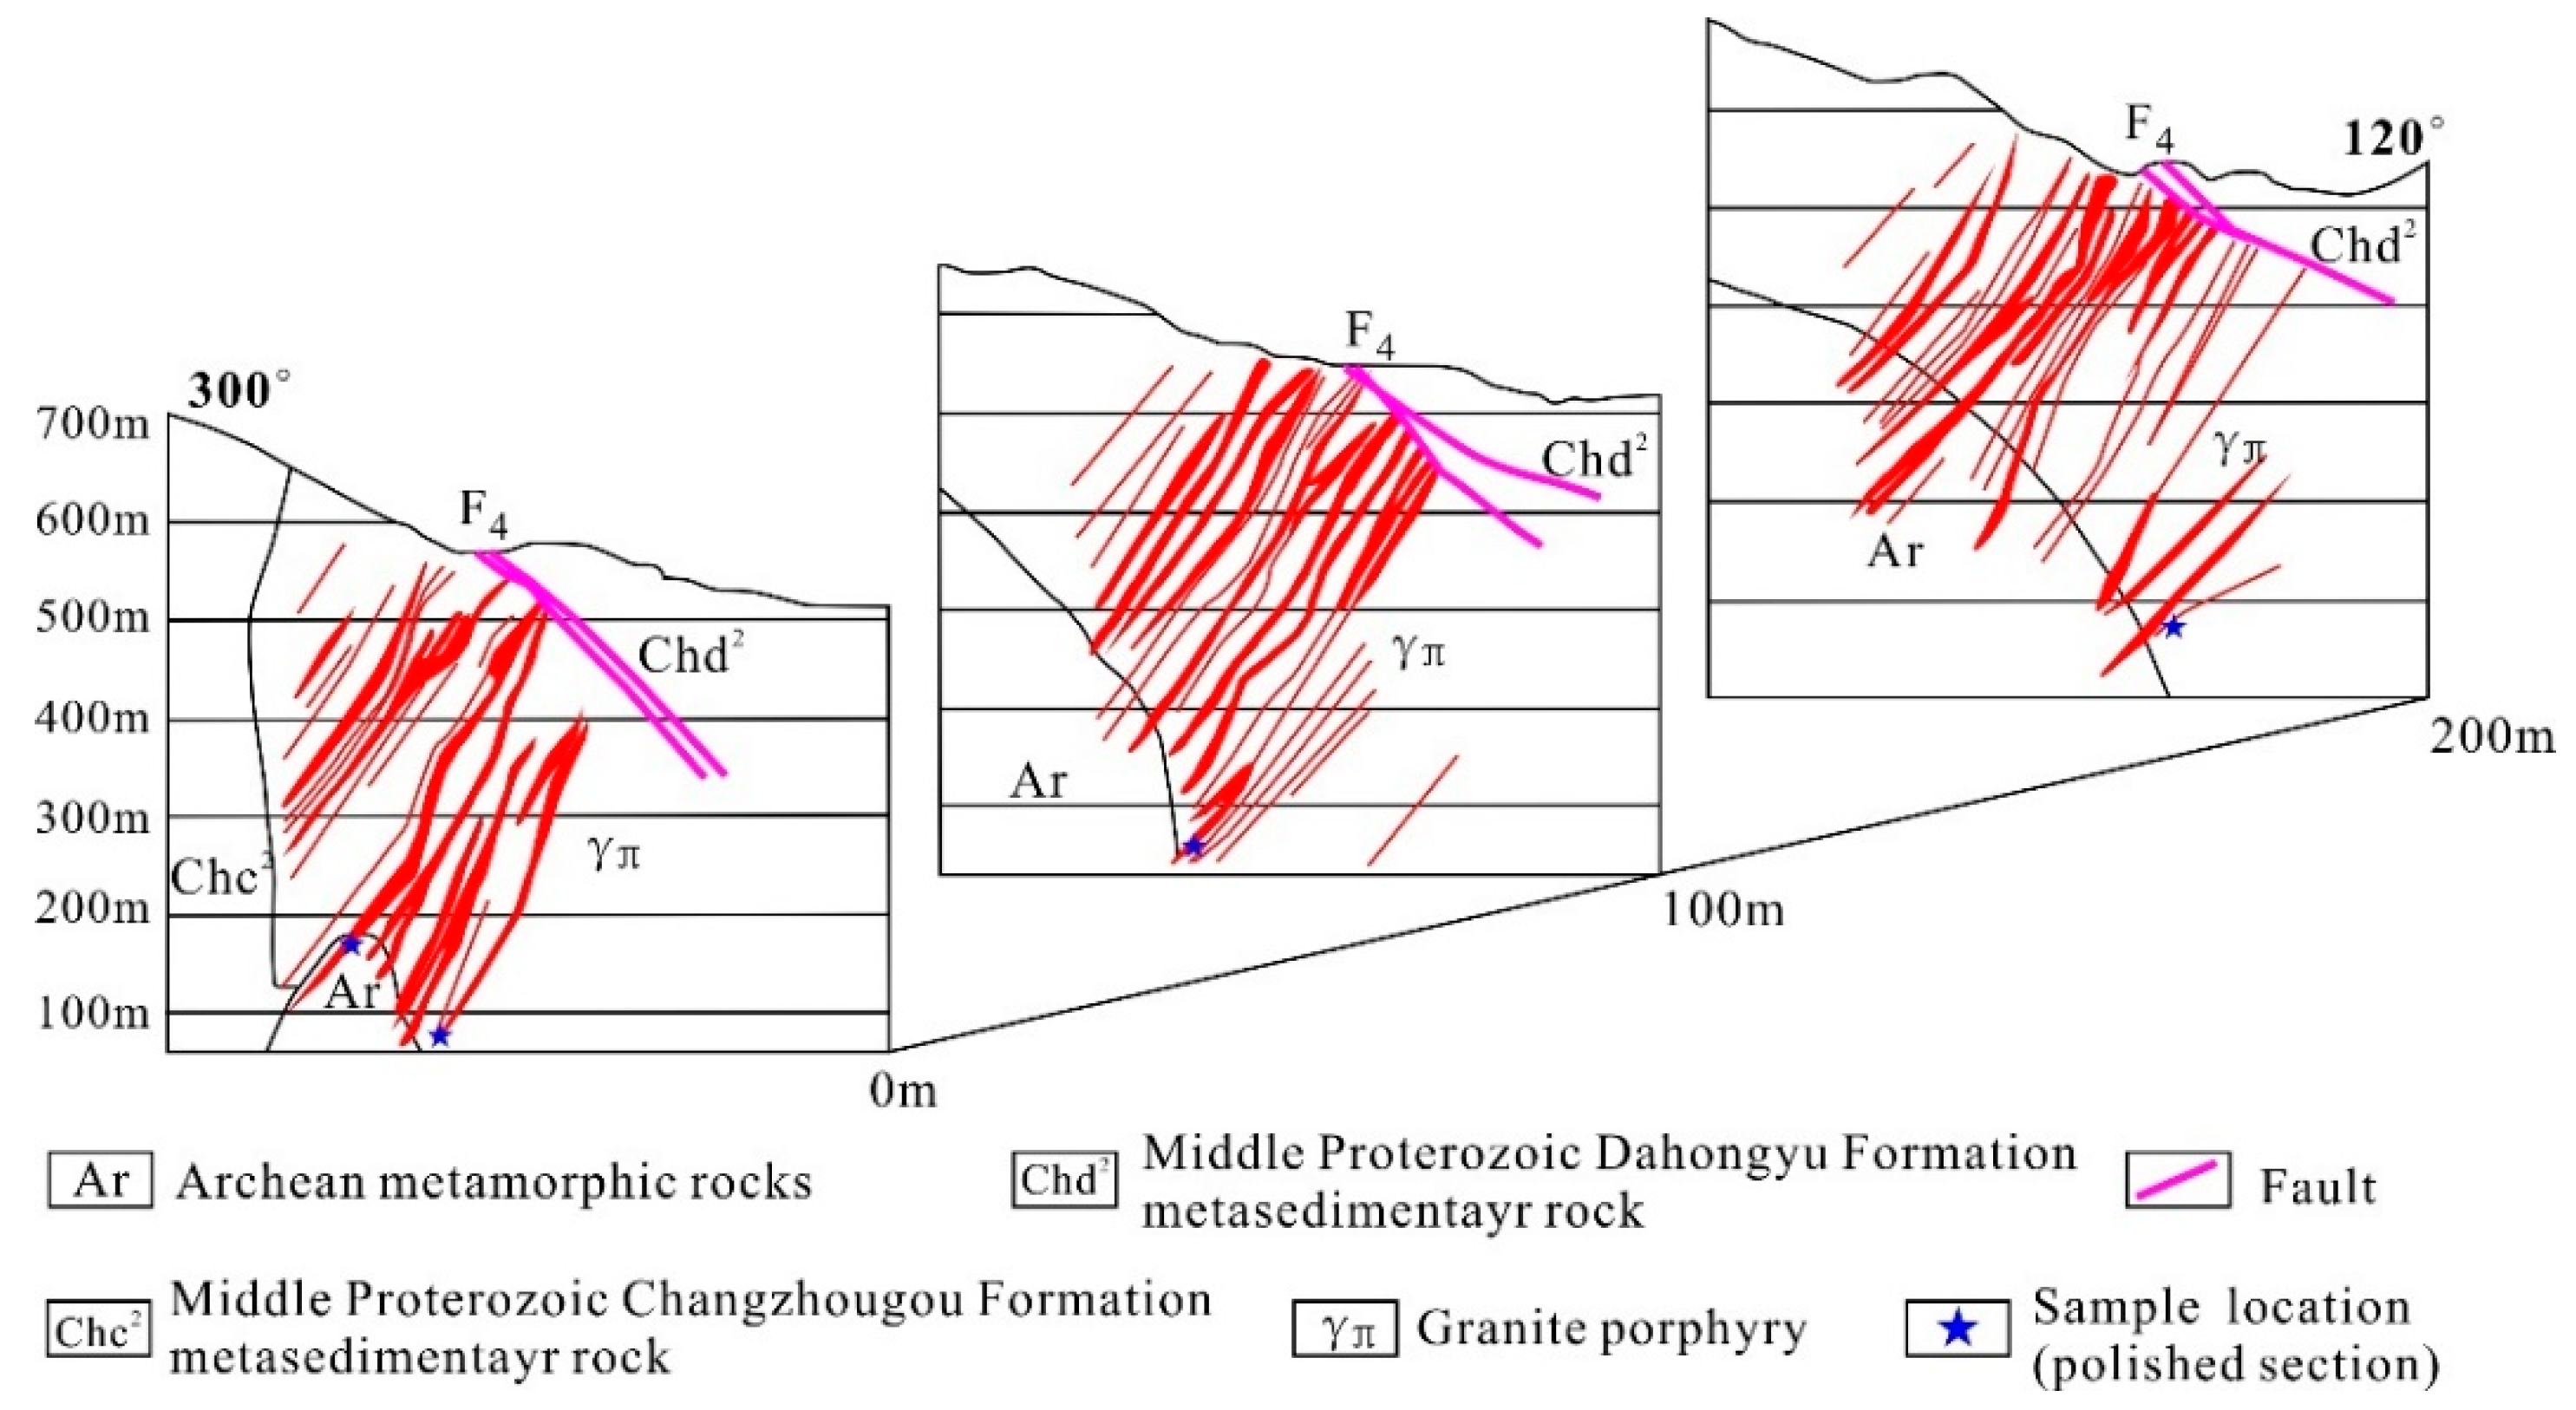
3.1. Host Rocks and Structures

The Archean Lamagou Formation of the Qianxi Group represents the oldest strata in this area (Figure 2). These strata are dominated by gray plagioclase hornblende gneiss steeply dipping to the NW at angle between 64°–86°. The schistosity strikes at about 50°. The intermediate to basic lavas that formed on the seafloor experienced Archean regional metamorphism which produced the basement gneisses. Fractures and folds are well developed. Folds mainly occur as dome structures, with well-developed interlayered detachment zones. The fractures can be divided into 3 groups: (1) NE–NNE-striking; (2) EW-striking; and (3) SN-striking. The granite emplacement is controlled by the NE–NNE-striking faults. Its Riedel structures control the mineralization.
The Xiajinbao intrusion mainly intruded into the Archean–Jurassic strata, which have porphyritic texture. The phenocrysts mainly comprise quartz, K-feldspar and minor plagioclase. The matrix mainly comprises fine-grained K-feldspar and quartz. The K-feldspar content in the rock ranges from 35–40 vol %. The phenocrysts have a hypidiomorphic crystals. The accessory minerals include zircon and apatite. The plagioclase content of the rock is approximately 30 vol %. Plagioclase phenocrysts mainly occur as hypidiomorphic platy phases crystals, with polysynthetic and Carlsbad twinning, locally with sericite and kaolinite alteration. Quartz represents 25–30 vol % of the rock and fills the spaces between other mineral grains. Biotite comprises approximately 3 vol % of the total rock.

3.2. Ore Bodies, Ore Types and Mineralogy

The Xiajinbao gold deposit consists of 28 individual satellite ore bodies. The ore bodies are distributed in parallel veins within an area that is approximately 700 m long and 400–600 m wide; these ore bodies are mainly NE-striking and, more rarely, NNE-striking. The ore bodies dip to the NW, and they pinch and swell in places (Figure 3). The average thickness of the ore bodies is 3.02 m; they have maximum grades of 7.5 g/t, minimum grades of 1.05 g/t, and averaging 1.91 g/t of gold.
The Xiajinbao gold deposit is dominated by disseminated sulfide ores and quartz vein-type ores, with the disseminated ore commonly distributed on both sides of the quartz veins (Figure 4). The main ore minerals include native gold, electrum, pyrite, chalcopyrite, galena, sphalerite and minor tetrahedrite and molybdenite. The gangue minerals include quartz, sericite, kaolinite, carbonates, and fluorite. There are two types of gold mineralization in the area. One type occurs in the form of free-milling native gold and electrum. Another type occurs as refractory gold in pyrite, galena and sphalerite [22]. The observed ore textures include idiomorphic–hypidiomorphic, allotriomorphic, replacements, exsolutions, inclusions, and fissure-filling textures (Figure 4), respectively.

3.3. Alteration Assemblages

Different types of hydrothermal alteration are well developed in the Xiajinbao gold deposit and mainly include potassic alteration, sodium alteration, silicification, sericitization, kaolinization, fluoritization and carbonization. Associated ore minerals include pyrite, galena, sphalerite, chalcopyrite, tetrahedrite, and molybdenite. Silicification, sericitization, and pyritization are most intimately related to the gold mineralization. The highest grades occur within zones of silicification and sericitization.

3.4. Mineral Paragenesis

Based on previous studies regarding the overprinting relations hips between ore-bearing veins and ore minerals (Figure 4h–j), the metallogenic processes can be grouped into three stages: the quartz–pyrite stage (Stage 1), the quartz–galena–sphalerite stage (Stage 2) and the quartz–polymetallic sulfide (pyrite, chalcopyrite, galena, sphalerite, and tetrahedrite) stage (Figure 5).
The quartz–pyrite stage (Stage 1): the quartz veins of Stage 1 are mainly recorded within the contact zone between the altered granitic intrusion and the wall rocks. The veins commonly have banded textures. The ore minerals include xenomorphic electrum and native gold. The gold is mainly distributed in fissures within pyrite. Pyrite mainly occurs in quartz veins.
The quartz–galena–sphalerite–pyrite stage (Stage 2): the quartz veins of the second stage also occur in the contact zone between the altered granite porphyry and the wall rocks. The ore minerals include hypidiomorphic grains of pyrite, sphalerite, galena, more rarely, electrum and native gold. Galena replacing sphalerite and sphalerite replacing pyrite are also observed. Most of the gold is distributed in fissures within pyrite, and more rarely, within sphalerite and galena. Rare gold inclusions occur in other sulfides.
The quartz–polymetallic sulfide stage (pyrite, chalcopyrite, galena, sphalerite, tetrahedrite) (stage 3): these quartz veins occur in the contact zone between the altered granite porphyry and the wall rocks as individual veins or stockworks. The ore minerals include hypidiomorphic granular pyrite, sphalerite, galena, chalcopyrite and tetrahedrite. Galena replacing sphalerite, sphalerite replacing pyrite, and tetrahedrite replacing chalcopyrite are also observed.

4. Sampling and Testing Methods

4.1. Sample Sites

Samples of granite porphyry were collected for major element analysis from locations shown on Figure 2. The positions of five samples for REE and trace element analyses are also shown on Figure 2. The 8 samples for H–O isotope analyses are collected from locations detailed in Table 1. The 8 samples for S isotope analyses and five samples for Pb isotope analyses are collected from positions detailed in Table 2.

4.2. Testing Methods

Major and trace element analyses were conducted at the ALS Laboratory Group Analytical Chemistry and Testing Services (Guangzhou, China). Major oxide concentrations were measured with an X-ray fluorescence (XRF) spectrometer. Fused glass disks with lithium borate were used, and the analytical precision is better than ±0.01%, referring to standards GSR-2 and GSR-3. The trace element concentrations were determined by ICP-MS. Using United States Geological Survey (USGS) rock standards (basalt, Columbia River 2 [BCR-2], basalt, Hawaiian Volcanic Observatory 1 [BHVO-1], and andesite [AGV-1]), the precision and accuracy are better than ±5%. The detailed analytical methods and procedures are described in Zhou et al. [23].
Cathodoluminescence (CL) images of the zircons were taken with a JEOL-JXA-8100 electron microprobe (JEOL Ltd., Tokyo, Japan) at GeoAnalysis Co Ltd. (Shandong Bureau Testing Center of China Metallurgical Geological Bureau, Jinan, China), operated with an acceleration voltage of 15 kV and a beam current of 2 × 10⁻⁸ A. LA-ICP-MS U–Pb zircon dating and trace element analyses were carried out at the Shandong Bureau Testing Center of China Metallurgical Geological Bureau, with a coherent 193 nm ArF excimer laser coupled to a Thermo Xeries 2 ICP-MS (Thermo Fisher Scientific, Waltham, MA, USA). Analyses were conducted with a laser diameter of 30 μm, a frequency of 8 Hz, and an energy density of 8.5 J/cm2. Ablation time was 110 s, during which a blank signal was measured for 30 s, sample ablation for 55 s, and flushing 25 s, respectively. The data were corrected according to the ICP-MS Data Calsoftware provided by Liu et al. [24].
The in situ zircon Hf isotope analyses were carried out at the State Key Laboratory for Geological Processes and Mineral Resources of China University of Geosciences, Wuhan, China. The Hf isotope analyses were performed using a Neptune Plus multicollector (MC)-ICP-MS (Thermo Fisher Scientific, Waltham, MA, USA) with helium as a carrier gas, coupled to a 193 nm GeoLas laser ablation system. The laser diameter was 44 μm and the output energy density was 5.3 J/cm2. Collection of the Hf and U–Pb data occurred at the same sample spots. Instrumental mass bias was corrected using standard GJ-1. The operating conditions and detailed analytical procedure are described in Hou et al. [25]. The 176Hf/177Hf weighted average of zircon standard sample GJ-1 was 0.282015 ± 28 (2 SD, n = 10), within error of the values reported in the literature [25,26]. The data were calculated using the ICP-MS Data Calsoftware described in Hou et al. [25] and Liu et al. [27].
The isotope samples were collected from both open pits and drill core. Pure single mineral (>95%) was selected for isotope analyses. Cu2O was used as oxidizing agent to react with the sulfide sample to produce SO2, which was frozen and collected for S isotope analysis by a MAT-251 mass spectrometer. The international standard VCDT (Meteorite sulfur from iron meteorites in Arizona and Dabilo canyon) was used. The accuracy was ±2‰. The Pb isotope analyses were determined using an IsoProbe-T thermal ionization mass spectrometer (TIMS, GV Instruments Ltd., Waltham, MA, USA). The Pb was separated and purified using a conventional cation-exchange technique with diluted HBr used as the eluant. The 208Pb/206Pb, 207Pb/206Pb, and 204Pb/206Pb ratios of the NBS981 Pb standard are 2.1681 ± 0.0008 (2σ), 0.91464 ± 0.00033 (2σ), and 0.059042 ± 0.000037 (2σ), respectively. The analyses were conducted at the Analytical Laboratory of Beijing Research Institute of Uranium Geology (BRIUG), Beijing.
The H–O isotope samples were collected from drill core. Eight mineral samples from different stages were selected for analysis. The size of the samples was around 20 mesh, with a purity of about 99.5%. The vacuum thermal explosion and zinc reduction methods were adopted to extract the hydrogen. Under vacuum conditions, and at 500–680 °C, the BrF5 method was used to collect pure O2 from quartz samples, which was transferred into CO2. The H and O isotope analyses were conducted at the Analytical Laboratory of BRIUG using MAT-253 mass spectrometry (Thermo Electron Corporation, Waltham, MA, USA). The error range of the H isotope analyses was 0.2‰. The error range of the O isotope analyses was 2‰.

5. Results

5.1. Whole-Rock Geochemistry

The major element analyses are listed in (Table 3): (1) the rocks have very high SiO2 content ranging from 70.420 to 72.976 wt %, low MgO of 0.413 to 0.530 wt %, low CaO of 1.360 to 1.550 wt %, and low TiO2 (0.173–0.215 wt %) and P2O5 (0.065–0.078 wt %) contents, respectively; (2) The rock has Na2O + K2O contents of 8.230–8.959 wt %, with high K2O contents ranging from 4.560 to 5.830 wt % and Na2O/K2O ratios ranging from 0.536 to 0.857, reflecting the high-K contents of the samples. The Rittman composite index ranges from 2.429–2.792, reflecting their calc-alkaline compositions. On the K2O–SiO2 diagram (Figure 6a), the sample points all fall within the high-K calc-alkaline and shoshonite fields; (3) The average alumina saturation index A/CNK value is 1.422. On the A/NK–A/CNK diagram (Figure 6b), the sample points all fall in the peraluminous field.
The trace element compositions of the Xiajinbao granite are presented in Table 4 and their spidergram patterns are shown in Figure 7a. The trace element spidergram patterns demonstrate fractional of the large-ion lithophile elements, resulting in enriched Rb, Ba and U contents and strongly depleted Nb, Ta, Sr, P, and Ti contents. These features are very similar to those of granites produced by crustal melting and subduction arc-derived granite magmas [28]. The LREE (Light rare earth elements) contents are strongly enriched, indicating that there is strong differentiation between the LREE and HREE (Heavy rare earth elements). The (Ce/Yb)N values range from 7.98 to 11.29, the (La/Yb)N values range from 22.17 to 32.294, and the (La/Sm)N values range from 17.70 to 21.60, indicating that strong differentiation has also occurred between the light and heavy rare earth elements (Figure 7b).

5.2. Zircon Trace Elements and U–Pb Chronology

The CL images of zircons reveal idiomorphic shapes, with the development of oscillatory and rhythmical zoning (Figure 8). The widths of these zones are relatively even, indicating that the temperature changed at relatively consistent rates during their crystallization. The zircon grains have diameters ranging from 50 to 350 μm, with length/width ratios ranging from 1:1–4:1. They are fresh and do not record evidence of hydrothermal alteration.
Zircons from different sources can have different Th and U contents. Magmatic zircons typically have high Th and U contents, and their Th/U ratios range from 0.1 to 1.0 [29,30] and commonly above 0.5 [30]. Their trace element compositions (Table 5) have Th/U ratios between 0.46 and 0.74, indicating that the zircons have primary magmatic features. In addition, the rare earth element distribution of the zircons is also similar to those of magmatic zircons (Figure 9). Therefore, the 16 zircons used for U–Pb isotopic dating are all of a magmatic origin and can be used to define the age of the granite. The results of the U–Pb chronological analyses of the Xiajinbao magmatic zircons are detailed in Table 6.

5.3. Hf Isotopic Compositions

The results of the zircon Hf isotopic analyses (Table 7) of the granite demonstrate that the 176Lu/177Hf ratios of both samples range from 0.000774 to 0.001561. These extremely low ratios imply that the zircons did not experience significant accumulation of radioactive Hf after crystallization. Calculations based on the ages of single zircons reveal that the 176Hf/177Hf ratios of the 16 zircons range from 0.282372 to 0.282462, with an average value of 0.282409. The zircon εHf(t) values range from −10.913 to −7.5828. The fLu/Hf values of the Xiajinbao rock body range from −0.97669 to −0.95298, with an average value of −0.96137. The TDM2 values of the Xiajinbao granite range from 1496.638 to 1673.632 Ma.

5.4. H and O Isotope Compositions

The δ18O values of the fluid in equilibrium with quartz can be obtained by calculating the homogenization temperatures of the fluid inclusions of each mineralization stage based on the following equation: δ18OQ–δ18OH2O ≈ 3.38 × 10⁶/T2 − 3.40 [31]. The δD values of the fluid can be obtained by analyzing the fluids trapped in the inclusions of the veins (Table 8). The δ18O values of the fluids of the quartz–pyrite stage (early stage) range from 7.26‰ to 8.96‰, and the δD values of the fluids range from −91.4‰ to −91‰. The δ18O values of the fluids of the quartz–galena–sphalerite stage (middle stage) range from 2.34‰ to 2.74‰, while the δD values of the fluids range from −91.4‰ to −91‰. The δ18O values of the fluids of the quartz–polymetallic sulfide stage (middle stage) range from −9.25‰ to −5.55‰, and the δD values of the fluids range from −96.6‰ to −83.1‰.

5.5. S–Pb Isotope Compositions

The results of the S isotope analyses of the Xiajinbao gold deposit are listed in Table 9. The δ34S values of the five pyrite samples range from 2.4‰ to 3.7‰, with an average value of 3.26‰. The δ34S values of the five galena samples range from −0.2‰ to 0.7‰, with an average value of 0.22‰. The Pb isotope compositions of the Xiajinbao gold deposit are illustrated in Table 10. The 208Pb/204Pb ratios of the sulfides range from 35.975 to 36.204; their 207Pb/204Pb values range from 15.160 to 15.231, and their 206Pb/204Pb values range from 16.1 to 16.176.

6. Discussion

6.1. Age of the Xiajinbao Granite and Related Au Mineralization

We present a new LA-ICP-MS zircon U–Pb age of the Xiajinbao granite of 157.8 Ma (Figure 10), which is similar to the metallogenic age (153.9 Ma, [6]) derived from zircon and apatite fission track dating and the molybdenite Re–Os model age (164.3 Ma, [7]). The gold mineralization is also spatially associated with the intrusions (Figure 2 and Figure 3). Most of the gold deposits at Jidong are located within 0–5 km of granitic plutons [4,5]. In addition, the metallogenic ages of most of the gold deposits in the Jidong area overlap with the granitic magmatism (Table 11). For example, the SHRIMP U–Pb age of the Yuerya granite is 174–175 Ma [32]; the molybdenite Re–Os age of the Yuerya gold mineralization is 169.8 Ma [33]; the zircon LA-ICP-MS U–Pb age of the Tangzhangzi granite is 173 ± 2 Ma [21]; the molybdenite Re–Os age of the Tangzhangzi gold mineralization is 170.1 ± 1.6 Ma [34]; the SHRIMP U–Pb age of the Niuxinshan granite is 172–173 Ma [21,32]; the Ar–Ar age of the Niuxinshan (Huajian) gold mineralization is 175.8 Ma [35]; and the molybdenite Re–Os age of the Jinchangyu gold deposit is 223 ± 5 Ma. Song [5] infer that there may be a concealed middle Triassic intrusion associated with this deposit.
In recent years, with the emergence of precise chronological dating methods (Table 11), the temporal evolution of the Jidong area has become relatively clear. The magmatic events in this area mainly occurred during the period of 223–153 Ma and are characterized by three main periods during the late Triassic (225–205 Ma), the early Jurassic (200–185 Ma) and the middle–late Jurassic (175–160 Ma), respectively (Figure 11). The metallogenic events in this area mainly occurred during the period of 223–155 Ma and include two mains periods in the late Triassic (223–210 Ma) and middle–late Jurassic (175–155 Ma) (Figure 11), respectively. The timing of the Mesozoic magmatic activity and gold metallogenesis in the eastern Hebei ore district reveal that the gold metallogenesis correlates with the late Triassic and middle–late Jurassic magmatic events.

6.2. Magma Sources

The Nd/Th ratios of the Xiajinbao granite range from 2.46 to 2.90, which are similar to those of crust-derived rocks (≈3), but significantly different from those of mantle-derived rocks (>15) [36], thus precluding their direct derivation from the mantle. In general, mantle-derived magmas are characterized by low Lu/Yb ratios (0.14–0.15), whereas the continental crust has relatively high Lu/Yb ratios (0.16–0.18) [37]. Hence, the high Lu/Yb ratios of the samples of 0.15–0.18 also suggest that the Xiajinbao granite is likely to represent the product of crust-derived magmas. Peraluminous granites are derived from partial melting of sedimentary rocks (e.g., silty sandstone, psammite, and graywacke) [38]. The CaO/Na2O ratio is a very important index for defining source components [28]. Peraluminous granites that form from argillaceous rocks have CaO/Na2O values of <0.3, and granitoids that form from psammite have CaO/Na2O values of >0.3 [28]. The CaO/Na2O ratios of the Xiajinbao granite range from 0.39–0.44, indicating that the magma was derived from psammitic rocks. On the Rb/Ba-Rb/Sr diagram (Figure 12a) and the CaO/(FeOTotal + MgO) − Al2O3/(FeOTotal + MgO) diagram (Figure 12b), the sample points also fall into the graywacke range of the clay-poor source region, indicating that this magma was derived from partial melting of crustal meta-sandstones.
The zircon εHf(t) values of the Xiajinbao granite range from −10.913 to −7.5828. The Hf isotopic crust model ages (TDM2) range from 1496.64–1673.63 Ma. The εHf(t) and TDM2 values of both samples exhibit relatively small variation (Figure 13a). The zircon Hf isotopic compositions are relatively stable, indicating that the zircons were derived from one single source. On the 176Hf/177Hf-t diagram (Figure 13b), the zircon Hf isotopic compositions also plot in a small range above the crustal evolution line, indicating that the Xiajinbao granite was derived from partial melting of crustal material. The TDM2 ages obtained from the zircon Hf isotope data are close to the ages (1400–1800 Ma) of the sediments of the Changcheng Formation. Therefore, it is likely that the melts were derived from a crustal source. Comparing the zircon Hf isotopic compositions (εHf(t)) of the different intrusions in the Jidong area reveals that the εHf(t) values of the late Triassic intrusions (e.g., the Dushan intrusion) are characterized by variable values, indicating that their magma sources represent mixtures between the mantle and the crust (Figure 13a). The εHf(t) values (−13.4 to −10.8) of the middle–late Jurassic magmatic rocks (175–160 Ma) (e.g., the Baijiadian intrusion, 170.5 Ma [39]) exhibit only small variations (Figure 13a), which suggests that the Baijiadian granitic intrusion was also derived from partial melting of crustal material.
On the 207Pb/204Pb–206Pb/204Pb and the 208Pb/204Pb–206Pb/204Pb diagrams (Figure 14), the Qingshankou granite, which formed during the second period (200–185 Ma), and the Yuerya and Niuxinshan granites, which formed during the third period (175–160 Ma), all plot close to the lower crust evolution line, indicating that the magmas shared a similar source, i.e., lower crustal material. As mentioned above, the Mesozoic magmatic events can be divided into three stages. The magma composition of the late Triassic magmatic rocks suggests mixing between mantle and crustal sources. The early Jurassic magmatic rocks are derived from melting of the lower crust, for example, the Qingshankou intrusion. The middle–late Jurassic magmatic rocks are derived from melting of lower crustal material, for example, the Yuerya and Niuxinshan granites, the Baijiadian intrusion and the Xiajinbao granite, respectively.

6.3. Petrogenesis of the Xiajinbao Granite Porphyry

Granitic rocks are commonly divided into I-, S-, M- and A-type granites based on the nature of their protolith; however, M-type granitic rocks are rarely reported. Various definitions are proposed by numerous researchers [44,45,46,47]. Based on Na2O–K2O diagrams, previous studies concluded that the Xiajinbao granite porphyry represents an A-type granite [48]. However, A-type granites usually have very characteristic geochemical features (e.g., high FeOT/MgO ratios and high field strength element (HFSE) contents) [47]. The Zr values of the major minerals are low, suggesting that their crystallization had little impact on the Zr content of the evolving magma [49]. Due to the behavior of Zr relatively immobile during hydrothermal alteration, the variations in its contents are commonly used as an indicator for magmatic differentiation. On the Zr–FeOT/MgO diagram (Figure 15a), the FeOT/MgO ratios and Zr values show a positive correlation, consistent with the evolved composition of the granites. A typical granitic melt has very little variation of Y/Ho values, which are typically close to the chondritic Y/Ho ratio (27.7 ± 1.9 [50]). However, interactions between the rock and fluids could result in a wider range of variation of Y/Ho values [51]. The Y/Ho ratios of the Xiajinbao granitic porphyry range from 29.61 to 32.42, which are higher than that of chondrite (27.7 ± 1.9 [50]), indicating that the magma experienced magma-fluid interaction during its evolution. On the Y/Ho–FeOT/MgO diagram (Figure 15b), the FeOT/MgO and Y/Ho values show a positive correlation, indicating that the high FeOT/MgO ratios of the Xiajinbao granite could have resulted from interactions between the magma and fluids. The division of I-type and S-type granites is based on the magma source [45]. As mentioned above, the Xiajinbao granite represents a peraluminous rock (A/CNK = 0.89–1.13, averaging 1.422), which was derived from partial melting of the Changcheng meta-graywacke and thus can be classified as S-type granite. However, the Xiajinbao granite does not contain Al-rich minerals, such as cordierite, garnet, and primary muscovite. During magmatic differentiation, the P2O5 contents of the Xiajinbao granite tend to decrease (Figure 15c), in contrast to S-type granites [52]. Low P2O5 content is a significant criterion for distinguishing I-type from S-type granites [28]. On the P2O5–Rb diagram (Figure 15d), the Xiajinbao granite falls into the range of I-type granites.

6.4. The Source of Ore-Forming Materials

The δ18OH2O values of the quartz that formed during the early mineralization period range from 7.26–8.96‰, which are consistent with O isotope compositions (5.5–9.5‰) of magmatic water defined by Sheppard [53]. The δ18OH2O values of the quartz during the quartz–galena–sphalerite stage (Stage 2) and the quartz–polymetallic sulfide stage (Stage 3) from 2.34‰ to 2.74‰ and from 9.25‰ to −5.55‰, respectively, which are consistent with the O isotope composition of meteoric water, indicating an increasing influence of meteoric waters during the mineralization. On the δD–δ18OH2O plot (Figure 16), the samples from the Xiajinbao, Jinchangyu, Yuerya, Tangzhangzi, Dongliang and Huajian gold deposits all fall into the field of magmatic water or they range between magmatic and meteoric water, indicating that the hydrothermal fluids underwent mixing with meteoric waters during their evolution.
Ohmoto [58] suggests that the δ34S values of hydrothermal sulfides are functions of the δ34S values of the hydrothermal fluids, oxygen fugacity (fO2), temperature, pH, and ionic potential, i.e., δ34Smineral = f(δ34S∑S, fO2, T, pH, I). The δ34S values of the hydrothermal minerals depends not only on the δ34S values of the source region, but also on the physical and chemical conditions during the transport and precipitation of sulfur in the hydrothermal fluid. Ohmoto [59] suggests that the δ34S values of the hydrothermal fluid should be similar to those of the sulfides, namely, δ34S∑S ≈ δ34Ssulfide, in a hydrothermal system with a relatively simple mineral assemblage in the absence of sulfates. No sulfate minerals were found at the Xiajinbao gold deposit, and its mineral composition is relatively simple, mainly comprising quartz, pyrite, galena, sphalerite and chalcopyrite. Therefore, its sulfide composition should represent the total sulfur composition of the hydrothermal system. The δ34S values of the Xiajinbao deposit (−0.2 to 3.7‰) are similar to those of a magmatic-hydrothermal system (0 ± 5‰ [58]) and slightly lower than those of the crust (mean +7‰ [60]), indicating that the sulfur of the Xiajinbao deposit was derived from magmatic-hydrothermal sources. Additionally, the sulfide isotope compositions of other gold deposits such as the Jinchangyu, Yuerya, Tangzhangzi, Dongliang and Huajian gold deposits all fall into the range of 0 ± 5‰, indicating that Mesozoic magmatism also provided a source of sulfur for the formation of these gold deposits. On the S isotope distribution diagram (Figure 17), the S isotope compositions of the above-mentioned gold deposits plot close to the S isotopic composition of the Archean plagioclase hornblende gneisses, indicating that these gneisses also provided a source of sulfur for the gold deposits at Jidong.
On both the 207Pb/204Pb–206Pb/204Pb diagram and the 208Pb/204Pb–206Pb/204Pb diagram (Figure 14), the data (from the Xiajinbao, Jinchangyu, Yuerya, Tangzhangzi, Dongliang and Huajian gold deposits) form a clear linear relationship. In a 2-end-member system, all Pb isotope data fall on a line between two end members. In a 3-end-member system, all data plot in the triangular zone defined by three end members [61]. Therefore, Figure 14 showing linear relationship suggests that the source of Pb in these deposits likely originated two end members. The Pb isotopic compositions of the Xiajinbao, Jinchangyu, Yuerya, Tangzhangzi, Dongliang, and Huajian gold deposits in this area are not only related to the granitic magma, both temporally and spatially, but are also close to those of the Archean plagioclase hornblende gneiss (Figure 14). Overall, the S and Pb compositions of the Jidong gold deposits are all derived from the Mesozoic granitic magma and the Archean plagioclase hornblende gneisses.

6.5. Origin of the Granite Porphyry and Related Xiajinbao Au Mineralization

The magmatic age (157 Ma) corresponds to the simultaneous movement of several plates (i.e., the Siberia plate, the Mongolia–Northern China plate and the Paleo–Pacific plate), which caused intra-continental collision and orogenic movement along the northern margin of the North China plate, resulting in crustal compression and thickening [62,63,64,65,66,67,68,69,70]. The simultaneous subduction of several plates (i.e., the Siberia plate, the Mongolia–Northern China plate and the Paleo–Pacific plate, [62,63,64,65,66,67,68,69,70]) caused the continuous thickening and partial melting of the Changcheng meta-graywacke in this area, resulting in the formation of Au-rich granitic magmas. The magmatic-hydrothermal brines associated with I-type magmas can transport the metals, including gold, and sulfur required for ore formation [71]. When primitive magmatic fluids migrated along structures, the metals from the Archean plagioclase hornblende gneiss were leached, thus forming the metallogenic fluids. Under medium to low temperatures, gold is usually transported as Au-S(H) complexes such as Au(HS)2− [72,73]. As a result of a decreasing temperature or a sudden pressure release, the gold-bearing complexes were destabilized, resulting in the precipitation of gold [8]. The remaining S2– and Fe2+ precipitated as pyrite, forming the early stage auriferous pyrite–quartz veins. As the metallogenic process continued, there was an influx of meteoric water. The mixing process of the fluids was accompanied by oxidation and the loss of H2S, which were the main reasons for the destabilization of the gold-bearing sulfide complexes in the middle–late-stage quartz veins [74]. The remaining S2– combined with metals such as Cu2+, Fe2+, Pb2+ and Zn2+ to precipitated as chalcopyrite, galena and sphalerite.
Many scholars believe that the Xiajinbao gold deposit belongs to a porphyry-type gold deposit because (1) its metal contents are mainly derived from the Xiajinbao granite intrusion [8,9,48]; (2) its metallogenic fluids have high salinity, similar to porphyry deposits [8]; (3) the Sb and Bi contents in the auriferous galena are similar to those of some porphyry-type deposits in the Western Henan Province [75]; and (4) the auriferous pyrite has high contents of Cu, Pb, Zn, Sb, Ag, and Au, which is similar to pyrite from mesothermal gold deposits and porphyry deposits [9]. The Xiajinbao gold deposit also shows many features similar to those of intrusion-related gold deposits, while porphyry Cu–Au deposits are generally associated with dominantly oxidized, magnetite-series and less fractionated calc-alkaline to alkaline magmatic suites that have affinities with magmatic and/or island arcs (e.g., References [76,77]), intrusion-related Au deposits are associated with more reduced I-type, calc-alkaline intrusions [78]. Compared with the more oxidized and less fractionated granitoids associated with porphyry systems [79,80], the Xiajinbao Au deposit is associated with highly fractionated (high Rb/Sr ratios of 0.40 to 0.74, Avg. 0.58) I-type granitoids; additionally, the Xiajinbao granitic magma also exhibits low oxidation states [81]. In contrast to porphyry Cu–Au systems, which are generated in subduction-related settings, the Xiajinbao Au deposit formed in a complex tectonic setting during the simultaneous movement of several plates (i.e., the Siberia plate, the Mongolia–Northern China plate and the Paleo–Pacific plate), similar to the intrusion-related Au deposits of the Yilgarn Craton that are located in a tectonic setting inboard of a convergent plate margin [82,83,84]. (3) In general, ore-zone geometries mainly depend on the overall form of the host stock or dike complex [85,86]. However, the gold ore bodies in this area are mainly distributed as parallel veins that are NW-dipping, NE-striking, and structurally controlled by NE-striking faults (Figure 2 and Figure 3), which is inconsistent with typical porphyry-type deposits [86]. By contrast, these ore bodies show features of intrusion-related gold deposits, such as the Tintina gold belt in Yukon, Canada [78,87]. The spatial pattern of the wall rock alteration of the Xiajinbao deposit is controlled by F2 faults, showing an NNE-striking orientation (Figure 2). In addition, the spatial distribution of alteration at Xiajinbao does not show alteration pattern of porphyry-type deposits. The alteration types in this area include K-alteration and Na-alteration pre-dating the metallogenic stage and silicification, sericitization, carbonization, and kaolinization during the main metallogenic stage, which are similar to those observed in other intrusion-related gold deposits. Furthermore, gold precipitation is always closely related to sericitization [78]. (5) The hydrothermal fluids are characterized by moderate temperatures, moderate to low salinities, low alkali contents, low fO2 and high CO2 contents [48]. These characteristics are all similar to those of the metallogenic fluids from intrusion-related gold deposits and different from those from porphyry-type deposits [78].

6.6. Evolution of the Mesozoic Gold Mineralization in the Jidong Area

During the Archean, the crust was relatively thin and active, accompanied by intensive magmatic activity. Basic to ultra-basic volcanic rocks were formed. As a result of regional metamorphism, the mafic plagioclase hornblendite gneisses with high Au background values formed [4,9,88].
After the late Paleozoic, the area was affected by several plate subduction collision events (i.e., the Siberia plate, the Mongolia–Northern China plate and the Paleo–Pacific plate, [62,63,64,65,66,67,68,69,70]), including the closure of the Paleo–Pacific Ocean, the closing of the Mongolia–Okhotsk Ocean, and the subduction of the Paleo–Pacific Ocean [62,63,64]. After the closure of the Mongolian plate and the Northern China plate along the Sauron suture during the late Permian [24,89], the eastern Hebei area (on the northeastern edge of the Yanshan tectonic belt) was subject to post-collisional extension [90,91]. Meanwhile, asthenospheric mantle upwelling transformed the lower crust. Mantle-derived magma underplated the bottom of the lower crust, triggering intensive mantle–crust interaction and inducing partial melting of the ancient lower crust [91]. The mantle–crust-derived magma intruded along fractures, marking the first episode of magmatic activity at ca. 225–205 Ma and the first episode of gold mineralization at about ca. 223–210 Ma (Figure 18a) during the Mesozoic. When the magma intruded into metamorphic rock strata, the differentiated magmatic water transformed the primitive ore source strata (Archean plagioclase hornblende gneiss) and leached the gold from the strata. Hydrothermal fluids associated with magmatism formed the Jinchangyu gold deposit [88].
During the early Jurassic, the Northern China–Mongolia plate collided with the Siberia plate, and the Mongolia–Okhotsk Ocean gradually closed from west to east [65,66,67]. This resulted in the NE compression and the formation of the Yanshanian orogenic belt, leading to the thickening and melting of the crust and resulting in the early Jurassic magmatic activity in this area, such as the Qingshankou granite. During the middle–late Jurassic, the Paleo–Pacific plate subducted beneath the Northern China plate along a NW trench [67,68,69,70]. The simultaneous subduction of several plates caused the continuous thickening of the crust along the northern margin of the Northern China plate during the middle and late Jurassic. As a result, the magma derived from partial melting of the crust intruded along fractures, resulting in the 175–160 Ma magmatic activity of this area (e.g., the Xiajinbao granite porphyry, Baijiadian granite, Yuerya granite, and Niuxinshan granite) as well as the second phase of gold metallogenesis (ca. 175–155 Ma) (Figure 18b). Different magmatic emplacement mechanisms resulted in gold deposits of different types: (1) when the magma experienced a cryptoexplosion during its intrusion, it would result in the formation of a cryptoexplosion-type gold (molybdenum) deposit–vein-type gold deposit hosted by phreatic breccias or by granite porphyry breccias, such as the Tangzhangzi gold deposit [34]; (2) when the magma was emplaced within a clastic sediment (meta-sandstone), it would result in the formation of a hydrothermal gold deposit, intrusion-related gold deposit and/or porphyry-type gold deposit, such as the Huajian gold deposit [54], the Dongliang gold deposit [92], the Yuerya gold deposit (part of the ore bodies) [56], and the Xiajinbao gold deposit, respectively; (3) when the magma was emplaced into a chemically reactive stratum (e.g., limestone), it would result in the formation of skarn-type gold deposits, such as the Yuerya gold skarn [56].

7. Conclusions

(1)
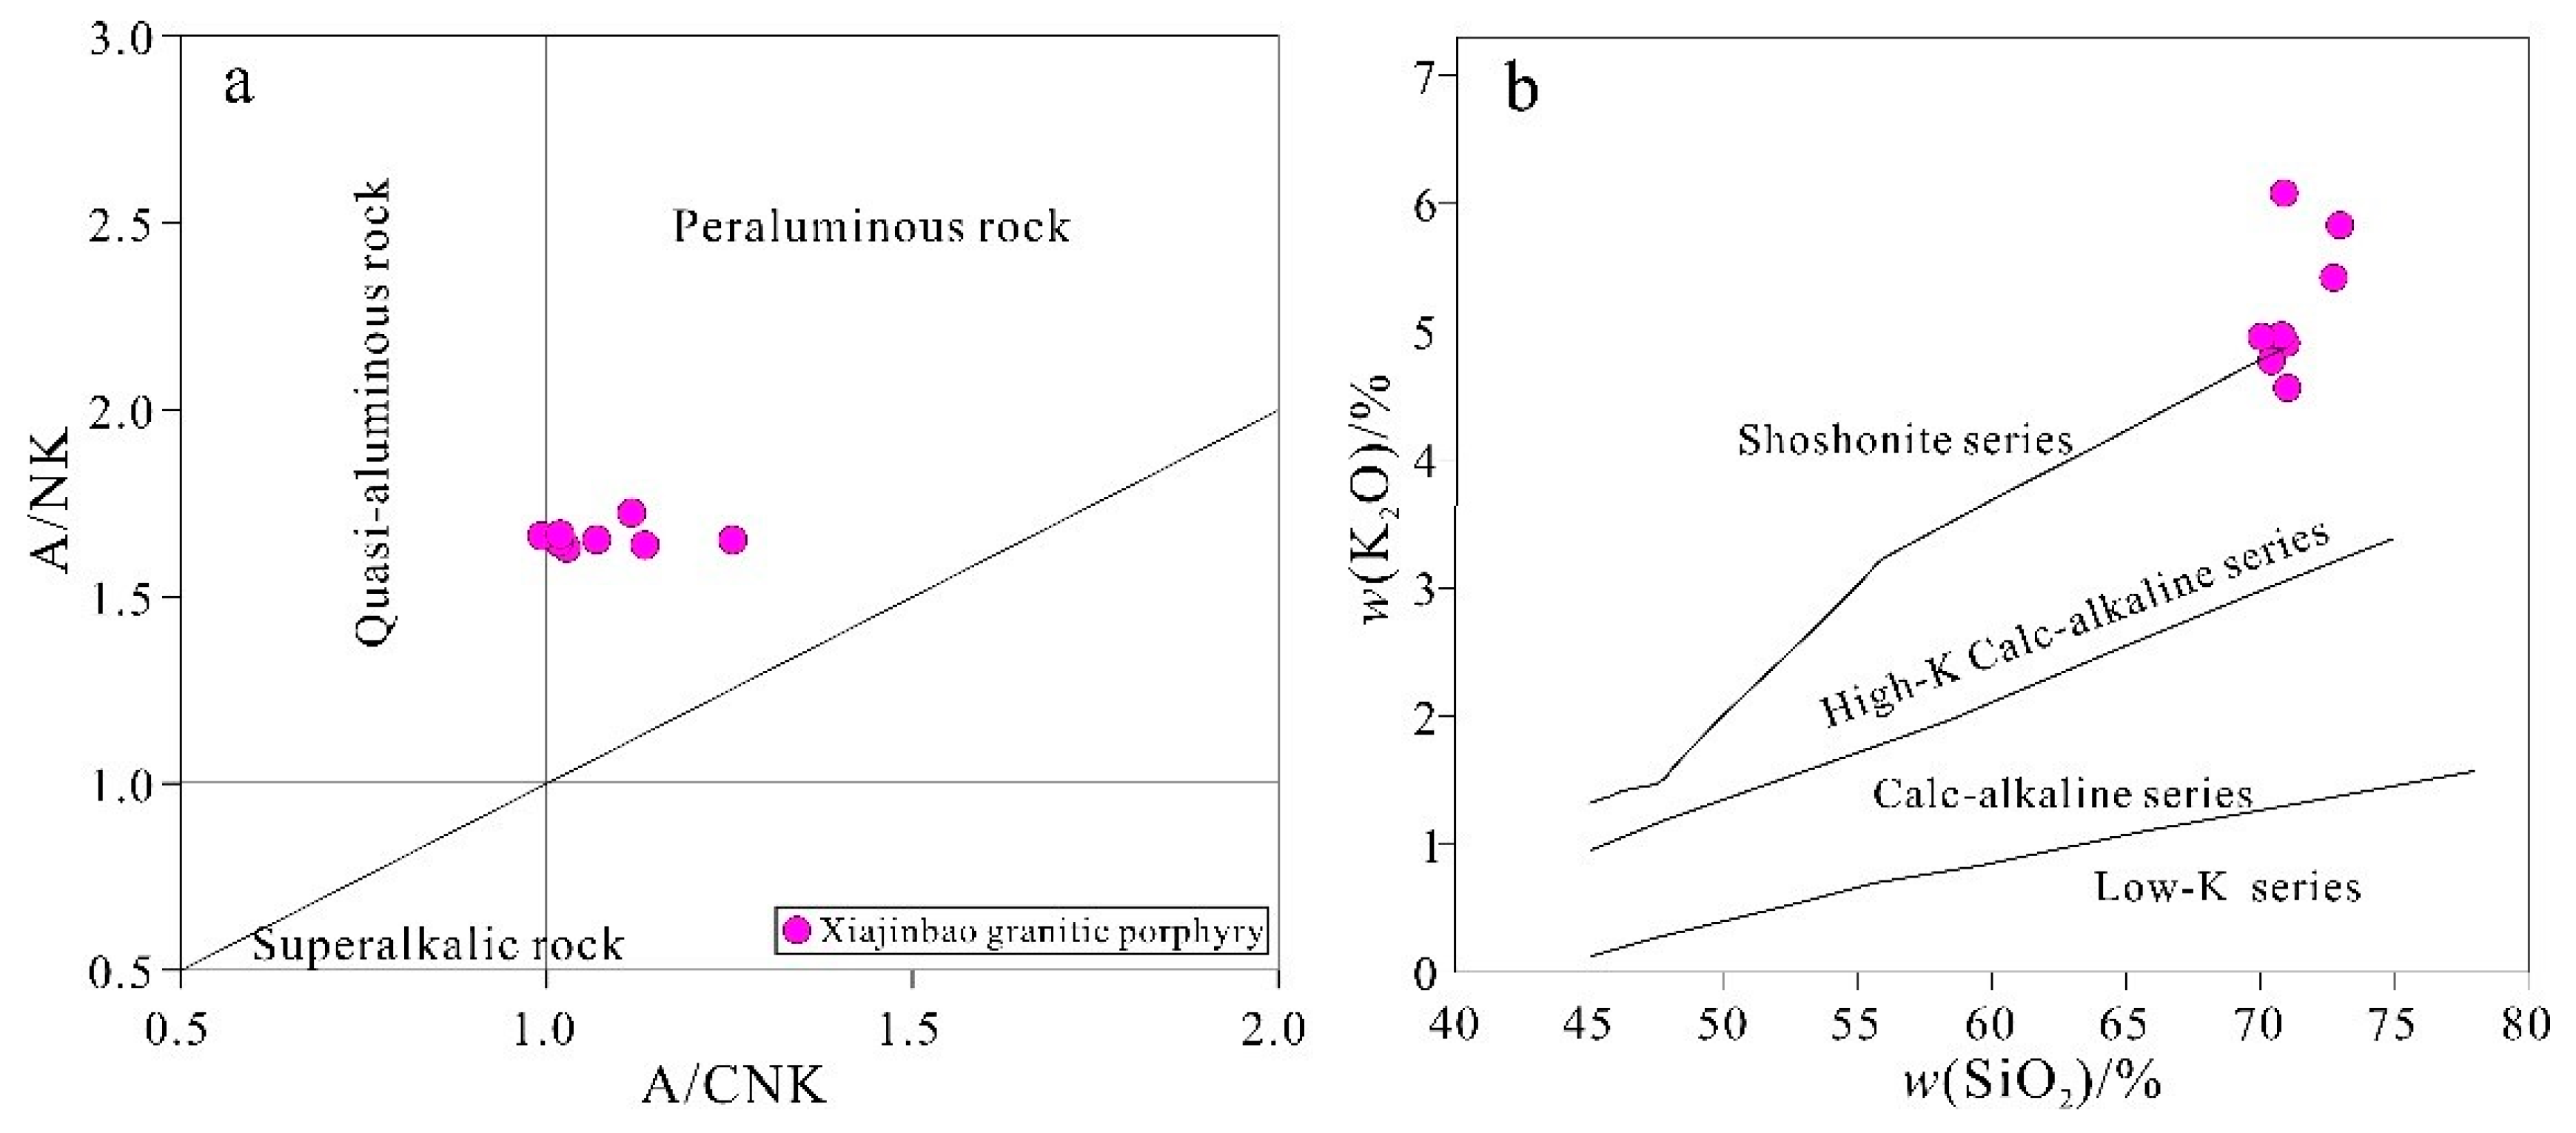
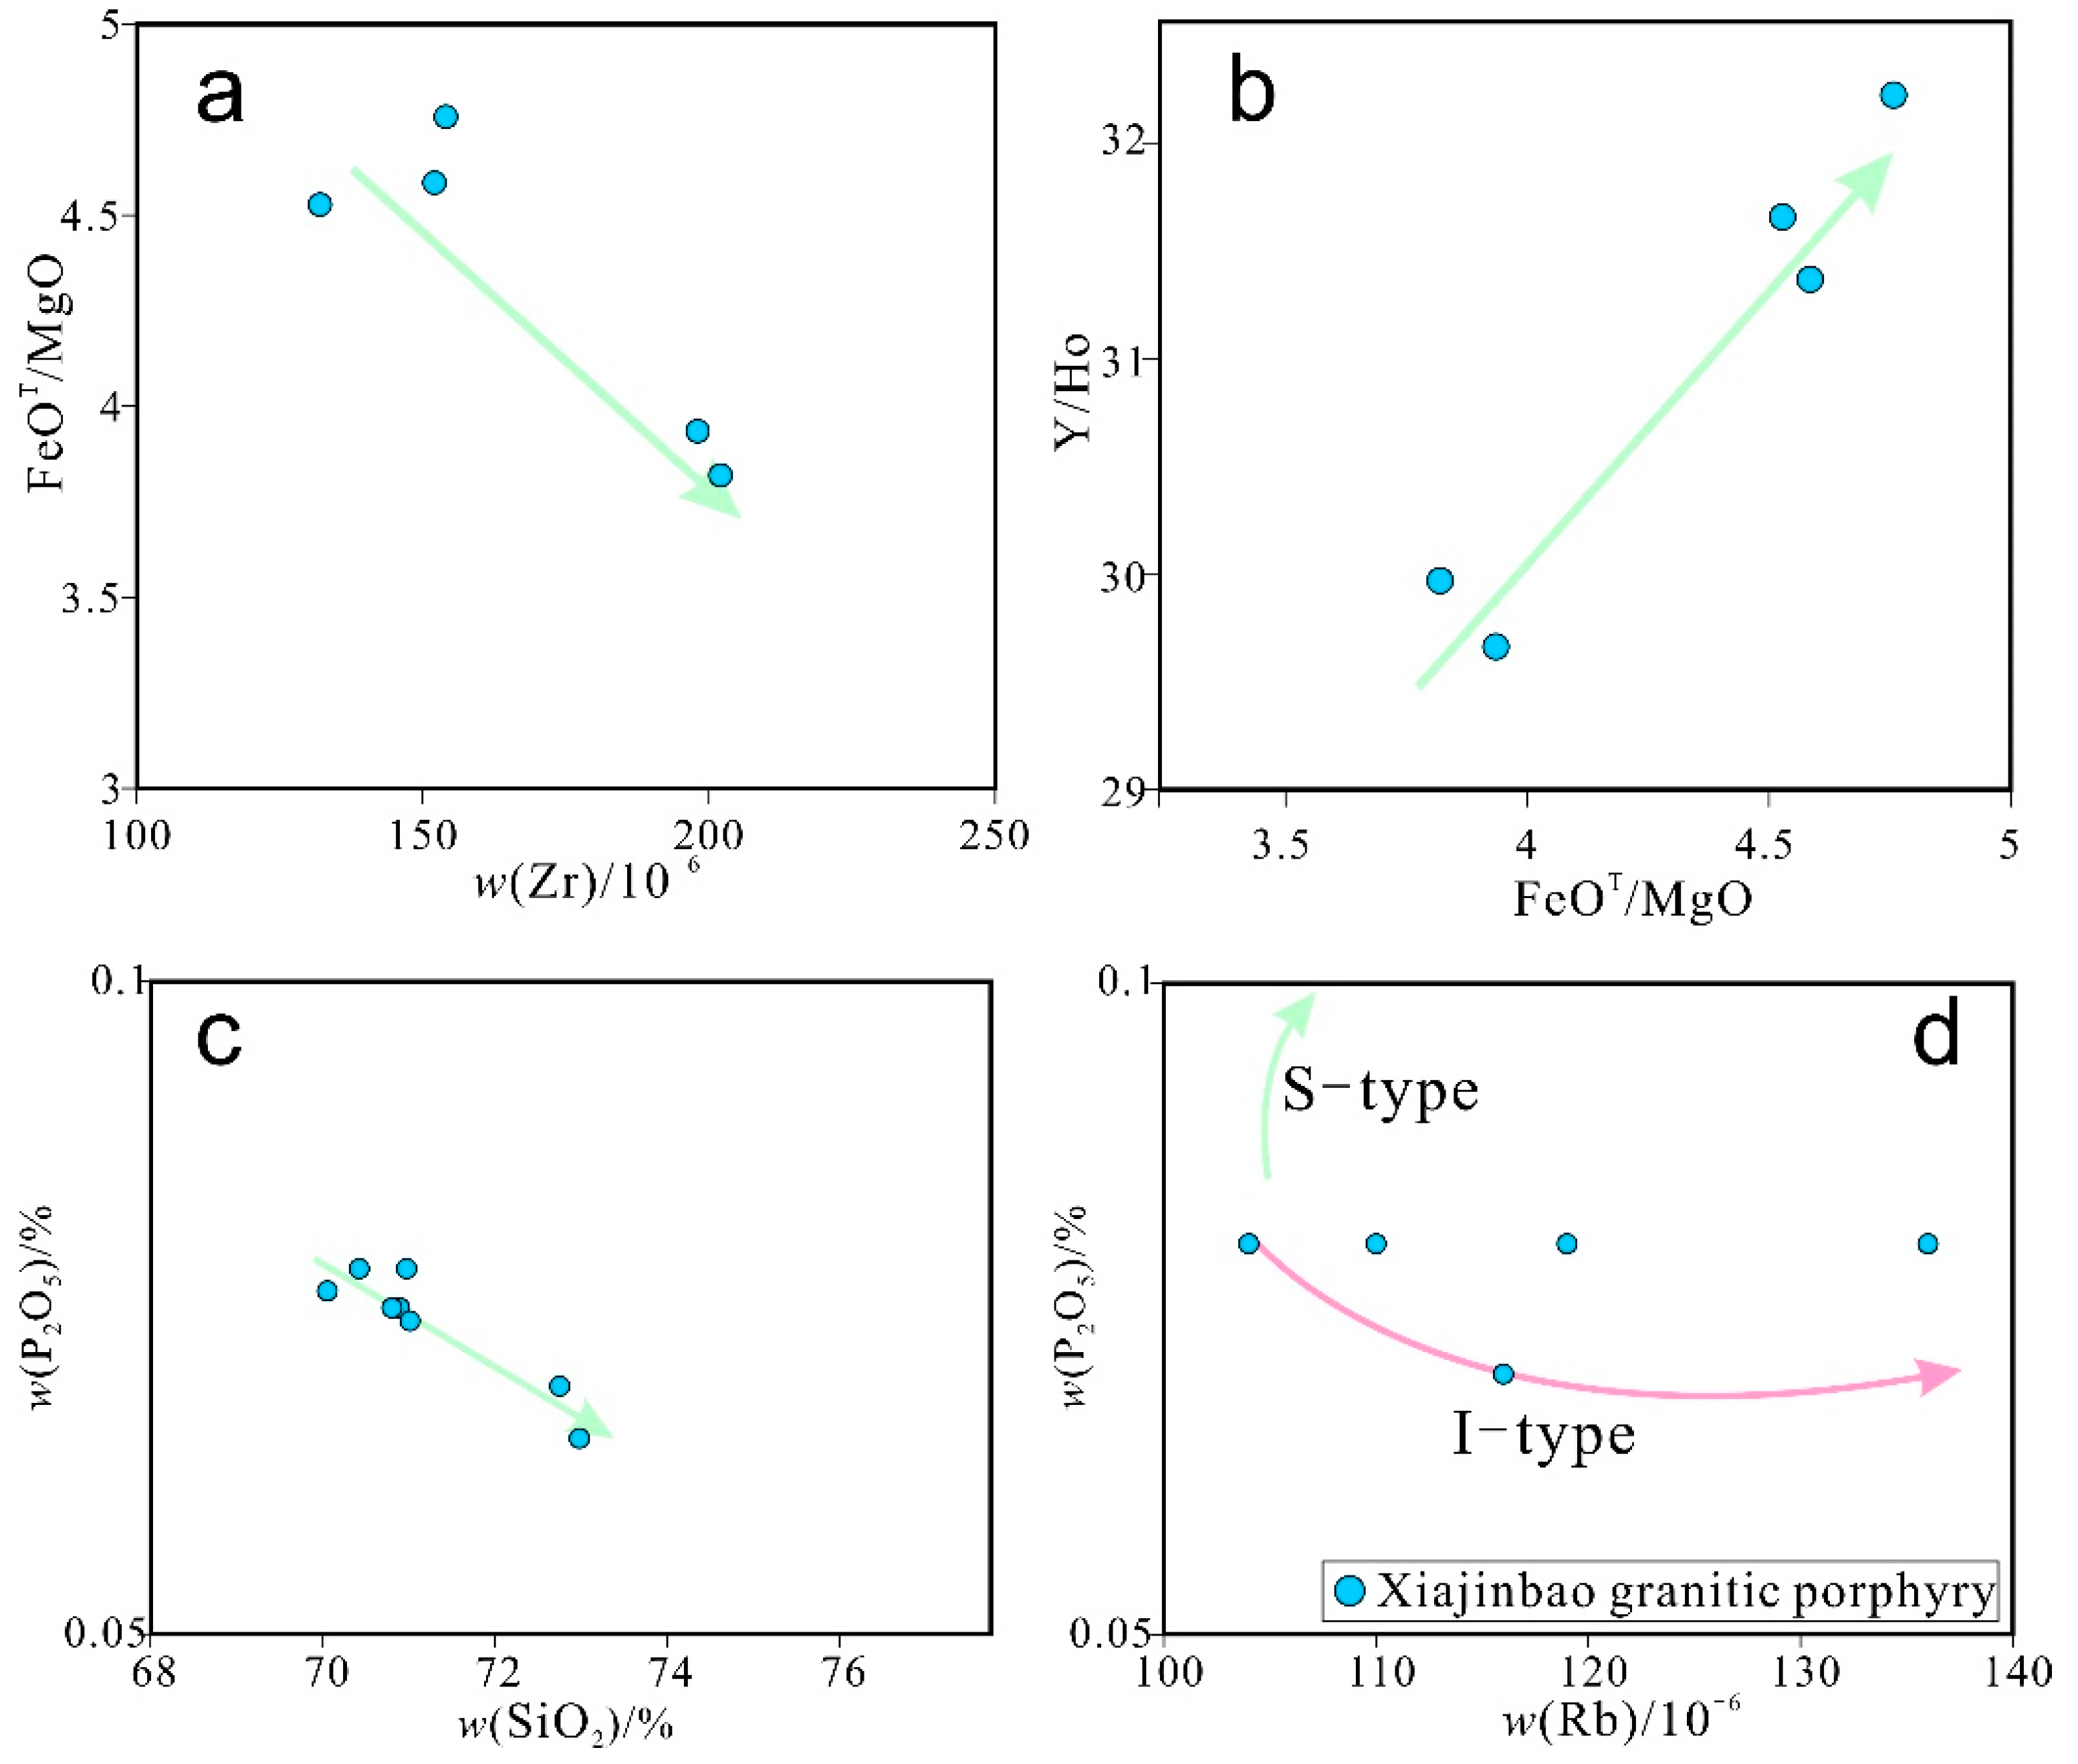
The Xiajinbao granite porphyry have relatively high SiO2, K2O contents; but low MgO and CaO contents; high-K calc-alkaline to shoshonitic characteristics. The rock is enriched in LREE and large ion lithophile elements (LILE) such as Rb, Ba and U, and it is strongly depleted in HREE and in HFSE and Sr, P. The petrographic features, major and trace elements, and zircon Hf isotopic model ages suggest that the Xijinbao granite is derived from partial melting of the Changcheng sediments.
(2)
The zircon LA-ICP-MS age of the Xiajinbao granite is 157.8 ± 3.4 Ma, which is close to the gold metallogenic age (153.9–163.4 Ma), indicating that both are related to the same tectonic setting.
(3)
H–O isotope of the auriferous quartz vein show that the early metallogenic fluids are derived from magmatic waters, while increasingly more meteoric water mixed with this fluid. S–Pb isotope results show that the metals were derived from both the magma and plagioclase hornblende gneisses.
(4)
The gold mineralization of the Xiajinbao deposit is closely associated with the high-K calc-alkaline to shoshonitic granite magma emplaced during the Yanshannian collision. The Xiajinbao deposit is an intrusion-related gold deposit.
(5)
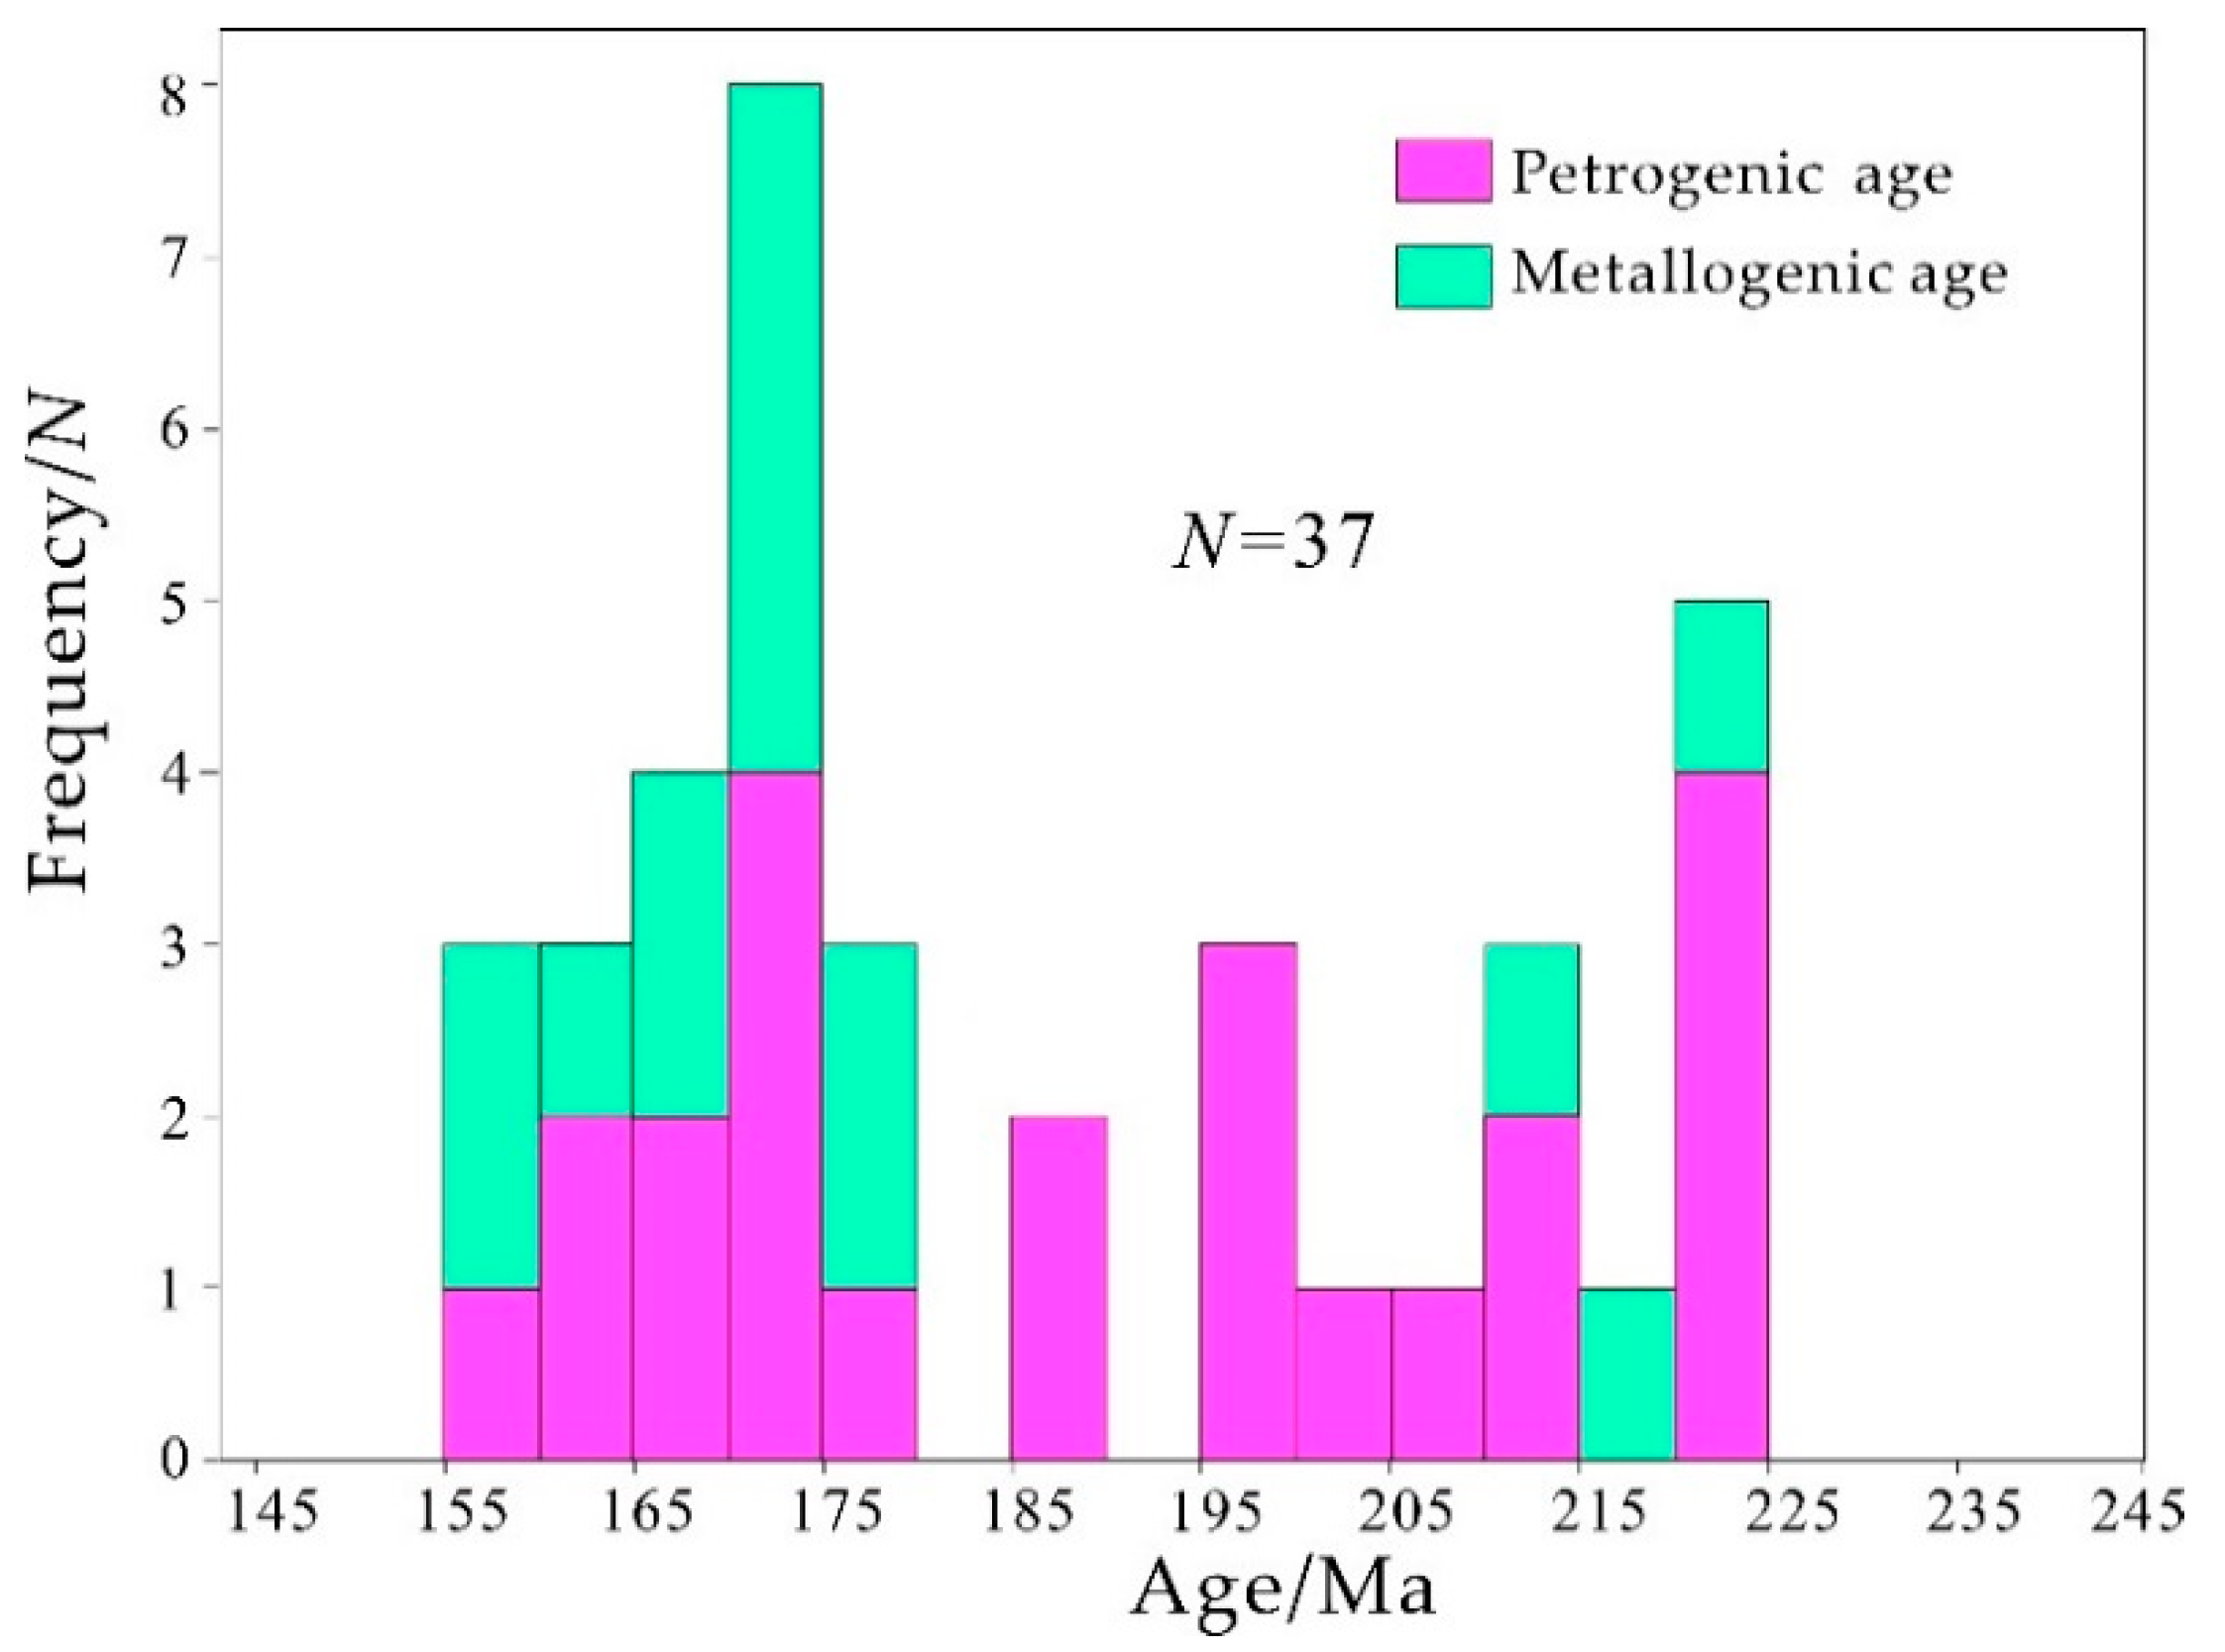
The magmatic events mainly occurred during the period between 223–153 Ma, characterized by three main periods during the late Triassic (225–205 Ma), the early Jurassic (200–185 Ma) and the middle–late Jurassic (175–160 Ma), respectively. The metallogenic events mainly occurred during the period between 223 Ma and 155 Ma, including two main periods during the late Triassic (223–210 Ma) and during the middle–late Jurassic (175–155 Ma).

Author Contributions

C.W., Y.S., and Q.L. conceived and designed the experiments; C.W., J.Z., and Z.L. performed the experiments; all authors wrote the paper.

Funding

This research was funded by [the Innovation-driven Plan of Central South University] grant number [1053320180985] and [the Open Topic of Hunan Key Laboratory of Land Resources Evaluation and Utilization] grant number [SYS-ZX-201804].

Acknowledgments

This work was supported by the Innovation-driven Plan of Central South University (Project 1053320180985) and the Open Topic of Hunan Key Laboratory of Land Resources Evaluation and Utilization (Project SYS-ZX-201804).

Conflicts of Interest

The authors declare no conflict of interest.

References

  1. Hart, C.J.R.; Goldfarb, R.J.; Qiu, Y.; Snee, L.; Miller, L.D.; Miller, M.L. Gold deposits of the northern margin of the North China Craton: Multiple late Paleozoic–Mesozoic mineralizing events. Miner. Depos. 2002, 37, 326–351. [Google Scholar] [CrossRef]
  2. Wang, W.; Liu, S.; Santosh, M.; Deng, Z.; Guo, B.; Zhao, Y.; Zhang, S.; Yang, P.; Bai, X.; Guo, R. Late Paleoproterozoic geodynamics of the North China Craton: Geochemical and zircon U–Pb–Hf records from a volcanic suite in the Yanliao rift. Gondwana Res. 2015, 27, 300–325. [Google Scholar] [CrossRef]
  3. Cook, N.J.; Ciobanu, C.L.; Mao, J. Textural control on gold distribution in As–free pyrite from the Dongping, Huangtuliang and Hougou gold deposits, North China Craton (Hebei Province, China). Chem. Geol. 2009, 264, 101–121. [Google Scholar] [CrossRef]
  4. Mei, Y.X. The Metallogenic Characteristic and Evolution of Gold Deposits in Jidong Region, Hebei Province, China. Ph.D. Thesis, Chinese Academy of Geological Sciences, Beijing, China, 1997. (In Chinese). [Google Scholar]
  5. Song, Y.; Jiang, S.H.; Bagas, L.; Li, C.; Hu, J.Z.; Zhang, Q.; Zhou, W.; Ding, H.Y. The geology and geochemistry of Jinchangyu gold deposit, north China Craton: Implications for metallogenesis and geodynamic setting. Ore Geol. Rev. 2016, 73, 313–329. [Google Scholar] [CrossRef]
  6. Yuan, W.M.; Wang, S.C.; Wang, L.F. Fission track study on the metallogenetic age of Xiayingfang gold deposit in eastern, Hebei. Nuclear Tech. 1999, 22, 411–413. (In Chinese) [Google Scholar]
  7. Zou, T.; Wang, Y.W.; Wang, J.B.; Zhang, H.Q.; Zhao, L.T.; Xie, H.J.; Shi, Y.; Liu, Y.Z.; Liu, G.Q. Geochronology of the Xiayingfang Au Deposit in Eastern Hebei Province. Geol. Explor. 2016, 52, 84–97. (In Chinese) [Google Scholar]
  8. Luan, W.L.; Yu, Y.X. Geochemistry of fluid inclusion of Xiayingfang gold deposit in Pingquan of Hebei province and ore-searching significance. J. Precious Met. Geol. 1995, 4, 161–167. (In Chinese) [Google Scholar]
  9. Yang, T.D. The study of complex mineralization and metallogenic series of Xiayingfang gold deposit, Hebei province. Earth Sci. 1989, 12, 405–413. (In Chinese) [Google Scholar]
  10. Shao, J.L.; Mei, J.M. Study on pyrite in a volcanic gold deposit in Pingquan, Hebei Province. Gold 1984, 5, 3–8. (In Chinese) [Google Scholar]
  11. Jia, S.; Wang, E.; Fu, J. Geological differences and mineralization unity of the key gold ore concentrated regions in eastern Hebei and Western Liaoning provinces. Acta Geol. Sin. 2011, 85, 1493–1506. (In Chinese) [Google Scholar]
  12. Liu, D.Y.; Nutman, A.P.; Compston, W.; Wu, J.S.; Shen, Q.H. Remnants of ≥3800 Ma crust in the Chinese part of the Sino-Korean craton. Geology 1992, 20, 339–342. [Google Scholar] [CrossRef]
  13. Ma, Y.S.; Zeng, Q.L.; Song, B.; Du, J.J.; Yang, F.Q.; Zhao, Y. SHRTMP U–Pb dating of zircon from Panshan granitoid pluton in Yanshan orogenic belt and its tectonic implications. Acta Petrol. Sin. 2007, 23, 547–556. (In Chinese) [Google Scholar]
  14. Niu, S.Y.; Li, F.Y.; Chen, H.S.; Sun, A.Q.; Wang, B.D.; Wang, J.Z.; Ma, B.J. The exploration and prognosis in the depth and the periphery of the Jinchangyu gold deposit in eastern Hebei. Chin. Geol. 2012, 39, 999–1006. (In Chinese) [Google Scholar]
  15. Zhang, G.R.; Xu, J.H.; Wei, H.; Song, G.C.; Zhang, Y.B.; Zhao, J.K.; He, B.; Chen, D.L. Structure, alteration, and fluid inclusion study on deep and surrounding area of the Dongping gold deposit, northern Hebei, China. Acta Petrol. Sin. 2012, 28, 637–651. (In Chinese) [Google Scholar]
  16. Huang, X.; Ziwei, B.; DePaolo, D.J. Sm–Nd isotope study of early Archean rocks, Qian’an, Hebei Province, China. Geochim. Cosmochim. Acta 1986, 50, 625–631. [Google Scholar] [CrossRef]
  17. Jahn, B.M.; Auvray, B.; Cornichet, J.; Bai, Y.L.; Shen, Q.H.; Liu, D.Y. 3.5 Ga old amphibolites from eastern Hebei Province, China: Field occurrence, petrography, Sm–Nd isochron age and REE geochemistry. Precambrian Res. 1986, 34, 311–346. [Google Scholar] [CrossRef]
  18. Sun, D.Z. The Early Precambrian Geology of the Eastern Hebei; Tianjin Science and Technology Press: Tianjin, China, 1984; pp. 1–273. (In Chinese) [Google Scholar]
  19. Luo, Z.K.; Miao, L.C.; Guan, F.; Qiu, Y.S.; Qiu, Y.M.; McNaughton, N.J.; Groves, D.I. SHRIMP U–Pb zircon dating of the Dushan granitic batholith and related granite-porphyry dyke, eastern Hebei Province, China, and their geological significance. Geochimica 2003, 32, 173–180. (In Chinese) [Google Scholar]
  20. Yang, F.L.; Niu, B.G.; Ren, J.S.; Li, S. Zircon U–Pb ages and geochemical characteristics of the Mesozoic intrusive bodies along the core of the Malanyu anticline and their tectonic significances. Acta Geosci. Sin. 2015, 36, 455–465. (In Chinese) [Google Scholar]
  21. Guo, S.F.; Tang, Z.L.; Luo, Z.H.; Zhao, W.H. Zircon SHRIMP U–Pb dating and geological significance from granite bodies in Tangzhangzi and Niuxinshan, eastern Hebei Province, China. Geol. Bull. China 2009, 28, 1458–1464. (In Chinese) [Google Scholar]
  22. Zhang, J.G.; Shao, Y.J.; Wang, C.; Liu, Z.F.; Xiong, Y.Q. Characteristics of gold-bearing minerals in Xiajinbao gold deposit of Hebei and their metallogenic indicating significance. J. Cent. South Univ. 2018, 49, 901–909. (In Chinese) [Google Scholar]
  23. Zhou, L.G.; Xia, Q.X.; Zheng, Y.F.; Hu, Z.C. Poly–phase growth of garnet in eclogite from the Hong’an orogen: Constraints from garnet zoning and phase equilibrium. Lithos 2014, 206–207, 79–99. [Google Scholar] [CrossRef]
  24. Liu, Y.S.; Gao, S.; Hu, Z.C.; Gao, C.G.; Zong, K.Q.; Wang, D. Continental and oceanic crust recycling–induced melt–peridotite interactions in the Trans–North China Orogen: U–Pb dating, Hf isotopes and trace elements in zircons from mantle xenoliths. J. Petrol. 2010, 51, 537–571. [Google Scholar] [CrossRef]
  25. Hou, K.J.; Li, Y.H.; Zou, T.R.; Qu, X.M.; Shi, Y.R.; Xie, G.Q. Laser ablation–MC–ICP–MS technique for Hf isotope microanalysis of zircon and its geological applications. Acta Petrol. Sin. 2007, 23, 2595–2604. (In Chinese) [Google Scholar]
  26. Elhlou, S.; Belousova, E.; Griffin, W.L.; Pearson, N.J.; O’reilly, S.Y. Trace element and isotopic composition of GJ-red zircon standard by laser ablation. Geochim. Cosmochim. Acta 2006, 70, 158. [Google Scholar] [CrossRef]
  27. Liu, Q.Q.; Li, B.; Shao, Y.J.; Lu, A.H.; Lai, J.Q.; Li, Y.F.; Luo, Z.C. Molybdenum mineralization related to the Yangtze’s lower crust and differentiation in the Dabie Orogen: Evidence from the geochemical features of the Yaochong porphyry Mo deposit. Lithos 2017, 282/283, 111–127. [Google Scholar] [CrossRef]
  28. Chappell, B.W.; White, A.J.R. I- and S-type granites in the Lachlan fold belt. Earth Sci. 1992, 83, 1–26. [Google Scholar]
  29. Belousova, E.A.; Griffin, W.L.; O’Reilly, S.Y.; Fisher, N.L. Igneous zircon: Trace element composition as an indicator of source rock type. Contrib. Mineral. Petrol. 2002, 143, 602–622. [Google Scholar] [CrossRef]
  30. Hoskin, P.W.O.; Schaltegger, U. The composition of zircon and igneous metamorphic petrogenesis. Rev. Mineral. Geochem. 2003, 53, 27–62. [Google Scholar] [CrossRef]
  31. Clayton, R.N.; O’Neil, J.R.; Mayeda, T.K. Oxygen isotope exchange between quartz and water. J. Geophys. Res. 1972, 77, 3057–3067. [Google Scholar] [CrossRef]
  32. Luo, Z.K.; Qiu, Y.S.; Guan, K.; Miao, L.C.; Qiu, Y.M.; McNaughton, N.J.; Groves, D.I. SHRIMP U–Pb dating on zircon from Yu’ erya and Niuxinshan granite intrusions in eastern Hebei provence. Bull. Mineral. Petrol. Geochem. 2001, 20, 278–285. [Google Scholar]
  33. Chen, S.C.; Ye, H.S.; Wang, Y.T.; Zhang, X.K.; Lu, D.Y.; Hu, H.B. Re–Os age of molybdenite from the Yuerya Au deposit in eastern Hebei Province and its geological significance. Geol. China 2014, 41, 1565–1576. (In Chinese) [Google Scholar]
  34. Li, Z.Y.; Ye, H.S.; He, W.; Cao, J.; Zhang, X.K.; Wang, S.; Lu, D.Y.; Li, C. Geological characteristics and molybdenite Re–Os isotopic dating of Tangzhangzi gold (molybdenum) deposit in eastern Hebei Province. Miner. Depos. 2014, 33, 1366–1378. (In Chinese) [Google Scholar]
  35. Hu, D.X. Gold-Bearing Quartz vein 40Ar-39Ar Age at the Margin of the North China Craton; China University of Geosciences Press: Beijing, China, 1996; pp. 1–100. (In Chinese) [Google Scholar]
  36. Bea, F.; Arzamastsev, A.; Montero, P.; Arzamastseva, L. Anomalous alkaline rocks of Soustov, Kola: Evidence of mantle-derived metasomatic fluids affecting crustal materials. Contrib. Mineral. Petrol. 2001, 140, 554–566. [Google Scholar] [CrossRef]
  37. Zheng, W.; Mao, J.W.; Zhao, H.J.; Zhao, C.S.; Yu, X.F. Two Late Cretaceous A-type granites related to the Yingwuling W–Sn polymetallic mineralization in Guangdong province, South China: Implications for petrogenesis, geodynamic setting, and mineralization. Lithos 2017, 274/275, 106–122. [Google Scholar] [CrossRef]
  38. Sylvester, P.J. Post-collisional strongly peraluminous granites. Lithos 1998, 45, 29–44. [Google Scholar] [CrossRef]
  39. Xu, X.Y.; Jiang, N.; Fan, W.B.; Hu, J.; Zong, K.Q. Petrogenesis and geological implications for the Mesozoic granites in Qinglong area, eastern Hebei province. Acta Petrol. Sin. 2016, 32, 212–232. (In Chinese) [Google Scholar]
  40. Zartman, R.E.; Doe, B.R. Plumbotectonics—The model. Tectonophysic 1981, 75, 135–162. [Google Scholar] [CrossRef]
  41. Shi, C.L.; Song, Y.; Hu, J.Z.; Zhao, B.; Wang, T.; Liao, Y.Z. Characteristics and geological significance of stable isotopes in the Huajian gold deposit, Hebei province. Bull. Mineral. Petrol. Geochem. 2015, 34, 362–368. (In Chinese) [Google Scholar]
  42. Xin, C.L.; Gong, X.; Zhu, X.L.; Zhao, Z.P. Geological characteristics and genesis of Dongliang gold deposit in eastern Hebei province. Contrib. Geol. Miner. Resour. Res. 2014, 29, 51–58. (In Chinese) [Google Scholar]
  43. Lin, E.W.; Guo, Y.J. Lead isotope studies on goldfields in eastern, Hebei, China. J. Jilin Univ. 1985, 1, 1–10. (In Chinese) [Google Scholar]
  44. Chappell, B.W. Aluminium saturation in I- and S-type granites and the characterization of fractionated haplogranites. Lithos 1999, 46, 535–551. [Google Scholar] [CrossRef]
  45. Chappell, B.W.; White, A.J.K. Two contrasting granite types. Pac. Geol. 1974, 8, 173–174. [Google Scholar]
  46. Frost, C.D.; Frost, B.R. Reduced rapakivi type granites: The tholeiitic connection. Geology 1997, 25, 647–650. [Google Scholar] [CrossRef]
  47. Whalen, J.B.; Currie, K.L.; Chappell, B.W. A-type granites: Geochemical characteristics, discrimination and petrogenesis. Contrib. Mineral. Petrol. 1987, 95, 407–419. [Google Scholar] [CrossRef]
  48. Li, H.B.; Shao, Y.J.; Liu, Z.F.; Zhang, Y.; Wei, H.T.; Wang, C. Geochemical characteristics of ore-bodies in Xiajinbao Au deposit in Pingquan of Hebei and its relationship with mineralization. Miner. Resour. Geol. 2014, 28, 356–360. (In Chinese) [Google Scholar]
  49. Münker, C.; Wörner, G.; Yogodzinski, G.; Churikova, T. Behavior of high field strength elements in subduction zones: Constraints from Kamchatka–Aleutian arc lavas. Earth Planet. Sci. Lett. 2004, 224, 275–293. [Google Scholar] [CrossRef]
  50. Bau, M. Controls on the fractionation of isovalent trace elements in magmatic and aqueous systems: Evidence from Y/Ho, Zr/Hf, and lanthanide tetrad effect. Contrib. Mineral. Petrol. 1996, 123, 323–333. [Google Scholar] [CrossRef]
  51. Zhao, K.D.; Jiang, S.Y. Rare earth element and yttrium analyses of sulfides from the Dachang Sn-polymetallic ore field, Guangxi Province, China: Implication for ore genesis. Geochem. J. 2007, 41, 121–134. [Google Scholar] [CrossRef] [Green Version]
  52. Li, X.H.; Liu, Y.; Yang, Y.H.; Chen, F.K.; Tu, X.L.; Qi, C.S. Rapid separation of Lu–Hf and Sm–Nd from a single rock dissolution and precise measurement of Hf–Nd isotopic ratios for national rock standards. Acta Petrol. Sin. 2007, 23, 221–226. (In Chinese) [Google Scholar]
  53. Sheppard, S.M.F. Characterization and isotopic variations in natural waters. Rev. Mineral. Geochem. 1986, 16, 165–183. [Google Scholar]
  54. Wang, T. Study on the Ore-Forming Geological Process in Niuxinshan Section of Hebei Huajian Gold Deposit. Master’s Thesis, China University of Geosciences, Beijing, China, 2012. (In Chinese). [Google Scholar]
  55. Zhang, Q.S.; Yang, Z.S.; Gao, D.Y. Jidong Jinchangyu Regional High-Grade Metamorphic Geology and Gold Deposits; Geological Publishing House: Beijing, China, 1991; pp. 1–445. (In Chinese) [Google Scholar]
  56. Jie, B. The Geochemical Characteristic and the Ore-Forming Material Source of Yuerya Gold Mine in Hebei Province. Master’s Thesis, China University of Geosciences, Beijing, China, 2013. (In Chinese). [Google Scholar]
  57. He, W. The Study of Geology, Geochemical and Mineralization of Tangzhangzi Au Polymetallic Deposit, East Hebei Province. Master’s Thesis, China University of Geosciences, Beijing, China, 2015. (In Chinese). [Google Scholar]
  58. Ohmoto, H. Systematics of sulfur and carbon isotopes in hydrothermal ore deposits. Econ. Geol. 1972, 67, 551–578. [Google Scholar] [CrossRef]
  59. Ohmoto, H.; Rye, R.O. Isotope of sulfur and carbon. In Geochemistry of Hydrothermal Ore Deposits, 2nd ed.; Barnes, H.I., Ed.; John Wiley and Sons: New York, NY, USA, 1979; pp. 509–561. [Google Scholar]
  60. Chaussidon, M.; Albaréde, F.; Sheppard, S.M.F. Sulphur isotope variation in the mantle from microprobe analysis of micro–sulphide inclusion. Earth Planet. Sci. Lett. 1989, 92, 144–156. [Google Scholar] [CrossRef]
  61. Peng, J.T.; Hu, R.Z.; Su, W.C. Lead isotopic composition of ores in the antimony deposits at the southern margin of the Yangtze massif and its geological implication. Geol. Geochem. 2000, 28, 43–47. (In Chinese) [Google Scholar]
  62. Windley, B.F.; Maruyama, S.; Xiao, W.J. Delamination/thinning of sub-continental lithospheric mantle under Eastern China: The role of water and multiple subduction. Am. J. Sci. 2010, 310, 1250–1293. [Google Scholar] [CrossRef]
  63. Tang, Y.J.; Zhang, H.F.; Santosh, M.; Ying, J.F. Differential destruction of the North China Craton: A tectonic perspective. J. Asian Earth Sci. 2013, 78, 71–82. [Google Scholar] [CrossRef]
  64. Dong, S.W.; Zhang, Y.Q.; Long, C.X.; Yang, Z.Y.; Ji, Q.; Wang, T.; Hu, J.M.; Chen, X.H. Jurassic tectonic revolution in China and new interpretation of the Yanshan movement. Acta Geol. Sin. 2007, 81, 1449–1461. (In Chinese) [Google Scholar]
  65. Tomurtogoo, O.; Windley, B.F.; Kroner, A. Zircon age and occurrence of the Adaatsag ophiolite and Muron shear zone, central Mongolia: Constraints on the evolution of the Mongol–Okhotsk Ocean, suture and orogen. J. Geol. Soc. 2005, 162, 125–134. [Google Scholar] [CrossRef]
  66. Zorin, Y.A. Geodynamics of the western part of the Mongolia–Okhotsk collisional belt, Trans-Baikal region (Russia) and Mongolia. Tectonophysics 1999, 306, 33–56. [Google Scholar] [CrossRef] [Green Version]
  67. Wu, F.Y.; Yang, J.H.; Lo, C.H. The Heilongjiang group: A Jurassic accretionary complex in the Jiamusi massif at the western Pacific margin of northeastern China. Island Arc 2007, 16, 156–172. [Google Scholar] [CrossRef]
  68. Isozaki, Y. Jurassic accretion tectonics of Japan. Island Arc 1997, 6, 25–51. [Google Scholar] [CrossRef]
  69. Maruyama, S.; Isozaki, Y.; Kimura, G.; Terabayashi, M. Paleogeographic maps of the Japanese Islands: Plate tectonic synthesis from 750 Ma to the present. Island Arc 1997, 6, 121–142. [Google Scholar] [CrossRef]
  70. Kojima, S.; Kemlcin, I.V.; Kametaka, M. A correlation of accretionary complexes of southern SiKhote–Alin of Russia and the Inner Zone of Southwest Japan. Geosci. J. 2000, 4, 175–185. [Google Scholar] [CrossRef]
  71. Burnham, C.W.; Ohmoto, H. Late-stage processes of felsic magmatism. Soc. Min. Geol. Jpn. 1980, 8, 1–11. [Google Scholar]
  72. Hayashi, K.; Ohmoto, H. Solubility of gold in NaCl and H2S-bearing aqueous solutions at 250 °C–350 °C. Geochim. Cosmochim. Acta 1991, 55, 2111–2126. [Google Scholar] [CrossRef]
  73. Cole, D.R.; Drummond, S.E. The effect of transport and boiling on Ag/Au ratios in hydrothermal solutions: A prelim in ray assessment and possible implications for the formation of epithermal precious metal ore deposits. Geochem. Explor. 1986, 25, 45–79. [Google Scholar] [CrossRef]
  74. Zhang, D.H. Some new advances in ore-forming fluid geochemistry on boiling and mixing of fluid during the processes of hydrothermal deposits. Adv. Earth Sci. 1997, 12, 546–552. (In Chinese) [Google Scholar]
  75. Xu, G.F.; Shao, J.L. On the study of the typomorphism of minerals in the applications of approaching gold deposits genesis and prospection. Gansu Geol. 1984, 6, 1–19. (In Chinese) [Google Scholar]
  76. Thompson, J.F.H.; Sillitoe, R.H.; Baker, T.; Lang, J.R.; Mortensen, J.K. Intrusion-related gold deposits associated with tungsten-tin provinces. Mineral. Depos. 1999, 34, 323–334. [Google Scholar] [CrossRef]
  77. Sillitoe, R.H. Gold-rich porphyry deposits: Descriptive and genetic models and their role in exploration and discovery. Rev. Econ. Geol. 2000, 13, 315–345. [Google Scholar]
  78. Lang, J.R.; Baker, T.; Hart, C.J.R.; Mortensen, J.K. An exploration model for intrusion–related gold systems. Soc. Econ. Geol. Newsl. 2000, 40, 1, 6–15. [Google Scholar]
  79. Blevin, P.L.; Chappell, B.W.; Allen, C.M. Intrusive metallogenic provinces in eastern Australia based on granite source and composition. Transactions of the Royal Society of Edinburgh. Earth Sci. 1996, 87, 281–290. [Google Scholar]
  80. Baker, T.; Pollard, P.J.; Mustard, R.; Graham, J.L. A comparison of granite-related tin, tungsten, and gold-bismuth deposits: Implications for exploration. Soc. Econ. Geol. Newsl. 2005, 61, 5–17. [Google Scholar]
  81. Li, H.B.; Ishiyama, D.; Zhang, Y.; Shao, Y.J. Geology and geochemical characteristics of the Xiajinbao gold deposit in the Hebei Province, China. J. Mineral. Petrol. Sci. 2018, 113, 24–40. [Google Scholar] [CrossRef] [Green Version]
  82. Mitchell, A.H.G.; Garson, M.S. Mineral Deposits and Global Tectonic Settings; Academic Press: London, UK, 1981; 405p. [Google Scholar]
  83. Sawkins, F.J. Metal Deposits in Relation to Plate Tectonics; Springer: Berlin, Germany, 1984; 325p. [Google Scholar]
  84. Duuring, P.; Cassidy, K.F.; Hagemann, S.G. Granitoid-associated orogenic, intrusionrelated, and porphyry style metal deposits in the Archean Yilgarn craton, Western Australia. Ore Geol. Rev. 2007, 32, 157–186. [Google Scholar] [CrossRef]
  85. Khashgerel, B.E.; Kavalieris, I.; Hayashi, K.I. Mineralogy, textures, and whole–rock geochemistry of advanced argillic alteration: Hugo Dummett porphyry Cu–Au deposit, Oyutolgoi mineral district, Mongolia. Mineral. Depos. 2008, 43, 913–932. [Google Scholar] [CrossRef]
  86. Sillitoe, R.H.; Thompson, J.F.H. Intrusion-related vein gold deposits: Types, tectono-magmatic settings and difficulties of distinction from orogenic gold deposits. Resour. Geol. 1998, 48, 237–250. [Google Scholar] [CrossRef]
  87. Mair, J.L.; Hart, C.J.R.; Goldfarb, R.J.; O’Dea, M.; Harris, S. Geology and metallogenic signature of gold occurrences at Scheelite Dome, Tombstone gold belt, Yukon. In Yukon Exploration and Geology 1999; Emond, D.S., Westen, L.H., Eds.; Exploration and Geological Services Division, Yukon, Indian and Northern Affairs Canada: Whitehorse, YT, Canada, 2000; pp. 165–176. [Google Scholar]
  88. Jia, S.S.; Wang, E.D.; Fu, J.F.; Guo, Y.Y. Ore-forming geological characteristics, geochemistry and formation mechanism of Jinchangyu gold deposit in eastern Hebei province. J. Jilin Univ. 2012, 33, 1492–1494. (In Chinese) [Google Scholar]
  89. Xiao, W.J.; Windley, B.F.; Hao, J.; Zhai, M.G. Accretion leading to collision and the Permian Solonker suture, Inner Mongolia, China: Termination of the central Asian orogenic belt. Tectonics 2003, 22, 1–21. [Google Scholar] [CrossRef]
  90. Jian, P.; Lui, D.; Kröner, A.; Windley, B.F.; Shi, Y.; Zhang, W.; Zhang, F.; Miao, L.; Zhang, L.; Tomurhuu, D. Evolution of a Permian intraoceanic arc–trench system in the Solonker suture zone, Central Asian Orogenic Belt, China and Mongolia. Lithos 2010, 118, 169–190. [Google Scholar] [CrossRef]
  91. Ma, Q. Triassic–Jurassic Volcanic Rocks in Western Liaoning: Implications for Lower Crustal Reworking and Lithospheric Destruction in the North Part of Eastern North China Craton; China University of Geosciences: Wuhan, China, 2013. (In Chinese) [Google Scholar]
  92. Zhu, X.L. Geological Characteristics and Genesis of Dongliang Gold Deposit in Eastern Hebei; Northwest Normal University: Lanzhou, China, 2014. (In Chinese) [Google Scholar]
Figure 1. Simplified geological maps: (a) Major tectonic divisions of China; (b) Sketch map showing the distribution of the Triassic to Jurassic granitic intrusions in the eastern NCC; (c) Simplified geological map of the eastern Hebei Province (Modified from Mei [4] and Song et al. [5]).
Minerals 08 00330 g001
Figure 2. Geological map of the Xiajinbao gold deposit.
Minerals 08 00330 g002
Figure 3. Joint section map of the Line 15–Line11–Line 7 ore bodies (From left to right) of the Xiajinbao gold deposit.
Minerals 08 00330 g003
Figure 4. Mineral assemblages at the Xiajinbao Au deposit. (a) Banded auriferous pyrite–quartz–vein-type ores; (b) Galena–sphalerite–quartz–vein-bearing altered granitic porphyry; (c) Poly sulfide (pyrite, chalcopyrite, tetrahedrite, galena, sphalerite)–quartz-bearing altered granitic porphyry; (d) Native–gold–pyrite-bearing quartz vein; (e) Sphalerite replacing hypidiomorphic–allotriomorphic pyrite and replaced by galena; (f) Sphalerite replacing hypidiomorphic–allotrimorphic chalcopyrite, chalcopyrite replacing sphalerite, tetrahedrite replacing sphalerite and chalcopyrite; (g) Common intergrowth texture between galena and sphalerite; (h) Galena–sphalerite–quartz vein-cutting pyrite–quartz vein; (i) Poly sulfides (pyrite, chalcopyrite, tetrahedrite, galena, sphalerite)–quartz vein.
Minerals 08 00330 g004
Figure 5. Mineral parageneses at the Xiajinbao Au deposit.
Minerals 08 00330 g005
Figure 6. SiO2 versus K2O (a) and A/NK versus A/CNK (b) diagrams for the Xiajinbao granitic porphyry.
Minerals 08 00330 g006
Figure 7. Primitive mantle-normalized trace element patterns (a) and Chondrite-normalized REE patterns (b) of the Xiajinbao granite.
Minerals 08 00330 g007
Figure 8. Representative CL images of zircon grains and 206Pb/238U ages of the Xiajinbao granite.
Minerals 08 00330 g008
Figure 9. Chondrite-normalized REE patterns of the zircon from the Xiajinbao granite.
Minerals 08 00330 g009
Figure 10. 206Pb/238U versus 207Pb/235U diagrams for the Xiajinbao granite.
Minerals 08 00330 g010
Figure 11. Histogram of petrogenic ages of granitic rocks in the Jidong gold province.
Minerals 08 00330 g011
Figure 12. Rb/Sr versus Rb/Ba (a) and CaO/(FeOTotal + MgO) versus Al2O3/(FeOTotal + MgO) (b) diagrams for the Xiajinbao granite.
Minerals 08 00330 g012
Figure 13. Histogram of εHf(t) (a) and diagram of εHf(t) versus U–Pb age (b) for zircons from the granitic rocks. The data from the Baijiadian and Dushan granites are from Xu et al. [39].
Minerals 08 00330 g013
Figure 14. Diagram showing 208Pb/204Pb vs. 206Pb/204Pb (a) and 207Pb/204Pb vs. 206Pb/204Pb (b) of sulfides and granitic rocks from the Jidong area, Modified from Zartman et al. [40]. Lead isotope data of the Huajian deposit are taken from Wang [41]; Lead isotope data of the Dongliang deposit are from Xin et al. [42]; Lead isotope data of the Jinchangyu deposit are from Lin and Guo [43]; Lead isotope data of the Yuerya deposit are from Chappell [44]; Lead isotope data of the Archean plagioclase hornblende gneiss are from Lin and Guo [43], respectively.
Minerals 08 00330 g014
Figure 15. FeOT/MgO vs. SiO2 (a), Y/Ho vs. FeOT/MgO (b), P2O5 vs. SiO2 (c), and Rb vs. P2O5 (d) diagrams for the Xiajinbao granite porphyry.
Minerals 08 00330 g015
Figure 16. Oxygen and hydrogen isotope compositions of quartz and ore-forming fluids from the Jidong gold deposits. Oxygen and hydrogen isotope data of the Huajian deposit are from Shi [41] and Wang [54]; Oxygen and hydrogen isotope data of the Dongliang deposit are from Xin et al. [42]; Oxygen and hydrogen isotope data of the Jinchangyu deposit are from Zhang et al. [55]; Oxygen and hydrogen isotope data of the Yuerya deposit are from Jie [56]; Oxygen and hydrogen isotope data of the Tangzhangzi deposit are from He [57].
Minerals 08 00330 g016
Figure 17. Sulfur isotope compositions of quartz and ore-forming fluids from the Jidong area. Sulfur isotope data of the Huajian deposit are from Shi [41] and Wang [54]; Sulfur isotope data of the Dongliang deposit are from Xin et al. [42]; Sulfur isotope data of the Jinchangyu deposit are from Zhang et al. [55]; Sulfur isotope data of the Yuerya deposit are from Jie [56]; Sulfur isotope data of the Tangzhangzi deposit are from He [57]; Sulfur isotope data of the Archean plagioclase hornblende gneiss stratum are from Lin and Guo [43].
Minerals 08 00330 g017
Figure 18. A simplified mineralization model of the Jidong gold province, modified from Ma [92]. (a) gold mineralization model and tectonic setting of Late Triassic in Jidong area; (b) gold mineralization model and tectonic setting of Mid–Late Jurassic in Jidong area.
Minerals 08 00330 g018
Table 1. Location and descriptions of samples for H–O isotope testing from the Xiajinbao Au deposit.
Sample No.LocationOre TypesStageDescription
Z46-1133 m, drill hole ZK401quartz–galena–sphalerite veinIIVein texture; Ore minerals dominated by gold, galena, sphalerite.
Z4997 m, drill hole ZK701quartz–galena–sphalerite veinIIVein texture; Ore minerals dominated by gold, galena, sphalerite.
Z78-285 m, drill hole ZK501quartz–pyrite veinIVein texture; Ore minerals dominated by gold, pyrite.
Z9564 m, drill hole ZK502quartz–polymetallic sulfide veinIIIVein texture; Ore minerals dominated by pyrite, chalcopyrite, galena sphalerite, tetrahedrite.
Z124132.5 m, drill hole ZK403quartz–pyrite veinIVein texture; Ore minerals dominated by gold, pyrite.
Z148147 m, drill hole ZK403quartz–polymetallic sulfide veinIIIVein texture; Ore minerals dominated by pyrite, chalcopyrite, galena sphalerite, tetrahedrite.
Z14993 m, drill hole ZK602quartz–pyrite veinIVein texture; Ore minerals dominated by gold, pyrite.
Z158102 m, drill hole ZK602quartz–polymetallic sulfide veinIIIVein texture; Ore minerals dominated by pyrite, chalcopyrite, galena sphalerite, tetrahedrite.
Table 2. Location and description of S–Pb isotope samples from the Xiajinbao Au deposit.
Sample No. LocationOre TypesStageDescription
K4open pits quartz–pyrite veinIOre minerals dominated by gold and pyrite; gangue material dominated by quartz
K5quartz–galena–sphalerite veinIIOre minerals dominated by gold, galena, sphalerite; gangue material dominated by quartz
K11quartz–galena–sphalerite veinIIOre minerals dominated by gold, galena, sphalerite; gangue material dominated by quartz
K13quartz–pyrite veinIOre minerals dominated by gold and pyrite; gangue material dominated by quartz
Z33quartz–galena–sphalerite veinIIOre minerals dominated by gold, galena, sphalerite; gangue material dominated by quartz
K2quartz–pyrite veinIOre minerals dominated by gold and pyrite; gangue material dominated by quartz
K4quartz–galena–sphalerite veinIIOre minerals dominated by gold, galena, sphalerite; gangue material dominated by quartz
K5quartz–pyrite veinIOre minerals dominated by gold and pyrite; gangue material dominated by quartz
K11quartz–galena–sphalerite veinIIOre minerals dominated by gold, galena, sphalerite; gangue material dominated by quartz
K13quartz–pyrite veinIOre minerals dominated by gold and pyrite; gangue material dominated by quartz
Table 3. Chemical composition of the Xiajinbao granite (wt %).
Sample No.Z144-2Z153Z176-2Z188Z190-1Z175-3Z48Z52
SiO270.420 71.010 70.050 70.800 70.970 70.890 72.747 72.976
Al2O314.330 14.080 14.300 14.310 14.110 13.920 14.607 14.792
TFe2O31.940 1.870 2.160 2.210 1.990 2.450 1.269 1.342
MgO0.493 0.413 0.454 0.482 0.521 0.480 0.530 0.498
CaO1.540 1.550 1.510 1.480 1.460 1.478 1.396 1.360
Na2O3.830 3.910 3.730 3.330 3.630 3.420 3.538 3.126
K2O4.770 4.560 4.960 4.970 4.910 4.810 5.421 5.830
MnO0.035 0.041 0.029 0.035 0.036 0.029 0.043 0.037
TiO20.205 0.198 0.215 0.206 0.189 0.191 0.186 0.173
P2O50.078 0.074 0.076 0.075 0.078 0.075 0.069 0.065
K2O + Na2O8.600 8.470 8.690 8.300 8.540 8.230 8.959 8.956
K2O/K2O + Na2O0.555 0.538 0.571 0.599 0.575 0.584 0.605 0.651
Na2O/K2O0.803 0.857 0.752 0.670 0.739 0.711 0.653 0.536
A/NK1.666 1.662 1.646 1.724 1.652 1.691 1.630 1.652
A/CNK1.413 1.405 1.402 1.463 1.411 1.434 1.411 1.434
σ2.697 2.561 2.792 2.478 2.607 2.429 2.698 2.676
A/NK = m(Al2O3)/[m(Na2O) + m(K2O)]; A/CNK = m(Al2O3)/[m(CaO) + m(Na2O) + m(K2O)]; σ = [w(K2O) + w(Na2O)]2/[w(SiO2) − 43].
Table 4. Trace element composition of the Xiajinbao granite (ppm).
SampleZ144-2Z153Z176-2Z188Z190-1
Granitic Porphyry
Rb136116104119110
Ba108311329801001977
Th1110.58.849.319.33
U1.752.982.562.283.1
Ta0.830.7990.7390.7460.75
Nb1311.413.411.311.5
Sr215290211160176
P3.413.233.633.633.41
Zr198132154152202
Hf5.94.224.854.956.16
Ti12.313.6812.912.3613.26
La39.90 45.20 37.60 42.40 38.00
Ce71.10 76.60 65.60 73.70 67.00
Pr7.98 8.09 7.05 7.85 7.21
Nd27.10 27.20 23.90 27.00 24.80
Sm4.32 3.94 3.51 3.77 3.54
Eu0.69 0.73 0.71 0.75 0.71
Gd3.35 2.91 2.57 2.80 2.74
Tb0.55 0.43 0.39 0.42 0.42
Dy2.54 2.19 1.83 1.93 1.90
Ho0.51 0.38 0.33 0.36 0.37
Er1.51 1.13 1.03 1.11 1.13
Tm0.26 0.20 0.18 0.18 0.18
Yb1.80 1.40 1.27 1.32 1.31
Lu0.27 0.21 0.22 0.20 0.22
Y15.11210.711.211
δEu0.58 0.69 0.75 0.73 0.73
δCe0.79 0.78 0.79 0.79 0.80
δEu = Eu/(Sm∙Gd)0.5; δCe = Ce/(La∙Pr) 0.5.
Table 5. The content of trace elements for zircon from Xiajinbao granite (ppm).
Sample TiYNbLaCePrNdSmEuGdTbDyHoErTmYbLuHfTaThU
K6-0115.6813325.70.0667.50.102.24.61.423.78.0103.340.920045.849195.820,4571.3171274
K6-028.213566.10.1064.70.101.74.21.122.38.1101.641.120347.552110122,0051.3189300
K6-0313.279562.91.239.70.402.73.30.8517.65.775.229.314232.835970.20.7194.7171
K6-049.315087.10.0266.50.091.94.51.323.08.211045.422953.658611317,1181.6150279
K6-0512.929682.90.0233.80.051.23.00.8115.15.672.828.914634.037874.717,5290.7484.6185
K6-0717.6413396.155.60.061.73.51.121.27.799.640.120347.953410521,1111.4120241
K6-0918.9515007.54.082.91.16.05.21.425.58.511445.822452.757910820,4921.6202336
K6-107.910664.41.857.90.493.83.81.119.26.582.632.715836.140474822,3670.98164267
K6-1119.3613036.30.0375.80.092.03.81.123.38.510640.719243.747985.719,3631.6238364
K6-1511.318803.451.40.081.22.70.8016.15.771.727.113230.533160.113,8720.98152254
Z176-1615173.73.762.11.097.16.81.929.510.112247.222250.153599.819,1310.93198268
Z176-1716.0814406.10.763.50.292.14.11.323.18.210643.921752.256411118,1411.4157277
Z176-1814674.90.0861.20.132.95.11.829.79.411544.921750.354610510,0461.2186283
Z176-1924.7913405.53.168.80.855.44.81.324.28.210340.519946.250496.024,5391.3191295
Z176-295.412654.60.4948.20.172.44.41.221.07. 695.738.618845.249593.617,0391.1118219
Z176-3220.813245.31.759.60.523.74.31.221.97.610140.019746.450696.021,0691.3159263
“–” below detection limits.
Table 6. The results of zircon U–Pb geochronology of the Xiajinbao granite.
Samplew(B)/10−6Isotopic Ratio Valuest/Ma
ThU207Pb/206Pb207Pb/235U206Pb/238U208Pb/232Th207Pb/235U206Pb/238U
K6-01170.8273.90.05280.00300.18700.01050.02590.00050.0080174.09.0164.52.8
K6-02188.7299.50.05180.00270.17680.00970.02490.00050.0084165.38.3158.32.9
K6-0394.7171.00.05940.00370.21870.01310.02730.00060.0089200.810.9173.93.7
K6-04150.0278.80.05520.00360.19020.01360.02490.00070.0072176.811.6158.34.5
K6-0584.6185.30.06050.00340.21160.01150.02590.00050.0090194.99.6164.83.4
K6-07119.8240.60.05200.00280.18140.01010.02520.00050.0089169.28.7160.53.1
K6-09201.8336.20.05180.00270.17770.00920.02500.00050.0088166.18.0159.42.8
K6-10163.8266.80.04910.00280.16740.00950.02460.00050.0085157.28.3156.73.1
K6-11237.7363.60.04950.00220.16690.00700.02500.00050.0075156.76.1159.03.0
K6-15152.1254.10.05350.00290.17860.00870.02510.00050.0082166.97.5159.73.0
Z176-16197.7267.70.05010.00260.17250.00810.02550.00050.0077161.57.0162.53.1
Z176-17157.1277.00.05180.00230.17590.00810.02500.00040.0078164.57.0159.12.7
Z176-18185.7282.90.04760.00250.16230.00880.02500.00050.0076152.77.7159.33.3
Z176-19191.0294.60.05200.00250.17590.00850.02530.00050.0085164.57.3160.93.0
Z176-29118.5218.60.05610.00350.18300.01040.02490.00060.0081170.78.9158.83.8
Z176-32143.4243.60.05830.00330.19540.01080.02470.00060.0081181.39.2157.53.8
Table 7. The Hf isotopes of the Xiajinbao granite.
Samplet/Ma176Hf/177Hf176Lu/177Hf176Yb/177HfεHf(0)εHf(t)TDM/MaTDMC/MafLu/Hf
K6-1164.50.2824060.0000140.0015090.0000300.0332490.000597−12.950635−9.538271211.8931606.254−0.95454
K6-2158.30.2824200.0000120.0013740.0000200.0307780.000424−12.459401−9.116571187.8771579.874−0.95861
K6-4158.30.2824080.0000130.0012060.0000360.0268230.000853−12.889740−9.275191199.6851598.064−0.96369
K6-5164.80.2824160.0000120.0012620.0000100.0286770.000229−12.597570−9.052771189.8491583.42−0.96198
K6-7160.50.2824240.0000120.0011870.0000150.0261910.000352−12.299078−8.915331175.5891569.586−0.96424
K6-9159.40.2823830.0000150.0012650.0000430.0284390.000987−13.741773−10.36681235.5591649.706−0.96189
K6-10156.70.2824210.0000120.0012370.0000280.0285030.000686−12.417700−9.039251181.8721576.42−0.96274
K6-11159.00.2824020.0000120.0012130.0000080.0274170.000189−13.085197−9.704451207.7071613.162−0.96346
K6-15159.70.2824090.0000130.0007740.0000060.0175660.000127−12.828529−9.444151183.6661597.336−0.97669
Z176-16162.50.2823840.0000150.0014400.0000070.0333570.000196−13.727737−10.26621240.7881648.013−0.95661
Z176-17159.10.2824150.0000160.0013450.0000120.0299650.000326−12.613840−9.289071193.1241588.626−0.95949
Z176-18159.30.2824620.0000320.0015610.0000340.0389180.001354−10.948415−7.58281133.0431496.638−0.95298
Z176-19160.90.2824190.0000120.0014400.0000090.0327850.000246−12.478206−9.100251190.7191580.521−0.95663
Z176-29158.80.2824010.0000130.0012760.0000110.0284000.000263−13.117993−9.807271211.031616.476−0.96158
Table 8. H and O isotope data of quartz from the Xiajinbao gold deposit.
Sample No.MineralδDV-SMOW (‰)δ18OV-SMOW (‰)δ18OH2O-SMOW (‰)Homogenization Temperature (°C)
Z46-1Quartz−91.413.62.34207.0
Z49−91142.74207.0
Z78-2−91.415.87.26258.9
Z95−93.311.7−5.95151.5
Z124−96.616.68.06258.9
Z148−83.112.1−5.55151.5
Z149−88.417.58.96258.9
Z158−96.18.4−9.25151.5
Table 9. Sulfur isotope compositions of sulfides from the Xiajinbao gold deposit.
Sample No.Mineralsδ34SV-CDT (‰)
K4Pyrite3.7
K53.4
K113.2
K133.6
Z332.4
K2Galena0.7
K40.1
K5−0.2
K110.7
K13−0.2
Table 10. Lead isotope compositions of sulfides from the Xiajinbao gold deposit.
Sample No.Minerals208Pb/204Pb207Pb/204Pb206Pb/204PbμωTh/U
K2Galena36.15415.22616.1079.1336.733.89
K436.20415.23116.1769.1236.533.88
K535.97515.1616.1068.9835.083.78
K1136.09915.19716.1579.0435.753.83
K1336.0515.1916.19.0535.843.83
Table 11. The petrogenetic and ore-forming age in the Jidong gold province.
Sample Locations (Intrusion)Host RockAge [Ma]Analytical MethodData Source
XiajinbaoGranitic porphyry157.0 ± 3.4LA-MC-ICP-MSThis study
QianfenshuilingMonzonite granite153.8 ± 2.7LA-MC-ICP-MSYang et al. [20]
WangpingshiMonzonite granite162.3 ± 1.3LA-MC-ICP-MSSong et al. [5]
MaoshanMonzonite granite162.7 ± 1.5LA-MC-ICP-MS
MadiGranite166.3Rb–SrYang et al. [20]
QibaiziGranite168 ± 3LA-ICP-MSSong et al. [5]
Monzonite granite159.5 ± 0.5LA-ICP-MSSong et al. [5]
XiaoyingziGranodiorite164.4 ± 2.2LA-MC-ICP-MSYang et al. [20]
GaojiadianQuartz diorite170.5 ± 1.8LA-MC-ICP-MS
NiuxinshanGranite172–173SHRIMPGuo et al. [21], Luo et al. [32], Hu et al. [35]
YueryaGranite174–175SHRIMP
TangzhangziGranitic porphyry173 ± 2LA-MC-ICP-MSGuo et al. [21]
DazigouMonzonite granite176.5 ± 1.0LA-ICP-MSLuo et al. [32]
WubaiziGranitic porphyry189.8 ± 0.7LA-ICP-MSLuo et al. [32]
LaosanjiaGranitic porphyry196.4 ± 0.8LA-ICP-MS
LuowenyuMonzonite granite196.7 ± 7.0LA-ICP-MSLuo et al. [32]
QinshankouMonzonite granite199 ± 2SHRIMPSong et al. [5], Luo et al. [32]
LiuzhupingMonzonite granite205.7 ± 0.8LA-ICP-MSLuo et al. [32]
SanbaiziMonzonite granite211.1 ± 1.1LA-ICP-MS
PanshanMonzonite granite203–207SHRIMPMa et al. [13]
DushanGranite210 ± 4SHRIMPLuo et al. [19]
DushanGranite223 ± 2SHRIMPLuo et al. [32]
DashiyuGranite222 ± 1LA-ICP-MSLuo et al. [19]
Monzonite granite224 ± 2LA-ICP-MS
SanjiaGranitic porphyry222 ± 4SHRIMPLuo et al. [19]
Sample Locations (Deposit)Geological Characteristicst/MaTesting MethodData Source
XiajinbaoAlterated rocks155.73K–ArYuan et al. [6], Zou et al. [7]
DaoliushuiOre-bearing quartz 155Rb–SrMei [4]
MaoshanOre-bearing quartz 174.2K–ArYang et al. [20]
HuajianOre-bearing quartz 175.8Ar–ArGuo et al. [21], Luo et al. [32], Hu et al. [35]
YueryaOre-bearing quartz 169.8Re–Os
TangzhangziOre-bearing quartz 170.1 ± 1.6Re–OsYang et al. [20]
ShizipingOre-bearing quartz 179.5Rb–SrYang et al. [20]
JinchangyuOre-bearing quartz 169.8/242.6K–Ar/Re–OsSong et al. [5]; Luo et al. [32]
ChagouAlterated rocks166K–ArMei [4]
XiangshuigouOre-bearing quartz 170.5K–ArMei [4]
PiandaogouOre-bearing quartz 161Rb–SrMei [4]
ShuiquangouOre-bearing quartz 212.5 ± 0.4Ar–ArMei [4]
ToudaomengouOre-bearing quartz 217.3 ± 2.0Ar–ArMei [4]

