Article

Textural Characteristics of Noncrystalline Silica in Sinters and Quartz Veins: Implications for the Formation of Bonanza Veins in Low-Sulfidation Epithermal Deposits

by
Tadsuda Taksavasu
1,*,
Thomas Monecke
1 and
T. James Reynolds
2
1
Center for Mineral Resources Science, Department of Geology and Geological Engineering, Colorado School of Mines, 1516 Illinois Street, Golden, CO 80401, USA
2
FLUID INC., 1401 Wewatta St. #PH3, Denver, CO 80202, USA
*
Author to whom correspondence should be addressed.
Minerals 2018, 8(8), 331; https://doi.org/10.3390/min8080331
Submission received: 25 June 2018 / Revised: 27 July 2018 / Accepted: 31 July 2018 / Published: 2 August 2018
(This article belongs to the Special Issue Mineralogy of Quartz and Silica Minerals)

Abstract

:
Silica sinters forming at the Wairakei geothermal power plant in New Zealand are composed of noncrystalline opal-A that deposited rapidly from cooling geothermal liquids flashed to atmosphere. The sinter is laminated with alternating layers of variably compacted silicified filamentous microbes encased by chains of fused silica microspheres. Microscopic inspection of bonanza quartz vein samples from the Buckskin National low-sulfidation epithermal precious metal deposit in Nevada showed that colloform bands in these veins exhibit relic microsphere textures similar to those observed in the silica sinters from the Wairakei power plant. The textural similarity suggests that the colloform bands were originally composed of noncrystalline opal-A that subsequently recrystallized to quartz. The colloform bands contain dendrites of electrum and naumannite that must have grown in a yielding matrix of silica microspheres deposited at the same time as the ore minerals, implying that the noncrystalline silica exhibited a gel-like behavior. Quartz bands having other textural characteristics in the crustiform veins lack ore minerals. This suggests that ore deposition and the formation of the colloform bands originally composed of compacted microspheres of noncrystalline silica are genetically linked and that ore deposition within the bonanza veins was only episodic. Supersaturation of silica and precious metals leading to the formation of the colloform bands may have occurred in response to transient flashing of the hydrothermal liquids. Flashing of geothermal liquids may thus represent a key mechanism in the formation of bonanza precious metal grades in low-sulfidation epithermal deposits.

1. Introduction

Low-sulfidation epithermal deposits are an important source of gold and silver. The deposits form in the shallow (<2 km) subsurface in association with subaerial geothermal systems. Ore formation takes place from near-neutral chloride waters at temperatures below ~300 °C [1,2,3,4,5,6]. The high-grade ores of many low-sulfidation epithermal deposits are contained in quartz veins that developed along subvertical faults [6,7,8]. It is well established that there is a close association between fluid immiscibility and mineral deposition in the epithermal environment [2,3,9,10,11,12,13,14].
The quartz veins in low-sulfidation epithermal deposits exhibit a wide range of textural characteristics [14,15,16,17]. Previous works [16,18,19,20] have proposed that some of the quartz textures encountered in epithermal veins are of secondary origin and formed as a result of recrystallization of a noncrystalline silica precursor phase. In particular, colloform quartz, which is characterized by the presence of continuous bands that are rounded or botryoidal, is invoked to represent a recrystallization texture. Saunders [19,20] showed that gold in low-sulfidation epithermal quartz veins from the Sleeper deposit in Nevada forms dendrites intergrown with fine-grained colloform quartz. He proposed that the gold and silica were originally precipitated as colloidal particles in the deeper part of the system and then mechanically transported upward by the ore-forming hydrothermal fluids. The presence of sedimentary structures suggests that the silica originally deposited in the vein was soft and gel-like. Transformation to microcrystalline quartz may have occurred under hydrothermal conditions immediately after deposition, as suggested by experimental studies [21,22,23,24].
This study describes the textural characteristics of silica sinter formed at the Wairakei geothermal power plant in New Zealand using a combination of optical microscopy and scanning electron microscopy. It is shown that the noncrystalline silica sinter is composed of high-porosity opal-A laminae formed by filamentous microbes and alternating low-porosity laminae of densely packed and merged opal-A microspheres. The textural characteristics of the low-porosity laminae in the silica sinter are strikingly similar to those of colloform quartz bands in bonanza ore veins from the Buckskin National low-sulfidation epithermal gold–silver deposit in Nevada. Both silica deposits are composed of silica microspheres and show a similar distribution of micropores between densely packed spheres. The textural observations of the present study lend support to the hypothesis that colloform quartz in low-sulfidation epithermal veins can indeed form through recrystallization of microspheres of a noncrystalline silica precursor deposited during fluid immiscibility.

2. Silica Sinter from the Wairakei Geothermal Power Plant in New Zealand

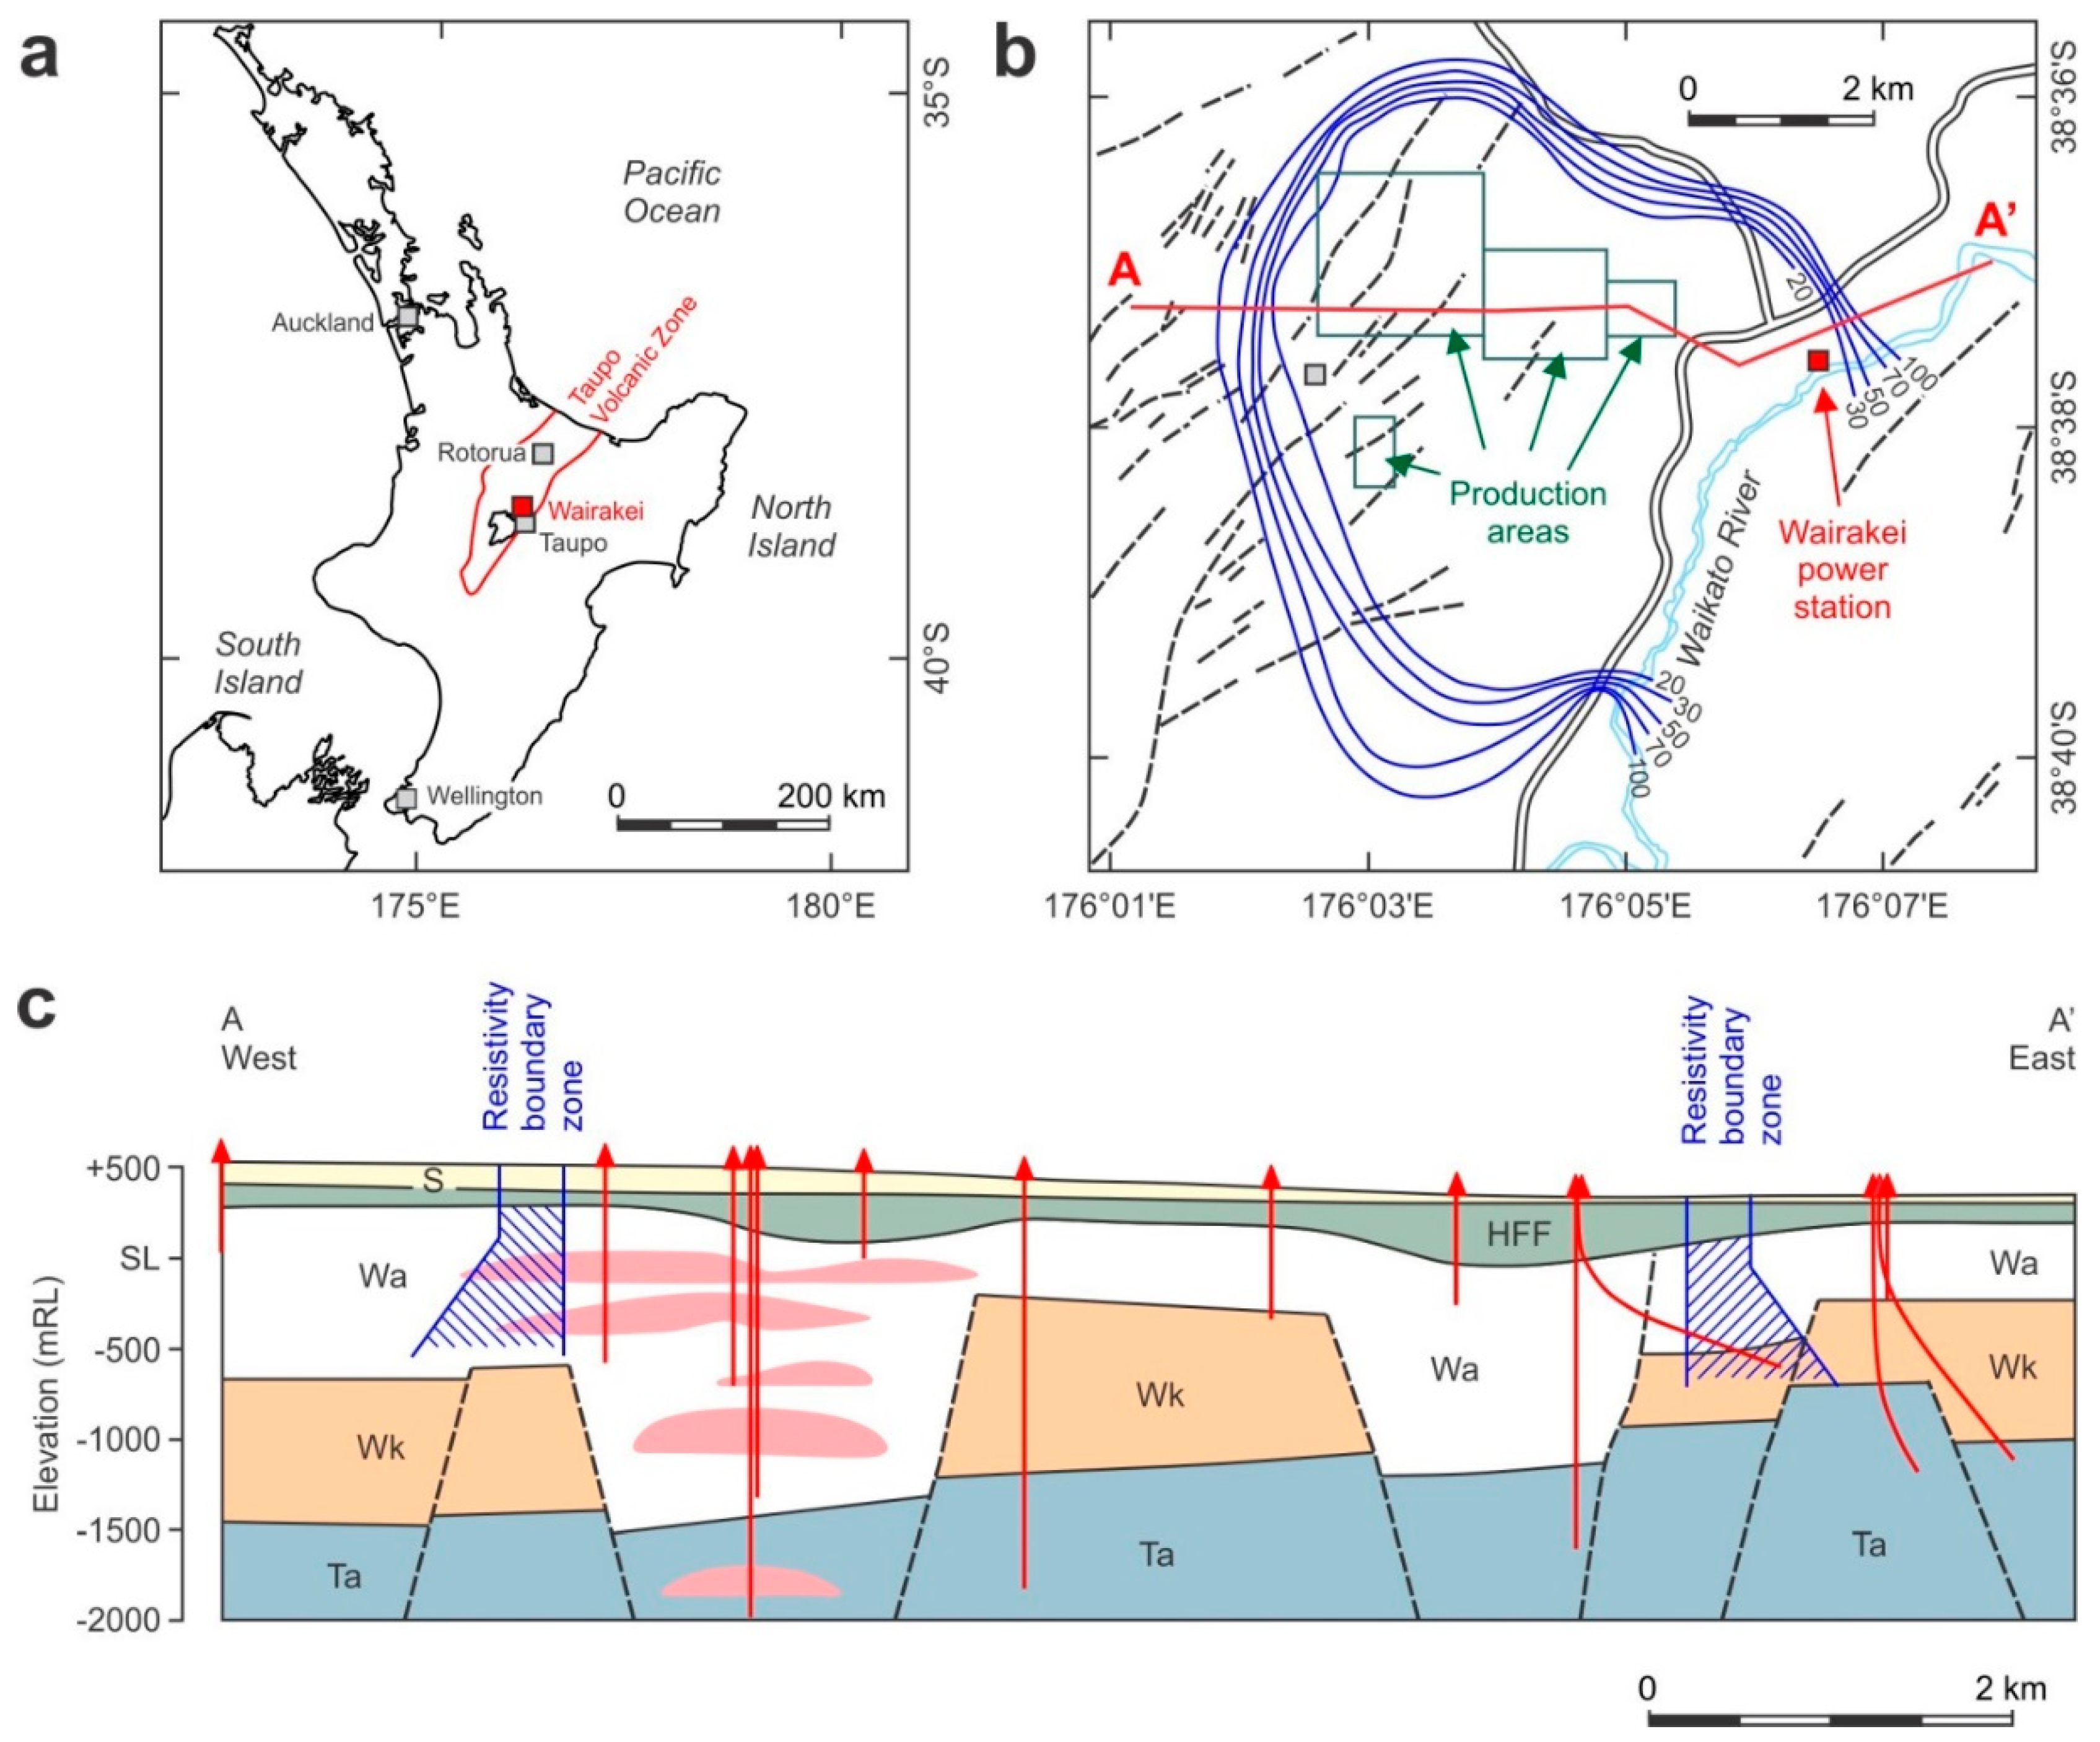
2.1. Geological Background

The Wairakei geothermal field is located 8 km north of Taupo in the Taupo Volcanic Zone of North Island, New Zealand (Figure 1a). Exploration drilling for geothermal power development at Wairakei commenced in 1949, with development culminating in the commissioning of the Wairakei power plant in 1958, which at the time was only the second commercial geothermal operation in the world and the first to exploit a wet geothermal resource. Historically, Wairakei has been exploited in four production areas (Figure 1b), with today’s installed capacity reaching in excess of ~350 MWe. A total of 54 production wells generate hydrothermal fluids at temperatures of up to ~260 °C. About half of the separated water is reinjected. To the southeast, Wairakei connects to the adjacent Tauhara geothermal field, which is currently exploited by a binary power station having an additional capacity of 28 MWe.
The Wairakei geothermal field is located over a broad, deep depression in Jurassic basement graywacke [25] that is filled by Quaternary volcanic and sedimentary rocks [26]. The regional basement structure [27] and basement drilling in other geothermal fields located to the northeast [28] suggest the presence of a northeast-striking, westward-deepening basement graben beneath Wairakei [29]. Active extension in the Taupo Volcanic Zone (2–8 mm/year) and related fault activation may be critical in maintaining fluid pathways in the basement and the overlying volcanic and sedimentary rocks [30,31,32,33].
The Jurassic greywacke basement at Wairakei is overlain by the Tahorakuri Formation, which is composed of thick (>650 m) pumiceous lithic tuff with intercalated partially welded ignimbrite (Figure 1c). These deposits are overlain by the ~0.32–0.34-Ma-old, crystal-rich, moderately welded Wairakei Ignimbrite [29,34,35]. The Wairakei Ignimbrite is of variable thickness, with one deep well encountering a thickness of ~1000 m (Figure 1c). The overlying Waiora Formation contains the main production aquifers of the Wairakei geothermal field. It has a minimum thickness of 400 m but reaches up to 2100 m in thickness. The volcanic and sedimentary deposits of the Waiora Formation are host to several large rhyolite units which have high fracture permeability in their brecciated margins (Figure 1c). The top of the Quaternary volcanic and sedimentary succession at Wairakei consists of the Huka Falls Formation and superficial deposits (Figure 1c). The Huka Falls formation comprises up to 300-m-thick lacustrine sediments and water-deposited tuffs that were accumulated in a long-lived shallow lake stretching northeastward for over 50 km from modern Lake Taupo. Superficial deposits include young pyroclastic fall and flows as well as their sedimentary and pedogenetic derivatives [29,34].
Hydrothermal alteration of the volcanic and sedimentary succession at Wairakei in general increases in rank and intensity with increasing depth [34]. Argillic alteration characterized by the presence of smectite and minor illite/smectite is found in near-surface units. The presence of smectite indicates alteration temperatures <140 °C [37]. Propylitic alteration is the predominant alteration style below the argillic cap. Epidote occurs in small veins but is more common as a pervasive replacement of primary feldspars and other phenocrysts. The presence of wairakite in the propylitic-altered rocks indicates alteration temperatures of above 210 °C [37,38]. The highest rank alteration assemblage recognized at Wairakei includes wairakite, epidote, and prehnite, indicating that alteration occurred at temperatures above 240–280 °C [34].

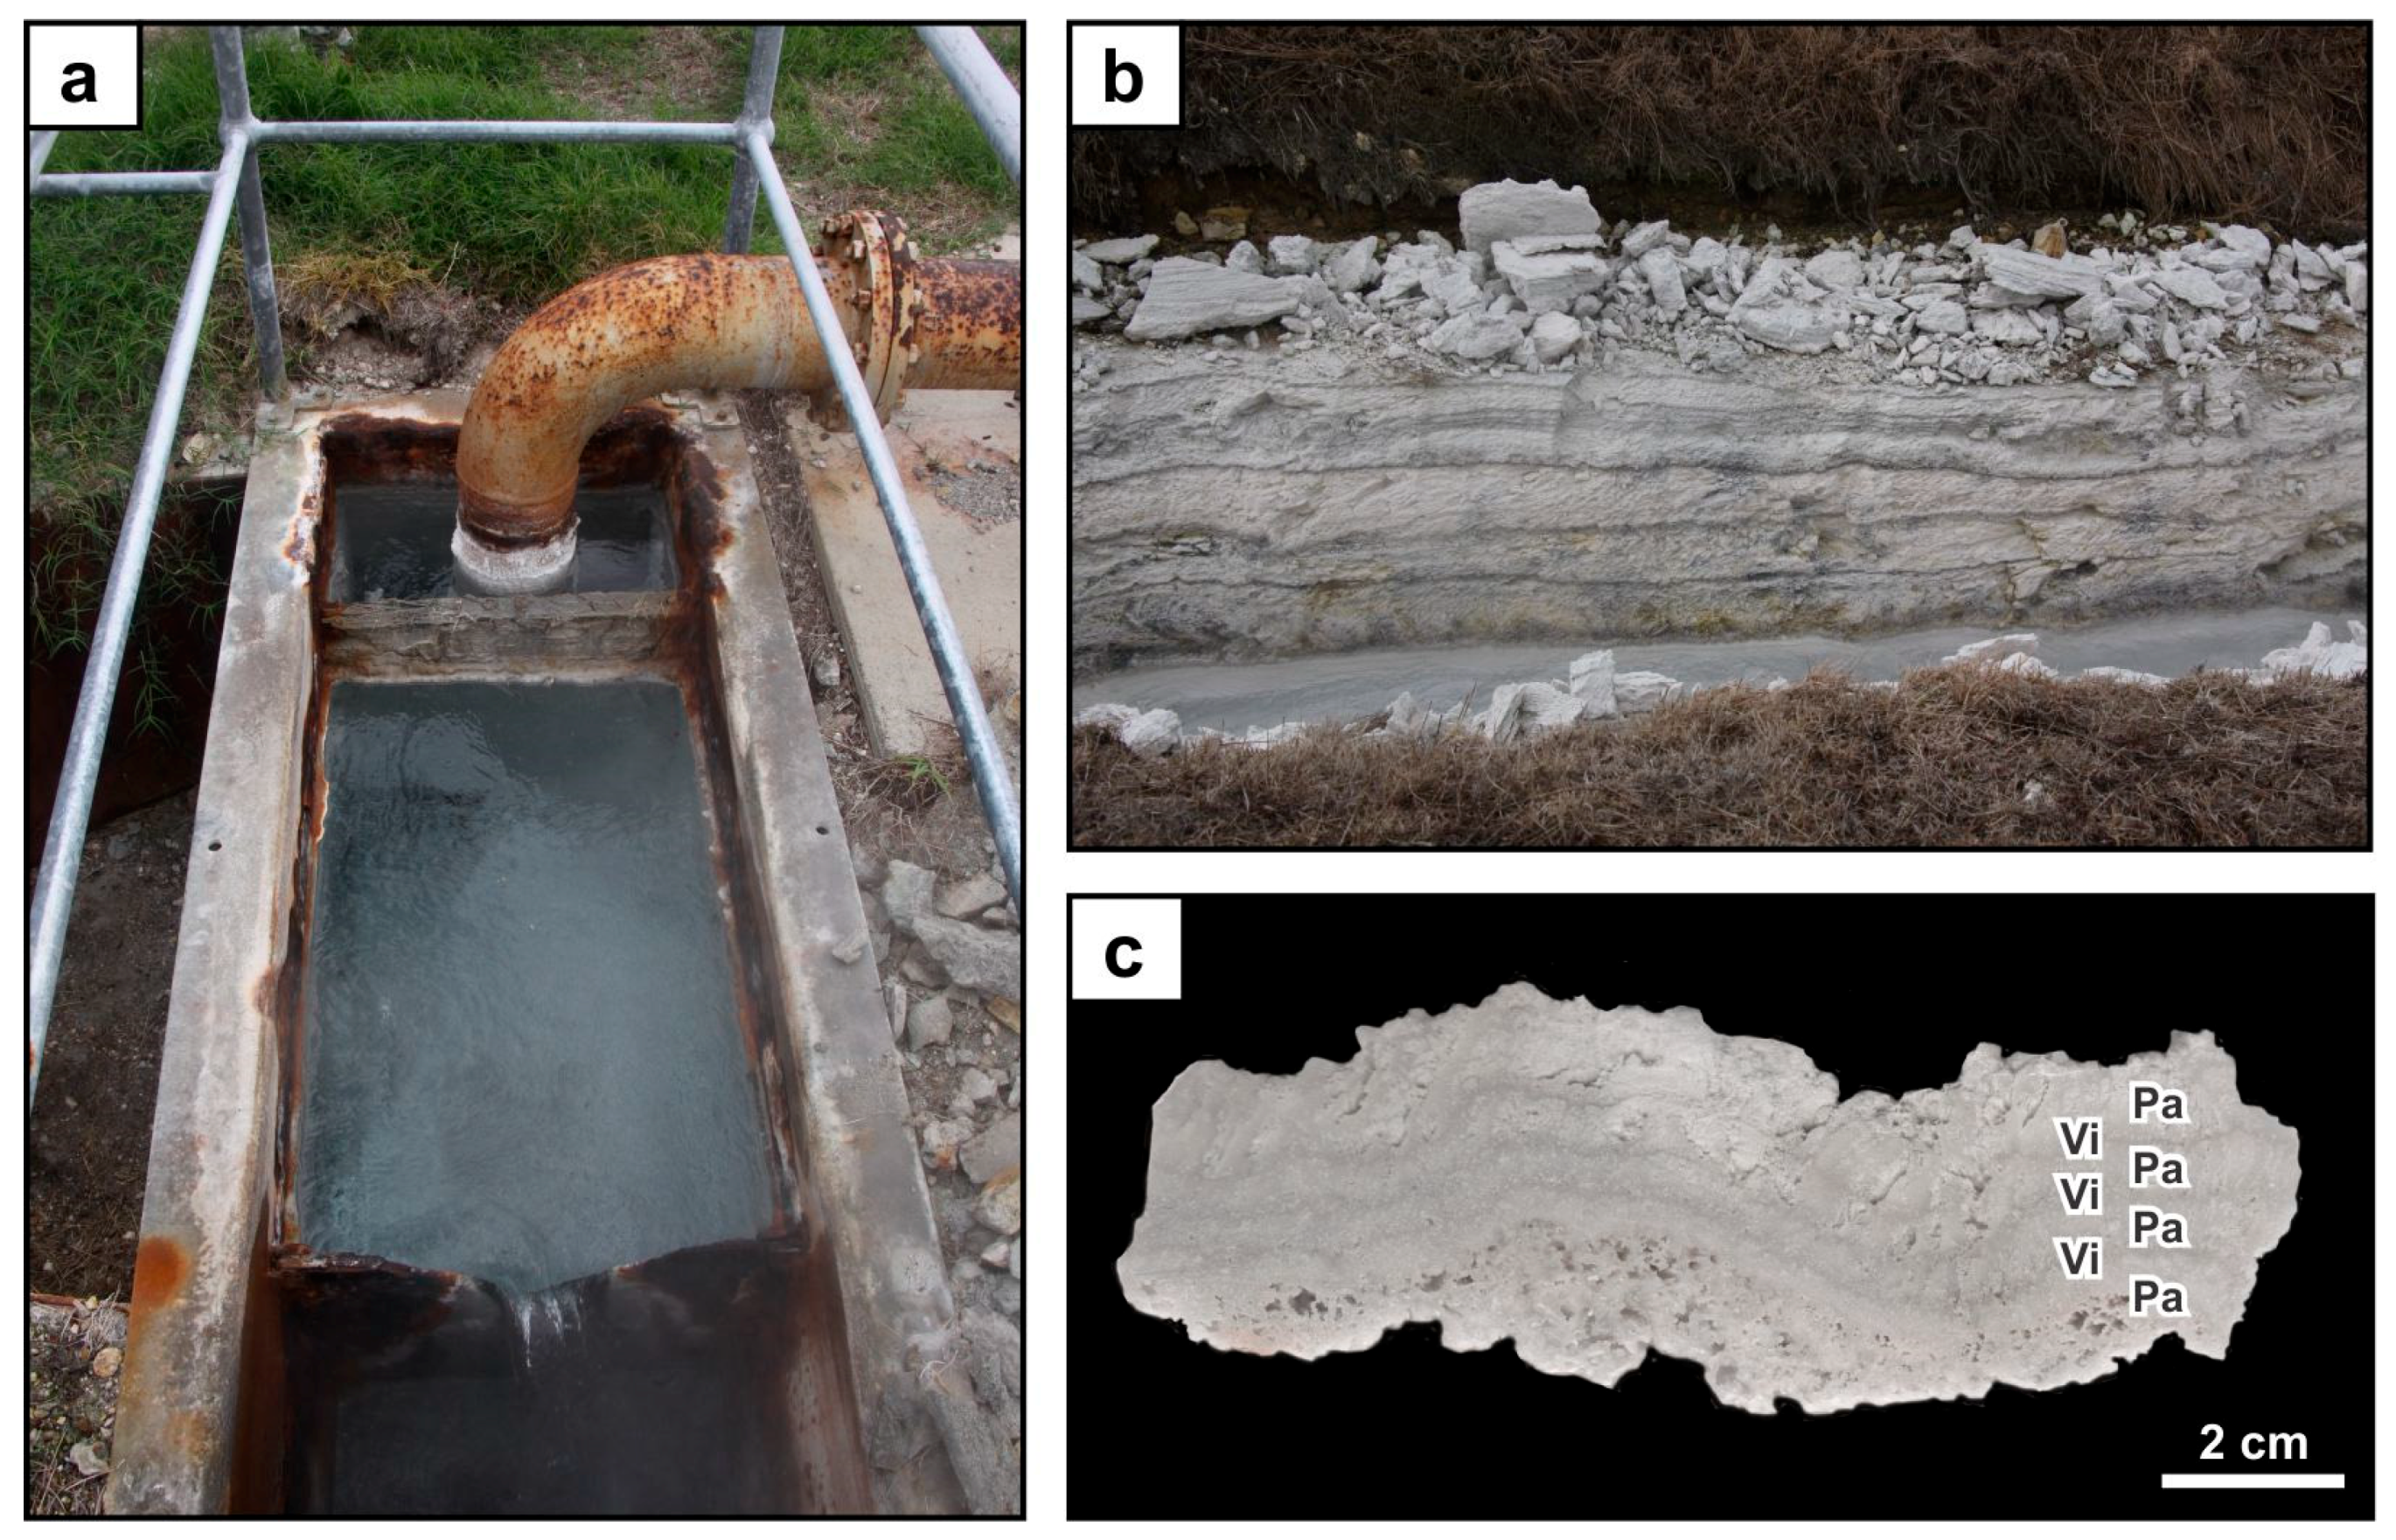
2.2. Silica Deposits

At the Wairakei geothermal field, silica sinter is formed at a high-temperature (~99 °C) outlet sourced from flash plant 14 and feeds the bathing pool known as Honeymoon Pool. At the outlet, the geothermal liquid is flashed to atmosphere and ponds in a steel-lined concrete pool, referred to as a weirbox, that drains into a small channel. The silica sinter forms several centimeters thick crusts at the bottom and walls of the pool and around the inlet pipe (Figure 2a). Within the channel, tens of centimeters thick silica deposits have formed (Figure 2b). The channel is cleaned out on a regular basis to maintain downhill flow. Representative sampling of the silica sinter formed in the steel-lined concrete pool was conducted in 2017.
Macroscopically, the sampled silica sinter is layered and consists of alternating laminae of 3–12-mm-thick highly porous and friable white silica showing palisade textures and 1–2-mm laminae of nonporous, smooth silica that is slightly gray, vitreous, and translucent. The white silica laminae with palisade textures locally show patchy overprints where the silica is vitreous in hand specimen. The alternating laminae having different textures are wavy on the hand specimen scale and are laterally continuous over tens of centimeters (Figure 2c).

2.3. X-ray Diffraction Analysis

The sampled silica sinter was cut to be able to better trace the alternating bands of white and gray silica. Using a dentist drill, both types of bands were sampled. The obtained material was powdered and then analyzed by X-ray diffraction analysis. Step-scan XRD data (15–50°2θ, 0.02°2θ step width, 1.0°2θ/min) of the powdered material were obtained using a Scintag XDS-2000 theta/theta diffractometer with a 2.2-kW sealed copper radiation source. An accelerating voltage of 40 kV was used, with a filament current of 40 mA and 0.5 and 0.3 mm of receiving slits.
The XRD patterns of both sinter bands are typified by broad diffraction bands. The highly porous and friable white silica showing palisade textures gave a diffraction band centered on 22.8°2θ (3.90 Å) with a full-width-at-half-maximum value of 4.7 Δ°2θ (0.80 Δd Å). The nonporous, smooth silica shows a diffraction band centered on 21.7°2θ (4.01 Å) with a full-width-at-half-maximum of 5.8 Δ°2θ (1.10 Δd Å). The diffraction experiments indicate that both types of laminae are composed of opal-A.

2.4. Water Content

The water content of the silica sinter from the Wairakei power plant was determined by gravimetry. A powdered aliquot of the silica sinter was dried at 105 °C overnight. The sample experienced a weight loss of 2.46 wt. %, which is interpreted to represent water absorbed by the noncrystalline material. Following further heating at 950 °C for 12 h, the sample experienced an additional weight loss of 5.64 wt. %.

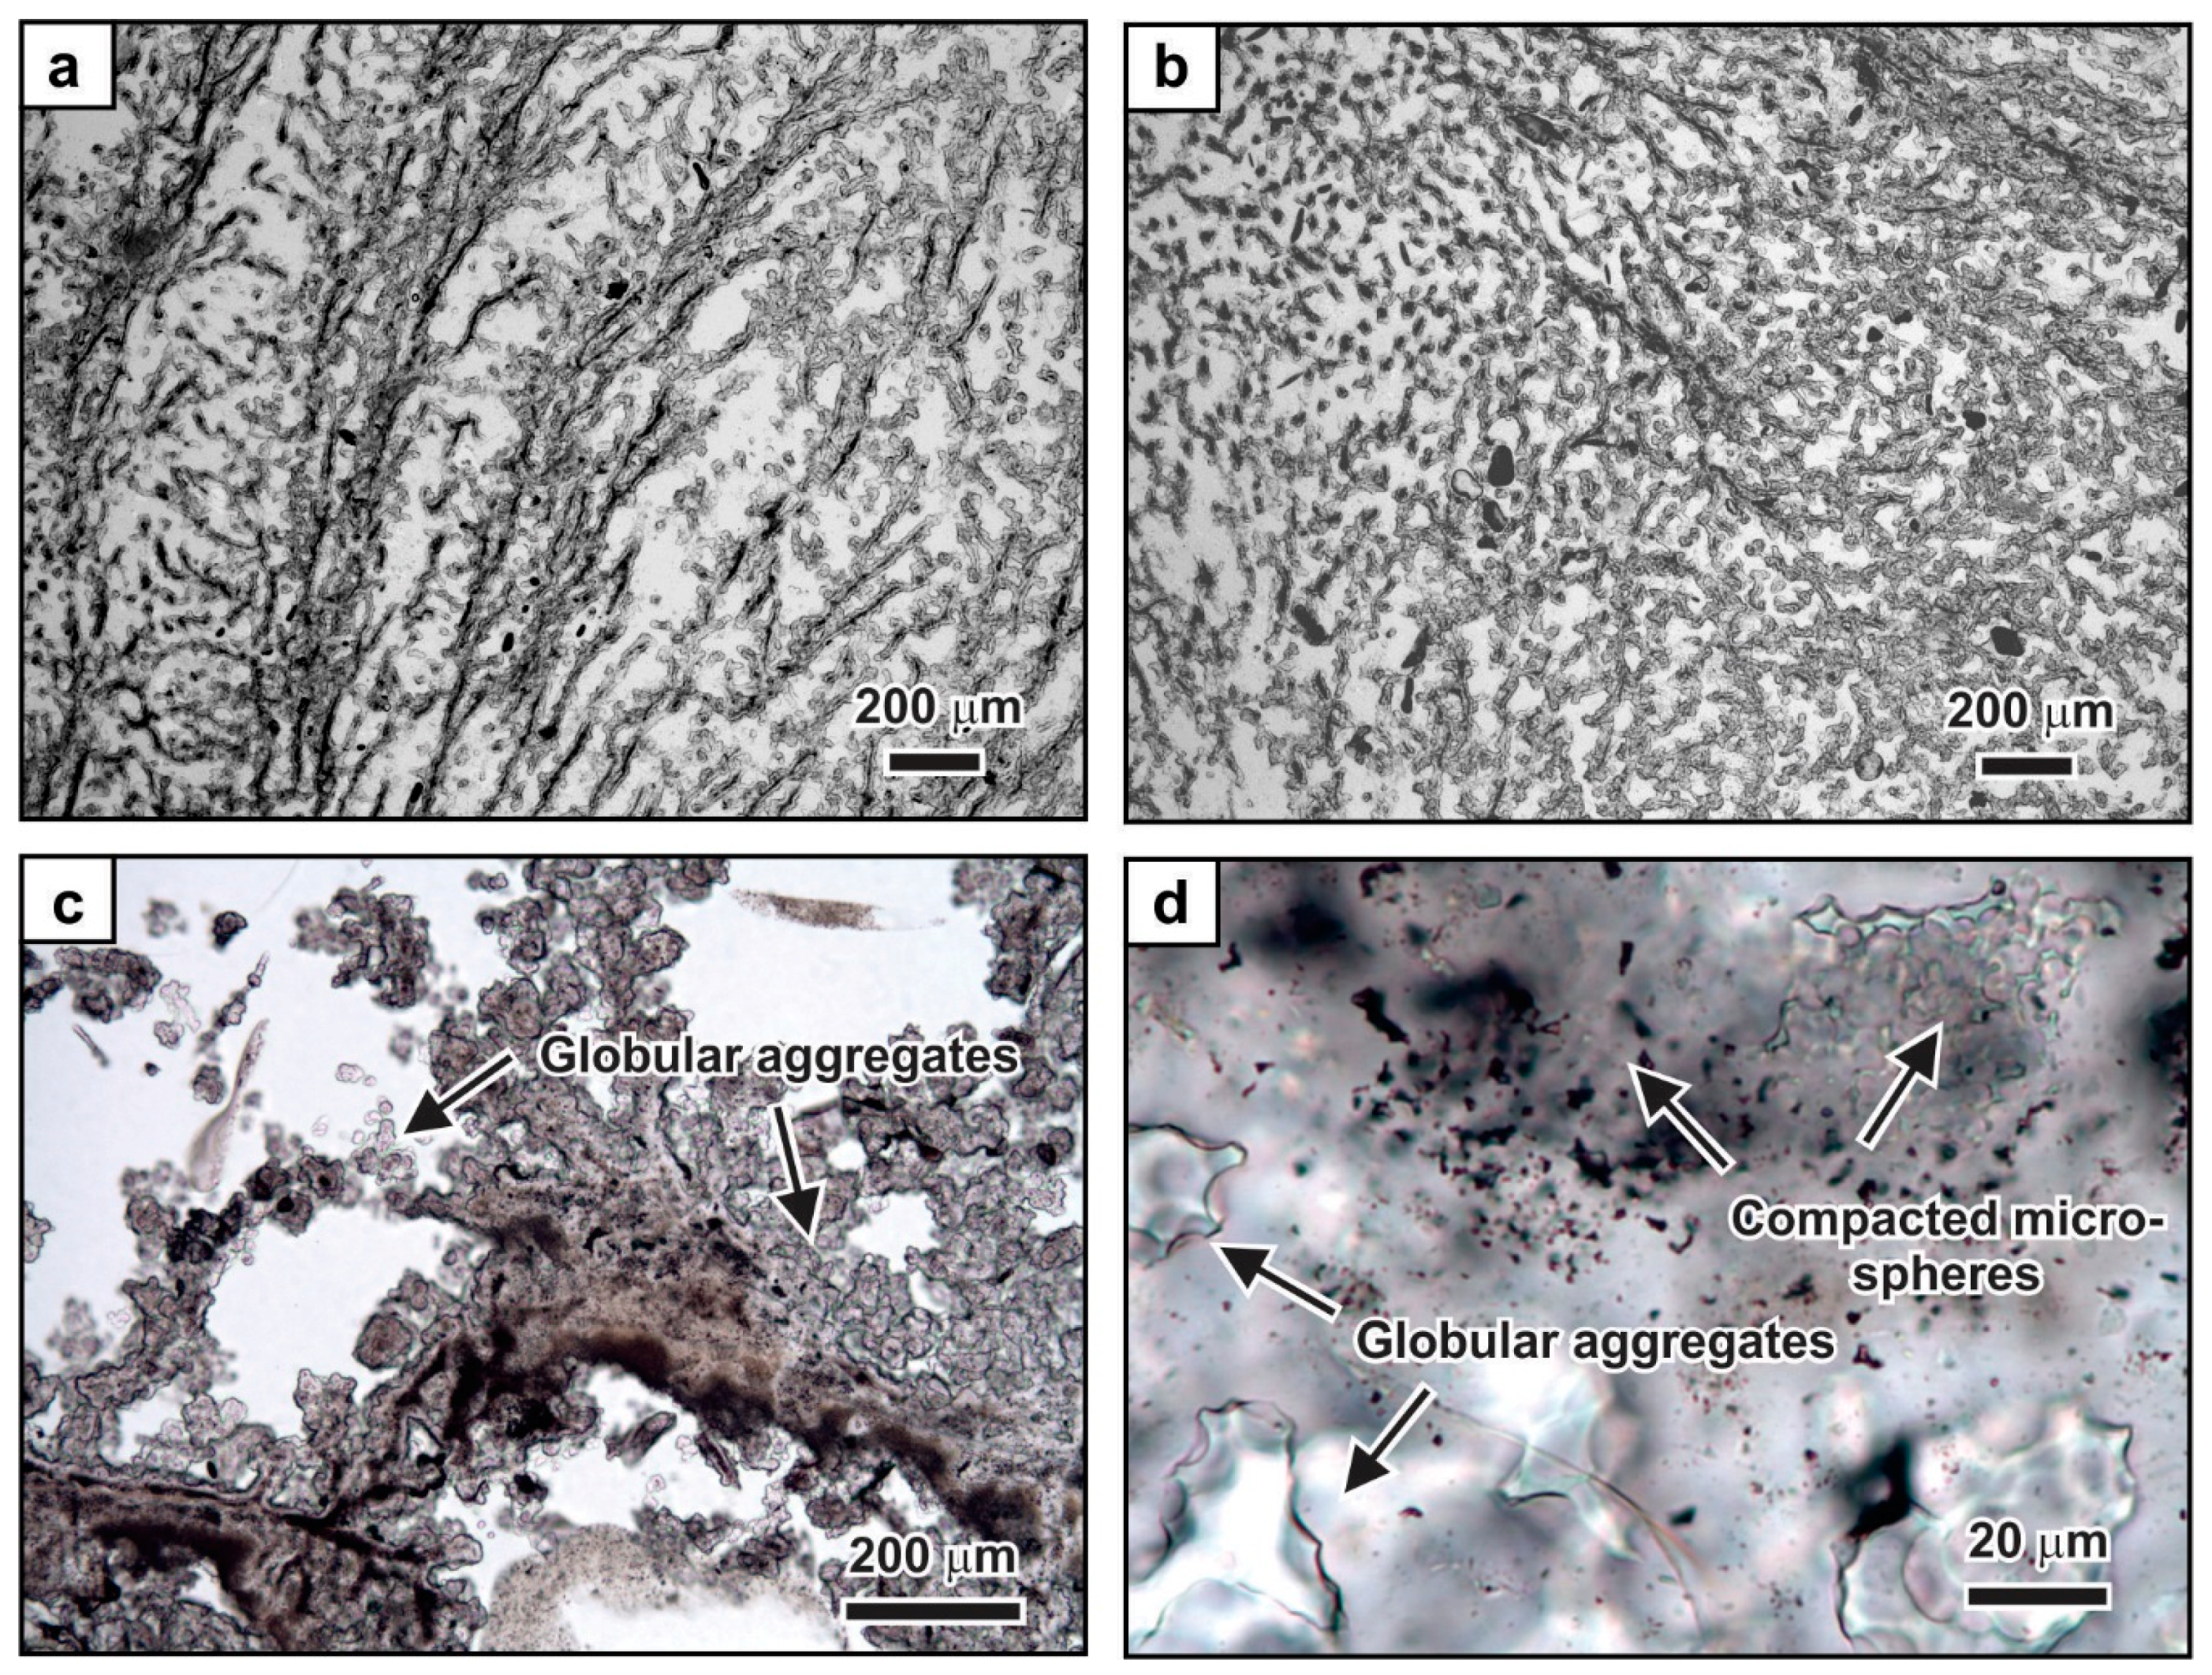
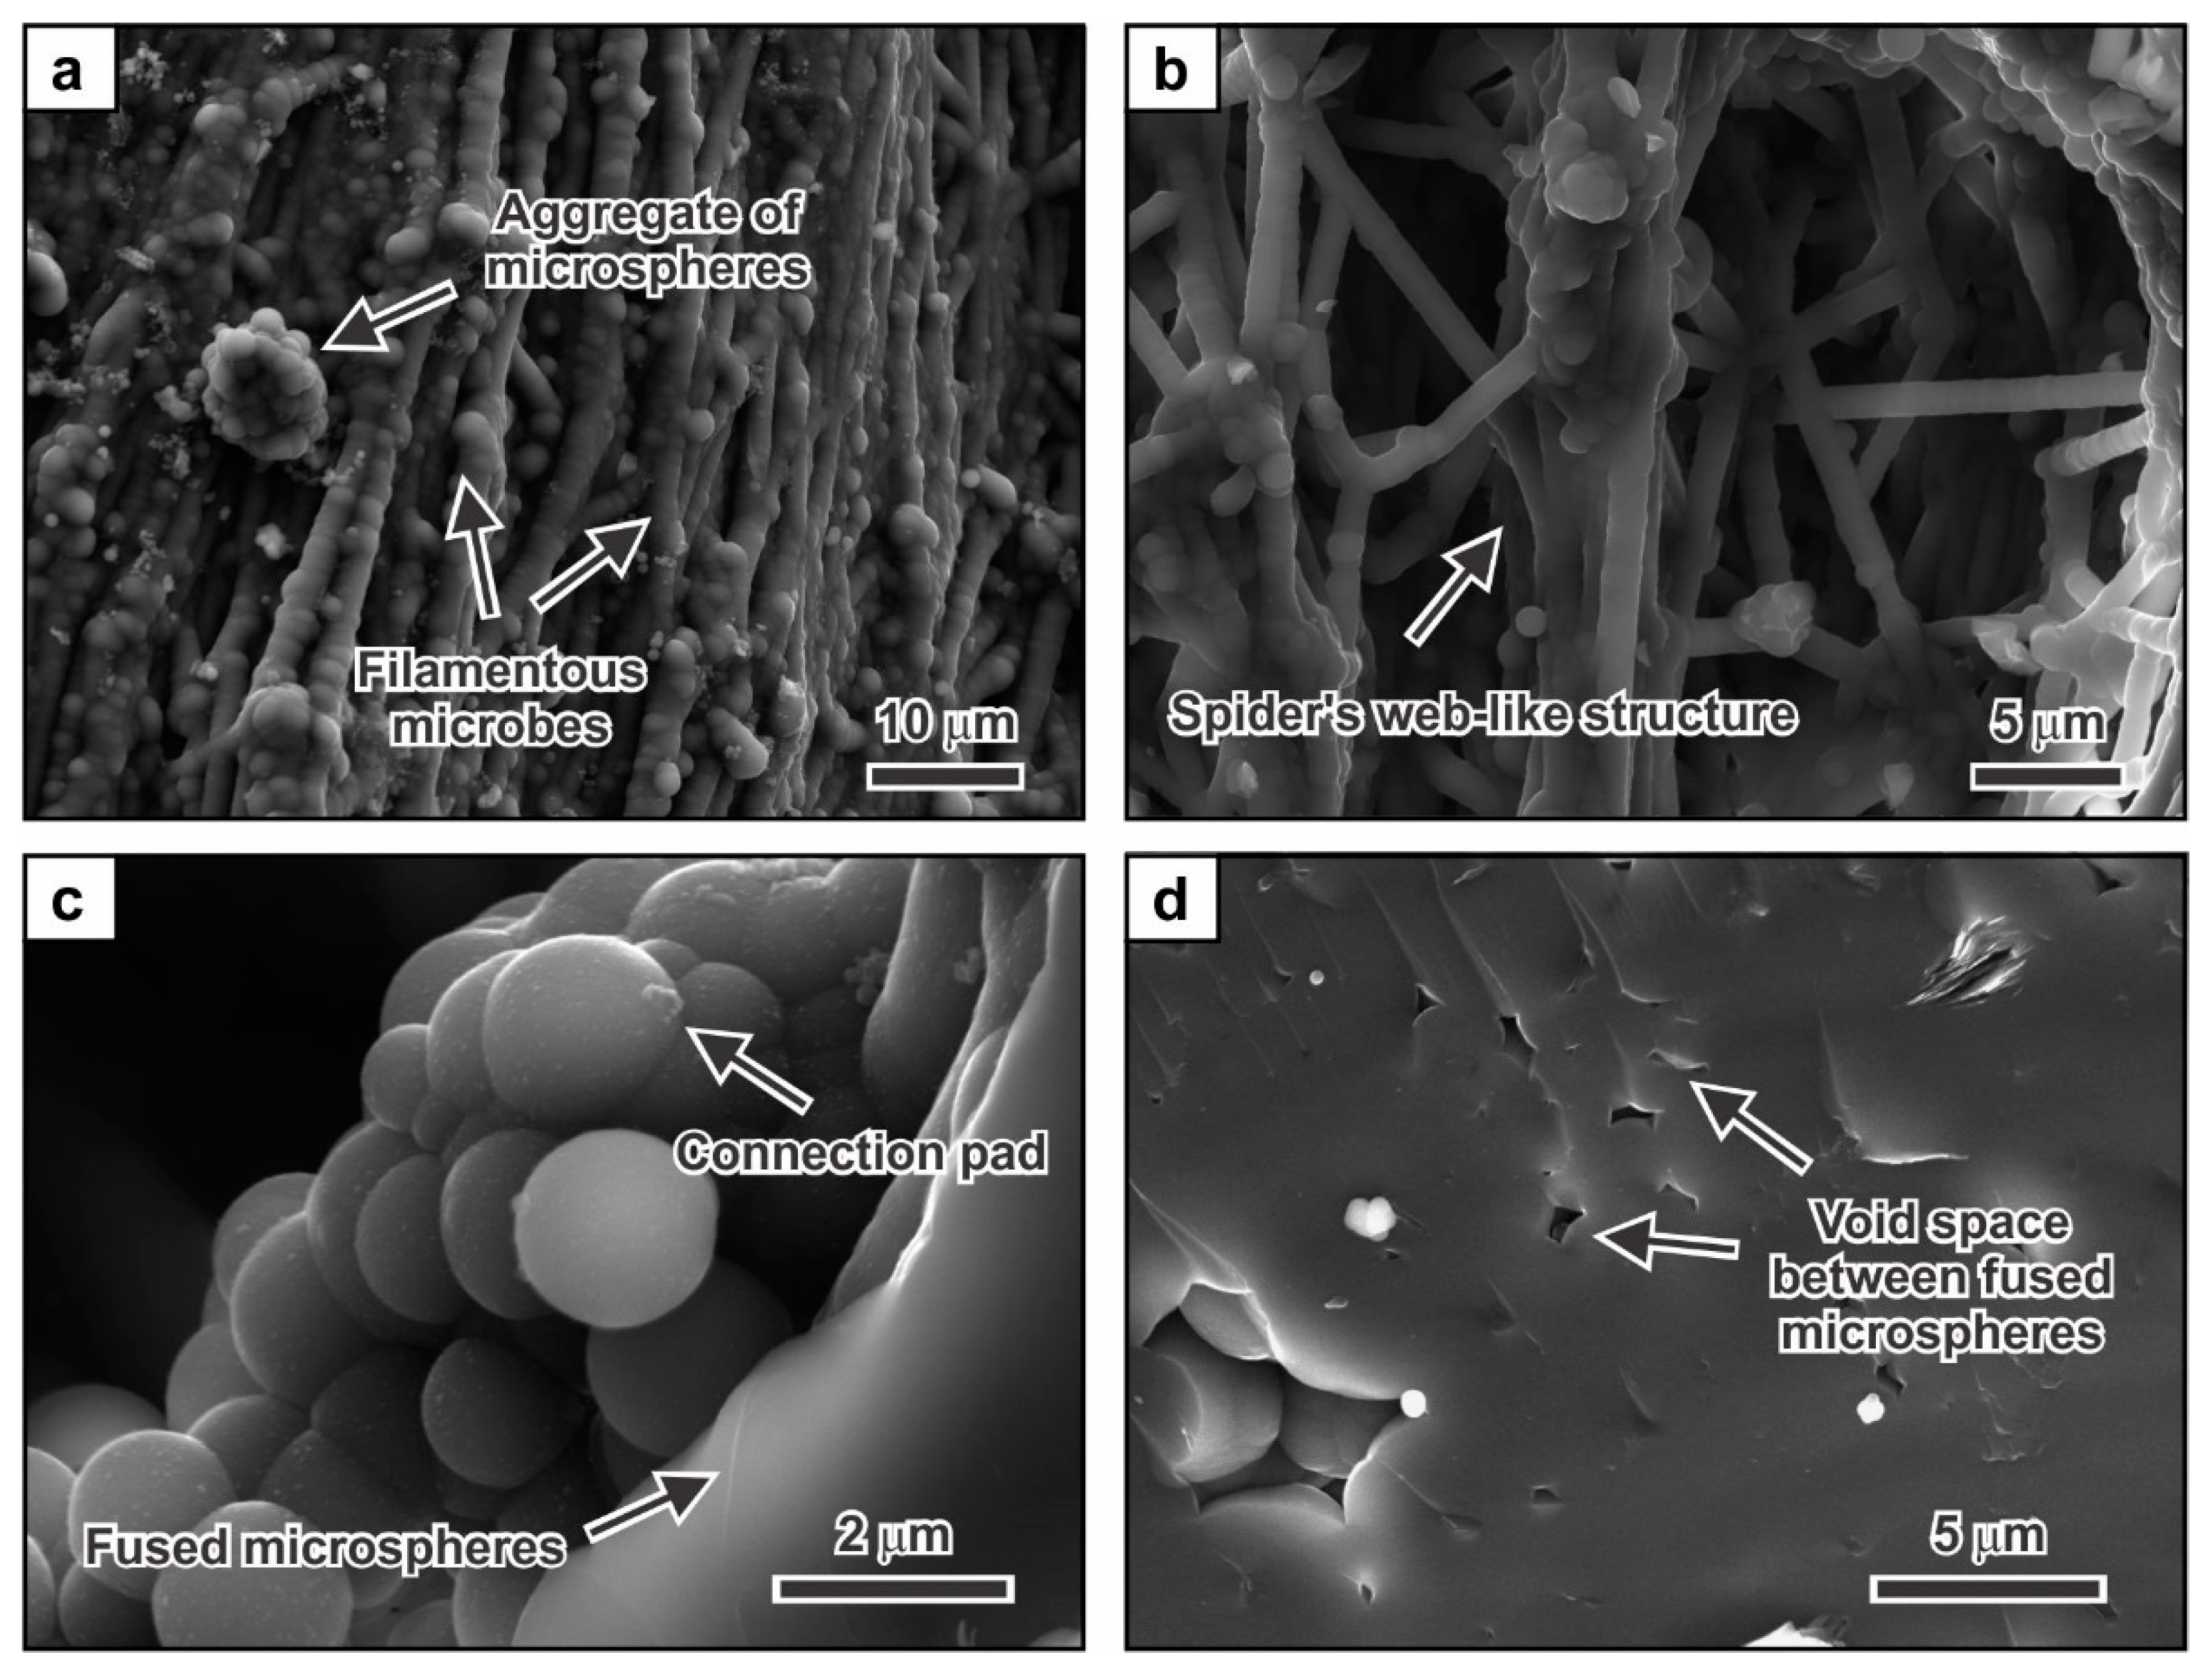
2.5. Textural Characteristics

In thin section, the silica sinter is composed of variably compacted silica laminae. The highly porous and friable white silica laminae showing palisade textures are composed of erect, silicified filamentous microbes that range from 10 to over 300 μm in length and are 2–5 µm in diameter. Complex arrays of subparallel to slightly radiating, connected, and twisted filaments define the palisade texture visible in hand specimen (Figure 3a). Arrays of oriented filaments are connected by randomly oriented filaments forming a spider’s web-like texture that exhibit incomplete framework patterns (Figure 3b). Cauliflower-like patterns are locally present. Individual filaments of the filamentous microbes are composed of heavily included, cloudy cores that are surrounded by a shell of fused microspheres of opal-A. The filaments are locally overgrown or cemented by globular aggregates composed of 20–50 individual silica spheres. These spheres are approximately 1–2.5 µm in diameter, with some being <1 µm in size.
The nonporous, smooth silica laminae that are gray, vitreous, and translucent in hand specimen are compositionally similar to the highly porous and friable silica laminae. However, the silicified filamentous microbes are densely packed and cemented together by globular aggregates of opal-A microspheres (Figure 3c). Dense vitreous silica layers are present that are composed of closely packed and fused silica spheres. In the vitreous silica layers, only faint outlines of the former opal-A microspheres can be recognized as the void space between the microspheres appears dark in plane-polarized light (Figure 3d). The compacted silica laminae contain small plant fragments and abundant Pinus pollen. The bisaccate pollen grains measure about 80–90 μm, with the pollen grain body measuring approximately 50–60 μm. The Pinus pollen most likely derived from the pine plantations (Pinus radiata) surrounding the sampling site at the Wairakei geothermal power plant. The pollen grains are overgrown and cemented by aggregates of microspherical opal-A.
Small pieces of the silica sinter were mounted on aluminum stubs and carbon coated for scanning electron microscopy. Imaging of small-scale textural relationships was conducted using a TESCAN MIRA3 LMH Schottky field-emission scanning electron microscope in secondary electron mode. A working distance of 12 mm and an acceleration voltage of 15.0 kV were used.
Scanning electron microscopy showed that the silicified filamentous microbes are composed of chains of fused silica microspheres. The chains can be subparallel or form spider’s web structures as observed in thin section (Figure 4a,b). The filaments are overgrown by individual microspheres or globular groups of microspheres (Figure 4a). High-resolution imaging showed that the spheres in these globular aggregates are connected by small connection pads that consist of silica nanospheres (Figure 4c). These connection pads are visible where a microsphere has separated from the globular aggregate. In areas of low porosity, massive zones of silica occur that consist of fused microspheres. Locally present void space defines the outline of fused microspheres in these areas (Figure 4d).

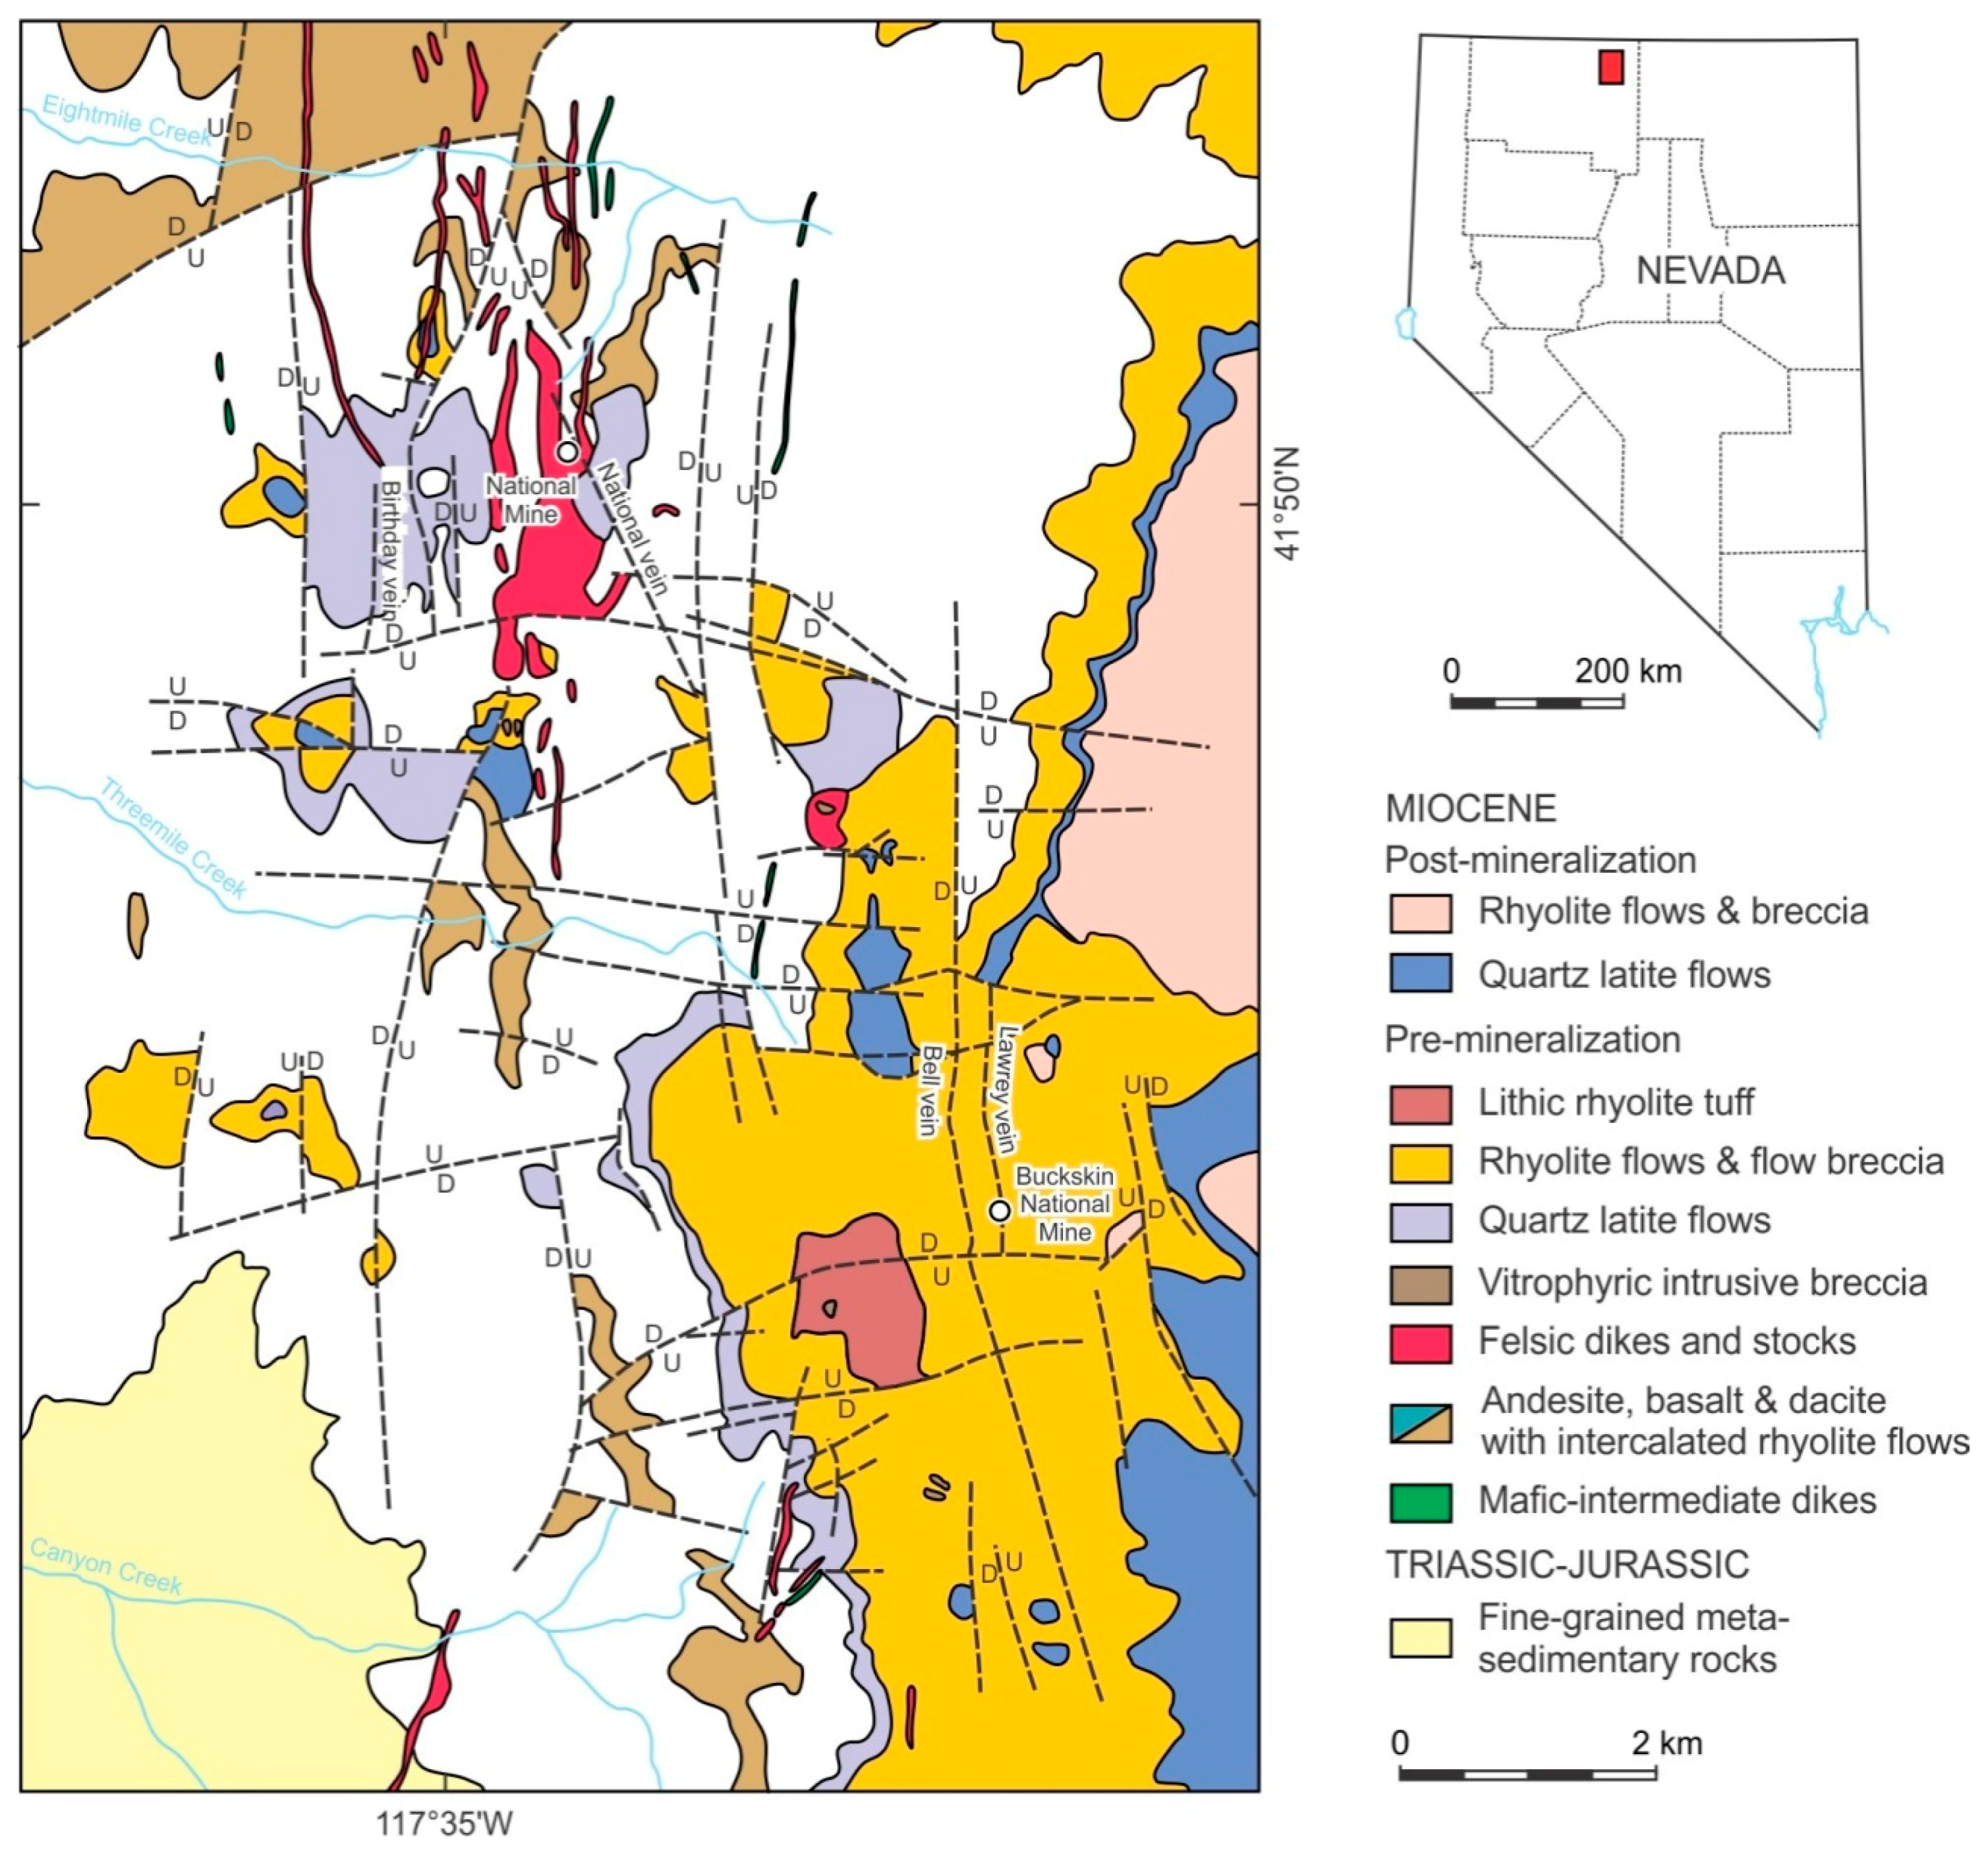
3. Epithermal Veins from the Buckskin National Deposit in Nevada

3.1. Geological Background

The Buckskin National deposit is located at the National district of Humboldt County, Nevada [39,40,41,42]. The deposit was mined intermittently from 1906 to 1941, yielding 24,000 ounces of gold and 300,000 ounces of silver from 34,000 tons of ores. The mine was developed on a bonanza-type, low-sulfidation epithermal vein referred to as the Bell vein [40].
Located on the eastern slope of Buckskin Mountain, the Buckskin National deposit is hosted by ~700-m-thick succession of Early Miocene (16.57 ± 0.03 to 16.11 ± 0.03 Ma; [42]) massive rhyolite and associated volcaniclastic facies (Figure 5). The top of Buckskin Mountain is capped by a 30-m-thick carapace of finely laminated silica sinter and silicified epiclastic deposits. The reddish to gray-black silica sinter cropping out in an area that is 420 × 230 m in size contains high Hg concentrations [42,43]. The silicified epiclastic deposits are stratified and are moderately to well-sorted. Individual beds range from several millimeters to centimeters in thickness. Bedding in the epiclastic rocks dips 15–20° to the northeast [42].
The silica sinter cropping out on Buckskin Mountain represents the surface expression of the hydrothermal system that formed the low-sulfidation epithermal deposit. The Bell vein strikes N-S and dips 75° to the west. The vein has an average thickness of 1.8 m. Mining of the Bell vein has occurred over a strike length of 1.3 km [40]. Based on drilling, the vein is known to extend to a depth of at least ~790 m below the paleosurface [42]. The Bell vein consists primarily of quartz with adularia being the second most abundant gangue mineral. 40Ar/39Ar dating of adularia yielded an age of 16.06 ± 0.03 Ma [42]. Bladed calcite replaced by quartz is locally present. The main ore minerals include electrum, acanthite, miargyrite, pyrargyrite, aguilarite, clausthalite, naumannite, arsenopyrite, galena, pyrite, marcasite, sphalerite, and tetrahedrite. Stibnite is present in the vein within ~150 m below the paleosurface [40,42]. Fluid inclusion studies showed that most of the gold and silver in the Bell vein was precipitated at 200–250 °C [40,42]. Gangue mineral textures suggest that the hydrothermal liquids experienced phase separation during vein formation [40,42].

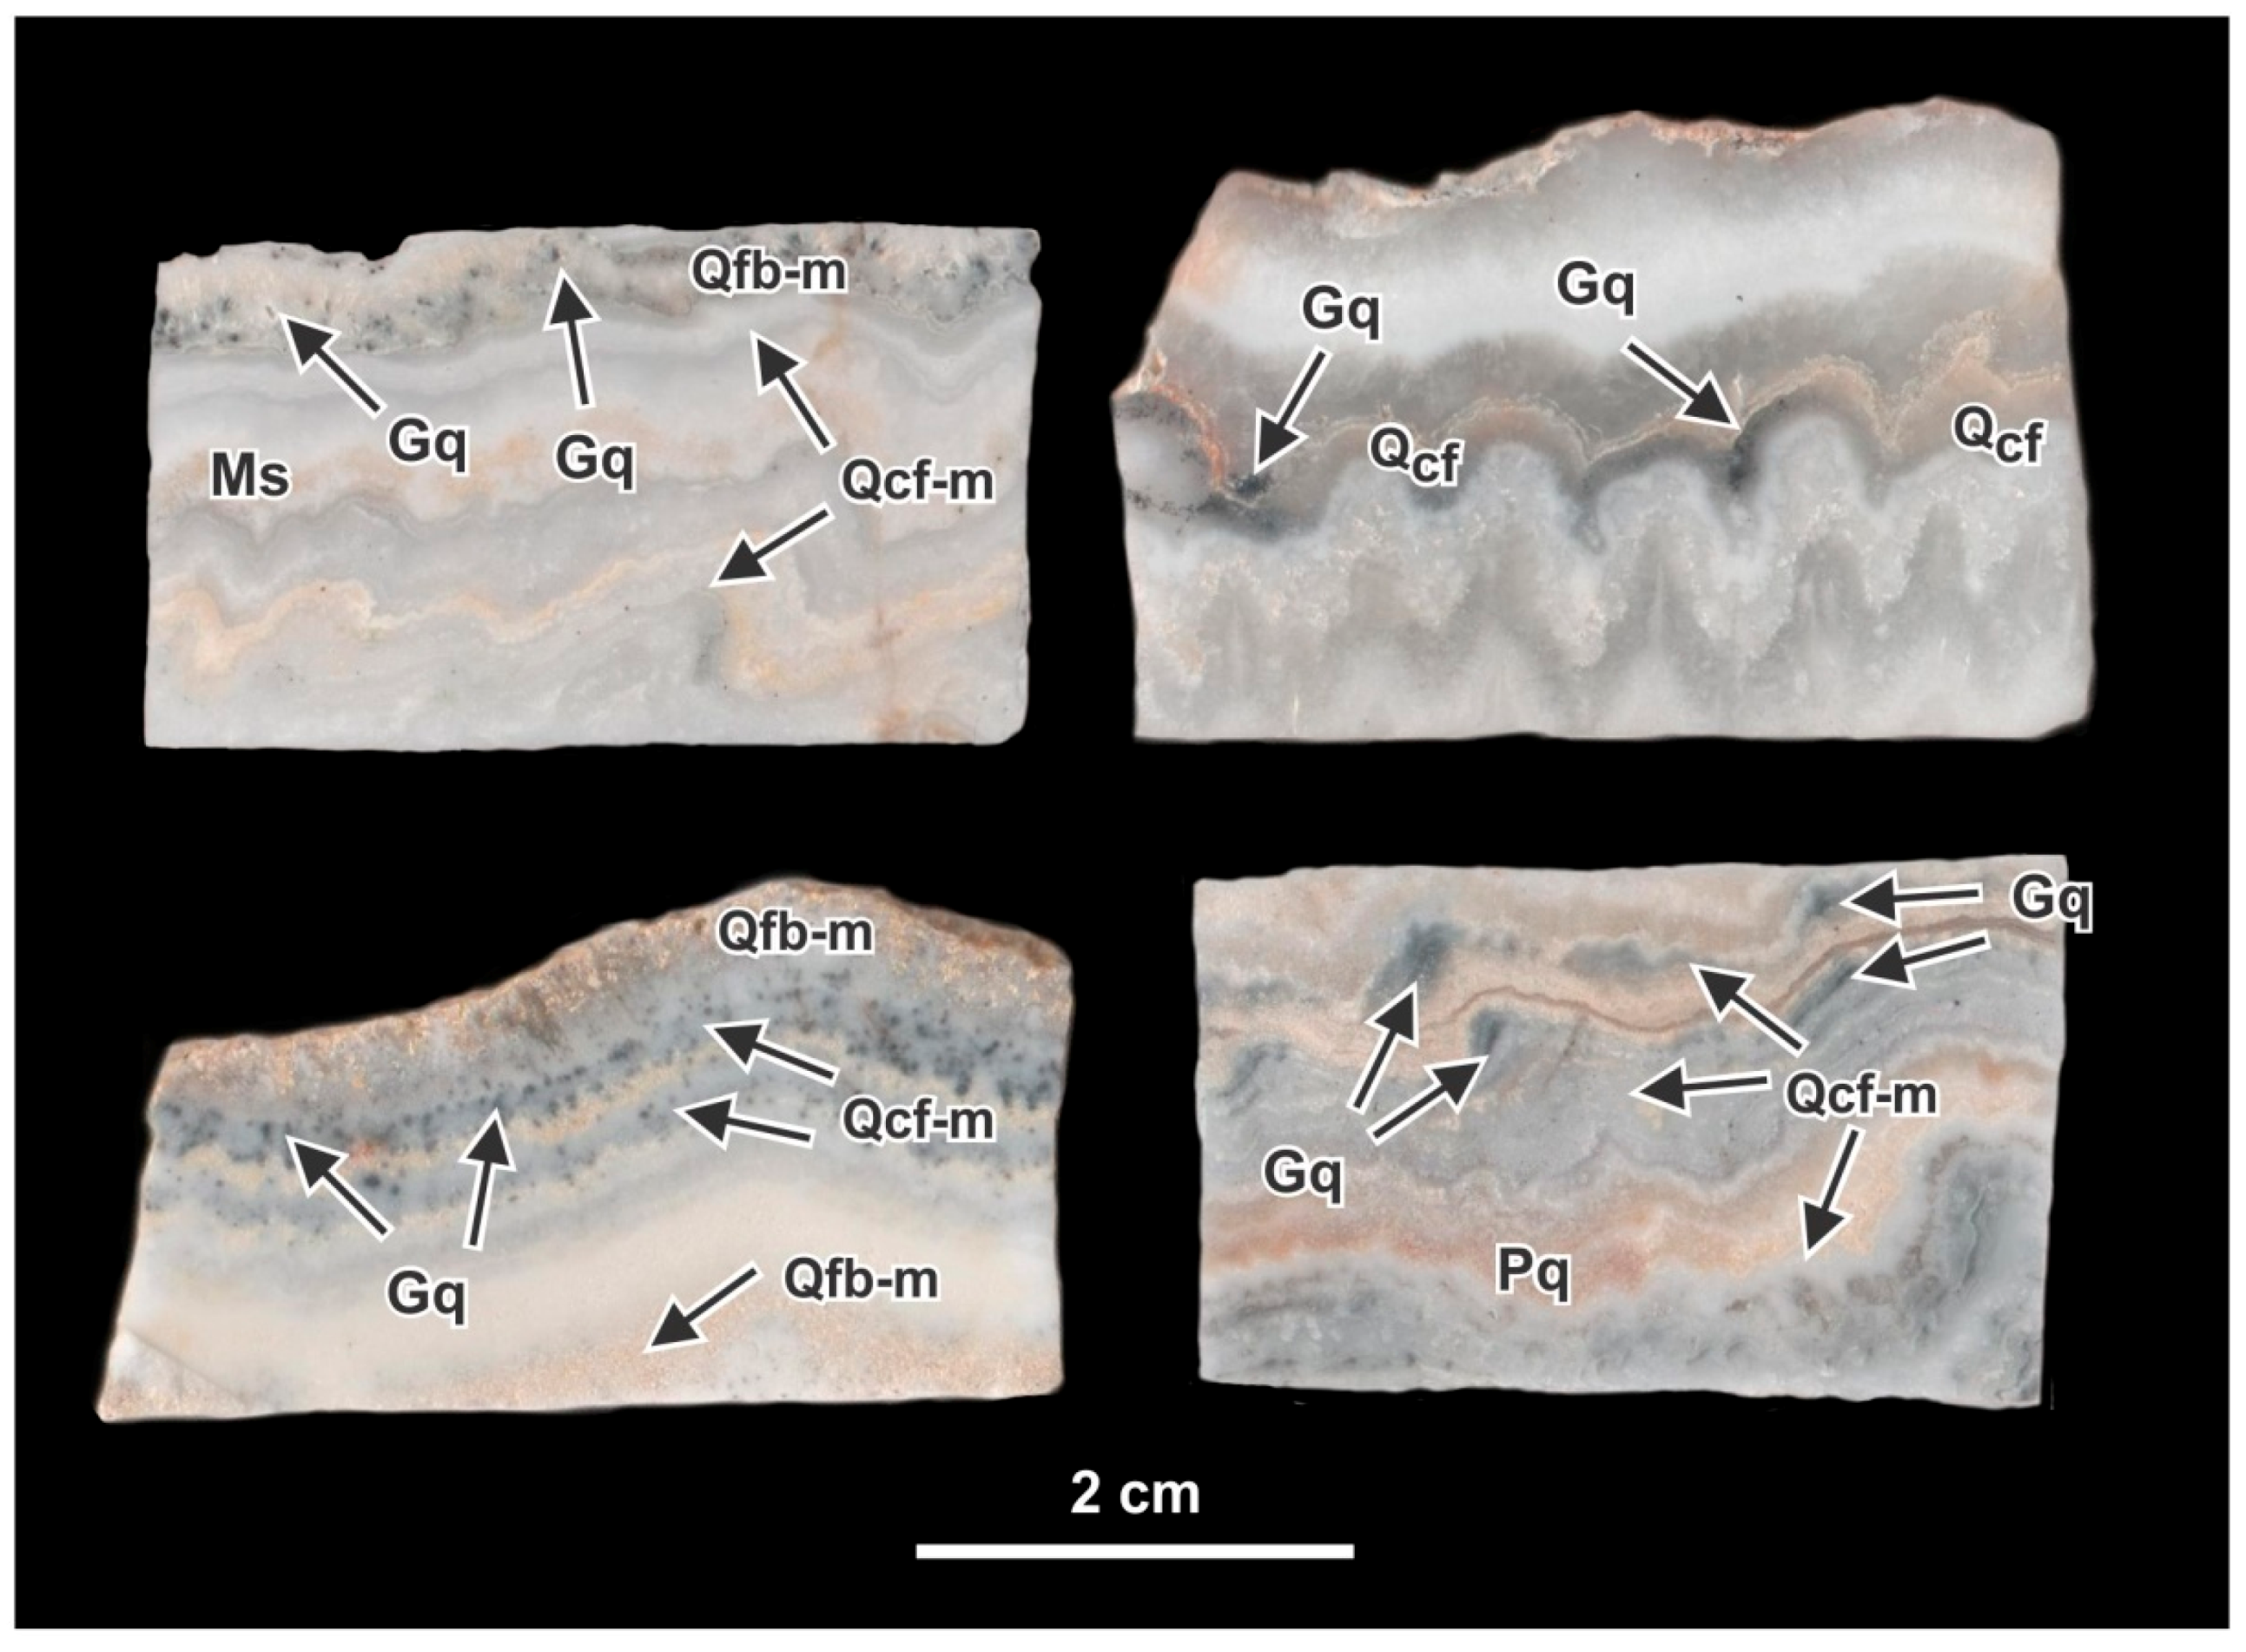
3.2. Bonanza-Type Quartz Veins

Vein textures were studied in 40 samples archived at the Colorado School of Mines as well as new samples collected from the waste dumps of the former Buckskin National mine in 2016. The vein samples are symmetrically or asymmetrically banded in hand specimen. Most bands are crustiform, consisting of alternating layers of quartz showing subtle differences in textures, colors, and grain sizes as described below. The layers are colorless, milky, or yellowish-cream to grayish-black in color and 1–5 mm in thickness (Figure 6). In addition to the crustiform bands, bands of massive gray quartz or euhedral quartz crystals occur in some samples. The centers of the veins are sutured or vuggy.

3.3. X-ray Diffraction Analysis

Using a dentist drill, one of the colloform bands in a bonanza-type quartz vein from the Buckskin National deposit was sampled. The obtained material was powdered using a mortar and pestle and used for X-ray diffraction analysis. Step-scan XRD data (5–60°2θ, 0.02°2θ step width, 1.0°2θ/min) were obtained using a Scintag XDS-2000 theta/theta diffractometer with a 2.2-kW sealed copper radiation source. An accelerating voltage of 40 kV was used, with a filament current of 40 mA and 0.5 and 0.3 mm of receiving slits. Peak-matching revealed that the colloform band is entirely composed of quartz. In addition to quartz, the sample contained small amounts of K-feldspar and muscovite.

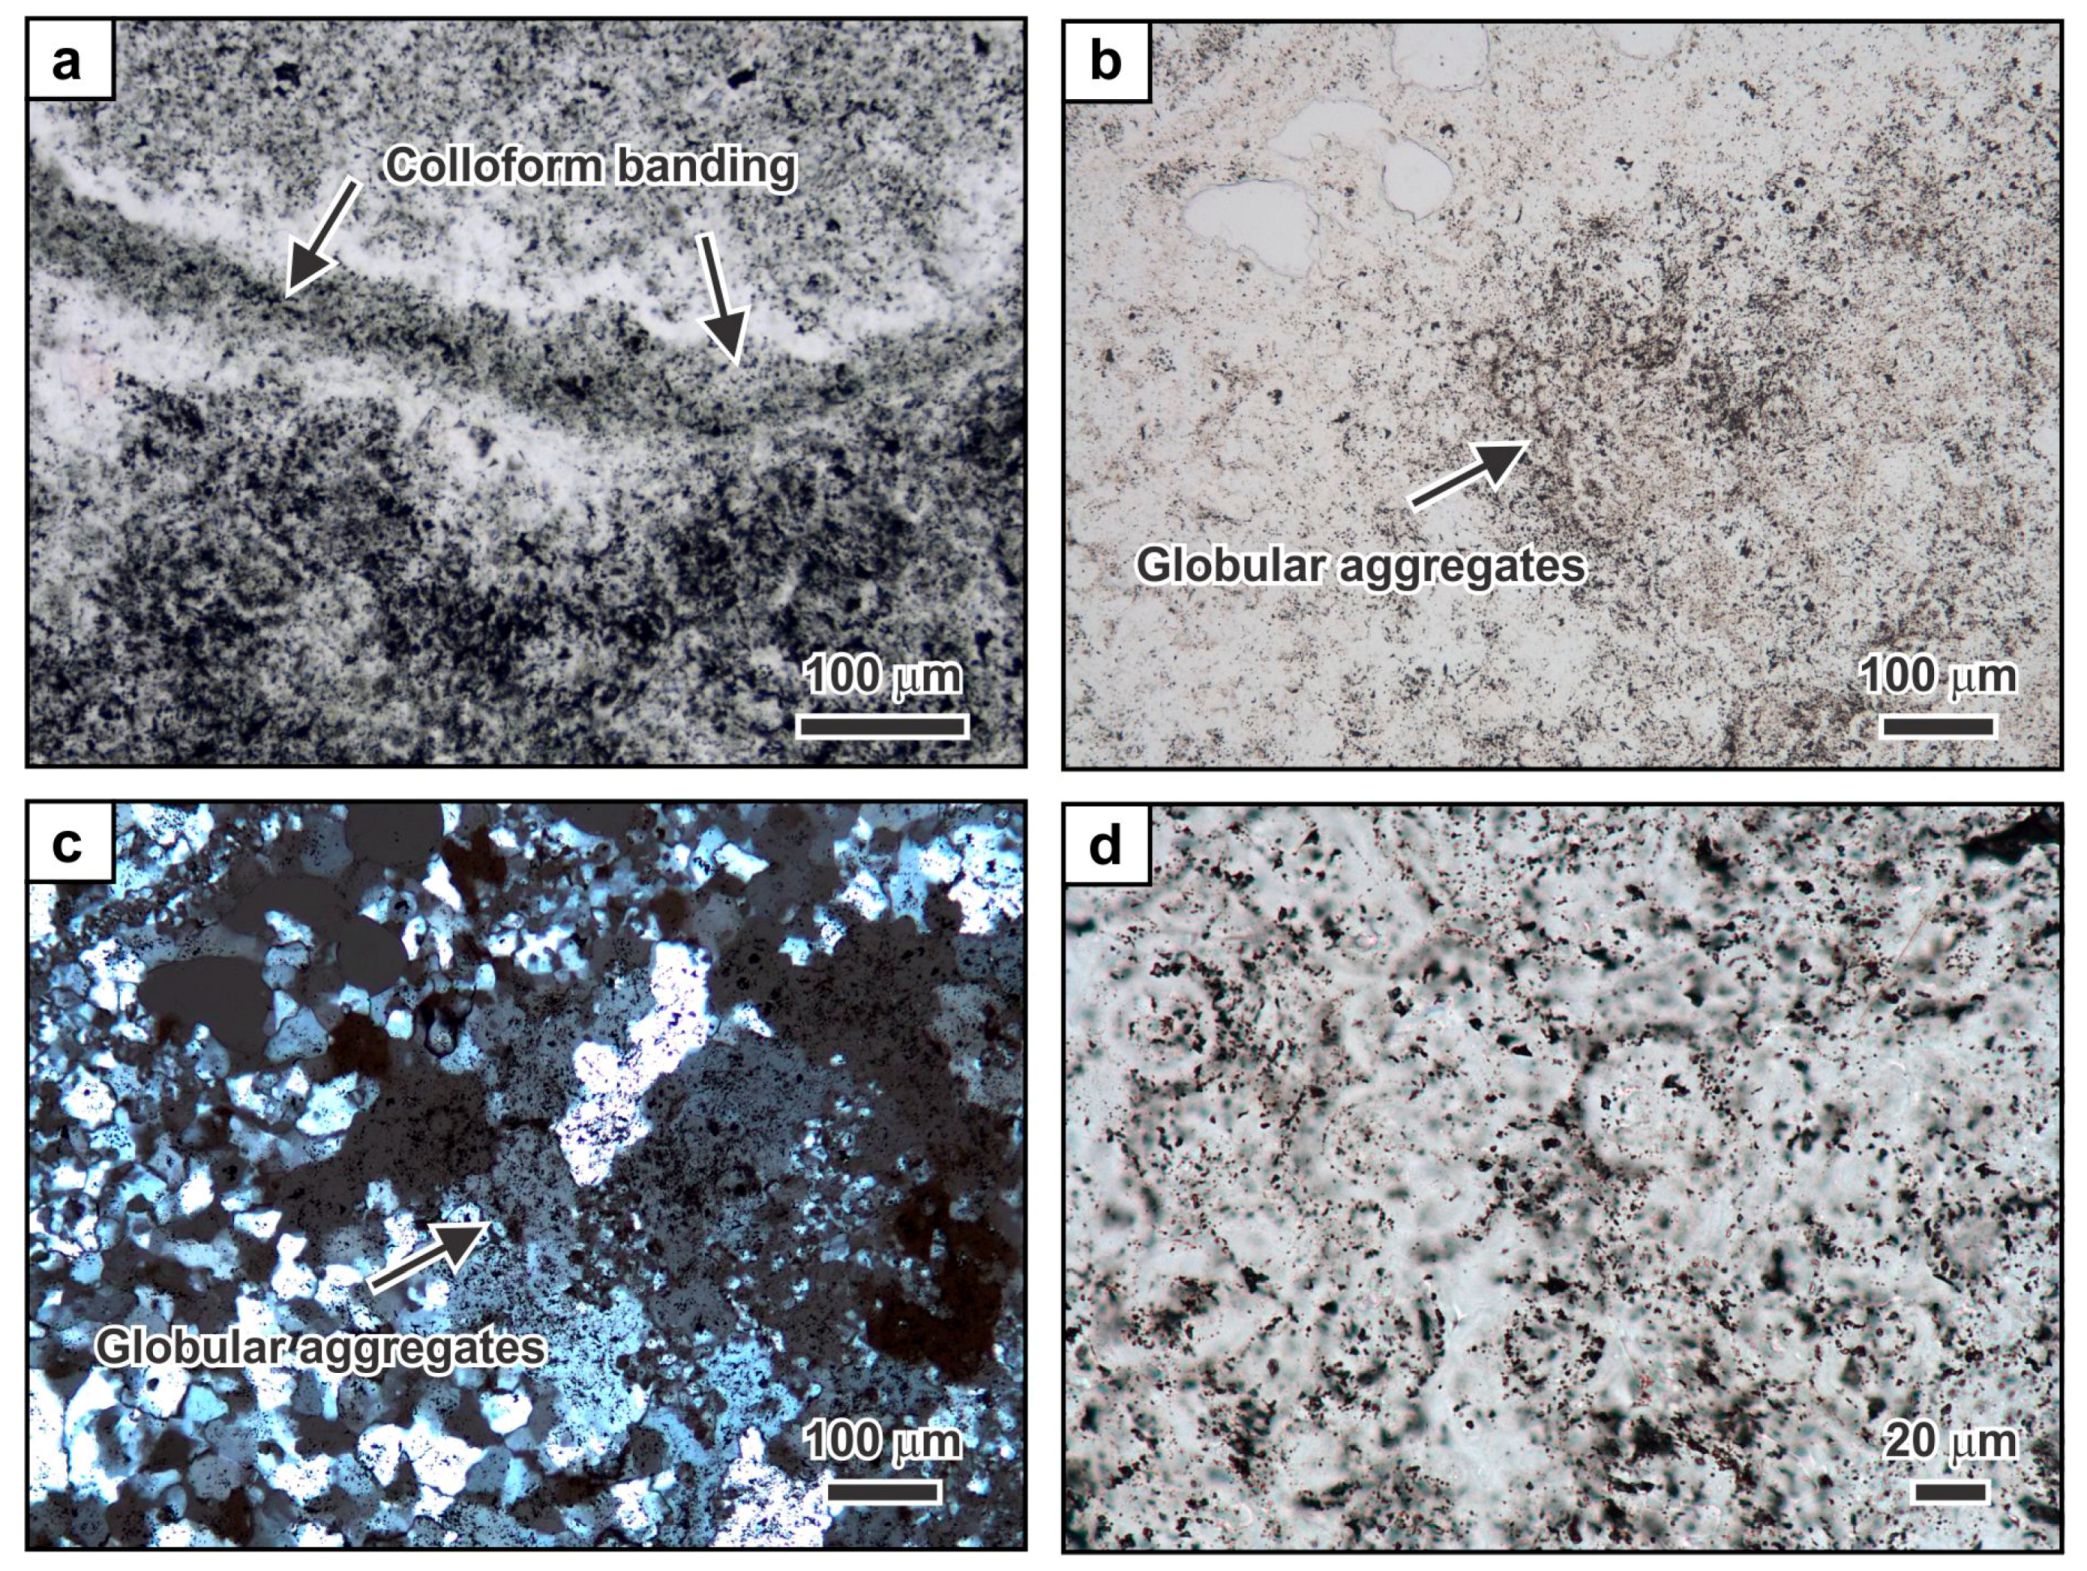
3.4. Quartz Textures

Petrographic inspection on thin sections using an Olympus BX51 microscope showed that individual layers in the crustiform bands of the bonanza vein samples exhibit a wide range of textural characteristics. Following Dong et al. [16], the observed quartz textures can be classified as being primary growth textures, recrystallization textures, and replacement textures.
Colloform quartz represents the most common primary growth texture. Colloform bands are most commonly asymmetrical with their spherical, botryoidal, reniform, or mammillary surfaces pointing towards the center of the veins. The layers are laterally continuous and typically 1–5 mm in thickness. Within the colloform bands, the quartz typically appears murky or cloudy and sometimes is almost opaque in thin section (Figure 7a). Optical microscopy at high magnification shows that the dark appearance of the quartz is related to the presence of myriads of micropores (Figure 7b). Under crossed-polarized light, the fine-grained colloform quartz shows a mosaic texture consisting of anhedral quartz grains having irregular and interpenetrating grain boundaries (Figure 7c). Microscopy on ultra-thin (15 μm) sections shows that the dark quartz with the micropores is composed of globular aggregates that are 20–30 μm in size (Figure 7b,d). These globular aggregates are composed of fused microspheres that are 1–3 μm in size. The micropores between these microspheres and between the globular aggregates have sichel-like shapes or are irregular and interconnected with concave boundaries.
In addition to the colloform quartz, chalcedonic quartz occurs in the vein samples. The chalcedonic quartz forms spherical, botryoidal, reniform, or mammillary layers that are texturally not unlike the colloform quartz composed of compacted microspheres. However, chalcedonic quartz is composed of radiating and sheaf-like bundles of microfibers. The chalcedonic layers show a fibrous extinction in crossed-polarized light. Based on the observed interference color, the chalcedony fibers are both length-fast and length-slow. The chalcedonic quartz is transparent in thin section and lacks the abundant micropores that are characteristic of the colloform quartz layers.
Moss and comb quartz represent other common primary growth texture present in the veins from the Buckskin National deposit. The moss quartz consists of groups of spheres that are 0.1–1 mm in size. The moss-like aggregates include radiating and concentric patterns of fine-grained quartz. The moss-like quartz is commonly coated by multiple thin colloform quartz layers. Comb quartz is composed of 0.5–1 mm large euhedral crystals. The quartz crystals form parallel or subparallel clusters and can exhibit radial patterns. Near the center of the veins, the euhedral quartz crystals can project into open space. Layers of comb quartz are commonly overgrown by colloform quartz layers.
The crustiform bands in the vein samples from the Buckskin National deposit contain a range of textures interpreted to be related to the recrystallization or replacement of primary textures. All samples collected contain mosaic quartz, which consists of anhedral grains that have irregular and sutured grain boundaries. The texture can be best identified in crossed-polarized light. The anhedral grains are 0.01–0.1 mm in size. Sericite and kaolinite locally are present along the grain boundaries. Mosaic quartz overprints primary growth textures, including colloform and moss quartz which can be recognized in plane-polarized light despite the recrystallization. Other recrystallization textures identified include feathery and flamboyant quartz. In addition, replacement textures recognized in the quartz veins from the Buckskin National deposit include lattice-bladed, ghost-bladed, parallel-bladed, and pseudo-acicular textures. These textures are interpreted to have formed through complete replacement of calcite by quartz.
Precious metal minerals in the vein samples at the Buckskin National deposit primarily occur within the colloform bands. Most abundant are naumannite dendrites that point toward the center of the veins. Electrum is less abundant and typically occurs as inclusions in naumannite. Pyrargyrite locally forms part of the naumannite dendrites [44,45,46].

4. Discussion

4.1. Formation and Recrystallization of Noncrystalline Silica in Modern Sinter Deposits

The sinter studied from the Wairakei geothermal power plant in New Zealand represents a young and highly immature silica deposit that is entirely composed of opal-A. Opal-A represents a noncrystalline hydrated silica phase. Opal-A is noncrystalline as it lacks long-range order [47]. Water is present as absorbed water or forms internal or surface silanol groups [47,48,49].
Young silica sinters from geothermal areas worldwide consist primarily of opal-A and have similar textural characteristics to those observed in the samples investigated here [50,51,52,53,54,55,56]. Smith et al. [57] studied silica deposits sampled from the discharge drain of the Wairakei geothermal power station and the silica sinter terrace of the Orakei Korako geothermal field in New Zealand. Opal-A textures observed included densely packed silica filaments, tangled chains of coalesced spheres forming closely packed mats of silica filaments, and twisted, helical strands of silica. Similar to the present study, opal-A from the Geysir geothermal area in Iceland occurs as featureless low-porosity opal-A laminae that alternate with high-porosity laminae composed of vertical or near-vertical silicified filamentous microbes [58]. The low-porosity laminae were formed of polymerized opal-A microspheres, with porosity being controlled by sphere packing and the amount of opal-A cement. Filamentous microbes were found to have outer mammillary surfaces that are smooth and featureless [58].
Previous studies on silica sinters have shown that the thermodynamically unstable opal-A matures and transforms over time, forming thermodynamically more stable paracrystalline [47] opal-CT, then opal-C, and ultimately blocky, microcrystalline quartz [51,54,55,59,60,61,62,63]. In the case of the Taupo Volcanic Zone in New Zealand, microcrystalline quartz becomes a common phase in silica sinters older than ~20,000 years [51]. Temperature, groundwater interaction, water chemistry, and other environmental factors represent important variables controlling the maturation time of silica sinters [58,64].
The transformation from opal-A to opal-CT is typically accompanied by textural changes [51,54,55,58,59], although the mineralogical changes may outpace textural maturation [63,65]. Opal-CT commonly forms lepispheres that are similar in size to the opal-A microspheres [51,54,55,56,58,59]. For instance, opal-CT at the Geysir geothermal area in Iceland forms <1-μm lepispheres that are composed of arrays of loosely packed intersecting thin plates or clusters of tightly packed plates. The plates commonly have hexagonal shapes. In addition to lepispheres, opal-CT sometimes also forms complex three-dimensional spindle and barrel frameworks [58]. The transition from opal-A to opal-CT most likely occurs through a dissolution–reprecipitation process [58,62,63].
Continued maturation to opal-C and quartz is commonly associated with another major change in microtextures [51,55,59,62]. At the Roosevelt Hot Springs in Utah, this transition involved a reorganization from blades into elongate, randomly oriented nanorods or blocky aggregates. Diagenetic quartz forms small euhedral crystals oriented parallel to the sinter surface [62]. In addition to opal-C and quartz, moganite can occur in mature sinters [60].
The textural characteristics of opal-CT and opal-C have not been observed in the silica sinter samples investigated from the Wairakei geothermal power plant, confirming that textural maturation of the young deposits has not yet commenced. Smith et al. [57] also showed that silica deposits of up to 2 years in age sampled at the discharge drain of the Wairakei power plant still consist of opal-A, although aging could be demonstrated based on the width of the opal-A band measured in XRD patterns.

4.2. Preservation of Textural Features in Fossil Silica Sinters

Despite textural changes associated with the transition from thermodynamically unstable opal-A to thermodynamically stable quartz with time, fossil sinters preserve a wide range of textural characteristics. Fossil sinters have been recognized throughout geological time, with the oldest being Archean in age [66].
Devonian sinter deposits in Aberdeenshire in Scotland [67] showing massive, vuggy, laminated, lenticular, nodular, and brecciated textures contain abundant silicified plant material. Devonian–Carboniferous sinters of the Drummond Basin in Australia exhibit a wide range of microfacies ranging from high-temperature apparently abiotic geyserites through various forms of stromatolitic sinters to ambient temperature marsh deposits. The sinters contain well-preserved microfossils including cyanobacterial sheaths [68,69]. A detailed study on Jurassic sinters in the Deseado Massif of Argentina showed that these deposits contain small-scale stromatolitic columnar structures, molds of stems and roots of plants, and desiccation cracks [70].
Upper Miocene to Pliocene Waitaia sinter on the east Coromandel Peninsula is the oldest known sinter deposit in New Zealand. The sinter exhibits plant-rich and plant-poor facies as well as detrital-rich vitreous and detrital-rich brecciated facies. In places, the silica sinter is interbedded with swamp deposits. Snails trapped in the sinter have become silicified [55]. The lower to mid-Pliocene Whenuaroa sinter of the Puhipuhi geothermal field in Northland, New Zealand exhibits stromatolitic facies including columnar structures and palisade mats. Quartz and moganite occur as microspheres that represent pseudomorphs of a noncrystalline precursor phase [55,61].
Preservation of delicate macroscopic and microscopic textures in fossil sinters enables their identification in ancient volcanic successions. Information on the presence and location of fossil sinters is used in mineral exploration to locate low-sulfidation epithermal vein deposits and to constrain the location of the paleowater table at the time of mineralization [7,71]. The presence of relic microspherical textures proves that these deposits formed by processes analogous to modern sinters associated with active geothermal systems, which originally involved the precipitation of opal-A that subsequently recrystallized to quartz through intermediate, metastable silica phases such as opal-CT.

4.3. Formation and Recrystallization of Noncrystalline Silica in Epithermal Veins

This study shows that some colloform quartz bands in the vein samples from the Buckskin National deposit in Nevada are composed of mosaic quartz that locally preserves densely packed microspheres texturally resembling those observed in the sinter samples from the Wairakei geothermal power plant in New Zealand. Based on the textural similarity, these microspheres are interpreted to have been originally composed of a noncrystalline silica phase.
This interpretation is consistent with previous works focusing on the ore mineralogy of deposits in the same district. Lindgren [39] described the occurrence of gold at the National deposit and noted that the gold forms elongated rod-like or club-like aggregates that are up to 3 mm in length. The gold aggregates commonly resemble dendrites. He suggested that the gold formed in a yielding medium, implying that the surrounding silica originally was gelatinous mass that slowly crystallized to a fine-grained quartz aggregate subsequent to gold deposition. Lindgren [39] also pointed out that the dendritic nature of the gold must represent a primary growth texture and that the gold and the surrounding silica mass must have been deposited at the same time. Detailed petrographic investigations by Saunders et al. [44,45] and Saunders [46] showed that naumannite in bonanza vein samples from the nearby Buckskin National deposit forms dendritic aggregates pointing towards the center of the veins. The naumannite dendrites probably formed by a similar process as the gold dendrites described by Lindgren [39].
The noncrystalline silica precursor to the colloform bands may have been similar in nature to gel-like silica deposits recovered after a hydrothermal eruption at Porkchop Geyser in Yellowstone [72,73]. Porkchop Geyser was the site of a small eruption in 1989. Ejected blocks were coated by a siliceous gel-like material that was up to 1-cm thick and showed botryoidal textures. Within several days of the eruption, the gelatinous material hardened and became no longer pliable [72,73].
Although the colloform bands in the vein samples from Buckskin National may originally have been composed of noncrystalline opal-A, they today consist entirely of quartz, as confirmed by the XRD experiments. In the vein material investigated, areas showing densely packed microspheres can only locally be recognized through optical microscopy. Under crossed-polarized light, the microspheres are not isotropic, confirming that they are no longer composed of a noncrystalline silica phase. The silica in the vein samples from Buckskin National has fully matured. This maturation process may have involved the formation of intermediate, metastable silica phases such as opal-CT. Investigations by Saunders [19] showed that silica in colloform bands in bonanza-grade samples from the Sleeper deposit in Nevada are virtually isotropic and XRD investigations confirmed the presence of opal-CT. The silica in the vein material from this low-sulfidation epithermal deposit has not been fully transformed to quartz. The degree of maturation may perhaps be related to the evolution of the hydrothermal system following silica deposition. Laboratory studies show that transformation of opal-A to quartz under hydrothermal conditions may occur within days to months [21,22,23,24].
In the samples investigated, quartz formed through recrystallization of the noncrystalline precursor phase in the colloform bands is mostly characterized by a mosaic texture, which can be easily recognized under crossed-polarized light. This texture is characterized by highly irregular and interpenetrating grain boundaries. In chert, mosaic textures are known to develop as a result of recrystallization from a noncrystalline silica precursor [74]. A similar origin has been inferred for mosaic quartz in epithermal veins [14,19,20,75].

4.4. Implications for Ore-Forming Processes

The observation that colloform banding exhibiting relic microspheres in the veins at the Buckskin National was originally composed of compacted and merged sphere-like aggregates of a noncrystalline silica precursor phase is in agreement with previous observations by Saunders [19,20] on bonanza-type vein material from the Sleeper deposit in Nevada. Based on careful textural observations, Saunders [19,20] showed that mineralized colloform bands in this deposit formed from coagulated silica. In contrast to this colloform quartz, bands composed of other textural types of quartz are barren. Similarly, Sherlock and Lehrman [76] demonstrated that colloform bands in crustiform veins from the McLaughlin deposit in California consist of compacted microspheres of quartz that formed through recrystallization of a noncrystalline silica precursor phase. The bands contain gold as dendrites or as particles that are concentrated in the interstitial space between the microspheres. At Guanajuato in Mexico, gold grades correlate with quartz vein textures, with the highest gold grades occurring in samples containing abundant colloform bands [14]. At the Koryu deposit in Japan, Shimizu [17] also demonstrated that colloform bands are the main host to precious metal minerals. The evidence available from these deposits collectively suggests that the formation of colloform bands originally composed of noncrystalline silica is directly related to the process of precious metal deposition in epithermal vein deposits.
In epithermal systems, silica supersaturation with respect to quartz leading to the deposition of opal-A can be accomplished as a result of fluid immiscibility [77,78]. Fluid inclusion evidence from Buckskin National in Nevada [40,42], Sleeper in Nevada [79], McLaughlin in California [76,80], Guanajuato in Mexico [14,81], and Koryu in Japan [17] is interpreted to indicate that phase separation of the hydrothermal liquids occurred during vein formation, even though the exact conditions of noncrystalline silica deposition cannot be ascertained due to the lack of primary fluid inclusions in the colloform bands composed of relic microspheres. Additional evidence for the occurrence of boiling at these deposits includes the presence of platy calcite which is replaced by quartz pseudomorphs (cf. [11]).
Moncada et al. [14] suggested that two end-member types of fluid immiscibility can be distinguished in epithermal systems based on the “intensity” of vapor production. During “gentle” boiling, a small proportion of the hydrothermal liquid is converted to vapor as the ascending hydrothermal liquid intersects the liquid plus vapor coexistence boundary. The small amount of vapor produced this way rises slowly through the fracture network. The remaining liquid cools as a result of boiling and continues to rise in the presence of vapor. During “violent” boiling, referred to as flashing, vapor is produced due to near-instantaneous vaporization of a large amount of hydrothermal liquid. This process may occur in response to a seismic event or dike-induced faulting [8]. Propagation of vaporstatic conditions in the fracture will cause any liquid present at depth or within the surrounding wall rock to flash to vapor [82]. Flashing may be associated with the formation of extensive zones of brecciation at depth. Hydrothermal eruption craters may develop at surface [83,84,85,86].
Flashing of the hydrothermal liquids would result in the near-instantaneous deposition of silica, as silica solubility in the vapor phase is significantly lower than in the liquid. The colloform bands composed of compacted silica microspheres may record such events of transient fluid flashing as extreme silica supersaturation with respect to quartz could be easily achieved by this process [82]. This conclusion is consistent with the observation that fluid inclusion evidence for gentle boiling can be recognized in a range of different textural types of quartz, many of which are not directly associated with ore minerals [14].
Deposition of noncrystalline silica in the veins may be concomitant with the formation of the precious metal minerals because flashing results in the preferential partitioning of H2S into the vapor phase, reducing the amount of H2S in solution in the coexisting liquid [9]. This process of metal deposition is observed in modern geothermal systems where sharp decreases in pressure occur such as on back-pressure plates in surface pipes of geothermal power plants [9]. Sanchez-Alfaro et al. [87] showed that flashing is a more effective mechanism of gold precipitation than gentle boiling.

4.5. Exploration Implications

The textural observations on crustiform quartz vein samples from the Buckskin National deposit in Nevada suggest that the precious metal minerals are primarily contained in colloform bands containing relic silica microspheres. Delicate intergrowth between the ore minerals and the microspherical silica in these bands [45,46,47] strongly supports the hypothesis that deposition of both were caused by the same process and flashing of the hydrothermal fluids represents the most likely process allowing rapid codeposition. Therefore, textural analysis on epithermal veins could be used to identify hydrothermal systems that underwent transient periods of fluid flashing. These systems are likely to be associated with veins having high gold grades, as fluid flashing represents the most efficient process of gold deposition in the epithermal environment [9,87]. Conversely, hydrothermal systems in which fluid ascent is only accompanied by gentle boiling or cooling (cf. [13,75]) are more likely to form lower-grade precious metal vein deposits.
The conclusion that gold precipitation in bonanza-type low-sulfidation epithermal deposits is linked to fluid flashing also has implications for the depth at which economic ore zones can be expected to occur below the water table. In systems experiencing transient fluid flashing, the depth at which the first gentle boiling occurs does not represent the main control on the location of the ore zone (cf. [12,88]). The ore zone will occur at the depth at which fluid flashing has occurred causing gold supersaturation or, alternatively, at a shallower depth if colloidal precious metals are mechanically transported upward during the flashing event. This has significant implications for the design of drilling programs aimed at finding high-grade ore zones in low-sulfidation epithermal vein systems.

5. Conclusions

Textural comparison between silica sinters from the Wairakei geothermal power plant in New Zealand and bonanza vein samples from the Buckskin National deposit in Nevada revealed that the precipitation of noncrystalline silica in hydrothermal systems can occur over a range of temperatures and pressures. Precipitation in the low-temperature surface environment occurred in response to rapid cooling (<100 °C) of the hydrothermal liquid flashed to atmospheric pressure. Deposition of noncrystalline silica in hydrothermal veins took place as a result of rapid pressure changes causing near-instantaneous vaporization of a large amount of hydrothermal liquid at temperatures of 200–250 °C at several hundred meters below surface at subhydrostatic conditions (<15.5–40 bar). In both cases, rapid deposition inhibited quartz precipitation resulting in a high degree of silica supersaturation with respect to quartz in the hydrothermal fluids.
The observation that mineralized bands in bonanza veins from the Buckskin National deposit in Nevada were originally composed of a noncrystalline silica precursor has significant implications for the understanding of ore-forming processes in the epithermal environment and the design of exploration strategies for low-sulfidation epithermal veins. The results of this study suggest that supersaturation of silica and precious metals only occurred episodically, as other texturally distinct quartz layers in the crustiform veins lack ore minerals. Transient flashing of the hydrothermal liquids, which may be seismically induced, represents a key mechanism in the formation of bonanza grades in the hydrothermal veins. Ores may form at the depth of flashing or closer to the water table, as colloidal precious metals may have been mechanically transported upward during flashing.

Author Contributions

T.M. conducted the sampling at Wairakei. T.T. sampled the quartz vein samples at the Buckskin National deposit. The study was conceived jointly by T.T., T.M., and T.J.R. The microscopic work was conducted by T.T. under supervision of T.M. and T.J.R. The results of the study were jointly discussed by all authors. The manuscript was written by T.T. and T.M. T.J.R. edited an earlier version of the manuscript.

Acknowledgments

We thank Abbie Dean and Fabian Sepulveda of Contact Energy for the opportunity to sample the silica sinter at the Wairakei geothermal power plant and comments that helped us improving an earlier version of this manuscript. We acknowledge Contact Energy for granting permission to publish the research results. We are indebted to James Saunders for help provided during sample collection at the Buckskin National deposit. We thank Richard Wendlandt and Reinhard Kleeberg for performing the X-ray diffraction analyses. Susann Stolze is thanked for identifying the pollen present in the sinter from Wairakei. The manuscript benefited from discussions with James Saunders and Lauren Zeeck on the textural characteristics of epithermal quartz veins. Research on the samples from the Buckskin National deposit was financially supported by the Geological Society of Nevada Elko Chapter.

Conflicts of Interest

The authors declare no conflict of interest.

References

  1. Lindgren, W. Mineral Deposits, 4th ed.; McGraw-Hill: New York, NY, USA, 1933; p. 930. [Google Scholar]
  2. Buchanan, L.J. Precious metal deposits associated with volcanic environments in the southwest. Geol. Soc. Ariz. Dig. 1981, 14, 237–262. [Google Scholar]
  3. Bodnar, R.J.; Reynolds, T.J.; Kuehn, C.A. Fluid-inclusion systematics in epithermal systems. Rev. Econ. Geol. 1985, 2, 73–97. [Google Scholar]
  4. White, N.C.; Hedenquist, J.W. Epithermal gold deposits: Styles, characteristics and exploration. SEG Newsl. 1995, 23, 9–13. [Google Scholar]
  5. Cooke, D.R.; Simmons, S.F. Characteristics and genesis of epithermal gold deposits. Rev. Econ. Geol. 2000, 13, 221–244. [Google Scholar]
  6. Simmons, S.F.; White, N.C.; John, D.A. Geological characteristics of epithermal precious and base metal deposits. In Economic Geology; Hedenquist, J.W., Thompson, J.F.H., Goldfarb, R.J., Richards, J.P., Eds.; Society of Economic Geologists: Littleton, CO, USA, 2005; Volume 100, pp. 485–522. [Google Scholar]
  7. Hedenquist, J.W.; Arribas, A.; Gonzalez-Urien, E. Exploration for epithermal gold deposits. Rev. Econ. Geol. 2000, 13, 45–47. [Google Scholar]
  8. Rowland, J.V.; Simmons, S.F. Hydrologic, magmatic, and tectonic controls on hydrothermal flow, Taupo Volcanic Zone, New Zealand: Implications for the formation of epithermal vein deposits. Econ. Geol. 2012, 107, 427–457. [Google Scholar] [CrossRef]
  9. Brown, K.L. Gold deposition from geothermal discharges in New Zealand. Econ. Geol. 1986, 81, 979–983. [Google Scholar] [CrossRef]
  10. Clark, J.R.; Williams-Jones, A.E. Analogues of epithermal gold-silver deposition in geothermal well scales. Nature 1990, 346, 644–645. [Google Scholar] [CrossRef]
  11. Simmons, S.F.; Christenson, B.W. Origins of calcite in a boiling geothermal system. Am. J. Sci. 1994, 294, 361–400. [Google Scholar] [CrossRef]
  12. Simmons, S.F.; Browne, P.R.L. Hydrothermal minerals and precious metals in the Broadlands-Ohaaki geothermal system: Implications for understanding low-sulfidation epithermal environments. Econ. Geol. 2000, 95, 971–999. [Google Scholar] [CrossRef]
  13. Albinson, T.; Norman, D.I.; Cole, D.; Chomiak, B. Controls on formation of low sulfidation epithermal deposits in Mexico: Constraints from fluid inclusion and stable isotope data. SEG Spec. Publ. 2001, 8, 1–32. [Google Scholar]
  14. Moncada, D.; Mutchler, S.; Nieto, A.; Reynolds, T.J.; Rimstidt, J.D.; Bodnar, R.J. Mineral textures and fluid inclusion petrography of the epithermal Ag-Au deposits at Guanajuato, Mexico: Application to exploration. J. Geochem. Explor. 2012, 114, 20–35. [Google Scholar] [CrossRef]
  15. Bobis, R.E. A review of the description, classification and origin of quartz textures in low sulfidation epithermal veins. J. Geol. Soc. Philipp. 1994, 49, 15–39. [Google Scholar]
  16. Dong, G.; Morrison, G.; Jaireth, S. Quartz textures in epithermal veins, Queensland—Classification, origin, and implication. Econ. Geol. 1995, 90, 1841–1856. [Google Scholar] [CrossRef]
  17. Shimizu, T. Reinterpretation of quartz textures in terms of hydrothermal fluid evolution at the Koryu Au-Ag deposit, Japan. Econ. Geol. 2014, 109, 2051–2065. [Google Scholar] [CrossRef]
  18. Sander, M.V.; Black, J.E. Crystallization and recrystallization of growth-zoned vein quartz crystals from epithermal system—Implications for fluid inclusion studies. Econ. Geol. 1988, 83, 1052–1060. [Google Scholar] [CrossRef]
  19. Saunders, J.A. Colloidal transport of gold and silica in epithermal precious-metal systems: Evidence from the Sleeper deposit, Nevada. Geology 1990, 18, 757–760. [Google Scholar] [CrossRef]
  20. Saunders, J.A. Silica and gold textures in bonanza ores of the Sleeper deposit, Humboldt County, Nevada: Evidence for colloids and implications for epithermal ore-forming processes. Econ. Geol. 1994, 89, 628–638. [Google Scholar] [CrossRef]
  21. Ernst, E.G.; Calvert, S.E. An experimental study of the recrystallization of porcelanite and its bearing on the origin of some bedded cherts. Am. J. Sci. 1969, 267, 114–133. [Google Scholar]
  22. Mitzutani, S. Silica minerals in the early stage of diagenesis. Sedimentology 1970, 15, 419–436. [Google Scholar] [CrossRef]
  23. Bettermann, P.; Liebau, F. The transformation of amorphous silica to crystalline silica under hydrothermal conditions. Contrib. Mineral. Petrol. 1975, 53, 25–36. [Google Scholar] [CrossRef]
  24. Oehler, J.H. Hydrothermal crystallization of silica gel. Geol. Soc. Am. Bull. 1976, 87, 1143–1152. [Google Scholar] [CrossRef]
  25. Mortimer, N. Origin of the Torlesse Terrane and coeval rocks, North Island, New Zealand. Int. Geol. Rev. 1994, 36, 891–910. [Google Scholar] [CrossRef]
  26. Rogan, M. A geophysical study of the Taupo Volcanic Zone, New Zealand. J. Geophys. Res. 1982, 87, 4073–4088. [Google Scholar] [CrossRef]
  27. Rowland, J.V.; Sibson, R.H. Extensional fault kinematics within the Taupo Volcanic Zone, New Zealand: Soft-linked segmentation of a continental rift system. N. Z. J. Geol. Geophys. 2001, 44, 271–284. [Google Scholar] [CrossRef]
  28. Rae, A.J.; Rosenberg, M.D.; Bignall, G.; Kilgour, G.N.; Milicich, S.D. Geological Results of Production Well Drilling in the Western Steamfield, Ohaaki Geothermal System: 2005–2007. In Proceedings of the 29th New Zealand Geothermal Workshop, Auckland, New Zealand, 19–21 November 2007; University of Auckland: Auckland, New Zealand, 2007; p. 6. [Google Scholar]
  29. Bignall, G.; Milicich, S.; Ramirez, E.; Rosenberg, M.; Kilgour, G.; Rae, A. Geology of the Wairakei-Tauhara Geothermal System, New Zealand. In Proceedings of the World Geothermal Congress, Bali, Indonesia, 25–29 April 2010; International Geothermal Association: Bochum, Germany, 2010; p. 8. [Google Scholar]
  30. Darby, D.J.; Hodgkinson, K.M.; Blick, G.H. Geodetic measurement of deformation in the Taupo Volcanic Zone, New Zealand: The North Taupo network revisited. N. Z. J. Geol. Geophys. 2000, 43, 157–170. [Google Scholar] [CrossRef]
  31. Villamor, P.; Berryman, K. A late Quaternary extension rate in the Taupo Volcanic Zone, New Zealand, derived from fault slip data. N. Z. J. Geol. Geophys. 2001, 44, 243–269. [Google Scholar] [CrossRef] [Green Version]
  32. Acocella, V.; Spinks, K.; Cole, J.; Nicol, A. Oblique back arc rifting of Taupo Volcanic Zone, New Zealand. Tectonics 2003, 22, 1045. [Google Scholar] [CrossRef]
  33. Rowland, J.V.; Sibson, R.H. Structural controls on hydrothermal flow in a segmented rift system, Taupo Volcanic Zone, New Zealand. Geofluids 2004, 4, 259–283. [Google Scholar] [CrossRef]
  34. Rosenberg, M.D.; Bignall, G.; Rae, A.J. The geological framework of the Wairakei-Tauhara geothermal system, New Zealand. Geothermics 2009, 38, 72–84. [Google Scholar] [CrossRef]
  35. Houghton, B.F.; Wilson, C.J.N.; McWilliams, M.O.; Lanphere, M.A.; Weaver, S.D.; Briggs, R.M.; Pringle, M.S. Chronology and dynamics of a large silicic magmatic system: Central Taupo Volcanic Zone, New Zealand. Geology 1995, 23, 13–16. [Google Scholar] [CrossRef]
  36. Hunt, T.M.; Bromley, C.J.; Risk, G.F.; Sherburn, S.; Soengkono, S. Geophysical investigations of the Wairakei field. Geothermics 2009, 38, 85–97. [Google Scholar] [CrossRef]
  37. Browne, P.R.L.; Ellis, A.J. The Ohaki-Broadlands hydrothermal area, New Zealand: Mineralogy and related geochemistry. Am. J. Sci. 1970, 269, 97–131. [Google Scholar] [CrossRef]
  38. Steiner, A. The Wairakei geothermal area, North Island, New Zealand: Its subsurface, geology, and hydrothermal rock alteration. N. Z. Geol. Surv. Bull. 1977, 90, 134. [Google Scholar]
  39. Lindgren, W. Geology and mineral deposits of the National Mining district, Nevada. USGS Bull. 1915, 601, 58. [Google Scholar]
  40. Vikre, P.G. Precious metal vein systems in the National district, Humboldt County, Nevada. Econ. Geol. 1985, 80, 360–393. [Google Scholar] [CrossRef]
  41. Vikre, P.G. Paleohydrology of Buckskin Mountain, National district, Humboldt County, Nevada. Econ. Geol. 1987, 82, 934–950. [Google Scholar] [CrossRef]
  42. Vikre, P.G. Sinter-vein correlations at Buckskin Mountain, National district, Humboldt County, Nevada. Econ. Geol. 2007, 102, 193–224. [Google Scholar] [CrossRef]
  43. Roberts, R.J. Quicksilver deposit at Buckskin Peak National mining district, Humboldt County, Nevada. USGS Bull. 1940, 922, 115–133. [Google Scholar]
  44. Saunders, J.A.; Unger, D.L.; Kamenov, G.D.; Fayek, M.; Hames, W.E.; Utterback, W.C. Genesis of Middle Miocene Yellowstone hotspot-related bonanza epithermal Au-Ag deposits, Northern Great Basin, USA. Miner. Deposita 2008, 43, 715–734. [Google Scholar] [CrossRef]
  45. Saunders, J.A.; Beasley, L.; Vikre, P.; Unger, D. Colloidal and physical transport textures exhibited by electrum and naumannite in bonanza epithermal veins from Western USA, and their significance. In Great Basin Evolution and Metallogeny, Proceedings of Geological Society of Nevada 2010 Symposium, Reno-Sparks, NV, USA, 14–22 May 2010; Steininger, R., Pennell, B., Eds.; Geological Society of Nevada: Reno-Sparks, NV, USA, 2011; pp. 825–832. [Google Scholar]
  46. Saunders, J.A. Textural evidence of episodic introduction of metallic nanoparticles into bonanza epithermal ores. Minerals 2012, 2, 228–243. [Google Scholar] [CrossRef]
  47. Smith, D.K. Opal, cristobalite, and tridymite: Noncrystallinity versus crystallinity, nomenclature of the silica minerals and bibliography. Powder Diffr. 1998, 13, 2–19. [Google Scholar] [CrossRef]
  48. Jones, B.; Renaut, R.W. Water content of opal-A: Implications for the origin of laminae in geyserite and sinter. J. Sediment. Res. 2004, 74, 117–128. [Google Scholar] [CrossRef]
  49. Day, R.; Jones, B. Variations in water content in opal-A and opal-CT from Geyser discharge aprons. J. Sediment. Res. 2008, 78, 301–315. [Google Scholar] [CrossRef]
  50. Jones, B.; Renaut, R.W.; Rosen, M.R. Biogenicity of silica precipitation around geysers and hot-spring vents, North Island, New Zealand. J. Sediment. Res. 1997, 67, 88–104. [Google Scholar]
  51. Herdianita, N.R.; Browne, P.R.L.; Rodgers, K.A.; Campbell, K.A. Mineralogical and textural changes accompanying ageing of silica sinter. Miner. Deposita 2000, 35, 48–62. [Google Scholar] [CrossRef]
  52. Campbell, K.A.; Rodgers, K.A.; Brotheridge, J.M.A.; Browne, P.R.L. An unusual modern silica-carbonate sinter from Pavlova spring, Ngatamariki, New Zealand. Sedimentology 2002, 49, 835–854. [Google Scholar] [CrossRef]
  53. Guidry, S.A.; Chafetz, H.S. Anatomy of siliceous hot springs: Examples from Yellowstone National Park, Wyoming, USA. Sediment. Geol. 2003, 157, 71–106. [Google Scholar] [CrossRef]
  54. Lynne, B.Y.; Campbell, K.A. Morphologic and mineralogic transitions from opal-A to opal-CT in low-temperature siliceous sinter diagenesis, Taupo Volcanic Zone, New Zealand. J. Sediment. Res. 2004, 74, 561–579. [Google Scholar] [CrossRef]
  55. Rodgers, K.A.; Browne, P.R.L.; Buddle, T.F.; Cook, K.L.; Greatrex, R.A.; Hampton, W.A.; Herdianita, N.R.; Holland, G.R.; Lynne, B.Y.; Martin, R.; et al. Silica phases in sinters and residues from geothermal fields of New Zealand. Earth Sci. Rev. 2004, 66, 1–61. [Google Scholar] [CrossRef]
  56. Fernandez-Turiel, J.L.; Garcia-Valles, M.; Gimeno-Torrente, D.; Saavedra-Alonso, J.; Martinez-Manent, S. The hot spring and geyser sinters of El Tatio, northern Chile. Sediment. Geol. 2005, 180, 125–147. [Google Scholar] [CrossRef]
  57. Smith, B.Y.; Turner, S.J.; Rodgers, K.A. Opal-A and associated microbes from Wairakei, New Zealand: The first 300 days. Mineral. Mag. 2003, 67, 563–579. [Google Scholar] [CrossRef]
  58. Jones, B.; Renaut, R.W. Microstructural changes accompanying the opal-A to opal-CT transition: New evidence from the siliceous sinters of Geysir, Haukadalur, Iceland. Sedimentology 2007, 54, 921–948. [Google Scholar] [CrossRef]
  59. Campbell, K.A.; Sannazzaro, K.; Rodgers, K.A.; Herdianita, N.R.; Browne, P.R.L. Sedimentary facies and mineralogy of the late Pleistocene Umukuri silica sinter, Taupo Volcanic Zone, New Zealand. J. Sediment. Res. 2001, 71, 727–746. [Google Scholar] [CrossRef]
  60. Rodgers, K.A.; Cressey, G. The occurrence, detection and significance of moganite (SiO2) among some silica sinters. Mineral. Mag. 2001, 65, 157–167. [Google Scholar] [CrossRef]
  61. Rodgers, K.A.; Hampton, W.A. Laser Raman identification of silica phases comprising microtextural components of sinters. Mineral. Mag. 2003, 67, 1–13. [Google Scholar] [CrossRef]
  62. Lynne, B.Y.; Campbell, K.A.; Moore, J.N.; Browne, P.R.L. Diagenesis of 1900-year-old siliceous sinter (opal-A to quartz) at Opal Mound, Roosevelt Hot Springs, Utah, U.S.A. Sediment. Geol. 2005, 179, 249–278. [Google Scholar] [CrossRef]
  63. Lynne, B.Y.; Cambell, K.A.; James, B.J.; Browne, P.R.L.; Moore, J. Tracking crystallinity in siliceous hot-spring deposits. Am. J. Sci. 2007, 307, 612–641. [Google Scholar] [CrossRef]
  64. Lynne, B.Y.; Cambell, K.A.; Perry, R.S.; Browne, P.R.L.; Moore, J.N. Acceleration of sinter diagenesis in an active fumarole, Taupo Volcanic Zone, New Zealand. Geology 2006, 34, 749–752. [Google Scholar] [CrossRef]
  65. Liesegang, M.; Milke, R.; Berthold, C. Amorphous silica maturation in chemically weathered clastic sediments. Sediment. Geol. 2018, 365, 54–61. [Google Scholar] [CrossRef]
  66. Djokic, T.; Van, K.; Martin, J.; Campbell, K.A.; Walter, M.R.; Ward, C.R. Earliest signs of life on land preserved in ca. 3.5 Ga hot spring deposits. Nat. Commun. 2017, 8, 15263. [Google Scholar] [CrossRef] [PubMed] [Green Version]
  67. Trewin, N.H. Depositional environment and preservation of biota in the Lower Devonian hot-springs of Rhynie, Aberdeenshire, Scotland. Trans. R. Soc. Edinb. Earth. Sci. 1993, 84, 433–442. [Google Scholar] [CrossRef]
  68. White, N.C.; Wood, D.G.; Lee, M.C. Epithermal sinters of Paleozoic age in north Queensland, Australia. Geology 1989, 17, 718–722. [Google Scholar] [CrossRef]
  69. Walter, M.R.; Desmarais, D.; Farmer, J.D.; Hinman, N.W. Lithofacies and biofacies of mid-Paleozoic thermal spring deposits in the Drummond Basin, Queensland, Australia. Palaios 1996, 11, 497–518. [Google Scholar] [CrossRef] [PubMed]
  70. Guido, D.; de Barrio, R.; Schalamuk, I. La Marciana Jurassic sinter—Implications for exploration for epithermal precious-metal deposits in Deseado Massif, southern Patagonia, Argentina. Appl. Earth Sci. 2002, 111, 106–113. [Google Scholar] [CrossRef]
  71. Sillitoe, R.H. Epithermal paleosurfaces. Miner. Deposita 2015, 50, 767–793. [Google Scholar] [CrossRef]
  72. Fournier, R.O.; Thompson, J.M.; Cunningham, C.G.; Hutchinson, R.A. Conditions leading to a recent small hydrothermal explosion at Yellowstone National Park. Geol. Soc. Am. Bull. 1991, 103, 1114–1120. [Google Scholar] [CrossRef]
  73. Keith, T.E.C. 1992 A look at silica phases in evolving hydrothermal systems. In Water-Rock Interaction, Proceedings of the 7th International Symposium on Water-Rock Interaction, Park City, UT, USA, 13–18 July 1992; Kharaka, Y.K., Maest, A.S., Eds.; Balkema: Rotterdam, The Netherlands, 1992; pp. 1423–1426. [Google Scholar]
  74. Lovering, T.G. Jasperoid in the United States—Its Characteristics, Origin, and Economic Significance; USGS Prof. Prep; United States Government Publishing Office: Washington, DC, USA, 1972; Volume 710, p. 164.
  75. Camprubí, A.; Albinson, T. Epithermal deposits in México—Update of current knowledge, and an empirical reclassification. Geol. Soc. Am. Spec. Pap. 2007, 422, 377–415. [Google Scholar]
  76. Sherlock, R.L.; Lehrman, N.J. Occurrences of dendritic gold at the McLaughlin mine hot-spring gold deposit. Miner. Deposita 1995, 30, 323–327. [Google Scholar] [CrossRef]
  77. Drummond, S.E.; Ohmoto, H. Chemical evolution and mineral deposition in boiling hydrothermal systems. Econ. Geol. 1985, 80, 126–147. [Google Scholar] [CrossRef]
  78. Fournier, R.O. The behavior of silica in hydrothermal solutions. Rev. Econ. Geol. 1985, 2, 45–61. [Google Scholar]
  79. Saunders, J.A.; Schoenly, P.A. Boiling, colloid nucleation and aggregation, and the genesis of bonanza Au-Ag ores of the Sleeper deposit, Nevada. Miner. Deposita 1995, 30, 199–210. [Google Scholar] [CrossRef]
  80. Sherlock, R.L.; Tosdal, R.M.; Lehrman, N.J.; Graney, J.R.; Losh, S.; Jowett, E.C.; Kesler, S.E. Origin of the McLaughlin mine sheeted vein complex: Metal zoning, fluid inclusion, and isotopic evidence. Econ. Geol. 1995, 90, 2156–2181. [Google Scholar] [CrossRef]
  81. Buchanan, L.J. The Las Torres Mine, Guanajuato, Mexico: Ore Controls of a Fossil Geothermal System. Ph.D. Dissertation, Colorado School of Mines, Golden, CO, USA, 1979. [Google Scholar]
  82. Henley, R.W.; Hughes, G.O. Underground fumaroles; “Excess heat” effects in vein formation. Econ. Geol. 2000, 95, 453–466. [Google Scholar] [CrossRef]
  83. Muffler, L.J.P.; White, D.E.; Truesdell, A.H. Hydrothermal explosion craters in Yellowstone National Park. Geol. Soc. Am. Bull. 1971, 82, 723–740. [Google Scholar] [CrossRef]
  84. Hedenquist, J.W.; Henley, R.W. Hydrothermal eruptions in the Waiotapu geothermal system, New Zealand: Their origin, associated breccias, and relation to precious metal mineralization. Econ. Geol. 1985, 80, 1640–1668. [Google Scholar] [CrossRef]
  85. Browne, P.R.L.; Lawless, J.V. Characteristics of hydrothermal eruptions, with examples from New Zealand and elsewhere. Earth Sci. Rev. 2001, 52, 299–331. [Google Scholar] [CrossRef]
  86. Monecke, T.; Petersen, S.; Hannington, M.D.; Anzidei, M.; Esposito, A.; Giordano, G.; Garbe-Schönberg, D.; Augustin, N.; Melchert, B.; Hocking, M. Explosion craters associated with shallow submarine gas venting off Panarea island, Italy. Bull. Volcanol. 2012, 74, 1937–1944. [Google Scholar] [CrossRef]
  87. Sanchez-Alfaro, P.; Reich, M.; Driesner, T.; Cembrano, J.; Arancibia, G.; Pérez-Flores, P.; Heinrich, C.A.; Rowland, J.; Tardani, D.; Lange, D.; et al. The optimal windows for seismically-enhanced gold precipitation in the epithermal environment. Ore Geol. Rev. 2016, 79, 463–473. [Google Scholar] [CrossRef] [Green Version]
  88. Cline, J.S.; Bodnar, R.J.; Rimstidt, J.D. Numerical simulation of fluid flow and silica transport and deposition in boiling hydrothermal solutions: Application to epithermal gold deposits. J. Geophys. Res. 1992, 97, 9085–9103. [Google Scholar] [CrossRef]
Figure 1. Wairakei geothermal field in New Zealand. (a) Map of North Island, New Zealand. The locations of the Taupo Volcanic Zone and the Wairakei geothermal field are highlighted. (b) Map of electrical resistivity (in Ωm) in the Wairakei geothermal field (modified from Hunt [36]). (c) Geological interpretation of structural elements at the Wairakei geothermal field based on well stratigraphy and seismic reflection data (modified from Rosenberg et al. [34]). The location of the section is given in B. No vertical exaggeration. Ta = Tahorakuri Formation; Wk = Wairakei Ignimbrite; Wa = Waiora Formation; HFF = Huka Falls Formation; S = Surficial deposits; mRL = meters above sea level.
Minerals 08 00331 g001
Figure 2. Photographs of silica sinters formed at the Wairakei power plant, New Zealand. (a) High-temperature (~99 °C) outlet at flash plant 14. The geothermal liquid is flashed to atmosphere and ponds in a steel-lined concrete pool. (b) Drainage channel that is partially filled with silica sinter formed from the cooling geothermal liquid. (c) Hand specimen of silica sinter showing alternating laminae of highly porous and friable white silica with palisade textures (Pa) and nonporous, smooth silica laminae that are gray, vitreous, and translucent (Vi).
Minerals 08 00331 g002
Figure 3. Transmitted light photomicrographs of silica sinter textures from the Wairakei geothermal power plant, New Zealand. (a) Palisade texture comprised of arrays of parallel silicified filamentous microbes. (b) Spider’s web-like texture comprised of arrays of parallel silicified filamentous microbes. (c) Low-magnification image showing areas of compacted and noncompacted global aggregates composed of opal-A. (d) High-magnification image of compacted microspheres and globular aggregates. The outlines of the microspheres are highlighted in some cases by void space that appears dark.
Minerals 08 00331 g003
Figure 4. Scanning electron images of silica sinter from the Wairakei geothermal power plant, New Zealand. (a) Complex arrays of silicified filamentous microbes consisting of subparallel filaments. The silicified filamentous microbes are overgrown by globular aggregates consisting of a large number of individual silica spheres. (b) Spider’s web-like structure consisting of silicified filamentous microbes. (c) Cluster of silica microspheres. Individual spheres are connected by pads consisting of small silica microspheres. (d) Fused silica microspheres. Note the shape of the voids between the fused silica microspheres.
Minerals 08 00331 g004
Figure 5. Geological map of the National district, Nevada (modified from Vikre [40]). The location of the Buckskin National deposit is highlighted.
Minerals 08 00331 g005
Figure 6. Photographs of crustiform quartz veins from the Buckskin National deposit in Nevada. The samples are characterized by the presence of colloform quartz layers that have spherical, botryoidal, reniform, or mammillary surfaces. Note that ore minerals only occur in some of the colloform bands while layers showing other quartz types are barren. Gq = dark gray quartz that hosts abundant ore minerals; Pq = pink quartz containing abundant adularia that is largely replaced by muscovite; Qcf = colloform quartz; Qcf−m = colloform-mosaic quartz; Qfb−m = quartz showing fibrous or mosaic microtextures.
Minerals 08 00331 g006
Figure 7. Transmitted-light photomicrographs of colloform banding in bonanza-type quartz veins from the Buckskin National deposit, Nevada. (a) Low-magnification image showing a colloform quartz layer. (b) Low-magnification image of a colloform quartz layer consisting globular aggregates. Picture was taken on an ultra-thin section. (c) Same low-magnification image in crossed-polarized light. The quartz shows a mosaic texture. (d) High-magnification image of globular aggregates consisting of fused microspheres. The large number of micropores located between the microspheres gives the quartz a dark appearance.
Minerals 08 00331 g007

