Numerical Modeling of REE Fractionation Patterns in Fluorapatite from the Olympic Dam Deposit (South Australia)


1
School of Physical Sciences, The University of Adelaide, Adelaide, SA 5005, Australia
2
School of Chemical Engineering, The University of Adelaide, Adelaide, SA 5005, Australia
3
BHP Olympic Dam, Adelaide, SA 5000, Australia
*
Author to whom correspondence should be addressed.
†
Present address: Boart Longyear Asia-Pacific, 6 Butler Boulevard, Adelaide Airport, SA 5950, Australia.
Minerals 2018, 8(8), 342; https://doi.org/10.3390/min8080342
Submission received: 11 July 2018
/
Revised: 6 August 2018
/
Accepted: 6 August 2018
/
Published: 8 August 2018
(This article belongs to the Special Issue Experimental and Thermodynamical Modeling of Ore-Forming Processes in Magmatic and Hydrothermal Systems)
Abstract
:Trace element signatures in apatite are used to study hydrothermal processes due to the ability of this mineral to chemically record and preserve the impact of individual hydrothermal events. Interpretation of rare earth element (REE)-signatures in hydrothermal apatite can be complex due to not only evolving fO2, fS2 and fluid composition, but also to variety of different REE-complexes (Cl-, F-, P-, SO4, CO3, oxide, OH− etc.) in hydrothermal fluid, and the significant differences in solubility and stability that these complexes exhibit. This contribution applies numerical modeling to evolving REE-signatures in apatite within the Olympic Dam iron-oxide-copper-gold deposit, South Australia with the aim of constraining fluid evolution. The REE-signatures of three unique types of apatite from hydrothermal assemblages that crystallized under partially constrained conditions have been numerically modeled, and the partitioning coefficients between apatite and fluid calculated in each case. Results of these calculations replicate the measured data well and show a transition from early light rare earth element (LREE)- to later middle rare earth element (MREE)-enriched apatite, which can be achieved by an evolution in the proportions of different REE-complexes. Modeling also efficiently explains the switch from REE-signatures with negative to positive Eu-anomalies. REE transport in hydrothermal fluids at Olympic Dam is attributed to REE–chloride complexes, thus explaining both the LREE-enriched character of the deposit and the relatively LREE-depleted nature of later generations of apatite. REE deposition may, however, have been induced by a weakening of REE–Cl activity and subsequent REE complexation with fluoride species. The conspicuous positive Eu-anomalies displayed by later apatite with are attributed to crystallization from high pH fluids characterized by the presence of Eu3+ species.
1. Introduction
The concentrations of trace elements (<<1 wt %) and their variation within hydrothermal minerals can provide valuable information on fluid parameters and conditions of ore deposition for assemblages that are well constrained with respect to paragenetic position. Studies have demonstrated the interdependency between hydrothermal conditions and the compositions of specific minerals (e.g., [1,2,3]). Many such studies have focused on the rare earth elements (REE), which display a coherent behavior to one another due to similar electronic configurations, common trivalent oxidation state, and systematic decrease in atomic radius with increased atomic number. This typically leads to smooth fractionation across the group (e.g., [4]). However, since Eu and Ce may also occur as Eu2+ and Ce4+ ions, redox-sensitive anomalies may result.
The behavior of the REE in hydrothermal fluids is affected by parameters such as pH, temperature, salinity, redox conditions and fluid composition (e.g., [4,5,6,7]), thus allowing REE to be used as geochemical tracers in hydrothermal systems. Emphasis has been placed on determining the thermodynamic properties of various REE complexes in hydrothermal fluids at temperatures typical of ore deposit formation [6,7], which can support numerical modeling of REE behavior.
Modeling of REE patterns for zoned calcic garnet [1] and scheelite [2,8] have shown the sensitivity of these minerals to changes in fluid parameters. In both cases, modeling addressed compositionally-zoned minerals, in which core-to-rim compositional variation was modeled in terms of partitioning between mineral and fluid, involving evolving fluid parameters, successfully reproducing the patterns measured. The work of Brugger et al. [2], which focused on high-grade orogenic gold ores, emphasized the sensitivity of REE patterns in scheelite to pH variation, and suggested that apatite should behave similarly and display analogous signatures enriched in middle rare earths (MREE).
Chondrite-normalized REE fractionation patterns of apatite-group minerals are recognized as valuable tools for understanding hydrothermal processes [9]. Despite being widespread in a wide range of magmatic to metamorphic rocks [10,11,12,13,14], apatite chemistry has not previously been modeled in the same way as scheelite or calc-silicate minerals. Chondrite-normalized REE fractionation trends for apatite are widely reported from a variety of rocks but granite related apatite is conspicuous by consistent, downward-sloping trends featuring relative enrichment in light rare earths (LREE) [12,13,14]. Variation in the size and sign of Eu anomalies across rock suites from across metallogenic provinces have been used to infer variability or change in redox conditions (e.g., [12]).
Apatite is an abundant component of Iron-Oxide-Copper-Gold (IOCG) systems, including those within the Olympic Cu-Au Province, South Australia [15,16,17,18]. In deposits and prospects from the Olympic Dam District, apatite is particularly abundant within early apatite-magnetite assemblages [19]. Recent study of apatite from Olympic Dam [15,16,17], by far the largest deposit in the Olympic Cu-Au Province [20], has demonstrated a systematic compositional variation that can be correlated with changes in the host intrusive or hydrothermal assemblage. Distinct geochemical signatures in terms of F, Cl, S, As, and REE are characteristic of apatite from certain hydrothermal assemblages. They vary from LREE-enriched types within early, high-temperature magnetite–chlorite ± pyrite ± chalcopyrite assemblages preserved on the margins of the deposit to MREE-enriched signatures towards the margins of the orebody in which hematite (+sericite) is the dominant alteration. Finally, apatite within late-stage massive bornite mineralization shows the greatest MREE-enrichment and a marked positive Eu-anomaly [17]. MREE-enrichment in association with hematite-sericite alteration has also been documented from the Wirrda Well and Acropolis IOCG prospects SSE and SSW of Olympic Dam, suggesting that such a feature may be a generic feature linked to ore genesis [16,17].
The transition from early high-temperature magnetite-dominant to later hematite-dominant assemblages in the Olympic Dam District coincided with significant changes in the mineralizing fluids as determined by fluid inclusion studies [21,22]. Given the well documented association between apatite with a specific chemistry and hydrothermal assemblages formed under known fluid conditions, numerical modeling of apatite/fluid partitioning can offer valuable insights into the behavior of REE during formation of the deposit. In this study, REE behavior and partitioning coefficients between apatite and fluid are modeled numerically employing empirical mineral compositional data and newly published thermodynamic values for REE complexes [7], along with assumptions for other fluid parameters grounded in the stabilities of the host assemblage. Using three examples, each with unique apatite REE-signatures, it can be demonstrated that the transition from LREE- to MREE-enriched and finally MREE-enriched signatures with positive Eu-anomalies, is a direct result of changes in the character of the hydrothermal fluids.
2. Description of the Deposit, Apatite-Group Minerals and Rare Earth Element Behavior
2.1. The Olympic Dam Deposit
Olympic Dam is by far the largest single IOCG deposit within the Olympic Cu-Au Province (10,400 million tonnes at 0.77% Cu, 0.25 kg/t U3O8, 0.32 g/t Au and 1 g/t Ag; [23]). The deposit is hosted within the Olympic Dam Breccia Complex (ODBC), comprising dominant granite breccias and subordinate intrusive rocks and other lithologies [20,24]. The ODBC is in turn hosted within the Roxby Downs Granite (RDG), a pink, hydrothermally altered, two-feldspar granite belonging to the ~1.59 Ga Hiltaba Intrusive Suite [25,26]. Geochronological U-Pb data for magmatic and hydrothermal zircon [27] and for hydrothermal hematite in the deposit [28,29] indicate that mineralization and associated alteration is associated with RDG.
2.2. Apatite Mineralogy, Geochemistry and Crystal Structure
The apatite supergroup [30] constitutes a large group of named minerals made possible by the extraordinary flexibility of the apatite structure (e.g., [31]), which allows for incorporation of approximately half the elements in the periodic table [32]. The general formula of apatite supergroup minerals is defined as A5(XO4)3Z, where the A position is most commonly occupied by Ca2+ but can be substituted by a variety of other di-, tri- and tetravalent cations such as Na+, Sr2+, Pb2+, Ba2+, Mn2+, Fe2+, Mg2+, Ni2+, Co2+, Cu2+, Zn2+, Sn2+, Cd2+, Eu2+, REE3+, Y3+, Zr4+, Ti4+, Th4+, U4+, and S4+, as well as U6+. The X position is dominantly occupied by P, as PO43- but can also accommodate SO42−, AsO43−, VO43−, SiO44−, CO32−, CrO42−, CrO43−, GeO44−, SeO44− and WO43−. Lastly, the Z position hosts F, Cl and OH− defining the three end-members fluorapatite, chlorapatite and hydroxyapatite [33].
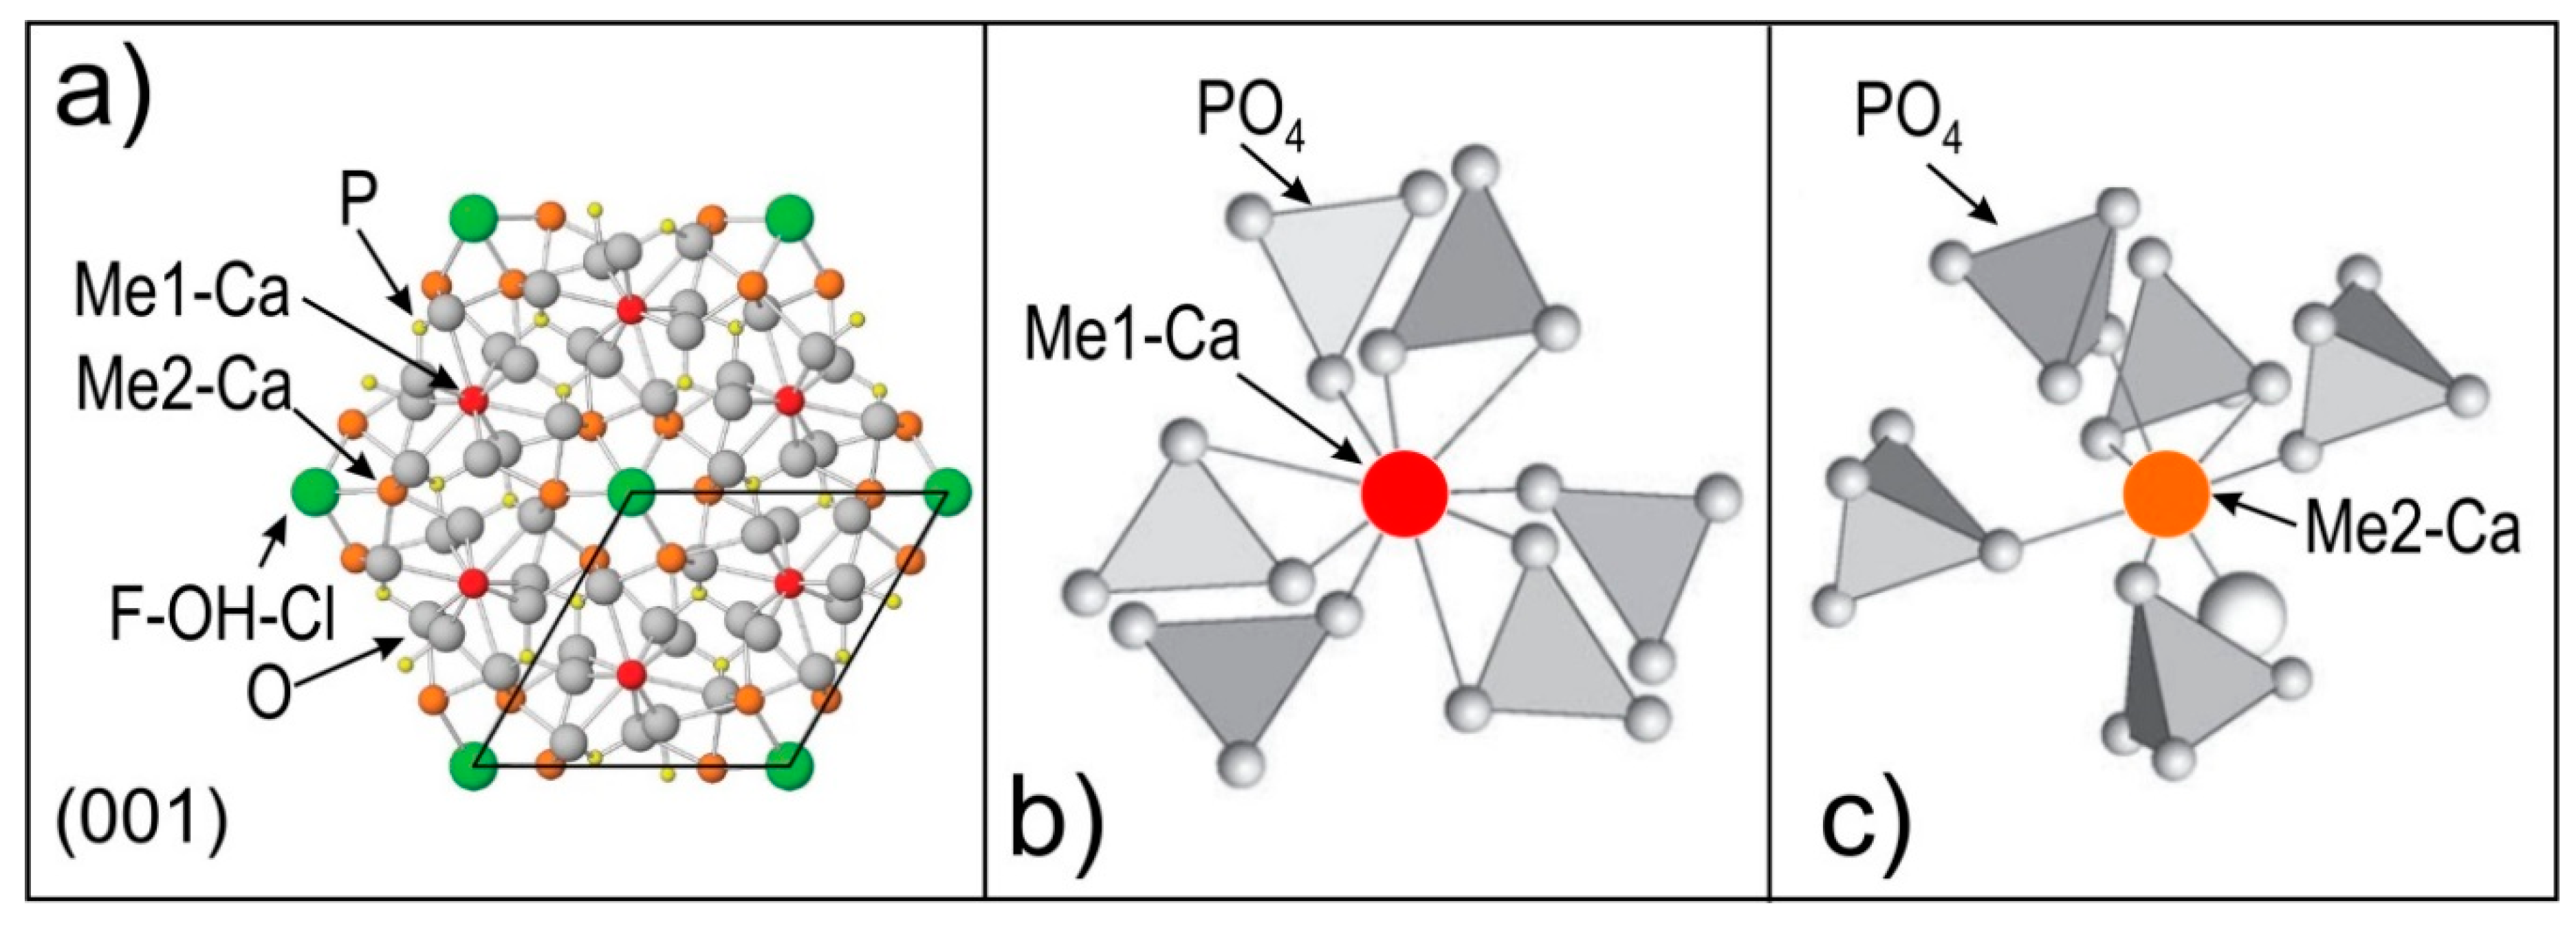
Three cation polyhedra make up the apatite structure (Figure 1), a single, rigid PO4 tetrahedron and two Ca polyhedra, Ca1 and Ca2 [33]. Of these, the Ca2 position dominantly hosts LREE and the Ca1 position the heavy-REE (HREE), with Nd expressing no preference for either position [32]. The size of these positions exerts the dominant control on trace element substitution through the proximity principle [34], meaning that elements with atomic radii closest to that of the substituting position are most readily substituted. In instances where an elements valance state is different to that of the position it is substituting, such as in the case of REE3+ substituting for Ca2+, overall charge balance is maintained through a variety of different coupled charge-compensated substitutions [35,36].
In the magmatic environment, once the effects of the proximity principle, whole rock composition and the co-partitioning of REE between apatite and other minerals are taken into account, apatite REE-signatures are largely predictable. In contrast, REE-trends in hydrothermal apatite could be more varied since the fluids capable of crystallizing apatite can carry variable concentrations of REE as a range of soluble complexes (e.g., [7]). These factors, combined with temperature, pH, fO2 and others, dictate the dominance or absence of an individual REE at the conditions of apatite crystallization, in turn resulting in a range of REE-signatures among hydrothermal apatites.
For example, redox-sensitive Eu, can be present as Eu3+ and Eu2+ giving it the ability to partition away from the other trivalent REE. This behavior has been used to infer variability or change in redox conditions (e.g., [12]), as well as changes in fluid parameters due to the sensitivity of Eu3+/Eu2+ complexing to pH [2]. No evidence is seen in the deposit for the presence Ce4+ (e.g., as cerianite), which might also influence partitioning trends. Similarly, the common tendency for the LREE to speciate as stable and soluble LREE-chloride complexes to a greater extent than for HREE can lead to spatial fractionation between the LREE and HREE [7].
2.3. REE Trends in Fluorapatite from the Olympic Dam Deposit
Mineralogical zoning is expressed across the Olympic Dam deposit by variation in the dominant Fe-oxide and Cu-(Fe)-sulfide species [20] whereby assemblages of magnetite ± pyrite ± chalcopyrite grade laterally from the peripheries of the deposit and upwards from depth to hematite-dominant chalcopyrite+bornite assemblages, and finally to chalcocite-dominant assemblages at shallow levels. Similarly, the dominant silicate alteration minerals vary from chlorite-dominant in association with magnetite assemblages (in which magmatic feldspars are also often preserved) to sericite-dominant in association with hematite [20].
Krneta et al. [15,17] defined the morphological and chemical characteristics of apatite across the Olympic Dam deposit and showed that apatite associated with a specific intrusive rock or hydrothermal assemblage displays chemical characteristics unique to that particular assemblage. Moreover, apatite was found to record subsequent hydrothermal overprinting events expressed within zoned grains. The three apatite REE trends previously described in the literature [17] and described below, are illustrative of changes from environments representing the magmatic-hydrothermal transition (altered granite from the deposit outer shell) to high-grade Cu-mineralization.
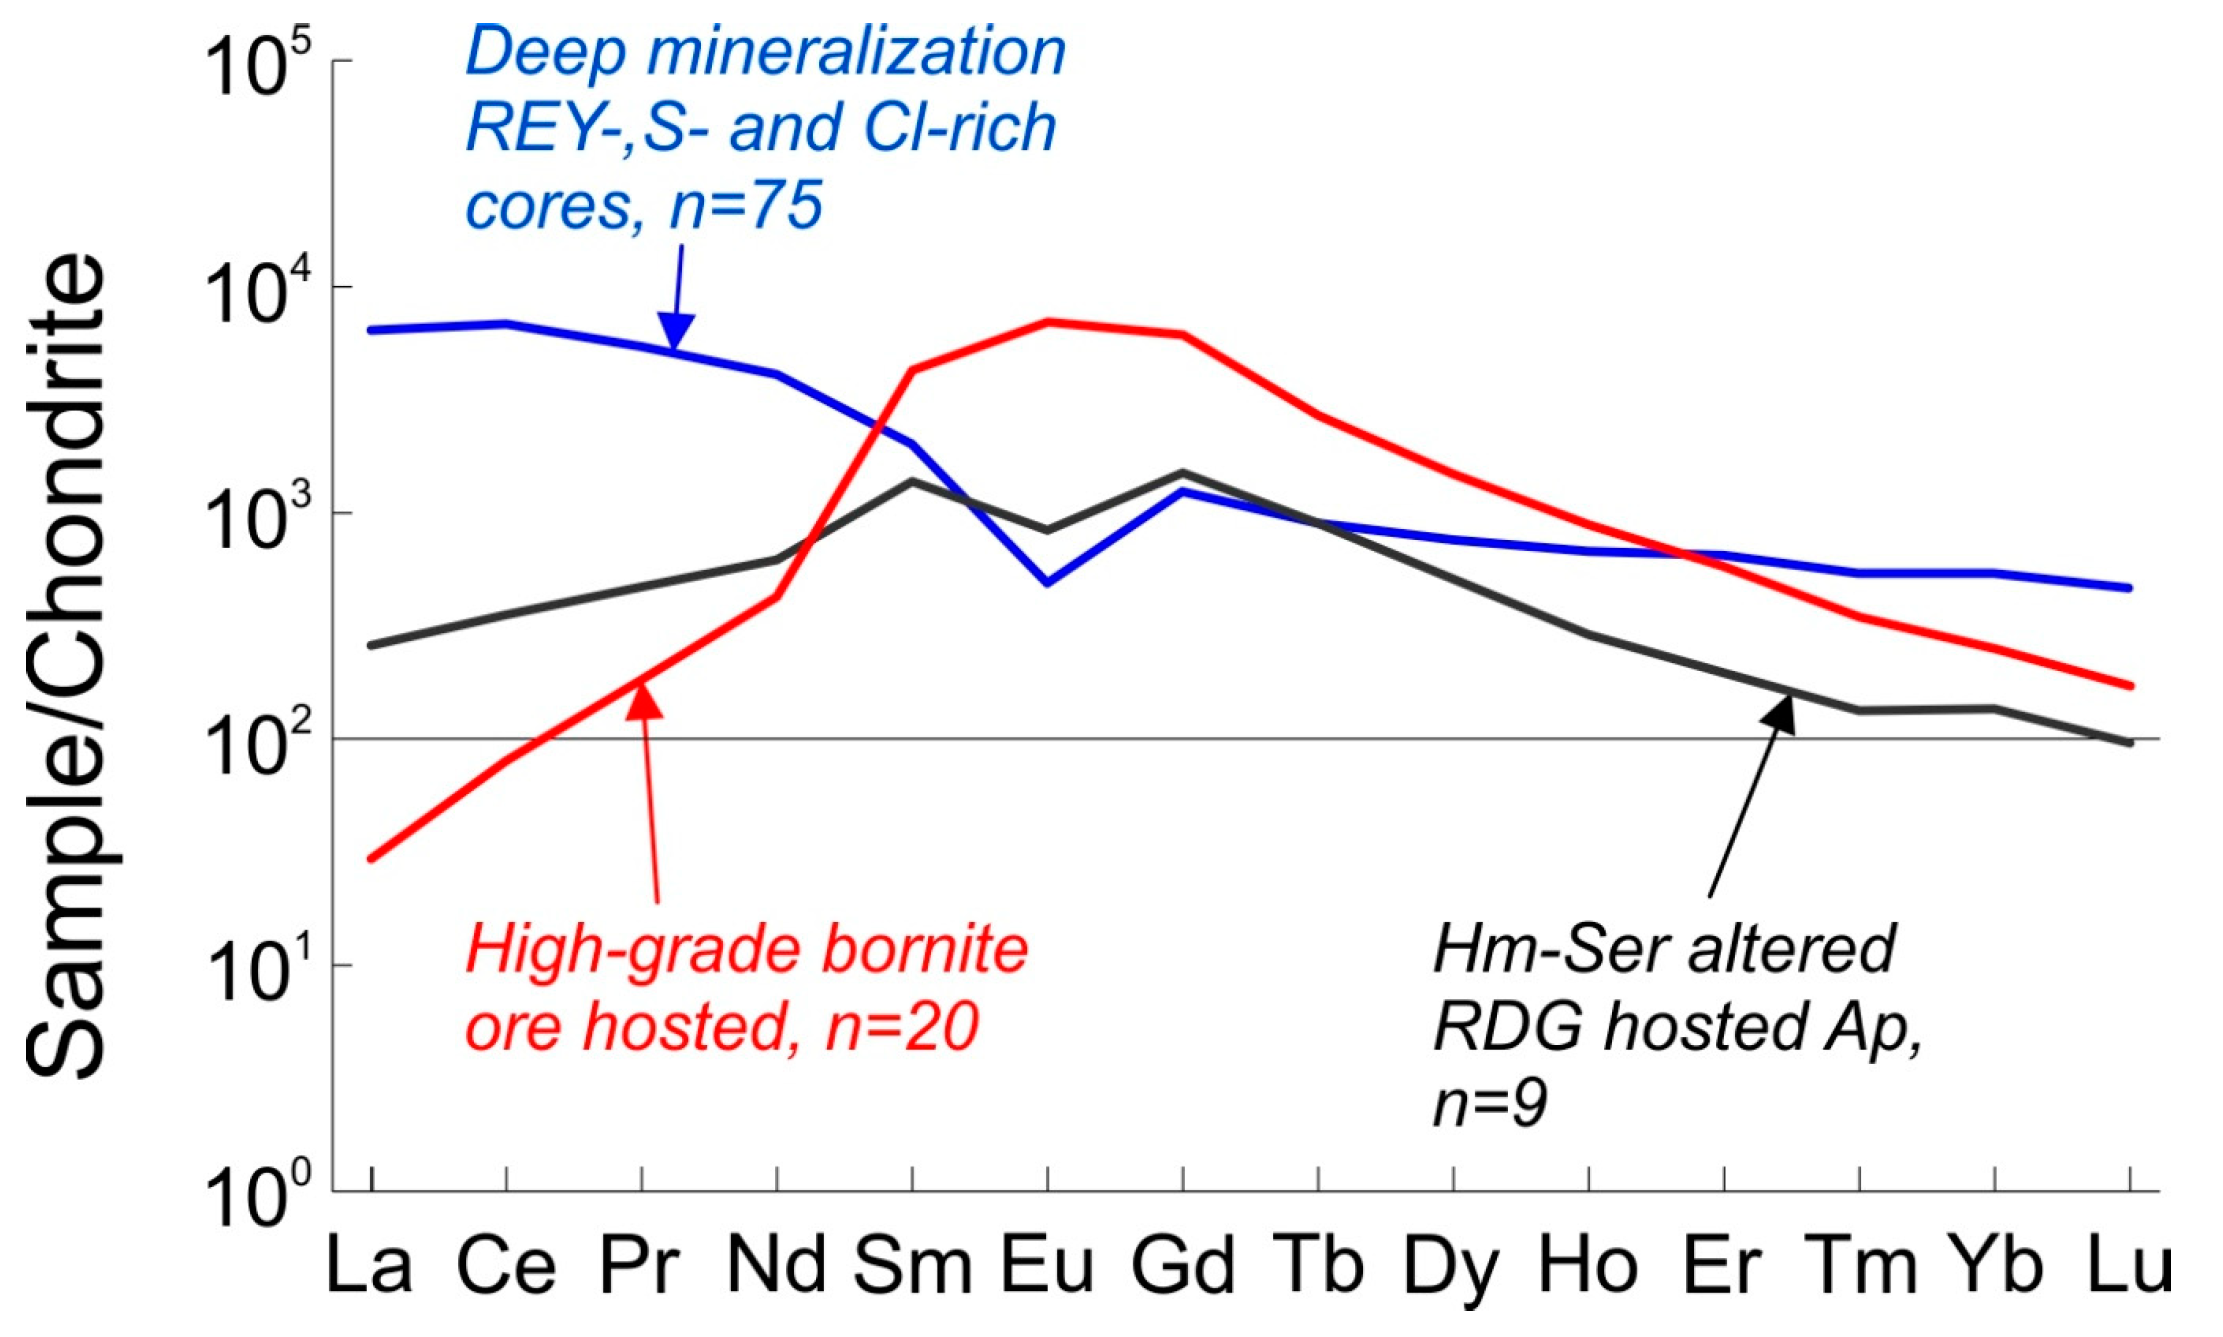
Hydrothermal apatite, abundant within the magnetite-bearing assemblages such as the ‘deep mineralization’ [15] representing one of the deepest mineralized intervals (2.3–2.33 km) intersected by drillholes just outside the orebody (~1 km E) is illustrative of the earliest hydrothermal stage. Here, apatite increases markedly in abundance and grain size across the contact between RDG and a porphyritic felsic unit, both intensively altered. Apatite occurs as individual grains up to several mm in width, or as cm-scale aggregates consisting of multiple ~500 µm grains commonly interstitial to magnetite. Compositionally, such apatite is LREE-enriched with moderate negative Eu-anomalies (Figure 2, Table 1).
A second trend is recorded within apatite from granite displaying locally abundant sericite + hematite alteration (hematite-sericite altered RDG). Although hematite-sericite alteration is developed throughout the orebody [39], this also partially overprints the weakly-mineralized (magnetite + chalcopyrite + pyrite) granite breccias forming an outer shell around the orebody at Olympic Dam. Early generations of hydrothermal apatite from such locations immediately adjacent to the orebody, are altered along fractures and grain rims and depleted in LREE, S and Cl. This apatite is MREE-enriched with a weak negative Eu-anomaly (Figure 2, Table 1; [15,17]).
The third trend, with characteristic highest MREE-enrichment, is representative of apatite associated with massive, high-grade bornite mineralization from the orebody at Olympic Dam. Unlike the hematite-sericite associated mineralization in altered RDG, such apatite displays a positive Eu-anomaly (high-grade bornite ore hosted apatite, Figure 2, Table 1; [17]. Such a signature is very unusual for IOCG apatite in the Olympic Province (e.g., [15,16,17,18]), however it has also been observed from the Acropolis deposit [16], where it is shown to be the result of crystallization from late-stage neutral to alkaline fluids based on mineral stabilities and Eu-speciation.
2.4. Fluid Evolution within IOCG Systems, REE Speciation and the Controls on Apatite/Fluid Partitioning
Study of fluid inclusions within IOCG mineralization in the Olympic Cu-Au Province [21,22,40,41], as well as from IOCG deposits globally [42,43,44] has provided insights into the formation of these deposits by defining the temperatures and salinities of fluids. In the case of Olympic Dam, early magnetite-dominant mineralization was found to have formed at temperatures exceeding 400 °C from fluids with salinities between 20 and 45 wt % NaCl equiv. [21]. Similar magnetite-dominant assemblages throughout the Olympic Cu-Au Province formed from analogous fluids [22]. Hematite-dominant mineralization at Olympic Dam may, however, have crystallized from cooler (150–300 °C), low-salinity (1–8 wt % NaCl) fluids [21]. Several authors have speculated that this transition was largely responsible for deposition of Cu-Au within many of the IOCG systems given that the early magnetite-stage ore fluids were copper-rich (>500 ppm Cu based on PIXE analysis; [22]) but lacked a suitable depositional mechanism. Similarly, Haynes et al. [45] modeled this transition and found that changes in fluid salinity, temperature and other parameters, notably pH, were sufficient to bring about deposition of Cu-Au-U-Ag mineralization.
None of these authors considered, however, the behavior of the REE during this transition despite the presence of REE within the deposit at concentrations well above crustal values, particularly in the case of La and Ce. The work of Migdisov et al. [7] provides the most comprehensive account of REE behavior in hydrothermal fluids along with thermodynamic properties for a suite of REE complexes derived from experiments conducted at elevated temperatures. The new thermodynamic data are inconsistent with the ambient temperature extrapolated values of Haas et al. [4] and can constrain the roles of the various REE complexes within hydrothermal systems formed at higher temperatures and neutral to acidic conditions. Migdisov et al. [7] emphasize that the low solubility of REE–F, –P, –oxide, –OH− and –CO3 complexes makes them unlikely to be involved in REE transport. Conversely, the high solubility and stability of REE–Cl and –SO4 complexes, along with their likely high concentration in hydrothermal fluids (e.g., highly saline hydrothermal fluids), suggests that they play a dominant role in REE transport. Significant variability is, however, observed among the REE with regards to complexing behavior. LREE are much more stable as Cl-complexes than HREE, suggesting that they should also be more readily transported and concentrated upon precipitation. Modeling can suggest and illustrate that such a hypothesis is very likely correct [7] and is supported indirectly by the predominance of LREE-enriched hydrothermal systems as opposed to those enriched in HREE (e.g., [46,47], even though the unique geological settings of specific hydrothermal systems may facilitate further complexities.
3. Methodology
Numerical Modeling of Apatite/Fluid Partitioning Coefficients
Brugger et al. [2,8], Smith et al. [1] and Migdisov et al. [7] have outlined the methodology for calculation of fluid partitioning coefficients in minerals where Ca is a major component. Substitution mechanisms must be defined as a preliminary requisite step. These can either be direct, e.g., Eu2+ for Ca2+ substitution, or via charge-compensated coupled substitutions involving elements such as Na or Si in the case of REE3+, as reported and discussed by Krneta et al. [17]. For calculation of partitioning coefficients between apatite (Ap) and fluid (aq), the two substitution mechanisms proposed are:
Although REE incorporation into the apatite types used here (Figure 1, Table 1) appears to be primarily accommodated by Si4+- for -P5+ substitution based on EPMA analysis [15], the simplifying assumption that the dominant substitution involves charge compensation by Na+ has been made to eliminate the complications involved in considering multiple elements in this role. This is considered in line with analogous approaches (e.g., [1]).
Using Equations (1) and (2) the equilibrium constants (K) expressed in Equations (3) and (4), respectively, can be defined, where ‘ai’ is the activity of element ‘i’ in the fluid, or in apatite:
The apatite/fluid partitioning coefficient (Di) is related to the equilibrium constant Ki by Equations (5) and (6), where ‘Yi’ denotes the activity coefficient of element ‘i’ and the square brackets in (6) define the concentration of the elements in the fluid in molal terms, and as mole fraction in the apatite:
Assuming that the solid solution is dilute and ideal, the activity coefficients for Ca and each individual REE can be assumed to be at unity. Moreover, if the fluid is considered dilute and ideal, then Ca and each of the other REE are equally at unity allowing (6) to be reduced to (7):
Using values obtained for individual REE from Equations (5) and (7) together with Equation (8) modified from Smith et al. [1], the crystallization of apatite can be modeled in an open system involving a constantly replenished fluid accounting for the common lack of intra-grain zoning observed in the apatite types used as the basis for the preceding models. This methodology also largely follows Brugger et al. [8]:
Activities of REE and other relevant components were calculated using Geochemist’s Workbench® 11 [48] after updating the database for REE–Cl and –F aqueous species according to thermodynamic values given by Migdisov et al. [49]. In the case of LREE, the activity is most commonly represented by a single chloride complex whereas the activity of MREEs and HREEs are distributed among multiple species (chloride, fluoride, hydroxide and oxide). As such these were combined and a total value, was used in the calculations. Although this method may be a simplification of the natural hydrothermal system, it is nevertheless in line with the approach followed elsewhere. Previous studies (e.g., [1]) have resolved the complication of an individual REE being present as multiple complexes by not defining the various species and treating the activity of an individual REE as a single parameter. In other published work, notably Brugger et al. [2], the scenario investigated involved the speciation of Eu under two sets of conditions, each of which contained Eu exclusively as a single species.
4. Results
4.1. Study Cases and Determination of Fluid Conditions
The three apatite sub-types with REE trends, as shown in Figure 2, and corresponding to measured REE mean compositions tabulated in Table 1 (see also [17]), are considered as study cases illustrative of fluid evolution from the magmatic-hydrothermal transition to high-grade mineralization stages. To perform the numerical modeling for the apatite/fluid REE partitioning, a set of fluid conditions for each case must be defined along with the concentrations of key components, such as the REE, complexing ligands, Ca and Na (Table 2).
Given that no empirical measurements of fluid REE, Ca or complexing ligand concentrations currently exist, these need to be assumed. Following Smith et al. [1], the various element concentrations are assumed to be equal to the whole rock concentrations of the interpreted fluid source (this is unaltered RDG in the case of the deep mineralization), or the whole rock concentrations in the rock host in the case of the hematite-sericite associated and the high-grade bornite ore hosted apatite. Whole rock values given by Ehrig et al. [20] for unaltered RDG, sericite-altered RDG and mineralized RDG (10–20 wt % Fe, Cu ≥ 3000 ppm) were used for the three cases as outlined in Table 2. In the absence of fluid inclusion data specific to the present assemblages (granite or high-grade bornite ore), salinity conditions showing a decrease from 20 to 10 and 5 NaCl wt % equiv. are chosen for cases 1 to 3. This is concordant with previous fluid inclusions studies of IOCG deposits in the Olympic Dam deposit/district showing such a trend from early to late hydrothermal evolution. For purposes of simplicity, a temperature (T) of 300 °C is considered in all cases. This is considered feasible considering the ranges of T obtained for assemblages-bearing both magnetite or hematite.
Estimation of wt % Ca, HCO3−, F and SO4− were made considering the whole rock data as well as the mineralogy of each assemblage. In each case, two subsets of conditions were considered by varying each of these parameters, except for F, which was kept constant, as shown in Table 2. Variation in Ca from ≤1 to 3–4 wt % was introduced for each case to test the effect this has on the obtained trends. A substantial increase in SO4− was considered for case 3 relative to the other two cases to reach precipitation of a sulfide-rich mineral assemblage. The presence of fractures in apatite containing micron-scale broken fragments of sulfide minerals [17] infers fluids with a high volatile component, which were approximated by increasing HCO3− in case 3. Numerical estimates for these parameters were varied to obtained a best fit between the calculated and measured REE trends. Variation in the activity of REE complexes is shown in Table 3 for the six sets of conditions.
4.2. Apatite/Fluid REE Partitioning and the Effects of Evolving Fluid Conditions
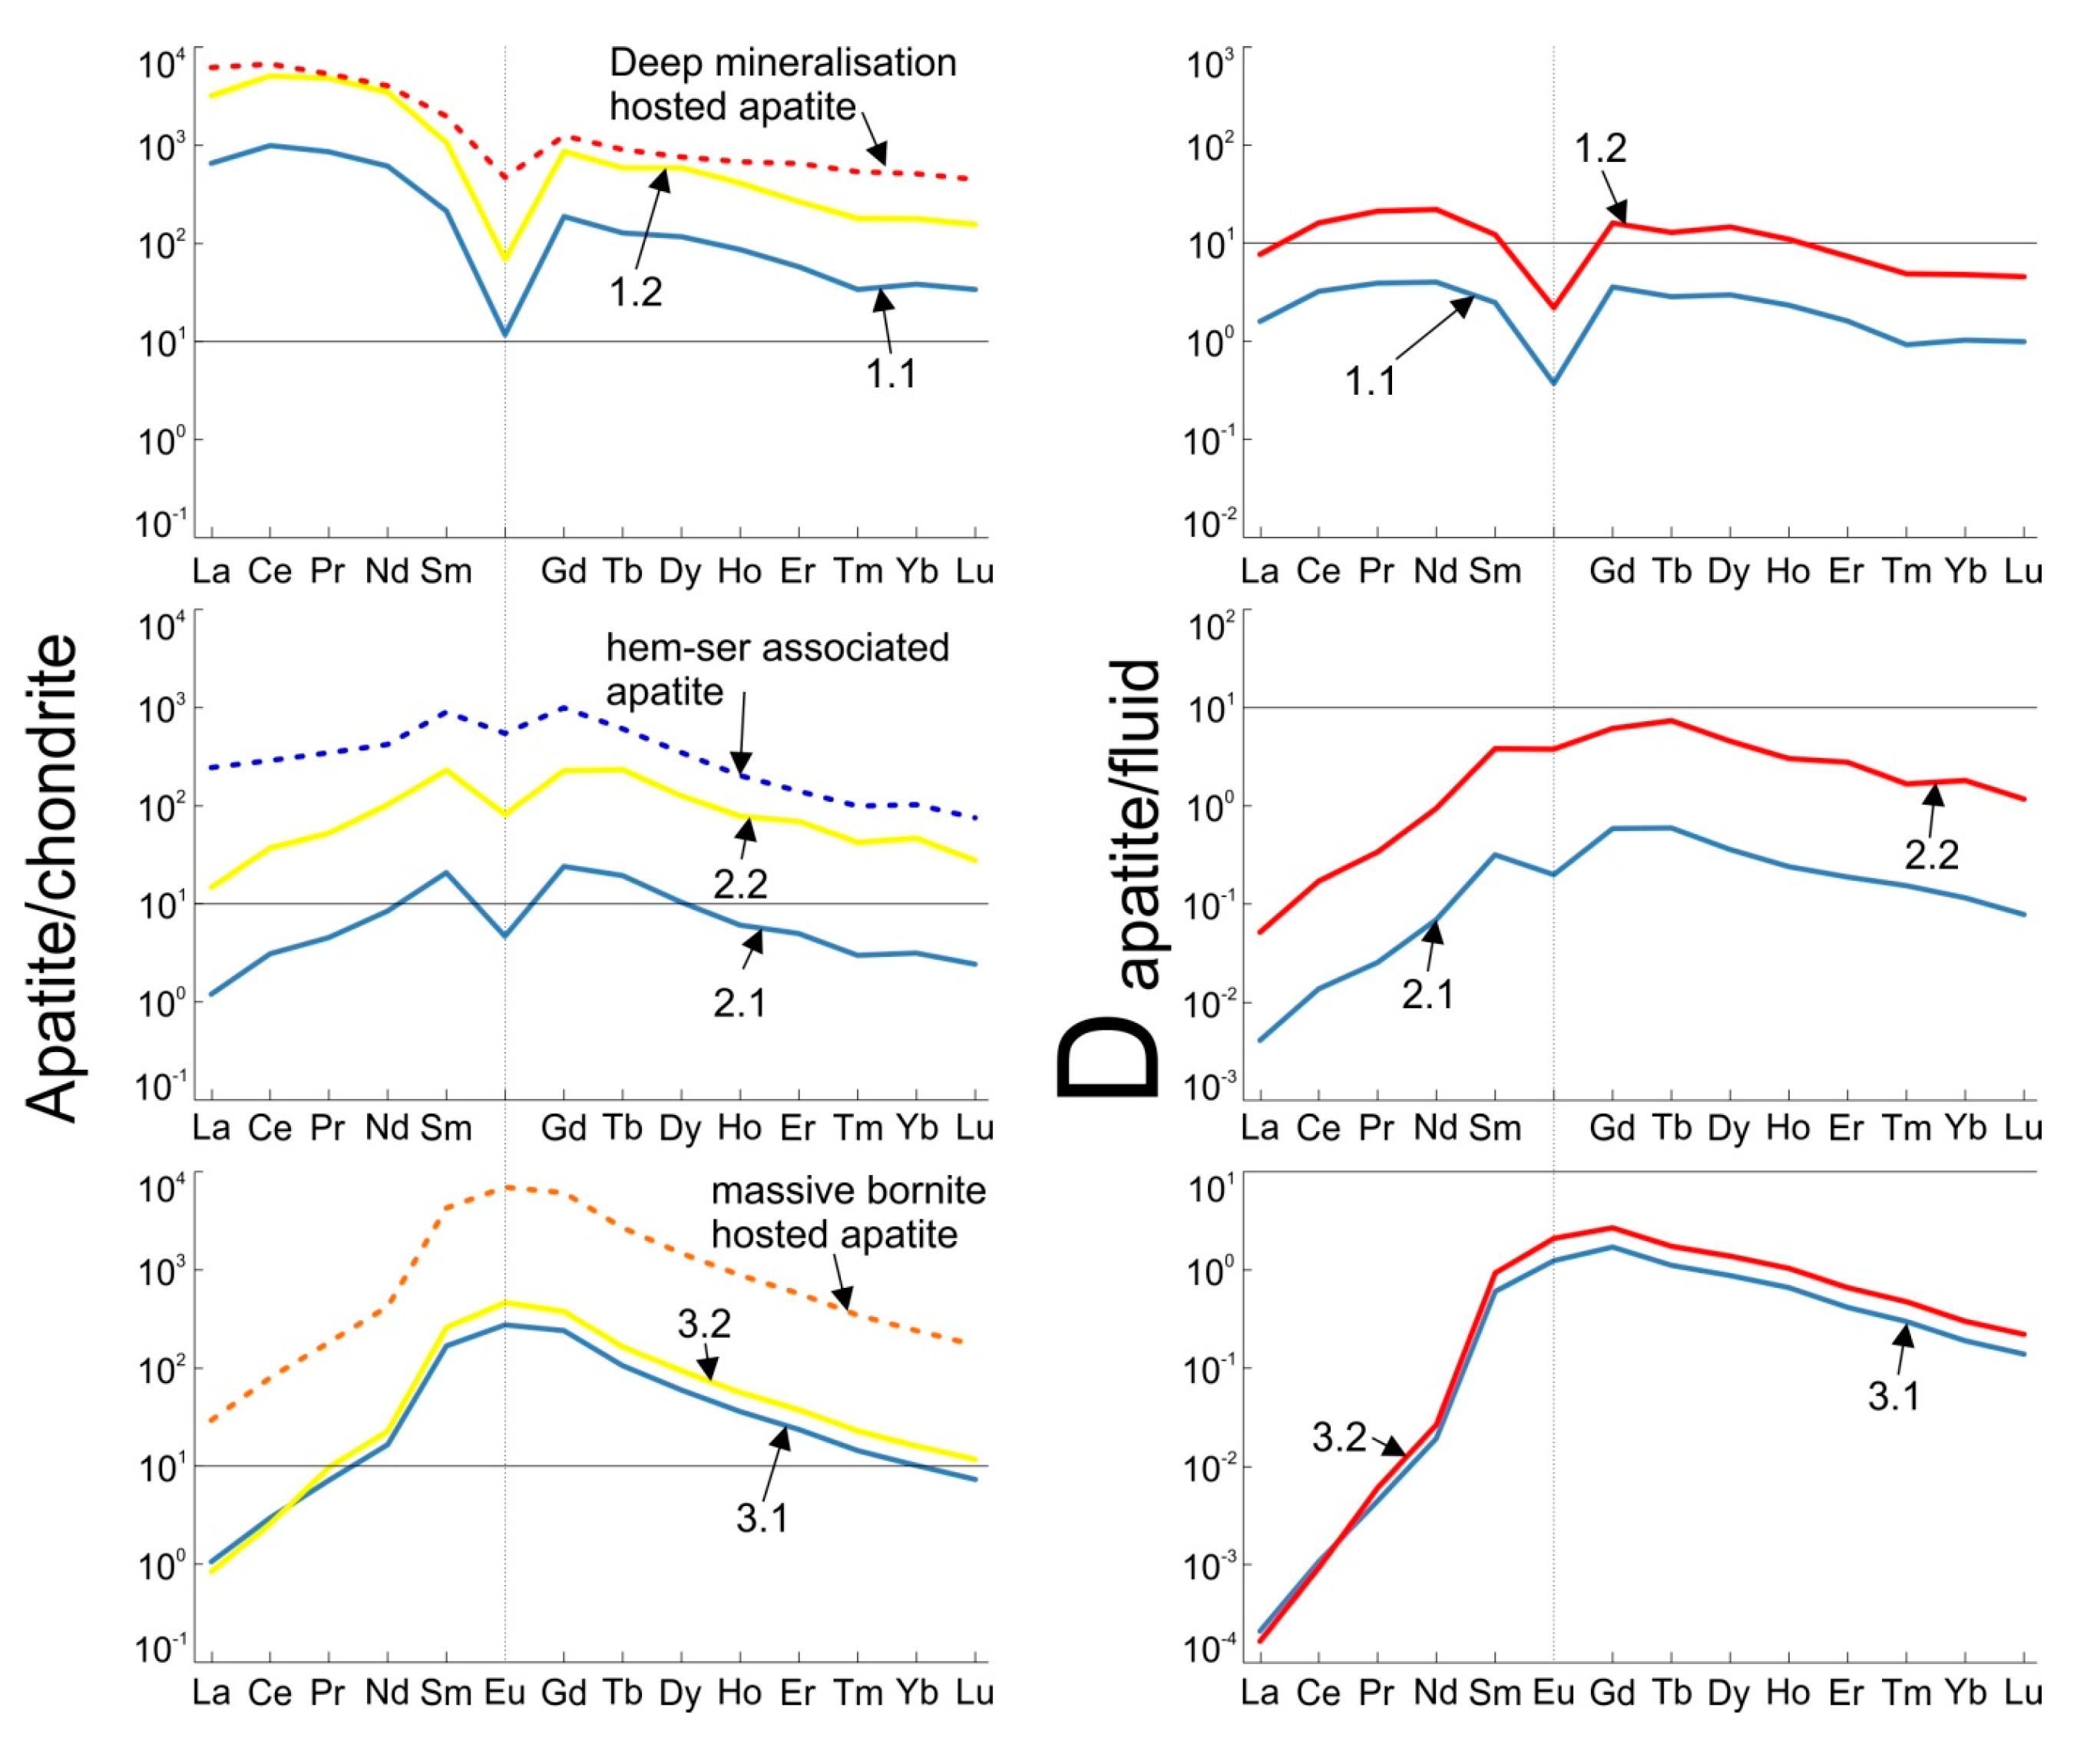
Using the methods and fluid parameters described and chemistry as outlined in Table 2, six models were generated, two for each apatite type (deep mineralization, hematite-sericite associated and massive bornite hosted apatite). Results of the modeling and calculations are shown in Appendix A with the model apatite and apatite/fluid partitioning coefficient D shown graphically as Figure 3.
Within the generated models, by far the best fits to the measured apatite compositions are provided by models 1.2 and 2.2. The remaining models significantly understate the observed absolute REE concentrations but nonetheless successfully replicate the shape of the measured chondrite-normalized REE fractionation trends. Many of these however are within the concentration ranges obtained for the measured apatite. To replicate the absolute mean REE concentrations, models 1.2 and 2.2 required an assumption of high Ca concentrations in the fluid (3 and 4 wt %), respectively which may be excessive for such fluids, even if it is noted that Haynes et al. [45] proposed fluids containing ~2.5 wt % Ca. As suggested, the primary effect of increasing Ca concentrations is an increase in the absolute REE levels within model apatite. However, this is not the case in models 3.1 and 3.2, suggesting that at the pH values at 300 °C proposed for these models (8.5 and 6.6, respectively) the effects of increasing Ca concentration are minor. Similarly, varying Na concentrations within all models, in isolation, primarily effects the absolute levels of REE but to a lesser extent than variation in Ca.
The various model groups are primarily distinguished with respect to changes in apatite/fluid partitioning coefficients, D, and the speciation of individual REE. For example, models 1.1 and 1.2 display relatively flat fractionation behavior, varying across a single order of magnitude, whereas in the case of the models attempting to replicate the MREE-enriched apatite varieties, they vary across at least 4 orders of magnitude with very low D values for LREE, increasing towards the MREE, and decreases slightly for HREE (Figure 3). These very low rates of LREE fractionation are, to a certain extent, artefacts of the highly LREE-enriched nature of the fluids chosen to represent models 2.1, 2.2, 3.1 and 3.2. However, in the case of models 2.1 and 2.2, an explanation for this fractionation can be observed in the increased proportion of fluid LREE activity being represented by Cl complexes (Table 3), a change that can be expected to increase the likelihood of these elements remaining mobile [7] and thus inhibit incorporation into apatite. Moreover, this would explain the commonly observed LREE depletion associated with hematite-sericite overprinting of pre-existing apatite [15,17]. An increase in the dominance of Cl complexes is primarily caused by a drop in pH from 5.2 to 4.4 and does not exhibit a sensitivity to changes in NaCl concentrations since sufficient Cl is available in all the models to facilitate formation of REE–Cl species.
Within all models chosen, with the exceptions of 3.1 and 3.2, REE–F species account for a portion of each REE’s activity. This is particularly true in the case of models 2.1 and 2.2 where a major proportion of HREE activity is represented by these complexes. In comparison to models 1.1 and 1.2 where these species are carried largely by oxide and hydroxide species, the transition to lower pH conditions would inhibit the crystallization of F as fluorite and increase its availability for REE complexing [7].
In all cases, the majority of HREE activity is represented by low-solubility F-, oxide- and hydroxide-complexes, all of which are considered highly immobile [7]. This may explain the much smaller variability that these elements exhibit compared to LREE with respect to both REE-signatures and absolute concentrations.
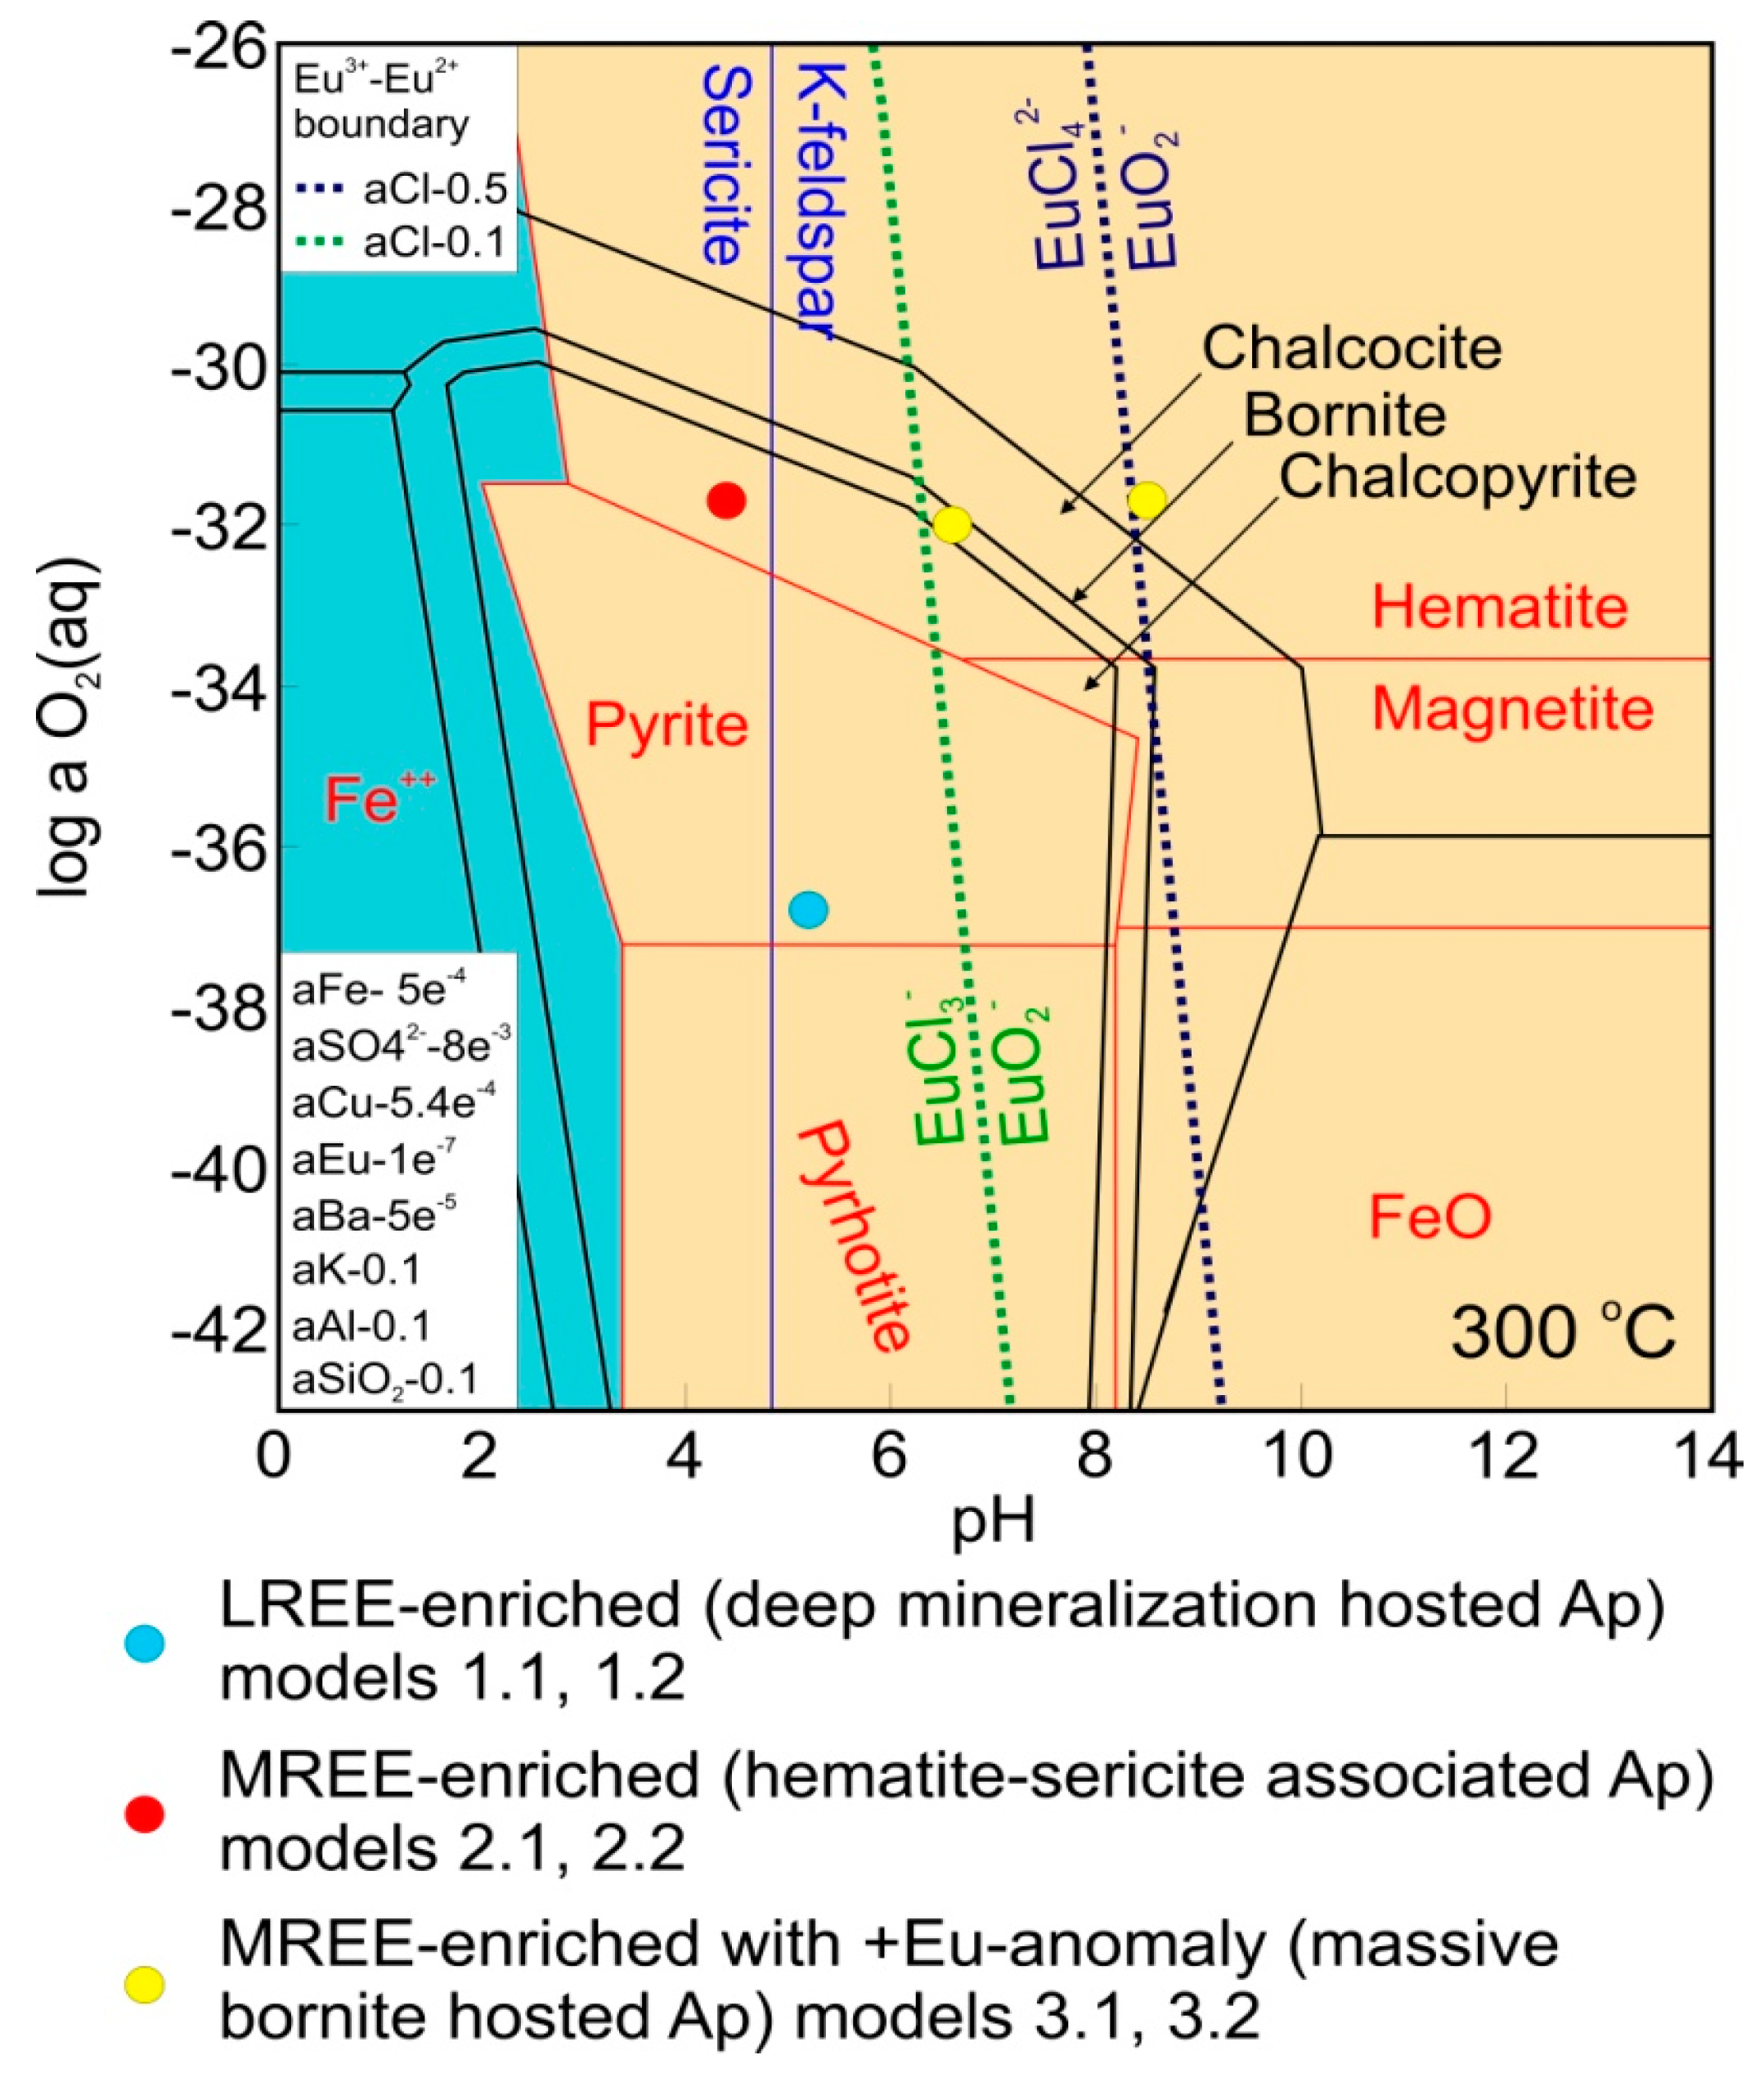
The significant variabilities in REE speciation present in models 1.1, 1.2, 2.1 and 2.2 are lacking in models 3.1 and 3.2, in which all REE species are dominated by oxide and hydroxide species. This suggests that the unusual MREE-enriched signature of this apatite cannot be explained in terms of solubility and stability discrepancies between the REE. Given the relative lack of co-crystallizing LREE-enriched species within these samples, except for very minor florencite, it is reasonable to suggest that the fluids from which this apatite formed were already slightly MREE-enriched and that the preferential partitioning of REE closest to the Sm-Gd range into apatite [35] led to further MREE-enrichment as was suggested for scheelite under similar conditions [8]. Significantly, within these models, Eu is present as the trivalent species EuO2−, a form much more easily incorporated into apatite compared to the EuCl42− species present within the other models. Given that the di- vs. trivalent speciation of Eu is primarily controlled by pH in hydrothermal systems [2], the presence of a positive Eu anomaly in the massive bornite hosted apatite can be readily attributed to crystallization under pH conditions significantly higher than those proposed for the other apatites that display negative Eu anomalies. Moreover, Brugger et al. [2] noted that transition of EuCl42− to EuO2− is very sensitive to Cl activity, as shown in Figure 4. This suggests that lower salinity, in addition to higher pH, was responsible for formations of this apatite.
5. Discussion
Modeling of REE partitioning between apatite and fluid along with the consideration of REE-speciation in fluid during formation of various hydrothermal assemblages within Olympic Dam offers valuable insights into the transport and deposition of REE within the deposit. It is apparent that REE transport was primarily facilitated by REE–Cl complexes due to their high solubility and dominance (at least for LREE) in both early magnetite-stable and later hematite-stable ore-forming conditions. Such a scenario is concordant with the findings of van Dongen et al. [50] in their studies of REE behavior within porphyry Cu-Au mineralization and with arguments put forward by Migdisov et al. [7]. The latter authors also emphasized the importance of SO4 complexes for REE transport. This is, however, found to have been negligible at Olympic Dam due to the very low activity of REE–SO4 complexes under all conditions considered, even at high SO4 concentrations (e.g., models 3.1 and 3.2).
Despite the mobility of REE during formation of both magnetite- and hematite-dominant mineralization, the latter appears to have made a much more considerable contribution to the overall enrichment of the deposit in REE. Specifically, pervasive sericite alteration results in the replacement of feldspars and apatite [15,26], releasing significant volumes of REE (as these minerals account for most of the REE budget within the RDG and other intrusive rocks) under conditions exceptionally well suited for their transport. Such a coupled process of REE release and transport could account for a portion of the elevated REE concentrations within the deposit. Moreover, the significantly higher enrichment in LREE is easily explained through such a model given their dominance as REE–Cl complexes within fluids causing hematite-sericite alteration.
Within the deposit, REE are dominantly hosted in the REE-fluorocarbonate mineral bastnäsite [(REE)CO3F], in florencite [(REE)Al3(PO4)2(OH)6], and in subordinate amounts within synchysite [Ca(REE)(CO3)2F], Sr- and Ca-dominant Al-phosphate-sulfates of the crandallite- and beudantite groups, as well as in xenotime and monazite [20,51]. Outside the deposit, a further REE–fluorocarbonate, parasite, is also observed [52,53], forming micron- to nanoscale intergrowths with bastnäsite and an unnamed species as part of a complex sericite + quartz + molybdenite assemblage replacing magmatic feldspar.
All these minerals contain P, F and/or CO3, supporting the hypothesis that deposition of REE was achieved via a weakening of REE–Cl activity and subsequent REE complexation with the aforementioned species. In the presence of REE-fluorocarbonate-rich assemblages outside the deposit, hydrothermal apatite is S-bearing but shows little change in the REE fractionation trends compared to magmatic apatite [15,17]. On the other hand, florencite + sericite replace apatite, the latter displaying REE fractionation trends represented here by case 2 [17]. The modeling presented here does not reflect the many, diverse environments of apatite formation at Olympic Dam. It is, however, illustrative of the underlying reasons behind the magmatic to hydrothermal transition (cases 1 and 2) and the high-grade ore (case 3).
6. Conclusions and Recommendations
The modeling outlined here shows a relatively good fit with measured REE fractionation in apatite from Olympic Dam and satellite prospects in the region. This not only highlights that the observed trends can be efficiently and plausibly explained in terms of IOCG fluid evolution but also that these trends can be used to predict regional-scale variation within IOCG systems comparable to Olympic Dam.
Further modeling is required to precisely determine under which parameters REE deposition occurred. Models should also explain the dominance of fluorocarbonates as REE-carriers at Olympic Dam. Speciation of REE as F-complexes is easily achieved by increasing F concentrations within fluid at low pH and may also need to consider the potential role of REE-CO3 complexes. These data, from one of the largest REE accumulations on Earth complement published empirical datasets and thermodynamic modeling in a broad range of different ore deposits [1,2,3,4,5,6,7,8,54,55,56].
Author Contributions
S.K. performed the work presented, guided by C.L.C. and N.J.C. K.J.E. supplied sample material and provided advice. S.K. wrote the manuscript assisted by C.L.C., N.J.C., and K.J.E.
Acknowledgments
This work is supported by BHP Olympic Dam. We gratefully acknowledge microanalytical assistance from the staff at Adelaide Microscopy, notably Ben Wade. N.J.C. and K.E. acknowledge support from the ARC Research Hub for Australian Copper–Uranium. CLC acknowledges support from the ‘FOX’ project (Trace elements in iron oxides), supported by BHP Olympic Dam and the South Australian Mining and Petroleum Services Centre of Excellence. A draft version of this work benefitted from helpful comments and encouragement to publish from David R. Lentz and Daniel Harlov. Last but not least, we thank the three anonymous Minerals reviewers and special issue editor Galina Palyanova, which have helped us improve expression and presentation of this work.
Conflicts of Interest
The authors declare no conflict of interest.
Appendix A. Results of Modeling (Models 1.1, 1.2, 2.1, 2.2, 3.1 and 3.2).
| MODEL 1.1 | a (aq.) Total | a (Apatite) | Concentration in Apatite (Mole Fraction) | Concentration Fluid (Modal) | K | Dapatite/fluid | Concentration REE Fluid (ppm) | Model Apatite (ppm) | Model Apatite/Chondrite |
| Ca | 0.141 | 0.974 | 0.974 | 0.195 | |||||
| Na | 3.05 | 0.013 | 0.013 | 4.39 | |||||
| La | 1.35 × 10⁻⁴ | 2.25 × 10⁻³ | 1.51 × 10⁻³ | 1.58 | 98.4 | 156 | 658 | ||
| Ce | 1.82 × 10⁻⁴ | 6.15 × 10⁻³ | 3.05 × 10⁻³ | 3.20 | 194 | 622 | 1014 | ||
| Pr | 1.80 × 10⁻⁵ | 7.35 × 10⁻⁴ | 3.70 × 10⁻³ | 3.89 | 21.1 | 81.9 | 881 | ||
| Nd | 6.35 × 10⁻⁵ | 2.66 × 10⁻³ | 3.79 × 10⁻³ | 3.98 | 72.2 | 287 | 629 | ||
| Sm | 1.57 × 10⁻⁵ | 4.07 × 10⁻⁴ | 2.35 × 10⁻³ | 2.47 | 13.0 | 32.0 | 216 | ||
| Eu | 1.03 × 10⁻⁷ | 3.70 × 10⁻⁵ | 0.032 | 0.37 | 1.76 | 0.65 | 11.6 | ||
| Gd | 8.63 × 10⁻⁶ | 3.23 × 10⁻⁴ | 3.39 × 10⁻³ | 3.56 | 10.8 | 38.3 | 192 | ||
| Tb | 1.41 × 10⁻⁶ | 4.20 × 10⁻⁵ | 2.69 × 10⁻³ | 2.83 | 1.65 | 4.68 | 130 | ||
| Dy | 7.59 × 10⁻⁶ | 2.36 × 10⁻⁴ | 2.81 × 10⁻³ | 2.95 | 9.92 | 29.3 | 119 | ||
| Ho | 1.90 × 10⁻⁶ | 4.63 × 10⁻⁵ | 2.21 × 10⁻³ | 2.32 | 2.08 | 4.82 | 87.5 | ||
| Er | 7.62 × 10⁻⁶ | 1.28 × 10⁻⁴ | 1.52 × 10⁻³ | 1.59 | 5.81 | 9.26 | 57.9 | ||
| Tm | 1.70 × 10⁻⁶ | 1.64 × 10⁻⁵ | 8.72 × 10⁻⁴ | 0.916 | 0.922 | 0.84 | 33.8 | ||
| Yb | 9.21 × 10⁻⁶ | 9.90 × 10⁻⁵ | 9.72 × 10⁻⁴ | 1.02 | 6.04 | 6.17 | 38.3 | ||
| Lu | 1.30 × 10⁻⁶ | 1.34 × 10⁻⁵ | 9.38 × 10⁻⁴ | 0.985 | 0.846 | 0.83 | 33.9 | ||
| Y Eu2+ (aq.) | 7.22 × 10⁻³ |
| MODEL 1.2 | a (aq.) Total | a (Apatite) | Concentration in Apatite (Mole Fraction) | Concentration Fluid (Modal) | K | Dapatite/fluid | Concentration REE Fluid (ppm) | Model Apatite (ppm) | Model Apatite/Chondrite |
| Ca | 0.789 | 0.974 | 0.974 | 1.05 | |||||
| Na | 3.39 | 0.013 | 0.013 | 4.80 | |||||
| La | 1.59 × 10⁻⁴ | 2.25 × 10⁻³ | 0.036 | 7.68 | 98.4 | 756 | 3189 | ||
| Ce | 2.08 × 10⁻⁴ | 6.15 × 10⁻³ | 0.075 | 16.1 | 194 | 3117 | 5084 | ||
| Pr | 1.89 × 10⁻⁵ | 7.35 × 10⁻⁴ | 0.099 | 21.1 | 21.1 | 445 | 4785 | ||
| Nd | 6.59 × 10⁻⁵ | 2.66 × 10⁻³ | 0.103 | 22.0 | 72.2 | 1587 | 3473 | ||
| Sm | 1.82 × 10⁻⁵ | 4.07 × 10⁻⁴ | 0.057 | 12.2 | 13.0 | 158 | 1067 | ||
| Eu | 9.78 × 10⁻⁸ | 3.70 × 10⁻⁵ | 0.965 | 2.19 | 1.76 | 3.85 | 68.7 | ||
| Gd | 1.10 × 10⁻⁵ | 3.23 × 10⁻⁴ | 0.075 | 16.0 | 10.8 | 172 | 864 | ||
| Tb | 1.78 × 10⁻⁶ | 4.20 × 10⁻⁵ | 0.060 | 12.8 | 1.65 | 21.2 | 588 | ||
| Dy | 8.80 × 10⁻⁶ | 2.36 × 10⁻⁴ | 0.068 | 14.6 | 9.92 | 145 | 589 | ||
| Ho | 2.31 × 10⁻⁶ | 4.63 × 10⁻⁵ | 0.051 | 10.9 | 2.08 | 22.6 | 412 | ||
| Er | 9.50 × 10⁻⁶ | 1.28 × 10⁻⁴ | 0.034 | 7.32 | 5.81 | 42.5 | 266 | ||
| Tm | 1.84 × 10⁻⁶ | 1.64 × 10⁻⁵ | 0.023 | 4.86 | 0.922 | 4.48 | 179 | ||
| Yb | 1.13 × 10⁻⁵ | 9.90 × 10⁻⁵ | 0.022 | 4.77 | 6.04 | 28.8 | 179 | ||
| Lu | 1.61 × 10⁻⁶ | 1.34 × 10⁻⁵ | 0.021 | 4.54 | 0.846 | 3.84 | 156 | ||
| Y Eu2+ (aq.) | 6.25 × 10⁻³ |
| MODEL 2.1 | a (aq.) Total | a (Apatite) | Concentration in Apatite (Mole Fraction) | Concentration Fluid (Modal) | K | Dapatite/fluid | Concentration REE Fluid (ppm) | Model Apatite (ppm) | Model Apatite/Chondrite |
| Ca | 0.068 | 0.996 | 0.996 | 0.105 | |||||
| Na | 1.28 | 1.96 × 10⁻³ | 1.96 × 10⁻³ | 1.94 | |||||
| La | 1.42 × 10⁻⁴ | 9.31 × 10⁻⁵ | 4.73 × 10⁻⁶ | 4.10 × 10⁻³ | 100 | 0.41 | 1.73 | ||
| Ce | 1.49 × 10⁻⁴ | 3.27 × 10⁻⁴ | 1.58 × 10⁻⁵ | 0.014 | 200 | 2.74 | 4.47 | ||
| Pr | 1.62 × 10⁻⁵ | 6.56 × 10⁻⁵ | 2.93 × 10⁻⁵ | 0.025 | 24.0 | 0.61 | 6.54 | ||
| Nd | 3.74 × 10⁻⁵ | 4.15 × 10⁻⁴ | 8.01 × 10⁻⁵ | 0.069 | 80.0 | 5.55 | 12.1 | ||
| Sm | 5.63 × 10⁻⁶ | 2.86 × 10⁻⁴ | 3.67 × 10⁻⁴ | 0.318 | 14.0 | 4.45 | 30.0 | ||
| Eu | 1.60 × 10⁻⁷ | 6.52 × 10⁻⁵ | 27.9 | 0.199 | 1.90 | 0.38 | 6.76 | ||
| Gd | 4.26 × 10⁻⁶ | 4.01 × 10⁻⁴ | 6.78 × 10⁻⁴ | 0.587 | 11.8 | 6.93 | 34.8 | ||
| Tb | 4.50 × 10⁻⁷ | 4.29 × 10⁻⁵ | 6.88 × 10⁻⁴ | 0.596 | 1.70 | 1.01 | 28.2 | ||
| Dy | 2.89 × 10⁻⁶ | 1.66 × 10⁻⁴ | 4.15 × 10⁻⁴ | 0.359 | 10.3 | 3.70 | 15.0 | ||
| Ho | 5.46 × 10⁻⁷ | 2.10 × 10⁻⁵ | 2.78 × 10⁻⁴ | 0.241 | 2.00 | 0.48 | 8.75 | ||
| Er | 1.37 × 10⁻⁶ | 4.14 × 10⁻⁵ | 2.17 × 10⁻⁴ | 0.188 | 6.10 | 1.15 | 7.18 | ||
| Tm | 1.79 × 10⁻⁷ | 4.40 × 10⁻⁶ | 1.78 × 10⁻⁴ | 0.154 | 0.70 | 0.11 | 4.31 | ||
| Yb | 1.48 × 10⁻⁶ | 2.75 × 10⁻⁵ | 1.34 × 10⁻⁴ | 0.116 | 6.30 | 0.73 | 4.53 | ||
| Lu | 2.48 × 10⁻⁷ | 3.10 × 10⁻⁶ | 9.03 × 10⁻⁵ | 0.078 | 1.10 | 0.086 | 3.50 | ||
| Y Eu2+ (aq.) | 0.012 |
| MODEL 2.2 | a (aq.) Total | a (Apatite) | Concentration in Apatite (Mole Fraction) | Concentration Fluid (Modal) | K | Dapatite/fluid | Concentration REE Fluid (ppm) | Model Apatite (ppm) | Model Apatite/Chondrite |
| Ca | 0.906 | 0.996 | 0.996 | 1.28 | |||||
| Na | 1.48 | 1.96 × 10⁻³ | 1.96 × 10⁻³ | 2.19 | |||||
| La | 1.58 × 10⁻⁴ | 9.31 × 10⁻⁵ | 6.46 × 10⁻⁴ | 0.052 | 100 | 5.18 | 21.8 | ||
| Ce | 1.67 × 10⁻⁴ | 3.27 × 10⁻⁴ | 2.14 × 10⁻³ | 0.172 | 200 | 34.4 | 56.0 | ||
| Pr | 1.70 × 10⁻⁵ | 6.56 × 10⁻⁵ | 4.22 × 10⁻³ | 0.338 | 24.0 | 8.11 | 87.2 | ||
| Nd | 3.85 × 10⁻⁵ | 4.15 × 10⁻⁴ | 0.012 | 0.946 | 80.0 | 75.7 | 166 | ||
| Sm | 6.55 × 10⁻⁶ | 2.86 × 10⁻⁴ | 0.048 | 3.83 | 14.0 | 53.6 | 362 | ||
| Eu | 1.27 × 10⁻⁷ | 6.52 × 10⁻⁵ | 468 | 3.79 | 1.90 | 7.21 | 129 | ||
| Gd | 5.71 × 10⁻⁶ | 4.01 × 10⁻⁴ | 0.077 | 6.15 | 11.8 | 72.6 | 365 | ||
| Tb | 5.09 × 10⁻⁷ | 4.29 × 10⁻⁵ | 0.092 | 7.38 | 1.70 | 12.5 | 349 | ||
| Dy | 3.19 × 10⁻⁶ | 1.66 × 10⁻⁴ | 0.057 | 4.56 | 10.3 | 47.0 | 191 | ||
| Ho | 6.08 × 10⁻⁷ | 2.10 × 10⁻⁵ | 0.038 | 3.03 | 2.00 | 6.06 | 110 | ||
| Er | 1.31 × 10⁻⁶ | 4.14 × 10⁻⁵ | 0.035 | 2.78 | 6.10 | 16.9 | 106 | ||
| Tm | 2.30 × 10⁻⁷ | 4.40 × 10⁻⁶ | 0.021 | 1.67 | 0.70 | 1.17 | 46.9 | ||
| Yb | 1.33 × 10⁻⁶ | 2.75 × 10⁻⁵ | 0.023 | 1.81 | 6.30 | 11.4 | 70.9 | ||
| Lu | 2.32 × 10⁻⁷ | 3.10 × 10⁻⁶ | 0.015 | 1.17 | 1.10 | 1.29 | 52.5 | ||
| Y Eu2+ (aq.) | 8.10 × 10⁻³ |
| MODEL 3.1 | a (aq.) Total | a (Apatite) | Concentration in Apatite (Mole Fraction) | Concentration Fluid (Modal) | K | Dapatite/fluid | Concentration REE Fluid (ppm) | Model Apatite (ppm) | Model Apatite/Chondrite |
| Ca | 0.224 | 0.992 | 0.992 | 0.292 | |||||
| Na | 0.439 | 4.10 × 10⁻³ | 4.10 × 10⁻³ | 0.944 | |||||
| La | 3.47 × 10⁻³ | 1.01 × 10⁻⁵ | 1.39 × 10⁻⁶ | 2.10 × 10⁻⁴ | 120 | 0.252 | 1.06 | ||
| Ce | 4.71 × 10⁻³ | 6.99 × 10⁻⁵ | 7.10 × 10⁻⁶ | 1.07 × 10⁻³ | 170 | 1.82 | 2.98 | ||
| Pr | 3.94 × 10⁻⁴ | 2.42 × 10⁻⁵ | 2.93 × 10⁻⁵ | 4.44 × 10⁻³ | 150 | 0.665 | 7.16 | ||
| Nd | 1.01 × 10⁻³ | 2.69 × 10⁻⁴ | 1.28 × 10⁻⁴ | 0.019 | 393 | 7.58 | 16.6 | ||
| Sm | 1.01 × 10⁻⁴ | 8.41 × 10⁻⁴ | 3.99 × 10⁻³ | 0.603 | 41.2 | 24.9 | 168 | ||
| Eu | 2.99 × 10⁻⁵ | 5.15 × 10⁻⁴ | 8.22 × 10⁻³ | 1.24 | 12.4 | 15.4 | 275 | ||
| Gd | 6.54 × 10⁻⁵ | 1.55 × 10⁻³ | 0.011 | 1.71 | 28.0 | 47.9 | 241 | ||
| Tb | 7.87 × 10⁻⁶ | 1.22 × 10⁻⁴ | 7.40 × 10⁻³ | 1.12 | 3.40 | 3.80 | 106 | ||
| Dy | 3.78 × 10⁻⁵ | 4.58 × 10⁻⁴ | 5.80 × 10⁻³ | 0.877 | 16.7 | 14.6 | 59.5 | ||
| Ho | 6.69 × 10⁻⁶ | 6.10 × 10⁻⁵ | 4.36 × 10⁻³ | 0.659 | 3.00 | 1.98 | 36.0 | ||
| Er | 2.00 × 10⁻⁵ | 1.15 × 10⁻⁴ | 2.74 × 10⁻³ | 0.415 | 9.10 | 3.78 | 23.6 | ||
| Tm | 2.61 × 10⁻⁶ | 1.08 × 10⁻⁵ | 1.98 × 10⁻³ | 0.299 | 1.20 | 0.359 | 14.4 | ||
| Yb | 1.83 × 10⁻⁵ | 4.82 × 10⁻⁵ | 1.26 × 10⁻³ | 0.191 | 8.60 | 1.64 | 10.2 | ||
| Lu | 2.73 × 10⁻⁶ | 5.25 × 10⁻⁶ | 9.18 × 10⁻⁴ | 0.139 | 1.30 | 0.180 | 7.34 | ||
| Y Eu2+ (aq.) | NA |
| MODEL 3.2 | a (aq.) Total | a (Apatite) | Concentration in Apatite (Mole Fraction) | Concentration Fluid (Modal) | K | Dapatite/fluid | Concentration REE Fluid (ppm) | Model Apatite (ppm) | Model Apatite/Chondrite |
| Ca | 0.645 | 0.992 | 0.992 | 1.05 | |||||
| Na | 0.652 | 4.10 × 10⁻³ | 4.10 × 10⁻³ | 1.03 | |||||
| La | 7.37 × 10⁻³ | 1.01 × 10⁻⁵ | 3.63 × 10⁻⁶ | 1.66 × 10⁻⁴ | 120 | 0.199 | 0.841 | ||
| Ce | 9.16 × 10⁻³ | 6.99 × 10⁻⁵ | 2.03 × 10⁻⁵ | 9.29 × 10⁻⁴ | 170 | 1.58 | 2.58 | ||
| Pr | 4.88 × 10⁻⁴ | 2.42 × 10⁻⁵ | 1.32 × 10⁻⁴ | 6.03 × 10⁻³ | 150 | 0.904 | 9.72 | ||
| Nd | 1.23 × 10⁻³ | 2.69 × 10⁻⁴ | 5.81 × 10⁻⁴ | 0.027 | 393 | 10.4 | 22.9 | ||
| Sm | 1.10 × 10⁻⁴ | 8.41 × 10⁻⁴ | 0.020 | 0.933 | 41.2 | 38.4 | 260 | ||
| Eu | 2.99 × 10⁻⁵ | 5.15 × 10⁻⁴ | 0.046 | 2.10 | 12.4 | 26.0 | 464 | ||
| Gd | 7.01 × 10⁻⁵ | 1.55 × 10⁻³ | 0.059 | 2.69 | 28.0 | 75.3 | 378 | ||
| Tb | 8.49 × 10⁻⁶ | 1.22 × 10⁻⁴ | 0.038 | 1.75 | 3.40 | 5.93 | 165 | ||
| Dy | 4.02 × 10⁻⁵ | 4.58 × 10⁻⁴ | 0.030 | 1.39 | 16.7 | 23.2 | 94.3 | ||
| Ho | 7.17 × 10⁻⁶ | 6.10 × 10⁻⁵ | 0.023 | 1.04 | 3.00 | 3.11 | 56.5 | ||
| Er | 2.11 × 10⁻⁵ | 1.15 × 10⁻⁴ | 0.014 | 0.661 | 9.10 | 6.01 | 37.6 | ||
| Tm | 2.77 × 10⁻⁶ | 1.08 × 10⁻⁵ | 0.010 | 0.475 | 1.20 | 0.570 | 22.8 | ||
| Yb | 1.95 × 10⁻⁵ | 4.82 × 10⁻⁵ | 6.59 × 10⁻³ | 0.301 | 8.60 | 2.59 | 16.1 | ||
| Lu | 2.89 × 10⁻⁶ | 5.25 × 10⁻⁶ | 4.83 × 10⁻³ | 0.221 | 1.30 | 0.287 | 11.7 | ||
| Y Eu2+ (aq.) | NA |
References
- Smith, M.; Henderson, P.; Jeffries, T.; Long, J.; Williams, C. The rare earth elements and uranium in garnets from the Beinn an Dubhaich Aureole, Skye, Scotland, UK: Constraints on processes in a dynamic hydrothermal system. J. Pet. 2004, 45, 457–484. [Google Scholar] [CrossRef]
- Brugger, J.; Etschmann, B.; Pownceby, M.; Liu, W.; Grundler, P.; Brewe, D. Oxidation state of europium in scheelite: Tracking fluid-rock interaction in gold deposits. Chem. Geol. 2008, 257, 26–33. [Google Scholar] [CrossRef]
- van Hinsberg, V.J.; Migdisov, A.A.; Williams-Jones, A.E. Reading the mineral record of fluid composition from element partitioning. Geology 2010, 38, 847–850. [Google Scholar] [CrossRef]
- Haas, J.R.; Shock, E.L.; Sassani, D.C. Rare earth elements in hydrothermal systems: Estimates of standard partial molal thermodynamic properties of aqueous complexes of the rare earth elements at high pressures and temperatures. Geochim. Cosmochim. Acta 1995, 59, 4329–4350. [Google Scholar] [CrossRef]
- Bau, M. Rare-earth element mobility during hydrothermal and metamorphic fluid-rock interaction and the significance of the oxidation state of europium. Chem. Geol. 1991, 93, 219–230. [Google Scholar] [CrossRef]
- Migdisov, A.A.; Williams-Jones, A.E. Hydrothermal transport and deposition of the rare earth elements by fluorine-bearing aqueous liquids. Miner. Deposita 2014, 49, 987–997. [Google Scholar] [CrossRef]
- Migdisov, A.A.; Williams-Jones, A.E.; Brugger, J.; Caporuscio, F.A. Hydrothermal transport, deposition, and fractionation of the REE: Experimental data and thermodynamic calculations. Chem. Geol. 2016, 439, 13–42. [Google Scholar] [CrossRef]
- Brugger, J.; Lahaye, Y.; Costa, S.; Lambert, D.; Bateman, R. Inhomogenous distribution of REE in scheelite and dynamics of Archean hydrothermal systems (Mt. Charlotte and Drysdale gold deposits, Western Australia). Contrib. Miner. Pet. 2000, 139, 251–264. [Google Scholar] [CrossRef]
- Harlov, D.E. Apatite: A fingerprint for metasomatic processes. Elements 2015, 11, 171–176. [Google Scholar] [CrossRef]
- Belousova, E.A.; Walters, S.; Griffin, W.L.; O’Reilly, S.Y. Trace-element signatures of apatites in granitoids from the Mt Isa Inlier, northwestern Queensland. Aust. J. Earth Sci. 2001, 48, 603–619. [Google Scholar] [CrossRef]
- Belousova, E.A.; Griffin, W.L.; O’Reilly, S.Y.; Fisher, N.I. Apatite as an indicator mineral for mineral exploration: Trace-element compositions and their relationship to host rock type. J. Geochem. Explor. 2002, 76, 45–69. [Google Scholar] [CrossRef]
- Cao, M.; Li, G.; Qin, K.; Seitmuratova, E.Y.; Liu, Y. Major and Trace element characteristics of apatites in granitoids from Central Kazakhstan: Implications for petrogenesis and mineralization. Res. Geol. 2012, 62, 63–83. [Google Scholar] [CrossRef]
- Teiber, H.; Marks, M.A.W.; Arzamastsev, A.A.; Wenzel, T.; Markl, G. Compositional variation in apatite from various host rocks: Clues with regards to source composition and crystallization conditions. J. Miner. Geochem. 2015, 192, 151–167. [Google Scholar] [CrossRef]
- Mao, M.; Rukhlov, A.S.; Rowins, S.M.; Spence, J.; Coogan, L.A. Apatite trace element compositions: A robust new tool for mineral exploration. Econ. Geol. 2016, 111, 1187–1222. [Google Scholar] [CrossRef]
- Krneta, S.; Ciobanu, C.L.; Cook, N.J.; Ehrig, K.; Kontonikas-Charos, A. Apatite at Olympic Dam, South Australia: A petrogenetic tool. Lithos 2016, 262, 470–485. [Google Scholar] [CrossRef]
- Krneta, S.; Ciobanu, C.L.; Cook, N.J.; Ehrig, K.; Kontonikas-Charos, A. The Wirrda Well and Acropolis prospects Gawler Craton, South Australia: Insights into evolving fluid conditions through apatite chemistry. J. Geochem. Explor. 2017, 181, 276–291. [Google Scholar] [CrossRef]
- Krneta, S.; Ciobanu, C.L.; Cook, N.J.; Ehrig, K.; Kontonikas-Charos, A. Rare earth element behaviour in apatite from the Olympic Dam Cu-U-Au-Ag deposit, South Australia. Minerals 2017, 7, 135. [Google Scholar] [CrossRef]
- Ismail, R.; Ciobanu, C.L.; Cook, N.J.; Teale, G.S.; Giles, D.; Schmidt Mumm, A.; Wade, B. Rare earths and other trace elements in minerals from skarn assemblages, Hillside iron oxide–copper–gold deposit, Yorke Peninsula, South Australia. Lithos 2014, 184–187, 456–477. [Google Scholar] [CrossRef]
- Ehrig, K.; Kamenetsky, V.S.; McPhie, J.; Apukhtina, O.; Ciobanu, C.L.; Cook, N.J.; Kontonikas-Charos, A.; Krneta, S. The IOCG-IOA Olympic Dam Cu-U-Au-Ag deposit and nearby prospects, South Australia. In Proceedings of the 14th SGA Biennial Meeting, Quebec City, QC, Canada, 20–23 August 2017; pp. 823–826. [Google Scholar]
- Ehrig, K.; McPhie, J.; Kamenetsky, V.S. Geology and mineralogical zonation of the Olympic Dam iron oxide Cu-U-Au-Ag deposit, South Australia. In Geology and Genesis of Major Copper Deposits and Districts of the World, a Tribute to Richard Sillitoe; Hedenquist, J.W., Harris, M., Camus, F., Eds.; Society of Economic Geologists: Littleton, CO, USA, 2012; pp. 237–268. [Google Scholar]
- Oreskes, M.; Einaudi, M.T. Origin of Hydrothermal Fluids at Olympic Dam: Preliminary Results from Fluid Inclusions and Stable Isotopes. Econ. Geol. 1992, 87, 64–90. [Google Scholar] [CrossRef]
- Bastrakov, E.N.; Skirrow, R.G.; Davidson, G.J. Fluid evolution and origins of iron oxide Cu-Au prospects in the Olympic Dam District, Gawler Craton, South Australia. Econ. Geol. 2007, 102, 1415–1440. [Google Scholar] [CrossRef]
- BHP Billiton. Available online: https://www.bhp.com/-/media/bhp/documents/investors/annual-reports/2016/bhpbillitonannualreport2016.pdf?la=en (accessed on 8 August 2018).
- Reeve, J.S.; Cross, K.C.; Smith, R.N.; Oreskes, N. Olympic Dam copper-uranium-gold-silver deposit. In Geology of the Mineral. Deposits of Australia and Papua New Guinea; Hughes, F.E., Ed.; Australasian Institute of Mining and Metallurgy Monograph: Melbourne, Australia, 1990; pp. 1009–1035. [Google Scholar]
- Creaser, R.A. The Geology and Petrology of Middle Proterozoic Felsic Magmatism of the Stuart Shelf, South Australia. Unpublished Ph.D. Thesis, La Trobe University, Melbourne, Australia, 1989. [Google Scholar]
- Kontonikas-Charos, A.; Ciobanu, C.L.; Cook, N.J.; Ehrig, K.; Krneta, S.; Kamenetsky, V.S. Feldspar evolution in the Roxby Downs Granite, host to Fe-oxide Cu-Au-(U) mineralisation at Olympic Dam, South Australia. Ore Geol. Rev. 2017, 80, 838–859. [Google Scholar] [CrossRef]
- Jagodzinski, E.A. The age of magmatic and hydrothermal zircon at Olympic Dam. In Proceedings of the 2014 Australian Earth Sciences Convention (AESC), Sustainable Australia, Newcastle, Australia, 7–10 July 2014; Volume 110, p. 260. [Google Scholar]
- Ciobanu, C.L.; Wade, B.; Cook, N.J.; Schmidt Mumm, A.; Giles, D. Uranium-bearing hematite from the Olympic Dam Cu-U-Au deposit, South Australia; a geochemical tracer and reconnaissance Pb-Pb geochronometer. Precambr. Res. 2013, 238, 129–147. [Google Scholar] [CrossRef]
- Courtney-Davies, L.; Zhu, Z.; Ciobanu, C.L.; Wade, B.P.; Cook, N.J.; Ehrig, K.; Cabral, A.R.; Kennedy, A. Matrix-matched iron-oxide laser ablation ICP-MS U-Pb geochronology using mixed solutions standards. Minerals 2016, 6, 85. [Google Scholar] [CrossRef]
- Pasero, M.; Kampf, A.; Ferraris, C.; Pekov, I.V.; Rakovan, J.; White, T. Nomenclature of the apatite supergroup minerals. Eur. J. Miner. 2010, 22, 163–179. [Google Scholar] [CrossRef]
- White, T.J.; Dong, Z.L. Structural derivation and crystal chemistry of apatites. Acta Cryst. 2002, B59, 1–16. [Google Scholar] [CrossRef]
- Hughes, J.M.; Rakovan, J.F. Structurally robust, chemically diverse: Apatite and apatite supergroup minerals. Elements 2015, 11, 165–170. [Google Scholar] [CrossRef]
- Hughes, J.M.; Rakovan, J.F. The crystal structure of apatite, Ca5(PO4)3(F,OH,Cl). Rev. Miner. Geochem. 2002, 48, 1–12. [Google Scholar] [CrossRef]
- Goldschmidt, V.M. The principles of distribution of chemical elements in minerals and rocks. The seventh Hugo Müller Lecture, delivered before the Chemical Society on 17th March 1937. J. Chem Soc. (Resumed) 1937, 655–673. [Google Scholar] [CrossRef]
- Pan, Y.; Fleet, M.E. Compositions of the apatite-group minerals: Substitution mechanisms and controlling factors. Rev. Miner. Geochem. 2002, 48, 13–49. [Google Scholar] [CrossRef]
- Rønsbo, J.G. Coupled substitutions involving REE’s and Na and Si in apatites in alkaline rocks from Ilimaussaq, South Greenland, and the petrological implications. Am. Miner. 1989, 74, 896–901. [Google Scholar]
- Hughes, J.M. The many facets of apatite. Am. Miner. 2015, 100, 1033–1039. [Google Scholar] [CrossRef]
- Luo, Y.; Rakovan, J.; Tang, Y.; Lupulescu, M.; Hughes, J.M.; Pan, Y. Crystal chemistry of Th in fluorapatite. Am. Mineral. 2011, 96, 23–33. [Google Scholar] [CrossRef]
- Verdugo-Ihl, M.R.; Ciobanu, C.L.; Cook, N.J.; Ehrig, K.; Courtney-Davies, L.; Gilbert, S. Textures and U-W-Sn-Mo signatures in hematite from the Cu-U-Au-Ag orebody at Olympic Dam, South Australia: Defining the archetype for IOCG deposits. Ore Geol. Rev. 2017, 91, 173–195. [Google Scholar] [CrossRef]
- Morales Ruano, S.; Both, R.A.; Golding, S.D. A fluid inclusion and stable isotope study of the Moonta copper-gold deposits, South Australia: Evidence for fluid immiscibility in a magmatic hydrothermal system. Chem. Geol. 2002, 192, 211–226. [Google Scholar] [CrossRef]
- Schlegel, T.U. The Prominent Hill Iron Oxide-Cu-Au Deposit in South. Australia. A Deposit Formation Model Based on Geology, Geochemistry and Stable Isotopes and Fluid Inclusions. Unpublished Ph.D. Thesis, ETH Zurich, Zürich, Switzerland, 2015. [Google Scholar]
- Chiaradia, M.; Banks, D.; Cliff, R.; Marschik, R.; de Haller, A. Origin of fluids in iron oxide–copper–gold deposits: Constraints from δ37Cl, 87Sr/Sr, and Cl/Br. Miner. Deposita 2006, 41, 565–573. [Google Scholar] [CrossRef]
- Baker, T.; Mustard, R.; Fu, B.; Williams, P.J.; Dong, G.; Fisher, L.; Mark, G.; Ryan, C.G. Mixed messages in iron oxide-copper-gold systems of the Cloncurry district, Australia: Insights from PIXE analysis of halogens and copper in fluid inclusions. Miner. Deposita 2008, 43, 599–608. [Google Scholar] [CrossRef]
- Gleeson, S.A.; Smith, M.P. The sources and evolution of mineralising fluids in iron oxide–copper–gold systems, Norrbotten, Sweden: Constraints from Br/Cl ratios and stable Cl isotopes of fluid inclusion leachates. Geochim. Cosmochim. Acta 2009, 73, 5658–5672. [Google Scholar] [CrossRef]
- Haynes, D.W.; Cross, K.C.; Bills, R.T.; Reed, M.H. Olympic Dam Ore Genesis: A Fluid-Mixing Model. Econ. Geol. 1995, 90, 281–307. [Google Scholar] [CrossRef]
- Cook, N.J.; Ciobanu, C.L.; O’Reilly, D.; Wilson, R.; Das, K.; Wade, B. Mineral chemistry of rare earth element (REE) mineralization, Browns Range, Western Australia. Lithos 2013, 172, 192–213. [Google Scholar] [CrossRef]
- Weng, Z.; Jowitt, S.M.; Mudd, G.M.; Haque, N. A detailed assessment of global Rare Earth Element resources: Opportunities and challenges. Econ. Geol. 2015, 110, 1925–1952. [Google Scholar] [CrossRef]
- GWB Essentials Guide. Available online: https://www.gwb.com/pdf/GWB11/GWBessentials.pdf (accessed on 22 July 2017).
- Migdisov, A.A.; Williams-Jones, A.E.; Wagner, T. An experimental study of the solubility and speciation of the Rare Earth Elements (III) in fluoride- and chloride-bearing aqueous solutions at temperatures up to 300 °C. Geochim. Cosmochim. Acta 2009, 73, 7087–7109. [Google Scholar] [CrossRef]
- van Dongen, M.; Weinberg, R.F.; Tomkins, A.G. REE-Y, Ti, and P Remobilization in Magmatic Rocks by Hydrothermal Alteration during Cu-Au Deposit Formation. Econ. Geol. 2010, 105, 763–776. [Google Scholar] [CrossRef]
- Schmandt, D.S.; Cook, N.J.; Ciobanu, C.L.; Ehrig, K.; Wade, B.P.; Gilbert, S.; Kamenetsky, V.S. Rare earth element fluorocarbonate minerals from the Olympic Dam Cu-U-Au-Ag deposit, South Australia. Minerals 2017, 7, 202. [Google Scholar] [CrossRef]
- Ciobanu, C.L.; Kontonikas-Charos, A.; Slattery, A.; Cook, N.J.; Ehrig, K.; Wade, B.P. Short-range stacking disorder in mixed-layer compounds: A HAADF STEM study of bastnäsite-parisite intergrowths. Minerals 2017, 7, 227. [Google Scholar] [CrossRef]
- Kontonikas-Charos, A.; Ciobanu, C.L.; Cook, N.J.; Ehrig, K.; Ismail, R.; Krneta, S.; Basak, A. Feldspar mineralogy and rare earth element (re)mobilization in iron-oxide copper gold systems from South Australia: A nanoscale study. Miner. Mag. 2018, 82, S173–S197. [Google Scholar] [CrossRef]
- Kolonin, G.R.; Shironosova, G.P. Influence of acidity–alkalinity of solutions On REE distribution during ore formation: Thermodynamic modeling. Dokl. Earth Sci. 2012, 443, 502–505. [Google Scholar] [CrossRef]
- Shironosova, G.P.; Kolonin, G.R. Thermodynamic modeling of REE partitioning between monazite, fluorite, and apatite. Dokl. Earth Sci. 2013, 450, 628–632. [Google Scholar] [CrossRef]
- Shironosova, G.P.; Kolonin, G.R.; Borovikov, A.A.; Borisenko, A.S. Thermodynamic modeling of REE behavior in oxidized hydrothermal fluids of high sulfate sulfur concentrations. Dokl. Earth Sci. 2016, 469, 855–859. [Google Scholar] [CrossRef]
Figure 1.
Crystal structure of apatite. (a) Atomic arrangement projected down to (001) (from Hughes [37]); (b,c) Environment of Me1 and Me2 sites, respectively, (from Luo et al. [38]). The different grey shadings of the PO4 tetrahedra show their orientation relative to projection planes.

Figure 2.
Chondrite-normalized REE-signatures of three apatite types hosted within the Olympic Dam mineralized system [17] used in the numerical modeling of partitioning between apatite and fluid. n refers to the number of laser-ablation inductively coupled plasma mass spectrometry analyses used to defining each mean trend. REE = Σ(REE + Y).

Figure 3.
(a) Measured (dashed line) and model (full lines) chondrite-normalized concentrations of REE; and (b) the corresponding calculated apatite/fluid partitioning coefficients D for each model.
Figure 3.
(a) Measured (dashed line) and model (full lines) chondrite-normalized concentrations of REE; and (b) the corresponding calculated apatite/fluid partitioning coefficients D for each model.

Figure 4.
Diagram showing the relative stabilities of Cu-Fe sulfides, Fe-oxides and K-feldspar-sericite. The various model scenarios are shown as colored circles demonstrating their agreement with the wider mineral assemblage [15,17].


Table 1.
REE concentrations (in ppm) of three apatite types hosted within the Olympic Dam mineralized system [15,17] used as examples in the numerical modeling of partitioning between apatite and fluid.
| Apatite in Altered Granite | Ore-Hosted Apatite | ||
|---|---|---|---|
| Deep Mineralization REE + Y-, S- and Cl-rich cores | Hematite-Sericite Altered | High-Grade Bornite Ore | |
| La | 1520 | 84 | 7 |
| Ce | 4192 | 258 | 49 |
| Pr | 504 | 47 | 17 |
| Nd | 1868 | 280 | 194 |
| Sm | 298 | 195 | 631 |
| Eu | 27 | 45 | 391 |
| Gd | 247 | 290 | 1217 |
| Tb | 32 | 32 | 97 |
| Dy | 187 | 125 | 365 |
| Ho | 37 | 16 | 49 |
| Er | 104 | 33 | 92 |
| Tm | 13 | 4 | 9 |
| Yb | 83 | 24 | 39 |
| Lu | 11 | 3 | 4 |
Table 2.
Numerical model fluid parameters and fluid chemistry.
| Case 1 Mt + Py + Cp K-Feldspar Stable | Case 2 Hm + Py + Cp Sericite Stable | Case 3 Hm + Bn Silicates Absent | ||||
|---|---|---|---|---|---|---|
| Model | 1.1 | 1.2 | 2.1 | 2.2 | 3.1 | 3.2 |
| O2 aq (log g) | −36.8 | −36.8 | −31.7 | −31.7 | −31.7 | −32 |
| H+ (pH) | 5.2 | 5.2 | 4.4 | 4.4 | 8.5 | 6.6 |
| NaCl (wt %) | 20 | 20 | 10 | 10 | 5 | 5 |
| Ca (wt %) | 0.61 | 3 | 0.37 | 4 | 1.06 | 3.5 |
| HCO3− (wt %) | 0.37 | 0.37 | 0.94 | 0.94 | 2.40 | 2.40 |
| F- (wt %) | 0.005 | 0.005 | 0.005 | 0.005 | 0.005 | 0.005 |
| SO4− (wt %) | 0.15 | 0.15 | 0.15 | 0.15 | 2.00 | 2.00 |
| Temperature (°C) | 300 | 300 | 300 | 300 | 300 | 300 |
| La (ppm) | 100 | 100 | 100 | 100 | 1200 | 1200 |
| Ce (ppm) | 200 | 200 | 200 | 200 | 1700 | 1700 |
| Pr (ppm) | 21 | 21 | 24 | 24 | 150 | 150 |
| Nd (ppm) | 70 | 70 | 80 | 80 | 393 | 393 |
| Sm (ppm) | 12.4 | 12.4 | 14 | 14 | 41.2 | 41.2 |
| Eu (ppm) | 1.7 | 1.7 | 1.9 | 1.9 | 12.4 | 12.4 |
| Gd (ppm) | 10.3 | 10.3 | 11.8 | 11.8 | 28 | 28 |
| Tb (ppm) | 1.6 | 1.6 | 1.7 | 1.7 | 3.4 | 3.4 |
| Dy (ppm) | 9.5 | 9.5 | 10.3 | 10.3 | 16.7 | 16.7 |
| Ho (ppm) | 1.9 | 1.9 | 2 | 2 | 3 | 3 |
| Er (ppm) | 5.7 | 5.7 | 6.1 | 6.1 | 9.1 | 9.1 |
| Tm (ppm) | 0.5 | 0.5 | 0.7 | 0.7 | 1.2 | 1.2 |
| Yb (ppm) | 5.6 | 5.6 | 6.3 | 6.3 | 8.6 | 8.6 |
| Lu (ppm) | 0.9 | 0.9 | 1.1 | 1.1 | 1.3 | 1.3 |
Table 3.
Percentages of REE activity represented within the model fluids as various complexes. Chloride complexes dominate LREE speciation in models 1.1 and 1.2. This proportion increases within models 2.1 and 2.2, in which Cl complexes increasingly represent all REE. Models 3.1 and 3.2 are entirely dominated by oxide and hydroxide species. REE–SO4 species are absent in most models and only minor constituents in models that assume very high SO4 concentrations (~2 wt %).
| % of REE Activity as Cl Complexes | Proportion of REE Activity as Oxide and OH− Complexes | |||||||||||
| Model | 1.1 | 1.2 | 2.1 | 2.2 | 3.1 | 3.2 | 1.1 | 1.2 | 2.1 | 2.2 | 3.1 | 3.2 |
| La | 91.9 | 94.0 | 97.5 | 99.1 | 0 | 3.5 × 10⁻³ | 6.21 | 4.57 | 0.20 | 0.11 | 100 | 100 |
| Ce | 63.7 | 70.8 | 93.8 | 97.1 | 1.2 × 10⁻¹⁰ | 4.9 × 10⁻⁴ | 31.7 | 27.0 | 1.89 | 1.09 | 100 | 100 |
| Pr | 67.0 | 73.6 | 96.1 | 98.2 | 0 | 1.6 × 10⁻⁴ | 29.6 | 25.0 | 1.67 | 0.97 | 100 | 100 |
| Nd | 30.7 | 36.9 | 84.6 | 92.6 | 0 | 2.9 × 10⁻⁵ | 65.3 | 61.9 | 6.01 | 4.39 | 100 | 100 |
| Sm | 10.2 | 13.1 | 64.5 | 79.7 | 0 | 1.7 × 10⁻⁶ | 85.5 | 84.8 | 12.9 | 10.4 | 100 | 100 |
| Eu | 100 | 100 | 100 | 100 | 0 | 0 | 0 | 0 | 0 | 0 | 100 | 100 |
| Gd | 13.3 | 18.3 | 57.3 | 77.1 | 0 | 1.7 × 10⁻⁶ | 72.4 | 73.9 | 7.40 | 5.32 | 100 | 100 |
| Tb | 5.04 | 7.65 | 34.4 | 58.8 | 0 | 7.4 × 10⁻⁷ | 79.4 | 83.8 | 8.49 | 8.37 | 100 | 100 |
| Dy | 5.96 | 2.02 | 30.3 | 56.0 | 0 | 5.1 × 10⁻⁷ | 69.3 | 83.4 | 5.36 | 5.05 | 100 | 100 |
| Ho | 7.82 | 6.79 | 31.2 | 56.5 | 0 | 4.7 × 10⁻⁷ | 75.2 | 83.8 | 7.85 | 7.24 | 100 | 100 |
| Er | 1.06 | 1.47 | 16.4 | 34.7 | 0 | 0 | 89.1 | 93.3 | 12.3 | 13.6 | 100 | 100 |
| Tm | 1.30 | 1.80 | 3.72 | 36.0 | 0 | 8.4 × 10⁻⁸ | 91.8 | 95.2 | 17.8 | 47.9 | 100 | 100 |
| Yb | 0.60 | 0.82 | 11.2 | 26.7 | 0 | 0 | 93.4 | 97.2 | 20.5 | 24.5 | 100 | 100 |
| Lu | 0.18 | 0.25 | 3.01 | 6.51 | 0 | 0 | 88.7 | 94.1 | 14.0 | 30.7 | 100 | 100 |
| % of REE Activity as F Complexes | Proportion of REE Activity as SO4 Complexes | |||||||||||
| Model | 1.1 | 1.2 | 2.1 | 2.2 | 3.1 | 3.2 | 1.1 | 1.2 | 2.1 | 2.2 | 3.1 | 3.2 |
| La | 1.85 | 1.38 | 1.94 | 0.74 | 2.3 × 10⁻⁸ | 0 | 0 | 0 | 0.38 | 0.10 | 3.3 × 10⁻⁹ | 1.5 × 10⁻⁴ |
| Ce | 4.54 | 2.21 | 4.28 | 1.76 | 3.1 × 10⁻⁹ | 7.9 × 10⁻¹⁰ | 0 | 0 | 0 | 0 | 0 | 0 |
| Pr | 3.44 | 1.42 | 2.19 | 0.83 | 4.2 × 10⁻¹⁰ | 0 | 0 | 0 | 0 | 0 | 0 | 0 |
| Nd | 4.02 | 1.20 | 5.76 | 2.00 | 1.5 × 10⁻¹⁰ | 1.2 × 10⁻¹⁰ | 0 | 0 | 3.59 | 1.04 | 7.5 × 10⁻¹¹ | 1.3 × 10⁻⁵ |
| Sm | 4.34 | 2.09 | 18.4 | 8.57 | 1.9 × 10⁻¹¹ | 0 | 0 | 0 | 4.17 | 1.34 | 6.5 × 10⁻¹² | 1.4 × 10⁻⁶ |
| Eu | 0 | 0 | 0 | 0 | 0 | 0 | 0 | 0 | 0 | 0 | 0 | 0 |
| Gd | 14.3 | 7.77 | 35.3 | 17.5 | 7.5 × 10⁻¹¹ | 2.9 × 10⁻¹⁰ | 0 | 0 | 0 | 0 | 0 | 0 |
| Tb | 15.5 | 8.60 | 53.8 | 32.8 | 8.5 × 10⁻¹¹ | 4.4 × 10⁻¹⁰ | 0 | 0 | 3.38 | 0 | 2.9 × 10⁻¹² | 0 |
| Dy | 24.7 | 14.6 | 62.7 | 38.9 | 1.1 × 10⁻¹⁰ | 3.5 × 10⁻¹⁰ | 0 | 0 | 1.73 | 0 | 1.7 × 10⁻¹² | 0 |
| Ho | 17.0 | 9.41 | 59.2 | 36.3 | 8.6 × 10⁻¹¹ | 1.1 × 10⁻¹⁰ | 0 | 0 | 1.76 | 0 | 1.5 × 10⁻¹² | 0 |
| Er | 9.81 | 5.19 | 69.7 | 51.7 | 2.5 × 10⁻¹¹ | 7.2 × 10⁻¹¹ | 0 | 0 | 1.59 | 0 | 3.5 × 10⁻¹³ | 7.7 × 10⁻⁸ |
| Tm | 6.89 | 2.96 | 74.2 | 10.7 | 2.7 × 10⁻¹¹ | 8.2 × 10⁻¹¹ | 0 | 0 | 4.32 | 5.34 | 4.0 × 10⁻¹³ | 8.7 × 10⁻⁸ |
| Yb | 5.96 | 1.96 | 66.6 | 48.8 | 1.7 × 10⁻¹¹ | 5.5 × 10⁻¹⁰ | 0 | 0 | 1.69 | 0 | 3.5 × 10⁻¹³ | 7.7 × 10⁻⁸ |
| Lu | 11.1 | 5.68 | 82.3 | 62.8 | 3.1 × 10⁻¹¹ | 1.2 × 10⁻¹⁰ | 0 | 0 | 0.68 | 0 | 0 | 2.8 × 10⁻⁸ |
© 2018 by the authors. Licensee MDPI, Basel, Switzerland. This article is an open access article distributed under the terms and conditions of the Creative Commons Attribution (CC BY) license (http://creativecommons.org/licenses/by/4.0/).
Share and Cite
MDPI and ACS Style
Krneta, S.; Ciobanu, C.L.; Cook, N.J.; Ehrig, K.J. Numerical Modeling of REE Fractionation Patterns in Fluorapatite from the Olympic Dam Deposit (South Australia). Minerals 2018, 8, 342. https://doi.org/10.3390/min8080342
AMA Style
Krneta S, Ciobanu CL, Cook NJ, Ehrig KJ. Numerical Modeling of REE Fractionation Patterns in Fluorapatite from the Olympic Dam Deposit (South Australia). Minerals. 2018; 8(8):342. https://doi.org/10.3390/min8080342
Chicago/Turabian StyleKrneta, Sasha, Cristiana L. Ciobanu, Nigel J. Cook, and Kathy J. Ehrig. 2018. "Numerical Modeling of REE Fractionation Patterns in Fluorapatite from the Olympic Dam Deposit (South Australia)" Minerals 8, no. 8: 342. https://doi.org/10.3390/min8080342
Note that from the first issue of 2016, this journal uses article numbers instead of page numbers. See further details here.