Eogenetic Karst Control of Carbonate Reservoirs during a Transient Exposure: A Case Study of the Ordovician Yingshan Formation in the Northern Slope of the Tazhong Uplift, Tarim Basin, China

Abstract
:1. Introduction
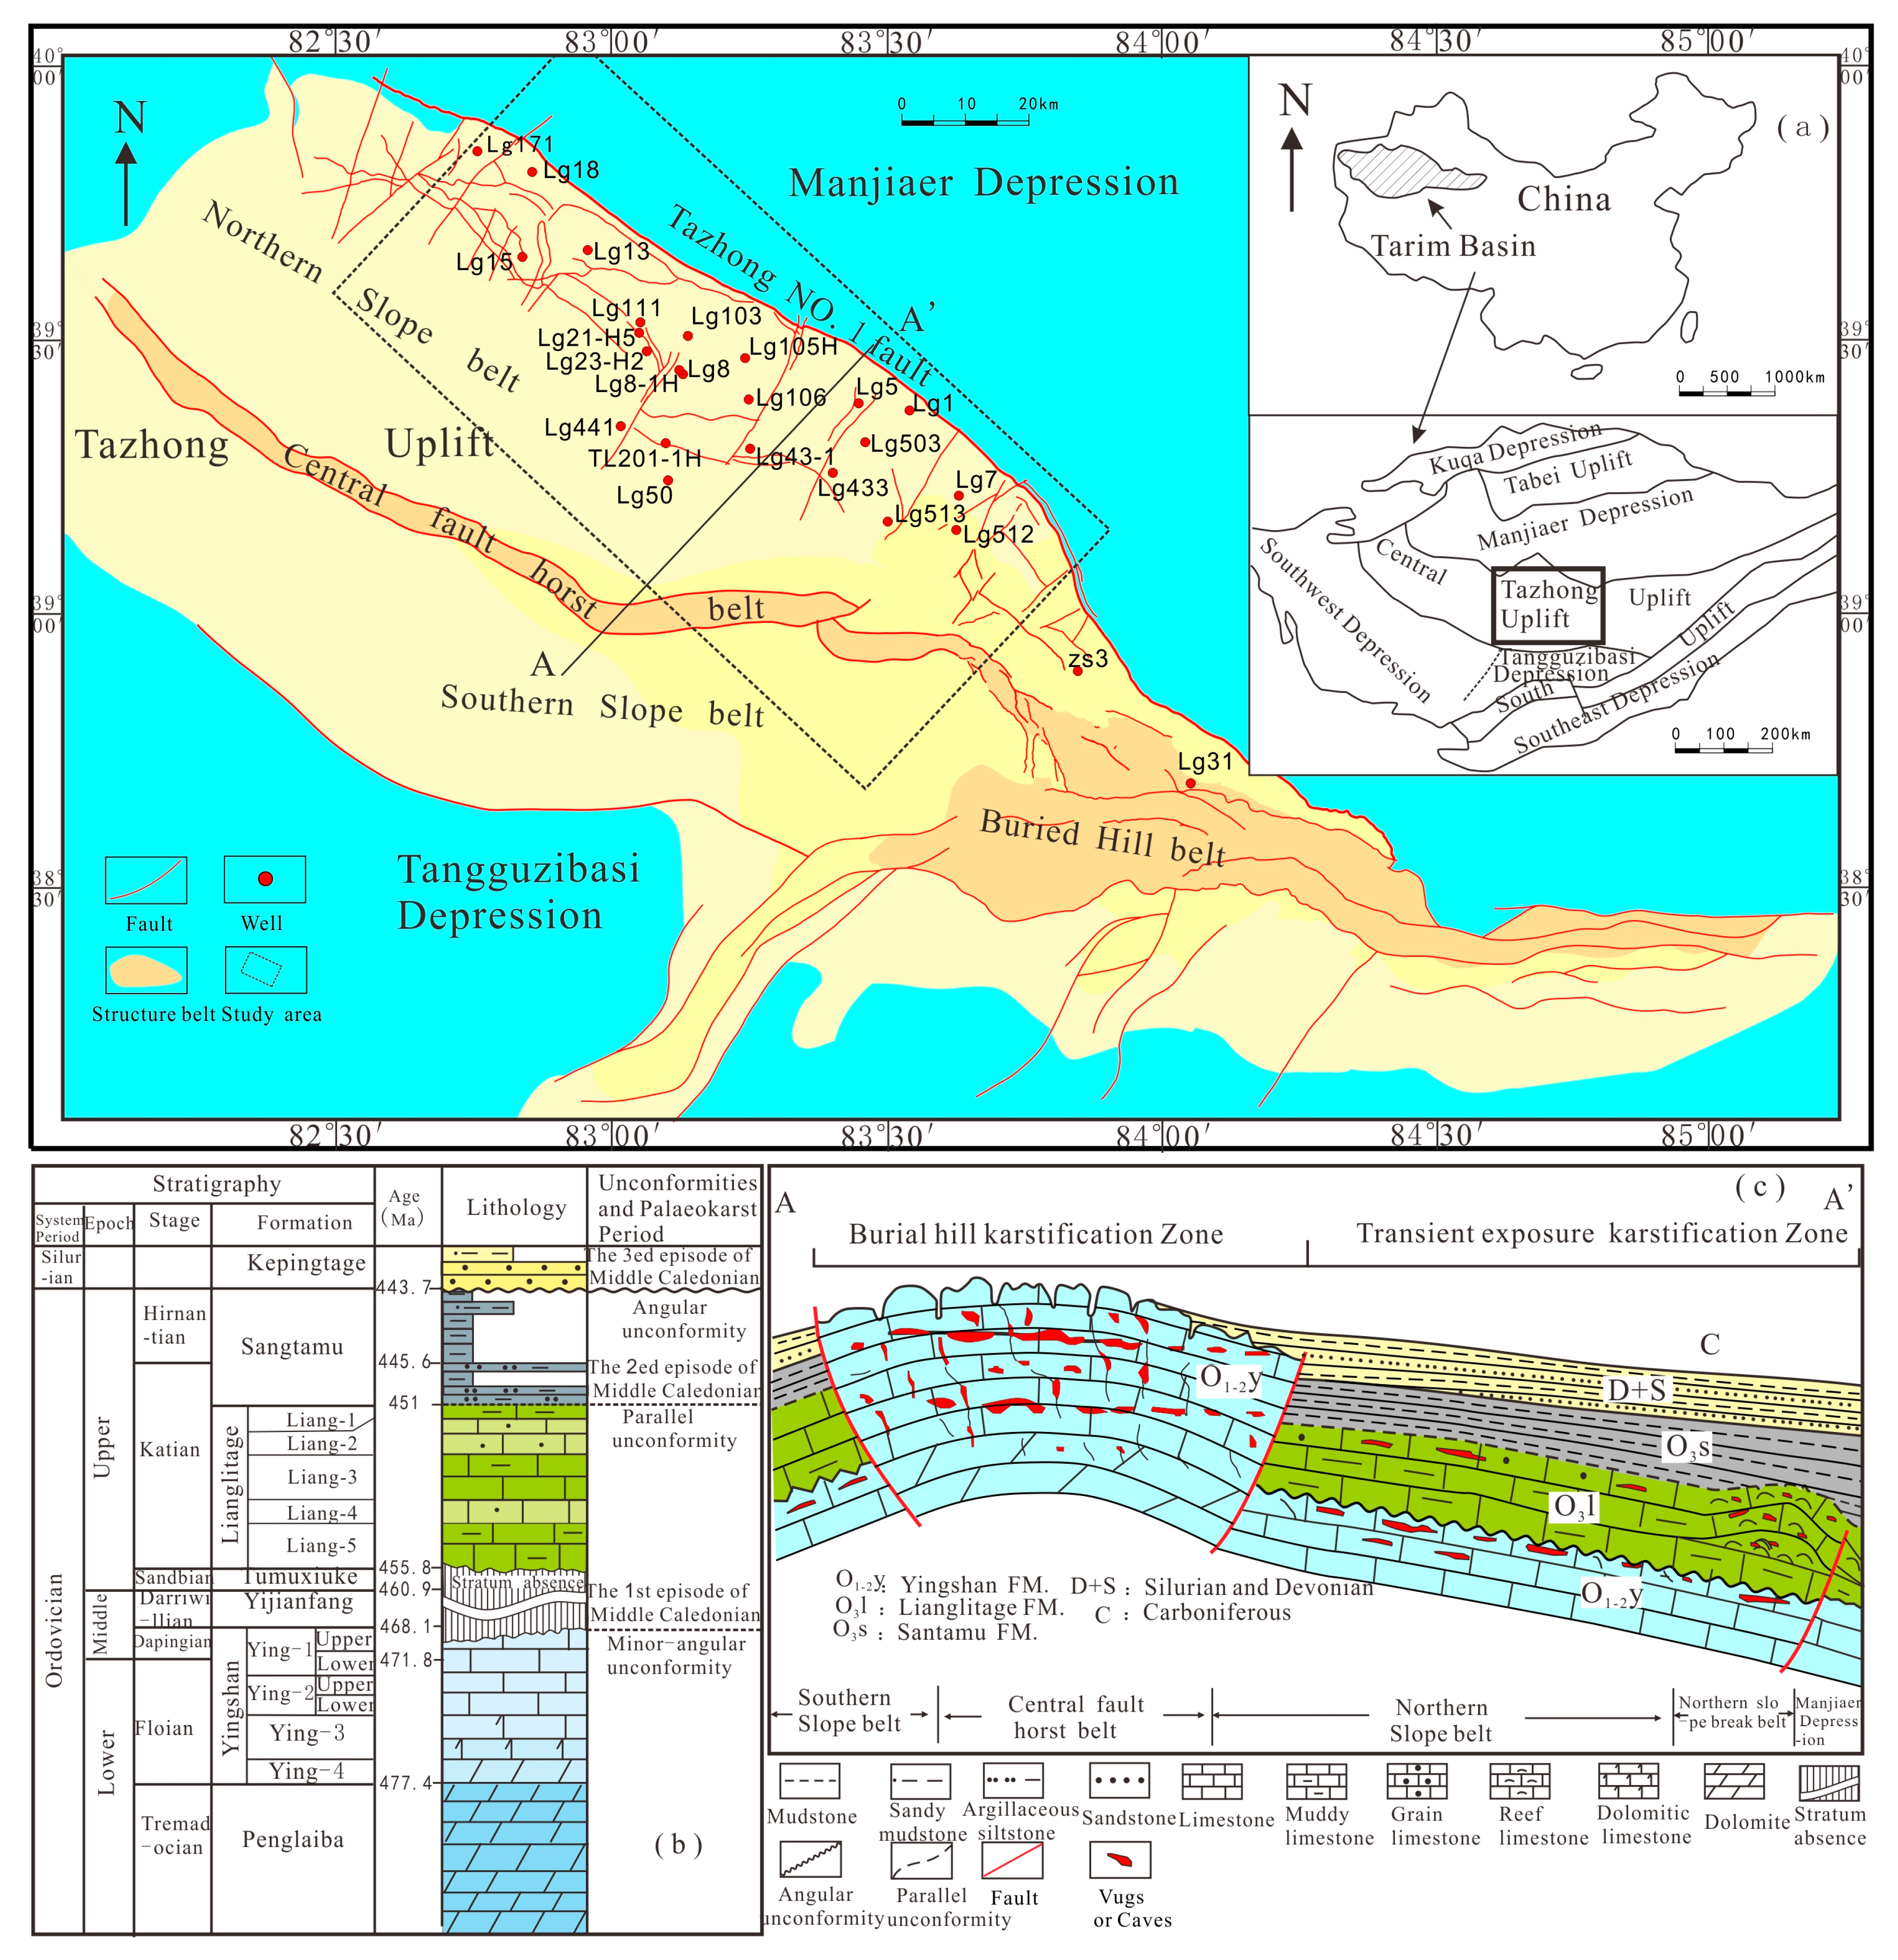
2. Geologic Setting
3. Methods
3.1. Rock Thin-Section Preparation and Identification
3.2. Cathode Luminescence Analysis
3.3. Electron Microprobe Analysis
4. Paleokarst Characteristics
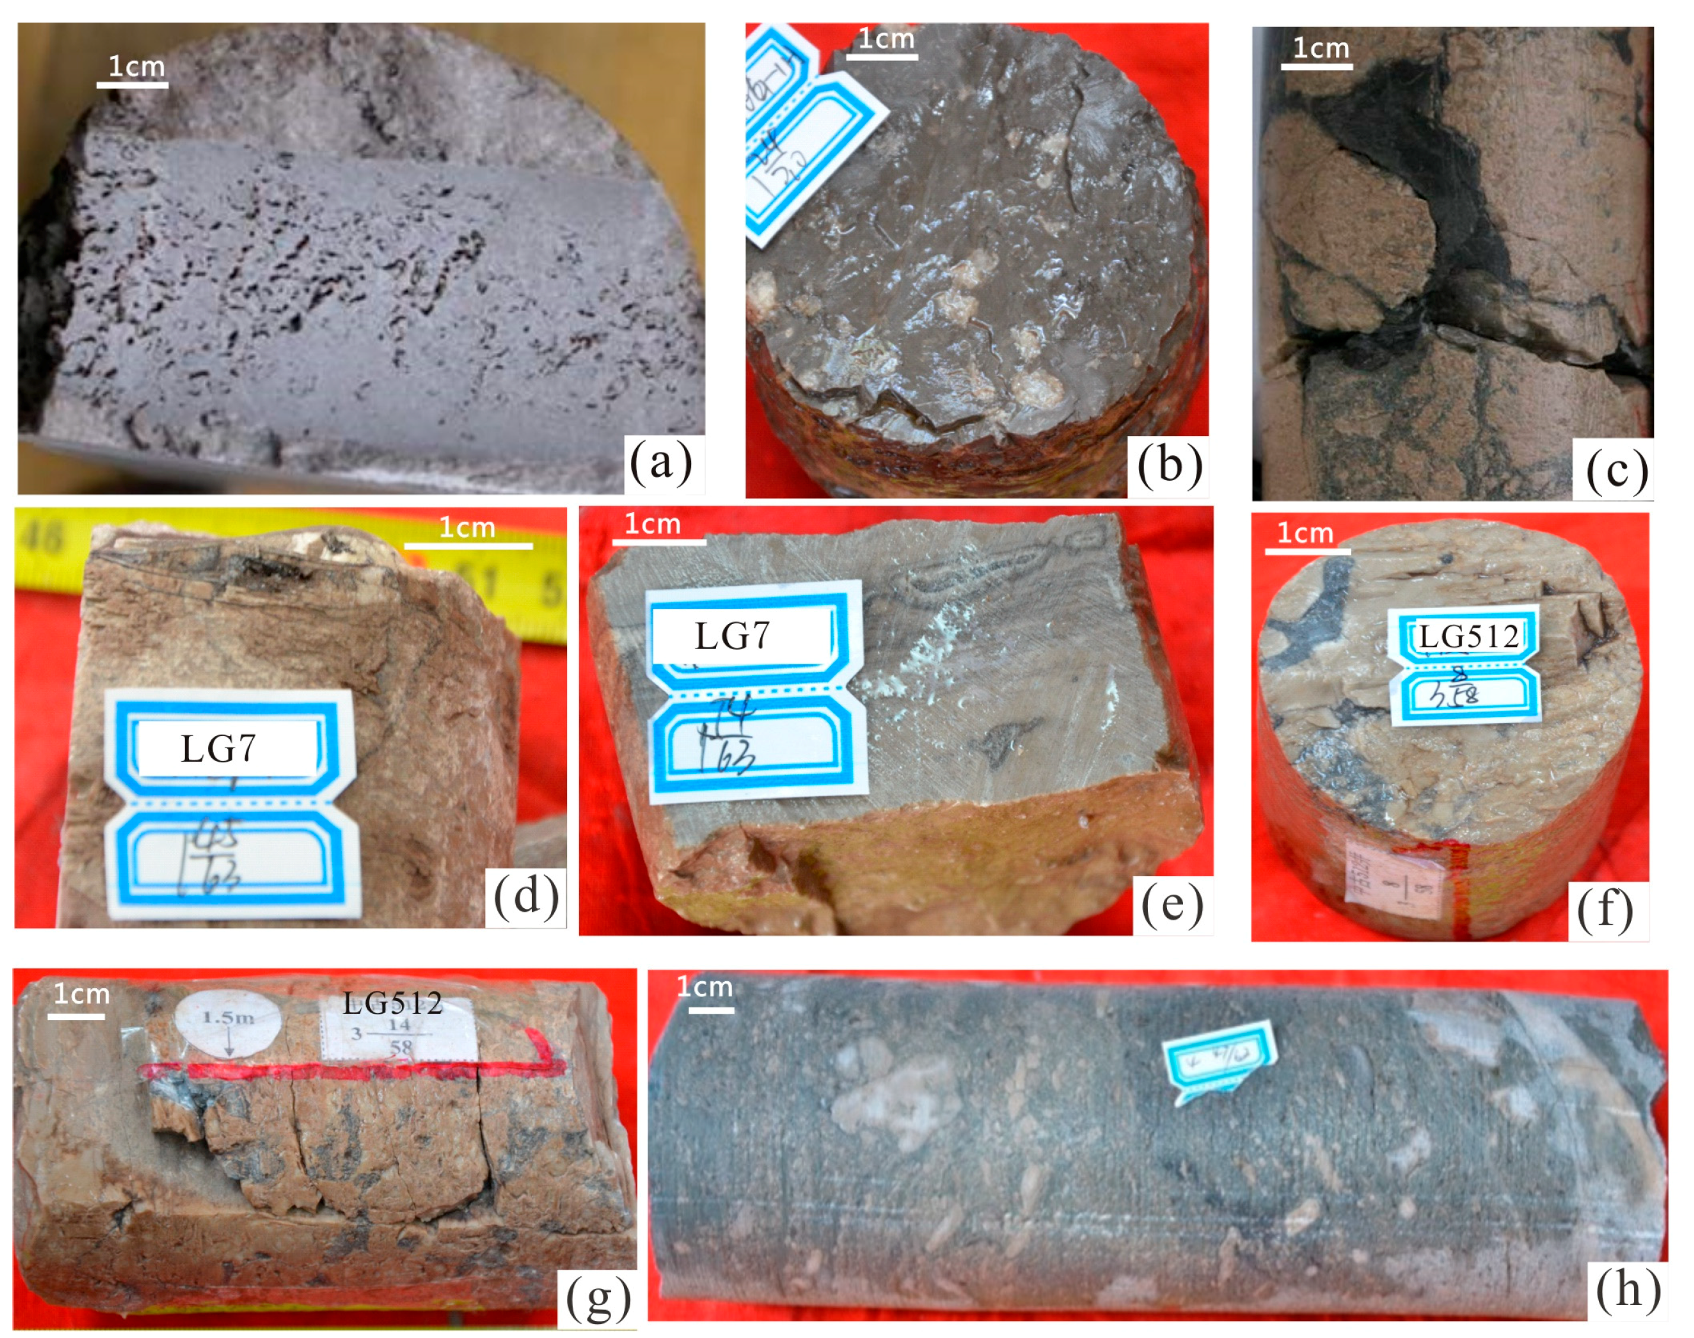
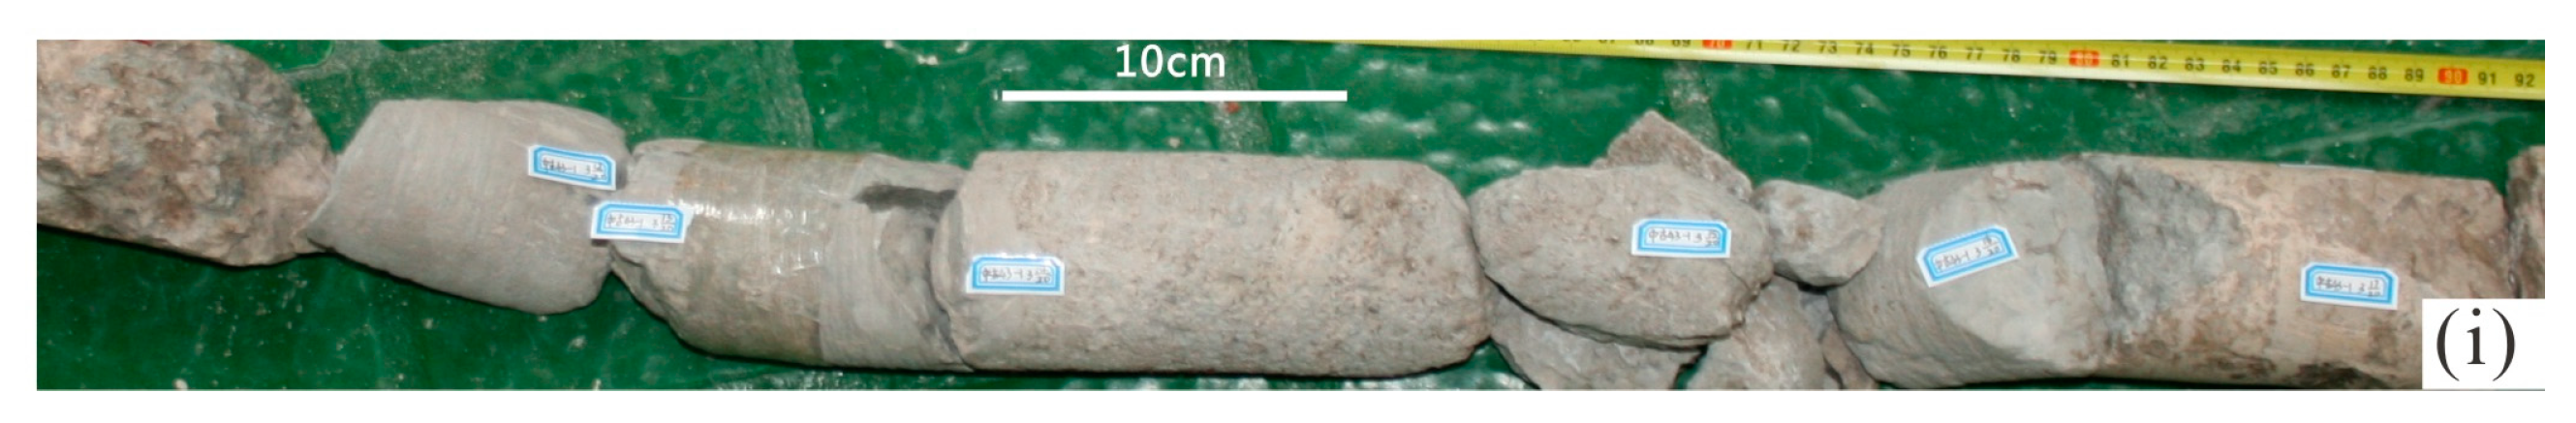
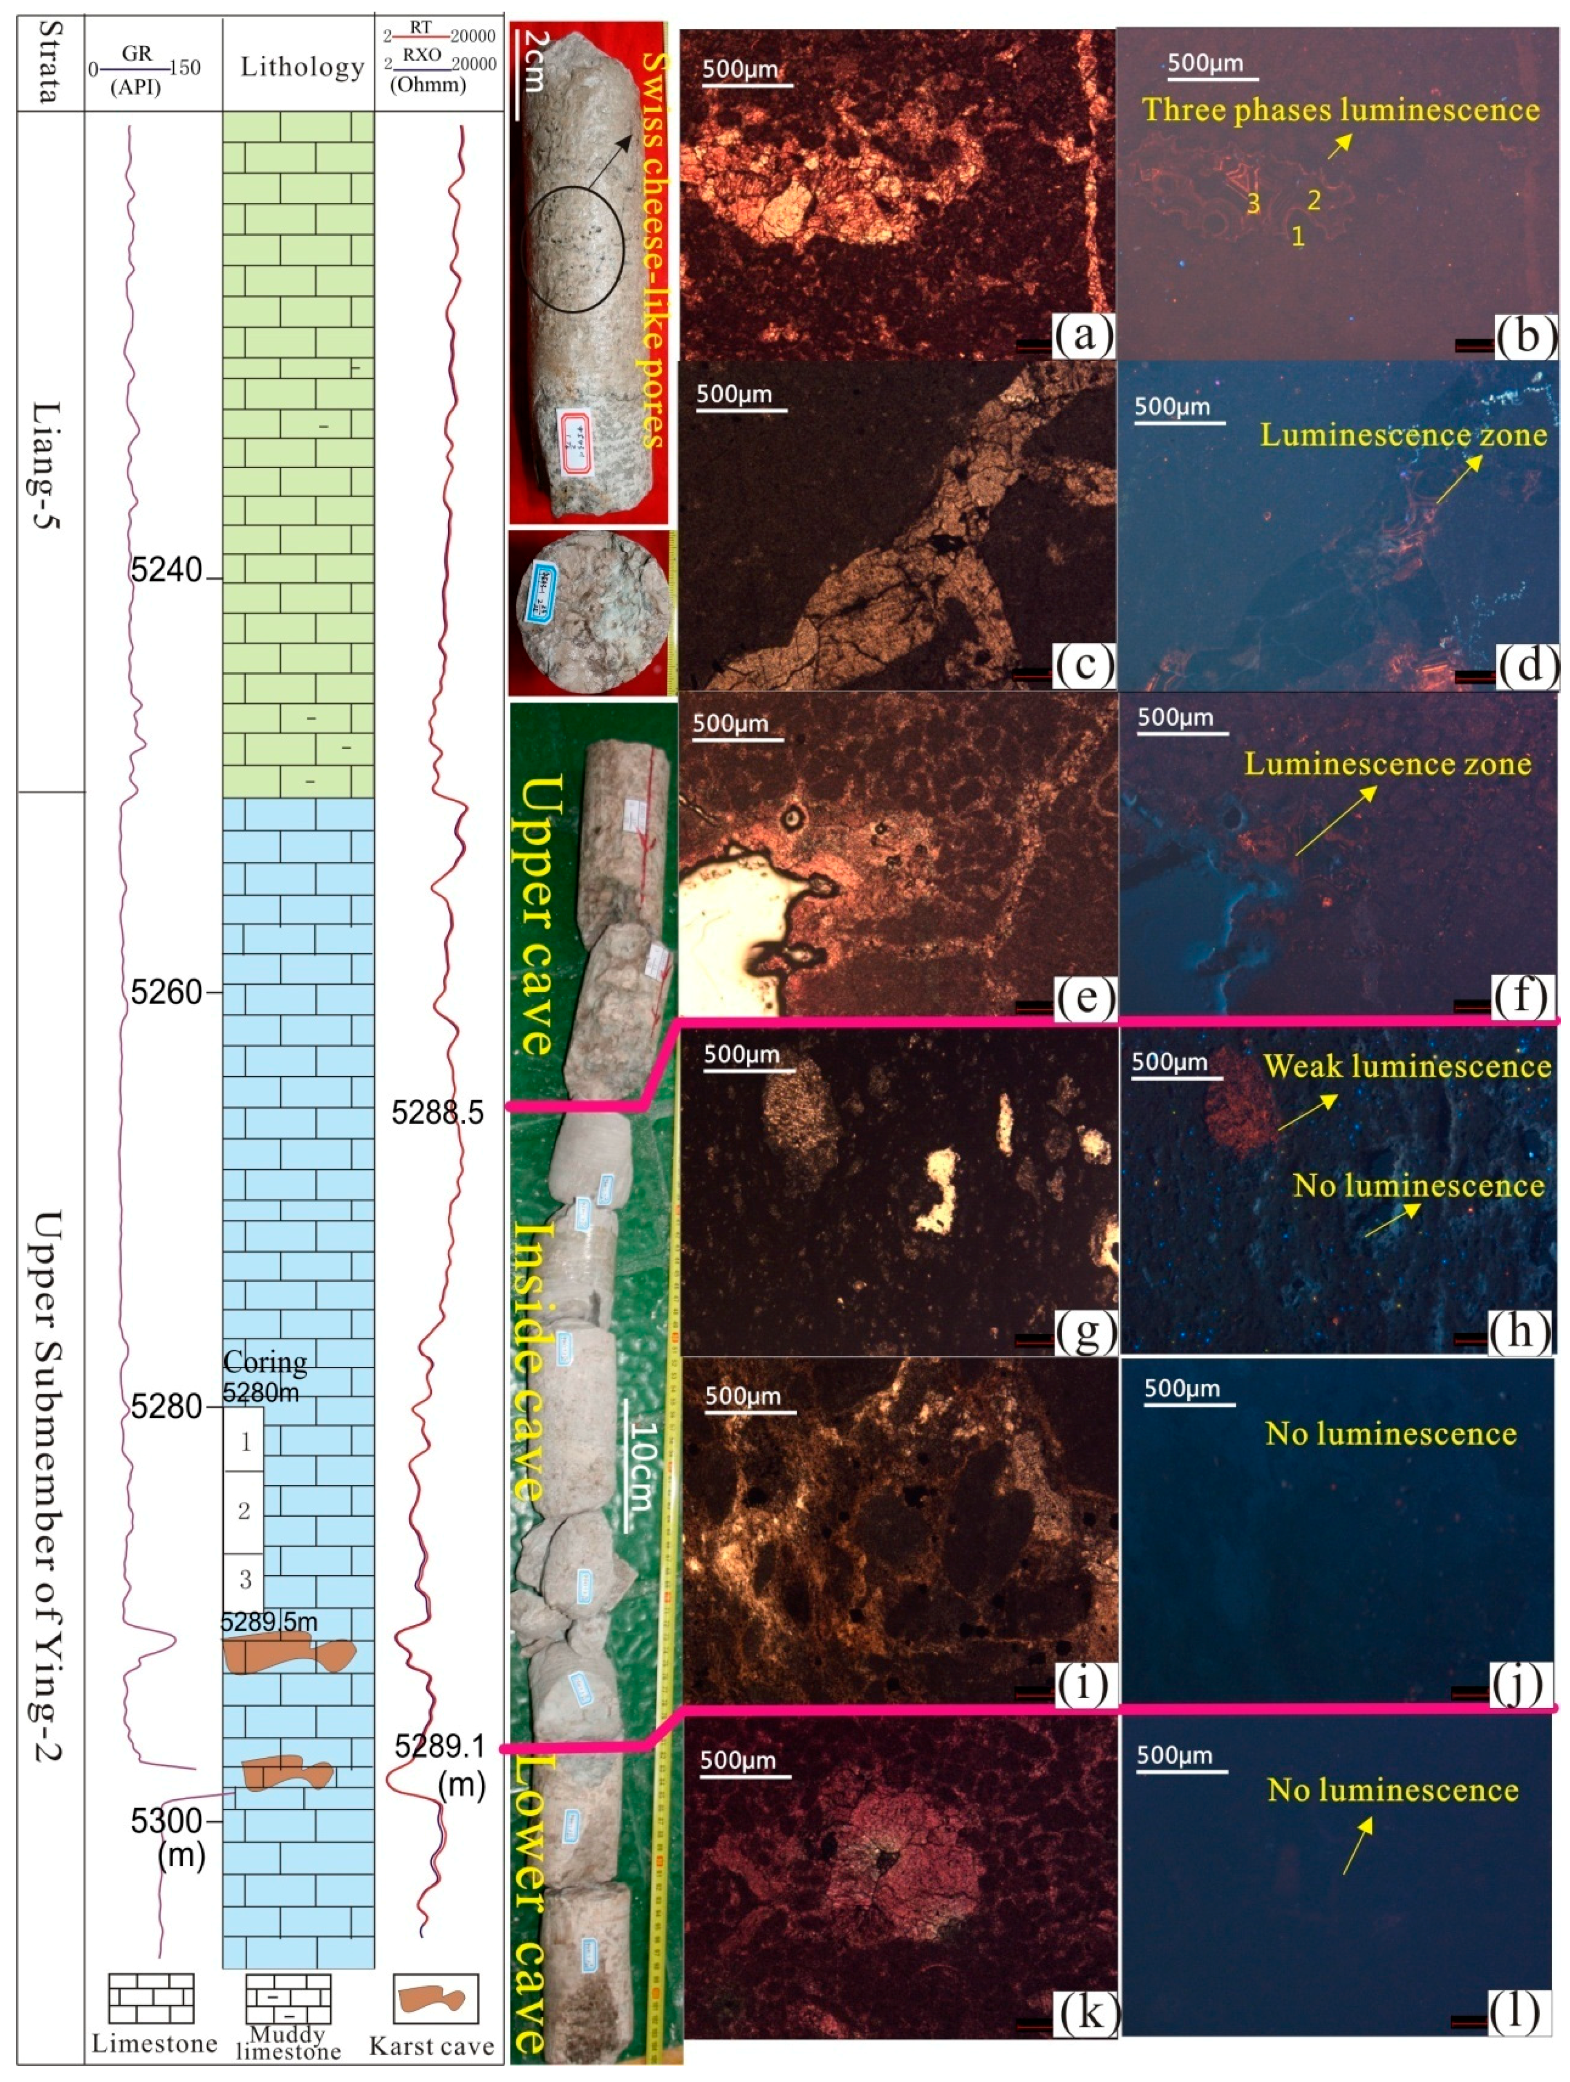
4.1. Dissolution Characteristics in the Core
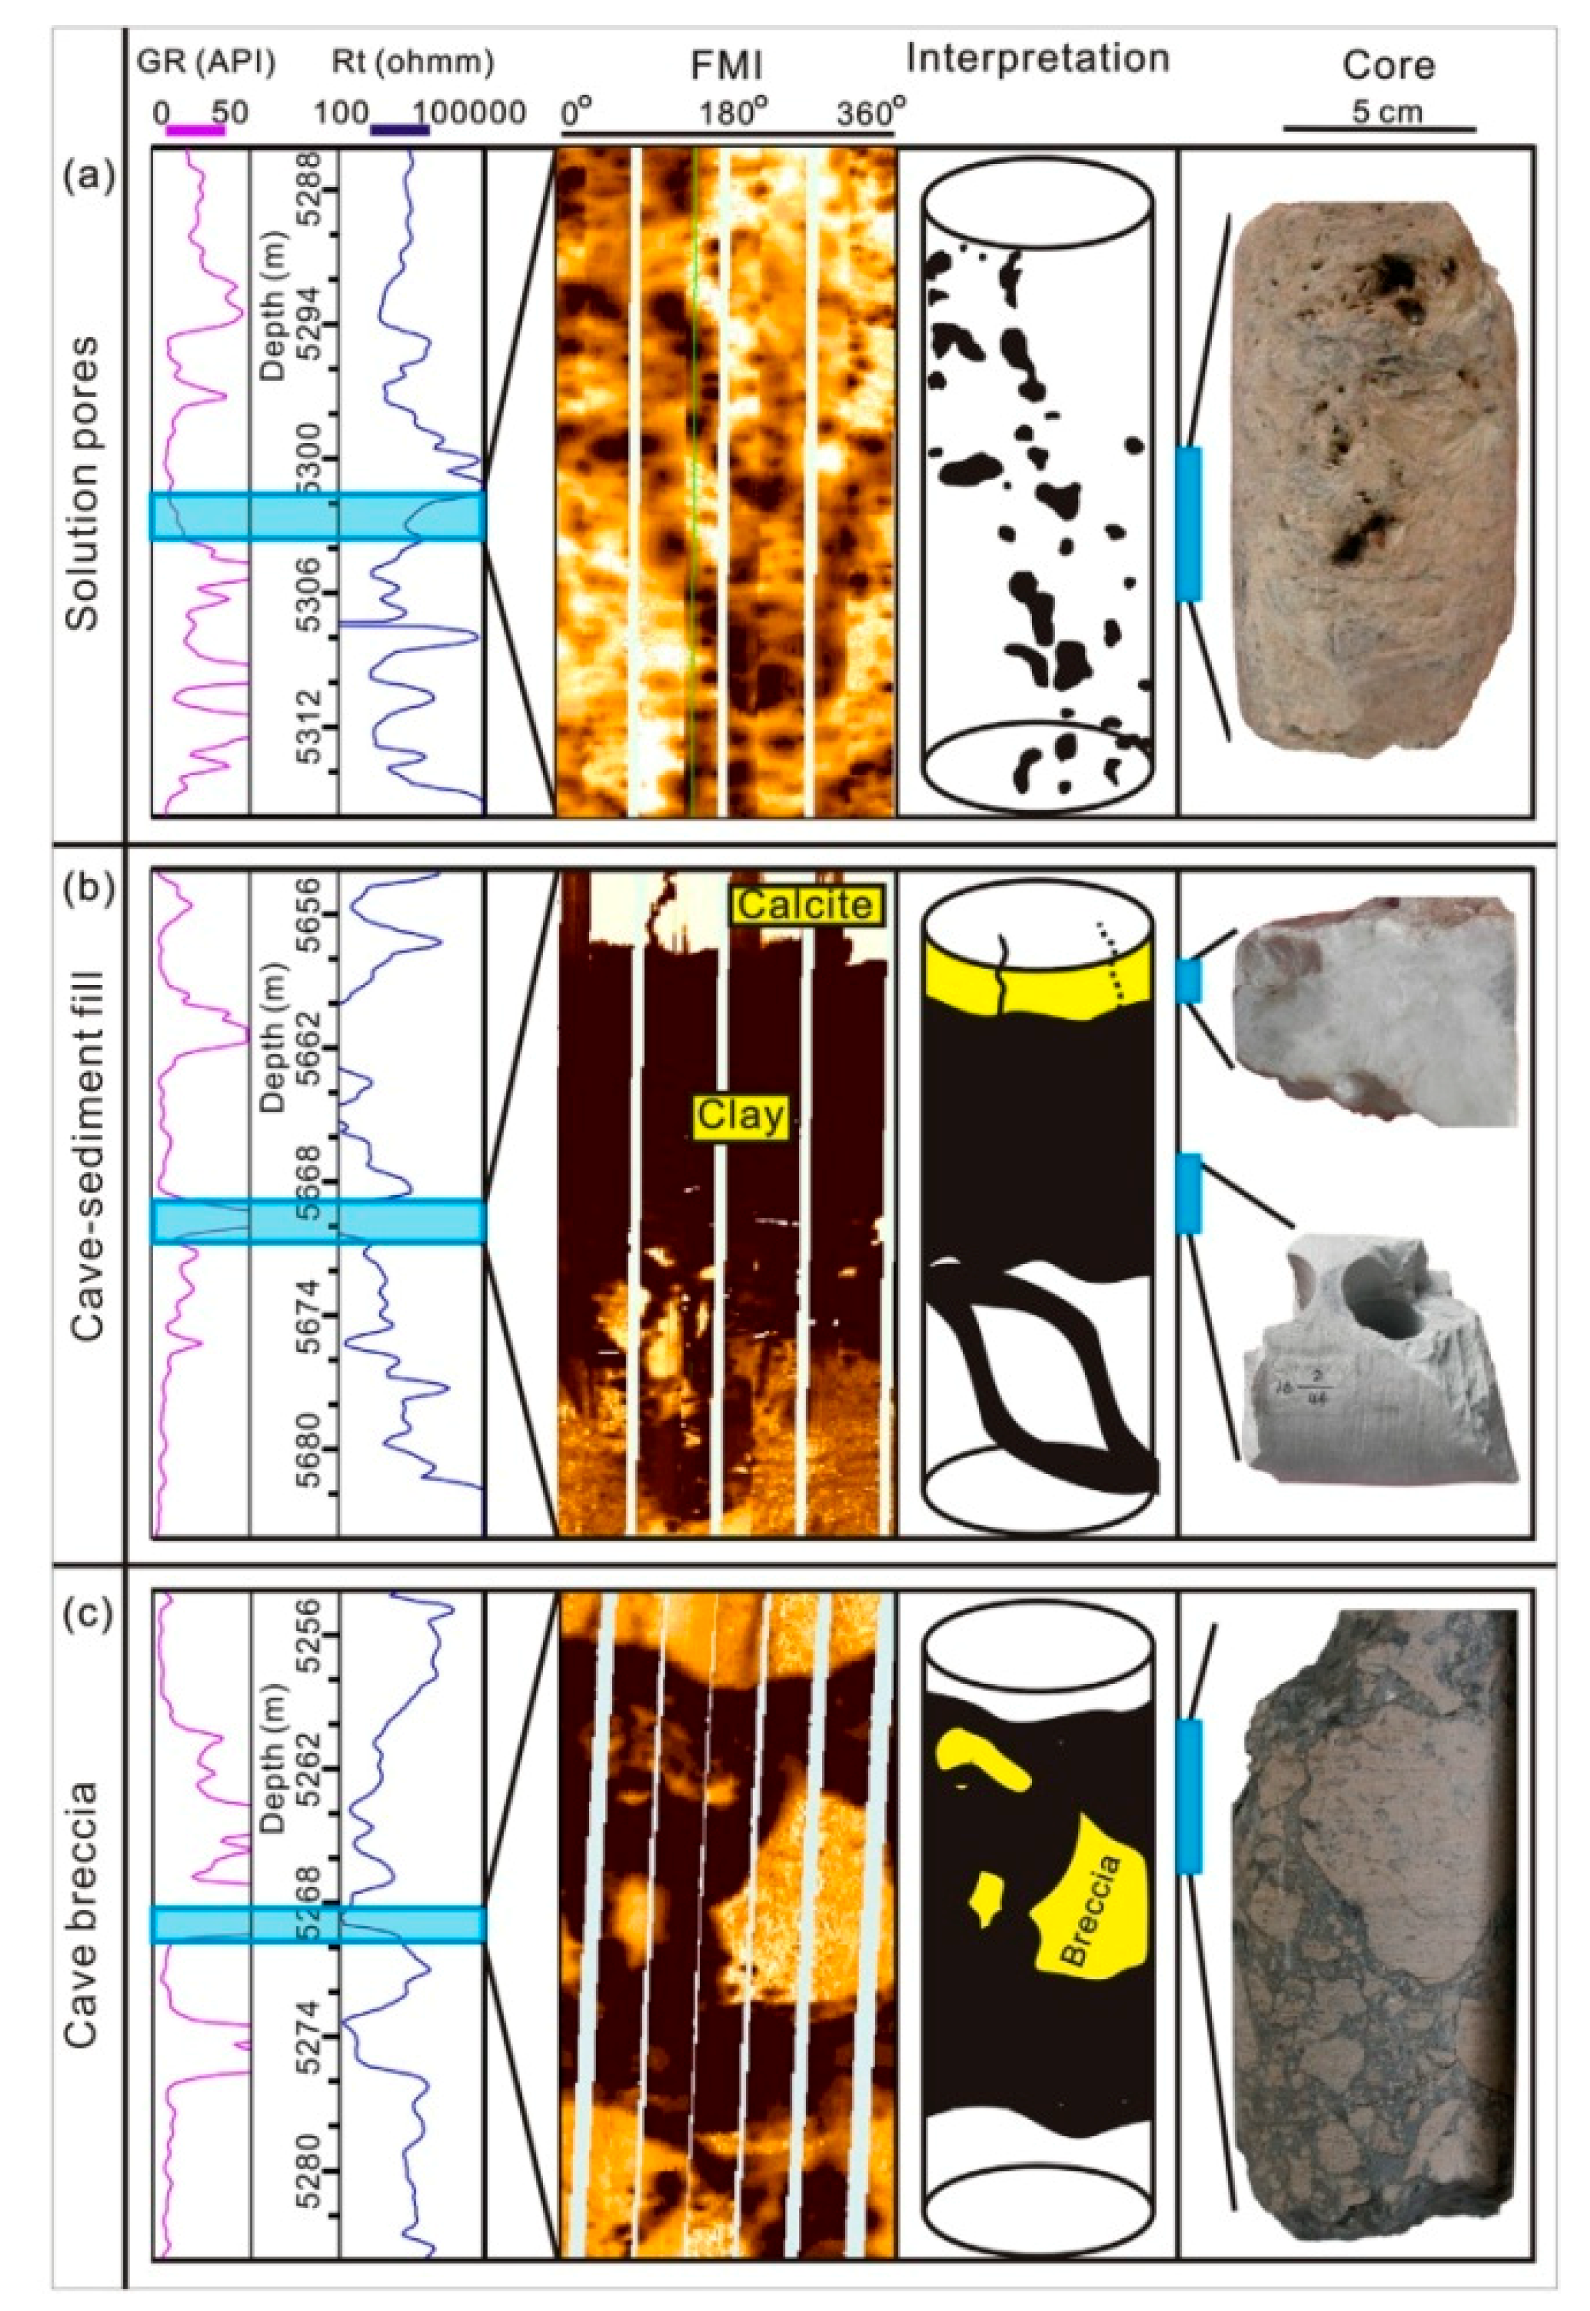
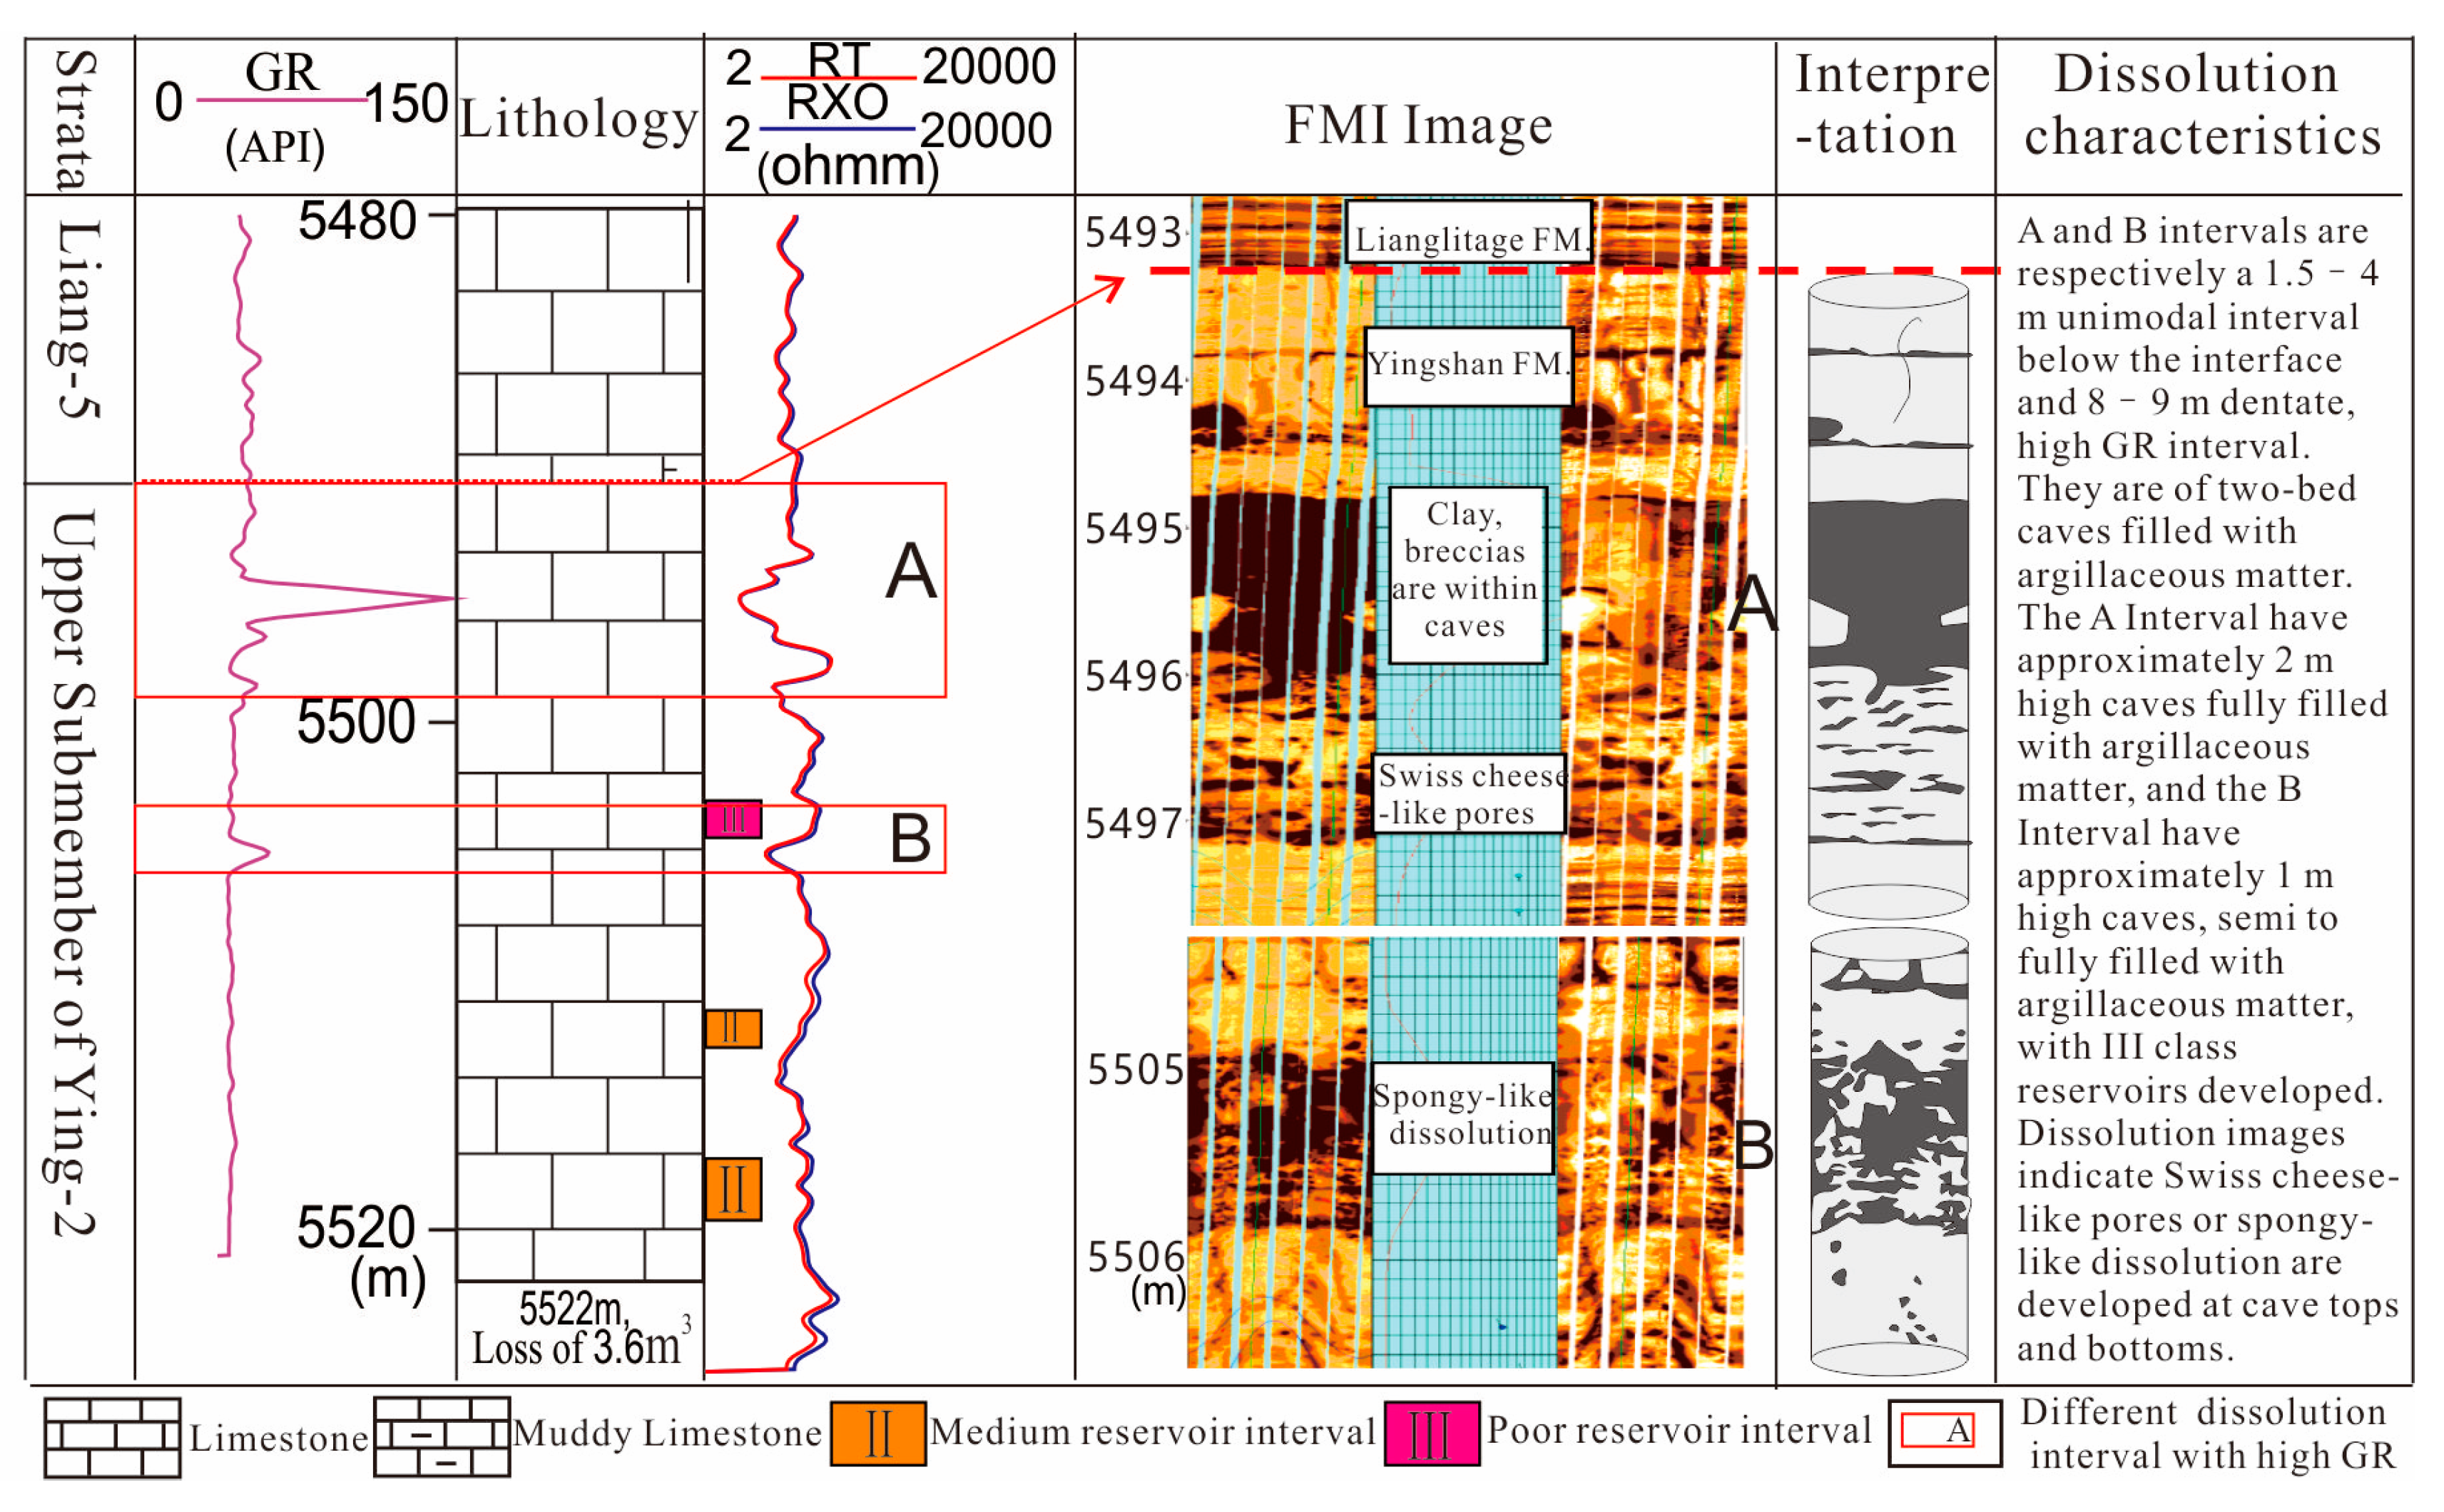
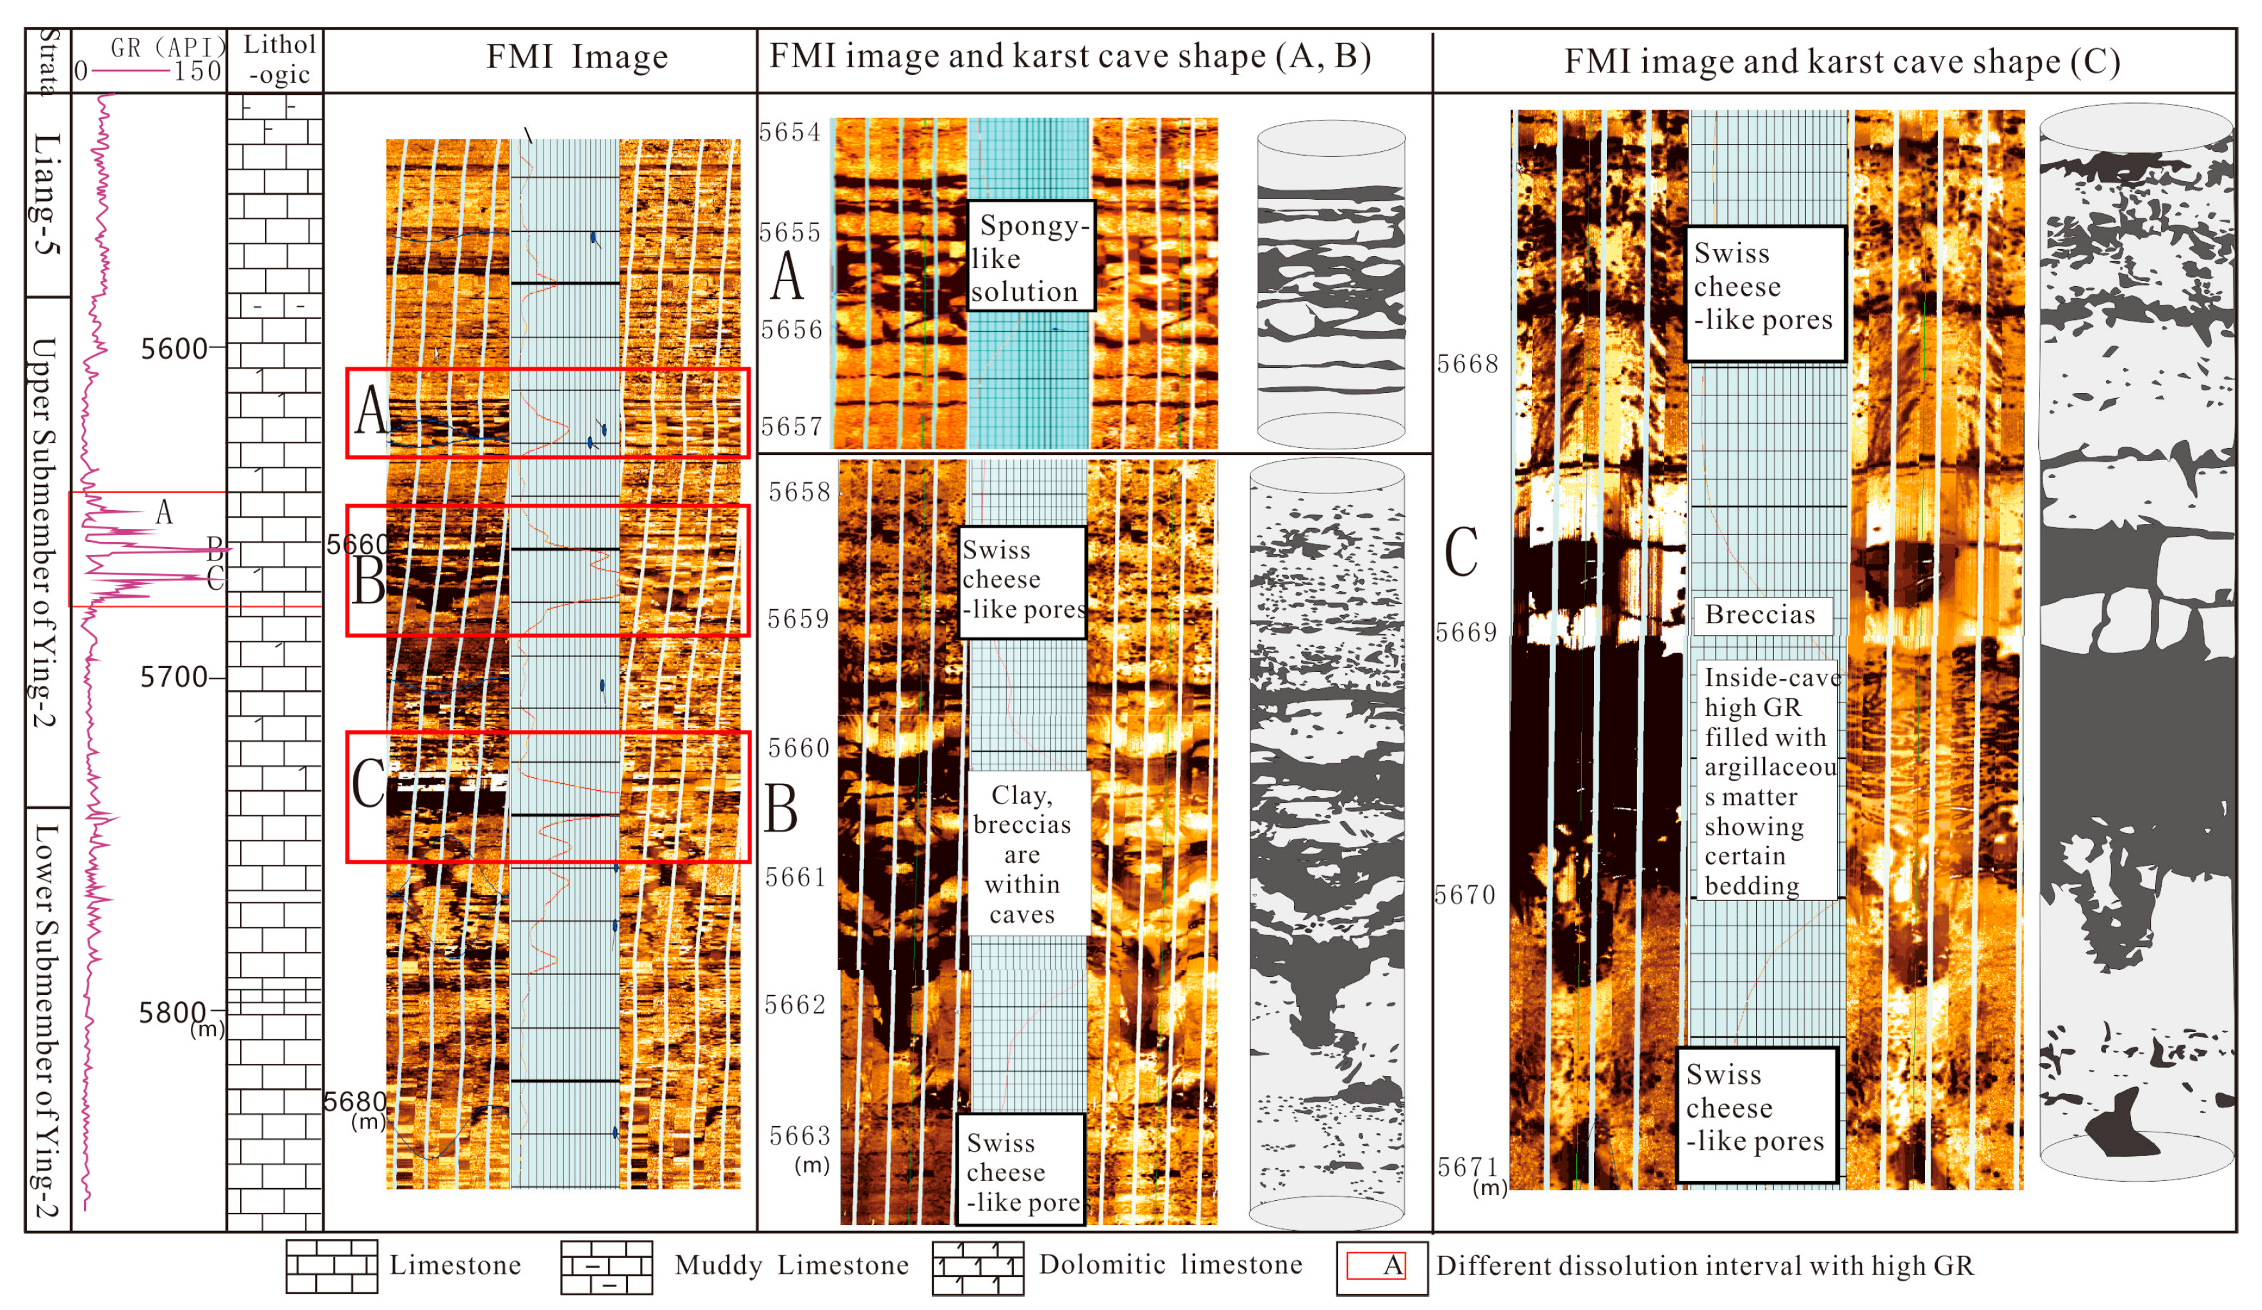
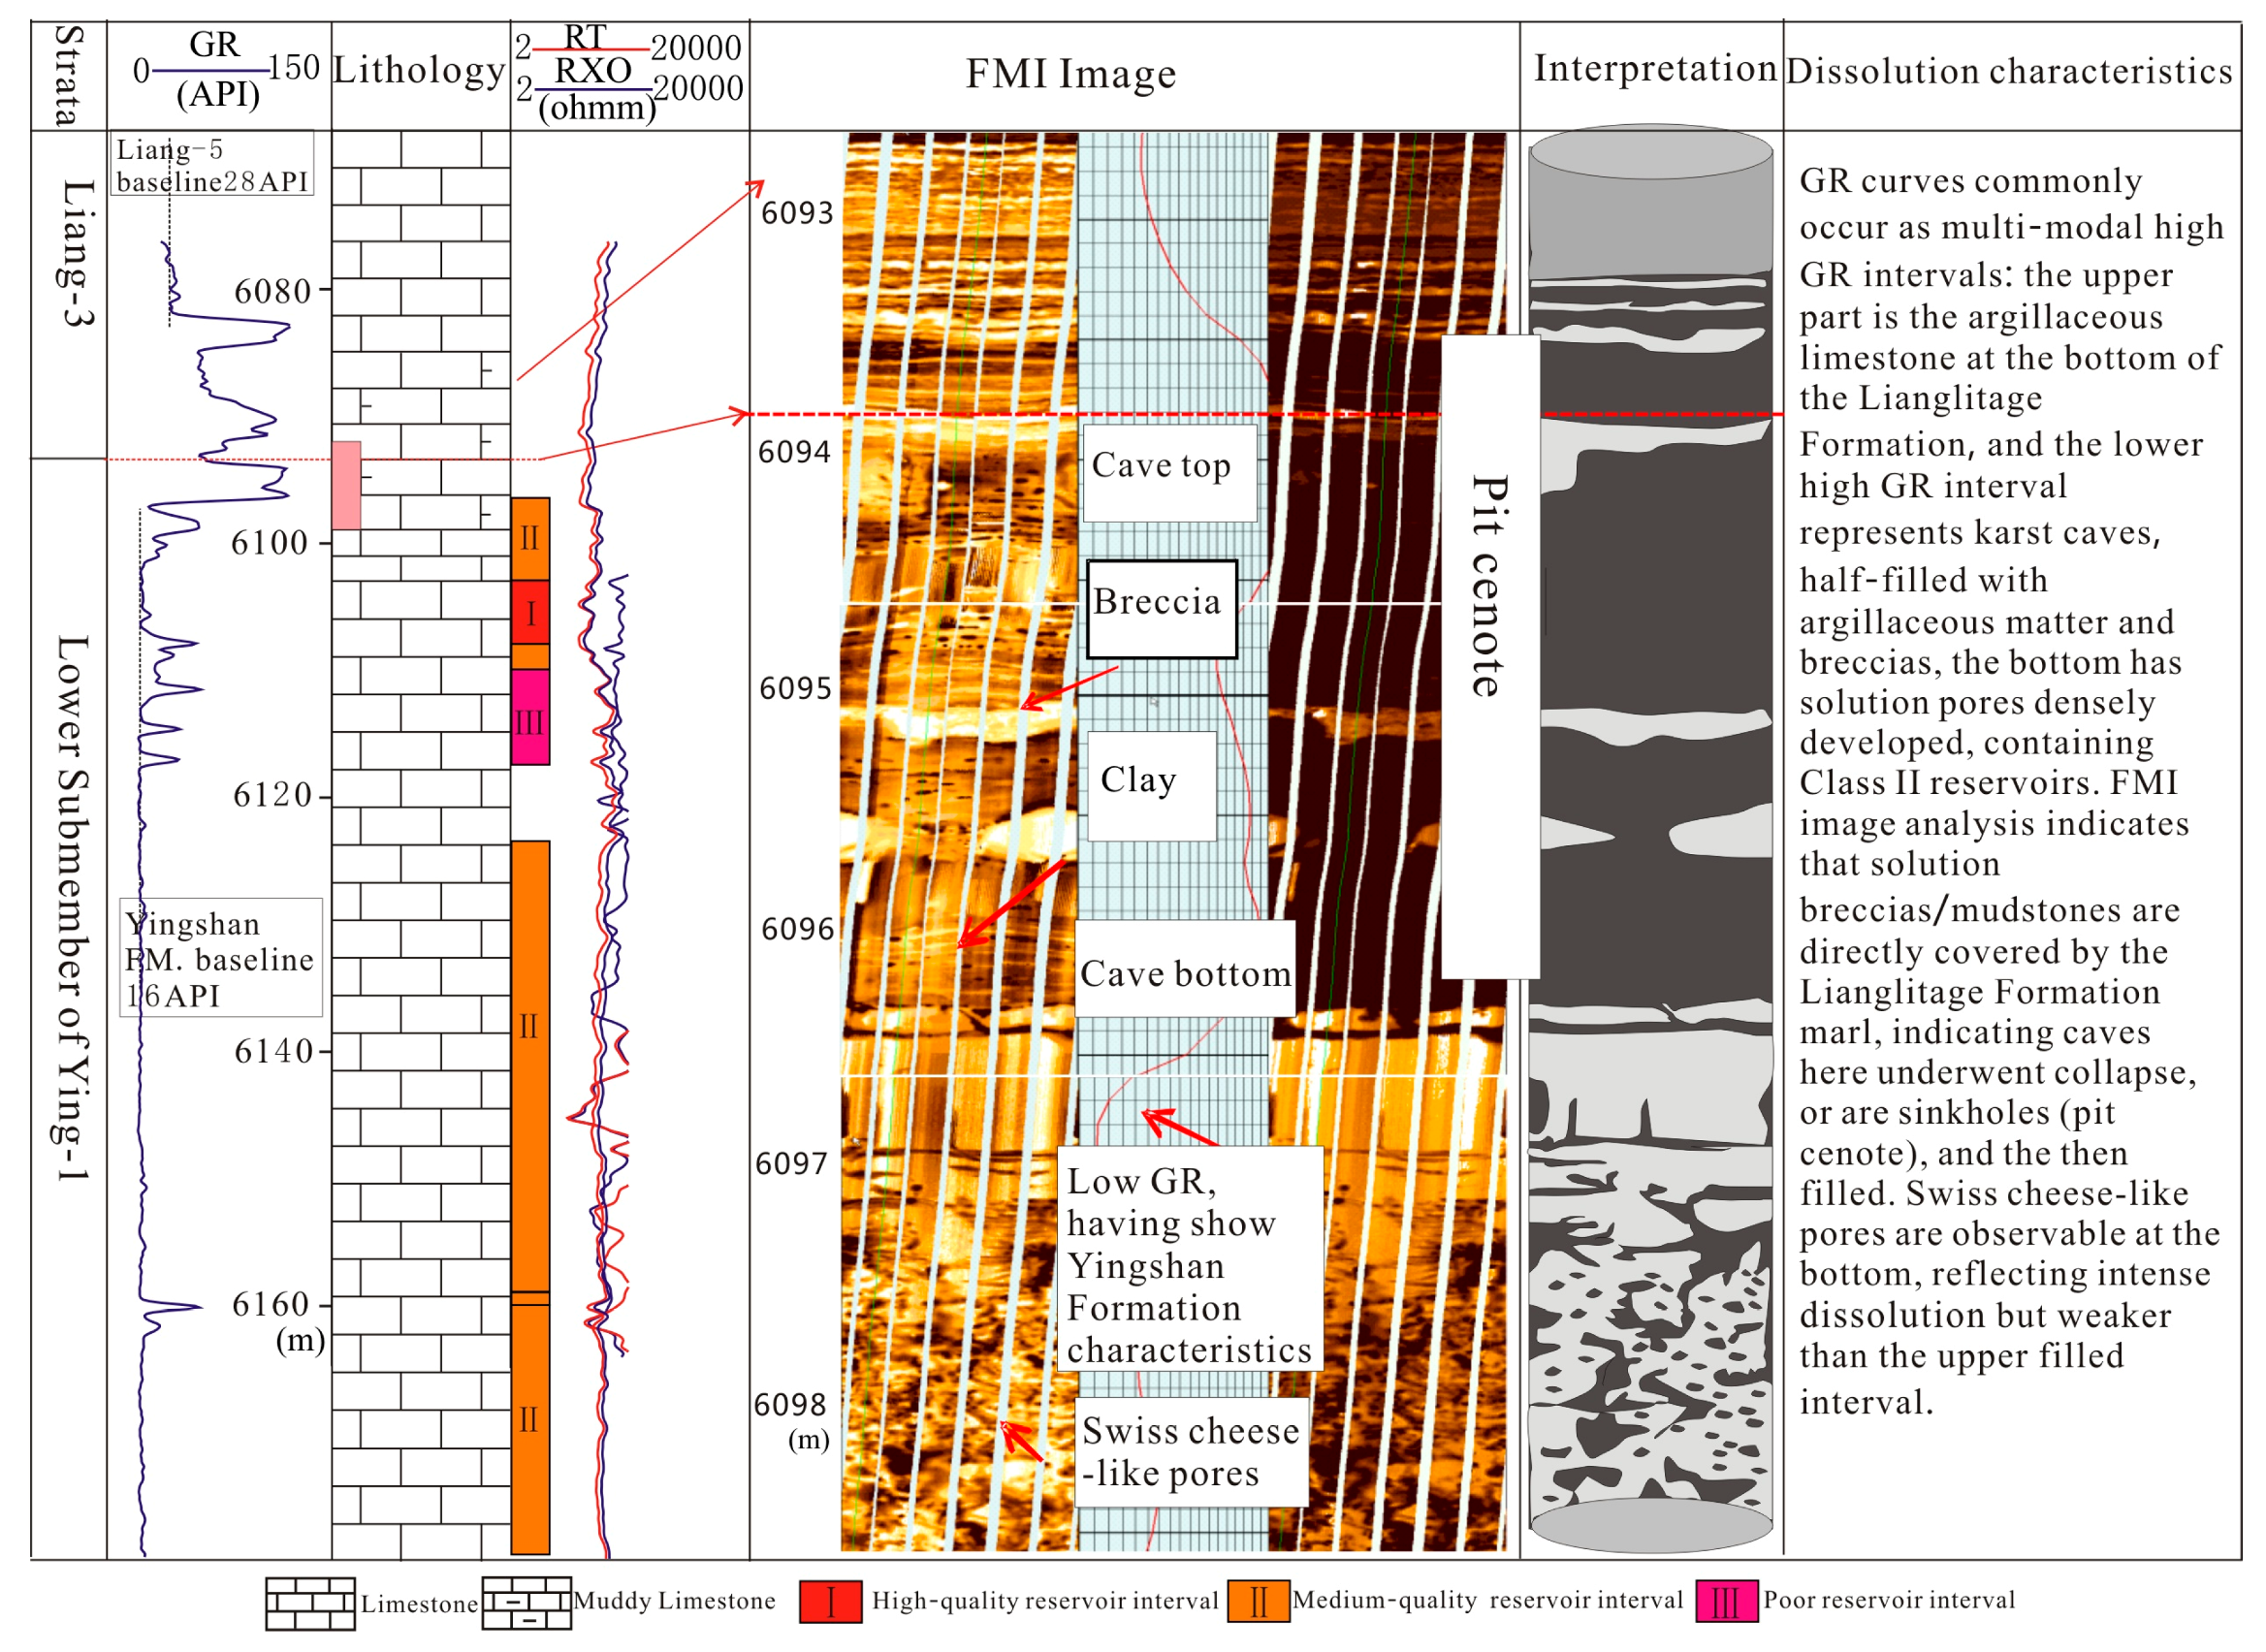
4.2. Dissolution Characteristics in FMI Logs
5. Development Characteristics of Paleokarst Cave Systems
5.1. Statistics of Pore-Cave Development
- (1)
- Drilling and mud logging data indicate some 25 intervals of blow-off/loss/overflow in more than 90 Yingshan Formation wells. About 92% of these intervals had vertical blow-off lengths of <3 m, and only two intervals had vertical blow-off lengths of about 4 m (the first and second intervals had a vertical blow-off length of 4.2 m and 4.3 m, respectively).
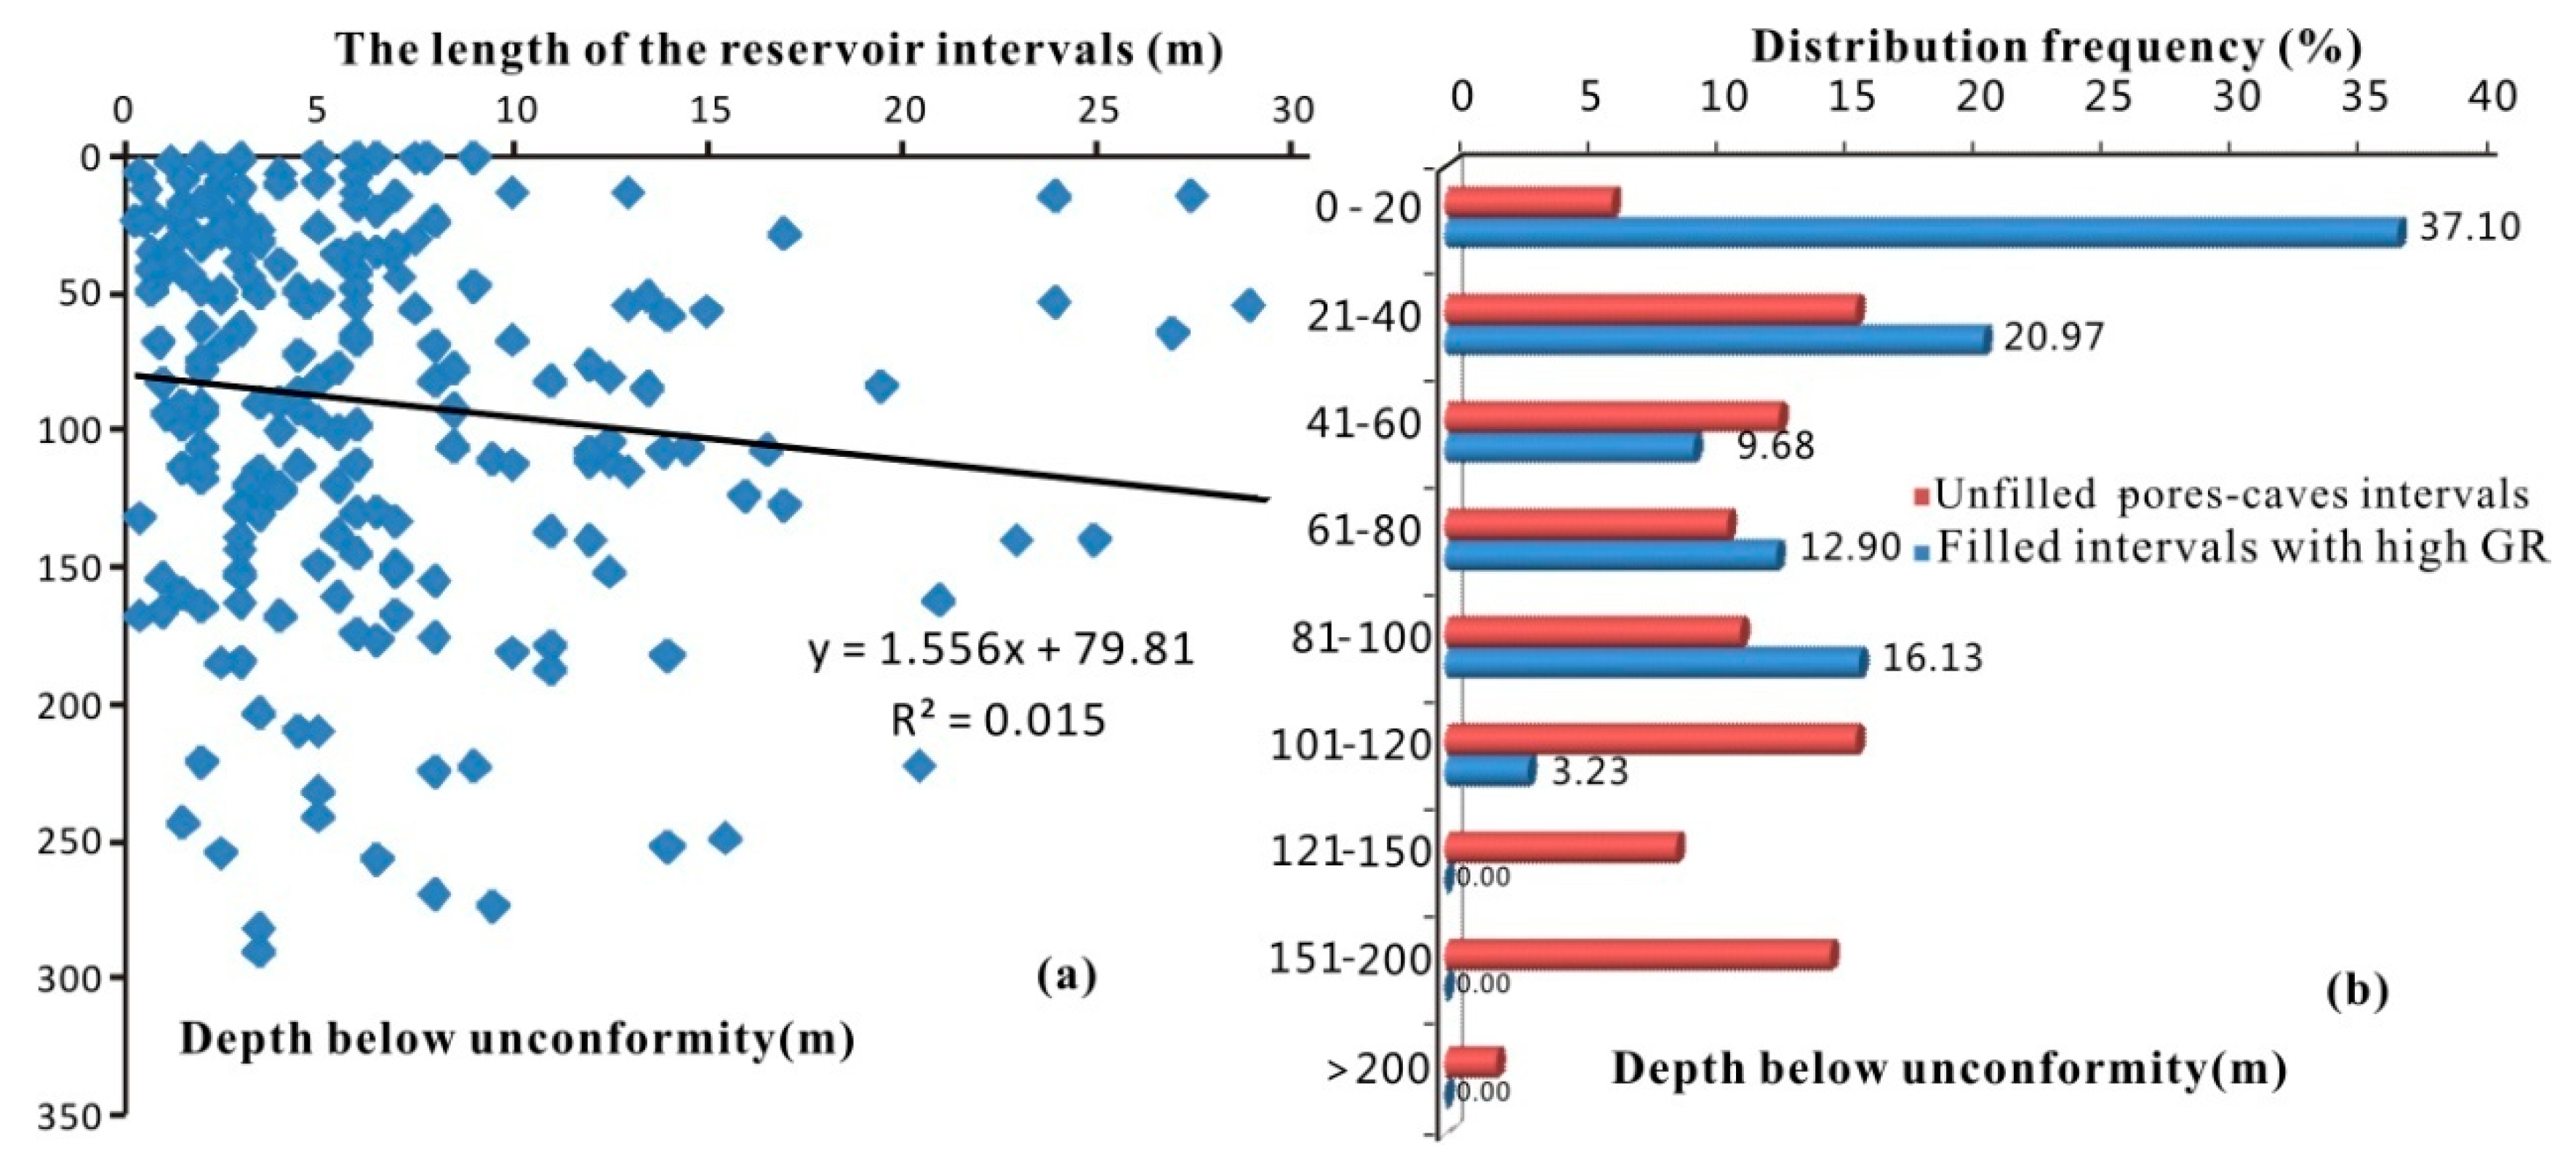
- (2)
- Interpretation of some 72 wells with conventional logging data (e.g., GR and Rt curves) indicated a total of 213 poor-quality reservoir intervals. The majority of reservoirs (about 54%) in the Yingshan Formation were found at least 50 m below the unconformity, and about 31% of the reservoir intervals were found 50–150 m below the unconformity. About 51% of the reservoir intervals had a thickness of <5 m (Figure 8a). Seventy-eight high-quality reservoir intervals were identified out of a total of 213 reservoir intervals, including 16 unfilled cave reservoirs and 60 unfilled fracture-cave reservoir intervals. Based on log analysis, 56 high-GR-filled intervals with heights ranging from 1–15 m were found. Each high-GR filling interval was a dissolution zone containing at least one smaller filled karst caves in the vertical direction, where the average height of a single small karst cave was <3 m. Pore-caves in the study area were mostly filled and displayed high GR on logs. Additionally, statistical analysis shows that reservoir intervals were generally found in the lower parts of filled intervals (Figure 8b).
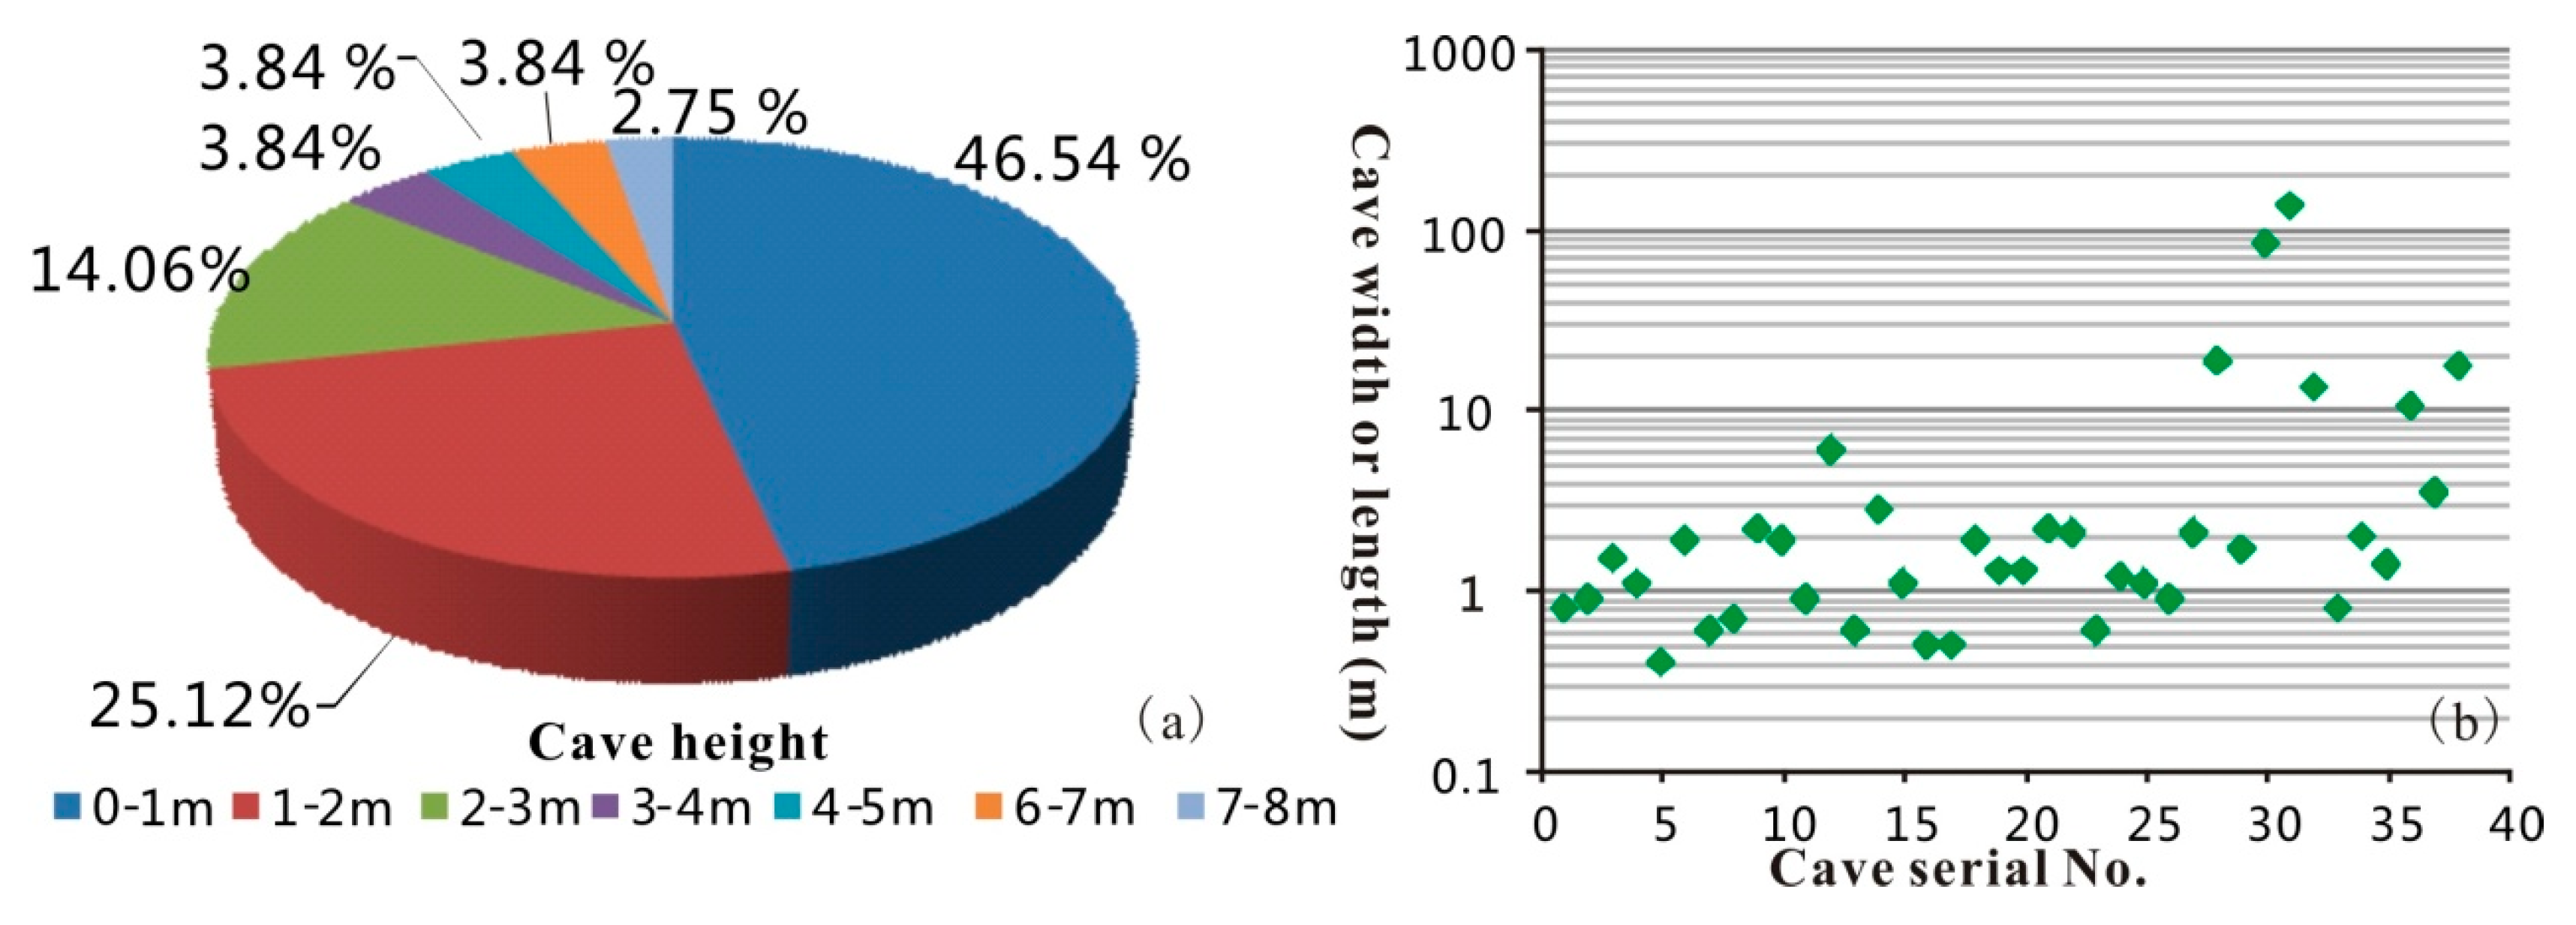
- (3)
- FMI data from 19 wells indicated that there were five wells with >40 cm-sized caves. There were 14 wells that intersected 34 caves; 91% of the caves were <3 m high, and 50% of the caves were <1 m high (Figure 9a). The caves were found over discrete intervals below the top of the Yingshan Formation: 17 caves within 30–50 m, 6 caves within 0–10 m, and 3 caves within 50 m below the formation top.
- (4)
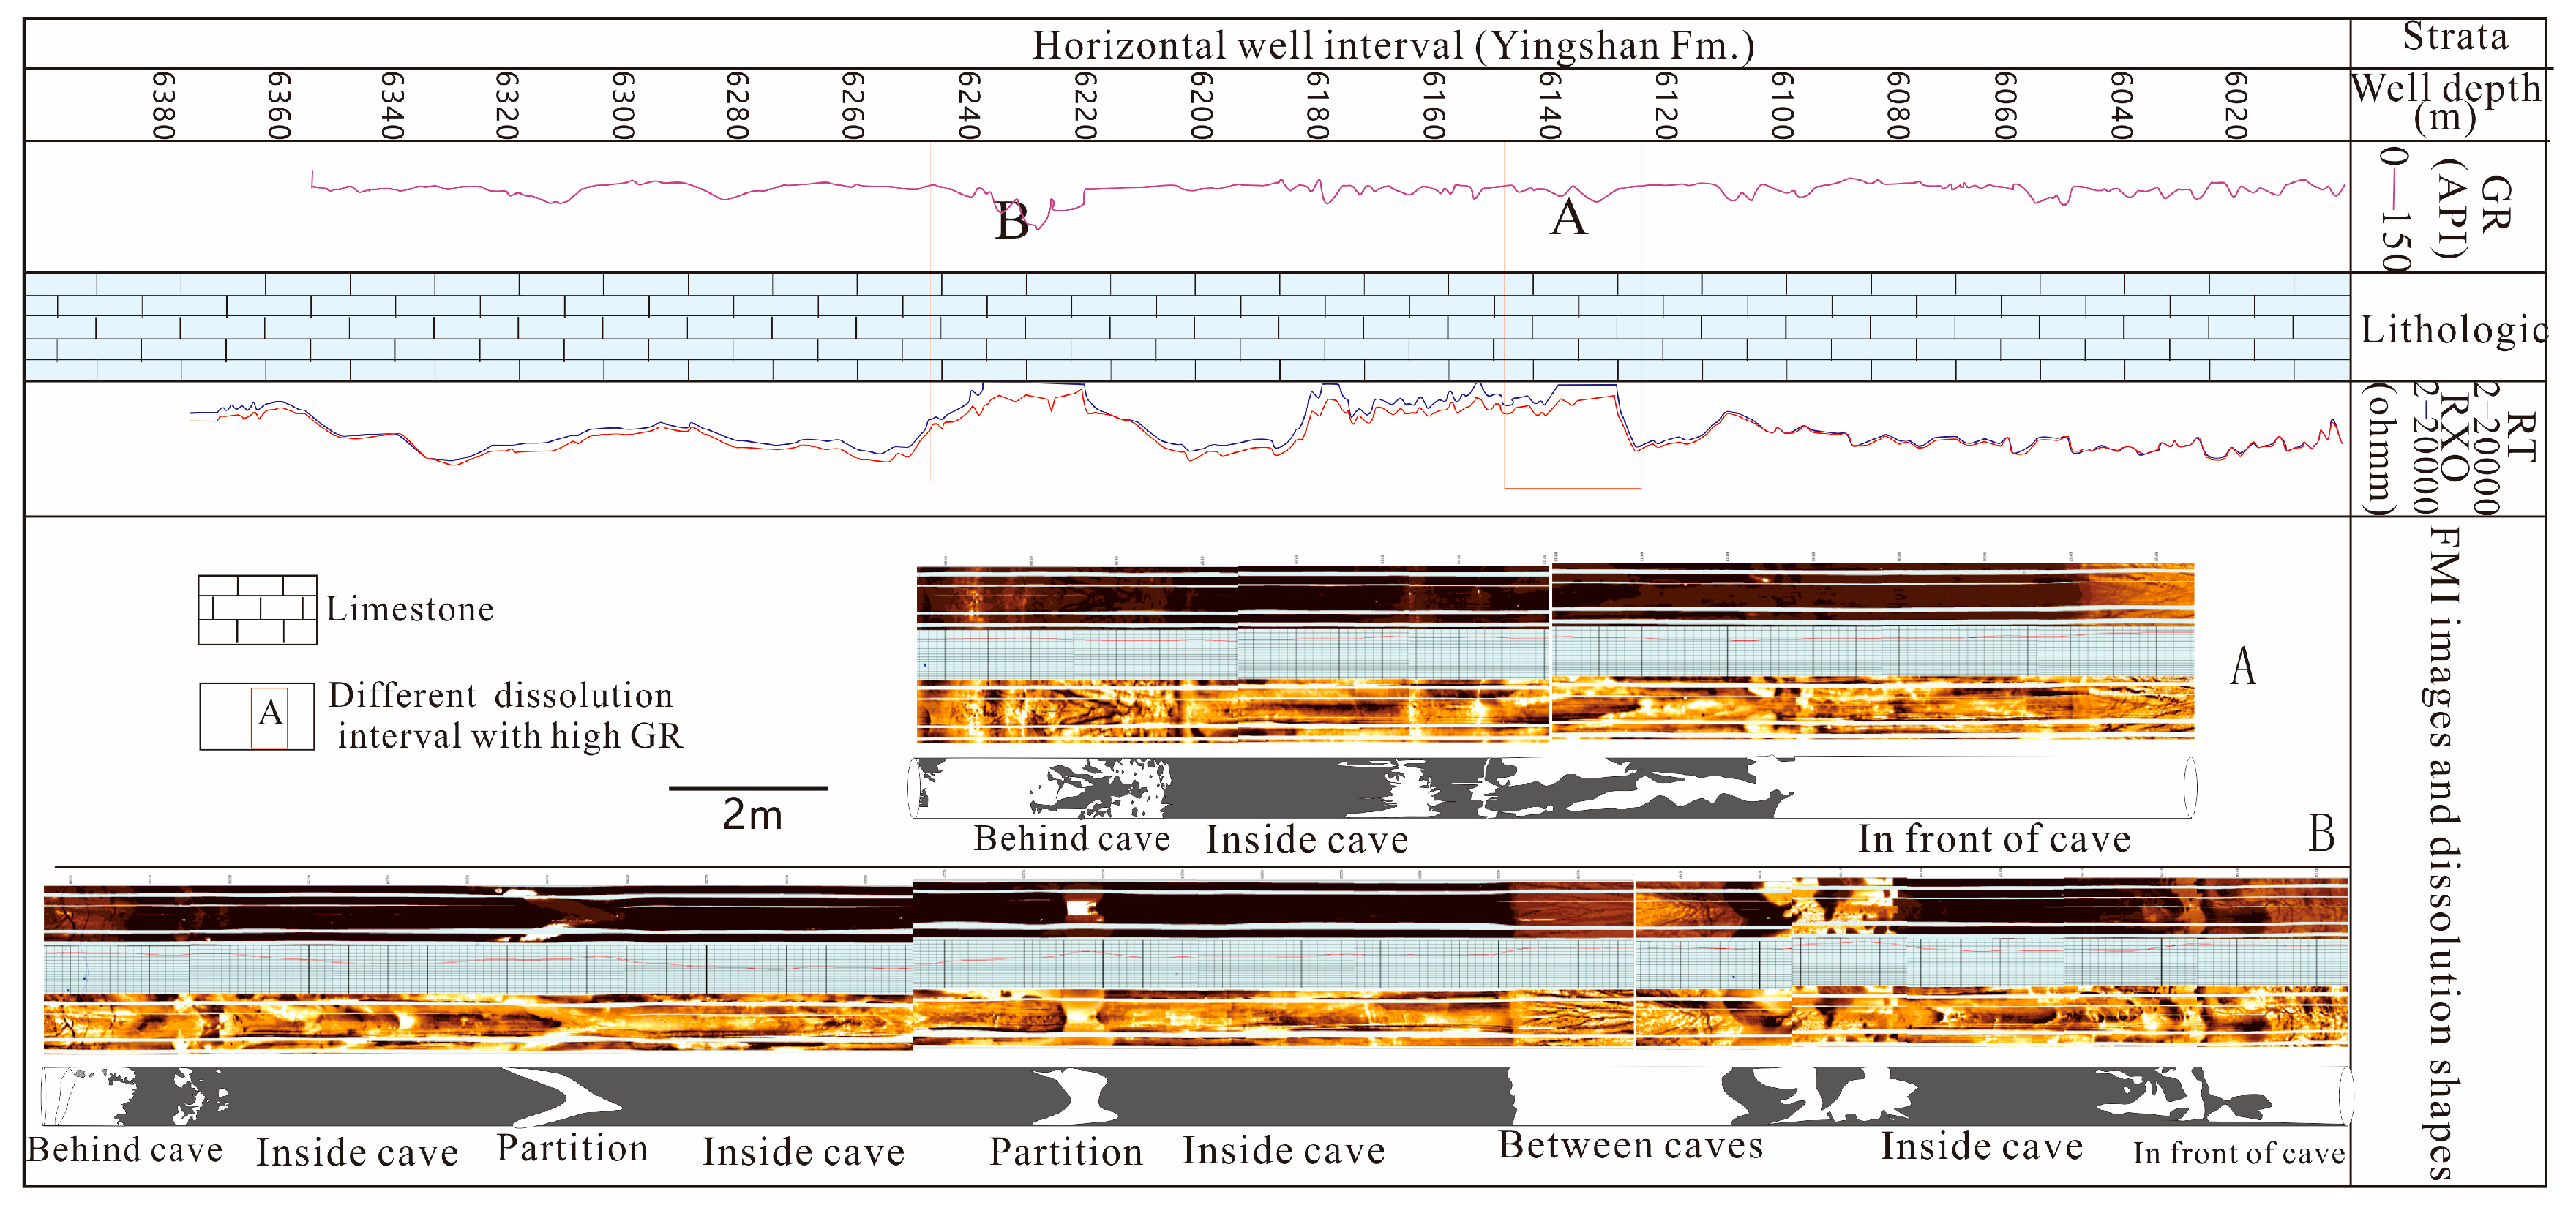
- FMI data from six horizontal wells indicated that two wells did not intersect >40 cm-sized caves, and four wells intersected 65 caves (including intermittently distributed caves in one horizontal well). Most of the caves had widths between 1–2 m, and several caves had widths or lengths greater than 10 m, and even up to 100 m (Figure 9b).
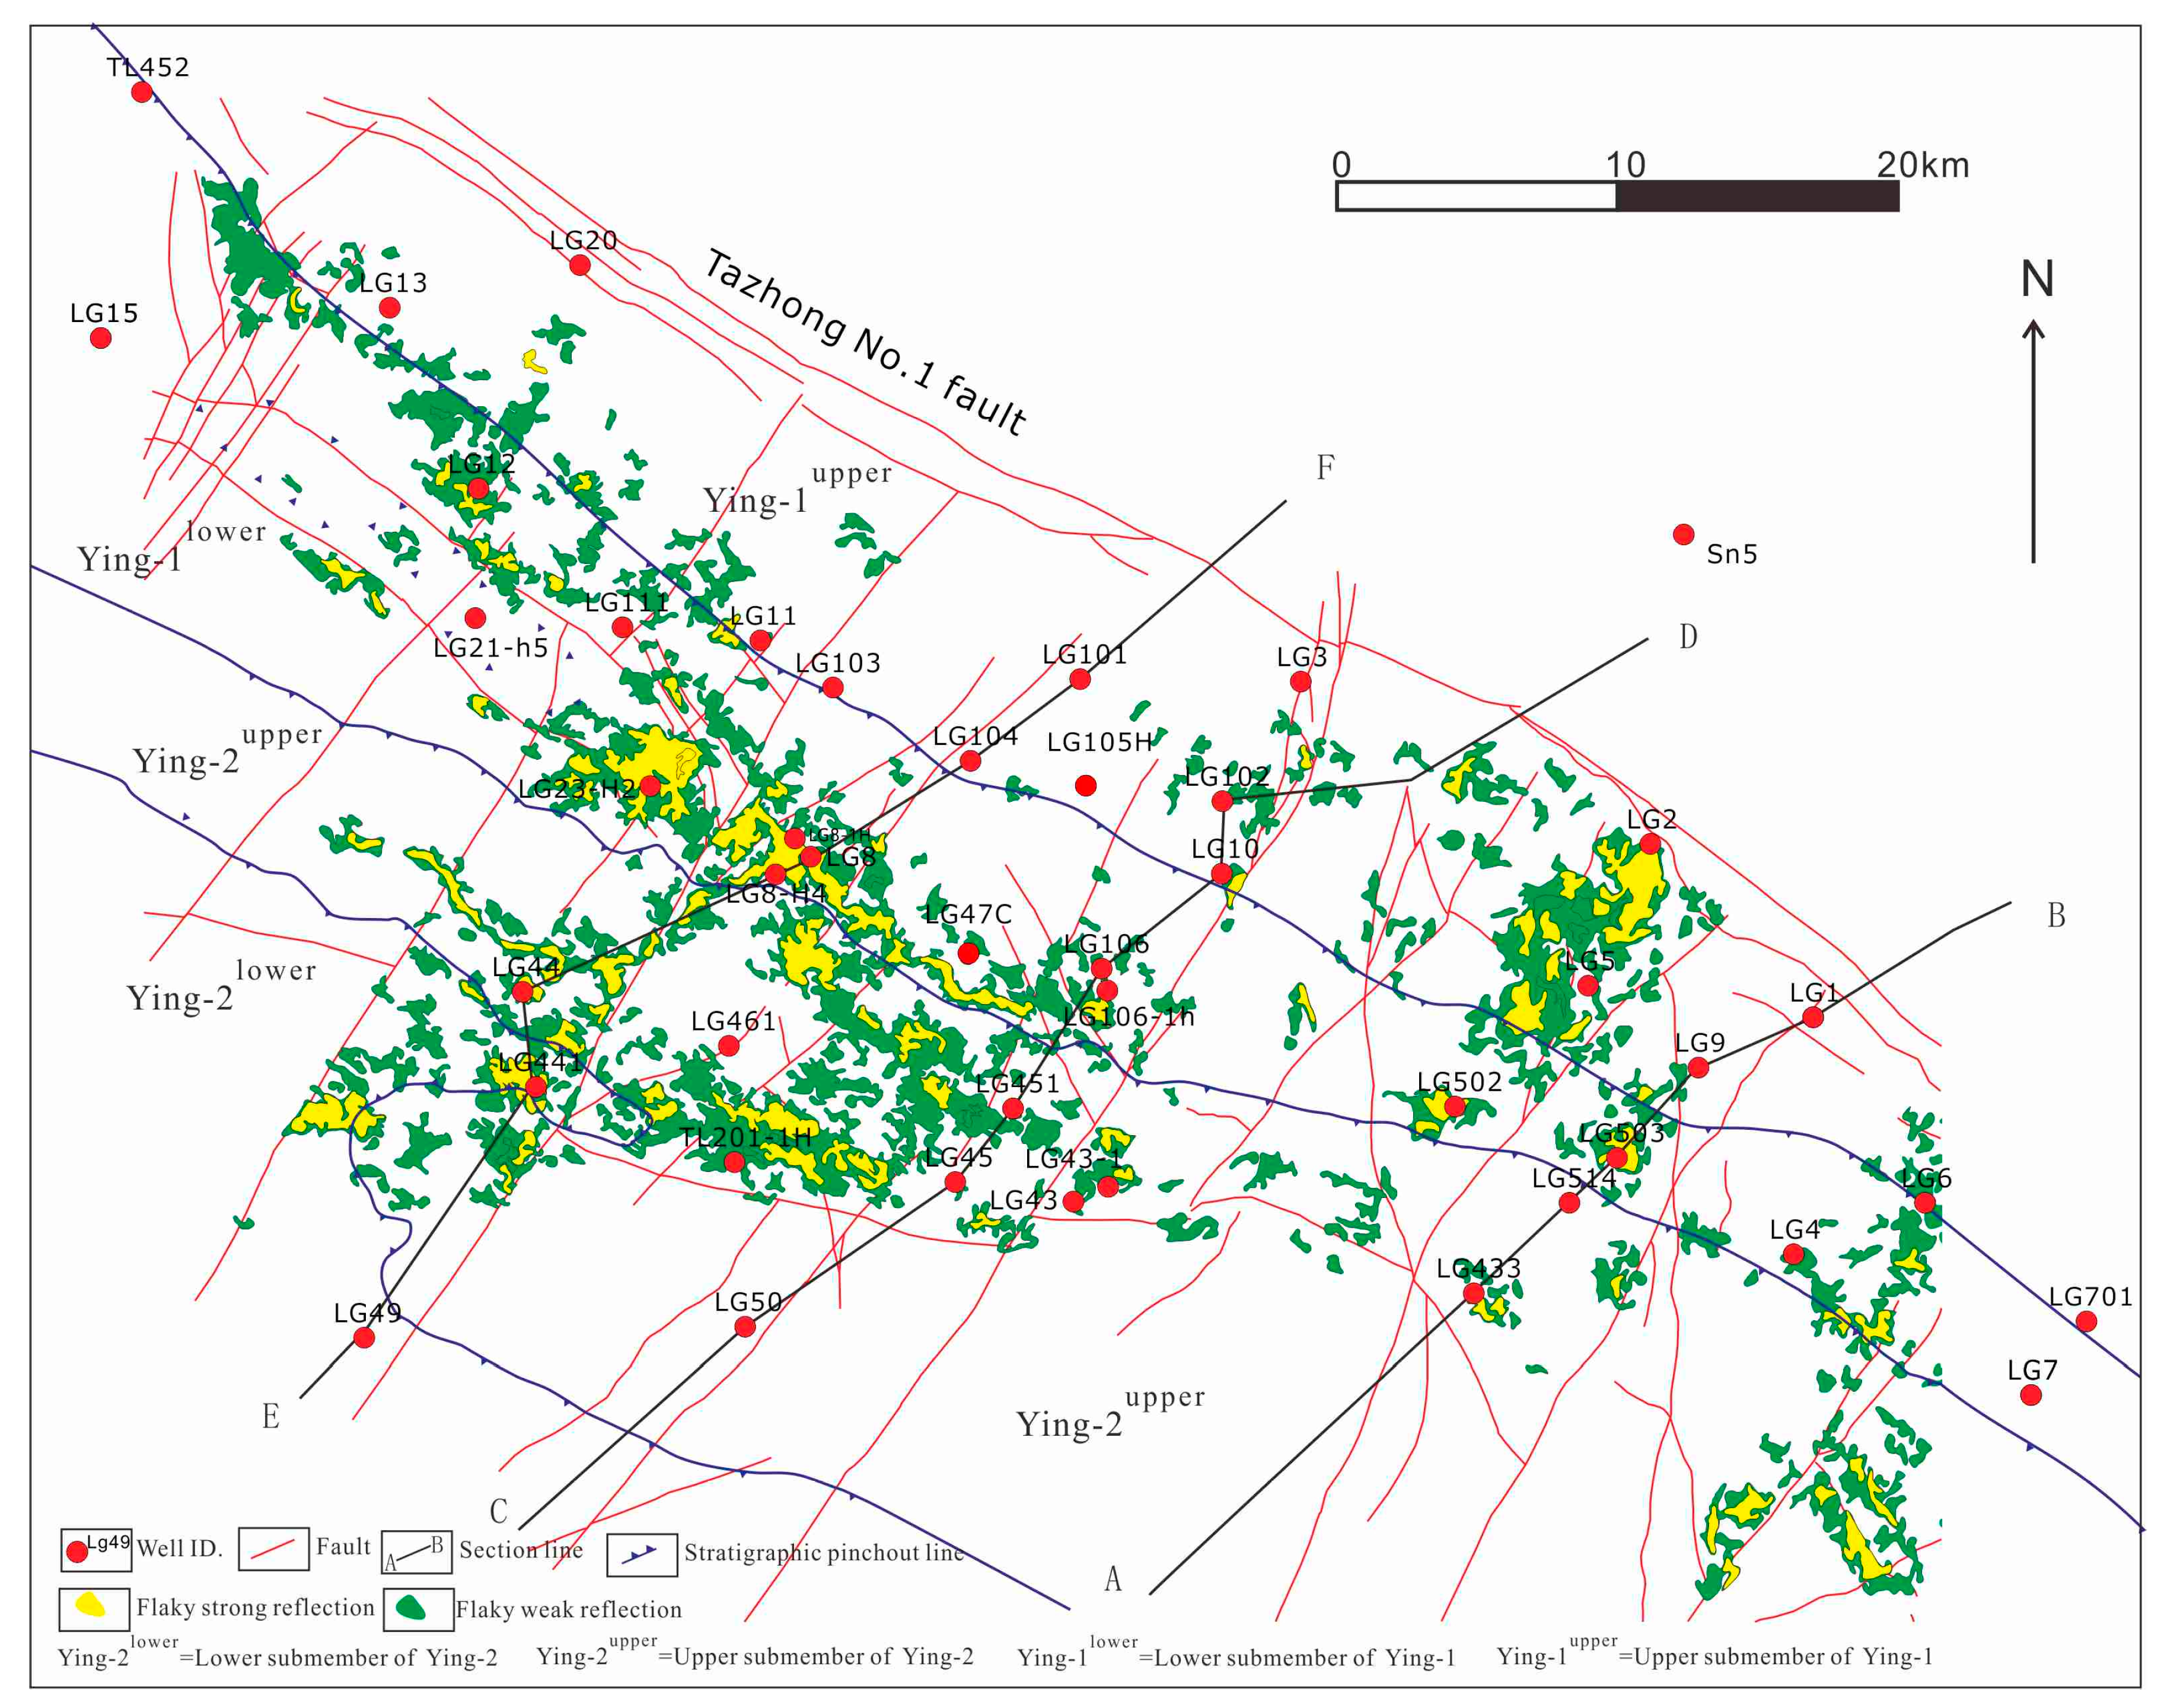
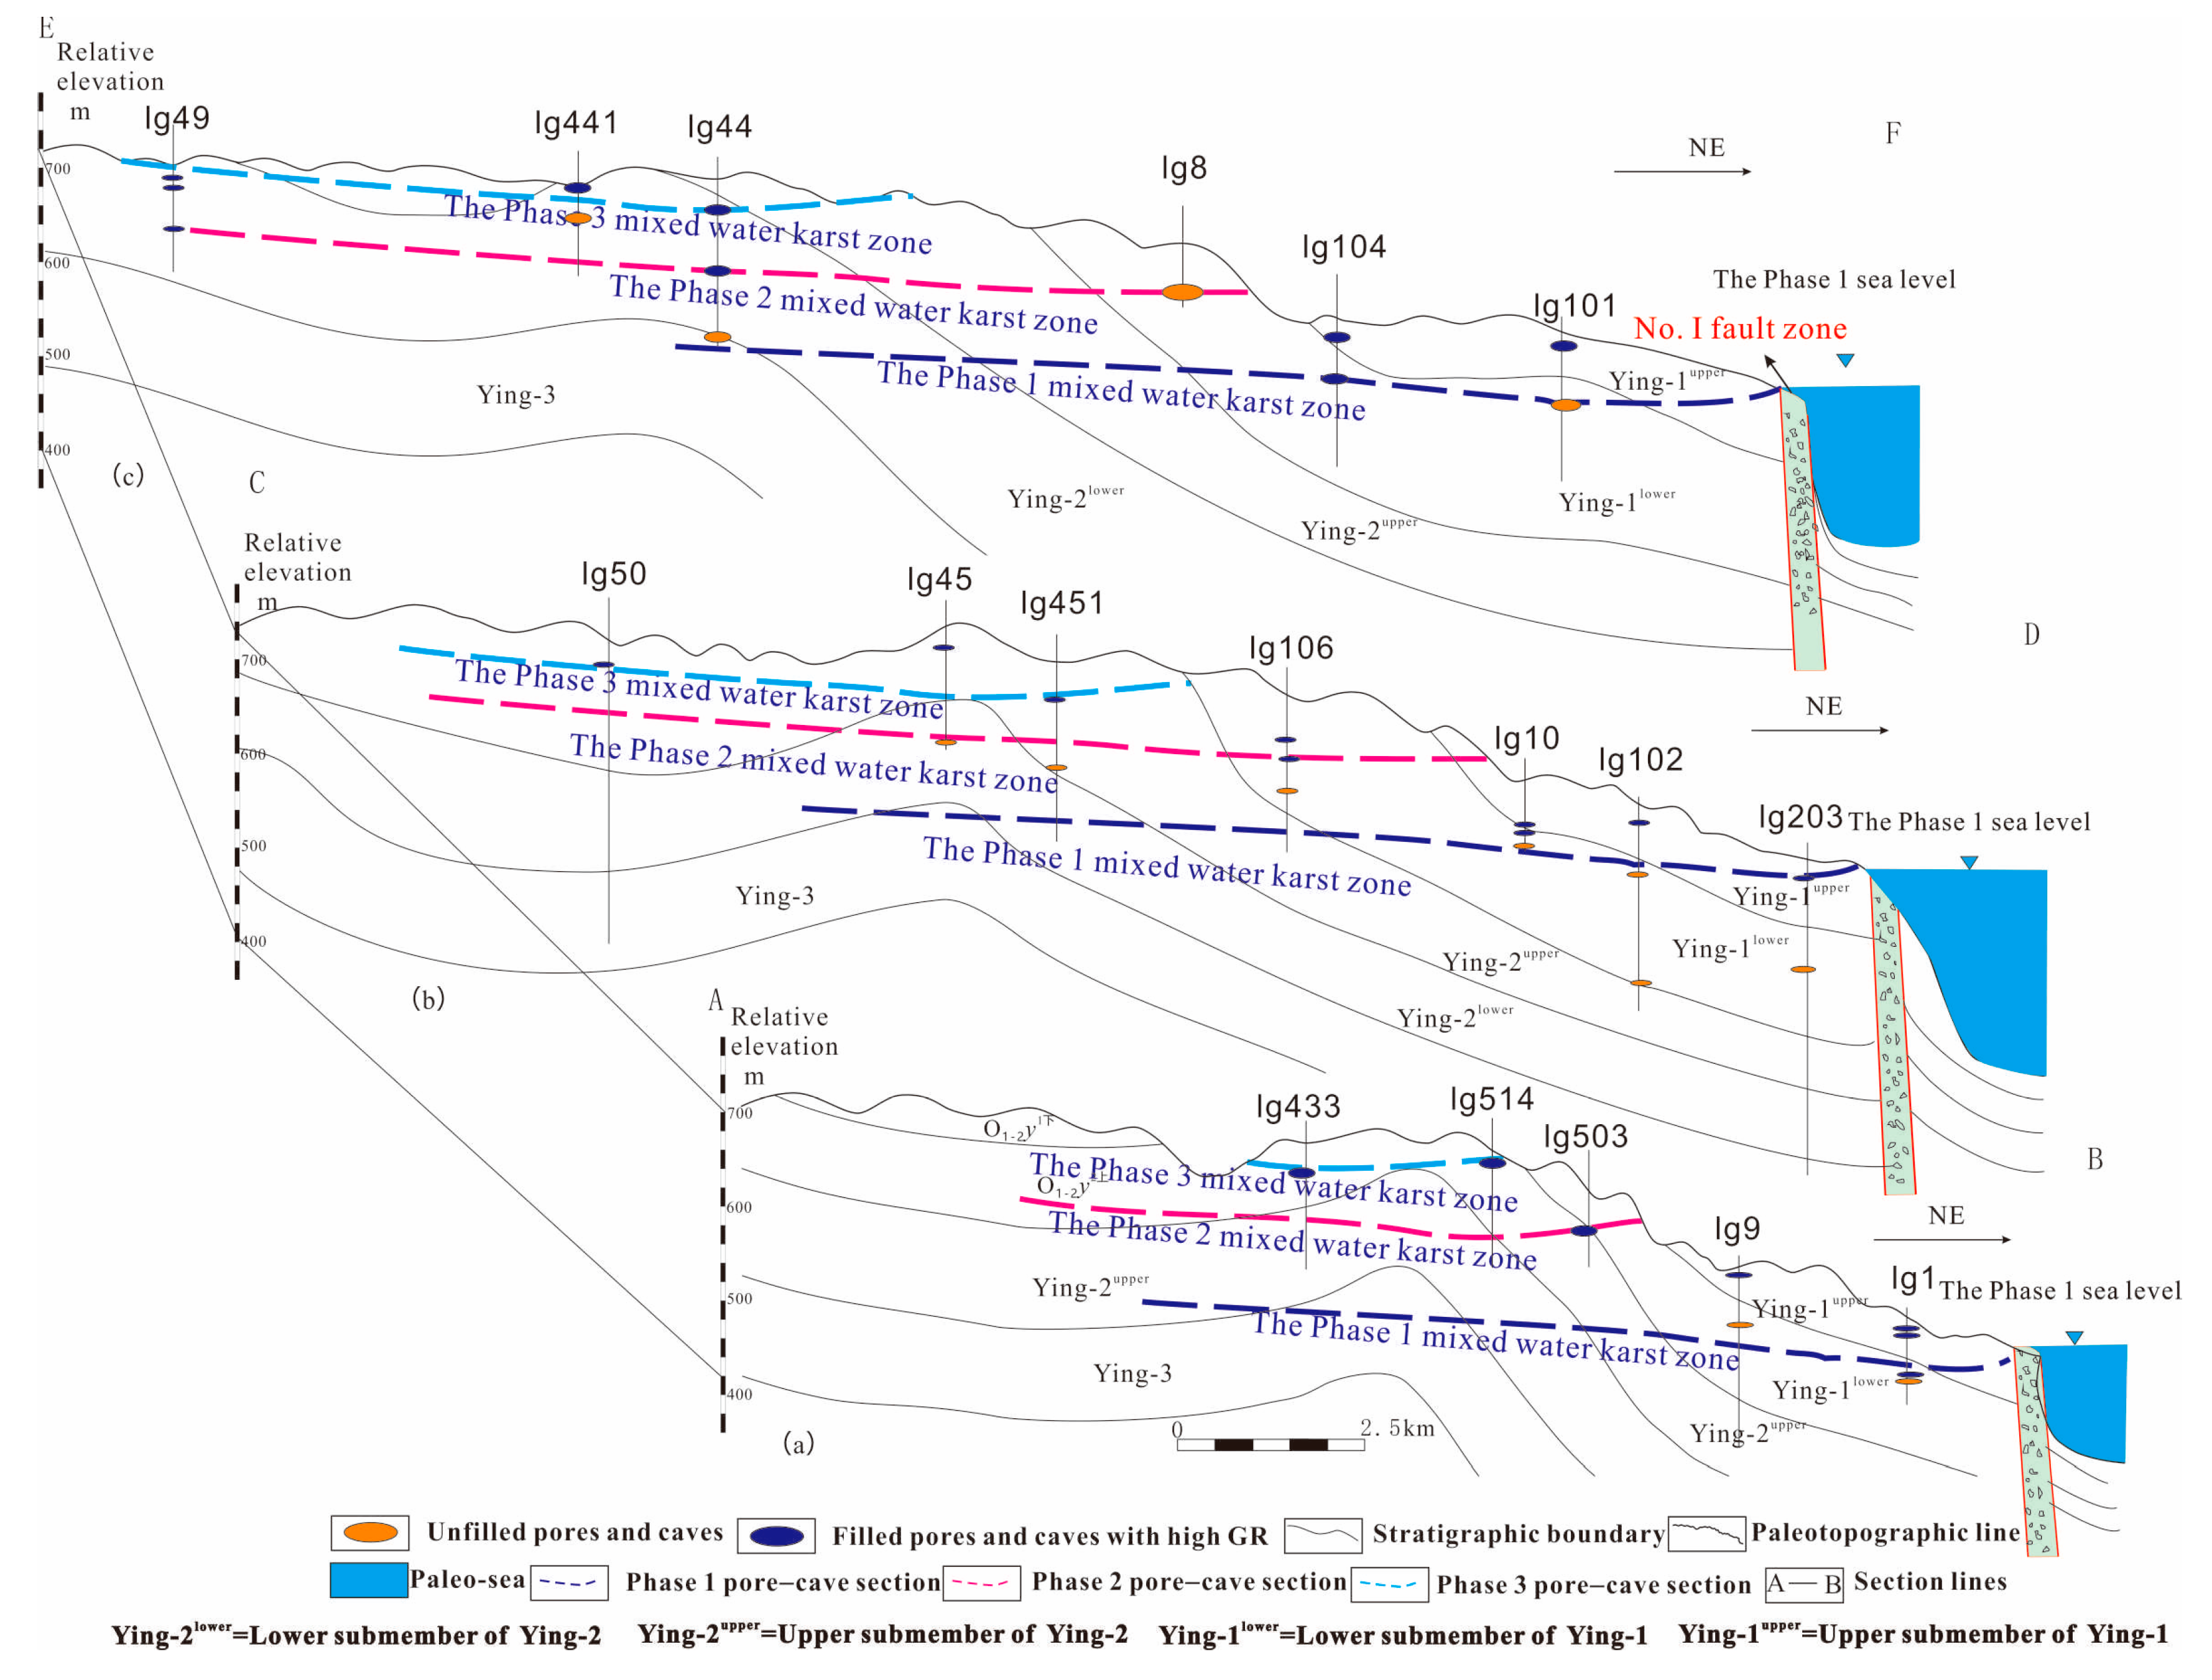
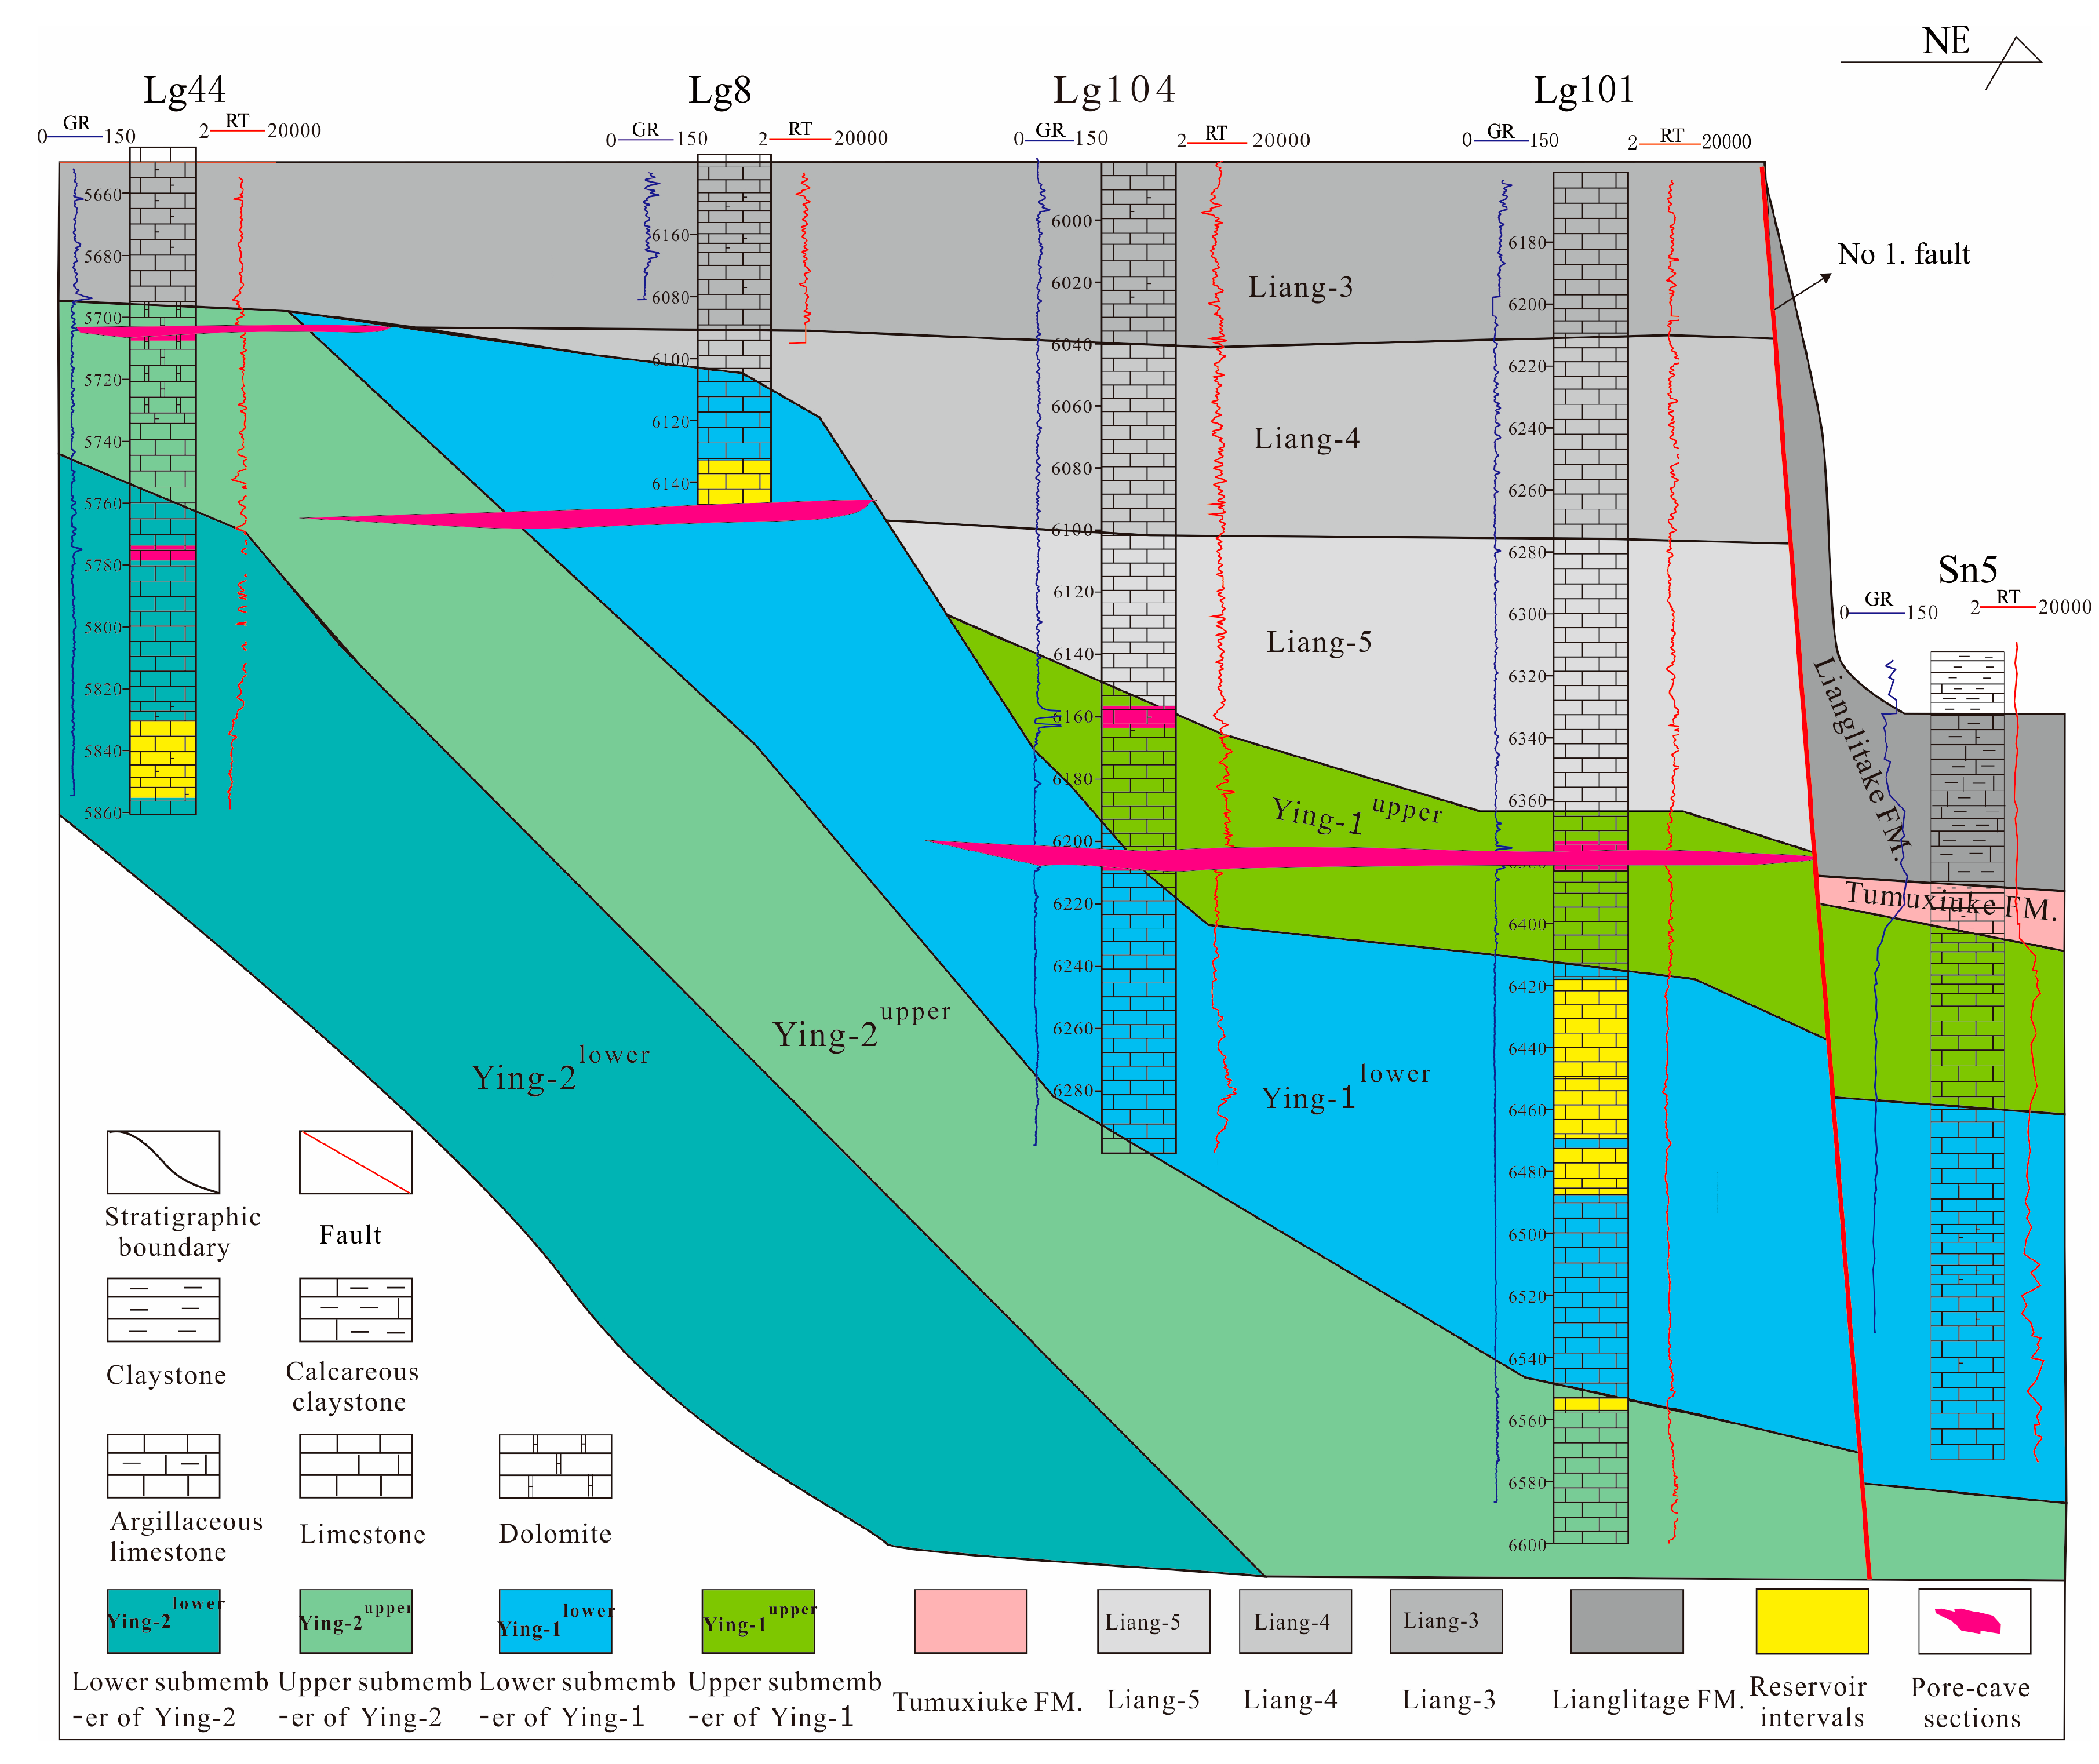
5.2. Distribution Characteristics of Paleokarst Pores and Caves
6. Geochemical Characteristics of Paleokarst Cave Fillings
6.1. Cathode Luminescence Characteristics of Pore Fillings and Identification of Paleokarst Environment
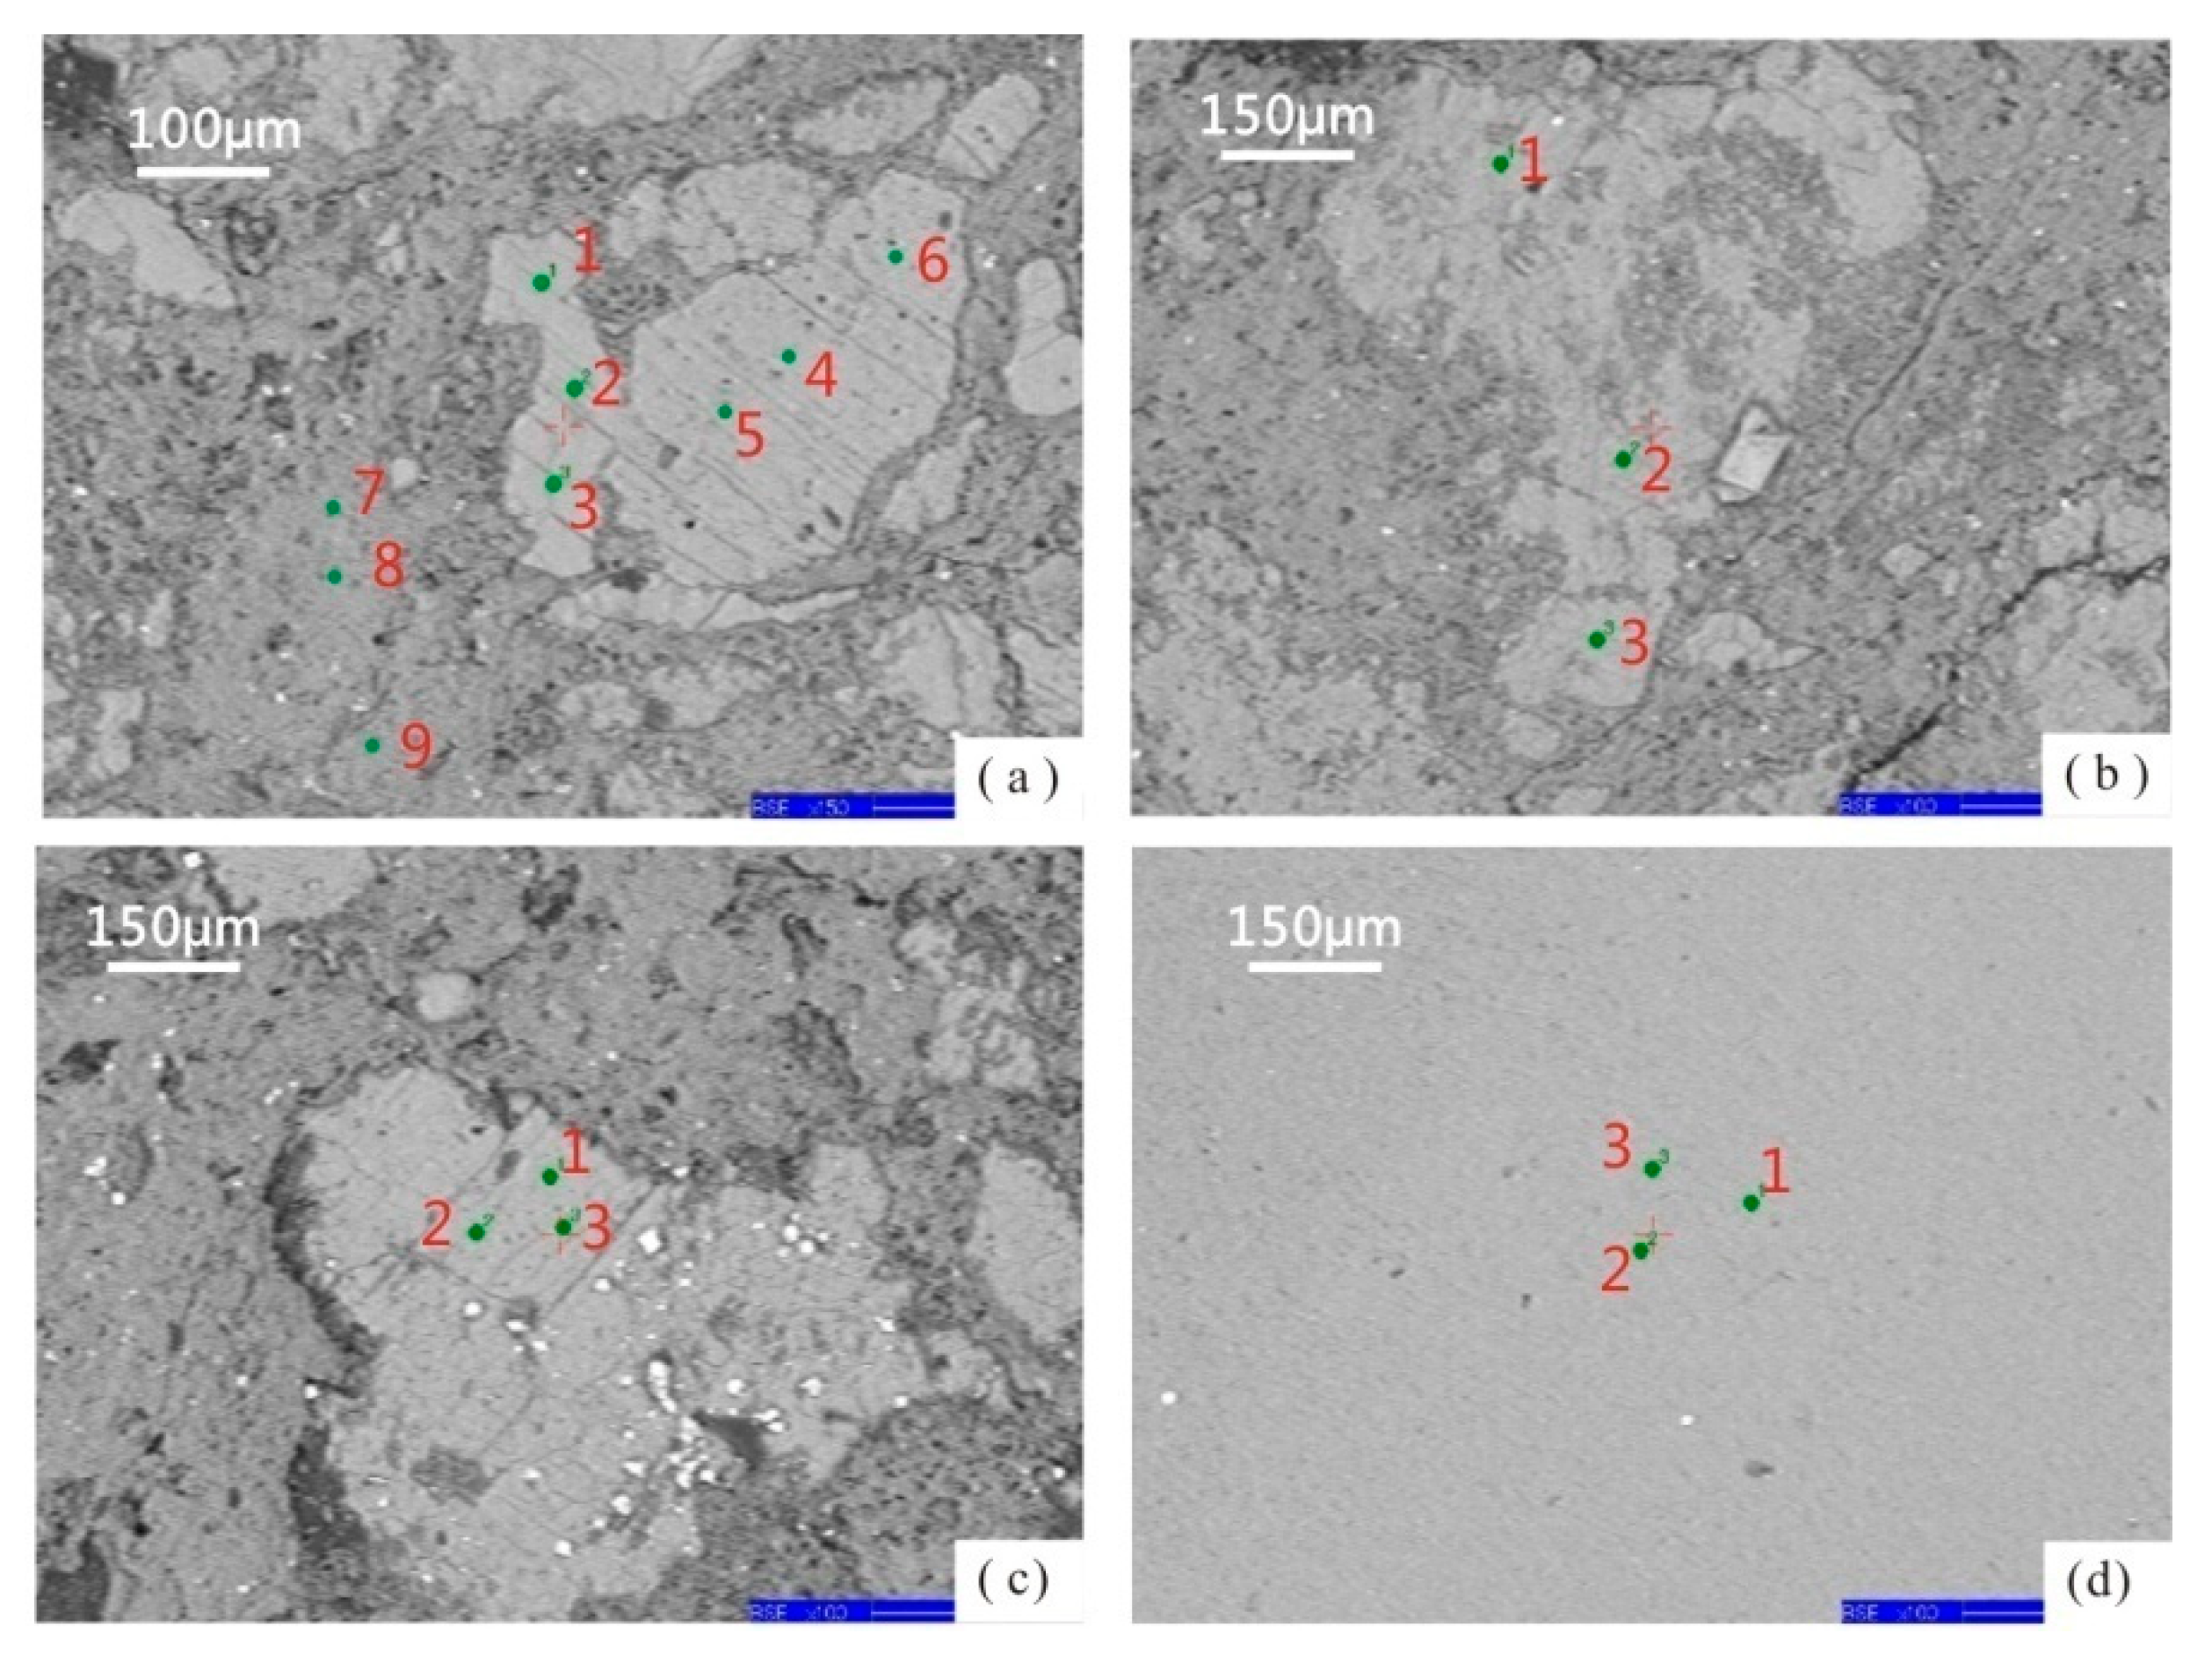
6.2. Trace Elements Testing of Fillings and Identification of Paleokarst Environments
7. Paleokarst Types and Genetic Model of the Yingshan Formation Karst in the Northern Slope of the Tazhong Area
7.1. Comparison between the Yingshan Formation Karst Characteristics and Modern Karst Types
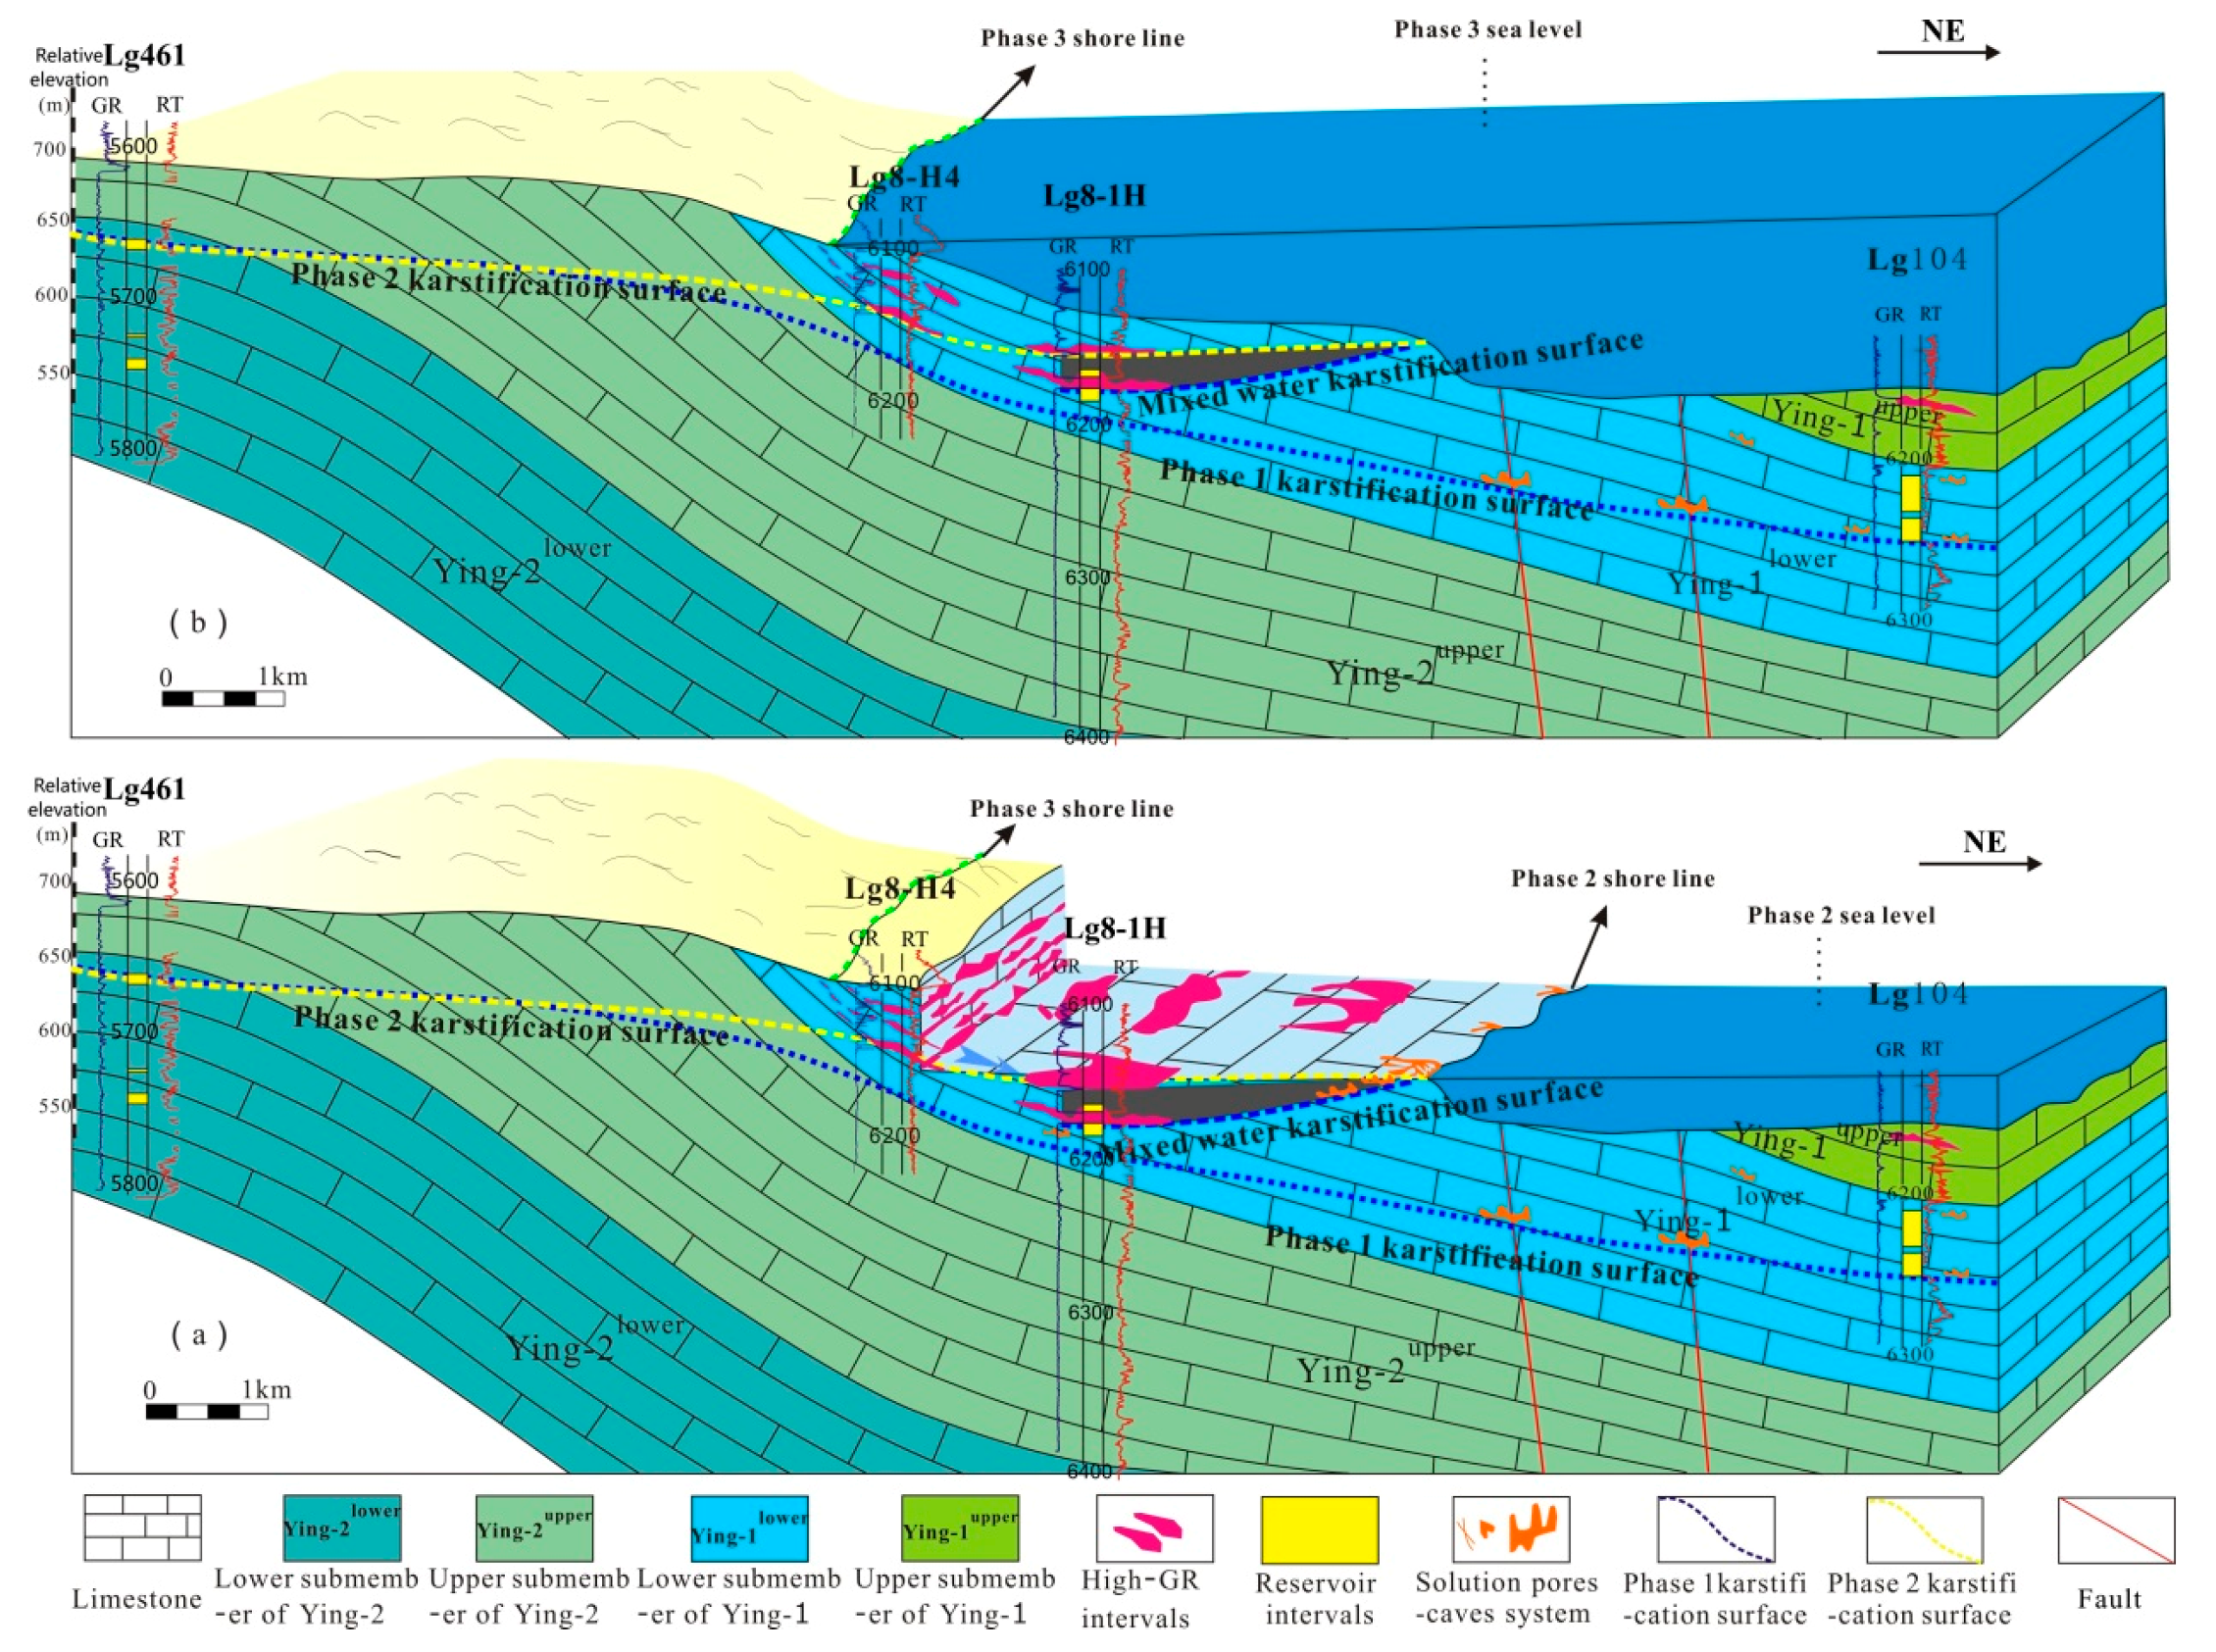
7.2. Development Model of Pores and Caves Controlled by Eogenetic Karsts
8. Conclusions
Author Contributions
Funding
Acknowledgments
Conflicts of Interest
References
- Yuan, D.X. China Karstology; Geology Press: Beijing, China, 1993; pp. 4–8. (In Chinese) [Google Scholar]
- James, N.P.; Choquette, P.W. Paleokarst; Springer: New York, NY, USA, 1988; pp. 6–10. [Google Scholar]
- Meyers, W.J. Paleokarstic Features on Mississippian Limestone, New Mexico. In Paleokarst; James, N.P., Choquette, P.W., Eds.; Springer: New York, NY, USA, 1988; pp. 306–328. [Google Scholar]
- Kerans, C. Karst-controlled reservoir heterogeneity in Ellenburger Group carbonates of west Texas. AAPG Bull. 1988, 72, 1160–1183. [Google Scholar]
- Lucia, F.J. Lower Paleozoic cavern development, collapse, and dolomitization, Franklin Mountains, El Paso, Texas. In Unconformities and Porosity in Carbonate Strata; Budd, D.A., Saller, A.H., Harris, P.M., Eds.; AAPG Memoir 63: Tulsa, OK, USA, 1995; pp. 279–300. [Google Scholar]
- Loucks, R.G. Paleocave carbonate reservoirs: Origins, burial depth modifications, spatial complexity and reservoir implications. AAPG Bull. 1999, 83, 1795–1834. [Google Scholar]
- Li, J.; Zhang, W.; Luo, X.; Hu, G. Paleokarst reservoirs and gas accumulation in the Jingbian field, Ordos Basin. Mar. Pet. Geol. 2008, 25, 401–415. [Google Scholar] [CrossRef]
- Dan, Y.; Liang, B.; Cao, J.W.; Zhang, Q.Y.; Hao, Y.Z. Characteristics and genesis of Ordovician carbonate karst reservoir in the shallow coverage zone of Halahatang area, northern Tarim Basin. Geophys. Prospect. Pet. 2015, 54, 90–98. (In Chinese) [Google Scholar]
- Zhao, W.Z.; Shen, A.J.; Pan, W.Q.; Zhang, B.M.; Qiao, Z.F.; Zheng, J.F. A research on carbonate karst reservoirs classification and its implication on hydrocarbon exploration: Cases studies from Tarim Basin. Acta Petrol. Sin. 2013, 29, 3213–3222. (In Chinese) [Google Scholar]
- Zhao, W.Z.; Shen, A.J.; Hu, Y. Geological conditions and distributional features of large-scale carbonate reservoirs onshore China. Pet. Explor. Dev. 2012, 39, 1–12. (In Chinese) [Google Scholar] [CrossRef]
- Kang, Y.Z. Palaeokarst of Cambro-Ordovician and oil-gas distribution in Tarim Basin. Xinjiang Pet. Geol. 2005, 26, 472–480. (In Chinese) [Google Scholar]
- Zhu, G.Y.; Zhang, S.C.; Wang, H.H.; Yang, H.J.; Meng, S.C.; Gu, Q.Y. The formation and distribution of deep weathering crust in north Tarim Basin. Acta Petrol. Sin. 2009, 25, 2384–2398. (In Chinese) [Google Scholar]
- Zeng, H.L.; Loucks, R.; Janson, X.; Wang, G.Z.; Xia, Y.P.; Yuan, B.H.; Xu, L.G. Three-dimensional seismic geomorphology and analysis of the Ordovician paleokarst drainage system in the central Tabei Uplift, northern Tarim Basin, western China. AAPG Bull. 2011, 95, 2061–2083. [Google Scholar] [CrossRef]
- Gu, J.Y. Characteristics and evolutional model of karst reservoir of Lower Ordovician carbonate rocks in Lunnan area of Tarim Basin. J. Palaeogeogr. 1999, 1, 54–60. (In Chinese) [Google Scholar]
- Jin, Z.J.; Zhu, D.Y.; Hu, W.X.; Zhang, X.F.; Zhang, J.T.; Song, Y.C. Mesogenetic dissolution of the middle Ordovician limestone in the Tahe oilfield of Tarim Basin, NW China. Mar. Pet. Geol. 2009, 26, 753–763. [Google Scholar] [CrossRef]
- Xiao, D.; Tan, X.C.; Xi, A.H.; Liu, H.; Shan, S.J.; Xia, J.W.; Cheng, Y.; Lian, C.B. An inland facies-controlled eogenetic karst of the carbonate reservoir in the Middle Permian Maokou Formation, southern Sichuan Basin, SW China. Mar. Pet. Geol. 2016, 72, 218–233. [Google Scholar] [CrossRef]
- Dan, Y.; Liang, B.; Cao, J.W.; Zhang, Q.Y.; Hao, Y.Z. Eogenetic karstification in carbonate and its significance for hydrocarbon geology. Carsologica Sin. 2015, 34, 126–134. (In Chinese) [Google Scholar]
- Vacher, H.L.; Mylroie, J.E. Eogenetic karst from the perspective of an equivalent porous medium. Carbonates Evaporites 2002, 17, 182–196. [Google Scholar] [CrossRef]
- Yang, H.J.; Han, J.F.; Sun, C.H. A development model and petroleum exploration of karst reservoirs of Ordovician Yingshan formation in the northern slope of Tazhong palaeouplift. Acta Petrolei Sin. 2011, 32, 199–205. (In Chinese) [Google Scholar]
- Feng, R.W.; Ou, Y.C.; Pang, Y.J.; Li, Z.Z.; Luo, X.; Zhang, Q.; Li, S.Y.; Zhou, Y.; Cheng, L. Evolution modes of interbedded weathering crust karst: A case study of the 1st and 2nd members of Ordovician Yingshan Formation in EPCC block, Tazhong, Tarim Basin. Pet. Explor. Dev. 2014, 41, 49–59. [Google Scholar] [CrossRef]
- Ni, X.F.; Shen, A.J.; Pan, W.Q. Geological modeling of excellent fractured-vuggy carbonate reservoirs: A case study of the Ordovician in the northern slope of Tazhong palaeouplift and the southern area of Tabei slope, Tarim Basin. Pet. Explor. Dev. 2013, 40, 414–422. [Google Scholar] [CrossRef]
- Lan, X.D.; Lü, X.X.; Zhu, Y.M. Characteristics and differential accumulation of oil/gas in Lower Paleozoic marine carbonate on northern slope of Tazhong Low Rise, Tarim Basin, NW China: A case study of Lower Ordovician Yingshan Formation. Arab. J. Geosci. 2014, 7, 4487–4498. [Google Scholar] [CrossRef]
- Yu, J.B.; Li, Z.; Yang, L. Characterization and distribution of deeply-buried paleokarst carbonate reservoirs of Ordovician Yingshan Formation in northern slope of central Tarim Basin. Acta Petrolei Sin. 2016, 37, 299–310. (In Chinese) [Google Scholar]
- Yu, J.B.; Li, Z.; Yang, L. Fault system impact on paleokarst distribution in the Ordovician Yingshan Formation in the central Tarim Basin, northwest China. Mar. Pet. Geol. 2016, 71, 105–118. [Google Scholar] [CrossRef]
- Yu, H.F.; Bai, Z.K.; Deng, L.P. Determination and geologic significance of Yingshan unconformity of lower Ordovician in Tazhong area, Tarim Basin. Xinjiang Pet. Geol. 2011, 32, 231–234. (In Chinese) [Google Scholar]
- Zhang, H.; Cai, Z.X.; Qi, L.X.; Yun, L. Types and characteristics of eogenetic karst in the Yingshan Formation in northwestern Tazhong area, Tarim Basin. Oil Gas Geol. 2016, 37, 291–303. (In Chinese) [Google Scholar]
- Chen, H.H.; Wu, Y.; Zhu, H.T. Eogenetic karstification and reservoir formation model of the Middle-Lower Ordovician in the northeast slope of Tazhong Uplift, Tarim Basin. Acta Petrolei Sin. 2016, 37, 1231–1246. (In Chinese) [Google Scholar]
- Kang, Y.; Kang, Z. Tectonic evolution and oil and gas of Tarim Basin. J. Southeast Asian Earth Sci. 1996, 13, 317–325. [Google Scholar]
- Lü, X.X.; Jin, Z.J.; Liu, L.F. Oil and gas accumulations in the Ordovician carbonates in the Tazhong Uplift of Tarim Basin, west China. J. Pet. Sci. Eng. 2004, 41, 109–121. [Google Scholar] [CrossRef]
- Qu, H.Z.; Wang, Z.Y.; Yang, H.J. Karstification of reef-bank facies carbonate and its control on pore distribution: A case study of Upper Ordovician Lianglitage Formation in eastern Tazhongarea, Tarim Basin, NW China. Pet. Explor. Dev. 2013, 40, 592–598. [Google Scholar] [CrossRef]
- Pang, H.; Chen, J.Q.; Pang, X.Q. Key factors controlling hydrocarbon accumulations in Ordovician carbonate reservoirs in the Tazhong area, Tarim basin, western China. Mar. Pet. Geol. 2013, 43, 88–101. [Google Scholar] [CrossRef]
- Huang, S.J. The cathodeluminescence and diagenesis of the carbonates of Guanwushan Formation, middle Devonian, Ganxi, northwestern Sichuan. J. Chengdu College Geol. 1988, 15, 50–56. (In Chinese) [Google Scholar]
- Huang, S.J. Carbonate Diagenesis; Geology Press: Beijing, China, 2010; pp. 100–101. (In Chinese) [Google Scholar]
- Mussman, W.J.; Read, J.F. Sedimentology and development of a passive to convergent margin unconformity—Middle Ordovician Knox unconformity, Virginia Appalachians. Geol. Soc. Am. Bull. 1986, 97, 282–324. [Google Scholar] [CrossRef]
- Katchenkov, S.M. Element distributions in clay minerals. Dokl. AN SSSR 1960, 134, 680–683. (In Russian) [Google Scholar]
- Katchenkov, S.M.; Flegontova, Y.I. Minor elements in Indian-Ocean muds. Trans. All-Union Pet. Geol. Res. Inst. 1964, 227, 202–211. (In Russian) [Google Scholar]
- Deng, H.W.; Qian, K. Sedimentary Geochemistry and Environmental Analysis; Science Technique Press: Gansu, China, 1993; pp. 78–94. (In Chinese) [Google Scholar]
- Lizinikov, А.H. Phase and Construction of Deposit Rock; Science Press: Beijing, China, 1961; pp. 150–155. (In Chinese) [Google Scholar]
- Lace, M.J.; Mylroie, J.E. Coastal Karst Landforms; Springer: Dordrecht, The Netherlands; Heidelberg, Germany; New York, NY, USA; London, UK, 2013; pp. 1–300. [Google Scholar]
- Mylroie, J.E.; Jenson, J.W.; Taborosi, D. Karst features of Guam in terms of a general model of carbonate island karst. J. Cave Karst Stud. 2001, 63, 9–22. [Google Scholar]
- Moore, P.J.; Martin, J.B.; Screaton, E.J.; Neuhoff, P.S. Conduit enlargement in an eogenetic karst aquifer. J. Hydrol. 2010, 393, 143–155. [Google Scholar] [CrossRef]
- White, S.; Webb, J.A. The influence of tectonics on flank margin cave formation on a passive continental margin: Naracoorte, Southeastern Australia. Geomorphology 2015, 229, 58–72. [Google Scholar] [CrossRef]
- Mylroie, J.E; Carew, J.L.; Vacher, H.L. Karst development in the Bahamas and Bermuda. In Terrestrial and Shallow Marine Geology of the Bahamas and Bermuda; Curran, H.A., White, B., Eds.; Geological Society of America Special Paper: Colorado Boulder, CO, USA, 1995; pp. 251–267. [Google Scholar]
- Mylroie, J.E.; Carew, J.L. Speleogenesis in coastal and oceanic settings. In Evolution of Karst Aquifers; Klimchouk, A.B., Ford, D.C., Palmer, A.N., Eds.; National Speleological Society: Huntsville, Alabama, USA, 2000; pp. 26–33. [Google Scholar]
- Mylroie, J.E; Carew, J.L. Karst development on carbonate islands. Speleogenesis Evol. Karst Aquifers 2003, 1, 1–21. [Google Scholar]
- Smart, P.L.; Beddows, P.A.; Coke, J.; Doerr, S.; Smith, S.; Whitaker, F.F. Cave development on the Caribbean coast of the Yucatan Peninsula, Quintana Roo, Mexico. In Perspectives on Karst Geomorphology, Hydrology, and Geochemistry; Harmon, R.S., Wicks, C., Eds.; Geological Society of America Special Paper 404: Bouldr, CO, USA, 2006; pp. 105–128. [Google Scholar]
- Baceta, J.I.; Wright, V.P.; Beavington-Penney, S.J.; Pujalte, V. Palaeohydrogeological control of palaeokarst macro-porosity genesis during a major sea-level lowstand: Danian of the Urbasae Andia Plateau, Navarra, North Spain. Sediment. Geol. 2007, 199, 141–169. [Google Scholar] [CrossRef]
- Dou, Q.F.; Sun, Y.F.; Sullivan, C. Paleokarst system development in the San Andres Formation, Permian Basin, revealed by seismic characterization. J. Appl. Geophys. 2011, 75, 379–389. [Google Scholar] [CrossRef]
- Hu, M.Y.; Qian, Y.; Hu, Z.G.; Wang, Y.Q.; Xiang, J. Carbon isotopic and element geochemical responses of carbonate rocks and Ordovician sequence stratigraphy in Keping area, Tarim Basin. Acta Petrol. Mineral. 2010, 29, 199–205. (In Chinese) [Google Scholar]
- Deng, X.L.; Zhang, Q.Y.; Liang, B.; Dan, Y. Reconstruction of karst palaeogeomorphology for the Ordovician Yingshan Formation in the central Tarim Basin. Carsol. Sin. 2015, 34, 154–158. (In Chinese) [Google Scholar]


| Spot ID | Analyzing Item | MgO (wt %) | Al2O3 (wt %) | SiO2 (wt %) | K2O (wt %) | CaO (wt %) | Mn (ppm) | Fe (ppm) | Fe/Mn | Sr (ppm) | Ba (ppm) | Sr/Ba | Identification of Paleokarst Environment | ||
|---|---|---|---|---|---|---|---|---|---|---|---|---|---|---|---|
| Sr/Ba | Fe/Mn | Environments | |||||||||||||
| a-1 | Calcite in karst caves | 0.042 | 0.392 | 0.604 | 0.199 | 55.050 | 0 | 529 | / | 0 | 0 | / | / | <1 | Cannot identify |
| a-2 | 0.018 | 0.032 | 0.037 | 0.040 | 55.649 | 403 | 54 | 0.13 | 0 | 179 | 0 | ||||
| a-3 | 0.019 | 0.042 | 0.136 | 0.059 | 55.746 | 279 | 443 | 1.59 | 0 | 0 | / | ||||
| a-4 | Limestone grains in karst caves | 0.194 | 0.094 | 0.070 | 0.028 | 55.546 | 116 | 0 | 0 | 152 | 0 | / | >1 | / | Seawater |
| a-5 | 0.197 | 0.343 | 0.590 | 0.102 | 55.027 | 62 | 342 | 5.52 | 0 | 18 | 0 | <1 | ≈5 | Freshwater | |
| a-6 | 0.404 | 0.038 | 0.132 | 0.063 | 55.269 | 0 | 490 | / | 381 | 0 | / | >1 | / | Seawater | |
| a-7 | Clay in karst caves | 2.040 | 28.133 | 41.72 | 10.722 | 0.766 | 318 | 12,903 | 40.58 | 0 | 152 | 0 | <1 | >5 | |
| a-8 | 2.069 | 26.849 | 39.381 | 9.815 | 1.213 | 372 | 6510 | 17.50 | 0 | 152 | 0 | Freshwater | |||
| a-9 | 1.927 | 27.916 | 41.316 | 10.239 | 1.262 | 225 | 6844 | 30.42 | 0 | 242 | 0 | ||||
| b-1 | Calcite in karst caves | 0.198 | 1.010 | 1.661 | 0.267 | 53.479 | 0 | 1680 | / | 0 | 0 | / | >1 | ≈1 | |
| b-2 | 0.076 | 0.153 | 0.203 | 0.058 | 55.497 | 0 | 529 | / | 0 | 0 | / | Seawater | |||
| b-3 | 0.132 | 0.566 | 0.267 | 0.018 | 55.082 | 132 | 210 | 1.59 | 676 | 0 | / | ||||
| c-1 | Calcite in karst caves | 0.070 | 0.081 | 0.187 | 0.046 | 55.593 | 0 | 319 | / | 617 | 125 | 4.94 | >1 | / | |
| c-2 | 0.018 | 0.039 | 0.180 | 0.014 | 55.785 | 0 | 506 | / | 0 | 0 | / | Seawater | |||
| c-3 | 0.086 | 0.197 | 0.409 | 0.041 | 55.246 | 0 | 1291 | / | 0 | 0 | / | ||||
| d-1 | Calcite cement of calcarenite in upper karst caves | 0.150 | 0.065 | 0.172 | 0.012 | 55.525 | 0 | 630 | / | 592 | 0 | / | >1 | ≈1 | |
| d-2 | 0.088 | 0.112 | 0.079 | 0.014 | 55.696 | 0 | 482 | / | 0 | 0 | / | Seawater | |||
| d-3 | 0.132 | 0.566 | 0.267 | 0.018 | 55.082 | 132 | 210 | 1.59 | 676 | 0 | / | ||||
| e-1 | Arenite grains of calcarenite in upper karst caves | 0.208 | 0.097 | 0.153 | 0 | 55.462 | 0 | 179 | / | 0 | 0 | / | >1 | ≈5 | |
| e-2 | 0.168 | 0.574 | 0.385 | 0 | 55.034 | 85 | 389 | 4.58 | 101 | 215 | 0.47 | Freshwater | |||
| e-3 | 0.179 | 0.033 | 0.119 | 0.010 | 55.648 | 0 | 0 | / | 0 | 0 | / | ||||
© 2018 by the authors. Licensee MDPI, Basel, Switzerland. This article is an open access article distributed under the terms and conditions of the Creative Commons Attribution (CC BY) license (http://creativecommons.org/licenses/by/4.0/).
Share and Cite
Dan, Y.; Lin, L.; Liang, B.; Zhang, Q.; Yu, Y.; Cao, J.; Li, J. Eogenetic Karst Control of Carbonate Reservoirs during a Transient Exposure: A Case Study of the Ordovician Yingshan Formation in the Northern Slope of the Tazhong Uplift, Tarim Basin, China. Minerals 2018, 8, 345. https://doi.org/10.3390/min8080345
Dan Y, Lin L, Liang B, Zhang Q, Yu Y, Cao J, Li J. Eogenetic Karst Control of Carbonate Reservoirs during a Transient Exposure: A Case Study of the Ordovician Yingshan Formation in the Northern Slope of the Tazhong Uplift, Tarim Basin, China. Minerals. 2018; 8(8):345. https://doi.org/10.3390/min8080345
Chicago/Turabian StyleDan, Yong, Liangbiao Lin, Bin Liang, Qingyu Zhang, Yu Yu, Jianwen Cao, and Jingrui Li. 2018. "Eogenetic Karst Control of Carbonate Reservoirs during a Transient Exposure: A Case Study of the Ordovician Yingshan Formation in the Northern Slope of the Tazhong Uplift, Tarim Basin, China" Minerals 8, no. 8: 345. https://doi.org/10.3390/min8080345
APA StyleDan, Y., Lin, L., Liang, B., Zhang, Q., Yu, Y., Cao, J., & Li, J. (2018). Eogenetic Karst Control of Carbonate Reservoirs during a Transient Exposure: A Case Study of the Ordovician Yingshan Formation in the Northern Slope of the Tazhong Uplift, Tarim Basin, China. Minerals, 8(8), 345. https://doi.org/10.3390/min8080345