Metal Sequestration through Coupled Dissolution–Precipitation at the Brucite–Water Interface


1
German Research Centre for Geosciences (GFZ), Interface Geochemistry, 14473 Potsdam, Germany
2
Institut für Mineralogie, University of Münster, 48149 Münster, Germany
3
Department of Chemistry, The Institute for Geoscience Research (TIGeR), Curtin University, 6845 Perth, Australia
4
School of Earth and Environment, University of Leeds, Leeds LS2 9JT, UK
5
Department of Earth Sciences, Freie Universität Berlin, 12249 Berlin, Germany
*
Author to whom correspondence should be addressed.
Minerals 2018, 8(8), 346; https://doi.org/10.3390/min8080346
Submission received: 18 July 2018
/
Revised: 6 August 2018
/
Accepted: 7 August 2018
/
Published: 10 August 2018
(This article belongs to the Special Issue Mineral Surface Reactions at the Nanoscale)
Abstract
:The increasing release of potentially toxic metals from industrial processes can lead to highly elevated concentrations of these metals in soil, and ground- and surface-waters. Today, metal pollution is one of the most serious environmental problems and thus, the development of effective remediation strategies is of paramount importance. In this context, it is critical to understand how dissolved metals interact with mineral surfaces in soil–water environments. Here, we assessed the processes that govern the interactions between six common metals (Zn, Cd, Co, Ni, Cu, and Pb) with natural brucite (Mg(OH)2) surfaces. Using atomic force microscopy and a flow-through cell, we followed the coupled process of brucite dissolution and subsequent nucleation and growth of various metal bearing precipitates at a nanometer scale. Scanning electron microscopy and Raman spectroscopy allowed for the identification of the precipitates as metal hydroxide phases. Our observations and thermodynamic calculations indicate that this coupled dissolution–precipitation process is governed by a fluid boundary layer at the brucite–water interface. Importantly, this layer differs in composition and pH from the bulk solution. These results contribute to an improved mechanistic understanding of sorption reactions at mineral surfaces that control the mobility and fate of toxic metals in the environment.
1. Introduction
The presence and behavior of metals in the environment is of increasing concern to society, as their increasing release from industrial processes poses a major threat to ecosystems and human health [1,2,3]. Consequently, research is needed to present possible remediation strategies [4]. In very low quantities, some metals, such as, iron (Fe), cobalt (Co), zinc (Zn), copper (Cu), manganese (Mn), and molybdenum (Mo), are vital to living organisms, as they are required for various physiological and biochemical processes [5]. However, above certain threshold concentrations they become toxic to all living systems. For some elements, such as copper, there is a very narrow range between dietary (<0.9 mg/day) and toxic effects (>10 mg/day) [6]. Other metals, such as cadmium (Cd), nickel (Ni), tin (Sn), lead (Pb), mercury (Hg), or chromium (Cr), are considered as non-essential elements. Although nickel is known to play an important role for some plants and microorganisms, its requirement as an essential element for higher organisms is disputed and larger doses or chronic exposure to nickel can lead to serious health problems such as lung fibrosis and skin dermatitis [7]. Nickel compounds are also classified by the International Agency for Research on Cancer (IARC) as human carcinogens. Of particular concern to human health are also lead and cadmium, which have been shown to have high toxicities or carcinogenic effects even at low levels of exposure [8]. Lead poisoning, for example, can lead to damages of the brain, kidneys, liver, and the central nervous system [9].
Metals occur as oxides, sulfides, carbonates, or silicates in rocks of the Earth’s crust, and they may dissolve into our groundwater through natural processes such as weathering and erosion. However, direct or indirect discharges from industrial activities and wastes can lead to highly elevated metal concentrations in soil and water. Waste containing high metal loads is produced by various industries including mining operations, metal plating facilities, fertilizer industries, and petroleum refining industries, as well as battery, paper, and pigment industries [4,10,11]. All of these processes generate large quantities of hazardous wastewaters, residues, and sludge, whose metal concentrations can reach extremely high levels well in excess of 1000 mg/L [11], and therefore require extensive waste treatment. Particular concerns may also arise from abandoned mining and smelting sites, where, after the cessation of industrial activity, the release of acidic and metalliferous waters continues for many years [12,13]. Metal concentrations in such settings typically range from tens to several hundreds of mg/L [14].
In the context of remediation, it is, however, crucial to understand the speciation, toxicity, mobility, and bioavailability of toxic metals. This is because, to a large degree the behaviour of these metals is controlled by reactions taking place at mineral surfaces in the soil environment, often involving coupled dissolution and precipitation, adsorption, ion exchange, and oxidation/reduction processes. Also, ion-binding to organic matter or metal oxide/hydroxide surfaces has an important impact on the mobility and transport of metals in soils and water [1,2,3,15]. The rates of these processes depend on multiple factors, such as pH, Eh, temperature, and the presence of complexing agents including organic molecules [1,2,3,10]. Unlike organic pollutants, metals are not biodegradable and tend to accumulate in living organisms. Therefore, the efficient removal and immobilization of toxic metals from industrial effluents and contaminated groundwater and soil is of enormous importance for protecting the environment and human health. The technologies that are being applied rely on various processes, such as chemical precipitation, ion exchange, adsorption, flotation, or electrochemical deposition [4,10,11]. Chemical precipitation is one of the most widely used methods because of its simplicity and low cost. It typically involves the addition of a precipitant that brings the pH into the basic range to cause the precipitation of metal hydroxides. The most commonly used precipitants include NaOH, lime (CaO), calcite (CaCO3), and portlandite (Ca(OH)2) [16,17]. However, these are not always able to reduce the metal load to an acceptable level [18]. For example, calcite dissolution buffers the pH to values between 6 and 7, which allows for the efficient hydroxide precipitation of trivalent metals such as Fe3+ or Cr3+, but is not high enough for divalent metals (including Zn2+, Cd2+, Co2+, Pb2+, Cu2+, and Ni2+). On the other hand, lime, portlandite, and NaOH, when used in excess, can easily raise the pH to levels above 12, which is too high, as the solubility of many metal hydroxides increases again at very high pH values.
Magnesium hydroxide (Mg(OH)2), prepared from the hydration of magnesium oxide (MgO) or in the form of the natural mineral brucite, is considered to be an attractive alternative reagent because its dissolution buffers the solution pH between 8.5 and 10, where most divalent metals are the least soluble [18]. The relatively low solubility of Mg(OH)2 ensures a slow release of OH−, thus providing a long-term source of alkalinity. It has already been demonstrated in various laboratory and field experiments that Mg(OH)2 can effectively remove a range of metals, such as Cr, Cd, Pb, Ni, Zn, Co, and Cu, from highly contaminated water [14,18,19,20,21,22,23,24,25,26]. In the case of bulk Mg(OH)2 powder, the major mechanism of metal removal is assumed to be precipitation. On the other hand, adsorption is generally considered to be the principal immobilization mechanism for some recently developed MgO- and Mg(OH)2-based nanomaterials, which are potentially useful in water remediation applications [27,28,29,30,31,32,33,34]. However, direct nanoscale insights into the dissolution–precipitation reactions at the interface between Mg(OH)2 and metal-containing solutions are so far lacking, because previous studies have mainly focused on the bulk efficiency of metal removal by Mg(OH)2.
In this research, we have studied the interaction between natural brucite and six common metals (Ni, Cu, Co, Zn, Cd, and Pb) that are often found at elevated concentrations in contaminated soil and groundwater. Our main objectives were (1) to characterize and quantify the spatial and temporal coupling between brucite dissolution and the subsequent nucleation and growth of metal precipitates and (2) to assess the role of such coupled dissolution–precipitation reactions in controlling the immobilization of metals. Brucite is of high relevance in this context, not only because of its direct applicability in water remediation, but also because its simple, layered structure is a fundamental building unit in a wide range of minerals. Examples include layered double hydroxides (LDH) as well as trioctahedral phyllosilicates, such as chlorite and saponite clays. These minerals are common constituents of natural soils and have been extensively studied in the past because their large surface areas and cation exchange capacities make them potentially useful adsorbents or ion exchangers for the removal of environmental contaminants [35,36]. Hence, our results may also provide more fundamental insights into how metals are immobilized at mineral surfaces in the environment.
2. Materials and Methods
2.1. Atomic Force Microscopy
All of the experiments were performed using natural brucite crystals (Tallgruvan, Norberg, Sweden). The initial, essentially monomineralic brucite rock sample contained minor amounts of dolomite, magnetite, and pyroaurite, which were avoided during the atomic force microscope (AFM) specimen preparation. Only optically clear brucite crystals were used. Immediately before each experiment, a brucite crystal was cleaved parallel to the (001) cleavage plane to expose a fresh surface. The final dimensions of the brucite specimens were ca. 3 mm × 3 mm × 0.2 mm. The aqueous metal-bearing solutions were prepared by dissolving reagent grade salts of NiSO4·6H2O, ZnSO4·7H2O, CoSO4∙7H2O, CdSO4∙8/3H2O, CuCl2∙2H2O, or PbCl2 into double-deionized water (resistivity >18 MΩ·cm). The adjustments of pH were made by adding 0.01 mol/L HCl. The concentrations were varied between 0.1 and 50 mmol/L to cover a broad range of concentrations typically found in industrial effluents as well as contaminated soil and groundwater [11,14].
The brucite (001) surfaces were imaged at room temperature (22 ± 1 °C) using a Bruker Multimode atomic force microscope (AFM) operating in contact mode. In situ experiments were performed within an O-ring sealed flow-through cell from Digital Instruments (Bruker, Billerica, MA, USA). The solutions were injected at regular time intervals between each scan (lasting ~1.5 min), giving an effective flow rate of 22 µL·s−1. The chosen flow rate was to ensure a surface-controlled reaction rather than diffusion control [37]. The time for injections, followed by the scans, was kept constant. The experiments were also performed using continuous flow by gravity feed as well as continuous flow using a pump. The results from all of the methods were similar, except that the image quality is reduced by fluid movement. Therefore, to obtain the best images, the flow was stopped during the actual scan. Si3N4 probes (NP-S10, Bruker, Billerica, MA, USA) were used for all of the AFM experiments at a scan rate of 3.81 Hz and samples/lines of 256, and occasionally 512 for better imaging. The set point was kept at 2.000 V. The scan areas were typically 3 µm × 3 µm and 5 µm × 5 µm with smaller areas (1 µm × 1 µm) chosen for closer observations. The scan angle was determined from trace and retrace matching to give accurate scanning. As tip-sample interactions can result in enhanced reaction kinetics at the surface [38], care was always taken to zoom out to a larger scan area after a number of scans in one area, in order to check for the effect of the tip. Also, new areas previously not scanned were always checked for differences or similarities. The images were analyzed using the NanoScope Analysis software (version 1.50). The step retreat velocities or etch pit spreading rates were calculated measuring the length increase of the etch pit step edges (s) per unit time in sequential images scanned in the same direction. For each experimental condition, at least five different etch pits were analyzed in 1–5 pairs of sequential images. Each etch pit spreading rate value thus represents an average of 5–25 individual measurements. In some experiments, the scanning was stopped from time to time and the solution in the fluid cell was kept static for several minutes to check the results of longer time reactions without any tip interference. In these cases, diffusion within the fluid cell took place and the reactions were not solely surface reaction controlled.
Ex situ experiments were performed following in situ AFM experiments. The reacted brucite samples were removed from the AFM fluid cell and were placed in a beaker filled with 7 mL of the different solutions at room temperature, in order to observe further reactions. After 12–48 h, the samples were recovered from the solution and quickly dried using adsorbent paper, and then immediately re-imaged in air in the AFM. We also performed ex situ experiments using the same protocol, but with “fresh” brucite crystals that had not been previously reacted in the AFM flow-through cell. In this case, the crystals were imaged only in air by AFM, before being placed into the reaction beaker, so as to ensure that the pristine surfaces were clean.
2.2. Scanning Electron Microscopy
The samples from the ex situ experiments were also imaged using an Ultra 55 Plus (Carl Zeiss Microscopy GmbH, Oberkochen, Germany) scanning electron microscope (SEM) equipped with an energy dispersive X-ray (EDX) detector for the elemental analysis of the reacted brucite surfaces and newly formed precipitates. Before imaging, all of the samples were coated with a 20 nm-thick layer of carbon and the imaging and analyses were performed at 20 keV.
2.3. Raman Spectroscopy
A confocal Raman spectrometer (LabRAM HR Evolution, Horiba Jobin Yvon, Bensheim, Germany) operating with the 532 nm line of a frequency-doubled Nd: YAG solid state laser was used for the analysis of surface precipitates on brucite, after reaction with metal-bearing solutions. Spectra in the range of 100 and 1200 cm−1 were obtained with a 100× objective lens, a 50 µm pinhole, and a grating of 1800 grooves/mm using an acquisition time 2 s × 10 s. The reference spectra of different metal phases were obtained from The RRUFF™ Project database [39].
2.4. Geochemical Modelling
The hydro-geochemical software PHREEQC [40] (version 3.2.0-9820) was used to calculate the chemical speciation and saturation state, with respect to relevant solid phases of the initial and final solutions used in the experiments. All of the calculations were done using the minteq.v4 database. The database was modified to include heterogenite (CoOOH), using a logK value of −7.973 for the reaction CoOOH + 3H+ = Co3+ + 2H2O (calculated from the standard Gibbs free energies of formation given in Chivot et al. [41]).
3. Results and Discussion
3.1. Brucite Dissolution in the Presence of Dissolved Metals
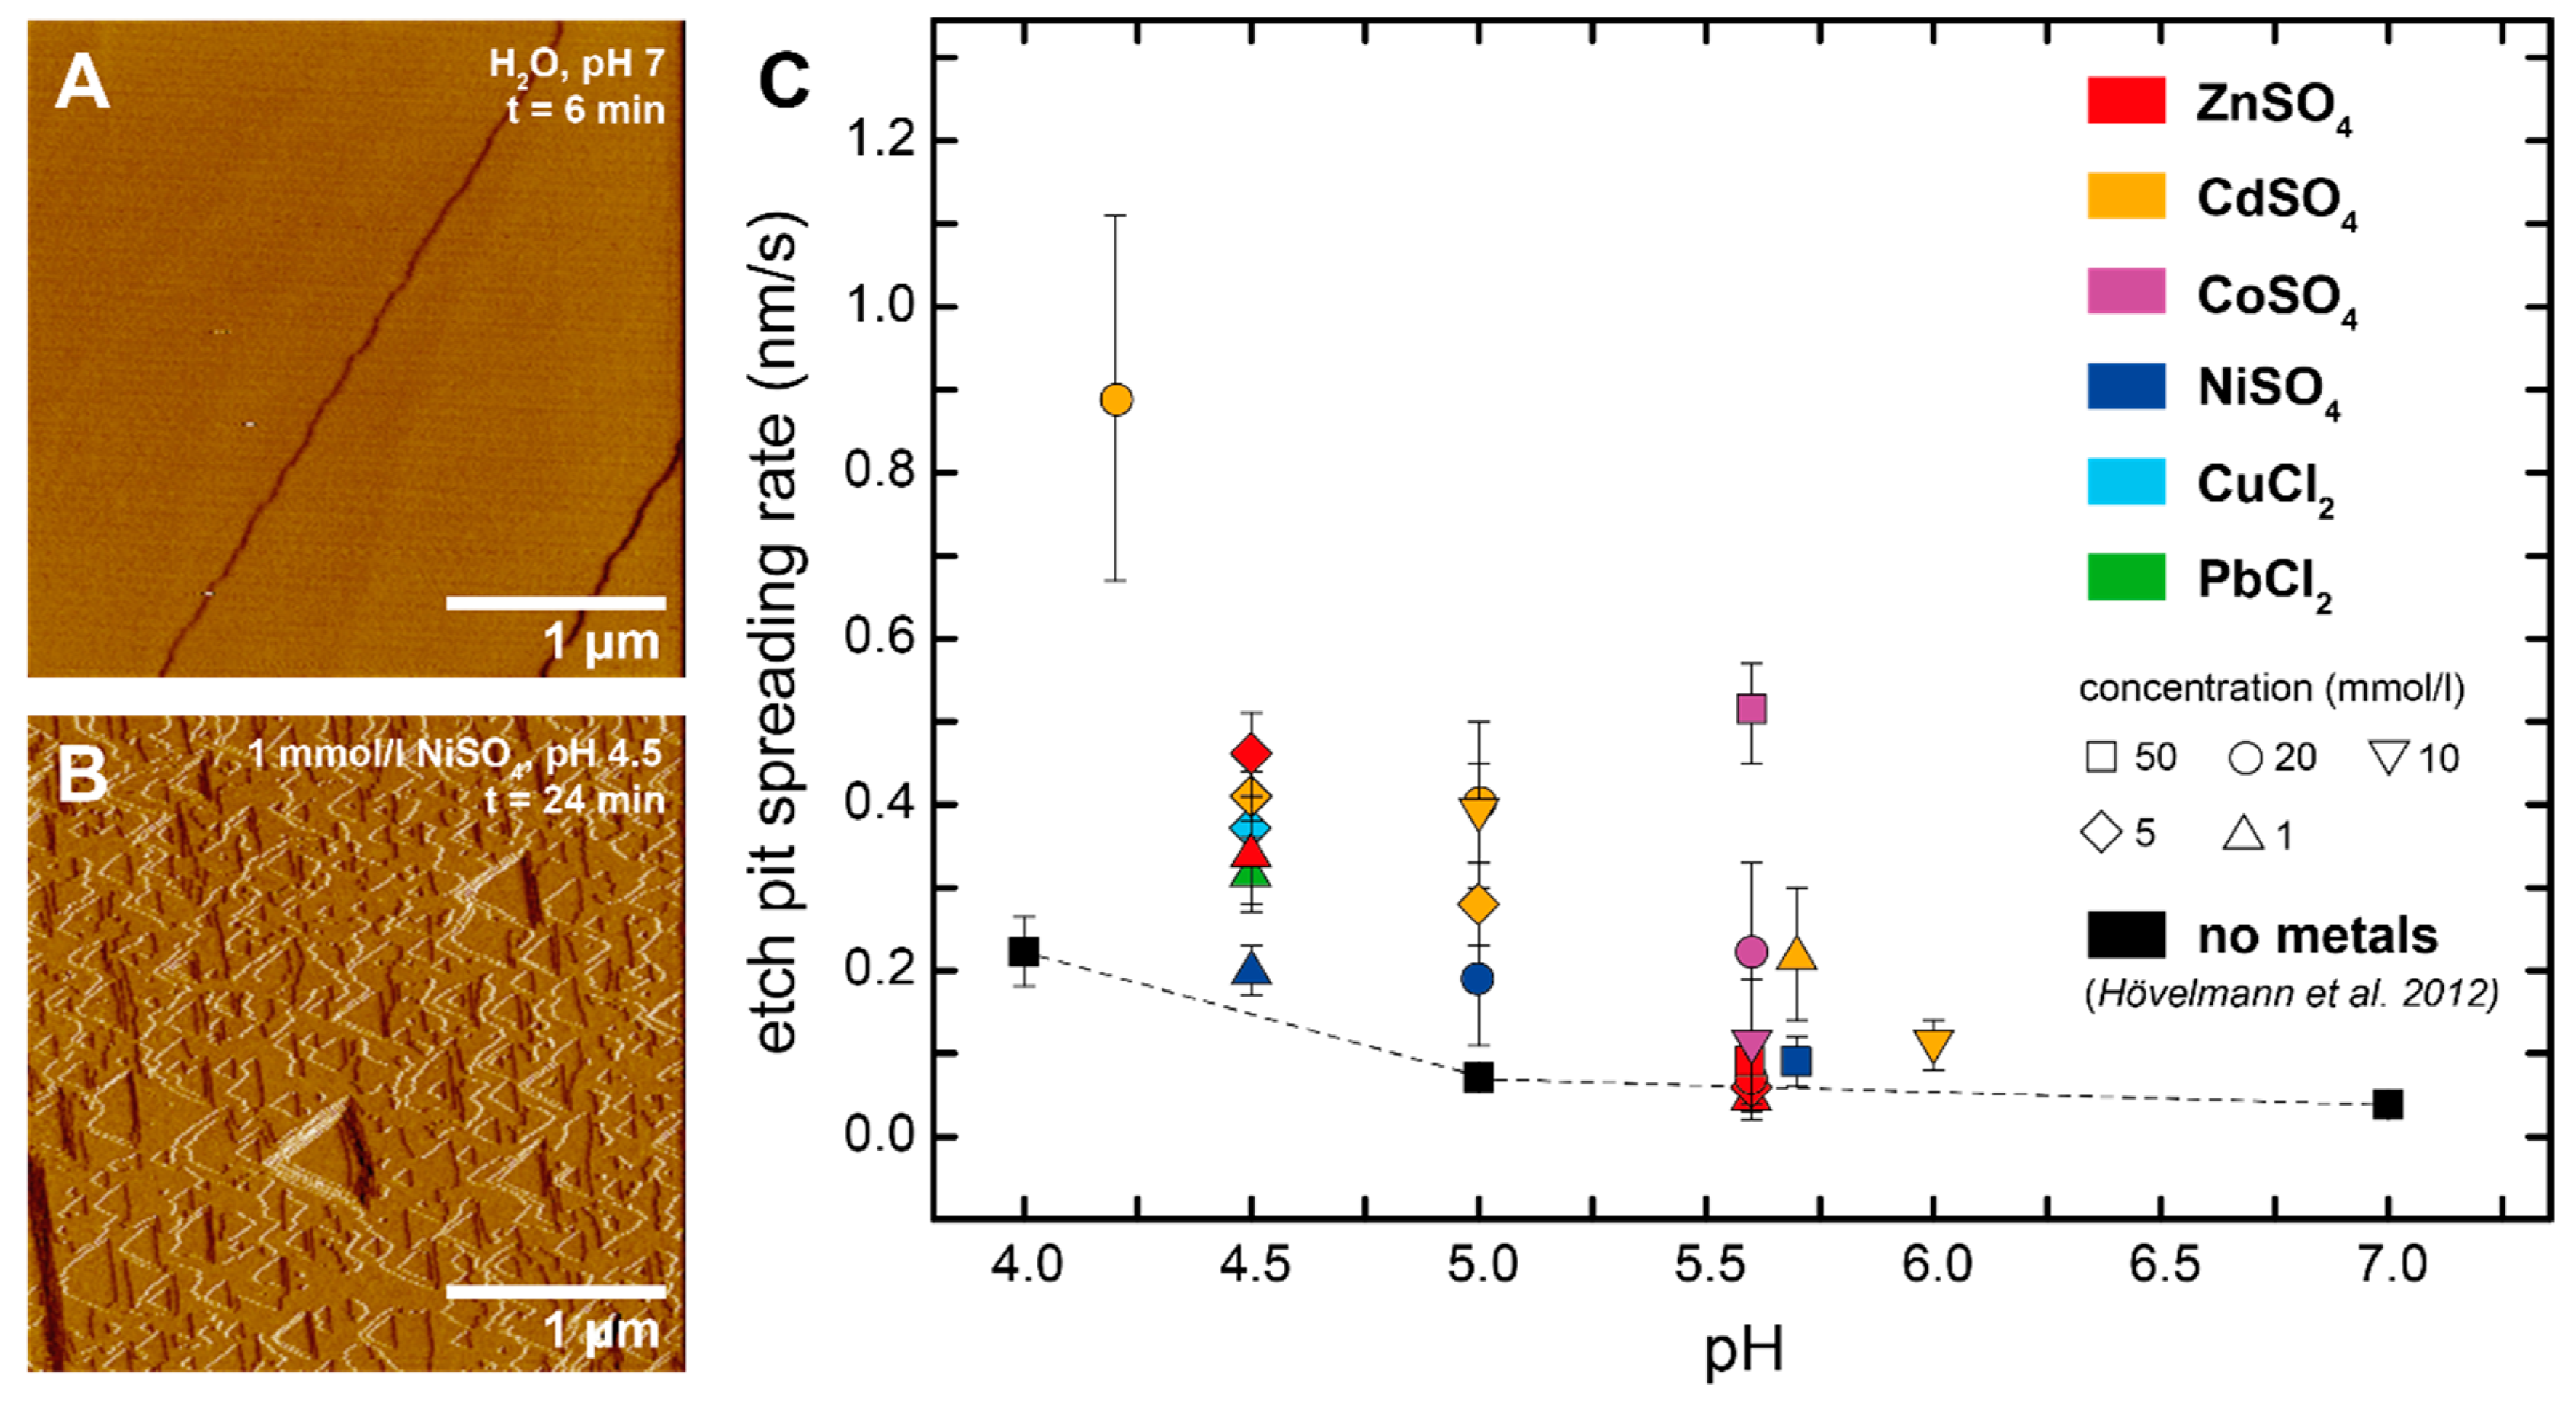
The freshly exposed brucite (001) surfaces were initially flat, apart from some pre-existing step edges (Figure 1A). Once exposed to metal bearing solutions (pH 3–6), brucite dissolution occurred with the retreat of step edges and the formation of etch pits with the typical equilateral triangular shape that results from the three-fold rotational axis normal to the (001) brucite cleavage surface [42,43] (Figure 1B). Most of the etch pits were initially shallow with depths of ~0.5 nm, corresponding to the thickness of one unit-cell layer (0.47 nm) of the brucite crystal lattice. The lateral spreading of these etch pits eventually caused them to merge, leaving behind small islands that disappeared upon further dissolution. The complete removal of one unit-cell layer was followed by the formation and spreading of new etch pits resulting in a layer-by-layer dissolution. The etch pit density was highly variable, both locally and temporally (ranging from <10 to >100 pits in a scanned area of 5 µm × 5 µm), suggesting a large heterogeneity in the distribution of the crystal defects. Some etch pits developed into deeper, concentric pits, whose slopes consisted of a high density of monolayer steps. Such pits most likely originated from structural defects that penetrate several layers, whereas the shallow monolayer etch pits nucleated at either defect-free sites or point defects [44]. Rows of deep etch pits were also frequently observed. These are likely to be associated with linear defects intersecting at the surface. Over time, the step density and roughness of the dissolving brucite surface increased because of the deepening, spreading, and subsequent coalescence of deep etch pits. Consequently, the monolayer etch pits nucleating on the narrow interstep terraces vanished quickly because of the merging with the adjacent steps.
The average spreading rate (vs) of the shallow etch pits (expressed as vs = 1/(2√3) ds/dt, where s is the side length of a triangular etch pit) was measured from successive AFM scans for several experiments. The etch pit spreading rates and their standard deviations were calculated from multiple measurements in the pH range between 4 and 6 (Table 1). Figure 1C presents the measured etch pit spreading rates at different metal concentrations between 1 and 50 mmol/L, in comparison to the metal-free rates previously reported by Hövelmann et al. [43]. Our data reveal that all six metals that were tested have a positive effect in increasing the spreading rates. This effect tended to be higher at lower pH values. For example, at pH 5.6, Zn had only a small effect compared to the Zn free system, whereas at pH 4.5, the spreading rates were almost twice as high compared with those in the metal-free solutions. Similarly, Cd at pH 6 showed only a minor effect, but gave four to five times higher rates at pH 4.2. At a given pH, the spreading rates also tended to increase with increasing metal concentration. For example, for Co at pH 5.6, we observed an increase from 0.11 ± 0.08 nm/s in 10 mmol/L to 0.51 ± 0.06 nm/s in 50 mmol/L solutions. Overall, Cd appeared to have the largest effect of all of the six metals. A two to three times dissolution rate increase was even observed at a Cd concentration of 1 mmol/L and a relatively high pH of 5.7. In contrast, Ni showed only a minor effect at this pH, even at very high concentrations of 50 mmol/L.
It has been previously shown that dissolved metals such as Cu2+, Co2+, Ni2+, Cd2+, and Al3+ can inhibit both the dissolution and growth of many oxides, carbonates, and silicates [45]. This inhibitory effect is attributed to the formation of inner-sphere binuclear/multinuclear surface complexes that bridge two (or more) dissolution active surface metal centers of the crystal lattice. It is thus thought that dissolution is inhibited because of the large activation energy that must be overcome to simultaneously remove two surface metal centers [45]. Pokrovsky et al. [46] have measured the bulk dissolution rates of brucite in the presence of eight different metals, including Ni, Co, and Pb. Brucite dissolution was found to be promoted by Pb, whereas strong inhibitory effects were observed for Ni and Co. Overall, they documented that the brucite dissolution rates in the presence of these metals correlated well with the water molecule exchange rates in the first hydration sphere of the corresponding cation.
In the present study, an inhibitory effect of Co and Ni could not be confirmed. Instead, our in situ AFM observations indicate that each of the six metals that were tested could promote brucite dissolution. The reason for this apparent discrepancy is not clear. It should, however, be noted that the etch pit spreading rate measurements are not directly comparable to the bulk dissolution rates, as in the Pokrovsky et al. [46] study. Inherent variations in the surface energies, for example, because of local differences in the number, distribution, and nature of reactive sites, make it difficult (if not impossible) to translate locally measured etch pit spreading rates into a bulk dissolution rate [47,48]. Also, during our AFM experiments, we followed dissolution only on (001) cleavage surfaces, which may be less reactive than (hk0) faces [49]. Hence, a decrease of the bulk dissolution rates could be primarily due to metal adsorption and formation of multi-dentate surface complexes at these edge surfaces. One possible explanation for our observation, that etch pit spreading rates increase in the presence of metals, could be the formation of aqueous metal–hydroxyl complexes or clusters, or the precipitation of metal hydroxide phases that consume part of the released OH− ions. In both cases, this would lower the saturation state with respect to brucite and hence increase the driving force for brucite dissolution.
3.2. Precipitation at the Dissolving Brucite Surface
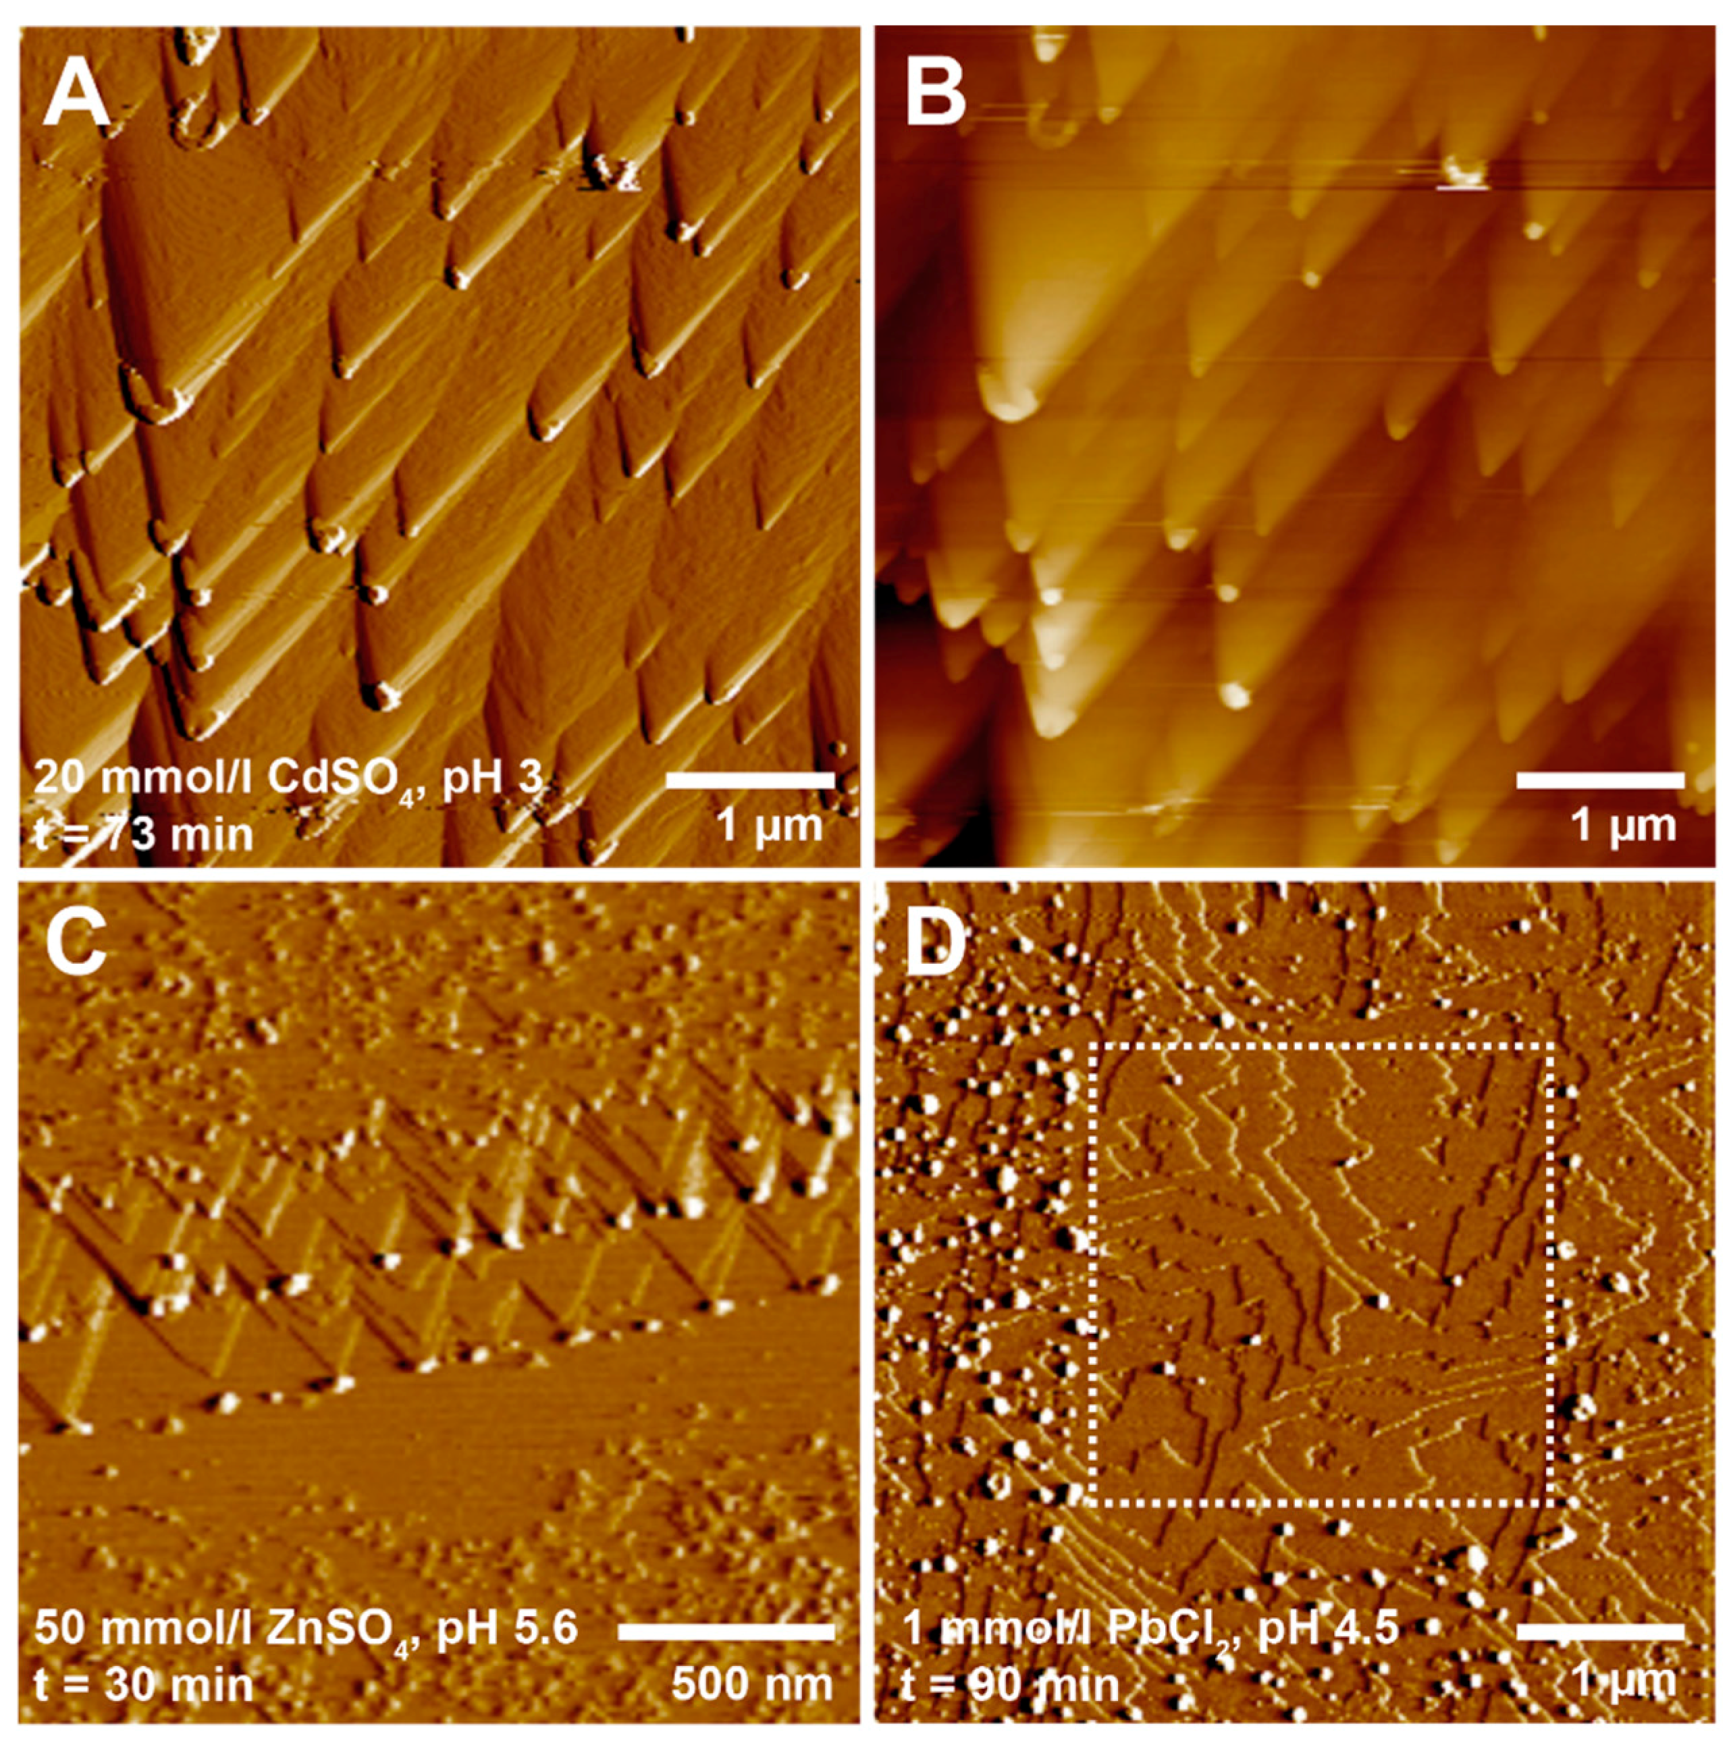
The dissolution of brucite in the metal-bearing solutions was followed by the formation of new phases. At relatively high metal concentrations (i.e., ≥10 mmol/L for Ni, Co, Zn, and Cd, and ≥1 mmol/L for Cu and Pb), precipitation was observed immediately after solution injection into the AFM fluid cell (Figure 2). Initially, the precipitates nucleated as small particles (average width 20–30 nm) with rounded shapes and average heights of just a few nanometers. They tended to form preferentially at kink sites and along step edges on the dissolving brucite surface (Figure 2A–C). At kink sites, dissolution is more intense, because of the lower coordination of Mg atoms [43,50]. Consequently, the faster release of OH− ions (along with Mg2+) may lead to a faster supersaturation in these areas. This means that the nucleation of the precipitates was rate-limited by the dissolution of brucite, and the dissolution of brucite is coupled with the precipitation of the new phase. Moreover, the higher amount of unsatisfied bonds at step edges and kink sites should result in a higher tendency to adsorb ions or molecules from solution, thus promoting nucleation. Precipitation also tended to be enhanced at lower pH values, where brucite dissolution is faster, again suggesting that dissolution was the rate-limiting step for nucleation. However, at pH <3, precipitation was no longer observed on the brucite surface, suggesting that the dissolution of brucite became kinetically too fast for nucleation to keep pace at the retreating surface.
In the earliest precipitation stages, the nucleated particles generally showed a weak adhesion to the brucite surface, as they were easily pushed aside by the AFM tip during scanning. Therefore, areas that had been scanned multiple times often had much fewer particles than the surrounding areas (Figure 2D). With time, the particles became more and more abundant on the brucite surfaces and they tended to aggregate to form larger particle clusters. In some cases, these particle clusters developed into aggregates of two-dimensional (2D) plates (see Section 3.3). However, the lateral spreading or growth of individual particles was limited, and no continuous precipitate layers formed within the time frame of our in situ AFM experiments (typically lasting 1–2 h).
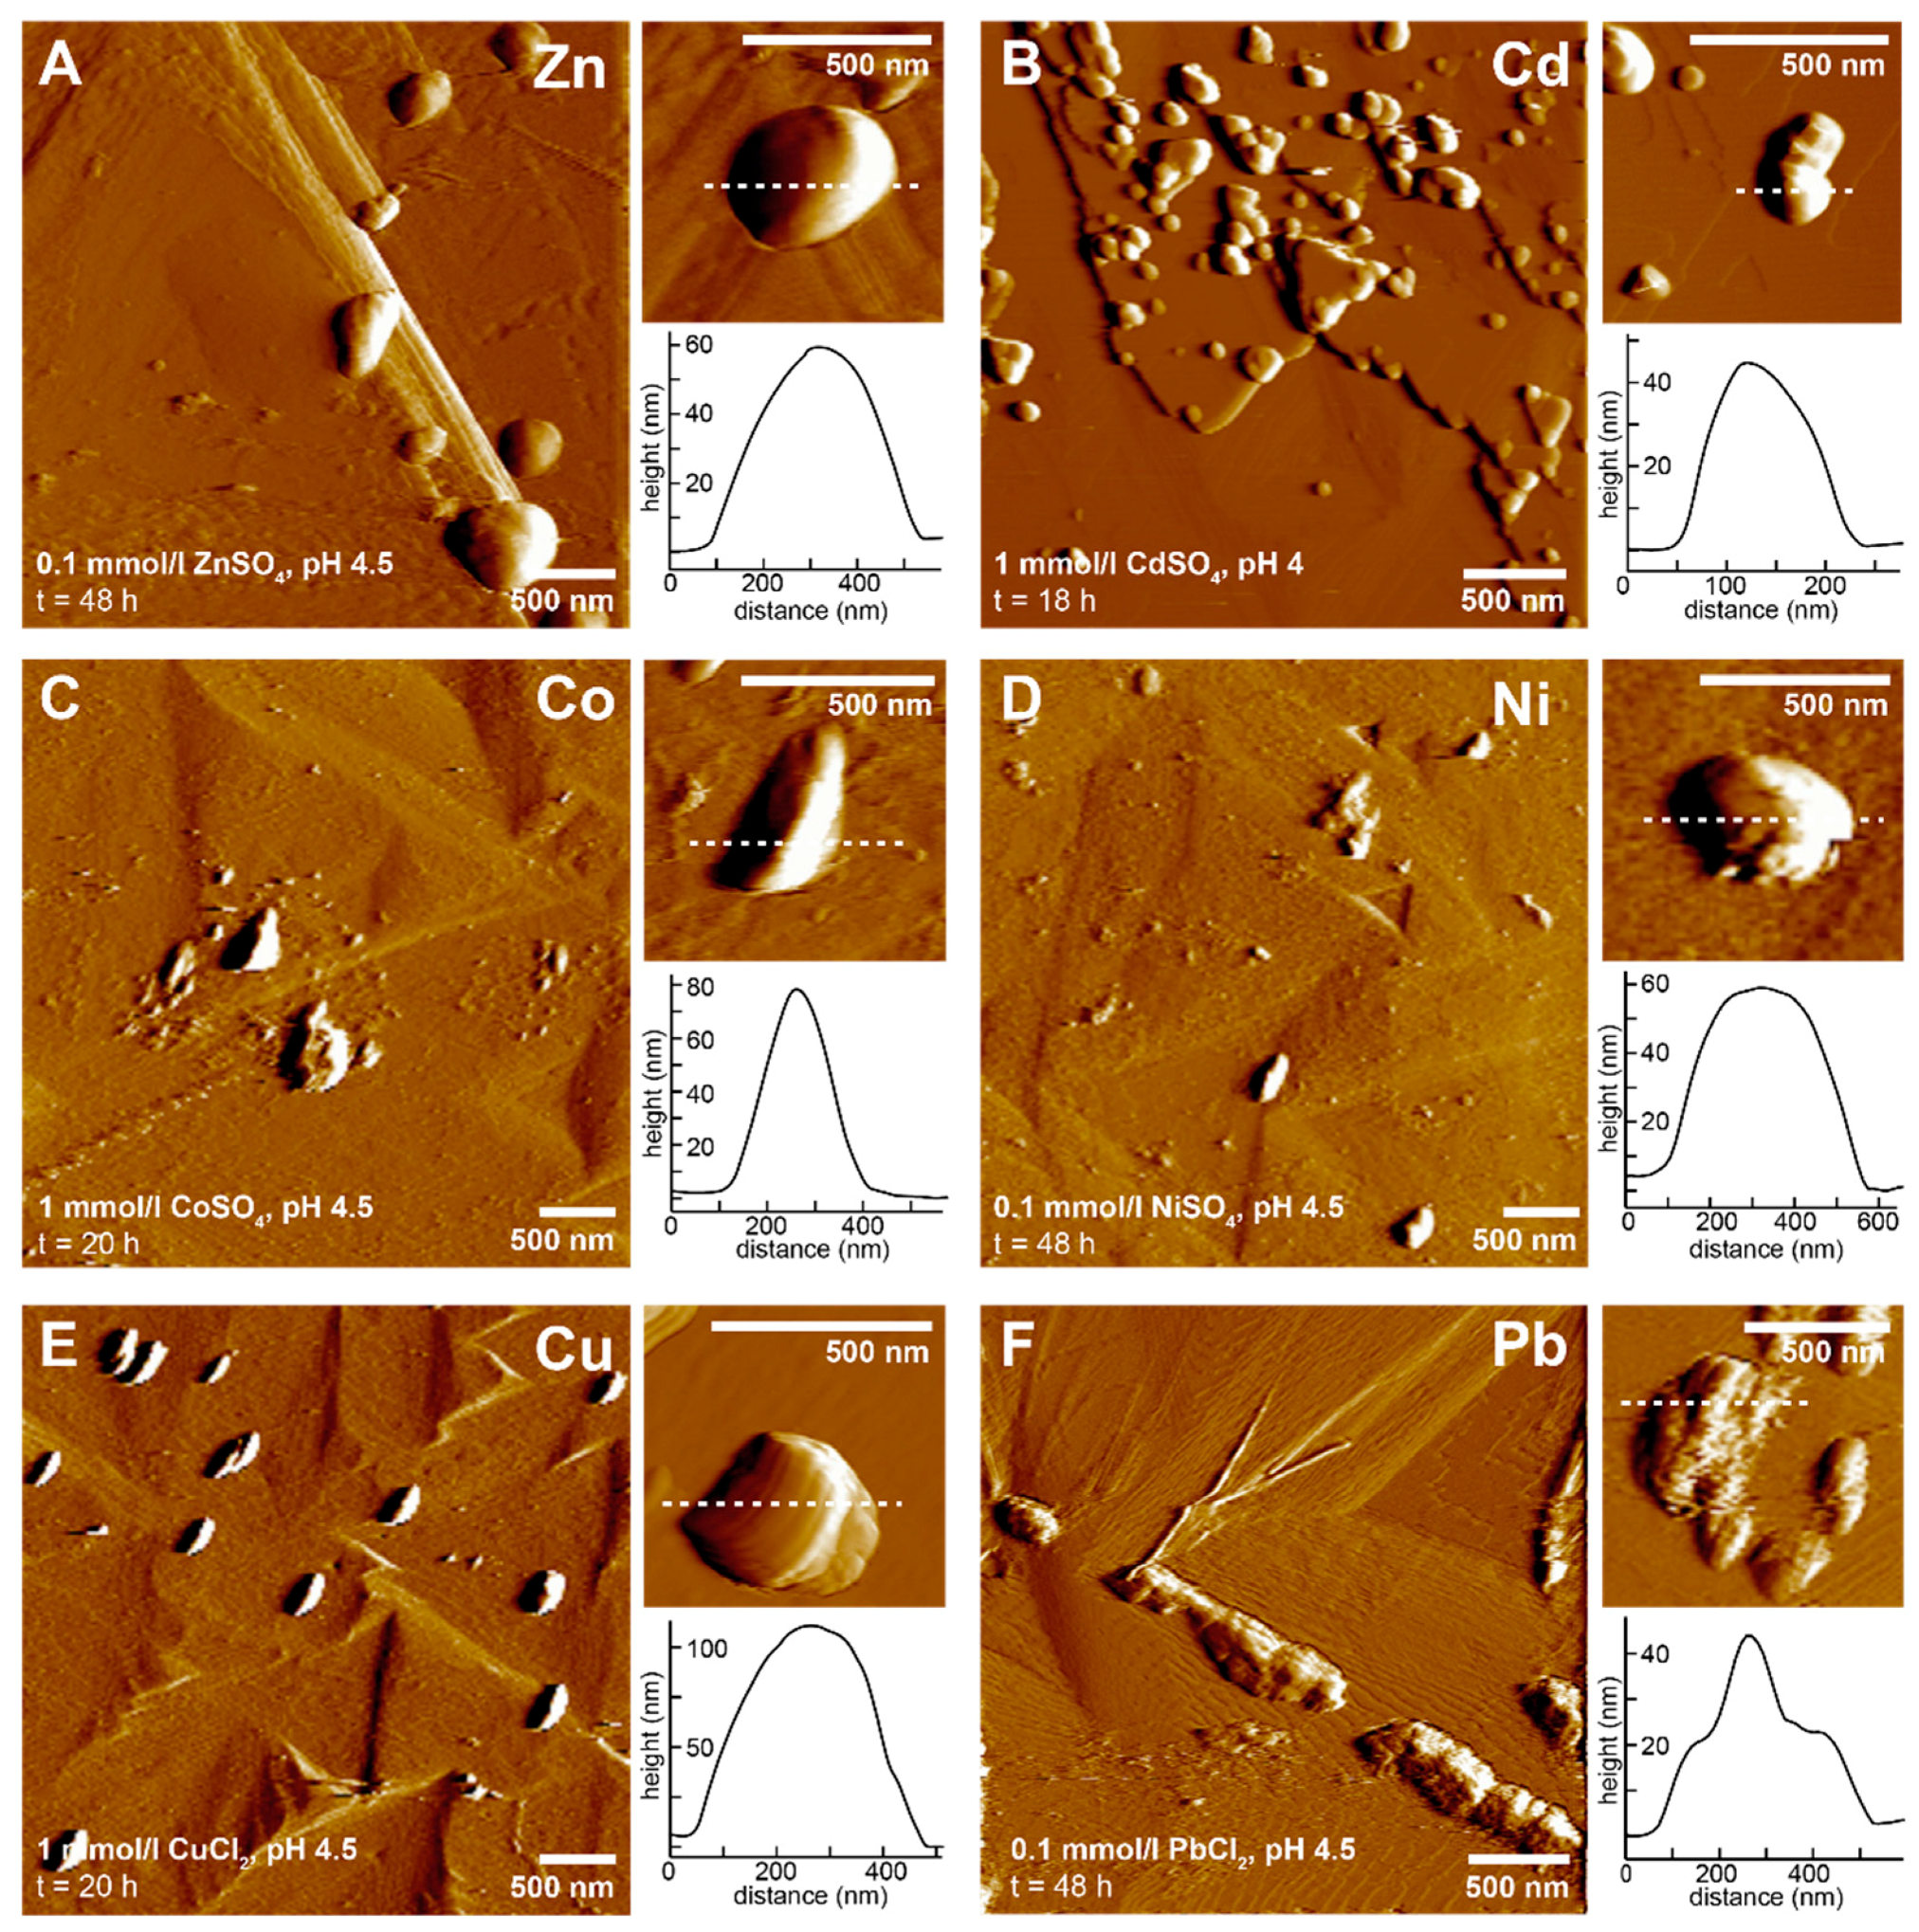
Precipitation also occurred at low concentrations (0.1–1 mmol/L) for all of the six metals (Figure 3). However, in these experiments, it typically took several hours before any particles could be observed with the AFM. For example, after 18–48 h, rounded particles or particle clusters (40–100 nm in height and 100–400 nm in diameter) were observed on all of the reacted brucite surfaces, regardless of the metal used in solution (Figure 3). Again, the precipitates were concentrated near step edges or deep etch pits (i.e., at sites of higher energy and hence enhanced dissolution). Most of the particles formed at low metal concentrations had more or less rounded shapes and showed no clear evidence of crystallographic facets, possibly indicating a poorly ordered internal structure. The clustering of particles, however, tends to indicate at least some short-range order. Moreover, some particles, such as the ones that formed in Cu-bearing solutions, were slightly elongated and showed a preferred orientation (Figure 3E). This may suggest that their nucleation and growth was, to some degree, crystallographically controlled by the underlying brucite substrate.
3.3. Identification of the Precipitates
The particles that formed at low metal concentrations were generally too small in size (<100 nm) and number to be readily characterized by SEM-EDX or Raman spectroscopy (in both cases, the spot size is usually ~1 µm). Therefore, some brucite crystals were exposed to metal solutions at high concentrations (10 mmol/L for Ni, Zn, Cd, Co, and Cu, and 1 mmol/L for Pb) for 36 h, in order to increase the amount of precipitates. The chemical and morphological characteristics of the so formed surface precipitates are shown in Figure 4, and described in the following paragraphs.
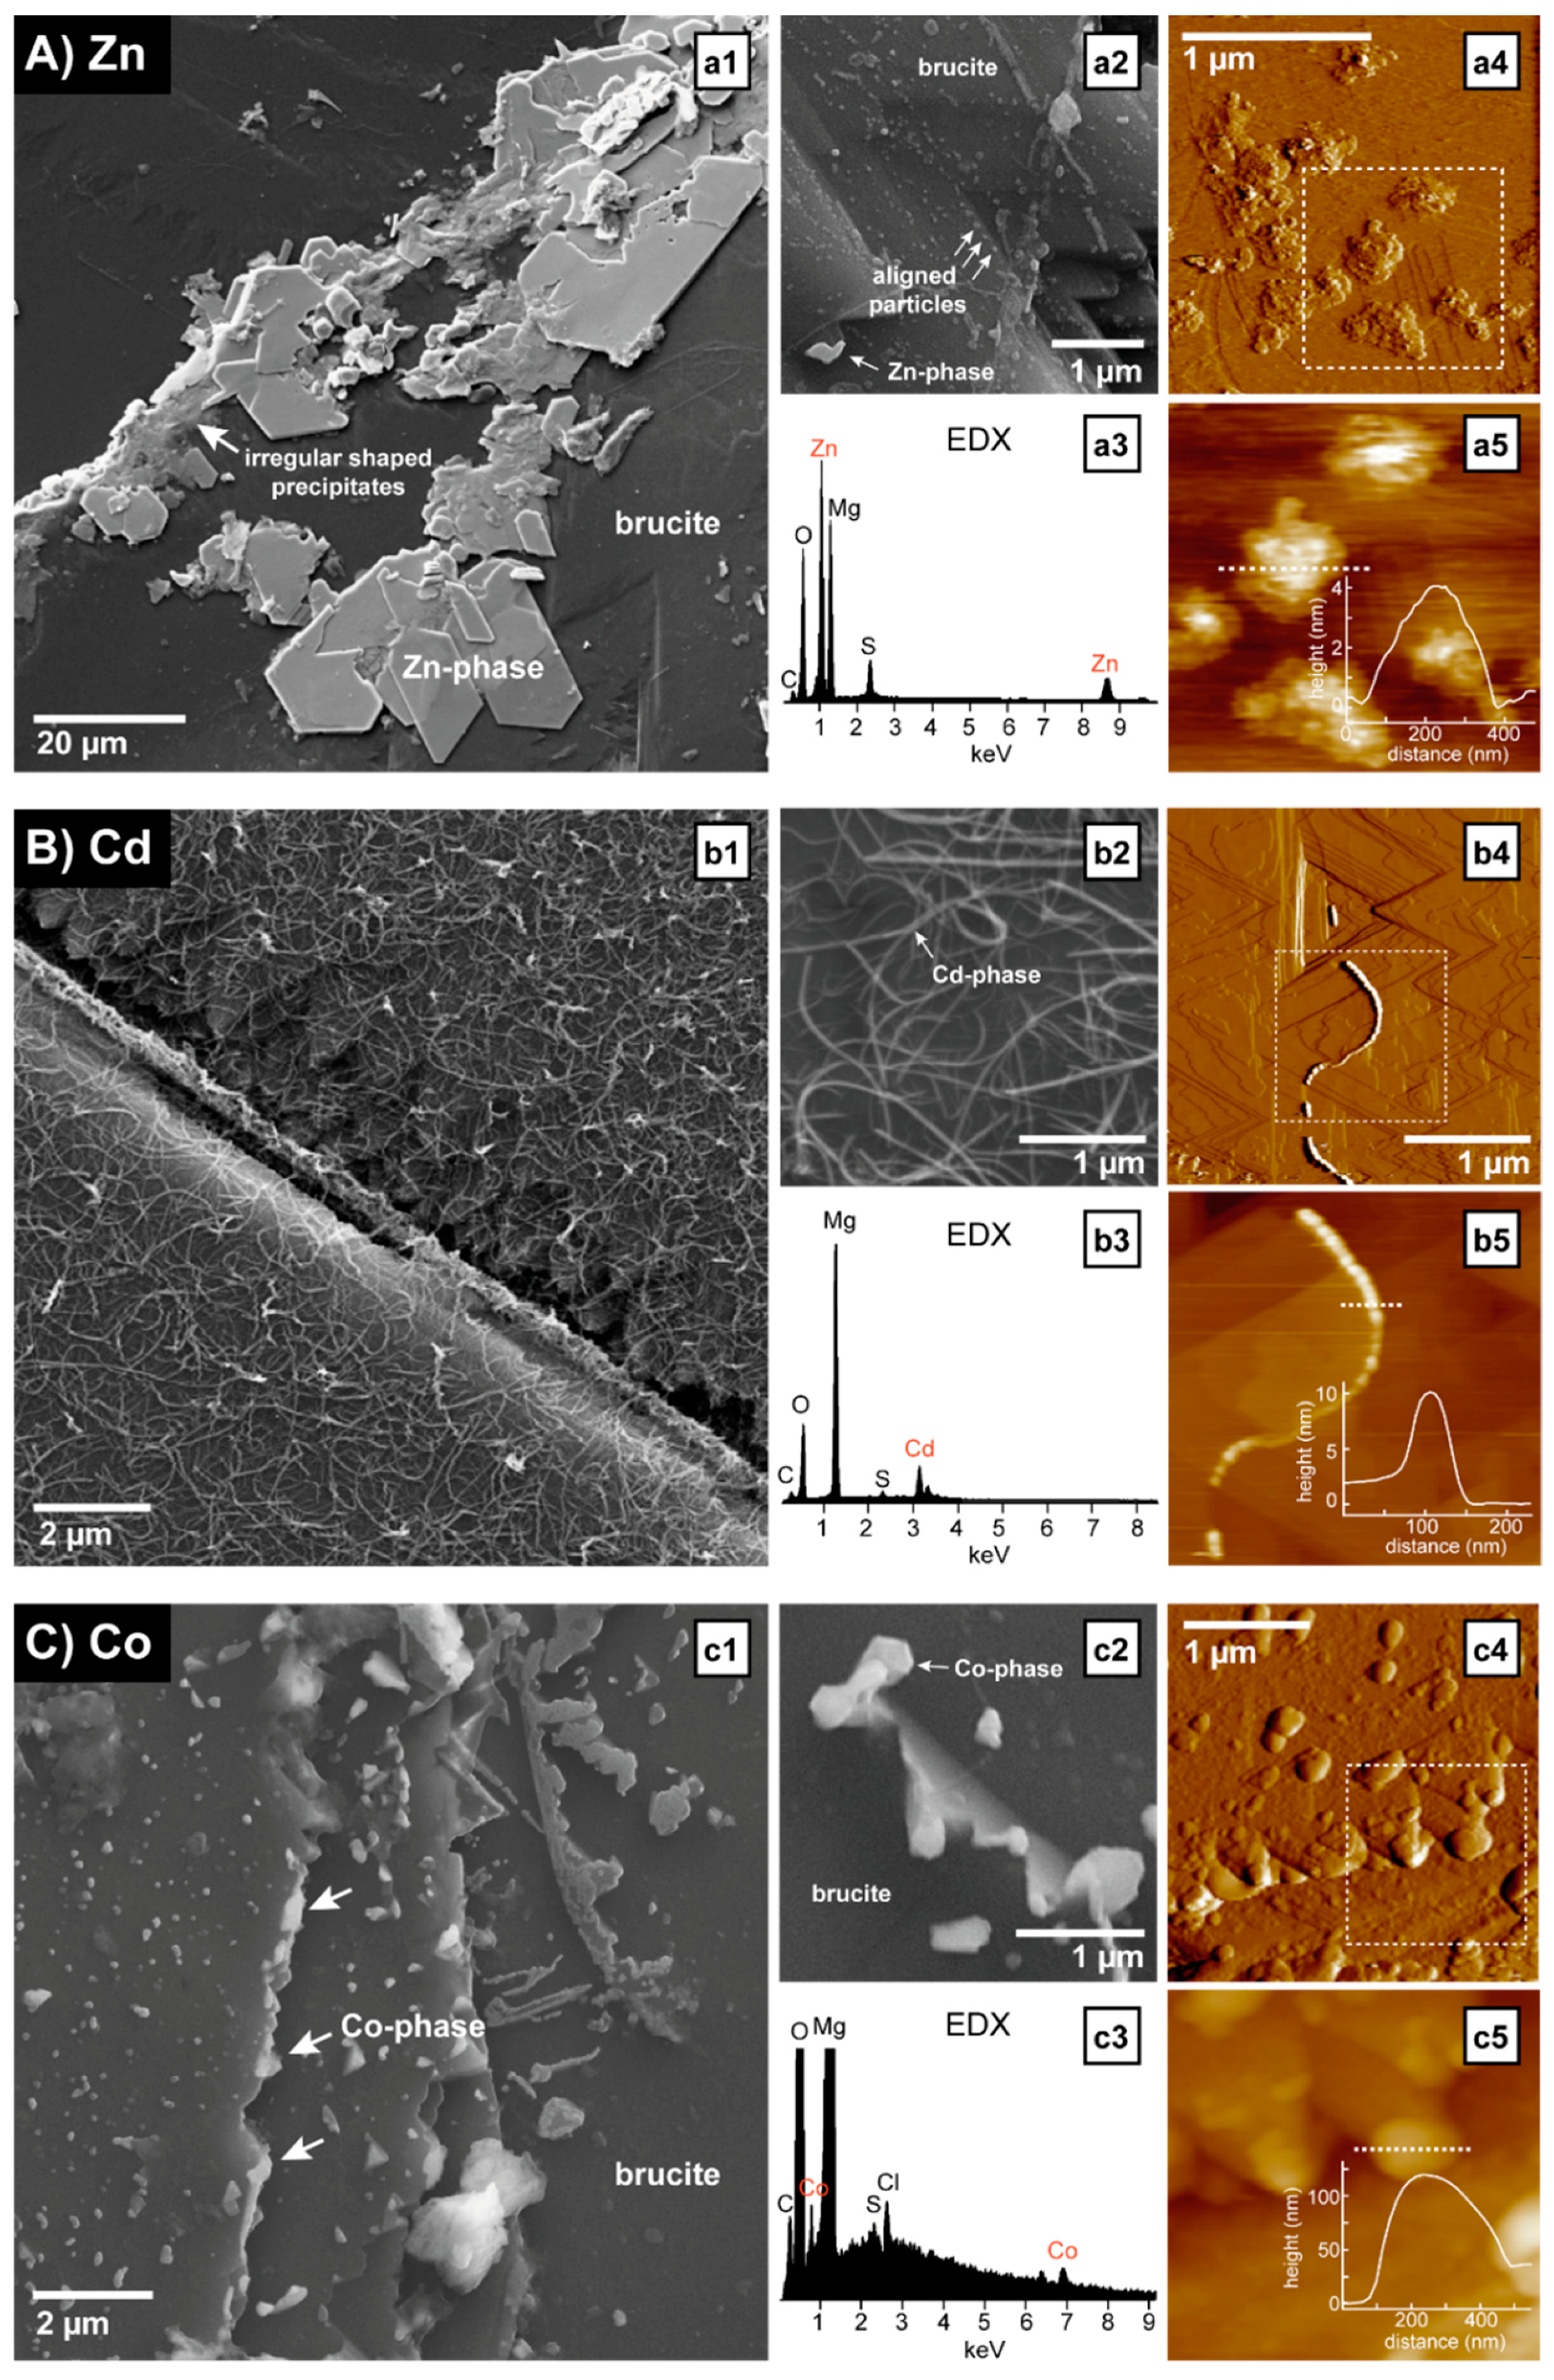
Zinc: The reaction of brucite with 10 mmol/L ZnSO4 (pH 4.5) resulted in the abundant surface precipitation of platy six-sided crystals, reaching diameters of more than 20 μm in some cases (Figure 4(a1)). Most of them were located near deep step edges and their basal planes were always parallel to the (001) cleavage surface of the underlying brucite. This non-random distribution and orientation of the crystals indicates that they formed in situ on the brucite surface and that they were not deposited onto the surface during drying. The newly formed crystals had well-developed shapes and straight edges and they were mostly formed on top of more irregular shaped precipitates (Figure 4(a1)). In addition to the larger crystals, clusters of smaller rounded particles, ca. 50–500 nm in size and often grouped in lines near step edges, etch pits, or kink sites, were also observed (Figure 4(a2)). The EDX analyses revealed the presence of Zn and S in both the large crystals and the particle clusters (Figure 4(a3)), thus confirming the formation of a Zn- and S-rich phase. The Raman spectroscopic analyses of the larger crystals produced spectra with several peaks, as shown in Figure 5A. The two peaks at 444 and 278 cm−1 are consistent with the strech/bend of Mg–O in the underlying brucite crystal [51]. The remaining peaks therefore originate from the precipitate itself. These were found to be in good agreement with the reference spectra of namuwite (Zn4(SO4)(OH)6∙4H2O) (Figure 5A). Namuwite is a zinc hydroxy-sulfate mineral that has been previously observed to form during the alkalinization of ZnSO4 solutions [52]. The early formation stages of platy precipitates (presumably namuwite) could also be imaged with AFM (Figure 4(a4,a5)). In the presence of 50 mmol/L ZnSO4 (pH 5.75), abundant precipitates were quickly formed at kink sites and along step edges. With time, these precipitates developed into flat islands that were about 100–500 nm wide and 4 nm thick, and typically consisted of several layers with irregular outlines.
Cadmium: After a reaction with 10 mmol/L CdSO4 (pH 4.5), the brucite surface was covered in thread-like precipitates (Figure 4(b1,b2)). The threads were only 50–100 nm thick, but reached lengths of more than 10 µm. The EDX analyses revealed the presence of Cd (and some minor amounts of S), possibly indicating a cadmium hydroxide phase (Figure 4(b3)). The Raman spectroscopic analysis of the reacted brucite surface produced no additional bands to those belonging to brucite. This is probably due to the thread-like precipitates being so thin that the Raman laser could not sample enough of the precipitates to produce peaks in the spectra. Hence, an exact phase identification was not possible. However, previous studies investigating Cd-precipitation from supersaturated aqueous solutions reported the formation of nanowires of crystalline Cd(OH)2, which are very similar in size and morphology to the thread-like Cd-precipitates observed in our experiments [53]. The Cd-hydroxide threads were not concentrated at specific locations, but were more or less equally distributed over the whole brucite surface. This may suggest that they were not directly formed at the brucite surface, but rather that they were nucleated in the overlying fluid layer, before being deposited onto the surface. However, they were not formed during the drying of the sample, as we also observed evidence for their formation during in situ AFM experiments (Figure 4(b4,b5)). Interestingly, the AFM images revealed that the threads are themselves made up of smaller aligned particles with diameters between 50 and 100 nm and heights of about 10 nm (Figure 4(b5)). This may suggest that they formed through a self-assembly mechanism involving the nucleation of particulate (either nanocrystalline or amorphous Cd-hydroxide, the latter with probably some short-range order) building blocks, followed by their continued oriented attachment to form one-dimensional (1D) chains.
Cobalt: Relatively sparsely distributed clusters of particles were observed on the brucite surface after 36 h in contact with 10 mmol/L CoSO4 (pH 4.5). Their diameters ranged from less than 100 nm to more than 2 µm, and they were usually more numerous and larger in areas where the dissolution was more intense, that is, near etch pits and deep step edges (Figure 4(c1)). Some particles showed platy shapes with straight edges and more or less hexagonal outlines, indicating the formation of a possible crystalline phase (Figure 4(c2)), and EDX suggests that they contained Co (along with Cl and minor S) (Figure 4(c3)). The Cl probably originates from the HCl that was added to bring the initial pH down to 4.5. Based on the elemental composition, it seems likely that the precipitate is a cobalt hydroxyl–chloride/sulfate. However, the Raman analyses showed no peaks other than those belonging to the underlying brucite, again likely due to the thinness (average <100 nm) of the precipitates. Although a higher surface coverage was observed at longer reaction times and higher Co concentrations, even after 95 h in 50 mmol/L CoSO4 the maximum thickness of the precipitates barely reached 100 nm (Figure 4(c4,c5)) and thus a conclusive identification of the formed Co crystals was not possible.
Nickel: Small particles (100–500 nm in diameter) were also formed in the presence of 10 mmol/L NiSO4 (pH 4.5) (Figure 4(d1)). In some cases, they formed larger aggregates reaching more than 2 µm in diameter. However, the coverage of the brucite surface was relatively sparse (i.e., similar to the cobalt experiment). Again, most of the particles were found in areas of enhanced dissolution, and kink sites generated during the dissolution at step edges were the preferred sites for nucleation (Figure 4(d1,d2)). Some of the larger particles had the form of 2D plates, indicating the formation of sheet-like crystals (Figure 4(d2)). The EDX analyses revealed the incorporation Ni and S into the precipitate, pointing to a nickel hydroxy-sulfate phase (Figure 4(d3)). Again, a conclusive identification by Raman spectroscopy was not possible because of the small particle sizes. The initial formation stages of these platy Ni-rich particles were also observed during in situ AFM imaging. For example, in the presence of 20 mmol/L NiSO4 (pH 5), tiny platelets, with thicknesses of only 1–2 nm and diameters of around 50 nm, were formed after 45 min at kink sites on the dissolving brucite surface (Figure 4(d4,d5)).
Copper: The brucite surface that reacted for 36 h with a solution containing 10 mmol/L CuCl2 (pH 4.5) became partly covered with patches of greenish precipitates. These were visible to the naked eye before the sample was removed from the reacting solution, and hence, they clearly are an in situ reaction product and not a drying artefact. The SEM imaging showed that the greenish patches were composed of 1–2 µm sized crystals with more or less isometric shapes (Figure 4(e1)). In addition, numerous small spherically shaped particles with diameters of ~100 nm (Figure 4(e1,e2)) were often agglomerated along step edges and steps of deep etch pits, resulting in linear structures on the brucite surface. However, they were not only observed on the brucite surface itself, but also on top of the larger, newly formed precipitate crystals, indicating that both were formed contemporaneously. The EDX analyses showed that both types of precipitates contain Cu and Cl (Figure 4(e3)). The Raman spectroscopic analysis of the larger crystals yielded spectra that agree well with the reference spectra of paratacamite (Cu2(OH)3Cl) (Figure 5B), a mineral that is commonly found as a corrosion product of copper in marine environments, and that was also observed to form in experiments where calcite was reacted with CuCl2 solutions [54,55]. Spherical Cu precipitates similar to those observed in the SEM could also be imaged with AFM on a brucite surface that was left for 20 h in a 20 mmol/L CuCl2 solution (Figure 4(e4,e5)). In the AFM experiments, these precipitates were between 100 and 200 nm in diameter and around 30 nm in height, and showed no evidence of crystallographic facets. Again, the small size of the spherical precipitates did not enable identification by Raman spectroscopy.
Lead: When brucite was reacted with 1 mmol/L PbCl2 (pH 4.5), the formation of numerous platy crystals with approximately hexagonal shapes and diameters of around 10 µm was observed (Figure 4(f1,f2)). The basal planes of these crystals were in most cases parallel to the exposed brucite (001) surface. However, crystals protruding from the surface were also observed, particularly in the most densely covered areas. Pb (and possibly minor Cl) were confirmed for these precipitates by EDX analyses (Figure 4(f3)). The Raman spectroscopic analysis of the precipitate crystals yielded spectra with an intense and sharp peak near 1050 cm−1 (Figure 5C). This peak is consistent with the CO3 symmetric stretching vibration (ν1) in hydrocerussite (Pb3(CO3)2(OH)2) [56], a basic lead carbonate that is a common weathering product in lead ore deposits and is often found in lead contaminated soil [57,58]. Hydrocerussite has a sheet-like structure and forms hexagonally shaped crystals (i.e., consistent with our SEM observations). Therefore, it seems reasonable to assume that the precipitated phase is hydrocerussite. This would imply that carbonate ions were present in the reacting solution. These must have resulted from CO2 gas exchange with the laboratory air, as no carbonate was added to the solution. In the measured Raman spectrum, the ν1 band shows a clear splitting into two bands centered at 149 and 152 cm−1 (see inset in Figure 5C). Such a splitting has also been previously observed for hydrocerussite, and is thought to be due to the carbonate ions occupying at least two different sites in the crystal lattice [56]. In addition to the ν1 band, the measured spectrum showed another broader peak at 107 cm−1, which probably relates to the lattice modes in hydrocerussite [56]. Agglomerates of the precipitates with approximately hexagonal shapes (presumably hydrocerussite) could also be imaged with AFM on a brucite surface that was left for 20 h in 1 mmol/L PbCl2 (pH 4.5) (Figure 4(f4,f5)). Interestingly, the surface of these ~6 nm thick precipitates was not flat, but showed a nanoglobular morphology, possibly suggesting that they formed through the aggregation of nanoparticles.
3.4. The Importance of the Fluid Boundary Layer
Our observations show that the dissolution of brucite in the presence of dissolved metals is coupled to the precipitation of metal hydroxide phases. Precipitation was observed for each of the six metals, and occurred at all of the concentrations tested (0.1–50 mmol/L). For selected ex situ experiments, we measured the pH of the metal solution after the reaction with brucite, in order to enable solution speciation calculations with PHREEQC. Our data show that the pH increased slightly from 4.5 to values between 5 and 6 after one to three days of interaction between a 3 mm × 3 mm × 0.2 mm brucite crystal and 7 mL of 0.1–10 mmol/L metal solutions (Table 2). The thermodynamic calculations were performed using the measured pH values and initial metal concentrations (before reaction) as input parameters. Our calculations indicate that the solutions were still undersaturated with respect to all of the relevant metal phases, including various oxides, hydroxides, carbonates, and mixed hydroxy-sulfates/chlorides (Figure 6). The only exception was the 10 mmol/L CuCl2 solution that was slightly supersaturated, with respect to atacamite (Cu2(OH)3Cl) (note: atacamite is a polymorph of the actually observed paratacamite and was used here as a proxy, as the thermodynamic data for paratacamite are not available in the database). It should be noted, however, that the calculated saturation indices are likely overestimates, because the actual metal concentrations (after reaction) were probably lower than those used for our calculations (due to precipitation and possibly adsorption at the brucite surface). The fact that we indeed observed precipitates on all of the reacted surfaces, even though the bulk solutions were undersaturated, must therefore mean that precipitation occurred within a thin fluid layer at the brucite–water interface, which differed in composition and pH from the bulk solution. A similar conclusion was also made for the reaction of brucite in the presence of dissolved carbonate, phosphate, and organic phosphorus [43,50,59], as well as for a wide range of other mineral–fluid systems [60,61,62,63,64,65]. Recently, the application of real-time phase-shift interferometry and ion-specific microelectrodes has indeed provided direct evidence that the fluid boundary layers at solid–fluid interfaces can become supersaturated with respect to new phases when the bulk solution is undersaturated [66]. The consequence of this is often a close spatial and temporal coupling between dissolution and precipitation reactions. This reaction mechanism is therefore known as the interface-coupled dissolution–precipitation mechanism, and it is thought to be a universal mechanism, whenever minerals are in contact with aqueous solutions with which they are out of equilibrium [67,68].
Eventually, the diffusion of ions from the fluid boundary layer may also lead to supersaturation of the bulk solution. The time it takes to supersaturate the bulk solution likely depends strongly on the initial liquid-to-solid ratio. In the case of our ex situ experiments, the liquid-to-solid ratio was relatively high (~1600 mL/g), resulting in a slow concentration built-up in the bulk fluid. On the other hand, if the amount of reactive brucite surface is high relative to the volume of fluid, one might expect a much faster saturation of the bulk fluid.
The coupled dissolution–precipitation reactions at the brucite surface are schematically illustrated in Figure 7, and can be summarized as follows:
Upon contact with a metal-bearing solution, the brucite surface begins to dissolve, releasing Mg2+ and OH− into the surface solution layer at the brucite–water interface (Figure 7, arrow (1)), as follows:
Mg(OH)2 → Mg2+(aq) + 2OH−(aq)
The release of OH− leads to a pH increase in the fluid boundary layer. At the sites where dissolution is enhanced (e.g., etch pits and kink sites), the pH will more rapidly reach values that promote the precipitation of metal hydroxide phases, as follows:
xMe2+(aq) + yOH−(aq) + zAa−(aq) + nH2O → Mex(OH)yAz∙nH2O
Note that in Equation (2), Me2+ represents the divalent metal cation (Zn2+, Cd2+, Co2+, Ni2+, Cu2+, or Pb2+), whereas Aa− refers to the corresponding counter anion (Cl− or SO42−).
Our observations indicate that precipitation within the brucite fluid boundary layer follows a range of different pathways, involving both classical ion-by-ion and non-classical particle-mediated nucleation and growth mechanisms [69,70] (Figure 7, arrows (2–8)). The appearance of small particles (few nm) at the dissolving brucite surface and their subsequent aggregation and fusion with adjacent particles (Figure 2 and Figure 3) suggests a heterogeneous nucleation and growth process. From our in situ AFM observations, however, it is not clear whether the initial particles nucleated directly on the brucite surface (Figure 7, arrow (2)) or if they are formed within the fluid boundary layer before attaching to the brucite surface (Figure 7, arrow (3)). The latter scenario seems likely, because the first observable particles already had sizes of a few nanometers. Thus, ionic species will likely associate within the fluid boundary layer to form nanoparticles that will attach to the surface at high energy sites. The subsequent growth of precipitates occurs then via diverse pathways, as follows: (a) Particle agglomerates at specific surface sites, such as step edges and etch pits (e.g., Figure 3 and Figure 4A,C–E), tend to indicate an aggregation process, where the successive addition of new particles occurred directly at the brucite surface (Figure 7, arrow (4)). (b) A more random distribution and arrangement of the Cd-hydroxide threads (Figure 4B) suggests that, in this case, the individual nanoparticles had already assembled within the fluid boundary layer (Figure 7, arrow (5)) before being deposited onto the brucite surface. Whether the early-formed particles were amorphous or nanocrystalline cannot be unequivocally determined from our AFM observations. Their rounded shapes and lack of clear crystallographic facets point to an amorphous or poorly ordered structure. Nevertheless, their tendency to form clusters suggests at least some short-range order. With time, some of these clusters developed into flat islands (e.g., Figure 4(a4)), possibly involving a structural rearrangement or transformation (Figure 7, arrow (6)). The further growth of these islands into microscopic, smooth-surfaced crystals (e.g., Figure 4(a1)) could have followed a classical mechanism that would require the addition of ionic species to step edges or kink sites (Figure 7, arrow (7)). However, it is also conceivable that the growth proceeded by the continued oriented attachment of nanoparticles (Figure 7, arrow (8)). In case of the Pb precipitate, the nanoglobular morphologies observed in AFM (Figure 4(f4,f5)) indeed suggest such a particle-mediated growth process. The relationships between the nm-sized particle clusters and the µm-sized crystals are, however, not always clear from our AFM and SEM observations. For the Cu-precipitates (Figure 4E), for example, it is not clear whether the large paratacamite crystals evolved from the smaller spherically shaped clusters or were formed by a separate nucleation and growth process.
4. Conclusions
Our study shows that dissolved metals such as Zn2+, Cd2+, Co2+, Ni2+, Cu2+, and Pb2+ can be sequestered as solid hydroxide phases on brucite surfaces by coupled dissolution–precipitation reactions. The dissolution of brucite in acidic metal solutions (pH 3–6) leads to the release of OH− ions, and the accompanying increase in pH then enables the precipitation of the metal hydroxides. The present results demonstrate that the precipitation of these metal hydroxides is possible even if the bulk solution is highly undersaturated. This is because supersaturation is reached only locally within a thin fluid boundary layer above the dissolving brucite surface. Thus, the dissolution of just a few monolayers of brucite may be enough to trigger the precipitation of metals. It is therefore reasonable to suggest that brucite is an effective reactant for the remediation of metal contaminated soils and waters. Moreover, our results emphasize the general importance of coupled dissolution–precipitation reactions at mineral surfaces in controlling the mobility of chemical species and toxic elements in the environment. In this context, our study may also contribute to an improved mechanistic understanding of the sorption reactions of dissolved metals to other sparingly soluble hydroxide surfaces, in particular brucite-like minerals such as layered double hydroxides or clays. These minerals are widely distributed in natural environments and of particular environmental significance, because their high ion exchange capacities and surface areas can greatly affect the fate of metals in the soil-water system [35,36].
Author Contributions
J.H. and C.V.P. conceived and designed the experiments; J.H. and C.V.P. performed the experiments; J.H. analyzed the data and wrote the paper; L.G.B. and C.V.P. helped with the discussion and interpretation of the results and edited the manuscript.
Funding
J.H. and L.G.B. acknowledge financial support by the European Union’s Horizon 2020 Marie Skłodowska-Curie Innovative Training Network Metal-Aid (Project No. 675219) and the Helmholtz Recruiting Initiative (Award No. I-044-16-01). C.V.P. acknowledges funding received through the European Union’s seventh Framework Marie Skłodowska-Curie Initial Training Networks CO2-React (Project No. 317235) and FlowTrans (Project No. 316889).
Acknowledgments
We thank Judith Schicks for her help with the Raman analyses.
Conflicts of Interest
The authors declare no conflict of interest.
References
- Rinklebe, J.; Knox, A.S.; Paller, M. Trace Elements in Waterlogged Soils and Sediments; CRC Press, Taylor & Francis Group: New York, NY, USA, 2016. [Google Scholar]
- Hooda, P.S. Trace Elements in Soils, 1st ed.; John Wiley & Sons: Chichester, UK, 2010. [Google Scholar]
- Kabata-Pendias, A.; Mukherjee, A.B. Trace Elements from Soil to Human; Springer: Berlin, Germany, 2007. [Google Scholar]
- Fu, F.; Wang, Q. Removal of heavy metal ions from wastewaters: A review. J. Environ. Manag. 2011, 92, 407–418. [Google Scholar] [CrossRef] [PubMed]
- World Health Organisation. Trace Elements in Human Nutrition and Health; World Health Organization: Geneva, Switzerland, 1996. [Google Scholar]
- Institute of Medicine. Dietary Reference Intakes for Vitamin A, Vitamin K, Arsenic, Boron, Chromium, Copper, Iodine, Iron, Manganese, Molybdenum, Nickel, Silicon, Vanadium, and Zinc; The National Academies Press: Washington, DC, USA, 2001. [Google Scholar]
- Denkhaus, E.; Salnikow, K. Nickel essentiality, toxicity, and carcinogenicity. Crit. Rev. Oncol. Hematol. 2002, 42, 35–56. [Google Scholar] [CrossRef]
- Tchounwou, P.B.; Yedjou, C.G.; Patlolla, A.K.; Sutton, D.J. Heavy metals toxicity and the environment. Mol. Clin. Environ. Toxicol. 2012, 101, 133–164. [Google Scholar] [CrossRef]
- Papanikolaou, N.C.; Hatzidaki, E.G.; Belivanis, S.; Tzanakakis, G.N.; Tsatsakis, A.M. Lead toxicity update. A brief review. Med. Sci. Monit. 2005, 11, RA329–RA336. [Google Scholar] [PubMed]
- Hashim, M.A.; Mukhopadhyay, S.; Sahu, J.N.; Sengupta, B. Remediation technologies for heavy metal contaminated groundwater. J. Environ. Manag. 2011, 92, 2355–2388. [Google Scholar] [CrossRef] [PubMed]
- Barakat, M.A. New trends in removing heavy metals from industrial wastewater. Arab. J. Chem. 2011, 4, 361–377. [Google Scholar] [CrossRef]
- Akcil, A.; Koldas, S. Acid Mine Drainage (AMD): Causes, treatment and case studies. J. Clean. Prod. 2006, 14, 1139–1145. [Google Scholar] [CrossRef]
- Sheoran, A.S.; Sheoran, V. Heavy metal removal mechanism of acid mine drainage in wetlands: A critical review. Miner. Eng. 2006, 19, 105–116. [Google Scholar] [CrossRef]
- Rötting, T.S.; Ayora, C.; Carrera, J. Improved passive treatment of high Zn and Mn concentrations using Caustic Magnesia (MgO): Particle size effects. Environ. Sci. Technol. 2008, 42, 9370–9377. [Google Scholar] [CrossRef] [PubMed]
- Di Bonito, M.; Lofts, S.; Groenenberg, J.E. Models of geochemical speciation: Structure and applications. In Environmental Geochemistry; De Vivo, B., Belkin, H.E., Lima, A., Eds.; Elsevier: Amsterdam, The Netherlands, 2018; pp. 237–305. [Google Scholar]
- Aziz, H.A.; Adlan, M.N.; Ariffin, K.S. Heavy metals (Cd, Pb, Zn, Ni, Cu and Cr(III)) removal from water in Malaysia: Post treatment by high quality limestone. Bioresour. Technol. 2008, 99, 1578–1583. [Google Scholar] [CrossRef] [PubMed]
- Mirbagheri, S.A.; Hosseini, S.N. Pilot plant investigation on petrochemical wastewater treatment for the removal of copper and chromium with the objective of reuse. Desalination 2005, 171, 85–93. [Google Scholar] [CrossRef]
- Cortina, J.L.; Lagreca, I.; De Pablo, J. Passive in situ remediation of metal-polluted water with Caustic Magnesia: Evidence from column experiments. Environ. Sci. Technol. 2003, 37, 1971–1977. [Google Scholar] [CrossRef] [PubMed]
- Rötting, T.S.; Cama, J.; Ayora, C. Use of caustic magnesia to remove cadmium, nickel, and cobalt from water in passive treatment systems: Column experiments. Environ. Sci. Technol. 2006, 40, 6438–6443. [Google Scholar] [CrossRef] [PubMed]
- Caraballo, M.A.; Rötting, T.S.; Macías, F.; Nieto, J.M.; Ayora, C. Field multi-step limestone and MgO passive system to treat acid mine drainage with high metal concentrations. Appl. Geochem. 2009, 24, 2301–2311. [Google Scholar] [CrossRef]
- Macías, F.; Caraballo, M.A.; Rötting, T.S.; Pérez-López, R.; Nieto, J.M.; Ayora, C. From highly polluted Zn-rich acid mine drainage to non-metallic waters: Implementation of a multi-step alkaline passive treatment system to remediate metal pollution. Sci. Total Environ. 2012, 433, 323–330. [Google Scholar] [CrossRef] [PubMed]
- Dong, J.; Li, B.; Bao, Q. In situ reactive zone with modified Mg(OH)2 for remediation of heavy metal polluted groundwater: Immobilization and interaction of Cr(III), Pb(II) and Cd(II). J. Contam. Hydrol. 2017, 199, 50–57. [Google Scholar] [CrossRef] [PubMed]
- Garcia, M.A.; Chimenos, J.M.; Fernandez, A.I.; Miralles, L.; Segarra, M.; Espiell, F. Low-grade MgO used to stabilize heavy metals in highly contaminated soils. Chemosphere 2004, 56, 481–491. [Google Scholar] [CrossRef] [PubMed]
- Navarro, A.; Chimenos, J.M.; Muntaner, D.; Fernández, A.I. Permeable reactive barriers for the removal of heavy metals: Lab-scale experiments with low-grade magnesium oxide. Gr. Water Monit. Remediat. 2006, 26, 142–152. [Google Scholar] [CrossRef]
- Shao, L.; Zhou, Y.; Chen, J.F.; Wu, W.; Lu, S.C. Buffer behavior of brucite in removing copper from acidic solution. Miner. Eng. 2005, 18, 639–641. [Google Scholar] [CrossRef]
- Lin, X.; Burns, R.C.; Lawrance, G.A. Heavy metals in wastewater: The effect of electrolyte composition on the precipitation of cadmium(II) using lime and magnesia. Water Air Soil Pollut. 2005, 165, 131–152. [Google Scholar] [CrossRef]
- Pilarska, A.A.; Klapiszewski, Ł.; Jesionowski, T. Recent development in the synthesis, modification and application of Mg(OH)2 and MgO: A review. Powder Technol. 2017, 319, 373–407. [Google Scholar] [CrossRef]
- Balducci, G.; Bravo Diaz, L.; Gregory, D.H. Recent progress in the synthesis of nanostructured magnesium hydroxide. CrystEngComm 2017, 19, 6067–6084. [Google Scholar] [CrossRef] [Green Version]
- Mahdavi, S.; Jalali, M.; Afkhami, A. Heavy metals removal from aqueous solutions using TiO2, MgO, and Al2O3 nanoparticles. Chem. Eng. Commun. 2013, 200, 448–470. [Google Scholar] [CrossRef]
- Hua, M.; Zhang, S.; Pan, B.; Zhang, W.; Lv, L.; Zhang, Q. Heavy metal removal from water/wastewater by nanosized metal oxides: A review. J. Hazard. Mater. 2012, 211–212, 317–331. [Google Scholar] [CrossRef] [PubMed]
- Gao, C.; Zhang, W.; Li, H.; Lang, L.; Xu, Z. Controllable fabrication of mesoporous MgO with various morphologies and their absorption performance for toxic pollutants in water. Cryst. Growth Des. 2008, 8, 3785–3790. [Google Scholar] [CrossRef]
- Zhang, S.; Cheng, F.; Tao, Z.; Gao, F.; Chen, J. Removal of nickel ions from wastewater by Mg(OH)2/MgO nanostructures embedded in Al2O3 membranes. J. Alloys Compd. 2006, 426, 281–285. [Google Scholar] [CrossRef]
- Feng, J.; Gao, M.; Zhang, Z.; Liu, S.; Zhao, X.; Ren, Y.; Lv, Y.; Fan, Z. Fabrication of mesoporous magnesium oxide nanosheets using magnesium powder and their excellent adsorption of Ni (II). J. Colloid Interface Sci. 2018, 510, 69–76. [Google Scholar] [CrossRef] [PubMed]
- Xiong, C.; Wang, W.; Tan, F.; Luo, F.; Chen, J.; Qiao, X. Investigation on the efficiency and mechanism of Cd(II) and Pb(II) removal from aqueous solutions using MgO nanoparticles. J. Hazard. Mater. 2015, 299, 664–674. [Google Scholar] [CrossRef] [PubMed]
- Liang, X.; Zang, Y.; Xu, Y.; Tan, X.; Hou, W.; Wang, L.; Sun, Y. Sorption of metal cations on layered double hydroxides. Colloids Surfaces A Physicochem. Eng. Asp. 2013, 433, 122–131. [Google Scholar] [CrossRef]
- Uddin, M.K. A review on the adsorption of heavy metals by clay minerals, with special focus on the past decade. Chem. Eng. J. 2017, 308, 438–462. [Google Scholar] [CrossRef]
- Ruiz-Agudo, E.; Kowacz, M.; Putnis, C.V.; Putnis, A. The role of background electrolytes on the kinetics and mechanism of calcite dissolution. Geochim. Cosmochim. Acta 2010, 74, 1256–1267. [Google Scholar] [CrossRef]
- Park, N.S.; Kim, M.W.; Langford, S.C.; Dickinson, J.T. Atomic layer wear of single-crystal calcite in aqueous solution scanning force microscopy. J. Appl. Phys. 1996, 80, 2680–2686. [Google Scholar] [CrossRef]
- Lafuente, B.; Downs, R.T.; Yang, H.; Stone, N. The Power of Databases: The RRUFF Project. In Highlights in Mineralogical Crystallography; Walter de Gruyter GmbH: Berlin, Germany, 2016. [Google Scholar]
- Parkhurst, D.L.; Appelo, C.A.J. User’s Guide to PHREEQC (Version 2): A Computer Program for Speciation, Batch-Reaction, Onedimensional Transport, and Inverse Geochemical Calculations; Water-Resources Investigations Report 99-4259; U.S. Geological Survey: Reston, WV, USA, 1999. [Google Scholar]
- Chivot, J.; Mendoza, L.; Mansour, C.; Pauporté, T.; Cassir, M. New insight in the behaviour of Co-H2O system at 25–150 °C, based on revised Pourbaix diagrams. Corros. Sci. 2008, 50, 62–69. [Google Scholar] [CrossRef]
- Kudoh, Y.; Kameda, J.; Kogure, T. Dissolution of brucite and the (001) surface at neutral pH: In situ atomic force microscopy observations. Clays Clay Miner. 2006, 54, 598–604. [Google Scholar] [CrossRef]
- Hövelmann, J.; Putnis, C.V.; Ruiz-Agudo, E.; Austrheim, H. Direct nanoscale observations of CO2 sequestration during brucite [Mg(OH)2] dissolution. Environ. Sci. Technol. 2012, 46, 5253–5260. [Google Scholar] [CrossRef] [PubMed]
- Ruiz-Agudo, E.; Putnis, C.V. Direct observations of mineral fluid reactions using atomic force microscopy: The specific example of calcite. Miner. Mag. 2012, 76, 227–253. [Google Scholar] [CrossRef]
- Stumm, W. Reactivity at the mineral-water interface: Dissolution and inhibition. Colloids Surfaces A Physicochem. Eng. Asp. 1997, 120, 143–166. [Google Scholar] [CrossRef]
- Pokrovsky, O.S.; Schott, J.; Castillo, A. Kinetics of brucite dissolution at 25 °C in the presence of organic and inorganic ligands and divalent metals. Geochim. Cosmochim. Acta 2005, 69, 905–918. [Google Scholar] [CrossRef]
- Fischer, C.; Arvidson, R.S.; Lüttge, A. How predictable are dissolution rates of crystalline material? Geochim. Cosmochim. Acta 2012, 98, 177–185. [Google Scholar] [CrossRef]
- Fischer, C.; Kurganskaya, I.; Schäfer, T.; Lüttge, A. Variability of crystal surface reactivity: What do we know? Appl. Geochem. 2014, 43, 132–157. [Google Scholar] [CrossRef]
- Jordan, G.; Rammensee, W. Dissolution rates and activation energy for dissolution of brucite (001): A new method based on the microtopography of crystal surfaces. Geochim. Cosmochim. Acta 1996, 60, 5055–5062. [Google Scholar] [CrossRef]
- Hövelmann, J.; Putnis, C.V. In Situ nanoscale imaging of struvite formation during the dissolution of natural brucite: Implications for phosphorus recovery from wastewaters. Environ. Sci. Technol. 2016, 50, 13032–13041. [Google Scholar] [CrossRef] [PubMed]
- Dawson, P.; Hadfield, C.D.; Wilkinson, G.R. The polarized infra-red and Raman spectra of Mg(OH)2 and Ca(OH)2. J. Phys. Chem. Solid 1973, 34, 1217–1225. [Google Scholar] [CrossRef]
- Tandon, K.; John, M.; Heuss-aßbichler, S.; Schaller, V. Influence of Salinity and Pb on the Precipitation of Zn in a Model System. Minerals. 2018, 8, 43. [Google Scholar] [CrossRef]
- Shinde, V.R.; Shim, H.S.; Gujar, T.P.; Kim, H.J.; Kim, W.B. A solution chemistry approach for the selective formation of ultralong nanowire bundles of crystalline Cd(OH)2 on substrates. Adv. Mater. 2008, 20, 1008–1012. [Google Scholar] [CrossRef]
- Veleva, L.; Quintana, P.; Ramanauskas, R.; Pomes, R.; Maldonado, L. Mechanism of copper patina formation in marine environments. Electrochim. Acta 1996, 41, 1641–1646. [Google Scholar] [CrossRef]
- Gibert, O.; De Pablo, J.; Cortina, J.L.; Ayora, C. Municipal compost-based mixture for acid mine drainage bioremediation: Metal retention mechanisms. Appl. Geochem. 2005, 20, 1648–1657. [Google Scholar] [CrossRef]
- Brooker, M.H.; Sunder, S.; Taylor, P.; Lopata, V.J. Infrared and Raman spectra and X-ray diffraction studies of solid lead(II) carbonates. Can. J. Chem. 1983, 61, 494–502. [Google Scholar] [CrossRef] [Green Version]
- Hardison, D.W.; Ma, L.Q.; Luongo, T.; Harris, W.G. Lead contamination in shooting range soils from abrasion of lead bullets and subsequent weathering. Sci. Total Environ. 2004, 328, 175–183. [Google Scholar] [CrossRef] [PubMed]
- Sangameshwar, S.R.; Barnes, H.L. Supergene processes in zinc-lead–silver sulfide ores in carbonates. Econ. Geol. 1983, 78, 1379–1397. [Google Scholar] [CrossRef]
- Wang, L.; Putnis, C.V.; King, H.E.; Hövelmann, J.; Ruiz-Agudo, E.; Putnis, A. Imaging organophosphate and pyrophosphate sequestration on brucite by in situ atomic force microscopy. Environ. Sci. Technol. 2017, 51, 328–336. [Google Scholar] [CrossRef] [PubMed]
- Putnis, C.V.; Renard, F.; King, H.E.; Montes-Hernandez, G.; Ruiz-Agudo, E. Sequestration of selenium on calcite surfaces revealed by nanoscale imaging. Environ. Sci. Technol. 2013, 47, 13469–13476. [Google Scholar] [CrossRef] [PubMed]
- Renard, F.; Putnis, C.V.; Montes-Hernandez, G.; Ruiz-Agudo, E.; Hovelmann, J.; Sarret, G. Interactions of arsenic with calcite surfaces revealed by in situ nanoscale imaging. Geochim. Cosmochim. Acta 2015, 159, 61–79. [Google Scholar] [CrossRef]
- Wang, L.; Putnis, C.V.; Ruiz-Agudo, E.; Hövelmann, J.; Putnis, A. In situ imaging of interfacial precipitation of phosphate on goethite. Environ. Sci. Technol. 2015, 49, 4184–4192. [Google Scholar] [CrossRef] [PubMed]
- Wang, L.; Putnis, C.V.; Ruiz-Agudo, E.; King, H.E.; Putnis, A. Coupled dissolution and precipitation at the cerussite-phosphate solution interface: Implications for immobilization of lead in soils. Environ. Sci. Technol. 2013, 47, 13502–13510. [Google Scholar] [CrossRef] [PubMed]
- Ruiz-Agudo, E.; Putnis, C.V.; Putnis, A. Coupled dissolution and precipitation at mineral–fluid interfaces. Chem. Geol. 2014, 383, 132–146. [Google Scholar] [CrossRef]
- Putnis, C.V.; Ruiz-Agudo, E.; Hövelmann, J. Coupled fluctuations in element release during dolomite dissolution. Miner. Mag. 2014, 78, 1355–1362. [Google Scholar] [CrossRef]
- Ruiz-Agudo, E.; King, H.E.; Patiño-Ĺpez, L.D.; Putnis, C.V.; Geisler, T.; Rodriguez-Navarro, C.; Putnis, A. Control of silicate weathering by interface-coupled dissolution–precipitation processes at the mineral-solution interface. Geology 2016, 44, 567–570. [Google Scholar] [CrossRef]
- Putnis, A.; Putnis, C. V The mechanism of reequilibration of solids in the presence of a fluid phase. J. Solid State Chem. 2007, 180, 1783–1786. [Google Scholar] [CrossRef]
- Putnis, A. Mineral Replacement Reactions. Rev. Miner. Geochem. 2009, 70, 87–124. [Google Scholar] [CrossRef]
- De Yoreo, J.J.; Gilbert, P.U.P.A.; Sommerdijk, N.A.J.M.; Penn, R.L.; Whitelam, S.; Joester, D.; Zhang, H.; Rimer, J.D.; Navrotsky, A.; Banfield, J.F.; et al. Crystallization by particle attachment in synthetic, biogenic, and geologic environments. Science 2015, 349, aaa6760. [Google Scholar] [CrossRef] [PubMed]
- Teng, H. How ions and molecules organize to form crystals. Elements 2013, 9, 189–194. [Google Scholar] [CrossRef]
Figure 1.
Brucite dissolution in the presence of dissolved metals. (A) In situ atomic force microscope (AFM) deflection image of a brucite (001) surface taken after 6 min in contact with pure water. The image shows that brucite surfaces were initially flat, apart from some pre-existing step edges; (B) In situ AFM deflection image of a brucite surface taken after 24 min in contact with 1 mmol/L NiSO4, pH 4.5. The dissolution of brucite in acidic metal solutions resulted in the formation of triangular etch pits; (C) Comparison of etch pit spreading rates in the absence (black symbols) and presence (colored symbols) of dissolved metals. Error bars indicate the standard deviation of the measured values (Table 1).

Figure 2.
In situ AFM images showing the nucleation of precipitates on brucite surfaces. (A) Deflection and (B) height image (acquired in liquid) showing the nucleation of nanometer size particles at kink sites on a brucite surface after 73 min in a 20 mmol/L CdSO4 (pH 3) solution; (C) Deflection image (acquired in liquid) of a brucite surface after 30 min in a 50 mmol/L ZnSO4 (pH 5.6) solution. The image reveals two generations of particles that nucleated at kink sites along a retreating step edge; (D) Deflection image (acquired in liquid) showing the covering of a brucite surface with precipitates after 90 min in a 1 mmol/L PbCl2 (pH 4.5) solution. The central area (outlined by a dashed square) corresponds to an area that was scanned before. This area contains far less particles than the surroundings, showing that the particles were initially weakly attached to the brucite surface, as they could be removed by the AFM tip during scanning.

Figure 3.
AFM deflection images (acquired in air) and height profiles of nanoparticles and particle clusters on brucite surfaces formed during ex situ experiments. Experimental conditions were (A) 0.1 mmol/L ZnSO4, pH 5, 48 h; (B) 1 mmol/L CdSO4, pH 4, 18 h; (C) 1 mmol/L CoSO4, pH 4.5, 20 h; (D) 0.1 mmol/L NiSO4, pH 4.5, 48 h; (E) 1 mmol/L CuCl2, pH 4.5, 20 h; and (F) 0.1 mmol/L PbCl2, pH 4.5, 48 h. The locations of the height profiles are indicated by dashed lines in the corresponding AFM images. Prior to the ex situ experiments, all of the surfaces were exposed to the corresponding solutions for ~2 h in the AFM fluid cell under stop-flow conditions.

Figure 4.
Chemical and morphological characterization of surface precipitates formed during reactions with solutions of (A) ZnSO4, (B) CdSO4, (C) CoSO4, (D) NiSO4, (E) CuCl2, and (F) PbCl2. (a1–f1) SEM images showing the coverage of brucite surfaces with precipitates. All of the SEM images are from brucite surfaces that reacted for 36 h with 7 mL of the respective metal solution at pH 4.5. Concentrations were 10 mmol/L for Zn, Cd, Co, Ni, and Cu (a1–e1), and 1 mmol/L for Pb (f1). The brucite surfaces were initially clean and free of any precipitates. (a2–f2) Higher magnification SEM images of surface precipitates from the same samples as in a1–f1. (a3–f3) Energy dispersive X-ray (EDX) spectra of the surface precipitates showing the incorporation of metals. The high Mg peak that is present in all of the spectra originates from the underlying brucite surface. (a4–f4) AFM deflection and (a5–f5) height images of surface precipitates highlighting some similar and additional morphological features. The location of the height images is indicated by a dashed square in the corresponding deflection image. Insets in (a5–f5) show the height profiles along the sections marked by the dashed lines. The experimental conditions for the AFM images were (a4,a5) 50 mmol/L ZnSO4, pH 5.75, ~2 h in situ (flow) + 16 h ex situ (static), image acquired in air; (b4,b5) 20 mmol/L CdSO4, pH 4.5, 40 min in situ (flow), image acquired in liquid; (c4,c5) 50 mmol/L CoSO4, pH 5, ~2 h in situ (flow) + 95 h ex situ (static), image acquired in air; (d4,d5) 20 mmol/L NiSO4, pH 5, 45 min in situ (flow), image acquired in liquid; (e4,e5) 20 mmol/L CuCl2, pH 4.5, ~2 h in situ (flow) + 20 h ex situ (static), image acquired in air; and (f4,f5) 1 mmol/L PbCl2, pH 4.5, ~2 h in situ (flow) + 20 h ex situ (static), image acquired in air.


Figure 5.
Raman spectra of surface precipitates formed after 36 h in (A) 10 mmol/L ZnSO4, pH 4.5; (B) 10 mmol/L CuCl2, pH 4.5; and (C) 1 mmol/L PbCl2, pH 4.5. The shown spectra are representative of the micrometer sized crystals in Figure 4A,E,F, respectively. The black spectrum in (A) corresponds to a pristine brucite surface. The peaks belonging to the underlying brucite substrate (marked “B”) are present in all of the measured spectra. The spectra of the Zn-, Cu-, and Pb-precipitates show good agreement with the reference spectra for namuwite, paratacamite, and hydrocerussite, respectively. The inset in (C) is a magnification of the spectral region between 1040 and 1060 cm−1, and reveals a splitting of the main peak near 1050 cm−1.

Figure 6.
Bulk solution saturation indices of the relevant metal phases calculated using PHREEQC, with the minteq.v4 database. The calculations are based on the initial metal concentrations and bulk solution pH measurements (Table 2) made after the reaction of a ca. 3 mm × 3 mm × 0.2 mm large brucite crystal with 7 mL of 0.1–10 mmol/L metal solutions. All of the solutions had an initial pH of 4.5. The saturation indices of the carbonate phases were calculated under the assumption of equilibrium with atmospheric CO2 (logPCO2 = −3.38).

Figure 7.
Schematic illustration of coupled dissolution–precipitation pathways at the brucite–water interface (see main text for more detailed explanations).
Figure 7.
Schematic illustration of coupled dissolution–precipitation pathways at the brucite–water interface (see main text for more detailed explanations).


Table 1.
Compilation of measured etch pit spreading rates in the presence and absence of dissolved metals.
Table 1.
Compilation of measured etch pit spreading rates in the presence and absence of dissolved metals.
| Metal | Concentration | pH | Spreading Rate | Standard Deviation | n |
|---|---|---|---|---|---|
| (mmol/L) | (nm/s) | ||||
| Zn | 1 | 4.5 | 0.34 | 0.07 | 19 |
| 5 | 4.5 | 0.46 | 0.05 | 15 | |
| 1 | 5.6 | 0.05 | 0.03 | 24 | |
| 5 | 5.6 | 0.06 | 0.03 | 12 | |
| 20 | 5.6 | 0.07 | 0.03 | 9 | |
| 50 | 5.6 | 0.09 | 0.03 | 6 | |
| Cd | 20 | 4.2 | 0.89 | 0.22 | 5 |
| 5 | 4.5 | 0.41 | 0.03 | 5 | |
| 5 | 5 | 0.28 | 0.05 | 16 | |
| 10 | 5 | 0.39 | 0.06 | 10 | |
| 20 | 5 | 0.4 | 0.1 | 10 | |
| 1 | 5.7 | 0.22 | 0.08 | 5 | |
| 10 | 6 | 0.11 | 0.03 | 10 | |
| Co | 10 | 5.6 | 0.11 | 0.08 | 8 |
| 20 | 5.6 | 0.22 | 0.11 | 17 | |
| 50 | 5.6 | 0.51 | 0.06 | 10 | |
| Ni | 1 | 4.5 | 0.2 | 0.03 | 10 |
| 20 | 5 | 0.19 | 0.08 | 26 | |
| 50 | 5.7 | 0.09 | 0.03 | 18 | |
| Cu | 5 | 4.5 | 0.37 | 0.1 | 10 |
| Pb | 1 | 4.5 | 0.32 | 0.04 | 10 |
| no metals * | 4 | 0.22 | 0.04 | 8 | |
| 5 | 0.07 | 0.01 | 10 | ||
| 7 | 0.04 | 0.01 | 11 |
* data from Hövelmann et al. [43].
Table 2.
Bulk pH values of metal solutions after reaction with brucite crystals.
| Metal Concentration | Initial pH | Solution Volume | Reaction Time | pH after Reaction with Brucite Crystal (ca. 3 mm × 3 mm × 0.2 mm) | |||||
|---|---|---|---|---|---|---|---|---|---|
| (mmol/L) | (mL) | (days) | ZnSO4 | CdSO4 | CoSO4 | NiSO4 | CuCl2 | PbCl2 | |
| 0.1 | 4.5 | 7 | 3 | 5.96 | 5.84 | 6.86 | 6.6 | 5.56 | 5.31 |
| 1 | 4.5 | 7 | 1 | 5.2 | 5.43 | 5.21 | 5.12 | 5.07 | 4.99 |
| 10 | 4.5 | 7 | 3 | 5.54 | 5.56 | 5.65 | 5.77 | 4.66 | - |
© 2018 by the authors. Licensee MDPI, Basel, Switzerland. This article is an open access article distributed under the terms and conditions of the Creative Commons Attribution (CC BY) license (http://creativecommons.org/licenses/by/4.0/).
Share and Cite
MDPI and ACS Style
Hövelmann, J.; Putnis, C.V.; Benning, L.G. Metal Sequestration through Coupled Dissolution–Precipitation at the Brucite–Water Interface. Minerals 2018, 8, 346. https://doi.org/10.3390/min8080346
AMA Style
Hövelmann J, Putnis CV, Benning LG. Metal Sequestration through Coupled Dissolution–Precipitation at the Brucite–Water Interface. Minerals. 2018; 8(8):346. https://doi.org/10.3390/min8080346
Chicago/Turabian StyleHövelmann, Jörn, Christine V. Putnis, and Liane G. Benning. 2018. "Metal Sequestration through Coupled Dissolution–Precipitation at the Brucite–Water Interface" Minerals 8, no. 8: 346. https://doi.org/10.3390/min8080346
Note that from the first issue of 2016, this journal uses article numbers instead of page numbers. See further details here.