Article

Ore-Forming Processes at the Xiajinbao Gold Deposit in Eastern Hebei Province: Constraints from EPMA and LA-ICPMS Analysis

1
Key Laboratory of Metallogenic Prediction of Non-Ferrous Metals and Geological Environment Monitoring, Central South University, Ministry of Education, Changsha 410083, China
2
Hunan Key Laboratory of Land and Resources Evaluation and Utilization, Hunan Planning Institute of Land and Resources, Changsha 410007, China
3
School of Geosciences and Info-Physics, Central South University, Changsha 410083, China
4
School of Resources and Safety Engineering, Central South University, Changsha 410083, China
*
Author to whom correspondence should be addressed.
Minerals 2018, 8(9), 388; https://doi.org/10.3390/min8090388
Submission received: 21 June 2018 / Revised: 2 September 2018 / Accepted: 3 September 2018 / Published: 5 September 2018
(This article belongs to the Section Mineral Geochemistry and Geochronology)

Abstract

:
The Xiajinbao gold deposit is located at the northern margin of the North China Craton. Hydrothermal pyrites belonging to three stages were identified: Py1; Py2; and Py3. Geochemical study of these pyrites was conducted using electron probe microanalysis and laser ablation inductively coupled plasma mass spectrometry to investigate the distributions of minor and trace elements, constrain pyrite genesis, and to obtain an improved understanding of the ore-forming processes. Py1 and Py2 contain high concentrations of Au and are interpreted to have been deposited from fluids from a dominantly magmatic source. Py3 grains have the lowest Co/Ni ratios. All generations of pyrite were deposited by mixing of meteoric waters with magmatic-hydrothermal fluids. Boiling of early ore-forming fluids led to the precipitation of Py1 and gold. Decreasing fO2 in the ore-forming system resulted in the formation of Py2 and gold. Fluid mixing was the dominant controlling factor for the precipitation of Py3 together with small amounts of gold.

1. Introduction

More than 70% of China’s gold resources occur along the margins of the North China Craton (NCC) and in adjacent orogenic belts. These include China’s most important gold deposits on the Jiaodong Peninsula, which is located along the eastern side of the North China Craton; and the Daqingshan, Yan-Liao, and Changbaishan gold provinces, which are located along the northern side of the North China Craton [1]. In the Yan-Liao gold field, there is an EW-trending gold field from which approximately 1000 tons of gold have been extracted to date [1]. Recent studies have suggested that the gold deposits in the North China Craton formed as a result of multiple orogenic events [2]. Approximately 70% of the gold deposits in the Yan-Liao gold field are hosted in Precambrian metamorphic rocks, while 30% of the gold deposits occur in Paleozoic and Mesozoic intrusive rocks [3].
The Jidong gold concentration area (or Eastern Hebei Province; East longitude 117°30′–119°00′, North latitude 40°00′–40°40′) is an important gold ore concentration area within the Yan-Liao gold field. Tectonically, this area is located on the SE edge of the Yanshanian tectonic belt, on the northern edge of the Northern China plate (Figure 1a). In total, 29 gold deposits and 118 smaller gold prospects have been defined in this area, with an accumulated proven reserve of 129.5 t Au, constituting 2.4% of China’s total gold reserves [4]. The economically viable gold deposits in the Jidong area all occur within Mesozoic units and are closely linked to acid to intermediate intrusive rocks [5]. These deposits include the large Yuerya gold deposit (Au: 50 t), the large Jinchangyu gold deposit (Au: 10 t), and the medium Huajian (or Niuxinshan) gold deposit (Au: 10 t), Dongliang gold deposit (Au: 19.53 t), Tangzhangzi gold deposit (Au: 1.025 t; Ag: 1 t; Mo: 47 t) and Xiajinbao gold deposit (Au: 3.9 t), respectively (Figure 1b).
Xiajinbao is an important medium-scale gold deposit located in the Jidong concentration area on the northern edge of the North China Craton, has an average gold grade of about 1.91 g/t. Fission track dating of zircon and apatite indicate that the metallogenic age is 153.9 Ma [6], which is close to the molybdenite Re–Os model age of 163.4 Ma [7]. The ore-forming fluid is characterized by moderate to high temperature and moderate to high salinity, and it is rich in CO2 [8]. Previous studies [8,9,10,11] have concluded that the Xiajinbao gold deposit belongs to a volcanic to sub-volcanic hydrothermal-type or porphyry gold deposit. However, the controlling factors of Au precipitation and the ore-forming processes have remained unclear until now.
Pyrite is the most important Au-hosting mineral in the Xiajinbao deposit. Since the pyrite precipitated directly from the ore-forming fluid, the trace element composition of the pyrite may provide useful information about the character of the ore-forming fluid and the ore-forming process [12,13]. Determination of trace element concentrations by laser ablation inductively coupled plasma mass spectrometry (LA-ICP-MS) is a powerful tool to define distinct generations of pyrite deposition and to define hydrothermal mineralization events [12,13,14]. However, no previous research of this type has been conducted for the Xiajinbao gold deposits. In this contribution, we report LA-ICP-MS data for pyrite from the Xiajinbao gold deposit, investigate the trace element distribution in pyrite and discuss pyrite genesis to constrain ore-forming processes.

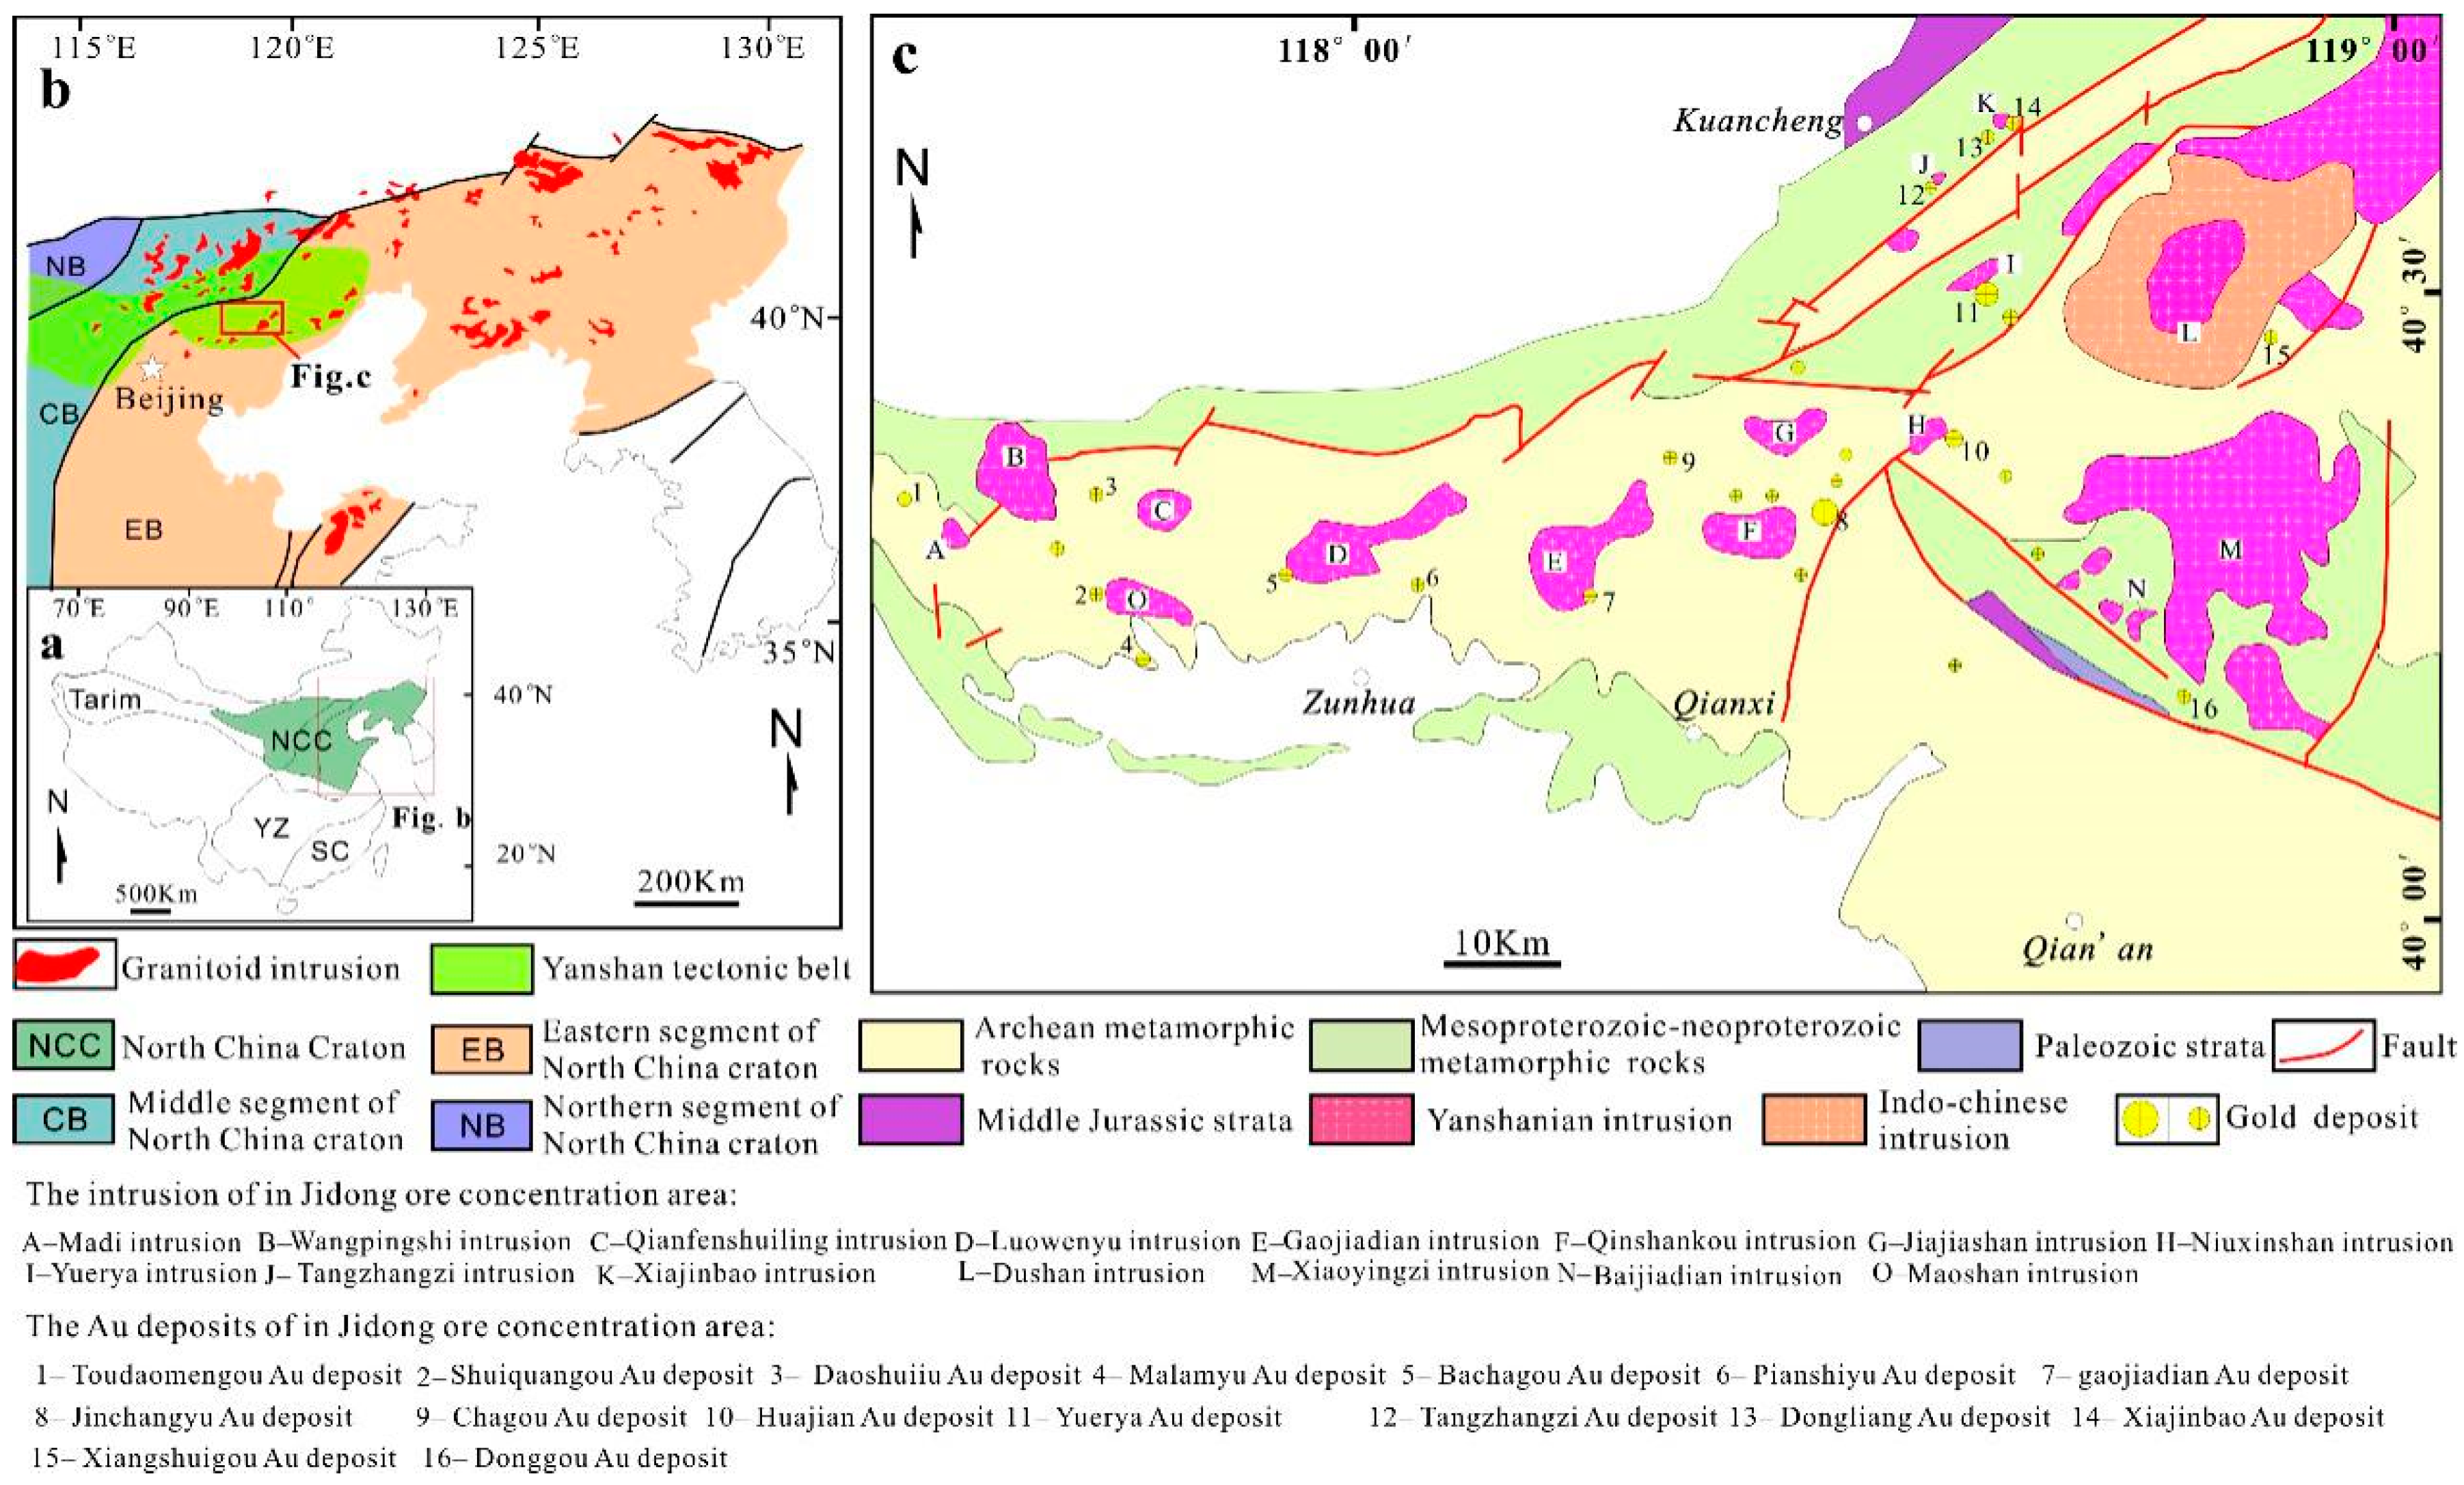
2. Geological Setting

Located on the southeastern edge of the Yanshanian tectonic belt (Figure 1b,c) on the northern edge of the Northern China block, the Jidong area occurs at the junction between the Northern China block, the Siberian plate and the Pacific plate [11]. This area has experienced a geological evolution characterized by several tectonic events since 3800 Ma [15]. Since the formation of the crystalline basement during the late Proterozoic Lvliang movement (ca. 1800 Ma), major tectonic deformation events have been absent for nearly 1600 Ma [16]. The area entered an intra-continental orogenic stage during the Mesozoic, which was associated with extensive magmatic activity together with the deposition of gold, molybdenum, copper, lead, zinc, and silver [17,18].
Widespread Precambrian rocks host gold mineralization in this region, include mineralization in the Jinchangyu, Yuerya, Huajian, and Dongliang deposits. The early Precambrian units are the most extensive units, and they make up the metamorphic crystalline substrate in the craton, including rocks as old as ca. 3.5 Ga [19,20]. These rocks include the Paleo- to Mesoarchean Qianxi and Zunhua groups, which consist of granulite- to amphibolite-facies mafic to felsic volcanic and sedimentary rocks, as well as the Qian’an Terrane that consists of granulite successions that have variably retrogressed to amphibolite-facies, with protoliths including calc-alkaline volcanic rocks [5]. The middle–upper Proterozoic strata can be divided into three systems, i.e., the Changcheng system, the Jixian system, and the Qingbaikou system. These strata comprise mainly of a series of non-metamorphosed, or slightly metamorphosed platform-type marine-facies Mg-rich carbonate rocks, breccia, and claystone that represent the first set of sedimentary cover on the crystalline basement in this area. The Paleozoic strata of the Jidong area mainly include the Cambrian, Ordovician, and Permian systems. The Cambrian and Ordovician strata comprise a set of stable platform-type neritic-facies sediments, which are in contact with the underlying middle–upper Proterozoic strata in the form of a parallel unconformity or an unconformity. The Permian strata comprise a set of intra-continent basin sediments, which are mainly composed of fluvial-, lacustrine-, and swamp-facies, coal-bearing, clastic rocks and continental red, variegated, clastic rocks. The Jurassic strata mainly comprise middle Jurassic and upper Jurassic strata. The Triassic and lower Jurassic strata are missing. Only disseminated outcrops of Cretaceous strata are present in the eastern area. The middle Jurassic represents a set of volcanic-sedimentary rocks composed of continental red beds, intermediate volcanic rocks, and volcaniclastic units. The upper Jurassic strata comprise a set of intermediate-acidic to sub-alkaline volcanic rocks. Complicated folds are commonly scattered in the Archean crystalline substrate. The early stage folding is characterized by tight isoclinal folds with axial plane of the N–S trending and west-dipping. The late stage is characterized by open folds with a near-SE or NEE axis and a W-dipping axis surface [21]. Since the Triassic, this area has experienced several cycles, including the Indo-China cycle, the Yanshanian cycle, and the Himalayan cycle. The main fold in the area is the near-EW Malanyu anticlinorium, which formed during the late Jurassic. The faults of this area can be divided into three categories based on their time of formation and stress mechanism: (1) Archean faults, which represent the products of the intensive ductile compression and deformation of strata; (2) Faults that formed during the Proterozoic–Paleozoic and activated faults that formed during the Archean, which include the near-EW compressive faults, near-SN extensive faults, and NE–NW-striking twisting faults that formed under near-SN compressive stress; and (3) Faults that have formed since the Mesozoic, which mainly exist in the form of NE–NNE compressive and twisting faults and NW extensive faults. The intrusive rocks of the Jidong area are mainly distributed along an arc-shaped area striking to the south. These rocks mainly formed during two eras: the neo-Archean–Proterozoic, and the Triassic–Jurassic. The neo-Archean Shuichang granite has an isotopic age of 3000 Ma. The Yangyashan granite has an isotopic age of 2980 Ma. The grayish gneisses in Caozhuang and Huangbaiyu have an isotopic age of 3300 Ma [4]. The products of Triassic magmatic activity occur mainly in the eastern part of the Jidong area, such as the Dushan complex massif (210–223 Ma) [22]. Rocks of Yanshanian age are abundant in this area and include Wangpingshi monzonite granite (162.3 ± 1.3 Ma) [23], Qianfenshuiling monzonite granite (153.8 ± 2.7 Ma [23], Maoshan monzonite granite (162.7 ± 1.5 Ma) [23], Tangzhangzi granitic porphyry (173 ± 2 Ma) [24], and Yuerya granite (174–175 Ma) [22].

3. Ore deposit Geology

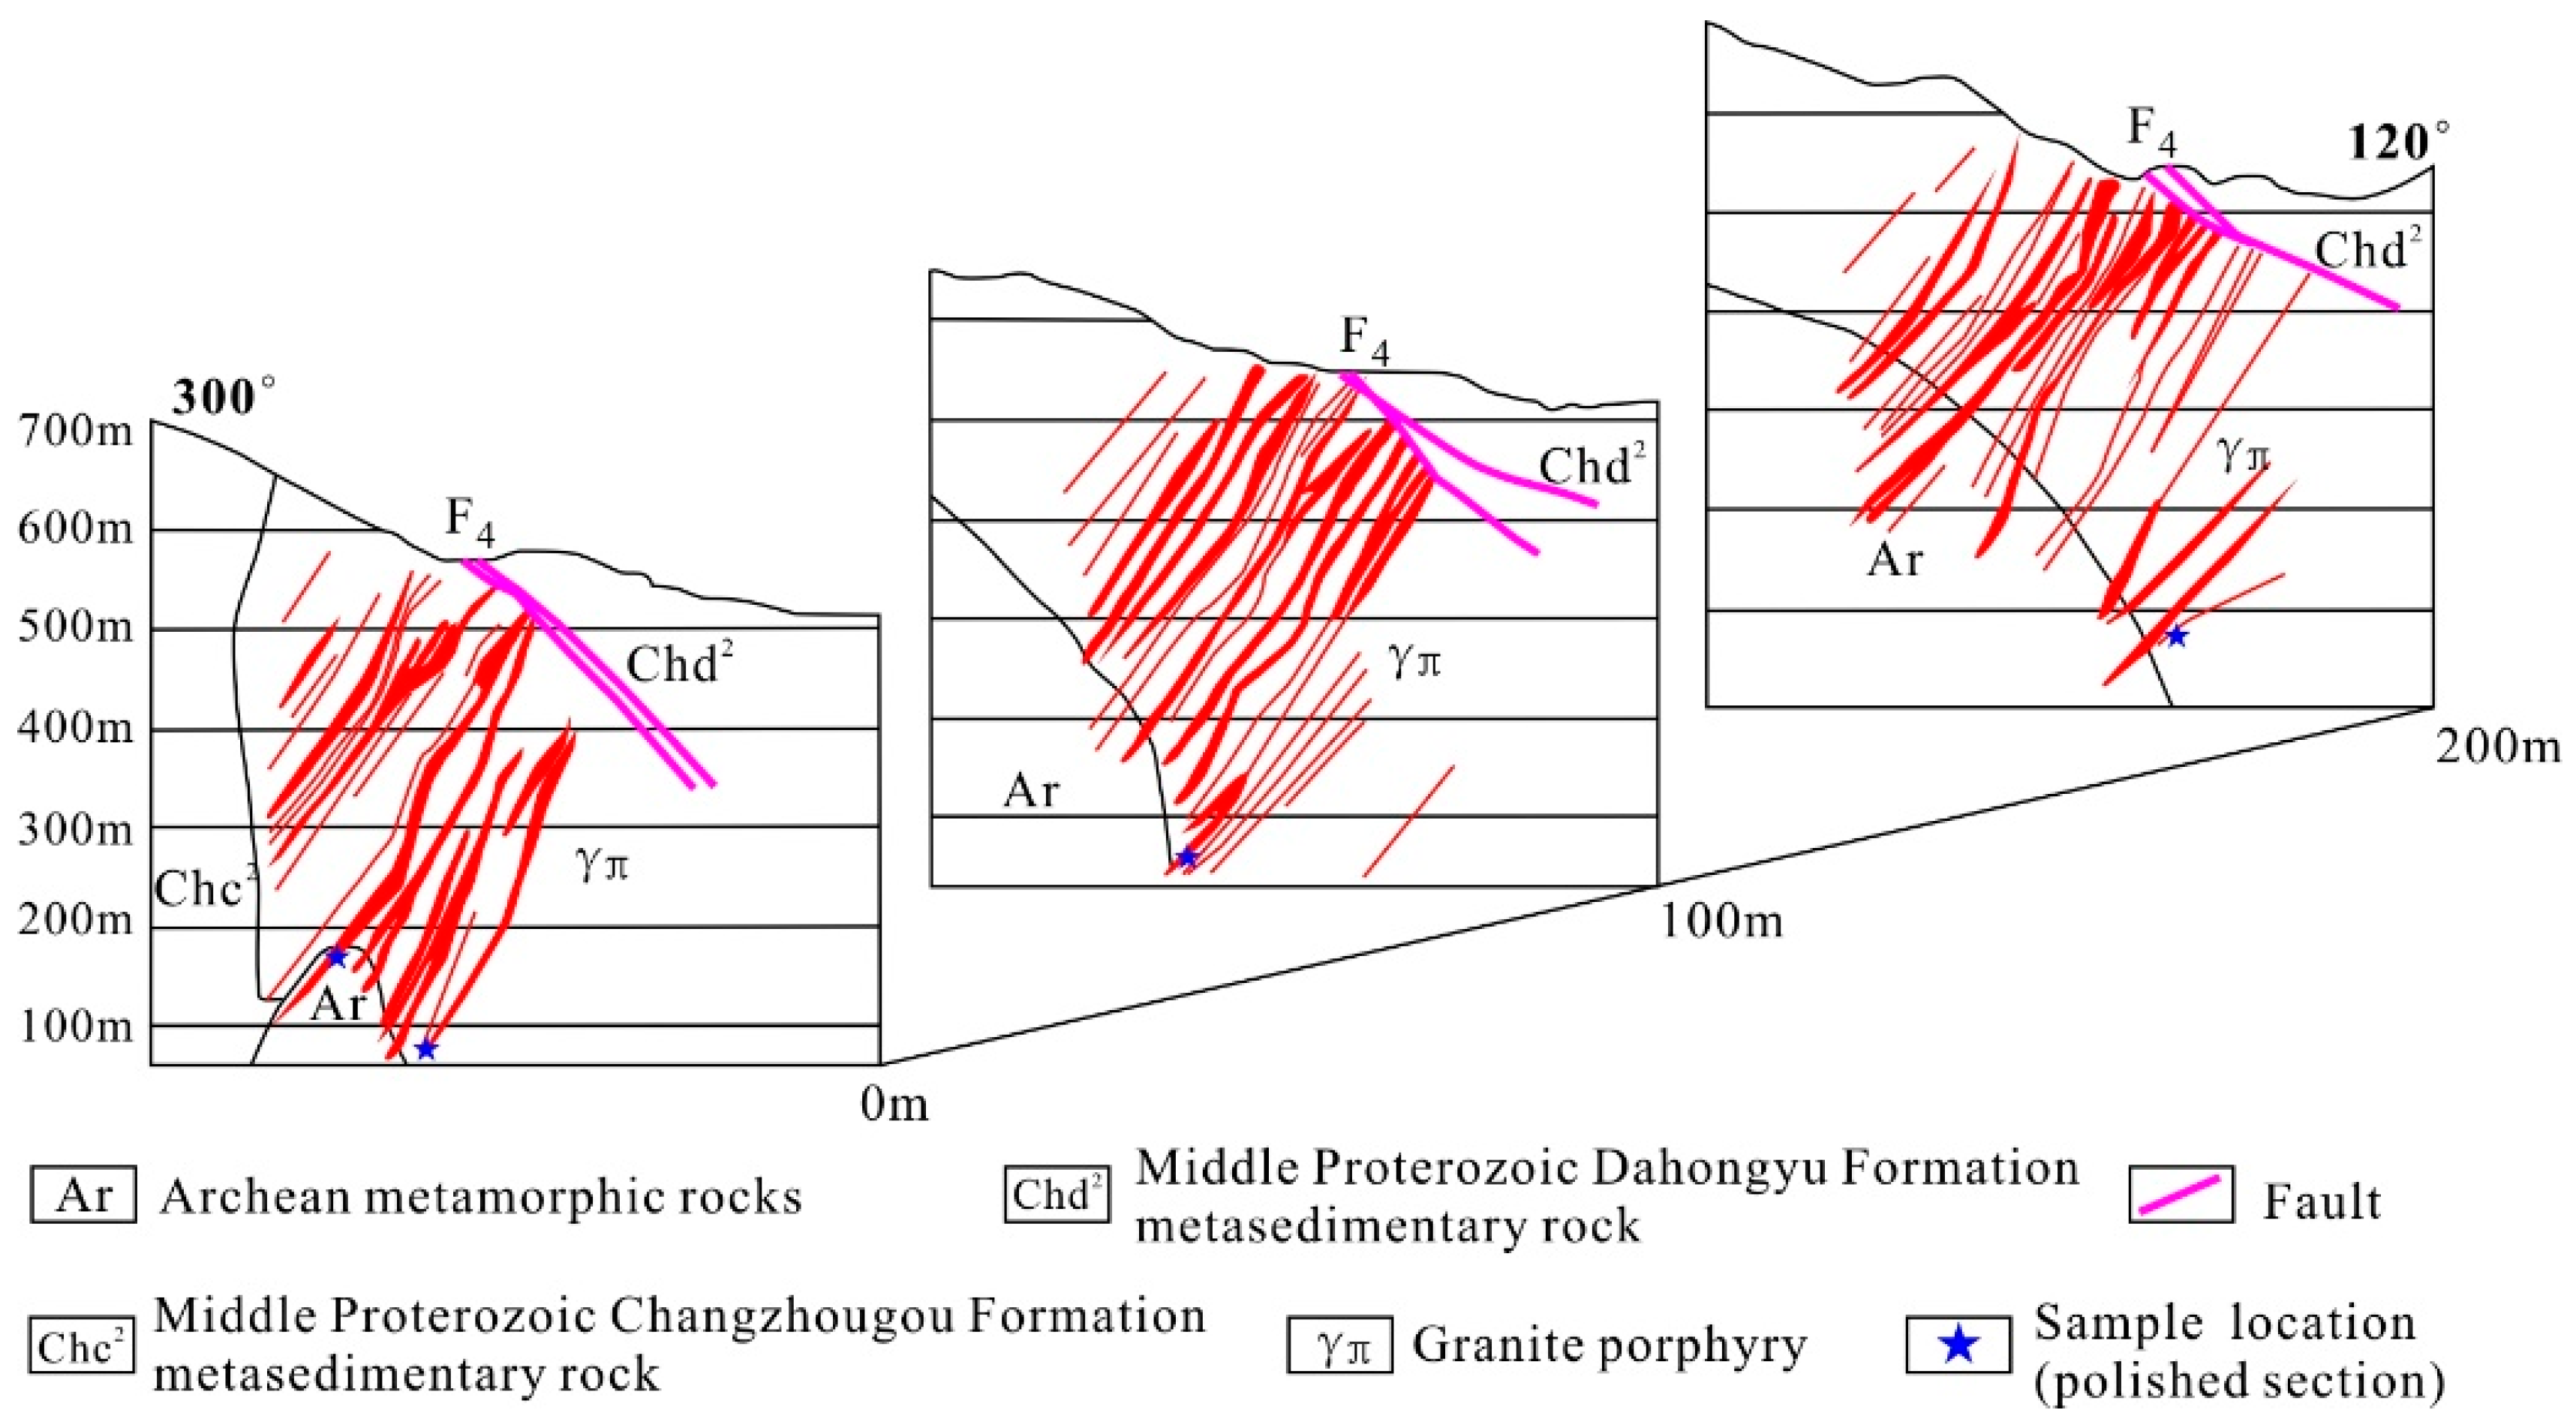
3.1. Host Rocks and Structures

The Archean Lamagou Formation of the Qianxi Group represents the oldest strata in the Xiajinbao area (Figure 2). These strata are dominated by grayish plagioclase hornblende gneiss dipping NW at an angle of 64–86°. The gneissic schistosity strikes at an angle of 50°. The intermediate to basic lava that was formed from seafloor volcanic eruptions experienced Archean regional metamorphism to form the ancient crystalline basement, which exhibits relatively high Au background values. Fractures and folds are well developed in the Xiajinbao area. Folds mainly occur in the form of Archean dome structures, with well-developed, interlayered detachment zones. The fractures are mainly divided into 3 groups based on their strikes: NE–NNE, E–W, and N–S. The location of the granitic porphyry body is controlled by the NE–NNE-striking F4 deep fault. Its secondary structure system represents the major ore-hosting structure in the Xiajinbao area.
The Lamagou Formation of the Xiajinbao Group contains the oldest strata in the Xiajinbao area. Its orogenesis mainly intruded into Archean–Jurassic strata, which are distributed along SE–NW direction, with an outcropping area of 0.35 km2. These rocks show porphyritic and massive structures. The major ore minerals mainly intruded into the Archean–Jurassic strata. The phenocrysts are mainly quartz, K-feldspar, and minor plagioclase. The matrix consists mainly of micro–fine K-feldspar and quartz. The K-feldspar content in the rock ranges from 35% to 40%. The phenocrysts are mainly hypidiomorphic in form. The accessory minerals include zircon and apatite. The plagioclase content in the rock is approximately 30%. Plagioclase phenocrysts mainly occur as hypidiomorphic platy crystals, with developed polysynthetic and Carlsbad twinning, together with sericite and kaolinite. The accessory minerals commonly exhibit a certain degree of sericitization. Quartz represents 25–30% of the rock and fills the spaces between other mineral grains in the form of xenomorphic grains with diameters ranging from 0.2 to 2 mm. Biotite comprises approximately 3% of the total rock. The total content of the remaining minerals is less than 2%.

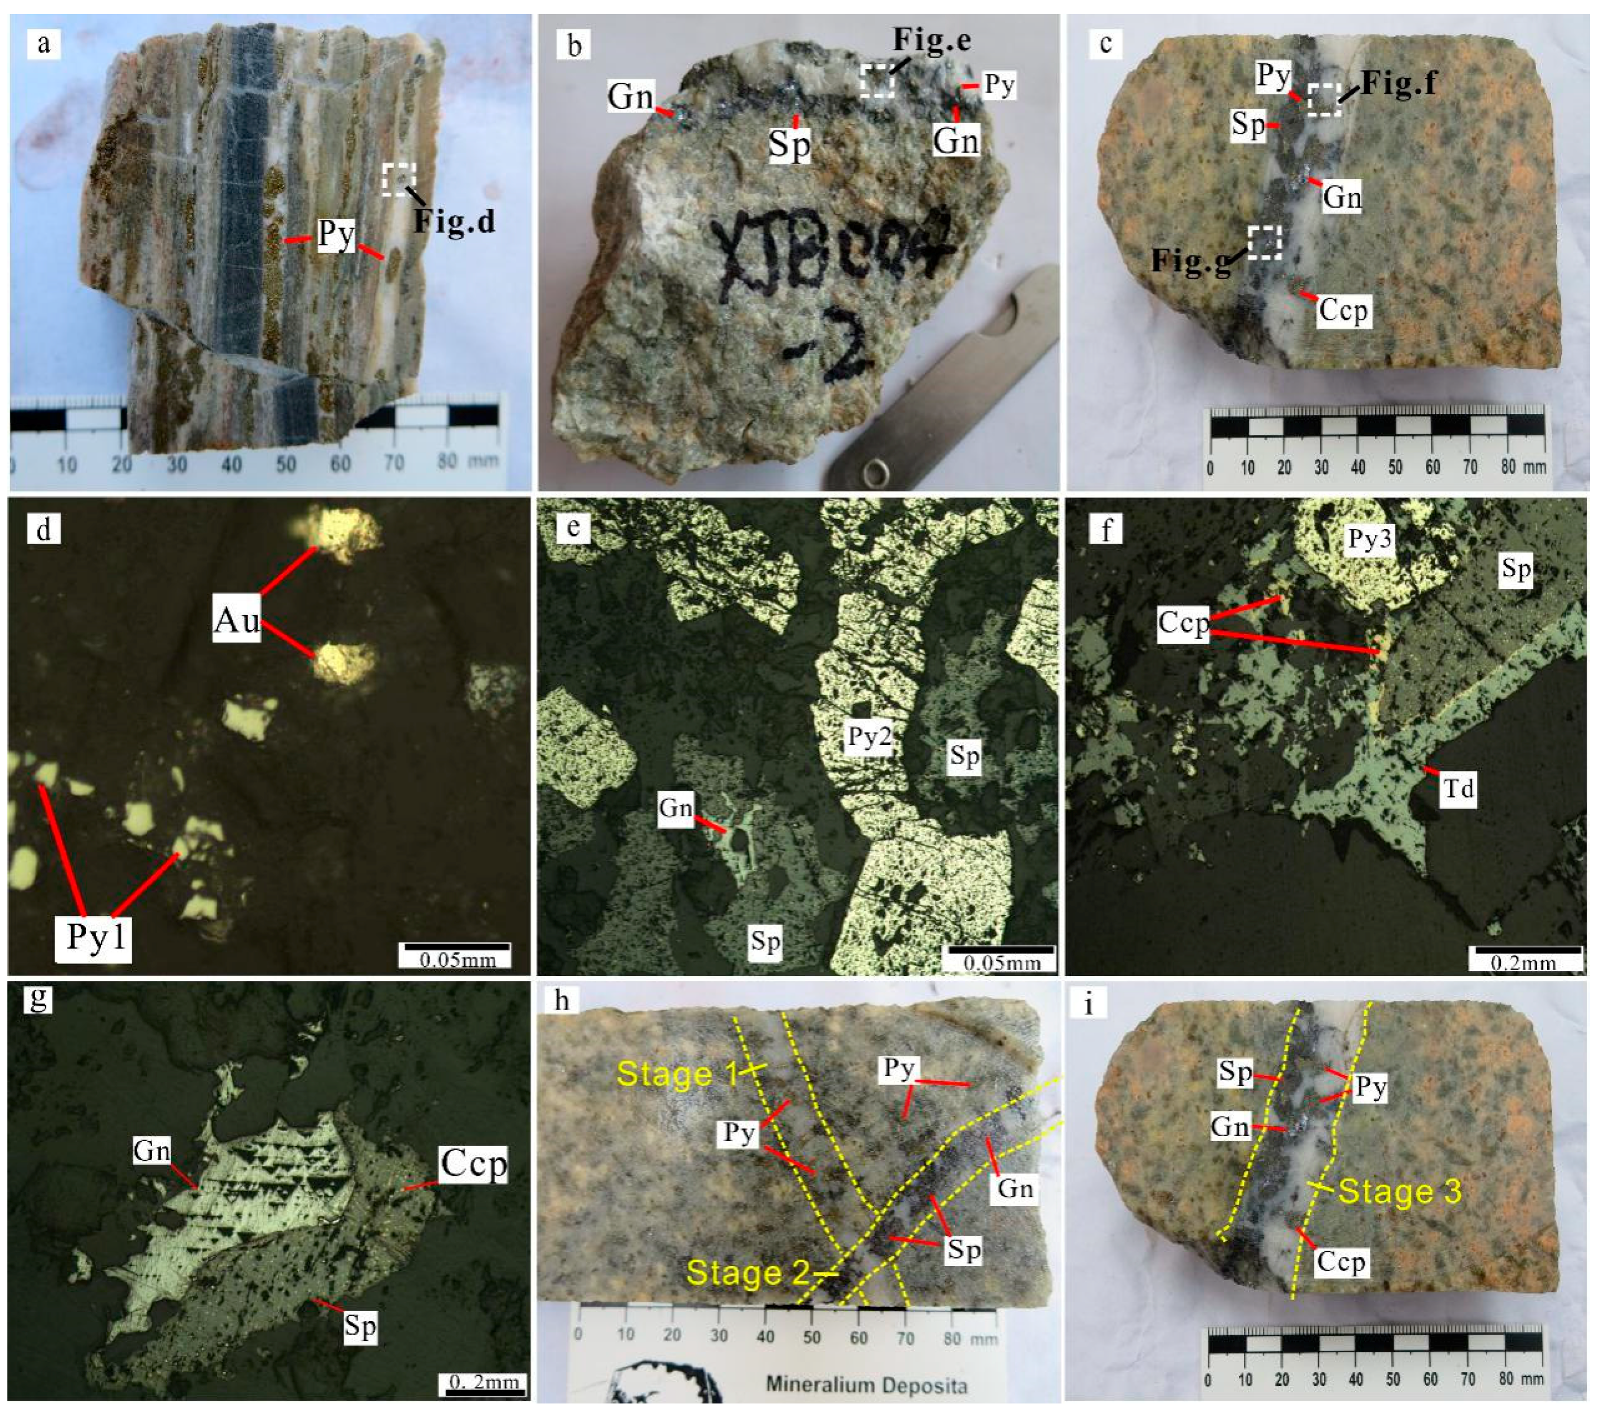
3.2. Ore Bodies, Ore Types, and Mineralogy

The Xiajinbao gold deposit consists of 28 gold ore bodies. These are distributed in parallel veins within an area that is approximately 700 m long and 400–600 m wide; these ore bodies are mainly NE-trending and occasionally quickly switch to NNE-trending. The ore bodies dip to the NW, and they locally swell and pinch, branch and recombine, and vanish and reappear (Figure 3). The average thickness of the ore bodies is 3.02 m; they have a maximum grade of 7.5 g/t, a minimum grade of 1.05 g/t, and an average grade of 1.91 g/t.
The Xiajinbao gold deposit is dominated by disseminated ores and quartz vein-type ores, with the disseminated ores occurring on both sides of the quartz veins (Figure 4). The main ore minerals are pyrite, chalcopyrite, galena, and sphalerite, together with native gold and electrum, and minor tetrahedrite and molybdenite. Gangue minerals include quartz, sericite, kaolinite, carbonates, and fluorite. There are two types of gold occurrence in the area: discrete minerals (native gold and electrum); and “invisible gold” locked in the crystal lattice of pyrite, galena, and sphalerite [25]. Ore textures include replacement, exsolution, inclusion, and fracture-filling (Figure 4). Individual mineral grains may be idiomorphic, hypidiomorphic, and allotriomorphic.

3.3. Alteration Assemblages

Several distinct types of hydrothermal alteration occur in the Xiajinbao deposit and include potassic and sodic alteration, silicification, sericitization, kaolinization, fluoritization, and carbonization. Associated ore minerals include pyrite, galena, sphalerite, chalcopyrite, tetrahedrite, and molybdenite. Silicification, sericitization, and pyritization are most closely related to the gold mineralization.

4. Paragenetic Sequences of Mineralization

Based on studies regarding the intersecting relationships among the ore-bearing veins and the paragenetic relations among the minerals, the metallogenic process can be divided into three stages: quartz–pyrite stage (Stage 1); quartz–galena–sphalerite stage (stage 2); and the quartz polymetallic sulfides (pyrite, chalcopyrite, galena, sphalerite, and tetrahedrite) stage (Figure 4h,i). A paragenetic diagram is provided for the Xiajinbao ores in Figure 5.
Quartz–pyrite veins of Stage 1 are mainly observed within the contact zone between the altered granitic intrusion and the wall rocks and commonly display banded textures. Ore minerals include xenomorphic electrum and native gold. The gold is mainly distributed in fissures within pyrite. Pyrite mainly occurs in quartz veins.
Quartz–galena–sphalerite–pyrite stage of Stage 2 also occur in the contact zone between the altered granite porphyry and the wall rocks. The ore minerals include hypidiomorphic pyrite, sphalerite and galena, and more rarely, electrum and native gold. Galena replaces sphalerite and sphalerite replaces pyrite. Most of the gold is observed in fissures within pyrite, and more rarely, within sphalerite and galena. Rare gold inclusions occur in other sulfides.
Quartz–polymetallic sulfide (pyrite, chalcopyrite, galena, sphalerite, tetrahedrite) veins of Stage 3 occur within the contact zone between the altered granitic porphyry body and wall rock in the form of separate veins and stockworks. Major ore minerals include hypidiomorphic granular pyrite, sphalerite, galena, chalcopyrite, and tetrahedrite. Some galena replaces sphalerite, sphalerite replaces pyrite, and tetrahedrite replaces chalcopyrite.

5. Sampling and Analyses

5.1. Sample Sites

Ore samples were collected from the No.19 orebody of the Xiajinbao deposit. The locations and types of samples are listed in Table 1.

5.2. Microscopic Observations and Electron-Probe Microanalyses

Representative ore samples were collected to represent the different pyrite stages and were prepared into polished sections in the 230 Division of the Changsha Uranium Geology Research Institute. The polished section is flat on the bottom and polished on the top. The polished sections were observed under the reflecting ore microscope to identify the mineral assemblages of three pyrite stages, the paragenetic sequences of the minerals, and the distribution of visible gold within those samples.
Ore minerals and ore textures were observed in polished sections using standard reflected-light microscopy techniques. Selected representative thin sections containing more auriferous pyrite and Au-bearing minerals were analyzed by electron probe microanalysis (EPMA) using a Shimadzu EPMA-1720H housed at the School of Geosciences and Info-physics (SGI), Central South University (CSU), Changsha, China. The operating conditions of the electron microprobe were an accelerating voltage of 15 kV, a beam current of 10 nA, and an electron beam diameter of 1 μm. The following X-ray lines were used to analyze different elements: As Lα, S Kα, Fe Kα, Co Kα, Ni Kα, Au Mα, and Pb Mα. The mineral and metal standards used for the calibration of elemental X-ray intensities included pyrite (S and Fe), GaAs (As), cobalt (Co), nickel (Ni), gold (Au), and galena (Pb). The resulting data were then ZAF-corrected using proprietary Shimadzu software. The minimum detection limit of Fe was 0.01 wt %, that of S was 0.01 wt %, that of Co was 0.03 wt %, that of Ni was 0.01 wt %, that of Au was 0.06 wt %, that of Pb was 0.04 wt %.

5.3. LA-ICP-MS In-Situ Trace Element Analysis

LA-ICP-MS analysis was conducted by the Nanjing Jupu Analysis Technology Co., Ltd, Nanjing, China. The LA-ICP-MS analysis system consisted of the Analyze Excite 193nm ArF Laser Ablation System (LA) made in the United States and the Agilent 7700x induced polarization plasma mass spectrum (ICP-MS) made in Japan. During laser ablation, the deep ultra-violet beams generated by the laser generator were focused on the sulfide through the homogenized light path. The energy density was 4.0 J/cm2. The beam diameter was 40 μm. The frequency was 7.0 Hz. ICPMS–DataCal software (version 10.4) was adopted for offline processing of the raw analytical data and included selection of sample and blank signal, equipment sensitivity drift calibration, and element content calculation. The standard was analyzed twice every 1.5 h with a 100-μm beam size at 10 Hz to correct for instrument drift. The accuracy is expected to be better than 20% for most elements. A series of 11 elements was chosen for spot analysis (i.e., Fe, Co, Ni, Cu, Zn, As, Ag, Te, Au, Pb, and Bi) in this study. The minimum detection limit of S was 50.8 ppm, that of Fe was 2.9 ppm, that of As was 0.9 ppm, that of Au was 0.9 × 10⁻³ ppm, that of Co was 3.5 × 10⁻³ ppm, that of Ni was 0.3 × 10⁻² ppm, that of Cu was 7.4 × 10⁻² ppm, that of Zn was 0.2 ppm, that of Pb was 0.6 × 10⁻² ppm, that of Ag was 0.1 × 10⁻¹ ppm, that of Te was 0.4 × 10⁻¹ ppm, that of Bi was 0.5 × 10⁻³ ppm.

6. Results

6.1. Petrography and Mineralogy

In the Xiajinbao deposit, pyrite is the main mineral host for gold. Gold occurs within pyrite as visible gold (native gold, electrum) within fractures or as inclusions. In this study, three stages of hydrothermal pyrite were carefully identified: Py1 (early-stage pyrite); Py2 (middle-stage pyrite); and Py3 (late-stage pyrite) (Figure 4). The Py1 is mostly distributed in the quartz veins (Stage 1), and occur as hypidiomorphic fine grains (Figure 6a,f). Bi-bearing inclusions are observed in the Py1. The Py2 is mainly distributed within the quartz veins (stage 2), and occur as idiomorphic–hypidiomorphic grains (Figure 6b–d,g,h). It is characterized by pores and fissures, containing some porous nuclei. The Py2 are usually associated with galena and sphalerite. The fissures in the Py2 are usually filled by galena and sphalerite. In addition, Bi-bearing inclusions are also observed in the Py2. The Py3 is distributed within the quartz veins (stage 3), and occur as porous hypidiomorphic fine grains, which are mostly associated with chalcopyrite, tetrahedrite, galena, and sphalerite (Figure 6e,i).

6.2. Occurrence of Electrum and Gold-Bearing Minerals

Gold minerals in the Xiajinbao deposit are mainly electrum, and minor native gold. Electrum and native gold dominantly take the form of granules with various shapes (Figure 6 and Figure 7). Granule diameter statistics under the microscope indicate that the diameter of the gold minerals mostly occur within the range of 0.005–0.053 mm, which accounts for more than 80% of the total gold grains (Table 2).
The gold minerals mostly occur as inter-granule and less commonly as inclusions and as gold within microscopic fractures within pyrite (Table 3; Figure 6a,b). The included gold occurs within auriferous minerals such as pyrite and sphalerite in the form of inclusions (Figure 6c). Locally, gold minerals show paragenetic relations with galena and sphalerite, forming what we have called “paragenetic gold”. Gold minerals also are distributed within the silicified quartz veins as independent minerals (Figure 6e). Small amounts of native gold are also observed embedded within the space among the quartz crystals, with some of the gold included within the quartz crystals (Figure 6e,f).

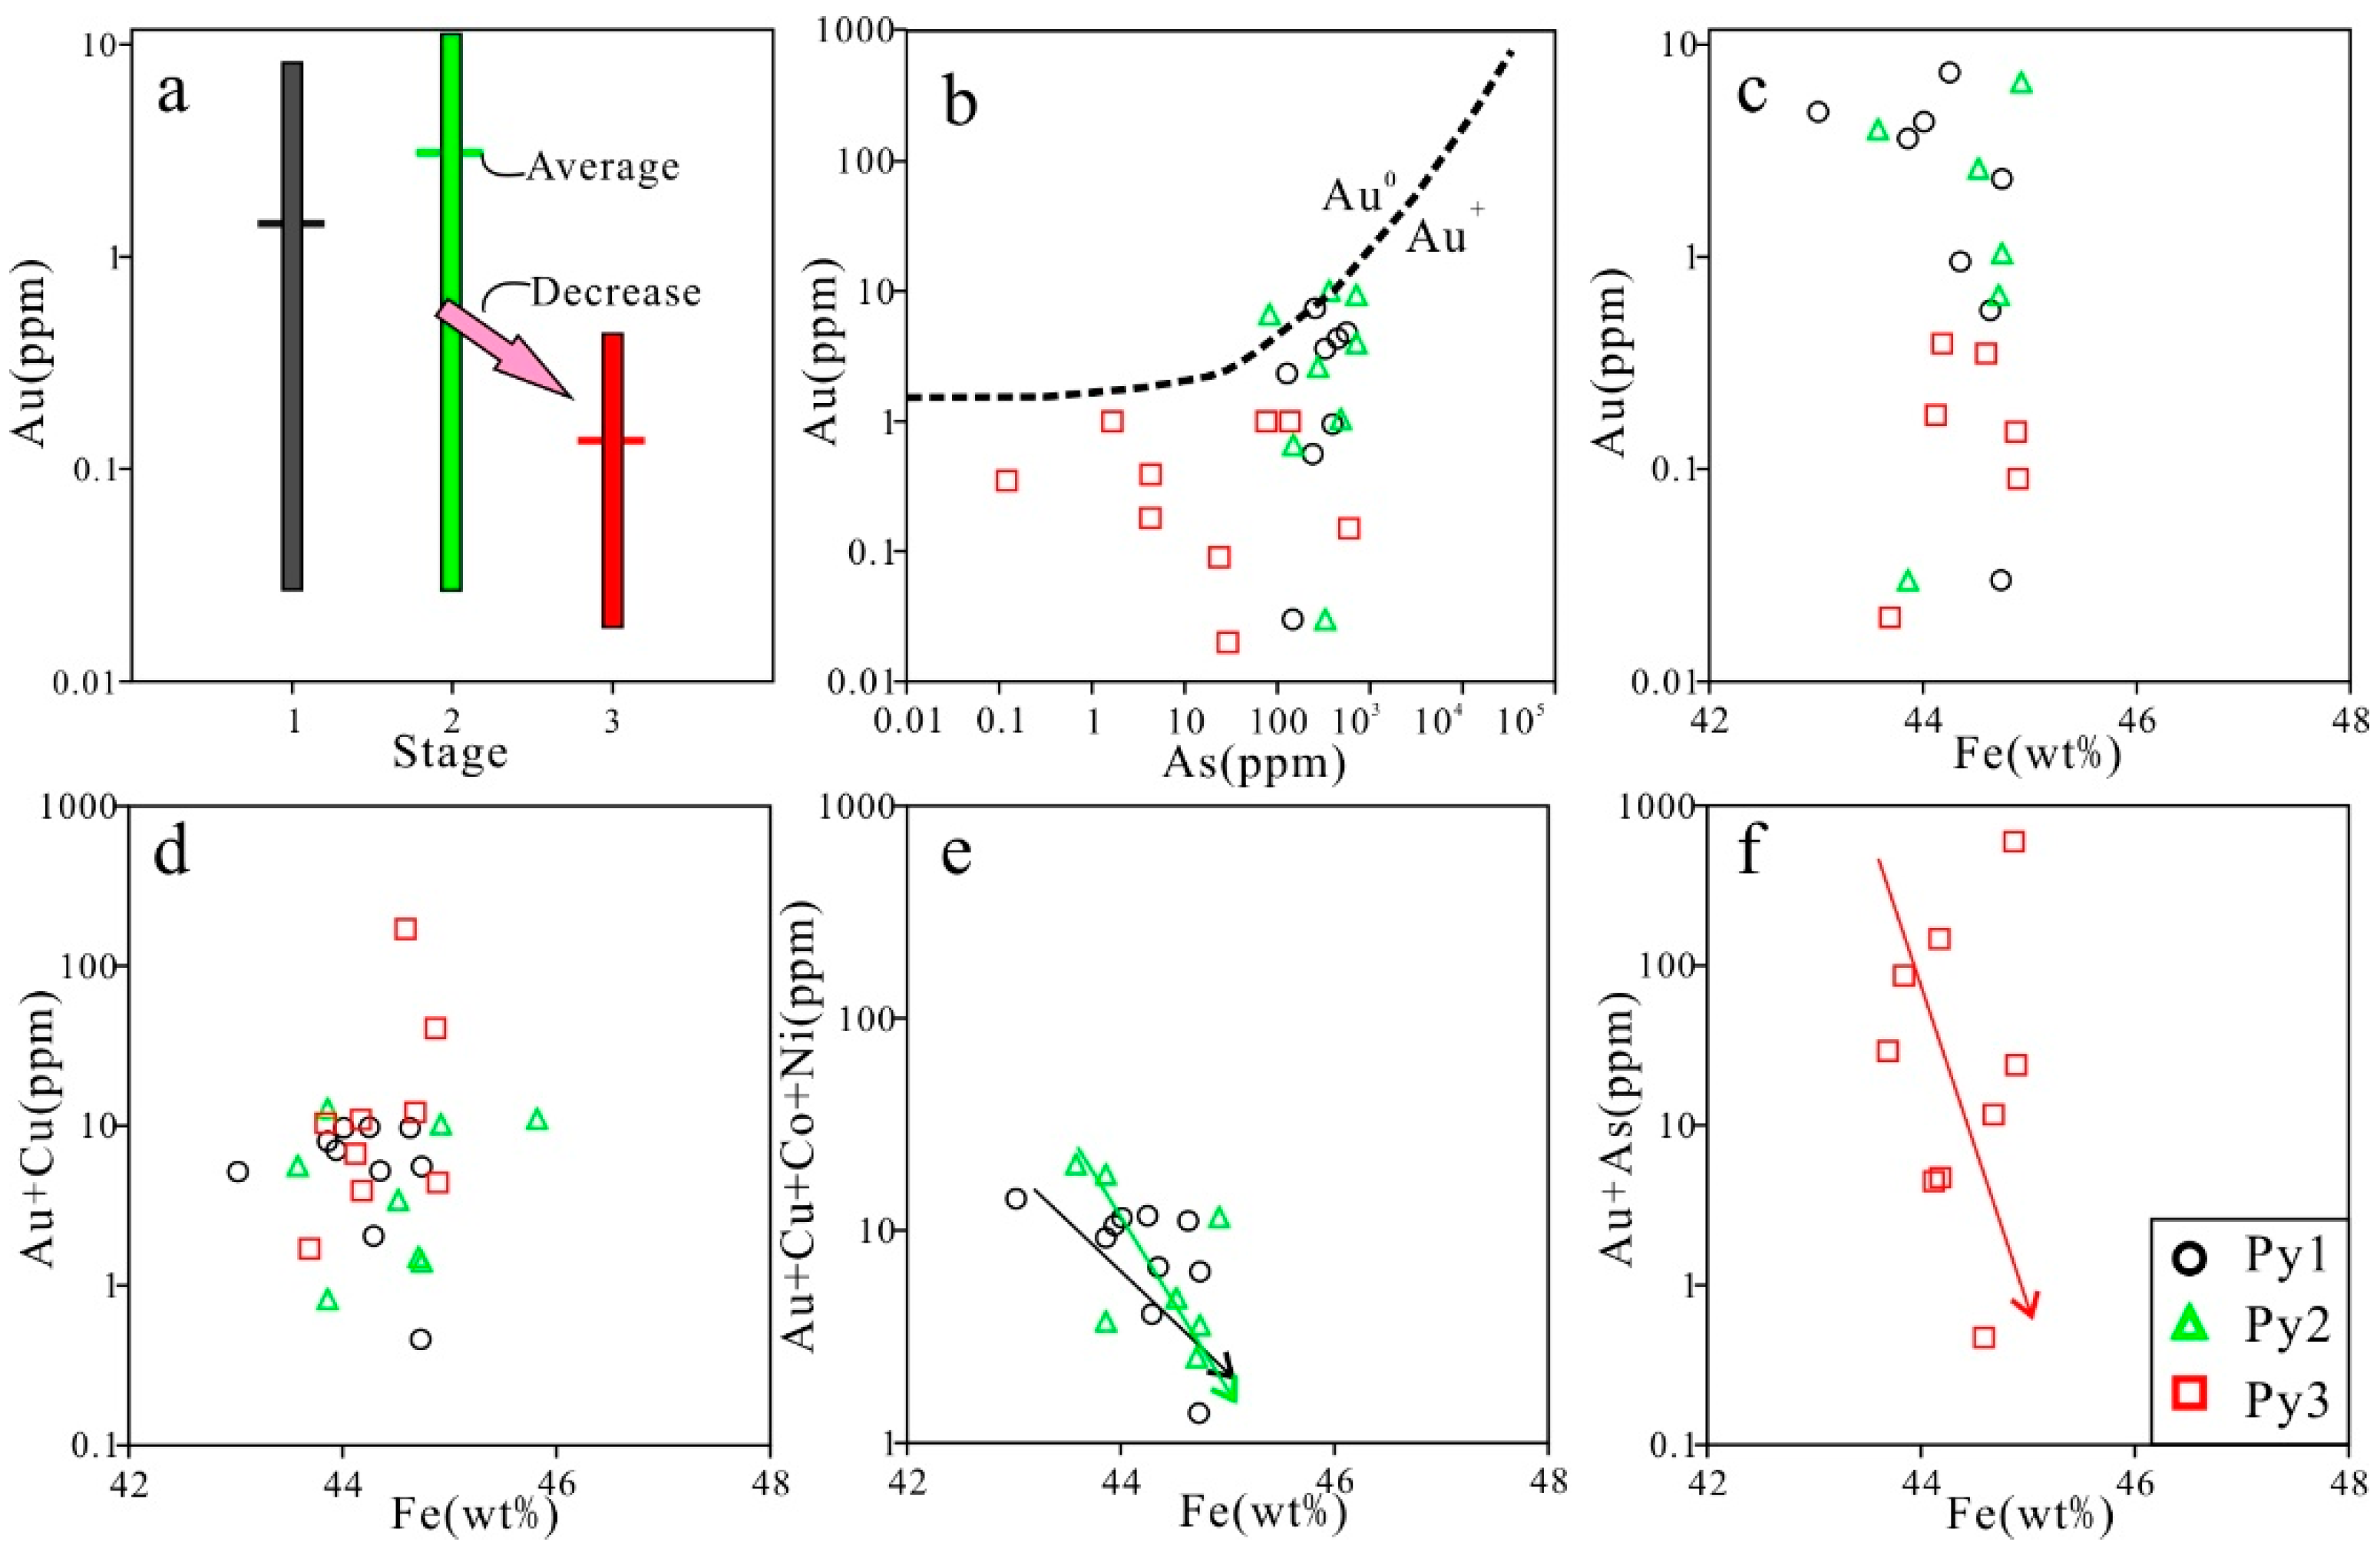
6.3. LA-ICP-MS Trace Element Microscopic in Situ Analysis

LA-ICP-MS spot analyses of 8 representative pyrite grains are given in Table 4. Au contents in Py1 range from 0.00 to 7.4 ppm (n = 10), which are less than those in Py2, which range from 0.03 to 10.1 ppm (n = 8). Py3 type pyrites have the lowest Au concentrations of below the minimum level of detection to 0.39 ppm (n = 9). Compared to Py1 and Py2, Py3 has more abundant trace elements including: Co (<0.01–19.3 ppm), Ni (<0.23–8.8 ppm), Cu (<0.33–170 ppm), Zn (<0.22–4.012 ppm), As (<0.12–716 ppm), Ag (<0.01–180.40 ppm), Te (<0.05–7.7 ppm), Pb (<0.04–2.575 ppm), and Bi (<0.01–360.81 ppm).

7. Discussion

7.1. Trace Element Distributions in Pyrite

Trace metals in pyrite may occur in several ways: (1) as solid solution within the crystal lattice [14]; (2) within nanoparticles of sulfides [26]; (3) within micron-sized inclusions of sulfides [14]; and (4) within micron-sized inclusions of silicate or oxide minerals [27].
Siderophile and chalcophile elements, including Co, Ni, and As, are commonly contained within pyrite (Table 4). A well-defined positive correlation exists between Co and Ni (Figure 8a). Furthermore, there is a negative correlation between Fe and Co, and a negative correlation was also observed between Fe and Ni (Figure 8b,c) in pyrite from different mineralization stages, which indicates that Ni and Co entered the lattice via isomorphous replacement of Fe. The EPMA and LA-ICPMS results show a negative correlation between As and S (Figure 8d), which is consistent with the substitution of As for S as anionic As in the Fe(S1−xAsx)2 solid solution [28,29]. The application of the Au solubility line in the Te–As system [30] represents a method to distinguish between Te in solid solution and inclusion-related presence of Te in pyrite. In Figure 8e, the plots of Py1 and Py2 all below the Au solubility line, suggesting Te is incorporated into the pyrite lattice. Py3 is plotted near or above the line of Au saturation, which reflects the formation of Te-bearing nanoparticles (Figure 8e) [30]. Arsenic significantly affects the incorporation of Te into pyrite due to structural distortion [30]. However, there is no clear relationship between As and Te (Figure 8e), and a negative correlation was observed between (As + Te) and S in pyrite (Figure 8f). Thus, we speculate that Te and As entered the lattice together via isomorphous replacement of S.
There is a positive correlation between Fe and Pb, and a positive correlation was also observed between Fe and Cu in pyrite from different mineralization stages (Figure 8g,h). Lead is least likely to be incorporated into the pyrite crystal lattice due to its ionic size [13]. It has a faster precipitation rate from an aqueous solution as a metal sulfide when compared to Fe [31,32]. Thus, Pb forms galena prior to pyrite formation, such that galena inclusions are commonly found in pyrite. Several analytical spots with higher levels of Pb than in other pyrite samples from different mineralization stages support this interpretation (Table 4). Similarly, high Cu and Zn concentrations probably result from inclusions of chalcopyrite and sphalerite, respectively. Furthermore, micro-inclusions in pyrite may influence the bulk pyrite geochemistry that was detected (Table 4). The few anomalously high Cu, Pb, and Zn analyses in pyrite may result from the presence of Cu-bearing phases, Pb-bearing phases (galena inclusions), and Zn-bearing phases (sphalerite inclusions) (Figure 9). LA-ICPMS data indicates that the Bi content is low in pyrite (0.01–1.39 ppm), with only one exception (360 ppm). During LA-ICPMS analysis, the Bi ion signal is essentially non-detectable. However, visible Bi-bearing minerals are found under reflected-light microscopy (Figure 6c). The anomalously high Bi and Pb values may be attributed to Bi- or Pb–Bi-bearing inclusions (Bi-bearing galena) within the pyrite.
Gold-bearing inclusions (native gold and electrum) were observed in pyrite from several samples by reflected light ore microscope, suggesting that higher Au concentrations in pyrite may result from minute Au-bearing inclusions in the micro-fractures of pyrite (Figure 7). However, small amounts of Au also were incorporated into the pyrite lattice or the interstices when other elements distorted the pyrite lattice to allow that gold to enter [33]. The content of Au in Py3 is obviously lower than Py1 and Py2 (Figure 10a). According to the Au–As plot (Figure 10b), pyrite from different mineralization stages indeed appears to contain significant gold as nanoparticles and in solid solution. There is a negative correlation between Fe and Au in pyrite from different mineralization stages (Figure 10c), indicating that Au entered the lattice via isomorphous replacement of Fe. However, the ionic radius of Au+ is different from that of Fe2+, so the replacement between Au+ and Fe2+ seem impossible. A coupled substitution mechanism of the type Au3+ + Cu+ ↔ 2Fe2+ was proposed [34]. However, there is also no clear correlation between (Au + Cu) and Fe in pyrite (Figure 8d), in turn suggesting that the coupled substitution mechanism is not valid. The fact that there is a negative correlation between Au + Cu + Co + Ni and Fe (Figure 10e) reflect the coupled reaction of Au+ + Cu+ + Co2+ + Ni2+ ↔ 3Fe2+ [34]. In addition, the incorporation of oxidised Au and As species in pyrite due to higher fO2 conditions may be accommodated by a mechanism incorporating the effect of vacancies of the type As3+ + yAu+ + 1 − y(□) ↔ 2Fe2+ [35]. The good negative relationship between (Au + As) and Fe in Py3 (Figure 10f) suggests that Au and As entered the lattice via isomorphous replacement of Fe at higher fO2 conditions.
The fact that measured values in Py1, Py2, and Py3 are concordant with empirical evidence for incorporation of greater amounts of Au into pyrite. Gold can be observed in sulfide fractures and the grain margins (Table 2 and Table 3, Figure 7), implying Au have originally been incorporated within the sulfides and was released [36]. Pokrovski et al. [37] have shown that incomplete redissolution of arsenopyrite can result in gold precipitation along grain boundaries and within fractures in the sulfide. Furthermore, the observed Au enrichment, the presence of nano- to micropores in the interior of some grains (Figure 7b,c) and the clearance of quartz grains (Figure 7e,f), is suggestive of fluid-assisted replacement via reactions between preexisting arsenopyrite and the late percolating fluid.

7.2. Pyrite Genesis

Cobalt and Ni contents in pyrite may reflect the origin of pyrite and the geological setting in which they formed [33,38]. The Co/Ni ratios of Py1 range from 1.91 to 13.45 (Table 4), with an average of 5.80, consistent with ratios for magmatic hydrothermal pyrite [14] and similar to values for the host rock (Xiajinbao granite porphyry). The majority of Co/Ni ratios for Py2 vary from 1.66 to 5.10, with three ranging 0.32–0.69, indicating that Py2 may have been precipitated from mixed fluids of magmatic water with fluids of other origins. The Co/Ni ratios of Py2 are mostly above the Co/Ni ratios of Py1 (Table 4, Figure 8a). Moreover, H–O isotopic data from the middle-stage ore-forming fluid show a small proportion of meteoric water mixed in [8] with the dominant magmatic water. Py1 and Py2 pyrites have significant amounts of Au, indicating that the initial magmatic fluids must have been enriched in Au. In contrast, a majority of Co/Ni ratios from the Py3 ranges from 0.06–0.62 (av. 0.22), with only one analysis above 1 (Table 4, Figure 8a). This is attributed to metamorphic and/or epizonogenic hydrothermal fluids [39] that are related to sedimentary facies [40,41]. H–O isotopic data for late-stage Au-bearing quartz veins suggest that the δ18O values for the ore-forming fluid shifted to meteoric water [8]. Therefore, the Py3 formed in a mixture dominated by evolved meteoric water with a smaller proportion of magmatic water. Py3 contains smaller amounts of Au than Py1 and Py2, which may have resulted from the fact that the late-stage ore-forming fluids are dominated by meteoric water and have only weak gold-carrying capability. Fluids with a high H2S content tend to have a strong capability for carrying Au. Meteoric water, which has a relatively low H2S content, has a weak gold-carrying capability, leading to a lower gold content in Py3 compared to Py1 and Py2 (Figure 10a).

7.3. Ore-Forming Process

Yuan et al. [6] conducted fission track age analysis on zircon and apatite from ores of the Xiajinbao deposit, and they concluded that the age of Au mineralization began at 153.9 Ma. The timing of metallogenesis is close to that of the host rock petrogenesis (163 Ma) [7], indicating that petrogenesis and metallogenesis have a close temporal relationship. They are products of the same tectonic-magmatic event under the same dynamic background. The timing of metallogenic and petrogenesis correspond to the NW subduction of the paleo-Pacific plate beneath the Northern China plate [42,43] and the NS closure of the Mongolia-Okhotsk Ocean [44,45].
Given these conditions, the asthenosphere mantle beneath the Yanshanian Tectonic Belt was perturbed, leading to partial melting of the lithospheric mantle and persistent underplating of mantle-derived magma [46], which in turn caused the partial melting of the lower crust [6]. The magma migrated upward along the F2 deep fault, and condensed to form the Xiajinbao granitic porphyry intrusion at shallow levels. At that time, the magma differentiated to form early stage ore-forming fluids.
During the main mineralization period, the gangue mineral assemblages of carbonate, chlorite, quartz, and minor muscovite (sericite) and the lack of K-feldspar (existing in the pre-ore process) in the ore-forming processes suggests that the hydrothermal fluids were near neutral to slightly acid (pH value ranging from 4.5 to 5.3) [47], and that gold would be transported mainly as Au(HS)2− under a medium–low temperature condition [48,49].
Au(HS)2 + H+ + 0.5H2(aq) → Au0 + 2H2S(aq)
Au(HS)2 + 0.5H2O → Au0 + 2HS + H+ + 0.25O2
When the early-stage fluids migrated to the secondary F4 fault, changes in the physical and chemical conditions of the fluid system led to the formation of the early-stage quartz-gold-pyrite veins. FeCl+ in the magmatic fluids reacted with the reduced sulfur (mostly H2S) to form hydrothermal Py1 according to Equation (3).
FeCl+ + 2H2S(aq) → FeS2(pyrite) + 2H+ + Cl + H2(aq)
Fluid inclusion studies show that fluid immiscibility (boiling) occurred during the emplacement of early Au-bearing quartz veins [8]. The boiling effect could cause the emission of CO2 from the fluids, resulting in a decrease in the H+ content via Equations (2) and (3). The gold and pyrite precipitated in the meantime, and small amounts of gold entered the crystal lattice of pyrite in the form of a very limited solid solutions. As boiling continued, the type of gas emitted changed from CO2 to H2S (the solubility of CO2 is lower than H2S) [50,51]. The emission of H2S favored the reaction in Equation (1), resulting in the substantial precipitation of gold and the end of pyrite formation (Py1) (Equation (3)). Gold in the form of nanoparticle precipitation, resulting from the loss of H2S, could have taken place in the micro-fissures of Py1, which is also consistent with geological observation (Figure 7). Compared with Py1, the Au and As contents of Py2 are remarkably higher. The substitution of As for S in arsenian pyrite facilitates the incorporation of other trace elements, especially invisible Au, due to large amounts of defects in the pyrite structure caused by As substitution [28,52]. The maximum amount of Au that can be incorporated into pyrite is mainly a function of As concentration [29]. The significantly large amounts of Au and As in the Py2 (Table 4) suggest that gold precipitation may be related to the crystallization of arsenian pyrite. The high concentration of Fe in late-stage sphalerite (content of Fe ranges from 1.35% to 4.48%) [25], indicates low oxygen fugacity of the late-stage ore-forming fluids [53,54]. Furthermore, Te-rich pyrite precipitates from reduced fluids due to fluid boiling and fluid-rock interactions [30,55]. The concentrations of Te vary from 0.17 to 0.94 ppm in Py1 (av. 0.56 ppm), from 0.05 to 7.56 ppm in Py2 (av. 2.11 ppm), and from 0.21 to 7.71 ppm in Py1 (av. 3.37 ppm). The increase in Te concentrations from Py1 to Py3 also suggests that the oxygen fugacity in the ore-forming fluid decreased from the early stage to the late stage. The significant concentration of As in Py2 may be closely related to reducing conditions. In hydrothermal fluids dominated by H2S and near neutral to slightly acid pH, As is transported as H3AsO3 [56]. The precipitation of arsenian pyrite (Py2) can be strongly facilitated by decreasing the oxygen fugacity [56], expressed as Equation (4).
4FeS2(Pyrite) + 4H3AsO30 = 4Fe(AsS)(arsenian pyrite) + 4H2S0 + 2H2O + 5O2
Therefore, the precipitation of arsenian pyrite from the middle-stage ore-forming fluids and the occurrence of Fe-rich sphalerite demonstrate that the oxygen fugacity of the ore-forming fluid system decreased. The decrease in oxygen fugacity would promote gold mineralization via Equation (2).
As described above, the late-stage ore-forming fluids had evolved into mixed fluids dominated by meteoric water. The increasing proportion of meteoric water could lead to not only a decrease in the temperature, CO2, and H2S contents but also to changes in the physical and chemical conditions of the ore-forming fluid system; this resulted in the instability of the gold complexes and the precipitation of gold as well as Py3. Therefore, the mixing of meteoric and magmatic water appears to be a factor for the late stage precipitation of gold and Py3.

8. Conclusions

(1) Ni and Co entered the pyrite lattice via isomorphous replacement of Fe, and As entered the lattice via replacement of S. Te is present in the form of inclusions and isomorphs in pyrite. Te and As entered the lattice together via isomorphous replacement of S. There are well-define negative relationships in Py1 and Py2, indicating the coupled reaction of Au+ + Cu+ + Co2+ + Ni2+ ↔ 3Fe2+. Au and As in Py3 entered the lattice via isomorphous replacement of Fe at higher fO2 conditions. Bi, Cu, Pb, and Zn commonly coexist in the form of inclusions in pyrite.
(2) The hydrothermal pyrites in the Xiajinbao deposit vary in their geneses. Py1 and Py2 formed from magmatic waters, while Py3 was related to a mixture of evolved meteoric and magmatic water.
(3) The boiling of early ore-forming fluids caused the precipitation of Py1 and gold. The decrease of fO2 in the ore-forming system resulted in the substantial precipitation of gold and Py2. The mixing between meteoric and magmatic water led to the precipitation of Py3 and small amounts of gold.

Author Contributions

C.W., Y.S., Q.L. and H.Z. conceived and designed the experiments; C.W., J.Z., Z.L. and K.H. performed the experiments; all authors wrote the paper.

Funding

This research was funded by [the Innovation-driven Plan of Central South University] grant number [1053320180985], [the Open Topic of Hunan Key Laboratory of Land Resources Evaluation and Utilization] grant number [SYS-ZX-201804] and [Hunan Provincial Science and Technology Plan] grant number [2017TP1029].

Acknowledgments

This work was supported by the Innovation-driven Plan of Central South University (Project 1053320180985), the Open Topic of Hunan Key Laboratory of Land Resources Evaluation and Utilization (Project SYS-ZX-201804) and Hunan Provincial Science and Technology Plan (Project 2017TP1029).

Conflicts of Interest

The authors declare no conflict of interest.

References

  1. Hart, C.J.R.; Goldfarb, R.J.; Qiu, Y.; Snee, L.; Miller, L.D.; Miller, M.L. Gold deposits of the northern margin of the North China Craton: Multiple late Paleozoic-Mesozoic mineralizing events. Miner. Depos. 2002, 37, 326–351. [Google Scholar] [CrossRef]
  2. Wang, W.; Liu, S.; Santosh, M.; Deng, Z.; Guo, B.; Zhao, Y.; Zhang, S.; Yang, P.; Bai, X.; Guo, R. Late Paleoproterozoic geodynamics of the North China Craton: Geochemical and zircon U–Pb–Hf records from a volcanic suite in the Yanliao rift. Gondwana Res. 2015, 27, 300–325. [Google Scholar] [CrossRef]
  3. Li, H.B.; Ishiyama, D.; Zhang, Y.; Shao, Y.J. Geology and geochemical characteristics of the Xiajinbao gold deposit in the Hebei province, China. J. Miner. Petrol. Sci. 2018, 113, 24–40. [Google Scholar] [CrossRef]
  4. Mei, Y.X. The metallogenic Characteristic and Evolution of Gold Deposits in Jidong Region, Hebei Province, China. Ph.D. Thesis, Chinese Academy of Geological Sciences, Beijing, China, 1997. (In Chinese). [Google Scholar]
  5. Song, Y.; Jiang, S.H.; Bagas, L.; Li, C.; Hu, J.Z.; Zhang, Q.; Zhou, W.; Ding, H.Y. The geology and geochemistry of Jinchangyu gold deposit, north China Craton: Implications for metallogenesis and geodynamic setting. Ore Geol. Rev. 2016, 73, 313–329. [Google Scholar] [CrossRef]
  6. Yuan, W.M.; Wang, S.C.; Wang, L.F. Fission track study on the metallogenetic age of Xiayingfang gold deposit in eastern, Hebei. Nucl. Technol. 1999, 22, 411–413. (In Chinese) [Google Scholar]
  7. Zou, T.; Wang, Y.W.; Wang, J.B.; Zhang, H.Q.; Zhao, L.T.; Xie, H.J.; Shi, Y.; Liu, Y.Z.; Liu, G.Q. Geochronology of the Xiayingfang Au Deposit in Eastern Hebei Province. Geol. Explor. 2016, 52, 84–97. (In Chinese) [Google Scholar]
  8. Luan, W.L.; Yu, Y.X. Geochemistry of fluid inclusions of Xiayingfang gold deposit in Pingquan of Hebei province and ore-searching significance. J. Precious Met. Geol. 1995, 4, 161–167. (In Chinese) [Google Scholar]
  9. Yang, T.D. The study of complex mineralization and metallogenic series of Xiayingfang gold deposit, Hebei province. Earth Sci. 1989, 12, 405–413. (In Chinese) [Google Scholar]
  10. Shao, J.L.; Mei, J.M. Study on pyrite in a volcanic gold deposit in Pingquan, Hebei province. Gold 1984, 5, 3–8. (In Chinese) [Google Scholar]
  11. Jia, S.; Wang, E.; Fu, J. Geological differences and mineralization unity of the key gold ore concentrated regions in eastern Hebei and Western Liaoning provinces. Acta Geol. Sin. 2011, 85, 1493–1506. (In Chinese) [Google Scholar]
  12. Winderbaum, L.; Ciobanu, C.L.; Cook, N.J.; Paul, M.; Metcalfe, A.; Gilbert, S. Multivariate analysis of an LA-ICP-MS trace element dataset for pyrite. Math. Geosci. 2012, 44, 823–842. [Google Scholar] [CrossRef]
  13. Zhao, H.X.; Frimmel, H.E.; Jiang, S.Y.; Dai, B.Z. LA-ICP-MS trace element analysis of pyrite from the Xiaoqinling gold district, China: Implications for ore genesis. Ore Geol. Rev. 2011, 43, 142–153. [Google Scholar] [CrossRef]
  14. Zhang, J.; Deng, J.; Chen, H.Y.; Yang, L.Q.; David, C.; Leonid, D.; Gong, Q.J. LA-ICP-MS trace element analysis of pyrite from the Chang’an gold deposit, Sanjiang region, China: Implication for ore-forming process. Gondwana Res. 2014, 26, 557–575. [Google Scholar] [CrossRef]
  15. Liu, D.Y.; Nutman, A.P.; Compston, W.; Wu, J.S.; Shen, Q.H. Remnants of ≥3800 Ma crust in the Chinese part of the Sino-Korean craton. Geology 1992, 20, 339–342. [Google Scholar] [CrossRef]
  16. Ma, Y.S.; Zeng, Q.L.; Song, B.; Du, J.J.; Yang, F.Q.; Zhao, Y. SHRTMP U–Pb dating of zircon from Panshan granitoid pluton in Yanshan orogenic belt and its tectonic implications. Acta Petrol. Sin. 2007, 23, 547–556. (In Chinese) [Google Scholar]
  17. Niu, S.Y.; Li, F.Y.; Chen, H.S.; Sun, A.Q.; Wang, B.D.; Wang, J.Z.; Ma, B.J. The exploration and prognosis in the depth and the periphery of the Jinchangyu gold deposit in eastern Hebei. Chin. Geol. 2012, 39, 999–1006. (In Chinese) [Google Scholar]
  18. Zhang, G.R.; Xu, J.H.; Wei, H.; Song, G.C.; Zhang, Y.B.; Zhao, J.K.; He, B.; Chen, D.L. Structure, alteration, and fluid inclusion study on deep and surrounding area of the Dongping gold deposit, northern Hebei, China. Acta Petrol. Sin. 2012, 28, 637–651. (In Chinese) [Google Scholar]
  19. Huang, X.; Ziwei, B.; DePaolo, D.J. Sm–Nd isotope study of early Archean rocks, Qian’an, Hebei Province, China. Geochim. Cosmochim. Acta. 1986, 50, 625–631. [Google Scholar] [CrossRef]
  20. Jahn, B.M.; Auvray, B.; Cornichet, J.; Bai, Y.L.; Shen, Q.H.; Liu, D.Y. 3.5 Ga old amphibolites from eastern Hebei Province, China: Field occurrence, petrography, Sm–Nd isochron age and REE geochemistry. Precambr. Res. 1986, 34, 311–346. [Google Scholar] [CrossRef]
  21. Sun, D.Z. The Early Precambrian Geology of the Eastern Hebei; Tianjin Science and Technology Press: Tianjin, China, 1984; pp. 1–273. (In Chinese) [Google Scholar]
  22. Luo, Z.K.; Miao, L.C.; Guan, F.; Qiu, Y.S.; Qiu, Y.M.; McNaughton, N.J.; Groves, D.I. SHRIMP U–Pb zircon dating of the Dushan granitic batholith and related granite-porphyry dyke, eastern Hebei Province, China, and their geological significance. Geochimica 2003, 32, 173–180. (In Chinese) [Google Scholar]
  23. Yang, F.L.; Niu, B.G.; Ren, J.S.; Li, S. Zircon U–Pb ages and geochemical characteristics of the Mesozoic intrusive bodies along the core of the Malanyu anticline and their tectonic significances. Acta Geosci. Sin. 2015, 36, 455–465. (In Chinese) [Google Scholar]
  24. Guo, S.F.; Tang, Z.L.; Luo, Z.H.; Zhao, W.H. Zircon SHRIMP U–Pb dating and geological significance from granite bodies in Tangzhangzi and Niuxinshan, eastern Hebei Province, China. Geol. Bull. China 2009, 28, 1458–1464. (In Chinese) [Google Scholar]
  25. Zhang, J.G.; Shao, Y.J.; Wang, C.; Liu, Z.F.; Xiong, Y.Q. Characteristics of gold-bearing minerals in Xiajinbao gold deposit of Hebei and their metallogenic indicating significance. J. Cent. South Univ. 2018, 49, 901–909. (In Chinese) [Google Scholar]
  26. Ciobanu, C.L.; Cook, N.J.; Utsunomiyas, S.; Kogagwa, M.; Green, L.; Gilbert, S.; Wade, B. Gold–telluride nanoparticles revealed in arsenic-free pyrite. Am. Miner. 2012, 97, 1515–1518. [Google Scholar] [CrossRef]
  27. Thomas, H.V.; Large, R.R.; Bull, S.W.; Malennikov, V.; Berry, R.F.; Fraaser, R.; Froud, S.; Moye, R. Pyrite and pyrrhotite textures and composition in sediments, laminated quartz veins, and reefs at Bendigo gold mine, Australia: Insights for ore genesis. Econ. Geol. 2011, 106, 1–31. [Google Scholar] [CrossRef]
  28. Fleet, M.E.; Mumin, A.H. Gold-bearing arsenian pyrite and marcasite and arsenopyrite from Carlin Trend gold deposits and laboratory synthesis. Am. Mineral. 1997, 82, 182–193. [Google Scholar] [CrossRef]
  29. Reich, M.; Kesler, S.E.; Utsunomiya, S.; Palenik, C.S.; Chryssoulis, S.L.; Ewing, R.C. Solubility of gold in arsenian pyrite. Geochim. Cosmochim. Acta 2005, 69, 2781–2796. [Google Scholar] [CrossRef]
  30. Keith, M.; Smith, D.J.; Jenkin, G.R.T.; Holwell, D.A.; Dye, M.D. A review of Te and Se systematics in hydrothermal pyrite from precious metal deposits: Insights into ore-forming processes. Ore Geol. Rev. 2017, 96, 269–282. [Google Scholar] [CrossRef]
  31. Koglin, N.; Frimmel, H.E.; Minter, W.E.L.; Bratz, H. Trace-element characteristics of different pyrite types in Meso-archaean to Palaeo-proterozoic placer deposits. Miner. Depos. 2010, 45, 259–280. [Google Scholar] [CrossRef]
  32. Morse, J.W.; Luther, G.W. Chemical influences on trace metal-sulphide interactions in anoxic sediments. Geochim. Cosmochim. Acta 1999, 63, 3373–3378. [Google Scholar] [CrossRef]
  33. Cook, N.J.; Ciobanu, C.L.; Mao, J.W. Textural control on gold distribution in As-free pyrite from the Dongping, Huangtuliang and Hougou gold deposits, North China Craton (Hebei Province, China). Chem. Geol. 2009, 264, 101–121. [Google Scholar] [CrossRef]
  34. Chouinard, A.; Paquette, J.; Williams-Jones, A.E. Crystallographic controls on trace-element incorporation in auriferous pyrite from the Pascua epithermal high-sulfidation deposit, Chile-Argentina. Can. Miner. 2005, 43, 951–963. [Google Scholar] [CrossRef]
  35. Simmons, S.F.; White, N.C.; John, D.A. Geological characteristics of epithermal precious and base metal deposits. Econ. Geol. 2005, 100, 485–522. [Google Scholar]
  36. Cook, N.J.; Ciobanu, C.L.; Meria, D.; Silcock, D.; Wade, B. Arsenopyrite-pyrite association in an orogenic gold ore: Tracing mineralization history from textures and trace elements. Econ. Geol. 2013, 108, 1273–1283. [Google Scholar] [CrossRef]
  37. Pokrovski, G.S.; Kara, S.; Roux, J. Stability and solubility of arsenopyrite, FeAsS, in crustal fluids. Geochim. Cosmochim. Acta 2002, 66, 2361–2378. [Google Scholar] [CrossRef] [Green Version]
  38. Bralia, A.; Sabatini, G.; Troja, F. A revaluation of the Co/Ni ratio in pyrite as geochemical tool in ore genesis problems. Miner. Depos. 1979, 14, 353–374. [Google Scholar] [CrossRef]
  39. Chen, Y.J.; Zhai, M.G.; Jiang, S.Y. Significant achievements and open issues in study of orogenesis and metallogenesis surrounding the North China continent. Acta Petrol. Sin. 2009, 25, 2695–2726. (In Chinese) [Google Scholar]
  40. Li, H.B.; Zeng, F.Z. The pyrite’s typomorphic characteristics in gold deposit. Contrib. Mineral. Petrol. 2005, 20, 199–203. (In Chinese) [Google Scholar]
  41. Mao, S.D.; Yang, R.S.; Qin, Y.; Guo, J.H. Characteristics of gold bearing mineral and occurrence of gold in the Yangshan gold deposit field, Gansu Province. Acta Petrol. Sin. 2009, 25, 2776–2790. (In Chinese) [Google Scholar]
  42. Wu, F.Y.; Yang, J.H.; Lo, C.H. The Heilongjiang group: A Jurassic accretionary complex in the Jiamusi massif at the western Pacific margin of northeastern China. Island Arc 2007, 16, 156–172. [Google Scholar] [CrossRef]
  43. Kojma, S.; Kemlcim, I.V.; Kametaka, M. A correlation of accretionary complexes of southern SiKhote–Alin of Russia and the Inner Zone of Southwest Japan. Geosci. J. 2000, 4, 175–185. [Google Scholar] [CrossRef]
  44. Tomurtogoo, O.; Windley, B.F.; Kroner, A. Zircon age and occurrence of the Adaatsag ophiolite and Muron shear zone, central Mongolia: Constraints on the evolution of the Mongol-Okhotsk Ocean, suture and orogen. J. Geol. Soc. 2005, 162, 125–134. [Google Scholar] [CrossRef]
  45. Zorin, Y.A. Geodynamics of the western part of the Mongolia-Okhotsk collisional belt, Trans–Baikal region (Russia) and Mongolia. Tectonophysics 1999, 306, 33–56. [Google Scholar] [CrossRef]
  46. Ma, Q. Triassic–Jurassic Volcanic Rocks in Western Liaoning: Implications for Lower Crustal Reworking and Lithospheric Destruction in the North Part of Eastern North China Craton; China University of Geosciences: Wuhang, China, 2013. (In Chinese) [Google Scholar]
  47. Johson, J.W.; Oekers, E.H.; Helgeso, H.C. A software package for calculating the standard molal thermodynamic properties of minerals, gases, aqueous species, and reaction from 1 to 5000 bars and 0 to 1000 °C. Comput. Geosci. 1992, 18, 899–947. [Google Scholar] [CrossRef]
  48. Seward, T.M. Thio complexes of gold and the transport of gold in hydrothermal ore solutions. Geochim. Cosmochim. Acta 1973, 37, 379–399. [Google Scholar] [CrossRef]
  49. Stefánsson, A.; Seward, T.M. Gold (I) complexing in aqueous sulphide solutions to 500 °C at 500 bar. Geochim. Cosmochim. Acta 2004, 68, 4121–4143. [Google Scholar] [CrossRef]
  50. Reed, M.H.; Spycher, N.F. Boiling, cooling and oxidation in epithermal systems: A numerical modeling approach. Rev. Econ. Geol. 1985, 2, 249–272. [Google Scholar]
  51. Sprcher, N.F.; Reed, M.H. Evolution of a Broadlands–type epithermal ore fluid along alternative P–T paths: Implication for the transport and deposition of base, precious and volatile metals. Econ. Geol. 1989, 84, 328–359. [Google Scholar] [CrossRef]
  52. Heinrich, C.A.; Eadington, P.J. Thermodynamic predictions of the hydrothermal chemistry of arsenic and their significance for the paragenetic sequence of some cassiterite-arsenopyrite-base metal sulfide deposits. Econ. Geol. 1986, 81, 511–522. [Google Scholar] [CrossRef]
  53. Czamanske, G.K. The FeS content of sphalerite along the chalcopyrite-pyrite-bornite sulfur fugacity buffer. Econ. Geol. 1974, 69, 1328–1334. [Google Scholar] [CrossRef]
  54. Einaudi, M.T.; Hedenquist, J.W.; Inan, E. Sulfidation State of Hydrothermal fluids: The Porphyry-Epithermal Transition and Beyond. In Volcanic, Geothermal and Ore-Forming Fluids: Rulers and Witnesses of Processes within the Earth; Sommons, S.F., Graham, J., Eds.; Society of Economic Geologists: Littleton, CO, USA, 2003; Volume 10, pp. 285–313. [Google Scholar]
  55. Huston, D.L.; Sie, S.H.; Suter, G.F.; Cooke, D.R.; Both, R.A. Trace elements in sulfide minerals from eastern australian volcanic-hosted massive sulfide deposits; part I, proton microprobe analyses of pyrite, chalcopyrite, and sphalerite, and part II, selenium levels in pyrite; comparison with δ34S values and implic. Econ. Geol. 1995, 90, 1167–1196. [Google Scholar] [CrossRef]
  56. Wang, L.; Zhu, Y.F. Multi-stage pyrite and hydrothermal mineral assemblage of the Hatu gold district (West Junggar, Xinjiang, NW China): Implications for metallogenic evolution. Ore Geol. Rev. 2015, 69, 243–267. [Google Scholar] [CrossRef]
Figure 1. Simplified geological maps: (a) Major tectonic divisions of China; (b) Sketch map showing distribution of the Triassic to Jurassic granitic intrusions in the eastern NCC; (c) Simplified geological map of eastern Hebei Province (Modified from Mei [4] and Song et al. [5]).
Minerals 08 00388 g001
Figure 2. Geological maps of the Xiajinbao gold deposit.
Minerals 08 00388 g002
Figure 3. Joint section map of the Line 15–Line 11–Line 7 ore bodies (from left to right) of the Xiajinbao gold deposit.
Minerals 08 00388 g003
Figure 4. Mineral assemblages of the Xiajinbao deposit. (a) Banded auriferous pyrite–quartz vein type ores; (b) Galena–sphalerite–quartz vein-bearing altered granitic porphyry; (c) Multi–sulfide (pyrite, chalcopyrite, tetrahedrite, galena, sphalerite)–quartz-bearing altered granitic porphyry; (d) Native–gold–pyrite-bearing quartz vein; (e) Sphalerite replacing hypidiomorphic–allotriomorphic pyrite and replaced by galena; (f) Sphalerite replacing hypidiomorphic–allotrimorphic pyrite, chalcopyrite replacing pyrite and sphalerite, tetrahedrite replacing sphalerite, and chalcopyrite; (g) Common crystallization texture between galena and sphalerite; (h) Galena–sphalerite–quartz vein cutting through pyrite–quartz vein; (i) Multi–sulfides (pyrite, chalcopyrite, tetrahedrite, galena, sphalerite)–quartz vein. Py—pyrite; Ccp—chalcopyrite; Gn—galena; Sp—sphalerite; Td—tetrahedrite; Bi—bismuth.
Minerals 08 00388 g004
Figure 5. Paragenetic sequence of minerals from the Xiajinbao deposit.
Minerals 08 00388 g005
Figure 6. Photomicrographs showing features of metal minerals in Xiajinbao gold deposit: (a) Quartz vein (stage 1) containing hypidiomorphic pyrite (Py1); (b) Quartz vein (Stage 2) containing idiomorphic pyrite (Py2), which is characterized by pores and fissures; (c) Quartz vein (Stage 2) containing hypidiomorphic pyrite (Py2). Bi-bearing fluid inclusions are observed in Py2.; (d) Quartz veins (Stage 2) containing hypidiomorphic pyrite (Py2), which is characterized by pores and fissures; (e) Quartz veins (Stage 3) containing hypidiomorphic pyrite (Py2), which is characterized by pores in the margin and nucleus; (f) BSE image of xenomorphic pyrite (Py1) in quartz vein (Stage 1); (g) BSE image of hypidiomorphic pyrite (Py2) in quartz vein (Stage 2); (h) BSE image of hypidiomorphic pyrite (Py2) in quartz vein (Stage 2); (i) BSE image of hypidiomorphc pyrite (Py3) in quartz vein (Stage 3). Py—pyrite; Ccp—chalcopyrite; Gn—galena; Sp—sphalerite; Td—tetrahedrite; Bi—bismuth.
Minerals 08 00388 g006
Figure 7. Occurrence of “visible gold” in the Xiajinbao gold ores. (a) Fissure gold; (b) Inclusion gold; (c) Inclusion gold; (d) Intra-granule gold; (e) Independent gold; (f) Independent gold and fissure gold; Py—Pyrite; Sp—Sphalerite; Gn—Galena; Td—Tetrahedrite; Ccp—Chalcopyrite; Qtz—Quartz.
Minerals 08 00388 g007
Figure 8. Binary correlation diagram of trace elements in different types of pyrite. (a) plot of Co vs. Ni; (b) plot of Fe vs. Co; (c) plot of Fe vs. Ni; (d) plot of S vs. As; (e) plot of As vs. Te. Solubility line on (e) modified after Keith et al. [30]; (f) plot of S vs. Te + As; (g) plot of Fe vs. Pb; (h) plot of Fe vs. Cu.
Minerals 08 00388 g008
Figure 9. Time-resolved analytical signals of a LA-ICP-MS analysis from Au-bearing pyrite. Suspected solid inclusions are characterized by high Zn (a) and Pb intensities (b) (cps: counts-per-second).
Minerals 08 00388 g009
Figure 10. Gold content in different pyrite generations (a) and binary correlation diagram of trace elements in different pyrite types from Xiajinbao (bf).
Minerals 08 00388 g010
Table 1. Location and descriptions of samples from the Xiajinbao Au deposit.
SampleLocationOre TypesStageDescription
Z41-3179.5 m, borehole ZK1103Quartz pyrite veinsΙQuartz, pyrite, electrum, native gold
Z49-384 m, borehole ZK34
K7Open-pit mine
K1-3Open-pit mineQuartz–galena–sphalerite–veinsΙΙQuartz, pyrite, galena, sphalerite, electrum, native gold
K10-3
K35Open-pit mineQuartz–polymetallic sulfide veinsΙΙΙQuartz, pyrite, chalcopyrite, galena, sphalerite, tetrahedrite
Z498m, borehole ZK04
Z168164m, borehole ZK701
Table 2. Grain size distribution of the gold minerals.
Grain TypeSize Range (mm)No. of GrainsRatio (%)Total Ratio (%)
Micro–fine<0.00582.7433.65
0.005–0.019030.82
Fine0.01–0.03714549.6549.65
Medium0.037–0.0533411.6413.69
0.053–0.07462.05
Coarse0.074–0.131.032.74
0.1–0.351.71
Huge>0.310.340.34
Table 3. Relations among the gold minerals from the Xiajinbao gold deposit.
StylePosition Ratio (%)Total Ratio
Fissure goldPyrite fissure7.889.25
Sphalerite fissure1.37
Intra-granule goldPyrite–quartz3.0833.24
Pyrite–sphalerite3.8
Pyrite–galena0.34
Pyrite–galena–quartz0.34
Pyrite–pyrite0.68
Sphalerite–sphalerite3.08
Quartz–quartz0.68
Sphalerite–quartz20.21
Pyrite–sphalerite–quartz1.03
Inclusion goldSphalerite29.4531.86
Pyrite1.05
Galena0.68
Quartz0.68
Independent goldQuartz25.6525.65
Table 4. LA-ICP-MS spot analysis of pyrite grains.
Sample No.StageSFeCoNiCuZnAsAgAuPbBiTe
wt %wt %ppmppmppmppmppmppmppmppmppmppm
Z51-4Ι54.1944.730.820.10.430.31146.870.050.030.420.020.17
54.7644.630.950.469.131.03241.46180.40.562574.78360.810.48
55.4844.291.860.142.040.322.150.08-0.480.380.89
Z4954.0343.860.970.294.383.24329.370.393.614.650.010.37
56.7643.028.340.620.330.95562.3435.264.820.040.060.61
55.0643.942.970.577.030.2784.310.01-0.86-0.27
54.9744.740.610.243.222.16127.690.892.330.480.010.64
K754.4144.351.250.274.260.35394.360.960.951.360.010.35
53.7644.251.280.672.390.51256.321.697.390.62-0.94
54.2944.011.390.395.364.63449.340.044.330.980.110.86
Z12ΙΙ53.8945.8219.298.551.661.47715.981.649.35154.570.050.26
54.5344.520.860.520.821.7275.6233.982.610.44-4.14
54.9244.920.331.033.552.2382.43.146.65305.22-0.14
55.7143.862.30.610.791.51330.170.080.030.810.017.56
Z2955.8343.586.058.831.620.56716.2169.353.990.390.380.46
54.3443.864.690.922.670.34365.182.6710.080.280.010.05
54.6244.710.670.360.842.69149.270.250.661.35-4.14
54.1344.740.531.640.370.22485.324.631.040.640.570.08
K35ΙΙΙ54.8344.870.070.4740.571204.53594.976.520.1531.610.017.71
55.5544.590.020.15170.064011.920.1222.210.3511.020.011.24
54.9644.170.440.710.931.22136.77--0.540.014.26
Z455.9344.890.160.674.320.4723.694.680.098.36-5.32
55.9444.120.040.36.489.674.289.340.184.21-0.21
55.3143.840.190.860.370.2776.370.62-0.690.013.23
55.3443.690.950.621.682.3829.171.20.021.080.030.49
Z16855.3944.180.140.883.5210.644.315.370.393.24-6.89
56.1144.680.010.232.135.961.651.87-7.191.390.97
The concentration of Fe and S are from EPMA. “-” below detection limits.

