Article

Interpretation of Hydrophobization Behavior of Dodecylamine on Muscovite and Talc Surface through Dynamic Wettability and AFM Analysis

1
School of Minerals Processing and Bioengineering, Central South University, Changsha 410083, China
2
Key Laboratory of Hunan Province for Clean and Efficient Utilization of Strategic Calcium-Containing Mineral Resources, Central South University, Changsha 410083, China
*
Author to whom correspondence should be addressed.
Minerals 2018, 8(9), 391; https://doi.org/10.3390/min8090391
Submission received: 31 July 2018 / Revised: 2 September 2018 / Accepted: 4 September 2018 / Published: 6 September 2018

Abstract

:
In this study, a new approach, “dynamic wettability”, and atomic force microscopy (AFM) imaging analysis techniques were successfully used to characterize the hydrophobization mechanism of the collector dodecylamine (DDA) on muscovite and talc surfaces. The attachment of bubbles to the minerals was studied through the dynamic contact angle to gain a detailed understanding of the hydrophobization mechanism of DDA on a muscovite and talc surface. AFM imaging and interaction forces were performed to explain the DDA adsorption mechanism on both minerals. Finally, flotation tests were performed to verify the effectiveness of these techniques. After treatments with DDA, the contact angles became much larger compared to initial angles, particularly for muscovite, and the attachment of bubbles on the talc surface was much easier than muscovite due to its natural hydrophobicity. From AFM imaging, both the muscovite and talc showed a similar tendency; the higher the DDA concentration, the more the adsorbed amount. However, the adsorbed amount of DDA on talc surface was obviously more than that on muscovite. As far as interaction forces are concerned, the maximum attractions occurred at certain different concentrations respectively for muscovite and talc and agreed well with the AFM-imaging results. Moreover, results obtained from flotation tests were promising and quite in agreement with the phenomenon of these techniques.

1. Introduction

Phyllosilicates, after quartz, are most versatile mineral material mined from Earth’s crust for daily and industrial needs. Phyllosilicates usually consist of stacked tetrahedral and octahedral sheets that further constitute Si-O tetrahedral layers by sharing three oxygen atoms and Al-O or Mg-O octahedral layers. Talc and muscovite (with the composition Mg3(Si2O5)2(OH)2 and KAl2(AlSi3O10)(OH)2), typical hydrophobic and hydrophilic phyllosilicates, both have a 2:1 structure, where one octahedral layer is sandwiched between two tetrahedral layers. The subtle difference is their metal cations, which for talc is an Mg-O octahedron to be held between two tetrahedrons [1,2,3], but Al-O for muscovite. In the structure of muscovite, the tetrahedral layer is usually negatively charged as a result of the ionic isomorphic substitution of about one-fourth of Si4+ by Al3+. These permanent negative charges are neutralized by the interlayer K+, serving as a bridge between two sheets [4]. In talc structure, this substitution can also occur where Si4+ and Mg2+ are replaced by Al3+ and Ca2+ severally [5,6].
As a significant class of valuable industrial materials, the colloidal interaction forces of mineral particles between basal planes, edge planes, or basal planes and edge planes in muscovite flotation can be evaluated by the classical Derjaguin–Landau–Verwey–Overbeek (DLVO) theory [7]. It consists of two fundamental colloidal forces, the attractive Van der Waals force and the repulsive electrostatic double-layer force, respectively. The former can be determined by the Hamaker constant and the distance between the two particles that doesn’t substantially change when changing other conditions. Meanwhile, the latter is strongly influenced by many situations such as the type of solutions, its concentrations, and pH. The measurements of colloid forces between two solid surfaces have been reported widely in previous studies [8,9,10,11]. Lujie Yan et al. [12] focused deeply on the research of the interaction of divalent cations with basal planes and edge surfaces of muscovite and talc by atomic force microscopy (AFM). They got the values of Stern potential of basal and edge planes via fitting the measured force profiles with the DLVO theory and found that on the basal planes of muscovite, the fitted Stern potential became less negative with an increase of Ca2+ or Mg2+ concentration. Vishal Gupta and Jan D. Miller [8] measured the interaction forces between basal planes of ordered kaolinite particles on substrates that revealed that at pH > 4, the silica tetrahedral face of kaolinite is negatively charged. For the alumina octahedral face, it is nevertheless charged positively and negatively at pH < 6 and pH > 8, respectively. In our previous study [13], the interaction forces in electrolyte solutions (KCl) between a silica colloidal sphere and a muscovite substrate were measured and fitted with classical DLVO theory at different pH values, concentrations, and effects of time. The conclusion showed that at the lower KCl concentration or the higher pH, what dominated in muscovite–silica system was mainly the electrostatic double-layer force. But, in the opposite condition (the higher electrolyte concentration or lower pH), it was the van der Waals force that dominated the non-contact force at a closer distance.
The wettability of the surface often plays an important role in a variety of research fields such as filtration [14,15] and dewatering [16]. Especially in the froth flotation of minerals [17], it is the precondition for getting better results in flotation separation where the wettability on mineral surfaces is usually characterized by contact-angle measurements. Nowadays, a substantial amount of investigations have been carried out on the hydrophobization and the reagent adsorption of minerals [18,19,20,21]. Muscovite, dodecylamine hydrochloride, and sodium oleate were combined to increase the collector-adsorbed amount on its surface, thereby achieving higher recovery [22]. In the flotation of spodumene from feldspar, the most adsorbed amount of collector appeared at the molar ratio of 1:9 for dodecyl ammonium chloride and sodium oleate, where the highest selectivity was reported. However, there is hardly any work aimed at measuring the varying hydrophobicity of minerals by different ways.
In this study, a new approach was employed to measure the change of wettability on a hydrophilic muscovite surface and hydrophobic talc surface before and after treatment with dodecylamine (DDA). The attachment of bubbles to the minerals was studied through the dynamic contact angle to gain a detailed understanding of the hydrophobization mechanism of DDA on the muscovite and talc surface. Furthermore, AFM was used to observe the adsorption mechanism of DDA on a mineral surface, and the interaction forces between the basal planes of muscovite and talc in electrolyte and collector solutions under different conditions were also carried out. The classical DLVO theory was fitted to the experimental interaction force profiles.

2. Materials and Methods

2.1. Samples and Chemicals

The samples of muscovite and talc required for this study were received from Lingshou, Hebei province, China, and Kuandian, Liaoning province, China, respectively. Lump samples were handpicked, crushed, and ground in a laboratory porcelain mill to obtain a maximum amount with a size range of 45–75 μm. With regard to AFM and dynamic wettability analysis, samples were freshly cleaved into sheets as their perfect cleavages along basal planes. Chemical composition and X-ray diffractometry (XRD) were carried out to examine the purity of these two samples. Using X-ray fluorescence (XRF) and XRD analysis, the chemical and mineralogical composition of both minerals were determined and results (see Table 1 and Figure 1) indicated their purity to be about 90%, which was good enough to utilized these minerals in this work.
DDA, used as a collector for flotation tests, was purchased from Sinopharm Chemical Reagent Co., Ltd. (Shanghai, China). Freshly prepared KCl solution was used as electrolyte in force measurements by AFM. HCl and NaOH, from Damao Chemical Reagent Factory China, were used to control the pH. All the reagents were analytical-grade. Different drops of HCl (3%, volume concentration) or NaOH (5%, mass concentration) were added to control the pH to the desired value. It is worth noting that pH regulators were added through glass dropper bottles to eliminate the influence of the volume change of slurry. Ultrapure water was used throughout the study.

2.2. Methods

2.2.1. Dynamic Wettability Tests

Wettability tests were performed by a dynamic contact angle that was determined through the pendant-drop method by a video contact angle-measuring instrument (JY-82C, Chengde Dingsheng Tester Co., Ltd., Chengde, China). Before the test, the position of the needle tip of the syringe above the sample surface was accurately adjusted and the volume of every droplet was controlled at 3 μL by a constant speed injector. The method used here was quite different from the conventional static method; the experimental droplets used for the dynamic contact angle were collectors (DDA) instead of water. The freshly cleaved muscovite and talc sheets were placed on the stage and collector droplets were dropped on the mineral surface to observe their changes within 6 min. The images of the droplets that settled on the sample surface were created with a digital camera, and magnified by an optical lens. Besides that, the adhesion ability of the bubbles on the surface was also studied. Mineral sheets that had been immersed in the DDA solution for 30 min were placed in a container with ultrapure water. The bubble that was produced by an injector approached and then adhered to the mineral surface. Finally, the angle between the bubble and the surface was measured. The procedure was repeated at least 3 times under the same conditions, and the average was calculated as the final result.

2.2.2. Tapping Mode AFM Imaging

Adsorption surface AFM imaging (in situ) through tapping mode was performed by a Multimode SPM with Nanoscope V (Bruker, Billerica, MA, USA). A silicon probe (RTESP-300 type, Bruker) with a typical spring constant of 0.2 N/m and a resonant scanning frequency of around 2 Hz (Bruker) was used in this measurement. Tapping mode was employed to collect the images using a phosphorus (n)-doped silicon cantilever probe and to obtain some larger-scale images (1.5 μm × 1.5 μm) of the substrates and adsorption morphology. All images were flattened by polynomial functions for ease of comparison and to eliminate the effects of image bending and distortion due to the movement of the piezoelectric scanning tube. At first, the lamellar pieces of sample substrates, which were glued onto a magnetic plate, were immersed in DDA solutions with a certain concentration for 30 min. After being taken out, the sample surface was gently rinsed with ultrapure water to remove the remaining reagent on the surface and blow-dried with high-purity nitrogen for adsorption morphology tests. All the AFM observations were conducted in air at 20 °C.

2.2.3. AFM Force Measurements

Interaction force measurements were carried out in KCl and collector solutions, respectively, at different concentrations and pH values. A tipless silicon probe with NP-O10 type (Bruker) was used through contact mode. Before the measurements, the magnetic plate with freshly cleaved muscovite and talc sheets was fixed on the piezo translation stage. Sample sheets with lamellar pieces of about 20 μm in length were picked by a light microscope and glued with a two-component epoxy onto the apex of the cantilever. Then, the prepared mineral probes were placed in a vacuum desiccator for at least 24 h, and the micrographs of the muscovite probe and the talc probe are shown in the Figure 2. It was mounted in the liquid cell where solutions were injected slowly. About 1 h after the solutions were stable, the interaction force measurements were performed. When the mineral substrate approaches/departs from the mineral probe in the vertical (Z) direction, the force between the two basal planes of the sample causes the cantilever spring to deflect upward or downward, depending on the nature of the force between sample surfaces [23]. Some literatures can be referred to for more details about force measurements [24,25,26,27]. For each test condition, many different locations on the mineral substrate were measured to ensure a reproducible force profile. All the experiments were operated at room temperature (about 20 °C) in a class-100 clean room. Regarding to the ψ potential of minerals, a Coulter Delsa 440sx Zeta potential analyzer (Beckman Coulter, Inc., Chaska, MN, USA) equipped with a rectangular electrophoresis cell was employed to determine their values. Mineral samples were ground to –2 µm and the suspension was prepared by adding 40 mg of mineral samples to 80 mL desired solutions containing 1 mmol/L KNO3 as supporting electrolytes. Then, the suspension was conditioned by magnetic stirring for 6 min to ensure adequate dispersion of the fine mineral particles. After settling for 10 min, the supernatant of the dilute fine particle suspension was taken for potential measurements.

2.2.4. Microflotation Tests

Microflotation experiments were performed in a 40 mL flotation cell with a fixed impeller speed of 1500 r/min. Two grams of samples with 35 mL of ultrapure water were used in each test. The pulp was first conditioned for 1 min to uniformly disperse the particles. Then, HCl or NaOH was added to adjust the pH to desired values. After that, the pulp was conditioned with collectors (DDA) for 3 min. The flotation was conducted for 3 min. The froth products and tails were weighed after filtration and drying. The recovery was calculated based on the mass of products. The flotation tests were performed 3 times with the same procedure and conditions and the average was reported as a final value.

3. Results and Discussion

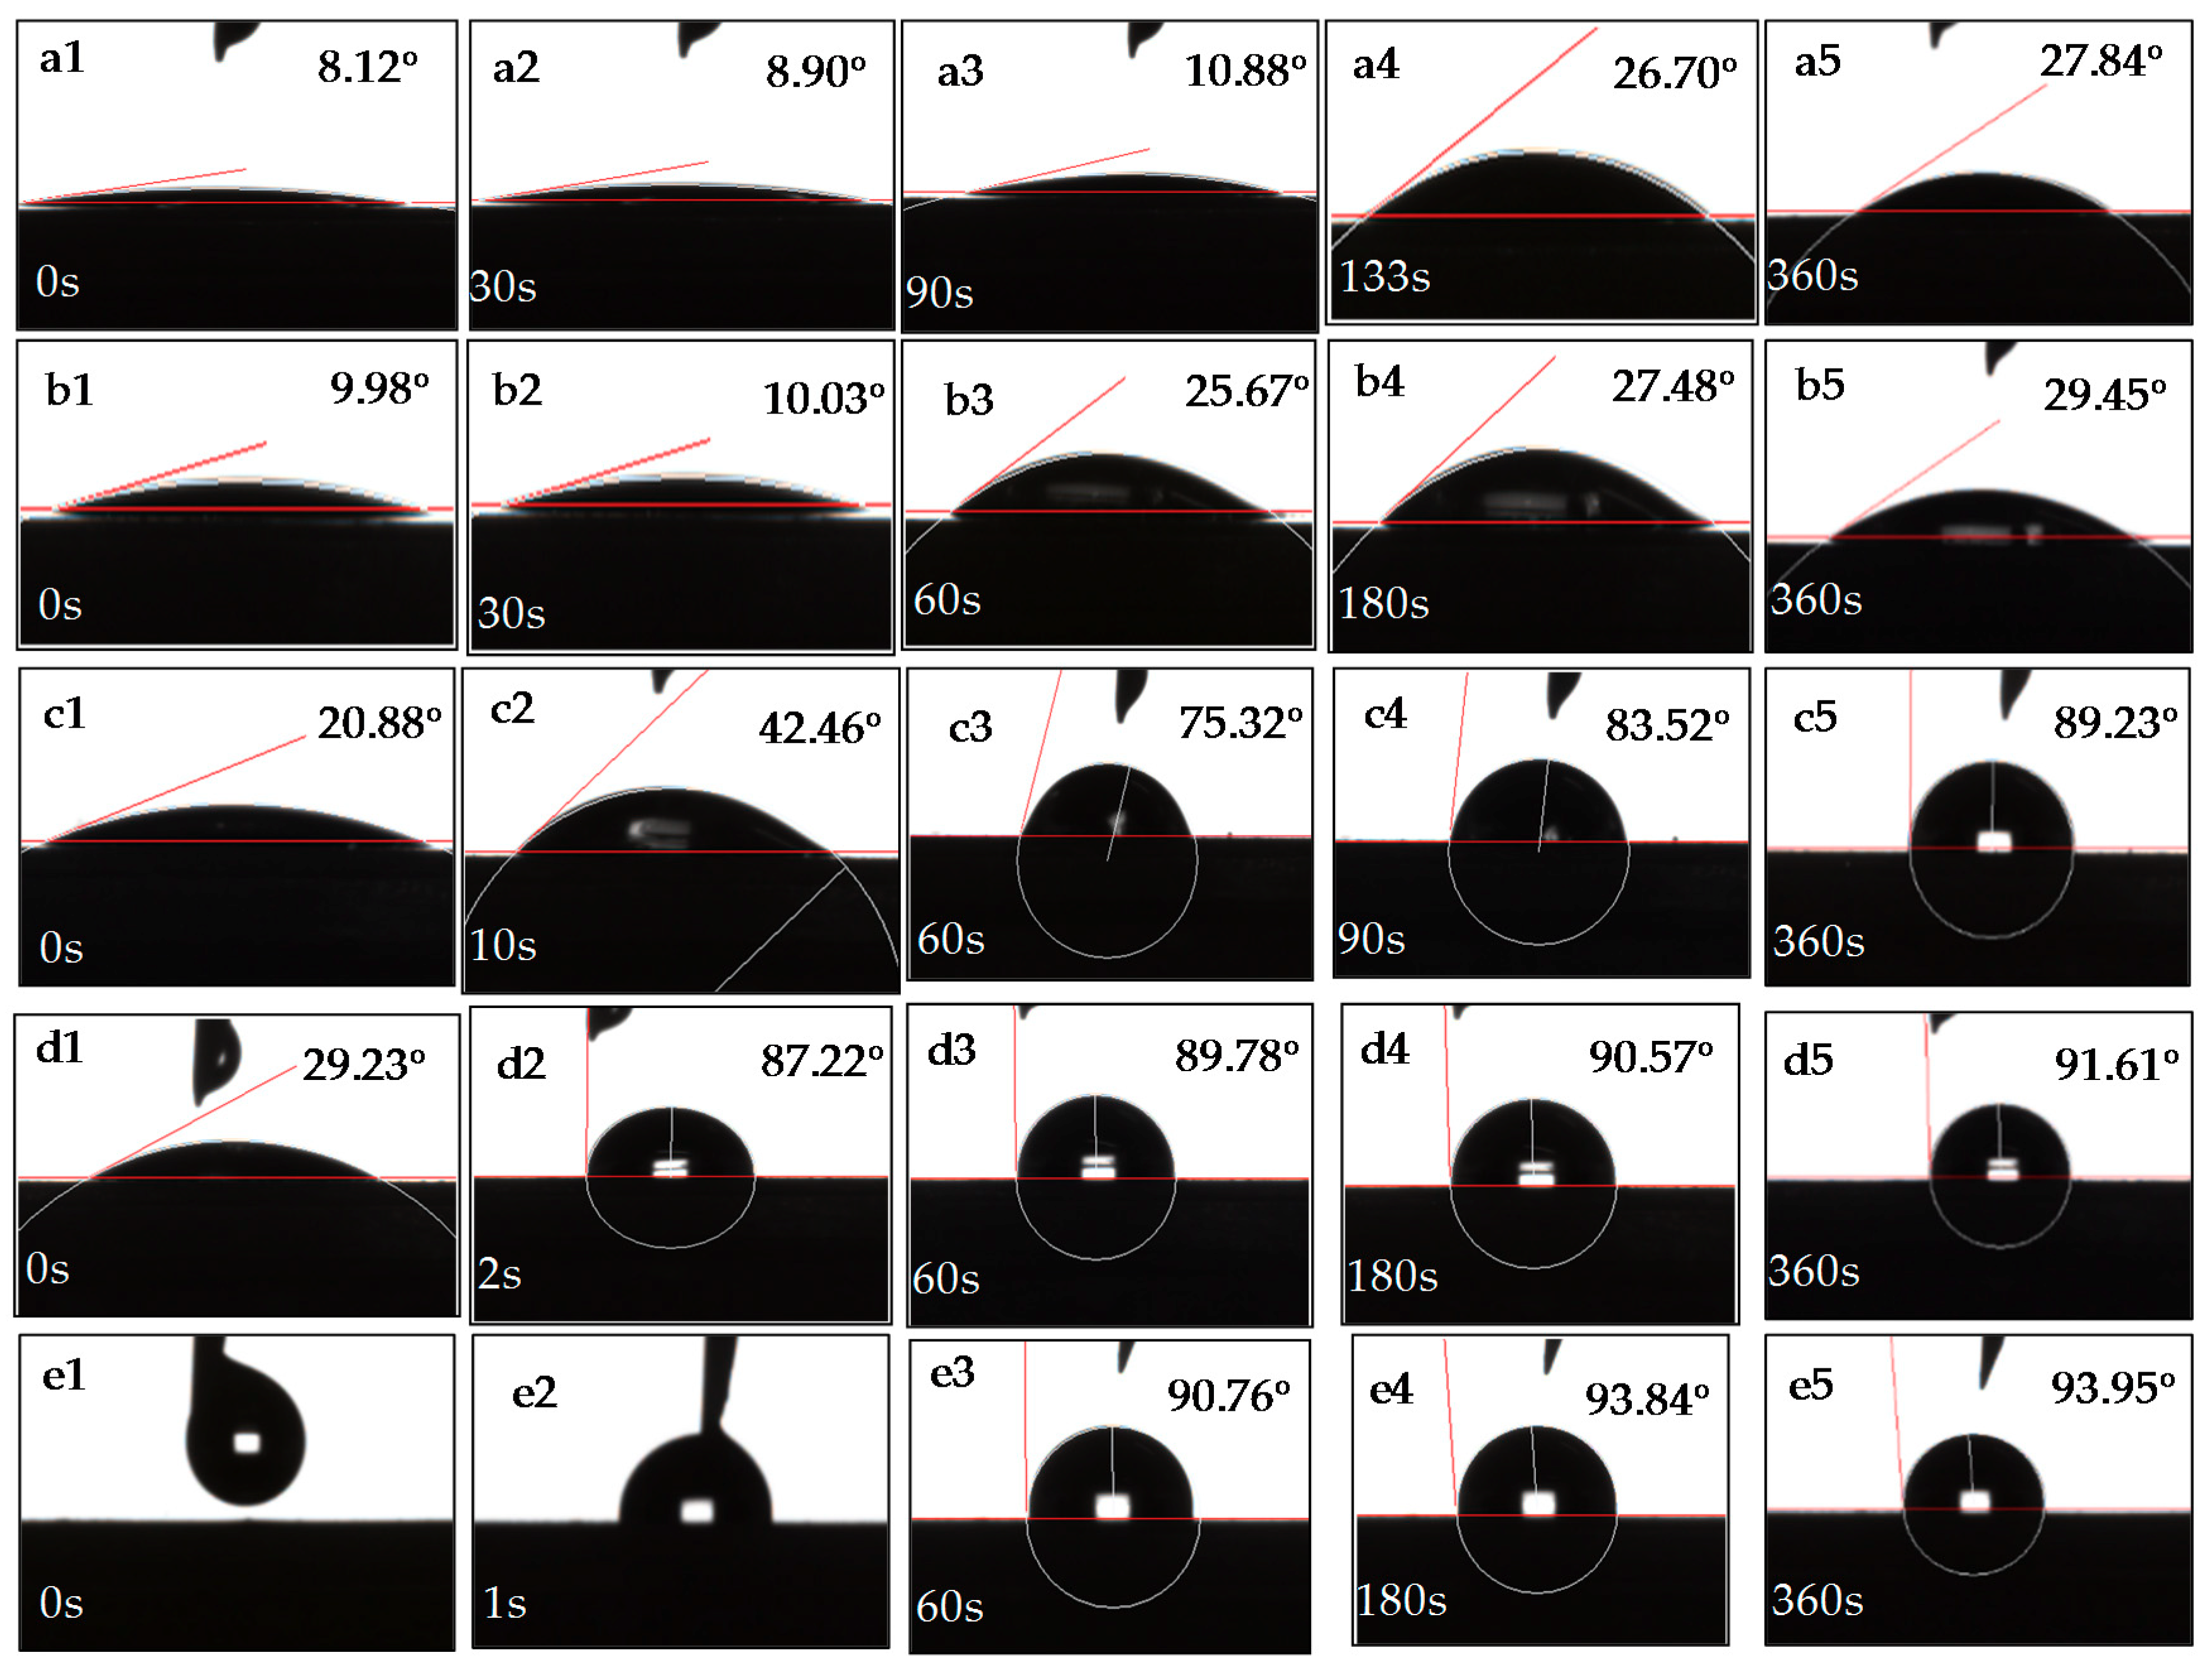
3.1. Dynamic Wettability Analysis
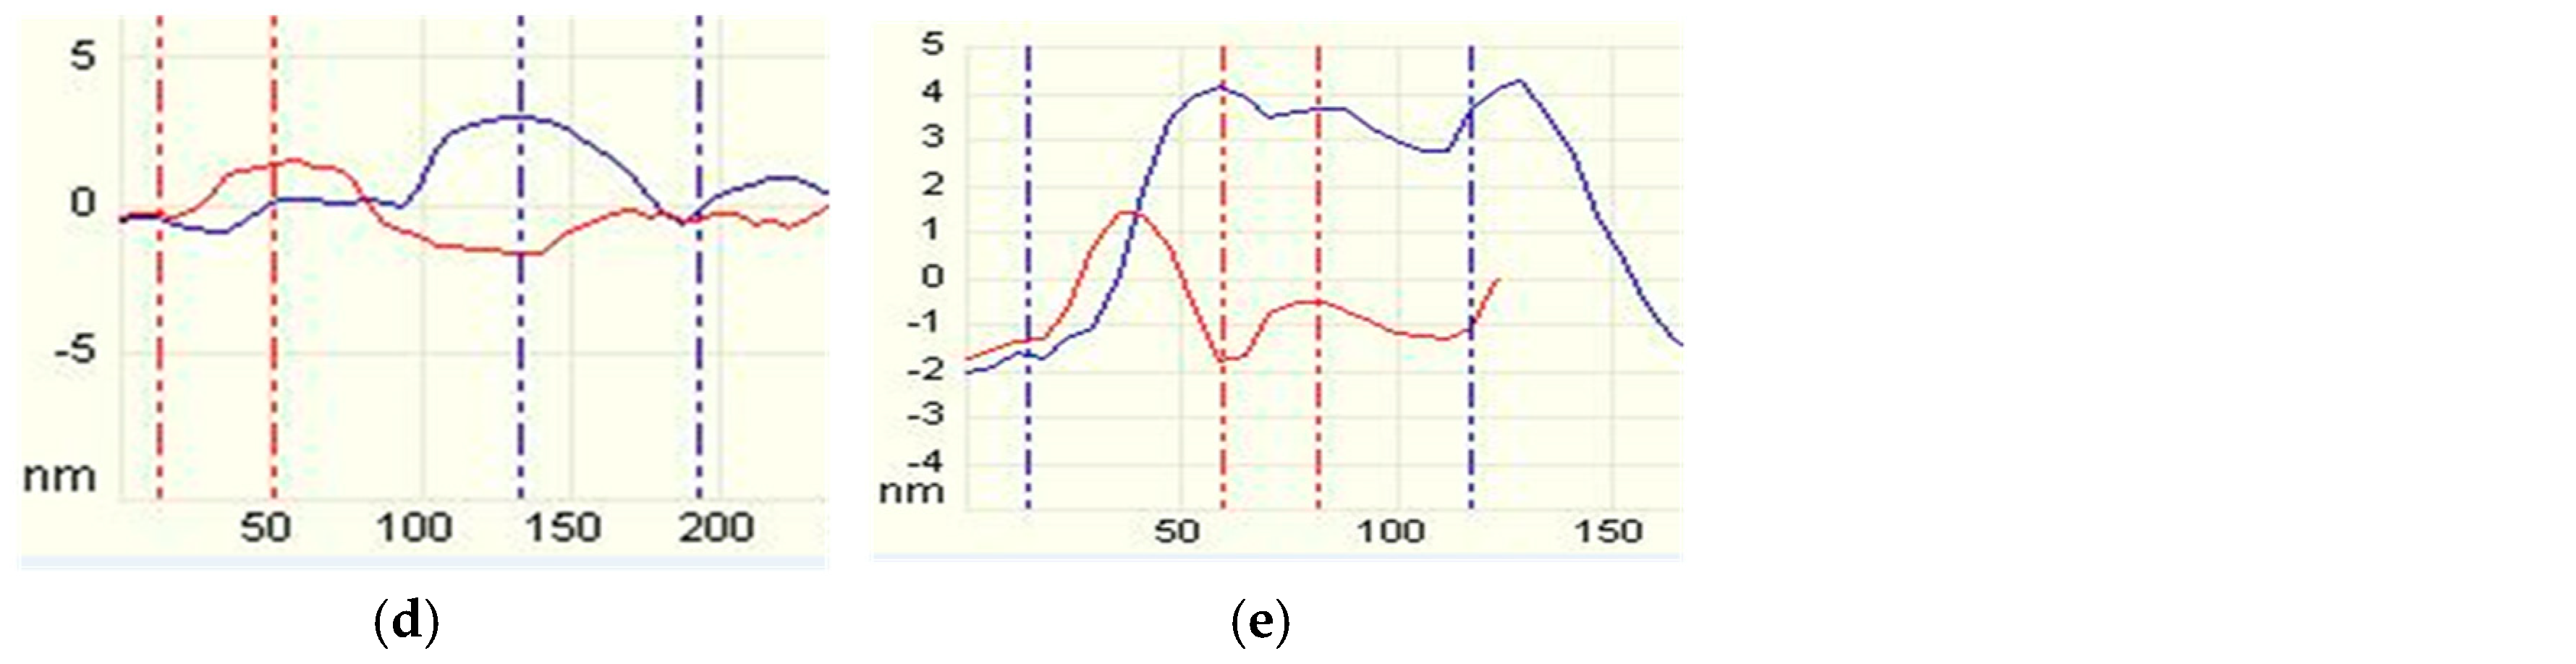
Differing from traditional static methods, how the collectors spread on the mineral surface was visually displayed by dynamic contact angle to explain the hydrophobization mechanism. The contact angle of muscovite, as a natural hydrophilic mineral, is only about 7°. In the mineral flotation process, we usually add some specific reagents to expand the differences in wettability among minerals to achieve the aim of flotation separation. The hydrophobicity changes of muscovite surface by the DDA collector are shown in Figure 3. At a lower DDA concentration (1.0 × 10⁻⁵ mol/L), when the DDA solution has just dropped on the muscovite surface for a period of time (shown in Figure 3(a1)–(a3)), the formed contact angle between the droplet and the muscovite surface was almost equivalent to that in pure water, which appeared to still be hydrophilic at this time. After the passing of some time, there was an interaction between the collector and muscovite indicating from Figure 3(a4) that the wettability varied from superhydrophilic to less hydrophilic. As time continued to pass, the contact angle continued to increase, and then ultimately got stable at 27.84° after 6 min (shown in Figure 3(a5)). When the DDA concentration increased to 5.0 × 10⁻⁵ mol/L, as shown in Figure 3(b1)–(b5), not only was the time required for DDA to interact with the muscovite surface shortened from 133 s in Figure 3(a1)–(a5) to 60 s, but the formed contact angle also became a little bigger (29. 45°).
At 1.0 × 10⁻⁴ mol/L (see Figure 3(c1)–(c5)), the whole process can be observed where the muscovite surface turned from extremely hydrophilic to hydrophobic. It took only 10 s for the muscovite surface to interact, resulting in an instantly big contact angle. The longer time went on, the bigger the angle was, and the stronger the hydrophobicity became, finally achieving a steady state. At this point, the contact angle reached 89°, indicating that muscovite had been quite hydrophobic. The interaction times were shortened to just 2 s and 1 s, respectively, at 5.0 × 10⁻⁴ mol/L and 1.0 × 10⁻³ mol/L of DDA concentration. The final contact angles were, respectively, 91.61° and 93.95°, which illustrated that the muscovite surface had changed successfully from natural hydrophilicity to exceeding hydrophobicity. Generally, the collector DDA can change the wettability of muscovite, making the muscovite surface from hydrophilic to hydrophobic, and the higher the DDA concentration, the shorter the time required for interaction with the muscovite surface and the stronger the hydrophobicity of the muscovite surface is.
Differing from hydrophilic muscovite, talc is known for its natural hydrophobicity. In natural conditions, the contact angle of talc was measured at about 60°, which was in accordance with the value in Reference [28]. However, the effects of DDA and its different concentrations on the dynamic contact angles of talc are shown in Figure 4. At the lowest concentration of 1.0 × 10⁻⁵ mol/L (see Figure 4(a1)–(a5)), as soon as the collector droplet fell on surface, the reagent reacted with the talc. The formed contact angle was even slightly larger than that of pure water on the talc surface. However, there was a minor decrease in the contact angle after a while, which could be explained due to the effect of gravity or evaporation. After some time, the formed angle was noted at 69.58°, about 9° higher than in natural conditions. Increasing the concentration up to 5.0 × 10⁻⁵ mol/L, as seen in Figure 4(b1)–(b5)), it still took quite a few seconds to undergo changes, and the ultimate angle was higher than that of the lowest concentration but the increase was not very obvious. Substantial increment in the contact angles, with increasing concentration from 1.0 × 10⁻⁴ mol/L to 5.0 × 10⁻⁴ mol/L suggested that the wettability of talc evidently changed. However, under the same concentrations, the amount of increase was not so good as compared to muscovite, revealing the significance of surface wettability in the formation of contact angles. As seen in Figure 4(e1)–(e5), at 1.0 × 10⁻³ mol/L, the contact angle formed by the DDA droplet on the talc surface had exceeded 90°, making the talc surface extremely hydrophobic. Thus, results suggest that the higher DDA concentration can make the contact angle larger, but compared with the muscovite, the amount of increase for talc is somewhat smaller.
Apart from dynamic contact-angle tests, the ability of bubble adhesion for mineral surface can further characterize its wettability. Figure 5 clearly interprets the adhesion process of minerals in ultrapure water before and after samples were treated by collector. For muscovite (see Figure 5(a1)–(a5)), when the bubble approached its surface and then left, there was no sign of adherence to the muscovite surface, indicating that the freshly cleaved muscovite was too hydrophilic to stick to a bubble. After the muscovite sample was treated with the DDA collector solution at 1.0 × 10⁻⁴ mol/L, the bubble was successfully adhered on its surface, as shown in Figure 5(c1)–(c5), and the formed contact angle (89.94°) was also close to the value in the dynamic contact-angle test (Figure 3(c1)–(c5)). For hydrophobic talc, the bubble could be stuck on its surface even in the absence of the collector solution (shown in Figure 5(b1)–(b5)). However, the formed contact angle (57.06°) was slightly too small to seem to have a tendency to be detached. After treatment with the DDA solution (Figure 5(d1)–(d5)), the talc surface was hydrophobic enough to make a bubble adhere steadily and the shaped angle was obviously bigger than that of the untreated. In comparing these two samples with different wettability, the collector can effectively change the hydrophobicity of a mineral surface.

3.2. AFM Imaging

Tapping-mode AFM imaging was used to characterize the freshly cleaved muscovite and talc surfaces. The AFM images of bare muscovite and talc are illustrated in Figure 6. Due to their unique crystal structures, the (001) crystal plane could be attained easily and both surfaces were very smooth, shorter than 0.2 nm (see Figure 6). Therefore, some factors that influence adsorption morphology of collectors on muscovite and talc surface can be excluded, making the results more representative and convincing. The adsorption morphology (1.5 μm × 1.5 μm) of muscovite and the height images of DDA on its surface were studied from Figure 7, when its concentration ranged from 1 × 10⁻⁵ mol/L to 1 × 10⁻³ mol/L. As can be seen, different adsorption morphologies occurred at different concentrations. At lower concentrations (Figure 7a to Figure 7b), only a small amount of DDA was adsorbed on the muscovite surface and uniformly spotted, indicating that the interaction was weaker between lower concentrations of DDA and the basal plane of muscovite. By increasing DDA concentrations (Figure 7c to Figure 7e), obvious changes in adsorption morphology appeared that gradually increased both the density and area of adsorption, from some single spots, sparsely flaky distribution to compact sheets finally. Taking Figure 7a as the example, a natural adsorption state, at the lowest concentration of 1 × 10⁻⁵ mol/L, was observed and its adsorption height was about 1.5 nm. Considering the theoretical length of DDA molecules (1.89 nm) [29,30], the height profile of about 1.5 nm could be explained in that DDA molecules were adsorbed obliquely on muscovite surface. When DDA concentrations rose to 1 × 10⁻⁴ mol/L (Figure 7c), one of the height profiles of about 3.8 nm coincided exactly with the double-layer adsorption of DDA, while most of the others were still monolayer. But in Figure 7d, the density and area of double-layer increased significantly and only a few molecules were adsorbed with monolayer. At the highest concentration (Figure 7e), the average heights were much higher than those of lower concentrations. That is to say, the adsorption morphology of DDA changes gradually from monolayer to bilayer, and even to multilayer as its concentration keeps increasing.
Adsorption morphology (1.5 μm × 1.5 μm) of talc and height images of DDA collector on its surface are shown in Figure 8. Like muscovite, a similar situation was observed for talc; the adsorption area increased gradually with increasing DDA concentration. At 1 × 10⁻⁵ mol/L, a bit of DDA was adsorbed on the talc surface and was uniformly spotted like muscovite. Although adsorptions of muscovite and talc were both monolayer, the absorbed amount on talc was much more than that on muscovite. Increasing to 5 × 10⁻⁵ mol/L, larger spots emerged with the same adsorption heights, which tended to link together to be a bulk. Until 1 × 10⁻⁴ mol/L, sparsely flaky distribution was observed and the bulks were adsorbed with bilayer, while a little was monolayer. At 5 × 10⁻⁴ mol/L, closer bulks occurred showing clearly that the density and area of adsorption increased evidently and the interaction was stronger between higher concentrations of DDA and the basal plane of talc. When DDA concentration reached the maximum, the adsorption morphology changed significantly. At this time, the reagent adsorption on talc surface was very uniform and tight, covering almost the entire surface of the talc. Ranging from 1 × 10⁻⁵ mol/L to 1 × 10⁻³ mol/L, muscovite and talc showed a similar situation with the DDA concentration rising; however, the adsorption density and area for talc were much higher than that of muscovite under the same concentration. This phenomenon can be explained by the hydrophobicity of mineral surfaces on which the hydrophobic attraction of talc is larger than that of muscovite, making its adsorption density and area of DDA higher. Similarly, this hydrophobic attraction can also generate its monolayer or multilayer adsorption on talc and muscovite surfaces. These results were consistent with the dynamic wettability analysis above that the higher the concentrations of DDA are, the larger the adsorbed amount is, making the contact angles increasingly bigger.

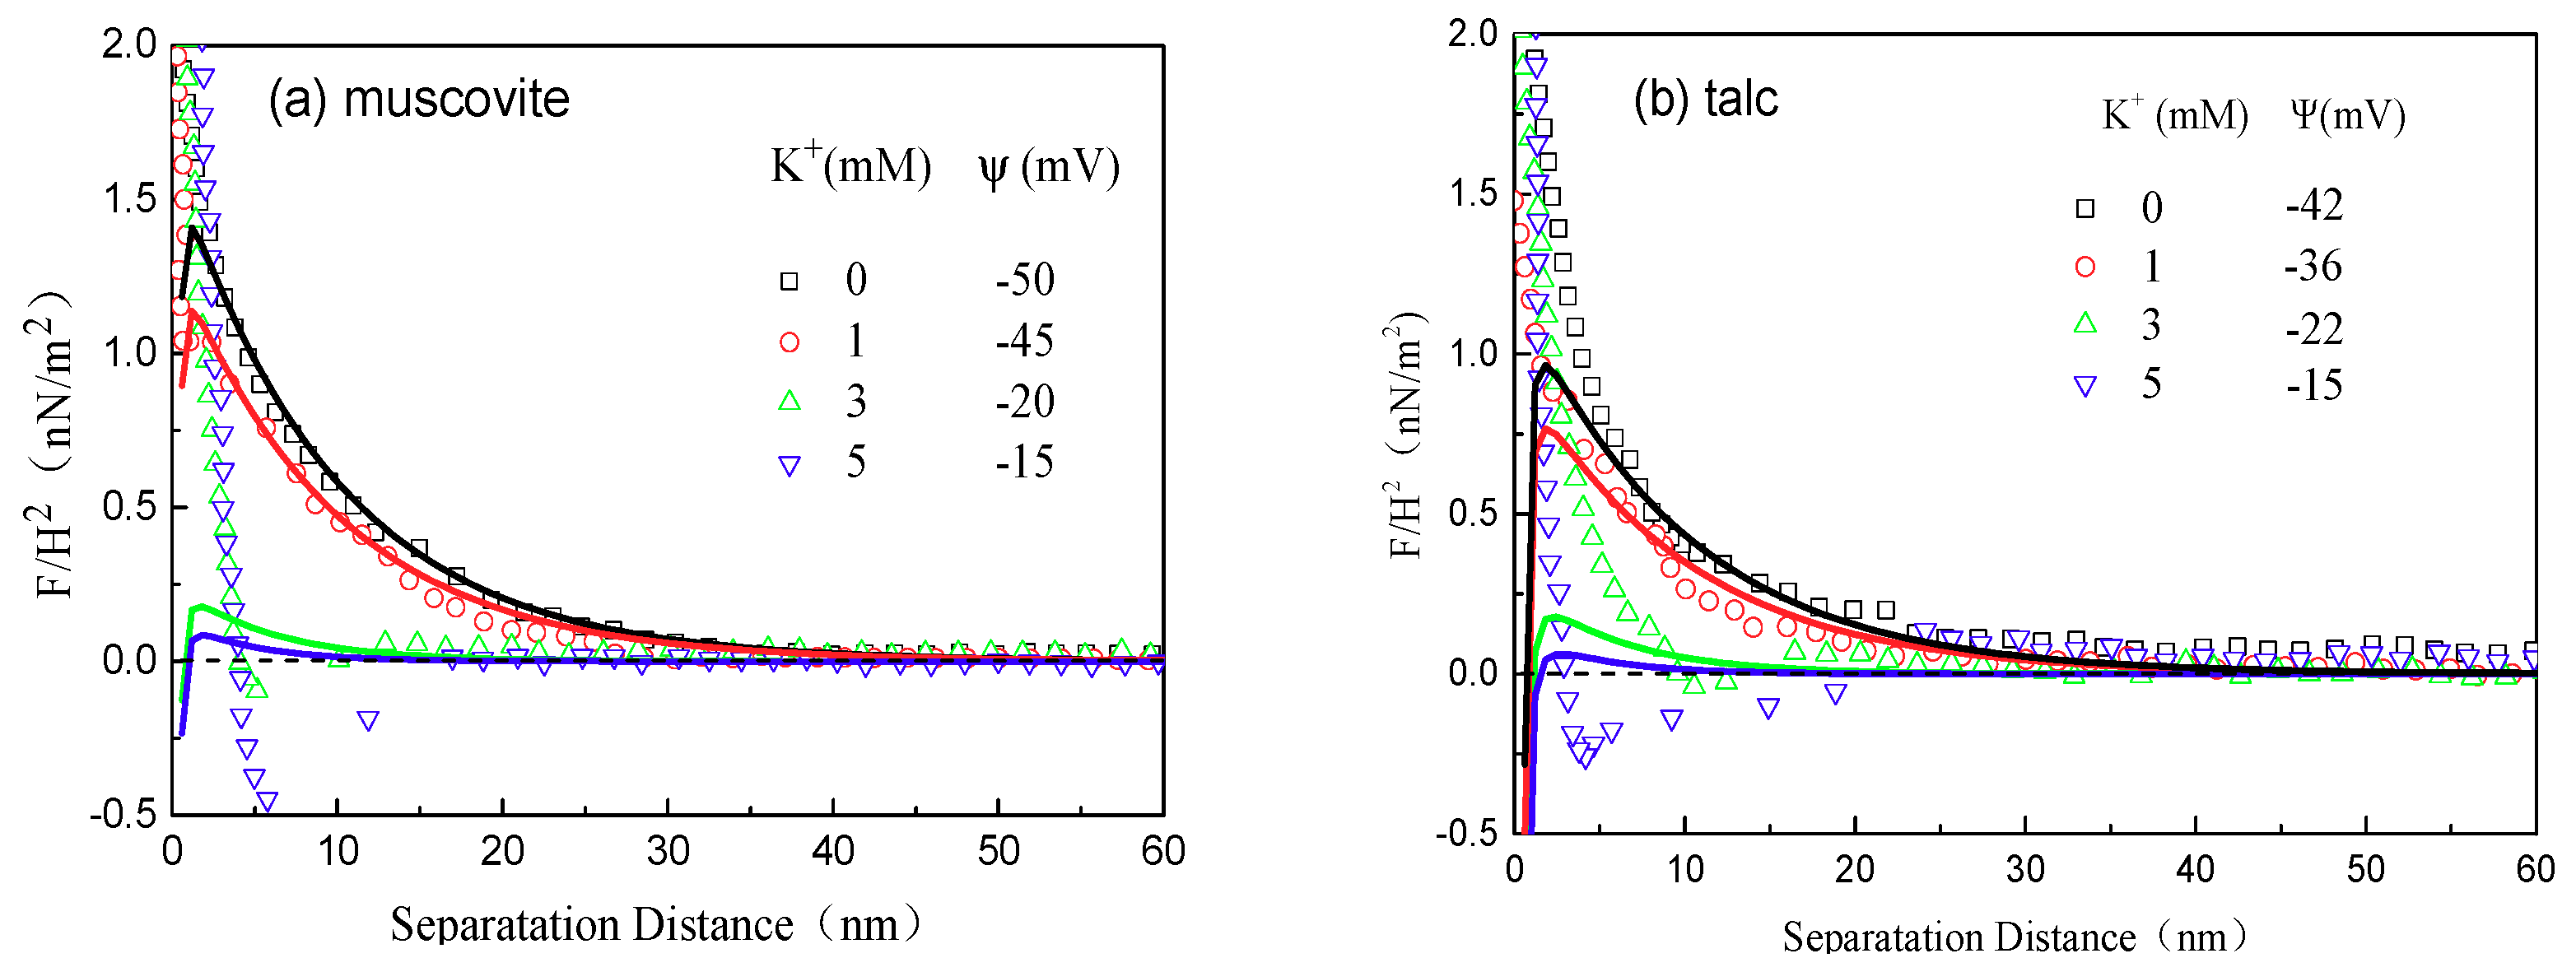
3.3. AFM Force Analysis

In a fine-grained flotation system, the forces between particles can be fitted according to DLVO theory where the total force, Ft, at a distance h between two parallel flat plates is decomposed into two contributions from Van der Waals force, Fvdw, and electrostatic double-layer force, Fedl [13,31]:
F t = F v d w + F e d l
For two parallel basal planes of samples, the Van der Waals force is written as:
F v d w ( h ) = A 6 π h 3
where A is the Hamaker constant, J; h is the distance between the sample substrate and the sample probe, m. For the current system [12,32]:
A m u s c o v i t e = 1 × 10 19 J ,   A w a t e r = 3.7 × 10 20 J ,   A t a l c = 1.93 × 10 19 J
Then, the Hamaker constant for the interaction between samples in water can be calculated as [33,34]:
A 131 = ( A s a m p l e A w a t e r ) 2
Electrostatic double-layer force [35]:
F e d l = 64 N A C k T γ 0 2 e x p ( κ h )
where NA is the Avogadro constant, 6.022 × 10²³ mol−1; C is the molar concentration of solution, mol/L; k is the Boltzmann constant, 1.381 × 10⁻²³ J/K; T is thermodynamic temperature, K; κ is Debye length, m; γ0 is calculated by:
γ 0 = exp ( z e ψ 0 / 2 k T ) 1 e x p ( z e ψ 0 / 2 k T ) + 1
where ψ0 is mineral surface potential, V; z is ionic valence; e is electron charge, 1.062 × 10¹⁹ C.
Figure 9 showed the interaction forces obtained with different concentrations of electrolytes (KCl) between sample probe and sample substrate. Each experimental curve (symbol) was fitted with a DLVO model (corresponding solid lines). As shown in Figure 9a, the monotonic repulsion was observed in ultrapure water for the whole range of studied forces due to negative charge on muscovite surface [13,36]. Differing from the crystal structure of muscovite, the chemical composition of tetrahedral talc is relatively stable and the amount of its isomorphism is less, accounting for only few negative charges on talc surface and weaker electrostatic interaction in water, as shown in Figure 9b. After adding 1 mM·KCl solution, although the repulsion reduced to a bit, it was still relatively large because K+ just neutralized a few negative charges on the samples’ surface. A further increase of the electrolyte concentration made the repulsive forces dramatically and progressively depressed. This is because of more and more K+ neutralizing most negative charges, and the increasing electrolyte concentration compressed the thickness of the electrical double layer on the mineral surface, resulting in greatly reduced electrostatic repulsion. At 3 mM KCl concentration, only weak repulsion was detected, and, at 5 mM, no repulsion was observed at all. There was even attractive force, though very weak, within a short distance, which could be deemed to be the weak hydrophobic attraction between the probe and the substrate when they were very close to each other.
What’s more, the ψ potential values of minerals, which were determined by a Coulter Delsa 440sx Zeta potential analyzer (Beckman Coulter, Inc.), were employed as the approximation of the Stern potential of samples, calibrating the Stern potential of the AFM tip of mineral probe by fitting the experimental interaction force profiles [12]. Potential measurements were conducted at least five times at the same concentration and the average was calculated. From Figure 9a,b, it can be noted that the experimental interaction force profiles fit really well into the classical DLVO theory at all concentrations of electrolytes for separation distances shorter than 5 nm of 0 mM and 1 mM and larger than 10 nm of 3 mM and 5 mM. The serious discrepancy within extremely short distances (less than 3 nm) is probably owing to the non-DLVO forces—the hydration force between the mineral substrate and probe, which is not included in the classical DLVO model [12].
The fitting results shown in Figure 9 are good enough to make the measured interaction forces convinced deeply. As a result, the fitting process isn’t explored in the following study when the electrolyte of the KCl solution is replaced by collectors. Interaction forces measured in different concentrations of DDA collector at a natural pH are shown in Figure 10. As shown, the repulsive force obtained at a lower concentration (1 × 10⁻⁵ mol/L) caused mainly by electrostatic repulsion where the force of muscovite was larger than talc due to its more negative charges. With increasing DDA concentration, the electrostatic repulsive force reduced and the long-range interaction force profiles changed from repulsive, at 5 × 10⁻⁵ mol/L, to attractive with a jump-in distance at around 15 nm of muscovite and 10 nm of talc at 1 × 10⁻⁴ mol/L. After that, for the muscovite, a further increase in DDA concentration changed the suppressed attractive force and it even became repulsive again. But for talc, the maximum attractive force occurred at 5 × 10⁻⁴ mol/L and then it was suppressed.
This situation for muscovite and talc can be explained that, at a lower concentration (1 × 10⁻⁵ mol/L), only a small amount of DDA was adsorbed on the muscovite surface and the hydrophobic attraction was relatively small, still making the electrostatic repulsive force dominant. With increasing concentrations, the adsorbed amount of DDA rose up gradually, consistent with Figure 7 and Figure 8 exactly and the surface of minerals also became more and more hydrophobic, causing the hydrophobic attraction to appear. The maximum of muscovite at 1 × 10⁻⁴ mol/L corresponded to the large-area monolayer adsorption and, after the maximum, the attractive force slowly declined due to the adsorption of the bilayer or multilayer, which made the hydrophobic attractions decrease. Nevertheless, the maximum of talc at 5 × 10⁻⁴ mol/L was because on the talc surface there was a large area of single-molecule adsorption layer, showing the greatest hydrophobic attraction that coincided with the AFM imaging results in Figure 8.

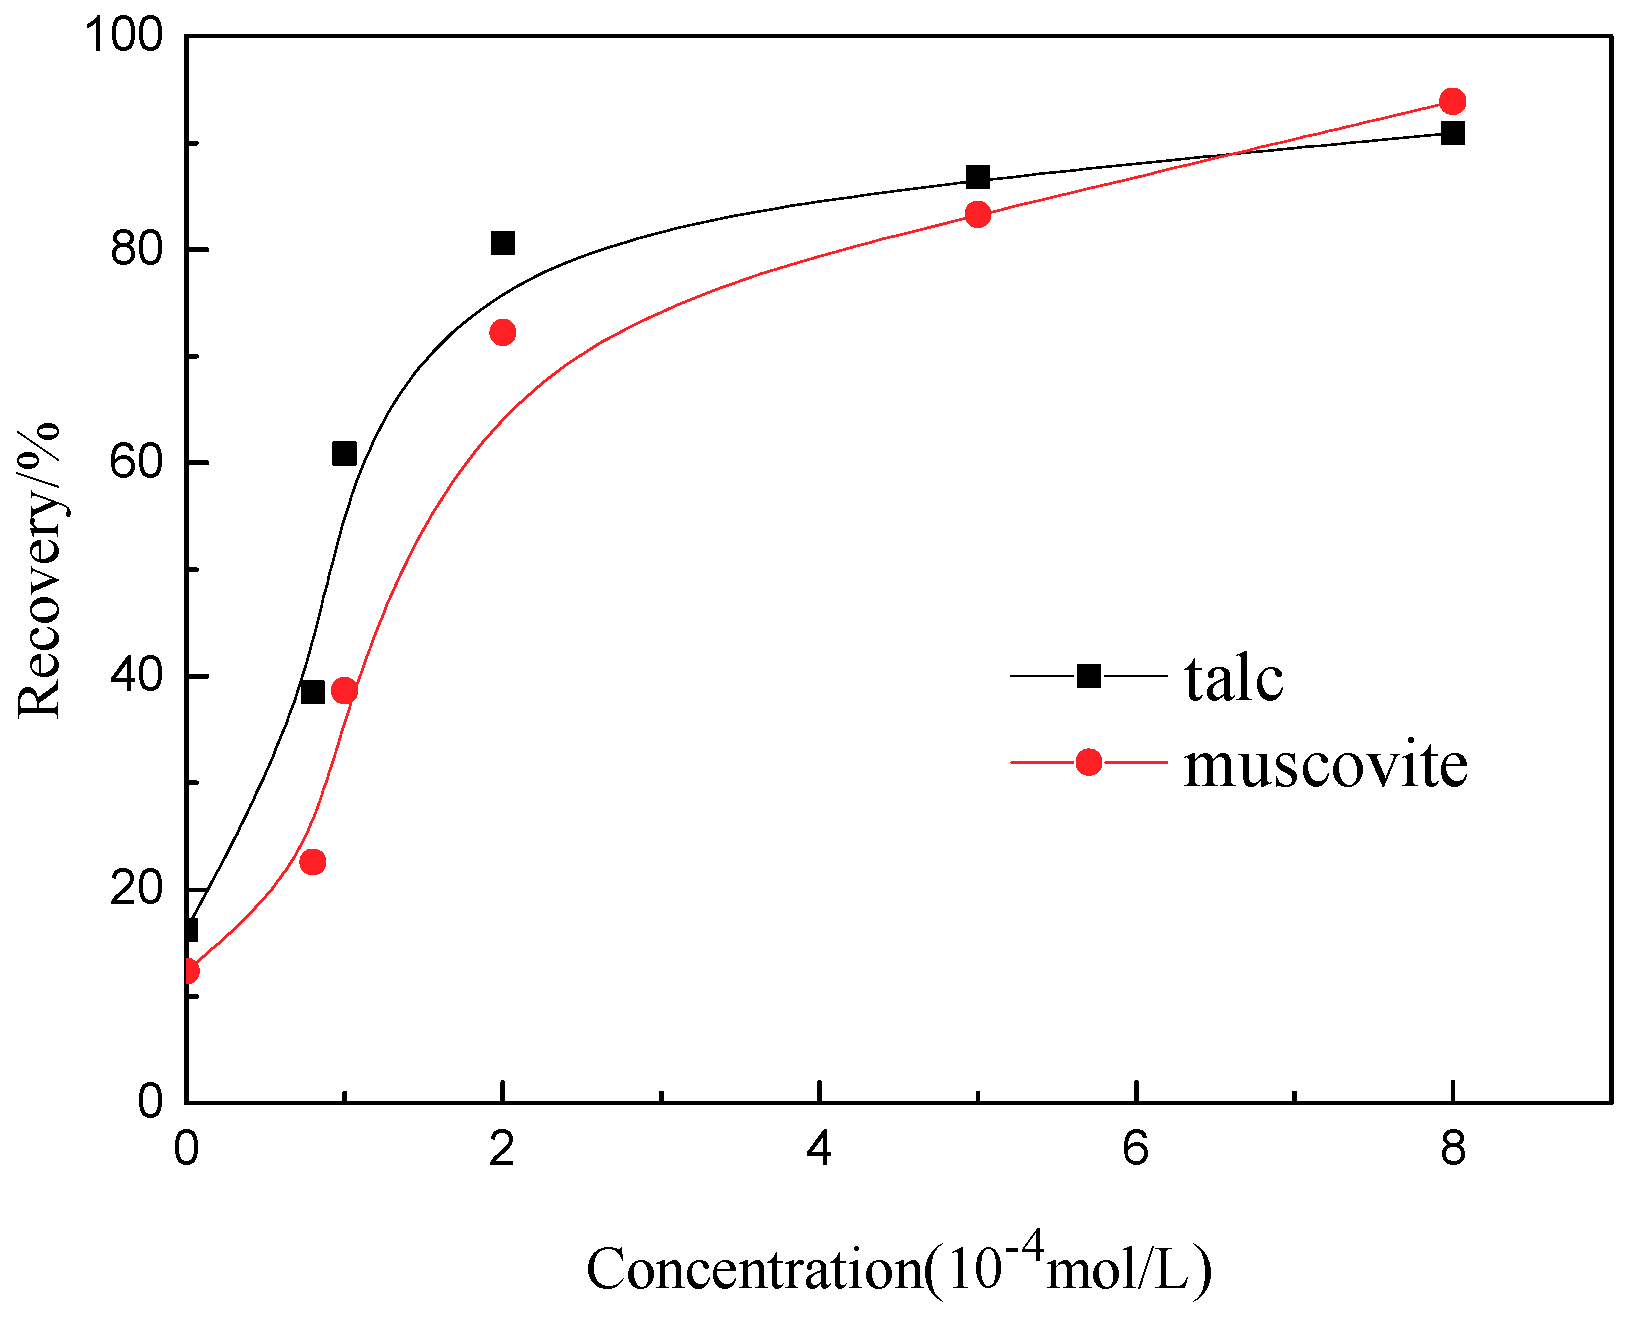
3.4. Flotation Results

The floatability of muscovite and talc in different pH values was studied when the concentration of DDA was fixed at 1 × 10⁻⁴ mol/L. As shown in Figure 11, the recovery of talc followed a similar trend to that of muscovite. Talc recovery remained relatively stable in acid conditions at approximately 83%, and then declined slightly to a minimum at pH = 10 before rising again, while muscovite recovery decreased substantially with the increase of pH and rose at the same value with talc. Overall, talc recovery was 8% higher than that of muscovite. Apart from pH, the effect of DDA concentration on muscovite and talc at pH = 6 ± 0.5 is presented in Figure 12. As for DDA concentration, the variation trends in recovery between muscovite and talc were also similar where recovery increased rapidly, up to 2 × 10⁻⁴ mol/L, and then slowed down after that concentration. Hence, results suggested that 2 × 10⁻⁴ mol/L is the optimum concentration for muscovite and talc flotation. Taking all the experiments together, the higher concentrations of DDA generated more and more adsorbed amount in AFM imaging, making the contact angles increasingly bigger ascribed from the hydrophobic attraction forces between mineral surfaces. As a result, a higher flotation recovery was finally attained.
Overall, a dynamic contact angle was employed to illustrate how wettability changed over time, while AFM imaging was performed to show the adsorbed amount on the mineral surfaces, which had an impact on the wettability of minerals, and then explained the phenomenon of dynamic contact angles at the last 6 min. Besides that, AFM force measurement was carried out to explain the mechanism of this phenomenon from the perspective of interaction force by using classical DLVO theory. Therefore, dynamic wettability can directly and visually show how the hydrophobicity of minerals changes when common water droplets are substituted with a collector solution. Regarding the flotation response, the bigger the final contact angle and the more the adsorbed amount in AFM imaging is, the higher the flotation recovery is, showing that all the mechanism interpretations are consistent with the macroscopic flotation results.

4. Conclusions

In the present study, the new dynamic wettability test and AFM imaging and force analysis were performed to characterize the hydrophobization mechanism of the DDA collector on a muscovite and talc surface. The attachment of bubbles onto the muscovite and talc surface hydrophobizing at different concentrations of DDA was investigated. The AFM imaging and interaction forces were applied to explain the DDA adsorption mechanism on both minerals. To authenticate the effectiveness of these techniques, flotation tests were further carried out. The following major conclusions were drawn from this detailed study:
(1)
After treatments with DDA, the contact angles became much larger compared to initial angles, particularly for muscovite, and the attachment of bubbles on the talc surface was found to be much easier than muscovite due to its natural hydrophobicity.
(2)
From AFM imaging, both the muscovite and talc showed a similar tendency: the higher the DDA concentration, the more the adsorbed amount. However, the adsorbed amount of DDA on talc surface was obviously more than that on muscovite.
(3)
As for the interaction forces between the minerals, the maximum attractions occurred at different concentrations respectively for muscovite and talc and agreed well with the AFM imaging results.
(4)
Results obtained from flotation tests were promising and quite in agreement with the phenomenon of these techniques.

Author Contributions

H.J. conceived of and designed the experiments; Y.G. and W.J. performed the experiments and analyzed the data; H.J. and Y.H. contributed reagents, materials and analysis tools; Y.G. and S.A.K. wrote the paper.

Funding

Authors of this paper proudly acknowledge the financial support from the National Natural Science Foundation of China (Grant Nos. 51674207, 50974134, and 51304162) and the Key Laboratory of Hunan Province for Clean and Efficient Utilization of Strategic Calcium-Containing Mineral Resources (No. 2018TP1002).

Conflicts of Interest

The authors declare no conflicts of interest.

References

  1. Morris, G.E.; Fornasiero, D.; Ralston, J. Polymer depressants at the talc–water interface: Adsorption isotherm, microflotation and electrokinetic studies. Int. J. Miner. Process. 2002, 67, 211–227. [Google Scholar] [CrossRef]
  2. Khraisheh, M.; Holland, C.; Creany, C.; Harris, P.; Parolis, L. Effect of molecular weight and concentration on the adsorption of CMC onto talc at different ionic strengths. Int. J. Miner. Process. 2005, 75, 197–206. [Google Scholar] [CrossRef]
  3. Mierczynska-Vasilev, A.; Beattie, D.A. The effect of impurities and cleavage characteristics on talc hydrophobicity and polymer adsorption. Int. J. Miner. Process. 2013, 118, 34–42. [Google Scholar] [CrossRef]
  4. Xu, L.; Hu, Y.; Dong, F.; Gao, Z.; Wu, H.; Wang, Z. Anisotropic adsorption of oleate on diaspore and kaolinite crystals: Implications for their flotation separation. Appl. Surf. Sci. 2014, 321, 331–338. [Google Scholar] [CrossRef]
  5. Vidal, C.A.G.; Pawlik, M. Molecular weight effects in interactions of guar gum with talc. Int. J. Miner. Process. 2015, 138, 38–43. [Google Scholar] [CrossRef]
  6. Burdukova, E.; Van Leerdam, G.C.; Prins, F.E.; Smeink, R.G.; Bradshaw, D.J.; Laskowski, J.S. Effect of calcium ions on the adsorption of CMC onto the basal planes of New York talc–A ToF-SIMS study. Min. Eng. 2008, 21, 1020–1025. [Google Scholar] [CrossRef]
  7. Mishchuk, N.A. The model of hydrophobic attraction in the framework of classical DLVO forces. Adv. Colloid Interface Sci. 2011, 168, 149–166. [Google Scholar] [CrossRef] [PubMed]
  8. Gupta, V.; Miller, J.D. Surface force measurements at the basal planes of ordered kaolinite particles. J. Colloid Interface Sci. 2010, 344, 362–371. [Google Scholar] [CrossRef] [PubMed]
  9. Tyrrell, J.W.G.; Attard, P. Atomic force microscope images of nanobubbles on a hydrophobic surface and corresponding force−Separation data. Langmuir 2002, 18, 160–167. [Google Scholar] [CrossRef]
  10. Hartley, P.G.; Larson, I.; Scales, P.J. Electrokinetic and direct force measurements between silica and mica surfaces in dilute electrolyte solutions. Langmuir 1997, 13, 2207–2214. [Google Scholar] [CrossRef]
  11. Kumar, N.; Andersson, M.P.; Van den Ende, D.; Mugele, F.; Siretanu, I. Probing the surface charge on the basal planes of kaolinite particles with high resolution atomic force microscopy. Langmuir 2017, 33, 14226–14237. [Google Scholar] [CrossRef] [PubMed]
  12. Yan, L.; Masliyah, J.H.; Xu, Z. Interaction of divalent cations with basal planes and edge surfaces of phyllosilicate minerals: Muscovite and talc. J Colloid Interface Sci. 2013, 404, 183–191. [Google Scholar] [CrossRef] [PubMed]
  13. Jiang, H.; Xie, Z.; Liu, G.-R.; Yu, Y.-W.; Zhang, D. Interaction forces between muscovite and silica surfaces in electrolyte solutions measured with AFM. Trans. Nonferrous Met. Soc. China. 2013, 23, 1783–1788. [Google Scholar] [CrossRef]
  14. Ozcan, O.; Gonul, B.B.; Bulutcu, A.N.; Manav, H. Correlations between the shear strength of mineral filter cakes and particle size and surface tension. Colloids Surf. A Phys. Eng. Asp. 2001, 187, 405–413. [Google Scholar] [CrossRef]
  15. Chang, Q.; Wei, B.; He, Y. Capillary pressure method for measuring lipophilic hydrophilic ratio of filter media. Chem. Eng. J. 2009, 150, 323–327. [Google Scholar]
  16. Stroh, G.; Stahl, W. Effect of surfactants on the filtration properties of fine particles. Filtr. Sep. 1990, 27, 197–199. [Google Scholar] [CrossRef]
  17. Chau, T.T. A review of techniques for measurement of contact angles and their applicability on mineral surfaces. Min. Eng. 2009, 22, 213–219. [Google Scholar] [CrossRef]
  18. Brossard, S.K.; Du, H.; Miller, J.D. Characteristics of dextrin adsorption by elemental sulfur. J. Colloid Interf. Sci. 2008, 317, 18–25. [Google Scholar] [CrossRef] [PubMed]
  19. Du, H.; Miller, J.D. Adsorption states of amphipatic solutes at the surface of naturally hydrophobic minerals: A molecular dynamics simulation study. Langmuir 2007, 23, 11587–11596. [Google Scholar] [CrossRef] [PubMed]
  20. Leung, A.; Wiltshire, J.; Blencowe, A.; Fu, Q.; Solomon, D.H.; Qiao, G.G. The effect of acrylamide—vinylpyrrolidinone copolymer on the depression of talc in mixed nickel mineral flotation. Min. Eng. 2011, 24, 449–454. [Google Scholar] [CrossRef]
  21. Jin, S.; Shi, Q.; Li, Q.; Ou, L.; Ouyang, K. Effect of calcium ionic concentrations on the adsorption of carboxymethyl cellulose onto talc surface: Flotation, adsorption and AFM imaging study. Powder Technol. 2018, 331, 155–161. [Google Scholar] [CrossRef]
  22. Xu, L.; Hu, Y.; Tian, J.; Wu, H.; Wang, L.; Yang, Y.; Wang, Z. Synergistic effect of mixed cationic/anionic collectors on flotation and adsorption of muscovite. Colloids Surf. A Phys. Eng. Asp. 2016, 492, 181–189. [Google Scholar] [CrossRef]
  23. Liu, J.; Xu, Z.; Masliyah, J. Colloidal forces between bitumen surfaces in aqueous solutions measured with atomic force microscope. Colloids Surf. A Phys. Eng. Asp. 2005, 260, 217–228. [Google Scholar] [CrossRef]
  24. Ducker, W.A.; Senden, T.J.; Pashley, R.M. Measurement of forces in liquids using a force microscope. Langmuir 1992, 8, 1831–1836. [Google Scholar] [CrossRef]
  25. Ducker, W.A.; Xu, Z.; Israelachvili, J.N. Measurements of hydrophobic and DLVO forces in bubble-surface interactions in aqueous solutions. Langmuir 1994, 10, 3279–3289. [Google Scholar] [CrossRef]
  26. Rabinovich, Y.I.; Yoon, R.H. Use of atomic force microscope for the measurements of hydrophobic forces. Colloids Surf. A Phys. Eng. Asp. 1994, 93, 263–273. [Google Scholar] [CrossRef]
  27. Cappella, B.; Dietler, G. Force-distance curves by atomic force microscopy. Surf. Sci. Rep. 1999, 34, 1–3. [Google Scholar] [CrossRef]
  28. Douillard, J.M.; Zajac, J.; Malandrini, H.; Clauss, F. Contact angle and film pressure: Study of a talc surface. J. Colloid Interface Sci. 2002, 255, 341–351. [Google Scholar] [CrossRef] [PubMed]
  29. Gao, Z.; Sun, W.; Hu, Y. New insights into the dodecylamine adsorption on scheelite and calcite: An adsorption model. Min. Eng. 2015, 79, 54–61. [Google Scholar] [CrossRef]
  30. Bastidas, J.M.; Polo, J.L.; Cano, E. Substitutional inhibition mechanism of mild steel hydrochloric acid corrosion by hexylamine and dodecylamine. J. Appl. Electrochem. 2000, 30, 1173–1177. [Google Scholar] [CrossRef] [Green Version]
  31. Qu, G.Z.; Hu, Y.H. The theory and application of coarse particle effect in flotation of fine particles. J. Central-South Inst. Min. Metall. 1993, 24, 743–748. [Google Scholar]
  32. Yan, L.; Englert, A.H.; Masliyah, J.H.; Xu, Z. Determination of anisotropic surface characteristics of different phyllosilicates by direct force measurements. Langmuir 2011, 27, 12996–13007. [Google Scholar] [CrossRef] [PubMed]
  33. Van Oss, C.J.; Omenyi, S.N.; Neumann, A.W. Negative Hamaker coefficients. Colloid Polym. Sci. 1979, 257, 737–744. [Google Scholar] [CrossRef]
  34. Van Oss, C.J.; Absolom, D.R.; Neumann, A.W. The “hydrophobic effect”: Essentially a van der Waals interaction. Colloid Polym. Sci. 1980, 258, 424–427. [Google Scholar] [CrossRef]
  35. Rajagopalan, R.; Hiemenz, P.C. Principles of Colloid and Surface Chemistry; Marcel Dekker: Newwork, NY, USA, 1986. [Google Scholar]
  36. Jiang, H.; Ji, W.; Yang, Q.; Xu, L.; Zhao, C.; Hu, Y. Synergistic adsorption and flotation of new mixed cationic/nonionic collectors on muscovite. Minerals 2017, 7, 74. [Google Scholar] [CrossRef]
Figure 1. X-ray diffraction (XRD) patterns of (a) muscovite and (b) talc.
Minerals 08 00391 g001
Figure 2. Micrograph of prepared (a) muscovite and (b) talc probes.
Minerals 08 00391 g002
Figure 3. Dynamic contact angles of muscovite surface in a dodecylamine (DDA) solution with different concentrations at natural pH = 6 ± 0.5. (a) 1.0 × 10⁻⁵ mol/L; (b) 5.0 × 10⁵ mol/L; (c) 1.0 × 10⁻⁴ mol/L; (d) 5.0 × 10⁻⁴ mol/L; (e) 1.0 × 10⁻³ mol/L.
Minerals 08 00391 g003
Figure 4. Dynamic contact angles of talc surface in DDA solution with different concentrations at pH = 6 ± 0.5. (a) 1.0 × 10⁻⁵ mol/L; (b) 5.0 × 10⁻⁵ mol/L; (c) 1.0 × 10⁻⁴ mol/L; (d) 5.0 × 10⁻⁴ mol/L; (e) 1.0 × 10⁻³ mol/L.
Minerals 08 00391 g004
Figure 5. The process of bubble adhesion on different surfaces in water at pH = 6 ± 0.5. (a) Natural muscovite; (b) natural talc; (c) collector-treated muscovite; (d) collector-treated talc.
Minerals 08 00391 g005
Figure 6. Atomic force microscopy (AFM) images of (a) bare muscovite and (b) talc sheets.
Minerals 08 00391 g006
Figure 7. AFM images (1.5 μm × 1.5 μm) and height profiles of adsorption morphology with different DDA concentrations on muscovite surface at pH = 6 ± 0.5. (a) 1 × 10⁻⁵ mol/L; (b) 5 × 10⁻⁵ mol/L; (c) 1 × 10⁻⁴ mol/L; (d) 5 × 10⁻⁴ mol/L; (e) 1 × 10⁻³ mol/L.
Minerals 08 00391 g007aMinerals 08 00391 g007b
Figure 8. AFM images (1.5 μm × 1.5 μm) and height profiles of adsorption morphology with different DDA concentrations on talc surface at pH = 6 ± 0.5. (a) 1 × 10⁻⁵ mol/L; (b) 5 × 10⁻⁵ mol/L; (c) 1 × 10⁻⁴ mol/L; (d) 5 × 10⁻⁴ mol/L; (e) 1 × 10⁻³ mol/L.
Minerals 08 00391 g008aMinerals 08 00391 g008b
Figure 9. Interaction forces of (a) muscovite and (b) talc measured in different concentrations of KCl solution at a natural pH.
Minerals 08 00391 g009
Figure 10. Interaction forces of (a) muscovite and (b) talc measured in different concentrations of DDA collector at pH = 6 ± 0.5.
Minerals 08 00391 g010
Figure 11. Flotation recovery of muscovite and talc as a function of pH at DDA concentration of 1 × 10⁻⁴ mol/L.
Minerals 08 00391 g011
Figure 12. Flotation recovery of muscovite and talc as a function of DDA concentrations at pH = 6 ± 0.5.
Minerals 08 00391 g012
Table 1. Chemical composition of mineral samples (mass fraction, %).
SampleAl2O3SiO2Fe2O3TiO2CaOMgOK2ONa2OH2OLOI 1
Muscovite37.4644.552.300.740.190.976.532.242.332.69
Talc0.8460.610.71--29.07--6.652.12
1 Loss on ignition; - Not detected.

