Fundamental Studies of SHMP in Reducing Negative Effects of Divalent Ions on Molybdenite Flotation


Abstract
:1. Introduction
2. Materials and Methods
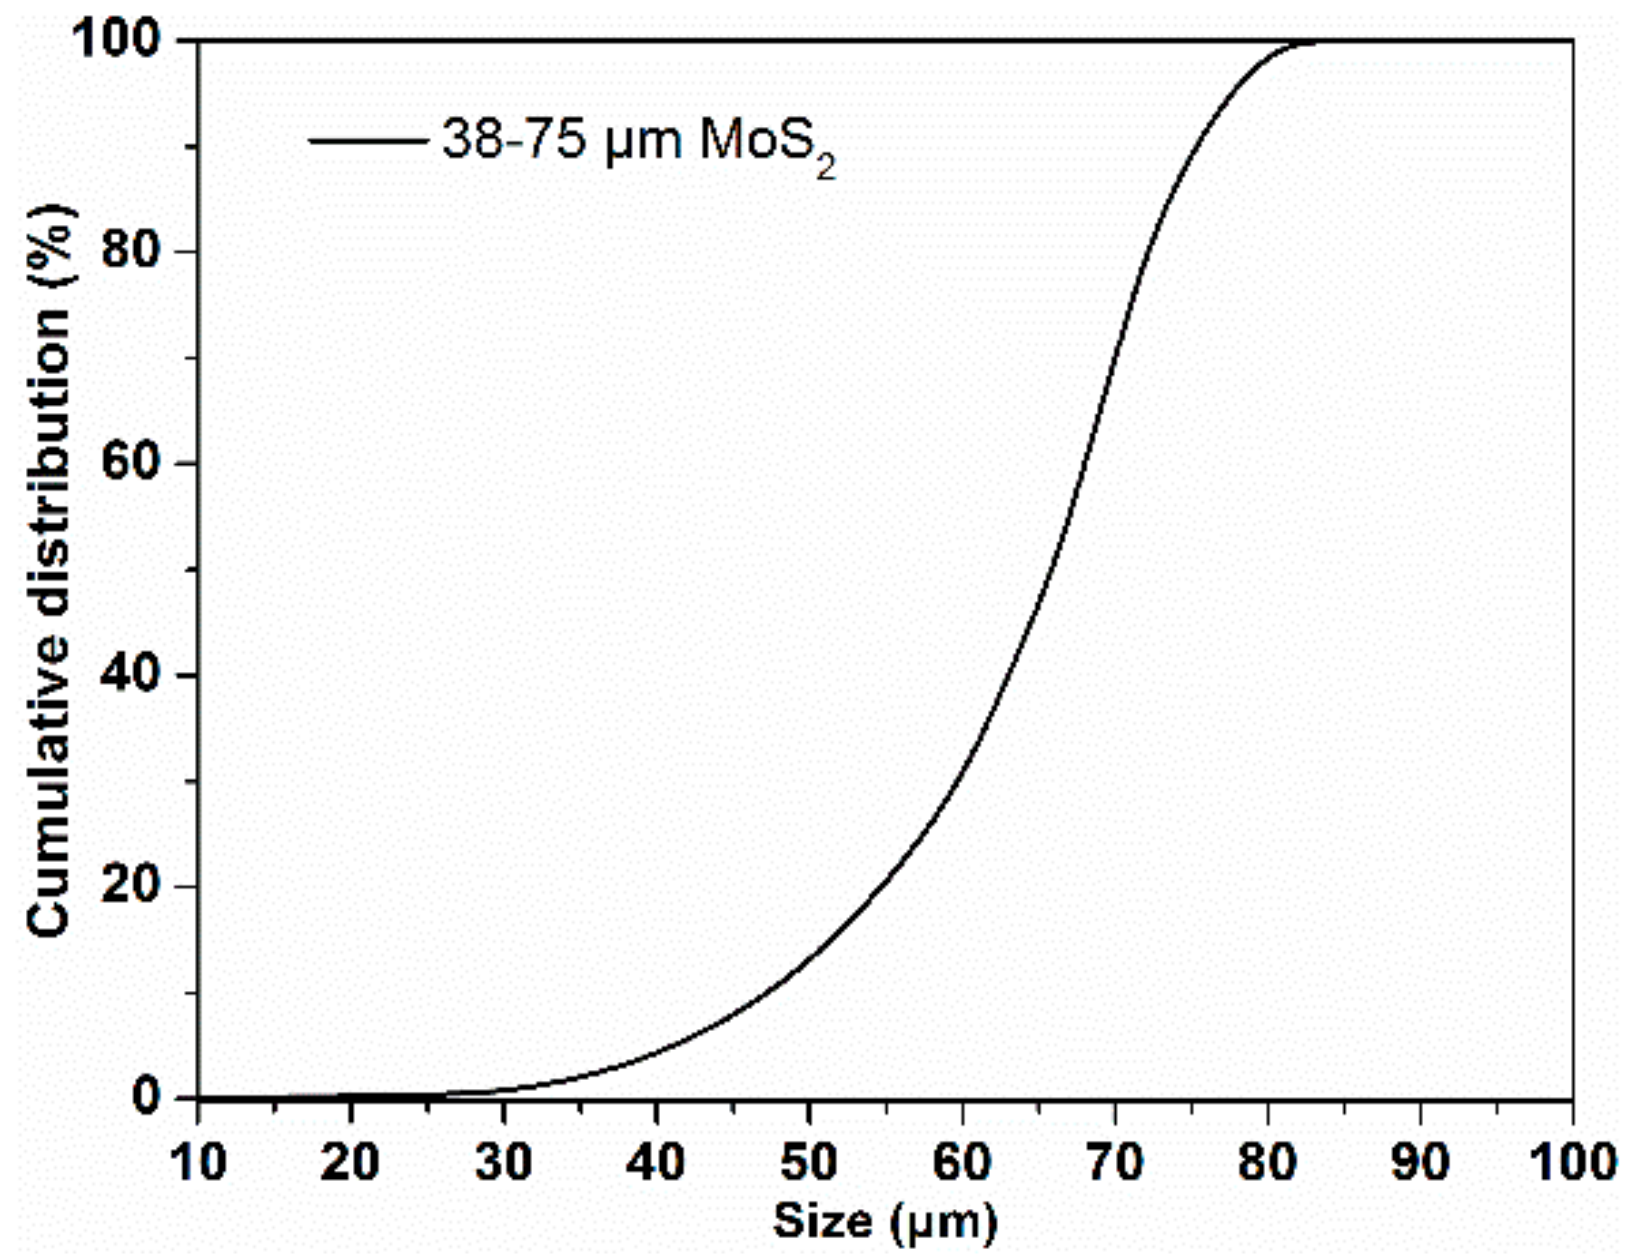
2.1. Minerals and Reagents
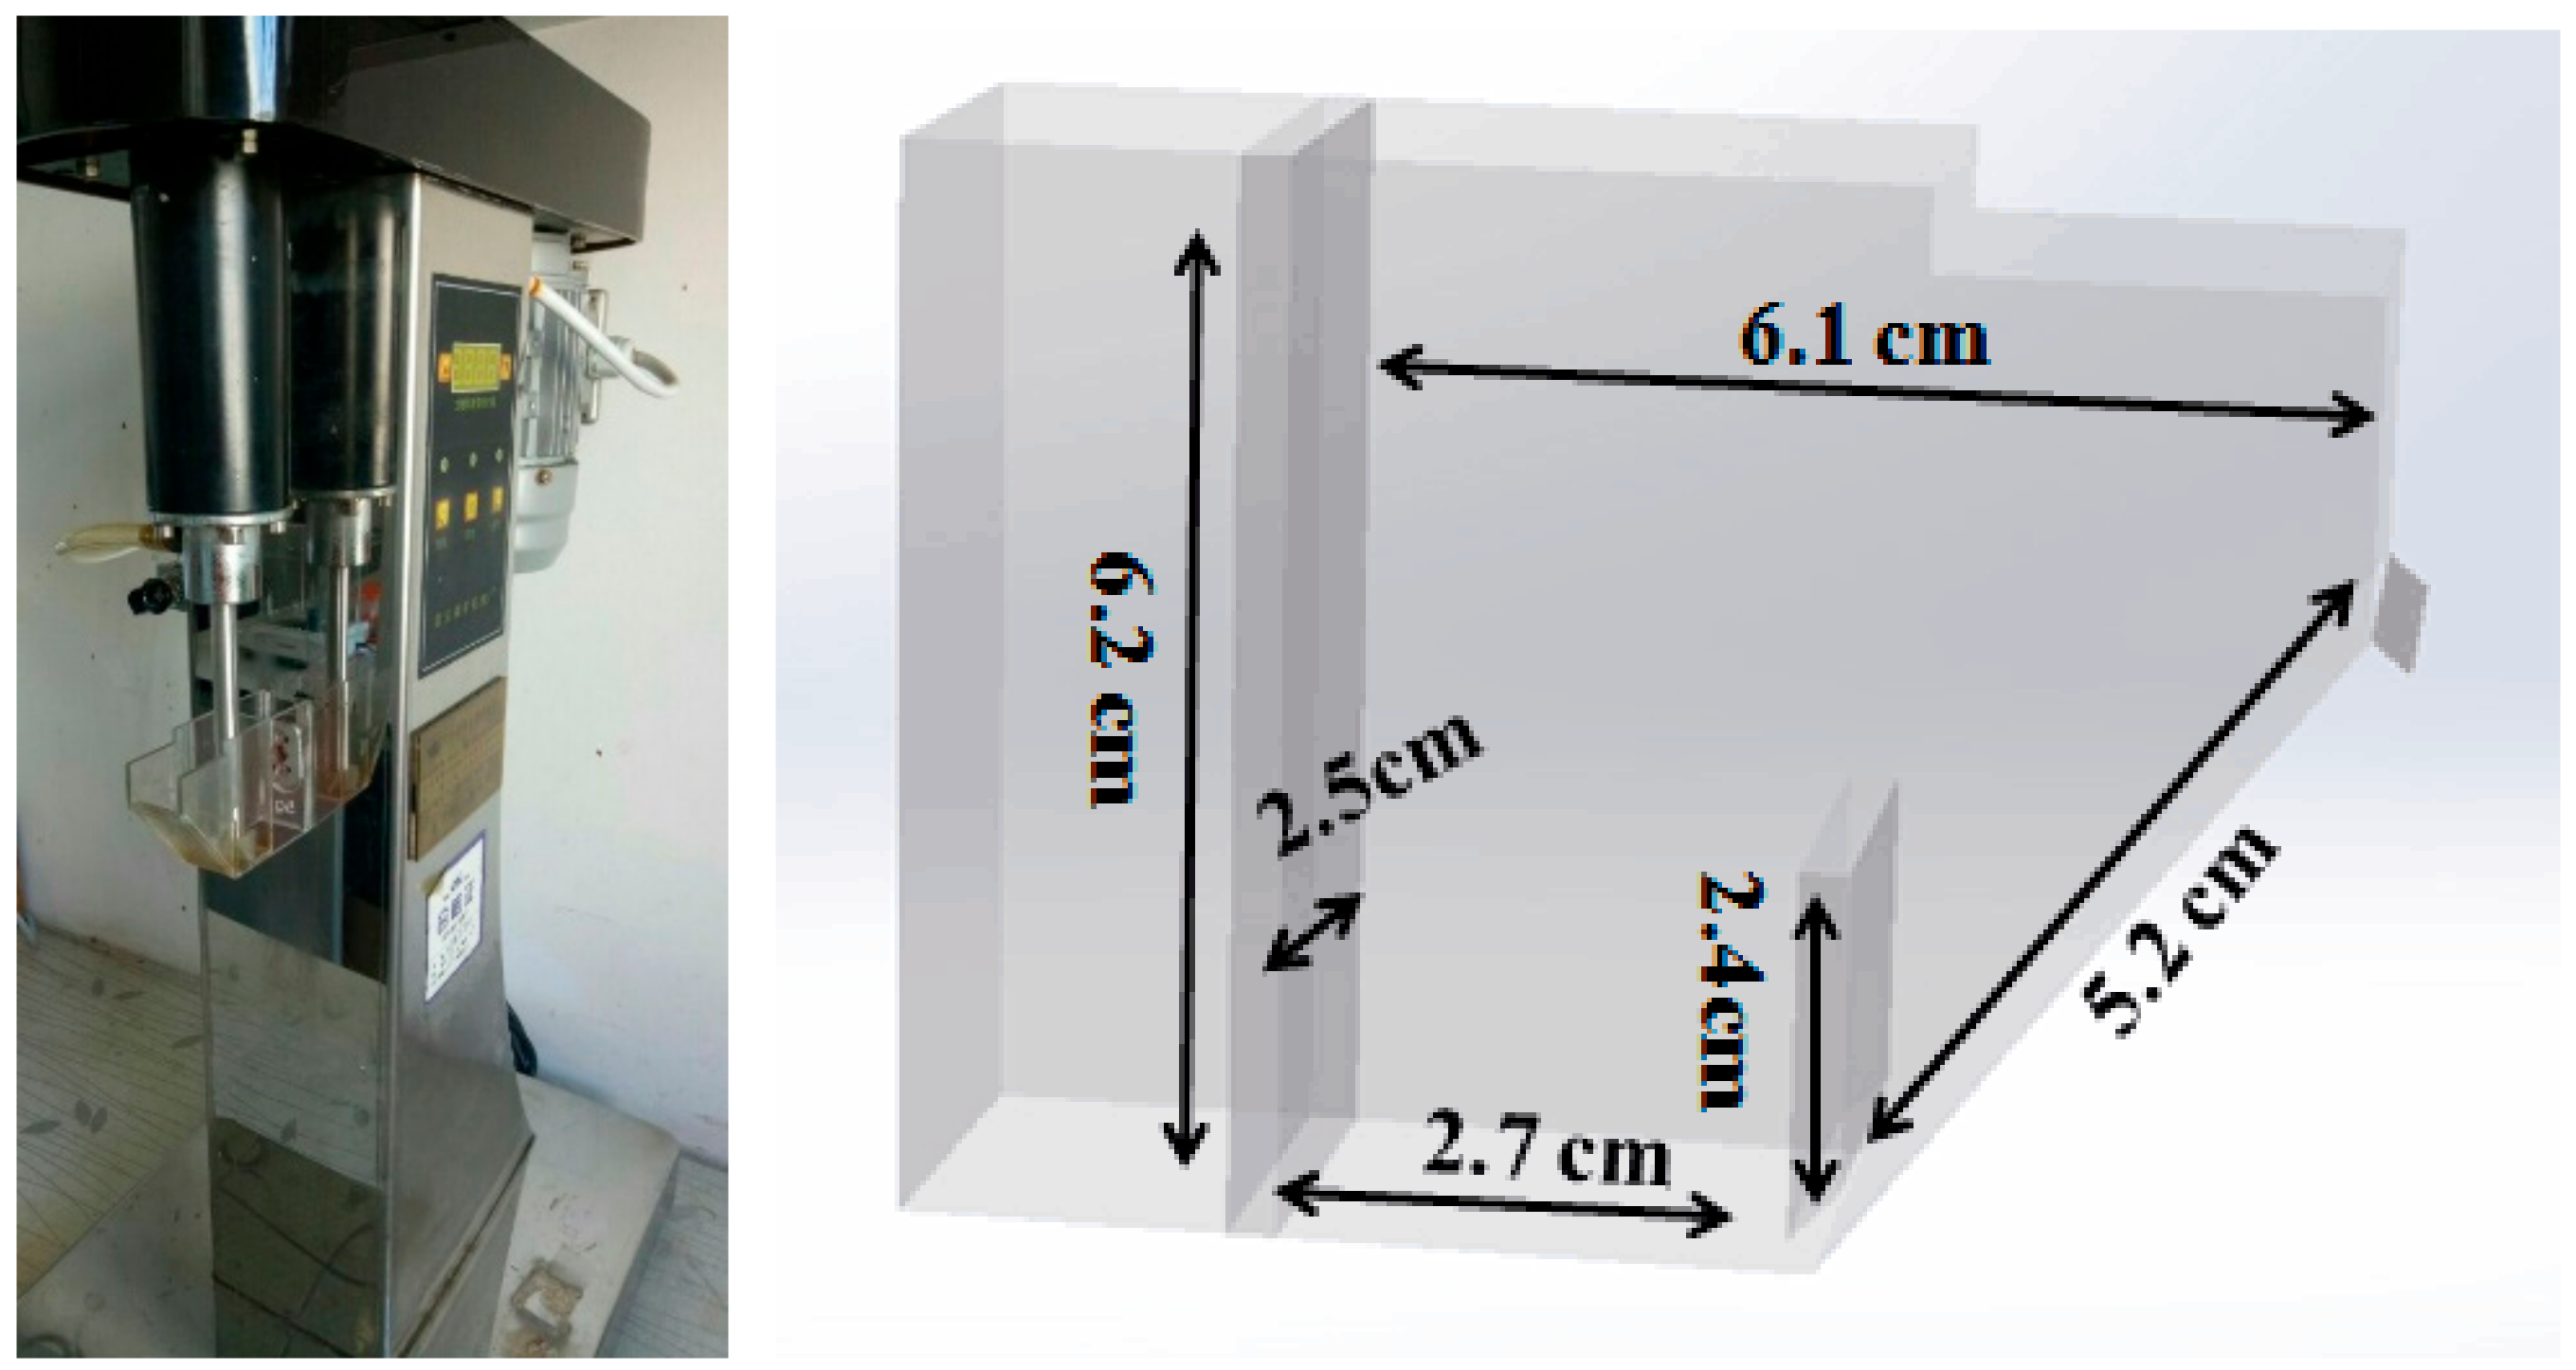
2.2. Flotation
2.3. Contact Angle Measurements
2.4. Zeta Potential Measurements
2.5. XPS Measurements
2.6. AFM Measurements
2.7. Theory Calculation
3. Results
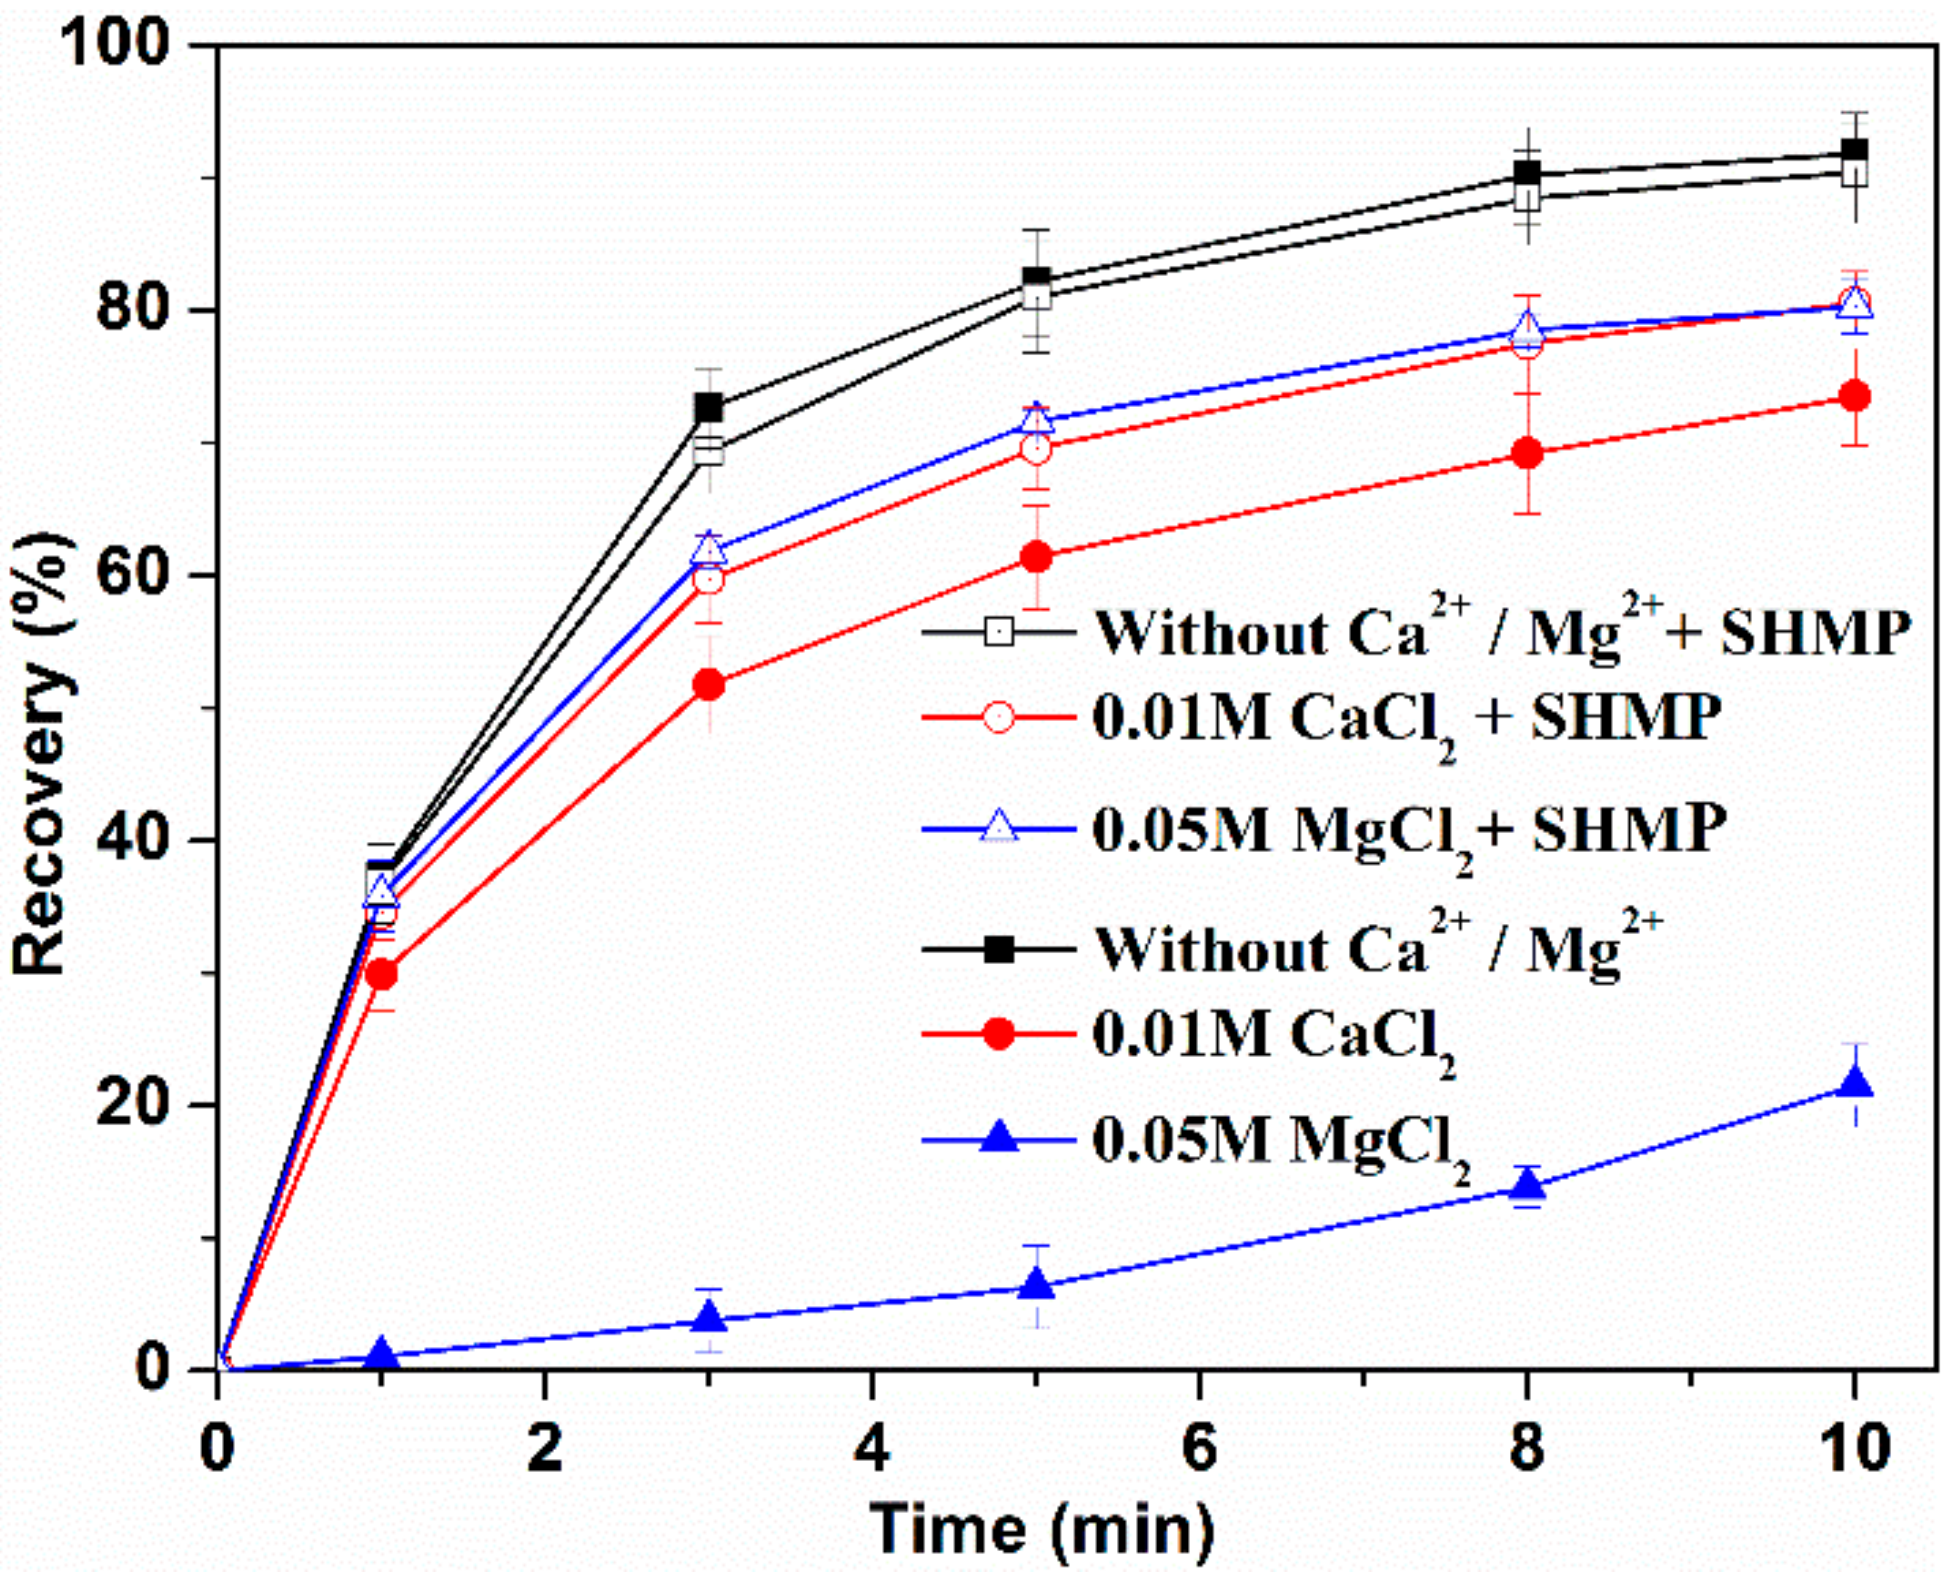
3.1. Flotation Results
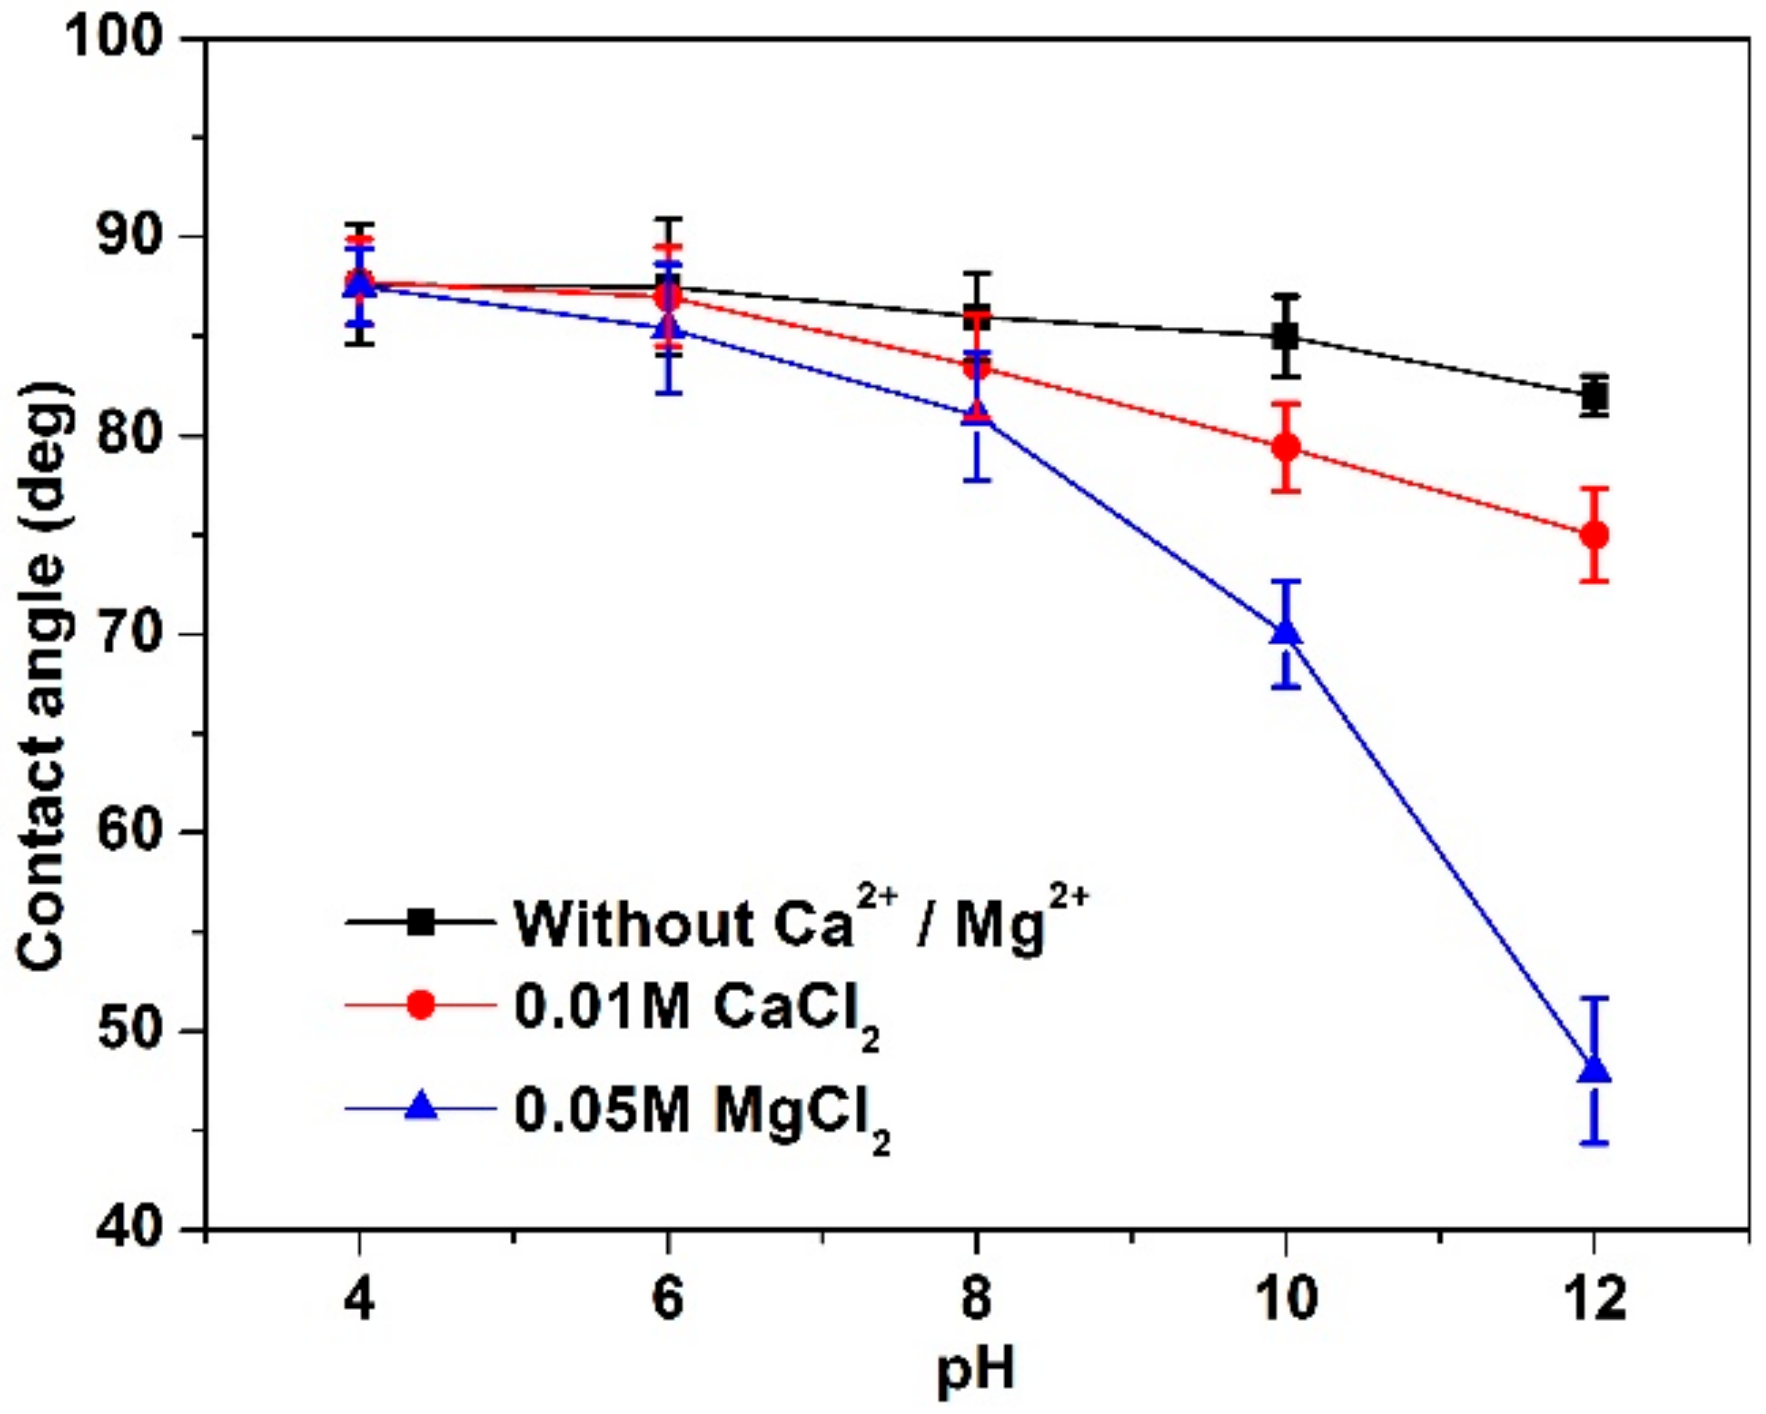
3.2. Contact Angle Analyses
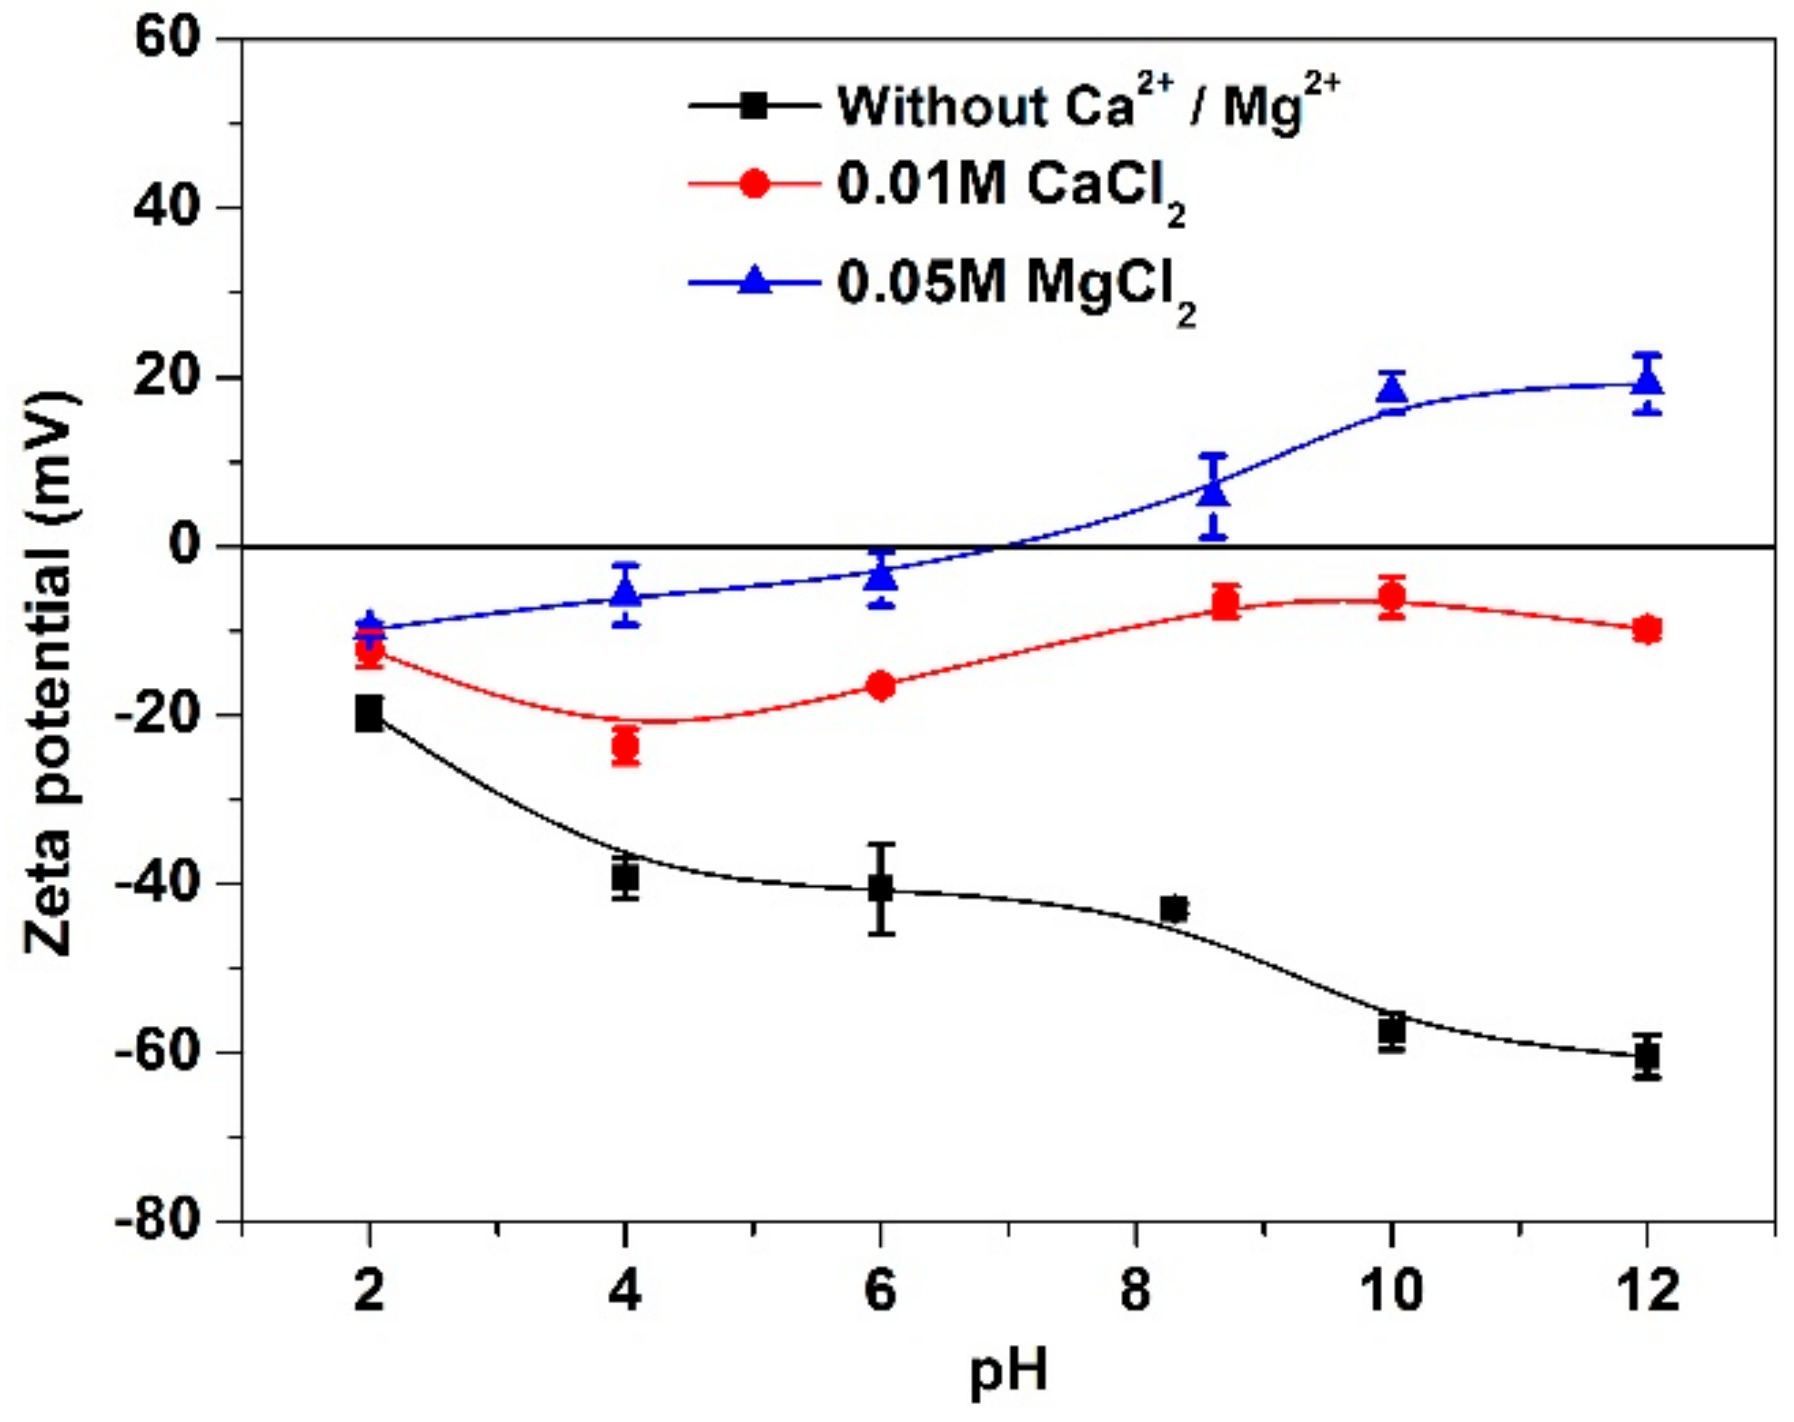
3.3. Zeta Potential Analyses
4. Discussion
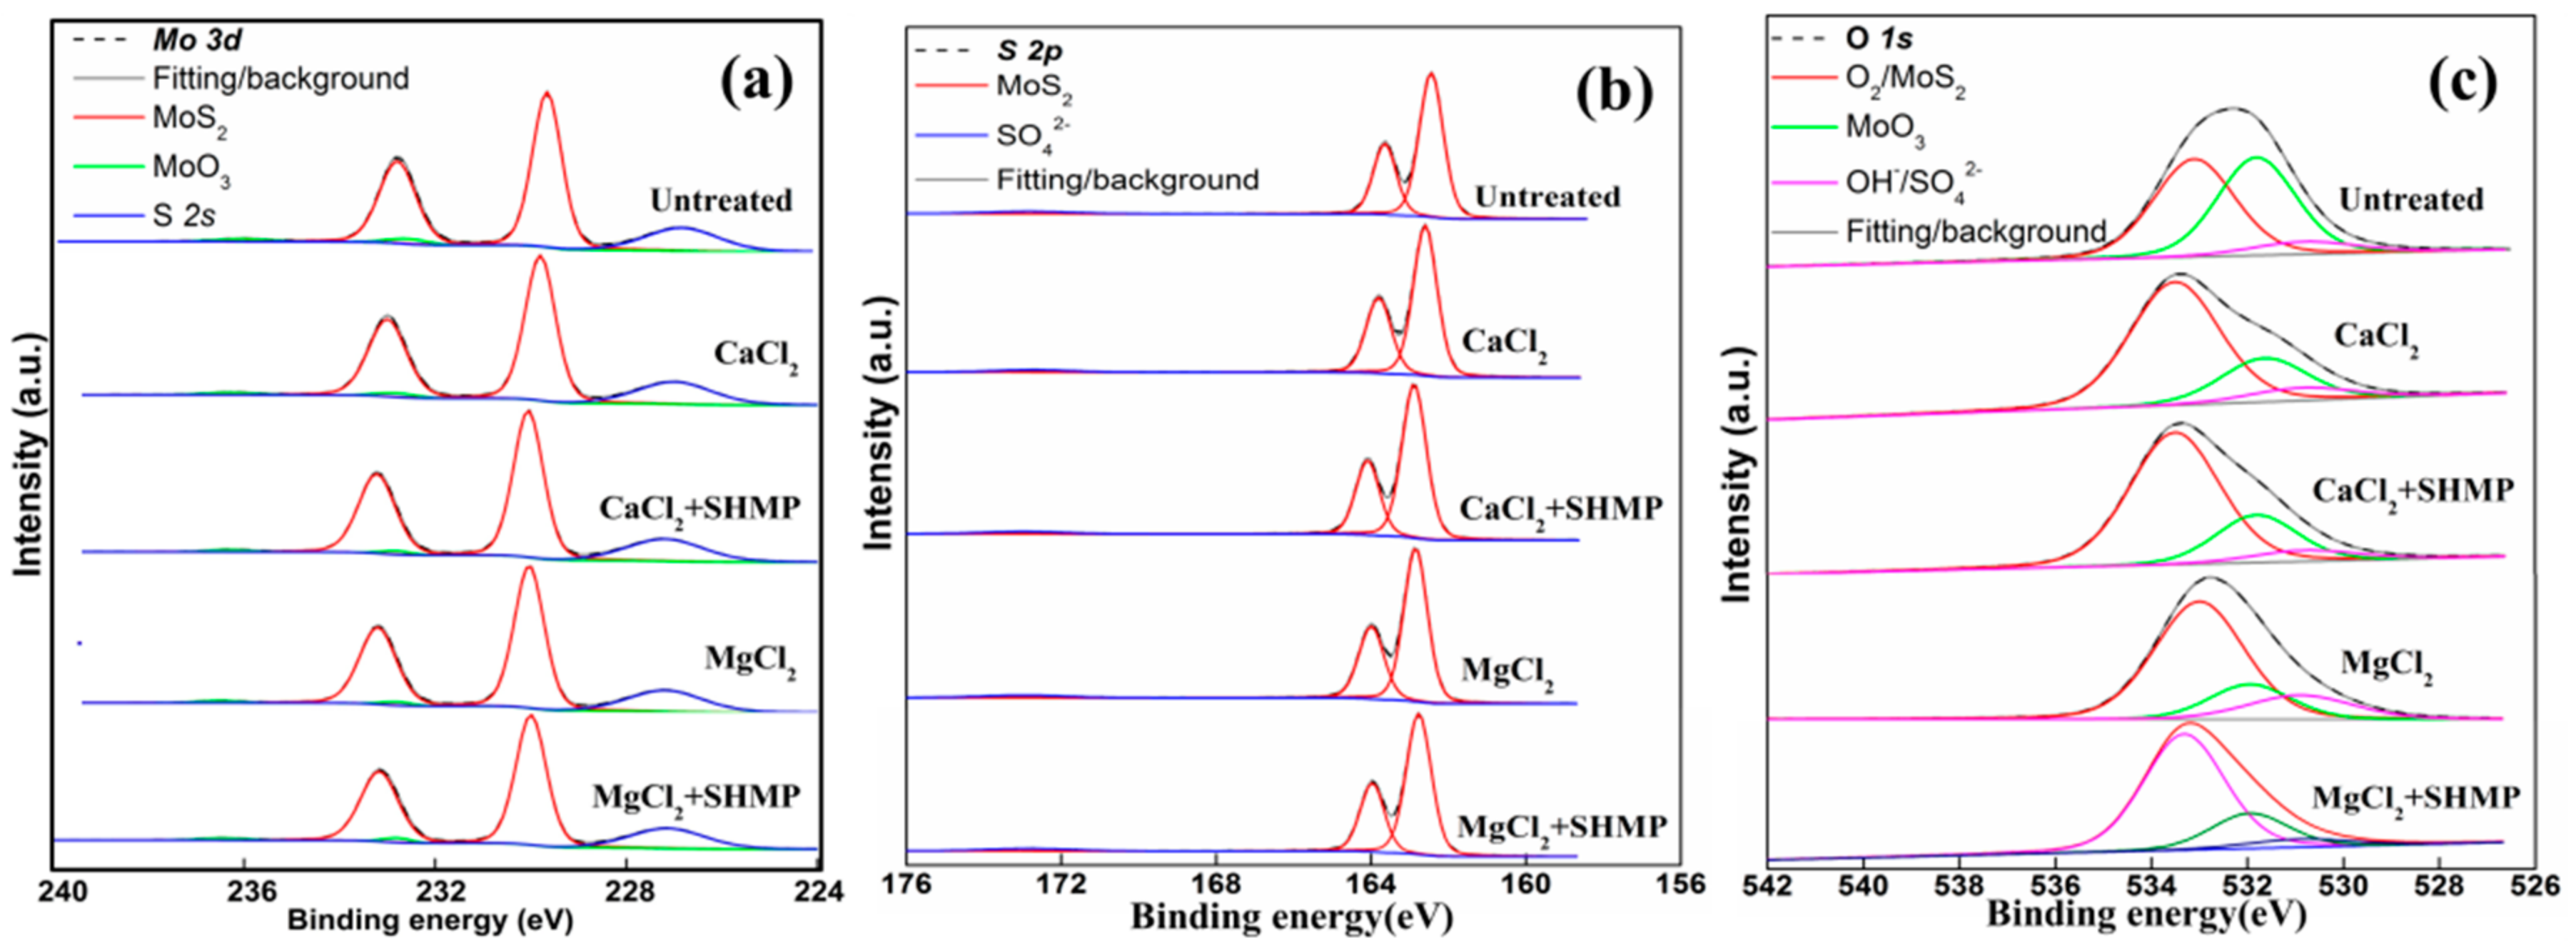
4.1. XPS Analyses
4.1.1. Survey Spectra
4.1.2. Mo 3d, S 2p and O 1s XPS Spectra
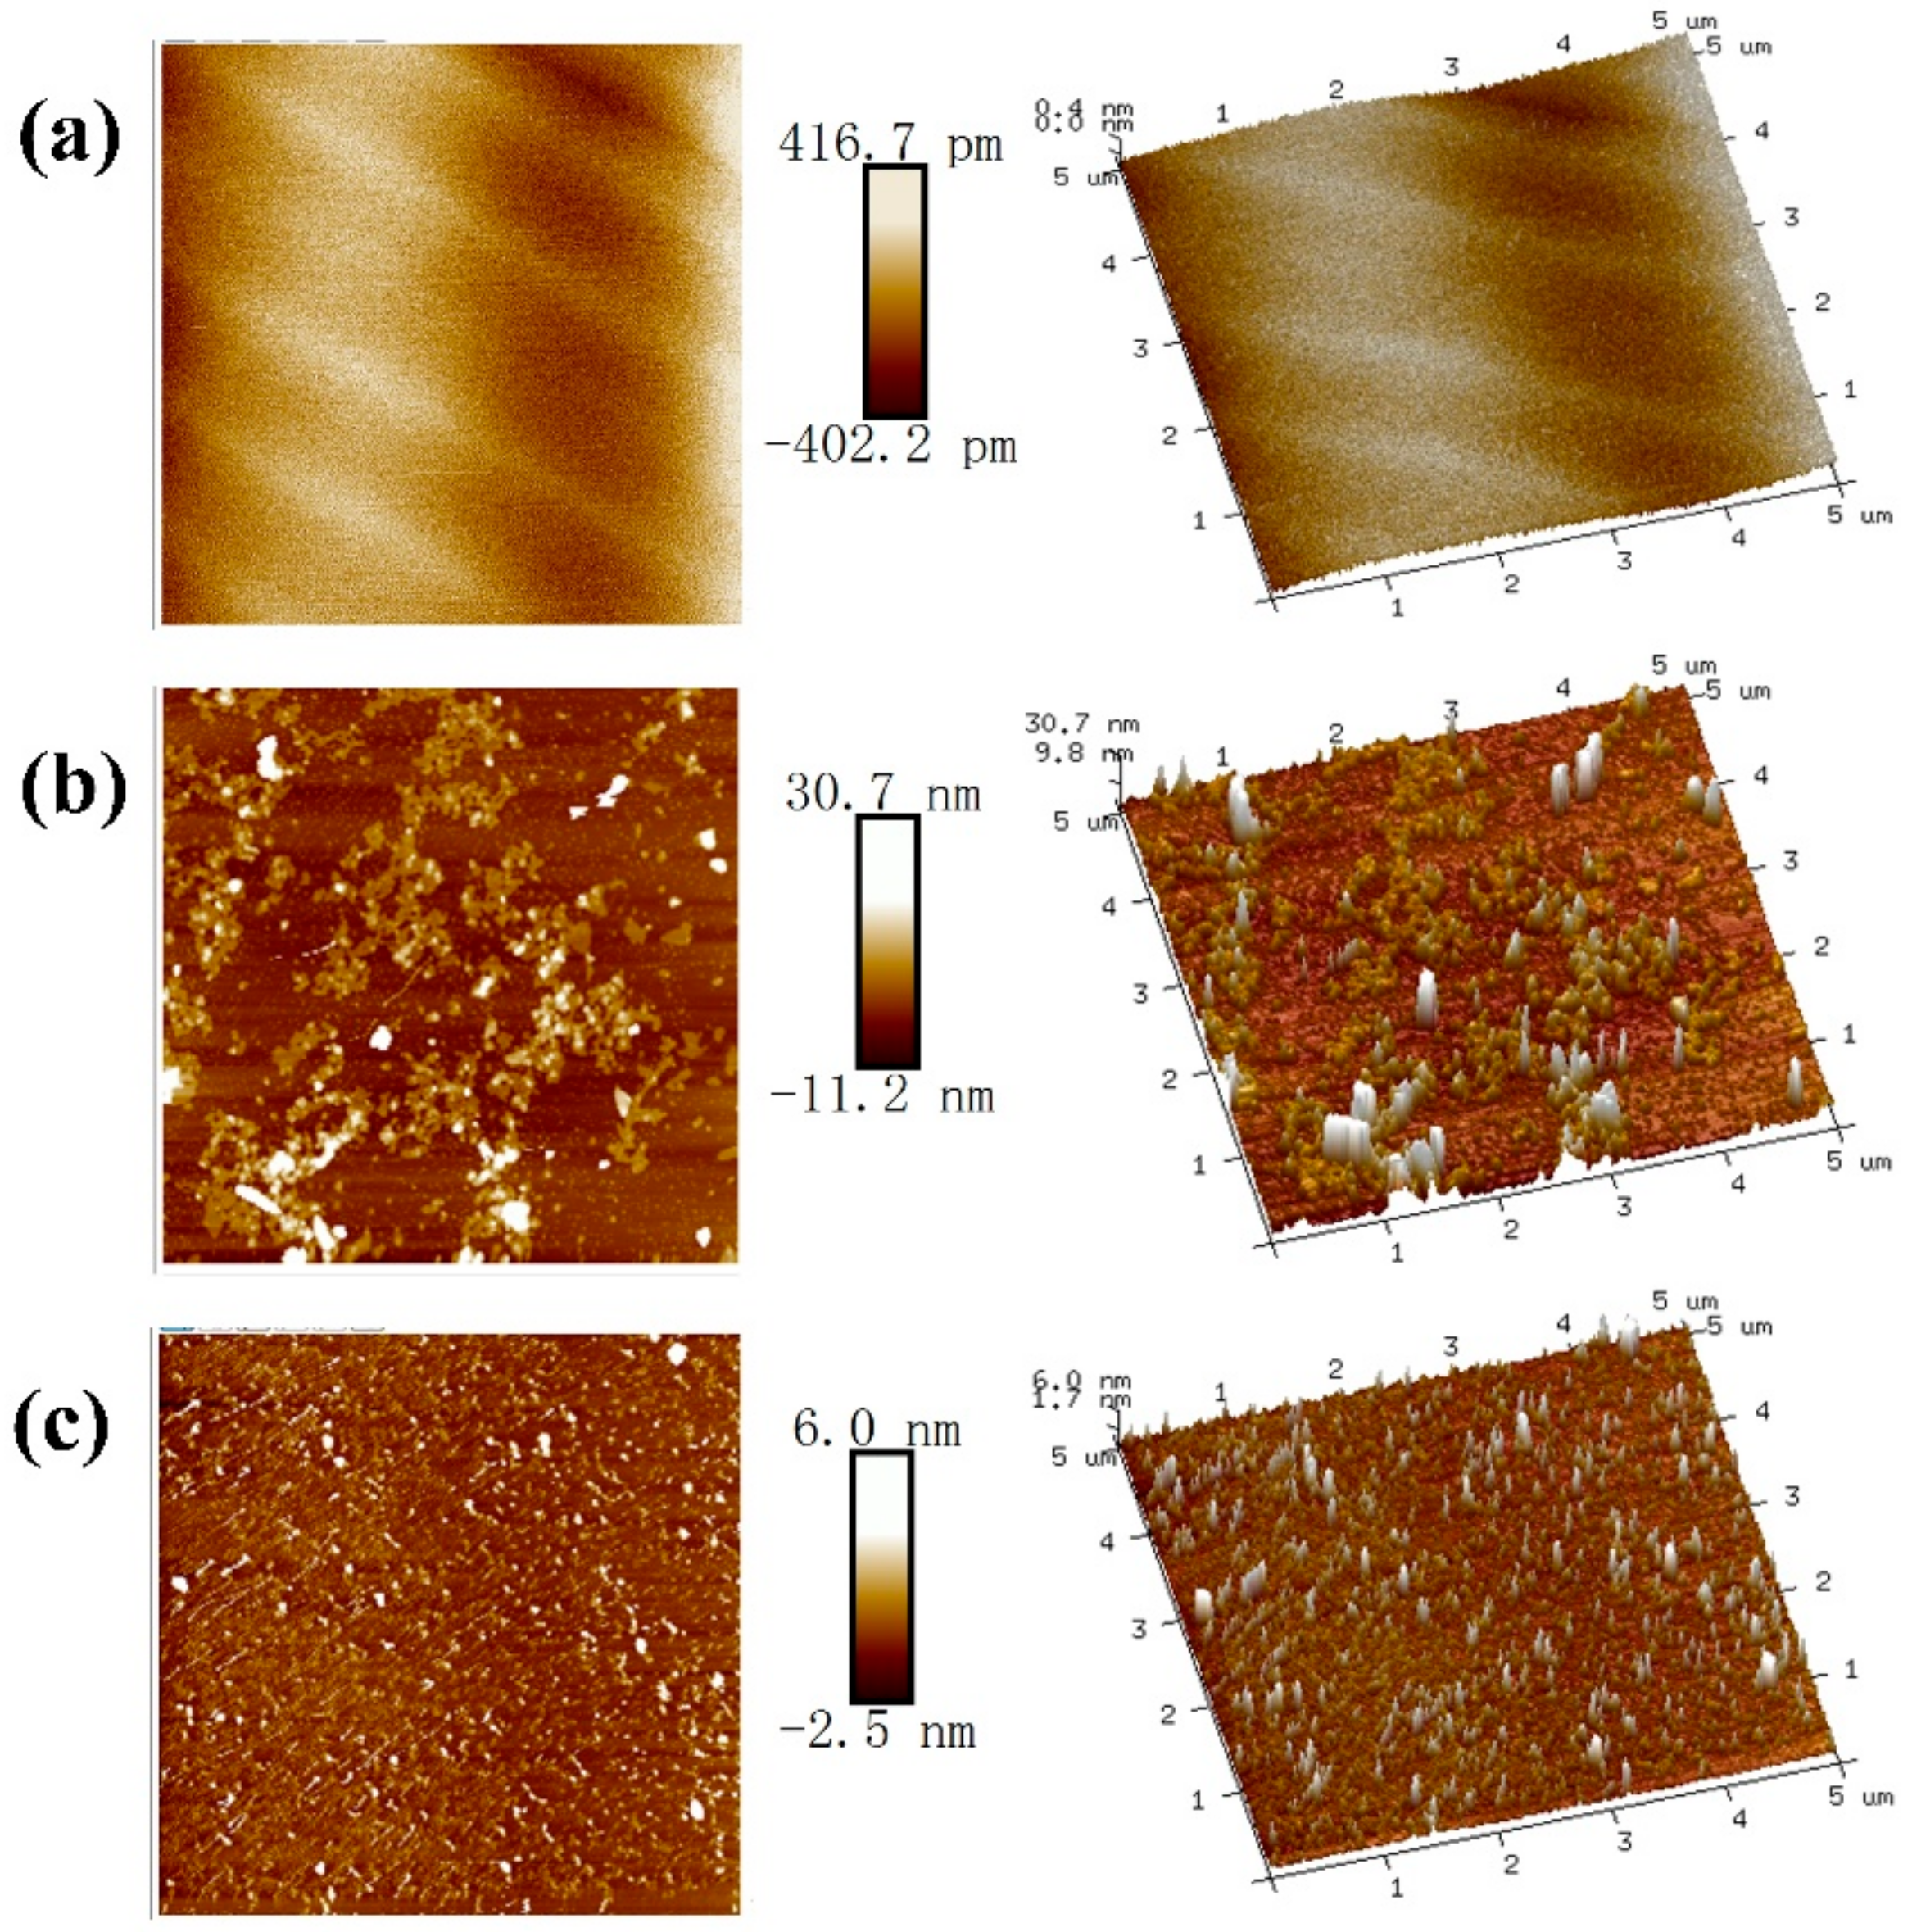
4.2. TMAFM Imaging
4.3. Mechanisms
5. Conclusions
Author Contributions
Funding
Acknowledgments
Conflicts of Interest
References
- Tabares, J.O.; Ortega, I.M.; Bahena, J.L.R.; López, A.A.S.; Pérez, D.V.; Valdivieso, A.L. Surface properties and flotability of molybdenite. In Proceedings of the 2006 China-Mexico Workshop on Minerals Particle Technology, San Luis Potosí, Mexico, 4–6 December 2006. [Google Scholar]
- Hirajima, T.; Mori, M.; Ichikawa, O.; Sasaki, K.; Miki, H.; Farahat, M.; Sawada, M. Selective flotation of chalcopyrite and molybdenite with plasma pre-treatment. Miner. Eng. 2014, 66–68, 102–111. [Google Scholar] [CrossRef]
- Castro, S.; Lopez-Valdivieso, A.; Laskowski, J.S. Review of the flotation of molybdenite. Part І: Surface properties and floatability. Int. J. Miner. Process. 2016, 148, 48–58. [Google Scholar] [CrossRef]
- Lince, J.R.; Frantz, P. Anisotropic oxidation of MoS2 crystallites studied by angle-resolved X-ray photoelectron spectroscopy. Tribol. Lett. 2000, 9, 3–4. [Google Scholar]
- Zanin, M.; Ametov, I.; Grano, S.; Zhou, L.; Skinner, W. A study of mechanisms affecting molybdenite recovery in a bulk copper/molybdenum flotation circuit. Int. J. Miner. Process. 2009, 93, 256–266. [Google Scholar] [CrossRef]
- López-Valdivieso, A.; Madrid Ortega, I.; Reyes Bahena, J.L.; Sanchez Lopez, A.A.; Song, S. Properties of the molybdenite/aqueous solution interface and their relationship with the mineral natural floatability. In Proceedings of the XVI International Congress in Extractive Metallurgy, Saltillo, México, 24–28 April 2006; pp. 299–310. (In Spanish). [Google Scholar]
- Yang, B.; Song, S.; Lopez-Valdivieso, A. Effect of particle size on the contact angle of molybdenite powders. Miner. Process. Extr. Metall. Rev. 2014, 35, 208–215. [Google Scholar] [CrossRef]
- Bulatovic, S.M. Handbook of Flotation Reagents: Chemistry, Theory and Practice Flotation of Sulfide Ores; Elsevier Socience: Burlington, VT, USA, 2007; p. 685. [Google Scholar]
- Liu, G.Y.; Lu, Y.P.; Zhong, H.; Cao, Z.F.; Xu, Z.H. A novel approach for preferential flotation recovery of molybdenite from a porphyry copper-molybdenum ore. Miner. Eng. 2012, 36–38, 37–44. [Google Scholar] [CrossRef]
- Lucay, F.; Cisternas, L.A.; Gálvez, E.D.; López-Valdivieso, A. Study of the natural floatability of molybdenite fines in saline solutions and effect of gypsum precipitation. Miner. Metall. Process. 2015, 32, 203–208. [Google Scholar]
- Wang, B.; Peng, Y. The effect of saline water on mineral flotation—A critical review. Miner. Eng. 2014, 66–68, 13–24. [Google Scholar] [CrossRef]
- Liu, W.; Moran, C.; Vink, S. A review of the effect of water quality on flotation. Miner. Eng. 2013, 53, 91–100. [Google Scholar] [CrossRef]
- Jeldres, R.I.; Forbes, L.; Cisternas, L.A. Effect of seawater on sulfide ore flotation: A review. Miner. Process. Extr. Metall. Rev. 2016, 37, 369–384. [Google Scholar] [CrossRef]
- Castro, S. Challenges in flotation of Cu-Mo sulfide ores in sea water. In Water in Mineral Processing of the First International Symposium; Drelich, J., Ed.; Society for Mining, Metallurgy and Exploration: Seattle, WA, USA, 2012. [Google Scholar]
- Moreno, P.A.; Aral, H.; Cuevas, J.; Monardes, A.; Adaro, M.; Norgate, T.; Bruckard, W. The use of seawater as process water at las luces copper-molybdenum beneficiation plant in taltal (Chile). Miner. Eng. 2011, 24, 852–858. [Google Scholar] [CrossRef]
- Peng, Y.; Seaman, D. The flotation of slime–fine fractions of Mt. Keith pentlandite ore in de-ionised and saline water. Miner. Eng. 2011, 5, 479–481. [Google Scholar] [CrossRef]
- Romero, C.P.; Jeldres, R.I.; Quezada, G.R.; Concha, F.; Toledo, P.G. Zeta potential and viscosity of colloidal silica suspensions: Effect of seawater salts, pH, flocculant, and shear rate. Collids Surf. A Physicochem. Eng. Asp. 2018, 538, 210–218. [Google Scholar] [CrossRef]
- Laskowski, J.S.; Castro, S.; Ramos, O. Effect of seawater main components on frothability in the flotation of Cu-Mo sulfide ore. Physicochem. Probl. Mineral Pro. 2014, 50, 17–29. [Google Scholar]
- Troncoso, P.; Saavedra, J.; Acuna, S.; Jeldres, R.; Concha, F.; Toledo, P. Nanoscale adhesive forces between silica surfaces in aqueous solutions. J. Colloid Interface Sci. 2014, 424, 56–61. [Google Scholar] [CrossRef] [PubMed]
- Ramos, O.; Castro, S.; Laskowski, J.S. Copper–molybdenum ores flotation in sea water: Floatability and frothability. Miner. Eng. 2013, 53, 108–112. [Google Scholar] [CrossRef]
- Quinn, J.J.; Kracht, W.; Gomez, C.O.; Gagnon, C.; Finch, J.A. Comparing the effect of salts and frother (MIBC) on gas dispersion and froth properties. Miner. Eng. 2007, 20, 1296–1302. [Google Scholar] [CrossRef]
- Hirajima, T.; Suyantara, G.P.W.; Ichikawa, O.; Elmahdy, A.M.; Miki, H.; Sasaki, K. Effect of Mg2+ and Ca2+ as divalent seawater cations on the floatability of molybdenite and chalcopyrite. Miner. Eng. 2016, 96–97, 83–93. [Google Scholar] [CrossRef]
- Li, W.; Li, Y.; Xiao, Q.; Wei, Z.; Song, S. The influencing mechanisms of sodium hexametaphosphate on chalcopyrite flotation in the presence of MgCl2 and CaCl2. Minerals 2018, 8, 150. [Google Scholar] [CrossRef]
- Suyantara, G.P.W.; Hirajima, T.; Elmahdy, A.M.; Miki, H.; Sasaki, K. Effect of kerosene emulsion in MgCl2 solution on the kinetics of bubble interactions with molybdenite and chalcopyrite. Collids Surf. A Physicochem. Eng. Asp. 2016, 501, 98–113. [Google Scholar] [CrossRef]
- Uribe, L.; Gutierrez, L.; Laskowski, J.; Castro, S. Role of calcium and magnesium cations in the interactions between kaolinite and chalcopyrite in seawater. Physicochem. Probl. Miner. Process. 2017, 53, 737–749. [Google Scholar]
- Qiu, Z.; Liu, G.; Liu, Q.; Zhong, H. Understanding the roles of high salinity in inhibiting the molybdenite flotation. Collids Surf. A Physicochem. Eng. Asp. 2016, 509, 123–129. [Google Scholar] [CrossRef]
- Rebolledo, E.; Laskowski, J.S.; Gutierrez, L.; Castro, S. Use of dispersants in flotation of molybdenite in seawater. Miner. Eng. 2017, 100, 71–74. [Google Scholar] [CrossRef]
- Suyantara, G.P.W.; Hirajima, T.; Miki, H.; Sasaki, K. Floatability of molybdenite and chalcopyrite in artificial seawater. Miner. Eng. 2018, 115, 117–130. [Google Scholar] [CrossRef]
- Laskowski, J.; Castro, S. Flotation in concentrated electrolyte solutions. Int. J. Miner. Process. 2015, 144, 50–55. [Google Scholar] [CrossRef]
- Jeldres, R.I.; Arancibia-Bravo, M.P.; Reyes, A.; Aguirre, C.E.; Cortes, L.; Cisternas, L.A. The impact of seawater with calcium and magnesium removal for the flotation of copper-molybdenum sulphide ores. Miner. Eng. 2017, 109, 10–13. [Google Scholar] [CrossRef]
- Wang, Y.; Chen, X.; Hu, Y.; Lan, Y. Influences of phosphates on dispersion of fine alumin-silicate minerals. Cent. South Univ. (Sci. Technol.) 2007, 38, 238–244. [Google Scholar]
- Xu, D.; Zhu, S.; Cao, G.; Cu, H. Influences of sodium hexametaphosphate on dispersion of fine montmorillonite in coal flotation. J. China Coal Soc. 2016, 41, 192–198. [Google Scholar]
- Xia, Q.; Li, Z.; Qiu, X.; Dai, Z. Invesitgation of action mechanism between sodium hexametaphosphate and serpenine. Min. Metall. Eng. 2002, 22, 53–56. (In Chinese) [Google Scholar]
- Li, Z.; Han, Y.; Li, Y.; Gao, P. Effect of serpentine and sodium hexametaphosphate on ascharite flotation. Trans. Nonferrous Met. Soc. China 2017, 27, 1841–1848. [Google Scholar] [CrossRef]
- Ding, H.; Lin, H.; Deng, Y. Depressing effect of sodium hexametaphosphate on apatite in flotation of rutile. J. Univ. Sci. Technol. Beijing 2007, 14, 200–203. [Google Scholar] [CrossRef]
- Luo, N.; Wei, D.; Shen, Y.; Han, C.; Zhang, C. Elimination of the adverse effect of calcium ion on the flotation separation of magnesite from dolomite. Minerals 2017, 7, 150. [Google Scholar]
- Feng, Q.; Zhou, Q.; Zhang, G.; Lu, Y.; Yang, S. Inhibition mechanism of sodium hexametaphosphate on calcite. Chin. J. Nonferrous Met. 2011, 21, 436–441. (In Chinese) [Google Scholar]
- Lu, Y.; Zhang, M.; Feng, Q.; Long, T.; Ou, L.; Zhang, G. Effect of sodium hexametaphosphate on separation of serpentine from pyrite. Trans. Nonferrous Met. Soc. China 2011, 21, 208–213. [Google Scholar] [CrossRef]
- Missana, T.; Adell, A. On the applicability of DLVO theory to the prediction of clay colloids stability. J. Colloid Interface Sci. 2000, 230, 150–156. [Google Scholar] [CrossRef] [PubMed]
- Zhang, M.; Liu, J.; Liu, H.; Wang, Y. Effects of water hardness on the dispersion of fine coal and montmorillonite. J. China Univ. Min. Technol. 2009, 38, 114–118. [Google Scholar]
- Lin, Q.; Gu, G.; Wang, H.; Liu, Y.; Fu, J.; Wang, C. Flotation mechanisms of molybdenite fines by neutral oils. Int. J. Miner. Metall. Mater. 2018, 25, 1–10. [Google Scholar] [CrossRef]
- Ren, J.; Shen, J.; Luo, S. Particle Dispersion Science and Technology; Chemical Industry Press: Beijing, China, 2005. (In Chinese) [Google Scholar]
- Van Oss C, J.; Giese, R.F.; Costanzo, P.M. Dlvo and non-dlvo interactions in hectorite. Clay Clay Miner. 1990, 38, 151–159. [Google Scholar] [CrossRef]
- Feng, B.; Lu, Y.; Feng, Q.; Li, H. Solution chemistry of sodium silicate and implications for pyrite flotation. Ind. Eng. Chem. Res. 2012, 51, 12089–12094. [Google Scholar] [CrossRef]
- Nagaraj, D.R.; Farinato, R. Chemical factor effects in saline and hypersaline waters in the flotation of Cu and Cu-Mo ores. In Proceedings of the XXVII International Mineral Processing Congress, Santiago, Chile, 20–24 October 2014. [Google Scholar]
- Yuan, Z.; Zhang, Q.; Liu, J. Influence and mechanism of metal ions on flotation of molybdenite. J. Northeast. Univ. (Nat. Sci.) 2016, 37, 1013–1016. [Google Scholar]
- Jacques, S.; Greet, C.J.; Bastin, D. Oxidative weathering of a copper sulphide ore and its influence on pulp chemistry and flotation. Miner. Eng. 2016, 99, 52–59. [Google Scholar] [CrossRef] [Green Version]
- Muganda, S.; Zanin, M.; Grano, S.R. Influence of particle size and contact angle on the flotation of chalcopyrite in a laboratory batch flotation cell. Int. J. Miner. Process. 2011, 98, 150–162. [Google Scholar] [CrossRef]
- Li, Y.; Lartey, C.; Song, S.; Li, Y.; Gerson, A. The fundamental roles of monovalent and divalent cations with sulfates on molybdenite flotation in the absence of flotation reagents. RSC Adv. 2018, 8, 23364–23371. [Google Scholar] [CrossRef]
- Buckley, A.N. A survey of the application of X-ray photoelectron spectroscopy to flotation research. Collids Surf. A Physicochem. Eng. Asp. 1994, 93, 159–172. [Google Scholar] [CrossRef]
- Hirajima, T.; Miki, H.; Suyantara, G.P.W.; Matsuoka, H.; Elmahdy, A.M.; Sasaki, K.; Imaizumi, Y.; Kuroiwa, S. Selective flotation of chalcopyrite and molybdenite with H2O2 oxidation. Miner. Eng. 2017, 100, 83–92. [Google Scholar] [CrossRef]
- Yin, Z.; Sun, W.; Yuehua, H.; Zhang, C.; Guan, Q.; Zhang, C. Separation of molybdenite from chalcopyrite in the presence of novel depressant 4-amino-3-thioxo-3,4-dihydro-1,2,4-triazin-5(2h)-one. Minerals 2017, 7, 146. [Google Scholar]
- Liu, G.; Huang, Y.; Qu, X.; Xiao, J.; Yang, X.; Xu, Z. Understanding the hydrophobic mechanism of 3-hexyl-4-amino-1, 2,4-triazole-5-thione to malachite by tof-sims, xps, ftir, contact angle, zeta potential and micro-flotation. Collids Surf. A Physicochem. Eng. Asp. 2016, 503, 34–42. [Google Scholar] [CrossRef]
- Nesbitt, H.W.; Muir, I.J. Oxidation states and speciation of secondary products on pyrite and arsenopyrite reacted with mine waste waters and air. Mineral. Petrol. 1998, 62, 123–144. [Google Scholar] [CrossRef]
- Lu, Z.; Liu, Q.; Xu, Z.; Zeng, H. Probing anisotropic surface properties of molybdenite by direct force measurements. Langmuir 2015, 31, 11409–11418. [Google Scholar] [CrossRef] [PubMed]
- Beaussart, A.; Parkinson, L.; Mierczynska-Vasilev, A.; Beattie, D.A. Adsorption of modified dextrins on molybdenite: Afm imaging, contact angle, and flotation studies. J. Colloid Interface Sci. 2012, 368, 608–615. [Google Scholar] [CrossRef] [PubMed]
- Raghavan, S.; Hsu, L.L. Factors affecting the flotation recovery of molybdenite from porphyry copper ores. Int. J. Miner. Process. 1984, 12, 145–162. [Google Scholar] [CrossRef]
- Wan, H.; Yang, W.; He, T.; Yang, J.; Guo, L.; Peng, Y. The influence of Ca2+ and pH on the interaction between PAHs and molybdenite edges. Minerals 2017, 7, 104. [Google Scholar] [CrossRef]
- Wan, H.; Yang, W.; Cao, W.; He, T.; Liu, Y.; Yang, J.; Guo, L.; Peng, Y. The interaction between Ca2+ and molybdenite edges and its effect on molybdenum flotation. Minerals 2017, 7, 141. [Google Scholar] [CrossRef]


| Element | Mo | S | Si | Bi | Cl | Ca | Al | Fe | Ba | K | Pb |
|---|---|---|---|---|---|---|---|---|---|---|---|
| Concentration (%) | 53.10 | 43.25 | 1.07 | 0.72 | 0.53 | 0.35 | 0.26 | 0.25 | 0.22 | 0.18 | 0.07 |
| Conditions | Without Ca2+/Mg2+ | 0.01 M CaCl2 | 0.05 M MgCl2 |
|---|---|---|---|
| MoS2 | −57.5 | −6.0 | 18.2 |
| MoS2 + SHMP | −71.9 | −16.9 | −5.1 |
| Element | BE (eV) | Conditions | ||||
|---|---|---|---|---|---|---|
| Untreated | CaCl2 | CaCl2 + SHMP | MgCl2 | MgCl2 + SHMP | ||
| S 2p | 162.4 | 57 | 57 | 58 | 53 | 56 |
| O 1s | 533.2 | 7 | 6 | 6 | 11 | 7 |
| Mo 3d | 230.0 | 35 | 35 | 35 | 32 | 35 |
| Ca 2p | 351.0 | 0 | 1 | 0 | 0 | 0 |
| Mg 2s | 89.5 | 1 | 1 | 1 | 4 | 2 |
| Species | BE (eV) | FWHM (eV) | Conditions | ||||||
|---|---|---|---|---|---|---|---|---|---|
| Untreated | CaCl2 | CaCl2 + SHMP | MgCl2 | MgCl2 + SHMP | |||||
| Mo 3d | MoS2 | 229.8 | 0.7–0.8 | 78.9 | 79.2 | 79.5 | 79.9 | 79.5 | |
| MoO3 | 232.7 | 0.8–1.0 | 3.6 | 3.0 | 2.2 | 2.2 | 2.5 | ||
| S 2s | 227.0 | 1.8–1.9 | 17.5 | 17.8 | 18.3 | 17.9 | 18.0 | ||
| S 2p | MoS2 | 162.6 | 0.7–0.8 | 95.4 | 96.7 | 96.9 | 96.1 | 96.3 | |
| SO42− | 172.7 | 2.4–2.6 | 4.6 | 3.3 | 3.1 | 3.9 | 3.7 | ||
| O1s | O2/MoS2 | 533.3 | 2.0–2.2 | 46.9 | 68.2 | 80.8 | 66.1 | 72.5 | |
| MoO3 | 531.9 | 2.0–2.2 | 45.2 | 23.4 | 13.1 | 17.9 | 20.9 | ||
| OH−/SO42− | 530.9 | 2.5–2.6 | 7.9 | 8.4 | 6.1 | 16.0 | 6.6 | ||
© 2018 by the authors. Licensee MDPI, Basel, Switzerland. This article is an open access article distributed under the terms and conditions of the Creative Commons Attribution (CC BY) license (http://creativecommons.org/licenses/by/4.0/).
Share and Cite
Li, W.; Li, Y.; Wei, Z.; Xiao, Q.; Song, S. Fundamental Studies of SHMP in Reducing Negative Effects of Divalent Ions on Molybdenite Flotation. Minerals 2018, 8, 404. https://doi.org/10.3390/min8090404
Li W, Li Y, Wei Z, Xiao Q, Song S. Fundamental Studies of SHMP in Reducing Negative Effects of Divalent Ions on Molybdenite Flotation. Minerals. 2018; 8(9):404. https://doi.org/10.3390/min8090404
Chicago/Turabian StyleLi, Wanqing, Yubiao Li, Zhenlun Wei, Qing Xiao, and Shaoxian Song. 2018. "Fundamental Studies of SHMP in Reducing Negative Effects of Divalent Ions on Molybdenite Flotation" Minerals 8, no. 9: 404. https://doi.org/10.3390/min8090404
APA StyleLi, W., Li, Y., Wei, Z., Xiao, Q., & Song, S. (2018). Fundamental Studies of SHMP in Reducing Negative Effects of Divalent Ions on Molybdenite Flotation. Minerals, 8(9), 404. https://doi.org/10.3390/min8090404