Variations of Major and Minor Elements in Pt–Fe Alloy Minerals: A Review and New Observations

1
Research Laboratory of Industrial and Ore Mineralogy, Cherepovets State University, 5 Lunacharsky Avenue, Cherepovets 162600, Russia
2
Cabri Consulting Inc., 514 Queen Elizabeth Drive, Ottawa, ON K1S 3N4, Canada
*
Author to whom correspondence should be addressed.
Minerals 2019, 9(1), 25; https://doi.org/10.3390/min9010025
Submission received: 5 December 2018
/
Revised: 21 December 2018
/
Accepted: 27 December 2018
/
Published: 4 January 2019
(This article belongs to the Special Issue Platinum-Group Minerals: New Results and Advances in PGE Mineralogy in Various Ni-Cu-Cr-PGE Ore Systems)
Abstract
:Compositional variations of major and minor elements were examined in Pt–Fe alloys from various geological settings and types of deposits, both lode and placer occurrences. They included representatives of layered intrusions, Alaskan-Uralian-(Aldan)-type and alkaline gabbroic complexes, ophiolitic chromitites, and numerous placers from Canada, USA, Russia, and other localities worldwide. Pt–Fe alloy grains in detrital occurrences are notably larger in size, and these are considered to be the result of a special conditions during crystallization such as temperature, pressure, geochemistry or time. In addition, the number of available statistical observations is much greater for the placer occurrences, since they represent the end-product of, in some cases, the weathering of many millions of tonnes of sparsely mineralized bedrock. Typically, platinum-group elements (PGE) present in admixtures (Ir, Rh, and Pd) and minor Cu, Ni are incorporated into a compositional series (Pt, PGE)2–3(Fe, Cu, Ni) in the lode occurrences. Relative Cu enrichment in alloys poor in Pt implies crystallization from relatively fractionated melts at a lower temperature. In contrast to the lode deposits, the distribution of Ir, Rh, and Pd is fairly chaotic in placer Pt–Fe grains. There is no relationship between levels of Ir, Rh, and Pd with the ratio Σ(Pt + PGE):(Fe + Cu + Ni). The compositional series (Pt, PGE)2–3(Fe, Cu, Ni) is not as common in the placer occurrences; nevertheless, minor Cu and Ni show their maximums in members of this series in the placer grains. Global-scale datasets yield a bimodal pattern of distribution in the Pt–Fe diagram, which is likely a reflection of the miscibility gap between the ordered Pt3Fe structure (isoferroplatinum) and the disordered structure of native or ferroan platinum. In the plot Pt versus Fe, there is a linear boundary due to ideal Pt ↔ Fe substitution. Two solid solution series are based on the Ir-for-Pt and Pd-for-Pt substitutions. The incorporation of Ir is not restricted to Pt3Fe–Ir3Fe substitution (isoferroplatinum and chengdeite, plus their disordered modifications). Besides, Ir0 appears to replace Pt0 in the disordered variants of (Pt–Ir)–Fe alloys. There is a good potential for the discovery of a new species with a Pd-dominant composition, (Pd, Pt)3Fe, most likely in association with the alkaline mafic-ultramafic or gabbroic complexes, or the mafic units of layered intrusions. The “field of complicated substitutions” is recognized as a likely reflection of the crystallochemical differences of Pd and Ir, extending along the Ir-Pd axis of the Ir–Pd–Rh diagram. The inferred solid solution extends approximately along the line Ir–(Pd:Rh = 2:3). Minor Pd presumably enters the solid solution via a coupled substitution in combination with the Rh. An Ir-enrichment trend in Pt–Fe alloys typically occurs in the Alaskan-type complexes. The large size of the Pt–Fe nuggets associated with some of these complexes is considered to be related to an ultramafic-mafic pegmatite facies, whereas significant Pd-enrichment is characteristic of gabbroic source-rocks (e.g., Coldwell Complex), resulting in a markedly different trend for the Pt versus Fe (wt.%). However, based on our examination of a large dataset of Pt–Fe alloys from numerous origins, we conclude that they exhibit compositional overlaps that are too large to be useful as reliable index-minerals.
1. Introduction
Natural Pt–Fe alloys are an economically important species of platinum-group minerals (PGM), which are especially abundant in the zoned Alaskan-Uralian-(Aldan)-type ultramafic-mafic complexes and placers of PGE (platinum-group elements) that are derived from these complexes [1,2,3,4]. Native platinum (0–17 at.% Fe) is cubic (Fm3m), with a = 3.9231 Å (synthetic equivalent). Increasing Fe content reduces the cell dimension [1,5,6,7]. In the range of 17–20 at.% Fe, the structure is disordered or represents a mixture of native platinum and isoferroplatinum. The latter species, ideally the Pt3Fe (25 at.% Fe), has a cubic structure (Pm3m, 20–36 at.% Fe) with a = 3.86 Å [1]. Variations in the Fe cause the appearance of a partial disorder in this mineral. Within the interval 36–41 at.%, the alloy structures are disordered in the Pt–Fe system; isoferroplatinum likely coexists with tetraferroplatinum [8], i.e., tetragonal PtFe (41–65 at.% Fe; ideally 50 at.% Fe) with a = 3.84 Å and c = 3.71 Å; and its space group is P4/mmm [1,2,3]. The observed difference between the compositions of isoferroplatinum and tetraferroplatinum leads to a small reduction in the cell dimension to accommodate a greater content of Fe [1,5,6]. Commonly, natural members of the tetraferroplatinum–tulameenite [Pt2FeCu] series are somewhat nonstoichiometric and extend towards (Pt, PGE)1+x (Fe, Cu, Ni)1−x [9].
The goals of this article are: (1) To evaluate the compositional ranges observed in Fe-bearing platinum (or ferroan platinum) and isoferroplatinum with respect to the main components and admixtures on the basis of compositions from a large number of Pt–Fe alloys reported worldwide in the literature for various geological settings and types of deposits (note that the prefix “ferroan” (used in ferroan platinum) does not imply the valence state of Fe); (2) To compare the compositional characteristics of Pt–Fe alloys that are present in lode deposits versus the ones present in placer deposits derived from source rocks; and (3) To evaluate whether Pt–Fe alloys may be used as useful indicator minerals to infer the type or character of the lode source for detrital grains or placer concentrations of PGM.
2. Materials and Methods
In the present review, we used a total of 2430 data-points accumulated from the literature, including our own data and from hitherto unpublished results in internal reports, e.g., [10]. We believe this large dataset of electron-microprobe compositions (EMP) to be representative because it also reflects a large diversity of localities, geologic settings, and ore zones worldwide. The different types of lode and placer deposits reviewed for this study are listed in Table 1.
3. Results
3.1. Variations in the Pt–Fe Alloys from Lode Deposits
The Pt–Fe alloys are associated with several lode sources, specifically from the different types of ore zones within magmatic complexes (Table 1). Layered intrusions are represented by the dunite pipes (Mooihoek and Onverwacht) and the Merensky Reef of the Bushveld Layered Complex (South Africa), and by the Kapalagulu Layered Intrusion of western Tanzania. Alaskan-Uralian-(Aldan)-type zoned complexes include the Tulameen complex in British Columbia (Canada), the Kondyor Complex in northern Khabarovskiy krai, the Kachkanar and Nizhniy Tagil Complexes of the Urals, and the Gal’moenan Complex in the Koryak Upland, Kamchatka krai (Russia). The Coldwell Complex represents a giant Alkaline Gabbro-Syenite intrusion located in Ontario (Canada); Ophiolitic Chromitites are represented by occurrences from the Uktus and Kytlym areas, central Urals (Russia). In addition, Pt–Fe alloys were studied in situ in a PGM-bearing saprolite developed after mineralized dunite at Yubdo (Ethiopia) (Table 1).
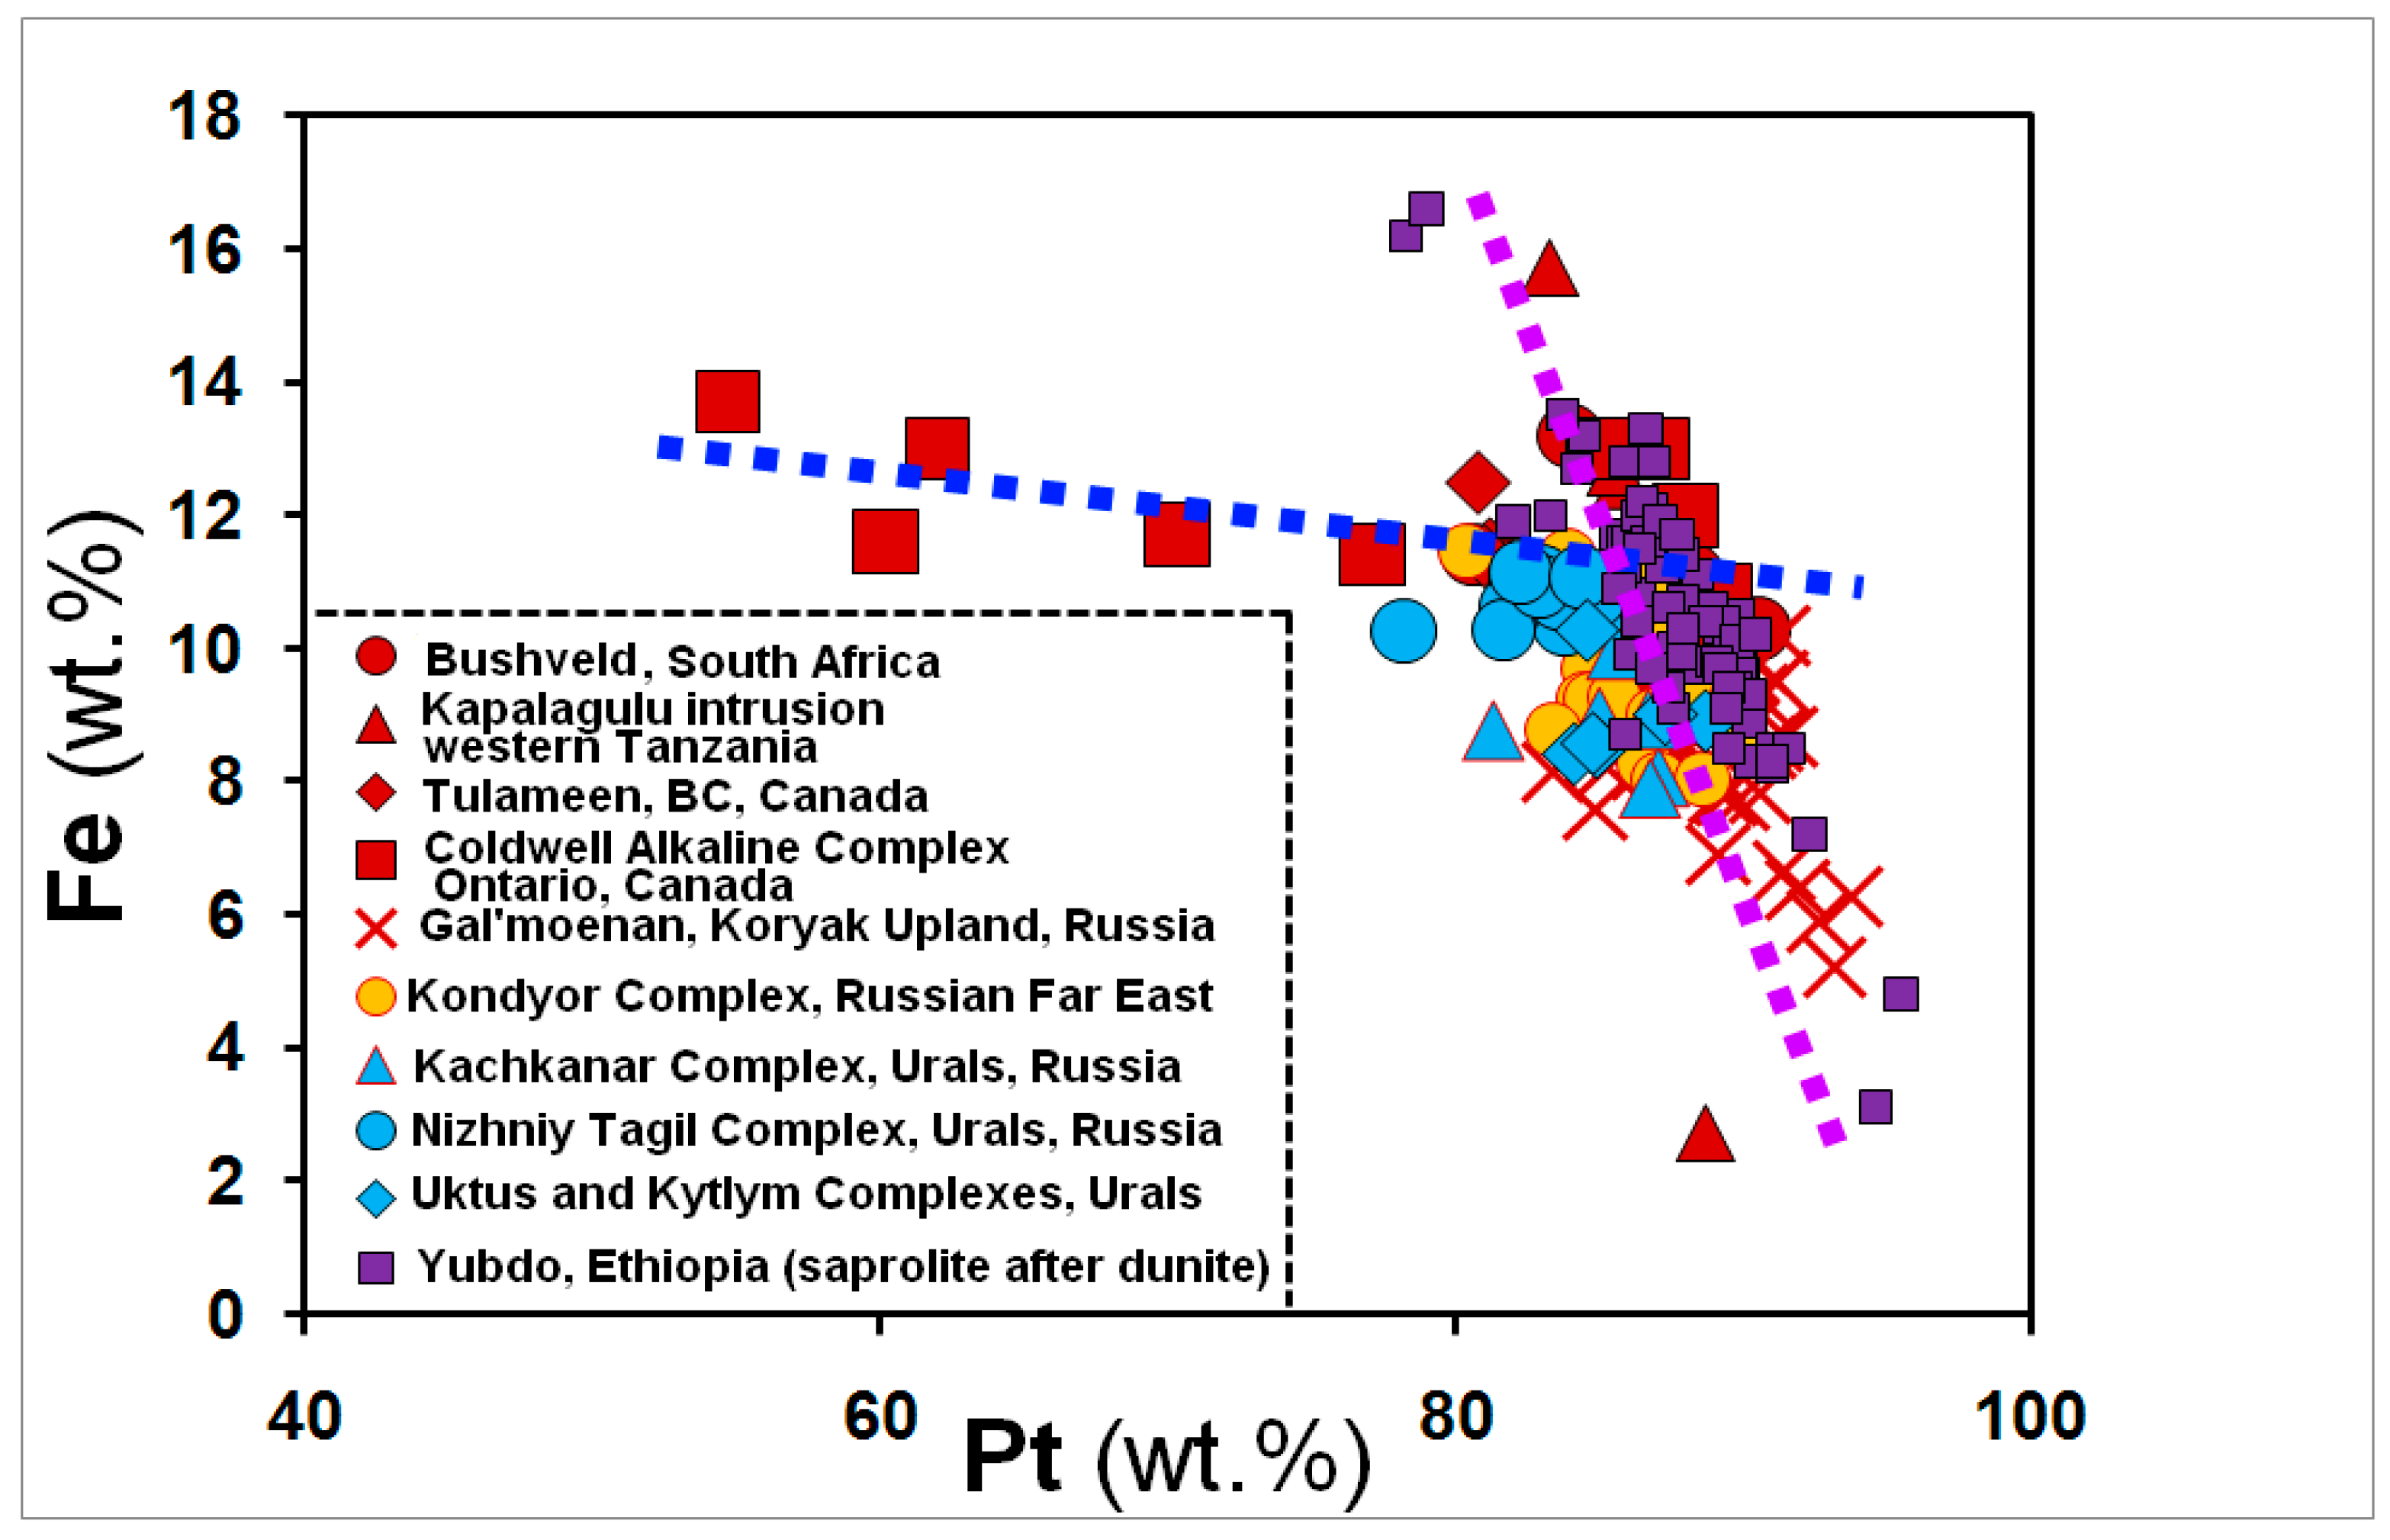
Two compositional trends are generally observed in Figure 1. First, the Yubdo trend is extended and consistent with most of the data-points plotted. Compositions of the Pt–Fe alloys from the Alaskan-type complexes, i.e., Tulameen, Kondyor, Kachkanar, and Nizhniy Tagil, are similar and broadly overlap to form a small field close to the central portion of the Yubdo trend. The second, the Coldwell trend of compositions, is uncommon. It is discordant to the Yubdo trend because of the strong Pd-for-Pt substitution occurring in these alloys (Figure 1).
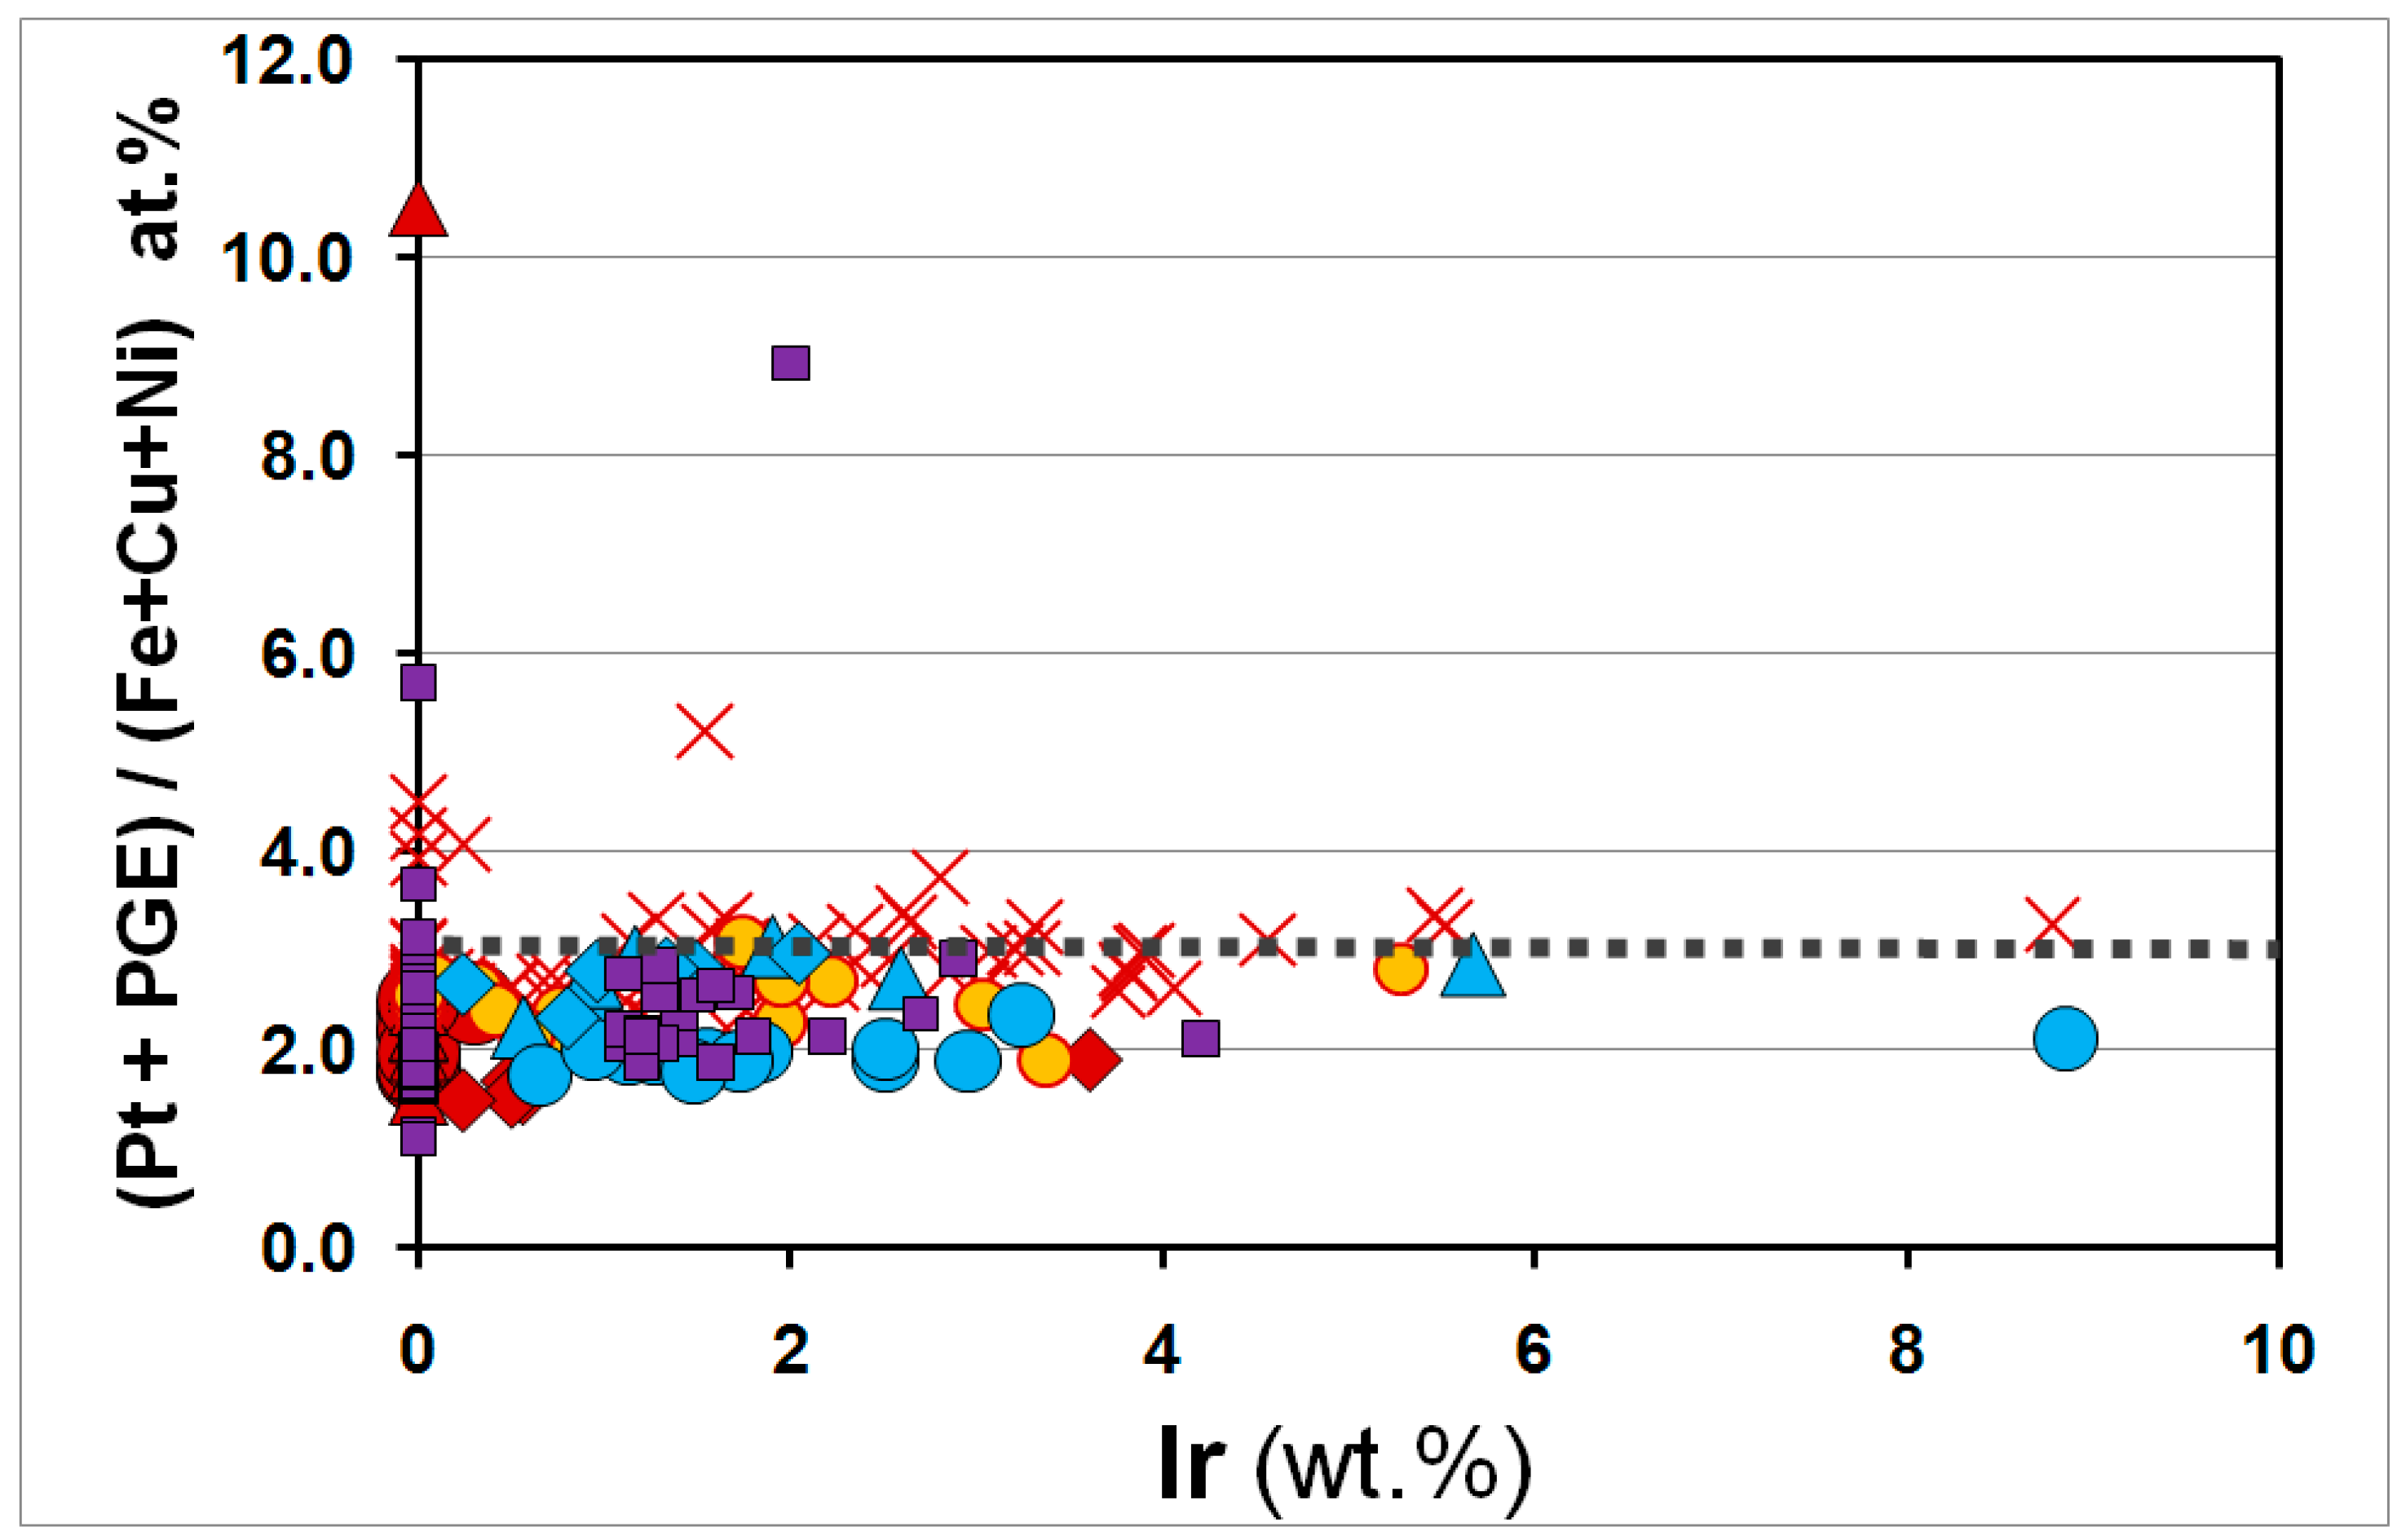
Pt–Fe alloys from the layered intrusions (Bushveld and Kapalagulu) and from the Coldwell Alkaline Complex are consistently poor in iridium, containing from “not detected” (n.d.) to 0.3 wt.% Ir (see References quoted in Table 1). In contrast, the Pt–Fe alloys from Alaskan-type complexes are relatively enriched in Ir (Figure 2): 0.24–3.6 (mean 1.0) wt.% Ir at Tulameen; n.d.–5.28 (1.32) wt.% at Kondyor; 0.56–5.67 (1.97) wt.% at Kachkanar; 0.65–8.85 (2.36) wt.% Ir at Nizhniy Tagil; and n.d.–8.78 (1.86) wt.% Ir at Gal’moenan. The observed maximums are notably similar in compositions of the Pt–Fe alloys from the latter two occurrences (Figure 1). The alloys analyzed in the chromitites at Uktus and Kytlym and in the Yubdo saprolite contain 0.24–2.04 (1.14) wt.% Ir and n.d. to 4.2 (mean 0.43) wt.% Ir, respectively.
The Rh admixtures (Figure 3) are below the level of detection (EMP) in the Pt–Fe alloys at Kapalagulu and Coldwell. The Bushveld Pt–Fe alloys contain variable amounts of Rh, from n.d. to 3.6 wt.% (mean 0.58) wt.% Rh. Pt–Fe alloys of the Alaskan-type complexes typically contain substantial levels of Rh: 0.52–0.75 (0.62) wt.% Rh at Tulameen; n.d.–1.66 (0.67) wt.% at Kondyor; 0.41–1.37 (0.92) at Kachkanar; and 0.45–1.37 (0.91) at Nizhniy Tagil, the values of which are close to 0.36–1.35 (mean 0.87) wt.% Rh in the Pt–Fe alloys analyzed at Uktus and Kytlym. Pt–Fe alloys at Gal’moenan are reportedly poor in Rh: n.d.–0.43 (mean 0.04) wt.% Rh.
Maximum Pd contents are characteristic of the Pt–Fe alloys at Coldwell, with compositions ranging from n.d. to 29.7 (mean 10.98) wt.% Pd (Figure 4). Occasionally, the Pt–Fe alloys analyzed from the layered intrusions also display elevated levels of Pd: n.d.–3.8 (mean 0.57) wt.% Pd at Bushveld and n.d.–5.6 (mean 0.62) wt.% Pd at Kapalagulu. These mean values compare well with the values observed for the Pt–Fe alloys from some of the Alaskan-type complexes: n.d.–1.07 (mean 0.59) wt.% at Kachkanar; 0.2–0.5 (0.43) wt.% Pd at Tulameen; and n.d.–1.51 (mean 0.45) wt.% Pd at Kondyor. The corresponding levels are lower at Nizhniy Tagil (n.d.–0.64, mean 0.19 wt.% Pd) and at Uktus and Kytlym (n.d.–0.86, mean 0.26 wt.% Pd).
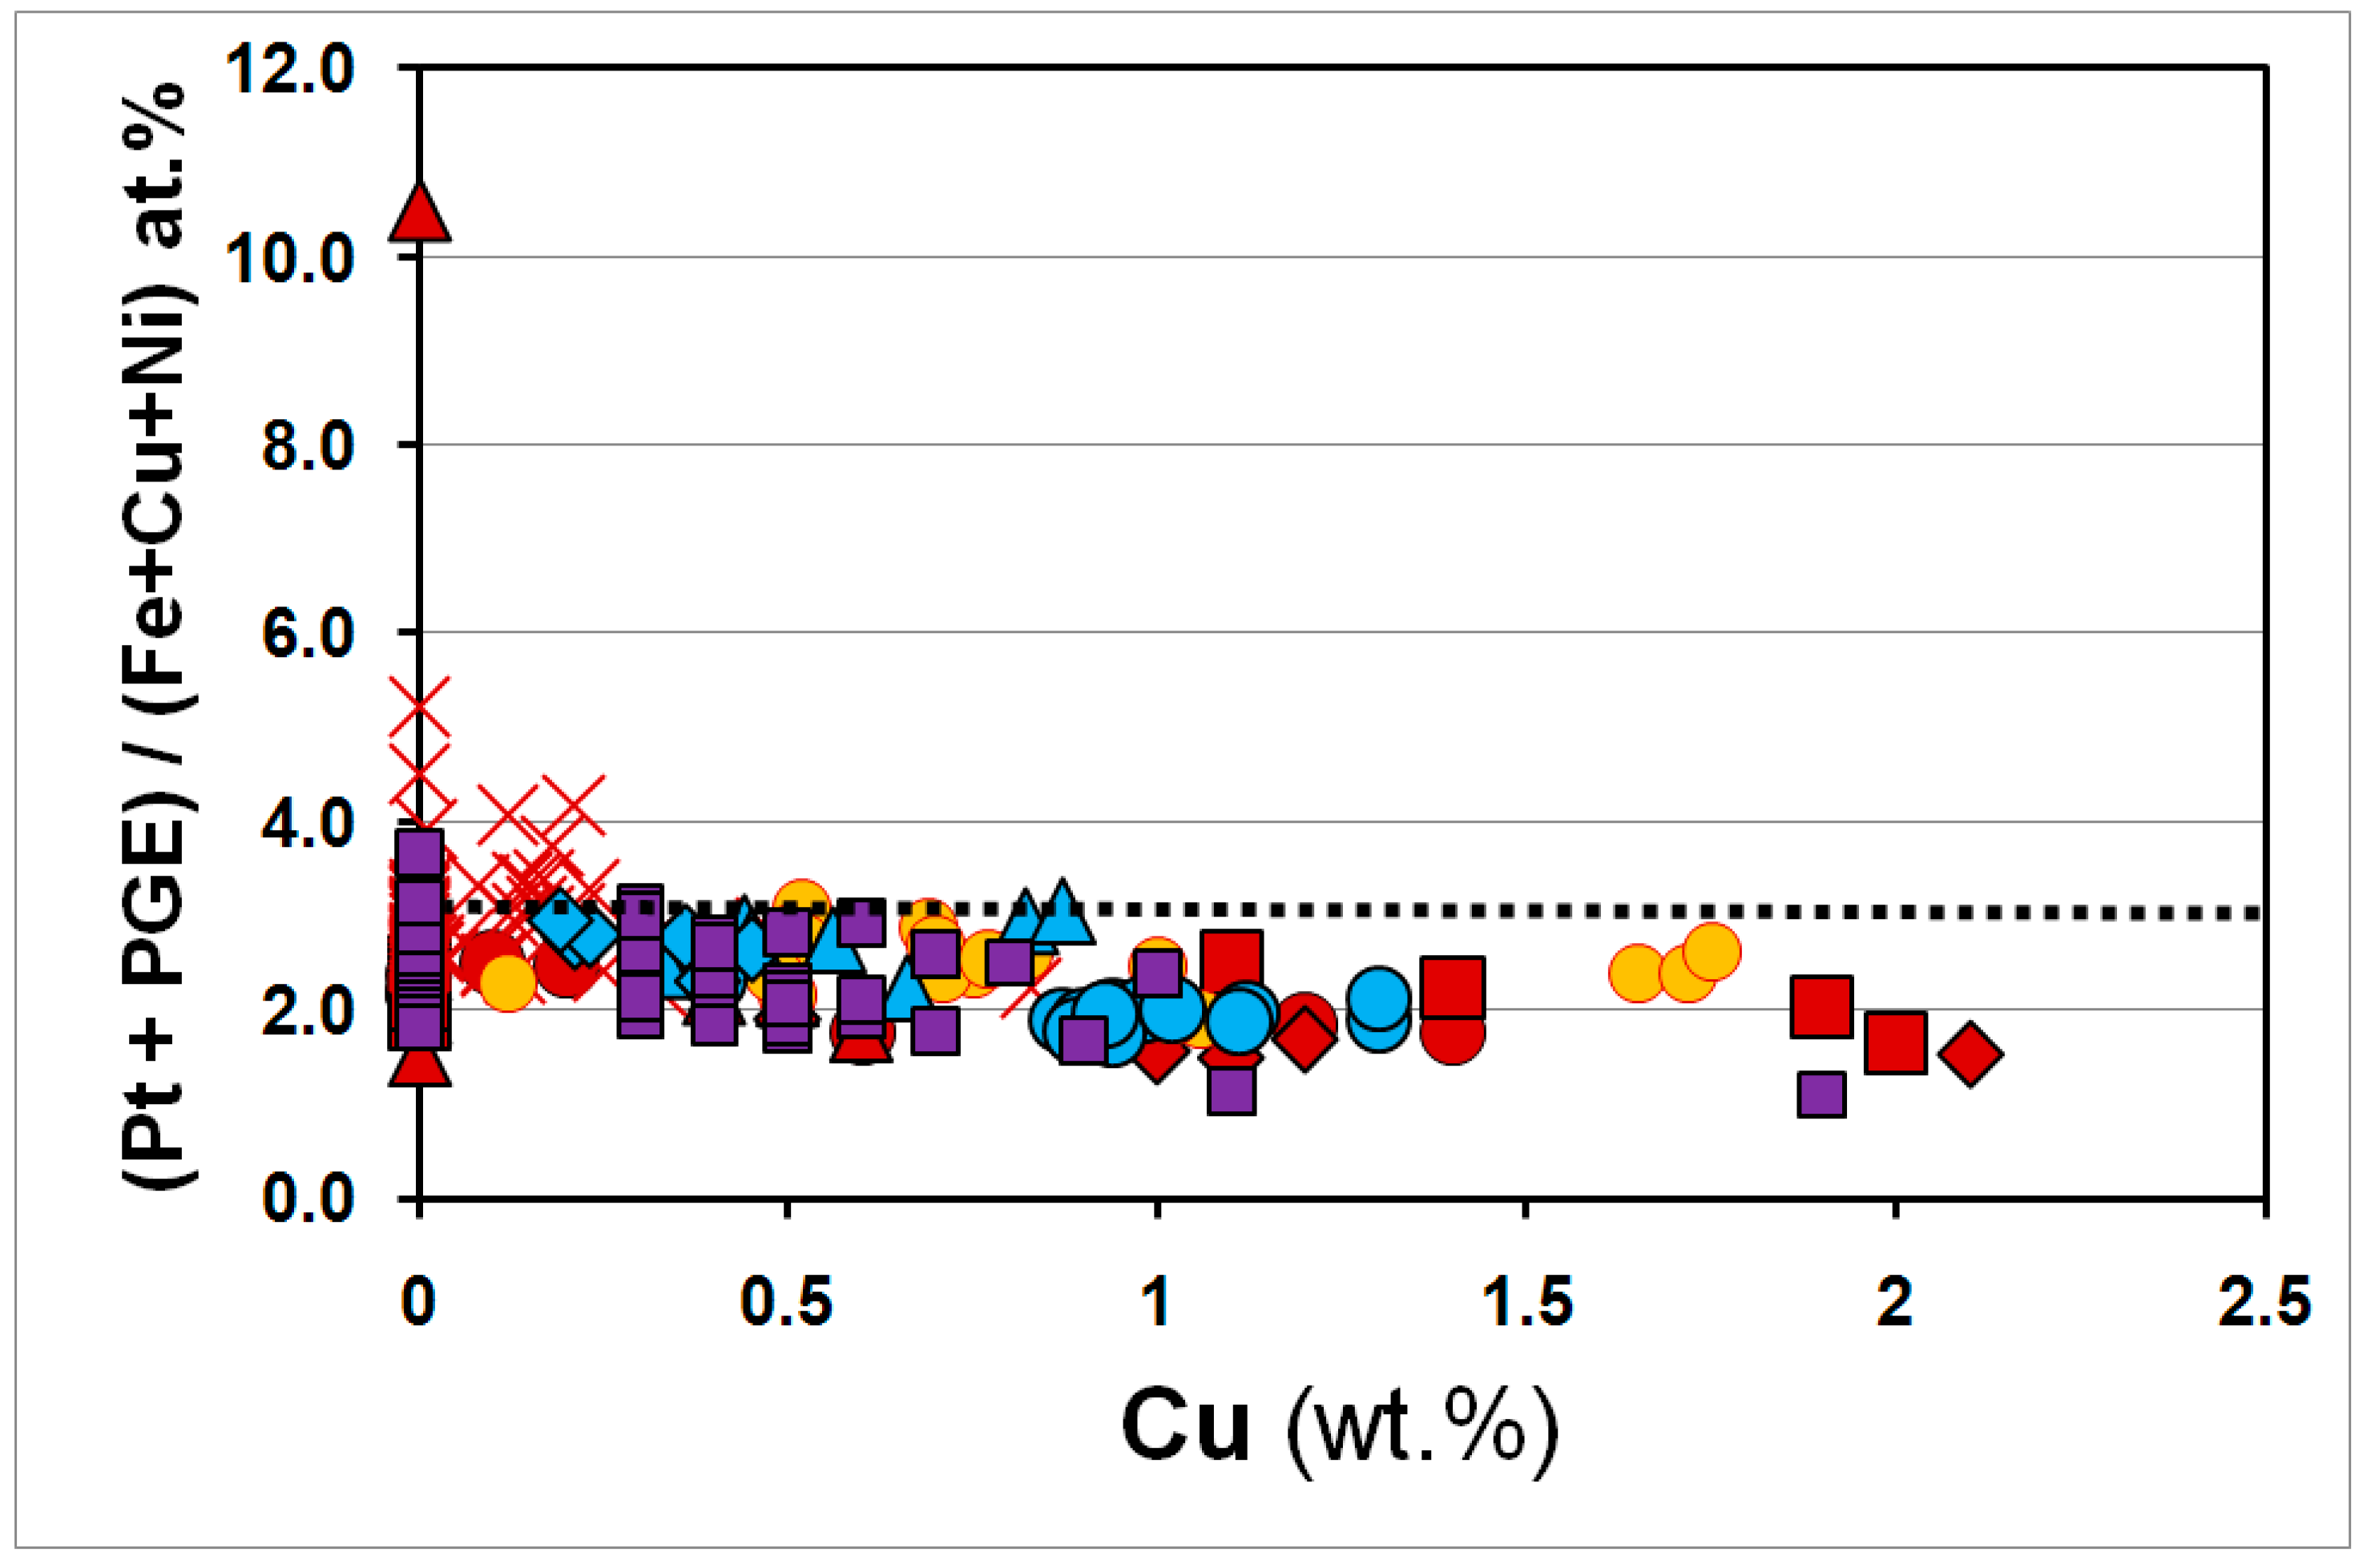
Compositional variations of Cu in the Pt–Fe alloys are presented in Figure 5. Note that the observed levels of Cu are generally increased with decreasing values of the atomic Σ(Pt + PGE):(Fe + Cu + Ni) ratio.
Pt–Fe alloys at Tulameen (0.5–2.1, mean 1.17 wt.% Cu), Kondyor (0.12–1.75, mean 0.82 wt.% Cu), and Nizhniy Tagil (0.4–1.3, mean 0.98 wt.% Cu) are notably rich in admixtures of Cu. Alloys of Pt–Fe at Kachkanar are less enriched in Cu: 0.33–0.87 (mean 0.59) wt.%. These levels are fairly close to the ones observed at Bushveld (n.d.–1.4, mean 0.5 wt.% Cu) and Coldwell (n.d.–2.0, mean 0.64 wt.% Cu). The other lode deposit occurrences show low values of the admixtures of Cu in the Pt–Fe alloys at: Kapalagulu (n.d.–0.6, mean 0.17 wt.% Cu); Gal’moenan (n.d.–0.83, mean 0.06 wt.%); Uktus and Kytlym (0.19–0.45, mean 0.31 wt.% Cu); and Yubdo (n.d.–1.90, mean 0.30 wt.% Cu).
Elevated values of Ni (Figure 6) were found in the Pt–Fe alloys in the Bushveld samples: n.d. to 3.9 (mean 1.0 wt.% Ni). The more unexpected observation is that a substantial Ni enrichment also exists in the Pt–Fe alloys in the Tulameen (1.2–3.2, mean 2.53 wt.% Ni) and Nizhniy Tagil (0.27–2.29, mean 1.27 wt.% Ni) Alaskan-type complexes. Some of the Pt–Fe alloys at Yubdo are also enriched in Pt (n.d.–2.6, mean 0.28 wt.% Ni). The other occurrences display low contents of Ni in the Pt–Fe alloys at: Kondyor (n.d.–0.83, mean 0.24 wt.% Ni); Kapalagulu (n.d.–0.6, mean 0.17 wt.% Ni); Uktus and Kytlym (0.23–0.39, mean 0.3 wt.% Ni); Kachkanar (n.d.–0.13 wt.% Ni); Gal’moenan (n.d.–0.09 wt.% Ni); and Coldwell (n.d.).
3.2. Variations in the Compositions of the Pt–Fe Alloys from Placer Deposits
Variations in the contents of Pt versus Fe, shown in Figure 7, pertain to grains of the Pt–Fe alloys from the placer localities summarized in Table 1. Four sets of EMP data were grouped conditionally for the large territories (Canada and the USA; Russia; and “Various placers worldwide”) to reduce the extensive overlaps existing amongst the compositional sets of regional scale.
Figure eight-shaped compositional fields are observed, which is indicative of a bimodal distribution pattern and consistent with the four plotted data sets that are mutually overlapped (Figure 7). Note that the multiple points of the 8-shaped clouds are clustered approximately around the central compositions Pt74Fe26 (very close to ideal Pt3Fe, i.e., isoferroplatinum) and Pt83Fe17 (native or ferroan platinum); thus, these fields may reflect the existing miscibility gap.
As displayed in Figure 8, most of the Pt–Fe alloys contain <5–10 wt.% Ir. The observed enrichment in Ir does not necessarily occur in (Pt, Ir)3Fe-type compositions related to a solid solution of isoferroplatinum and chengdeite, which is the Ir-dominant analogue of isoferroplatinum [44]. Thus, the incorporation of Ir is not controlled by the Σ(Pt + PGE):(Fe + Cu + Ni) ratio, and presumably, can occur in both types of structures: ordered and disordered. Interestingly, the Pt–Fe alloys from the lode deposits (Figure 2) display an Ir-enrichment trend that extends along a narrow range of compositions (Pt, PGE)2–3(Fe, Cu, Ni).
The observed distribution of admixtures of Rh (Figure 9) displays a similar character as Ir. There is no clear relationship between the levels of Rh and the values of the atomic Σ(Pt + PGE):(Fe + Cu + Ni) ratio in these minerals of placer alloys. In contrast, and uniform to Ir, the Rh-enrichment is related to the compositional series (Pt, PGE)2–3(Fe + Cu + Ni) in the lode deposits (Figure 3). However, the behavior of the Ir and Rh is not coherent in the Pt–Fe alloys. In the Rh–Ir plot, these elements formed separate trends of enrichment and were not involved in the mutual schemes of substitutions.
The Pd distribution (Figure 10) seems to be rather chaotic with respect to the ratio Σ(Pt + PGE):(Fe + Cu + Ni) in compositions of the placer grains. The observed extent of the Pd enrichment is modest in comparison to the high-Pd compositions of the Pt–Fe alloy from the Coldwell alkaline gabbro-syenite complex (Figure 4). The latter type of lode source was unlikely to have been involved as a contributor to the studied zones of the placer PGM. In contrast, similar to Ir–Rh, the trend of Pd enrichment corresponds to the series (Pt, PGE)2(Fe + Cu + Ni) in the lode deposits (Figure 4).
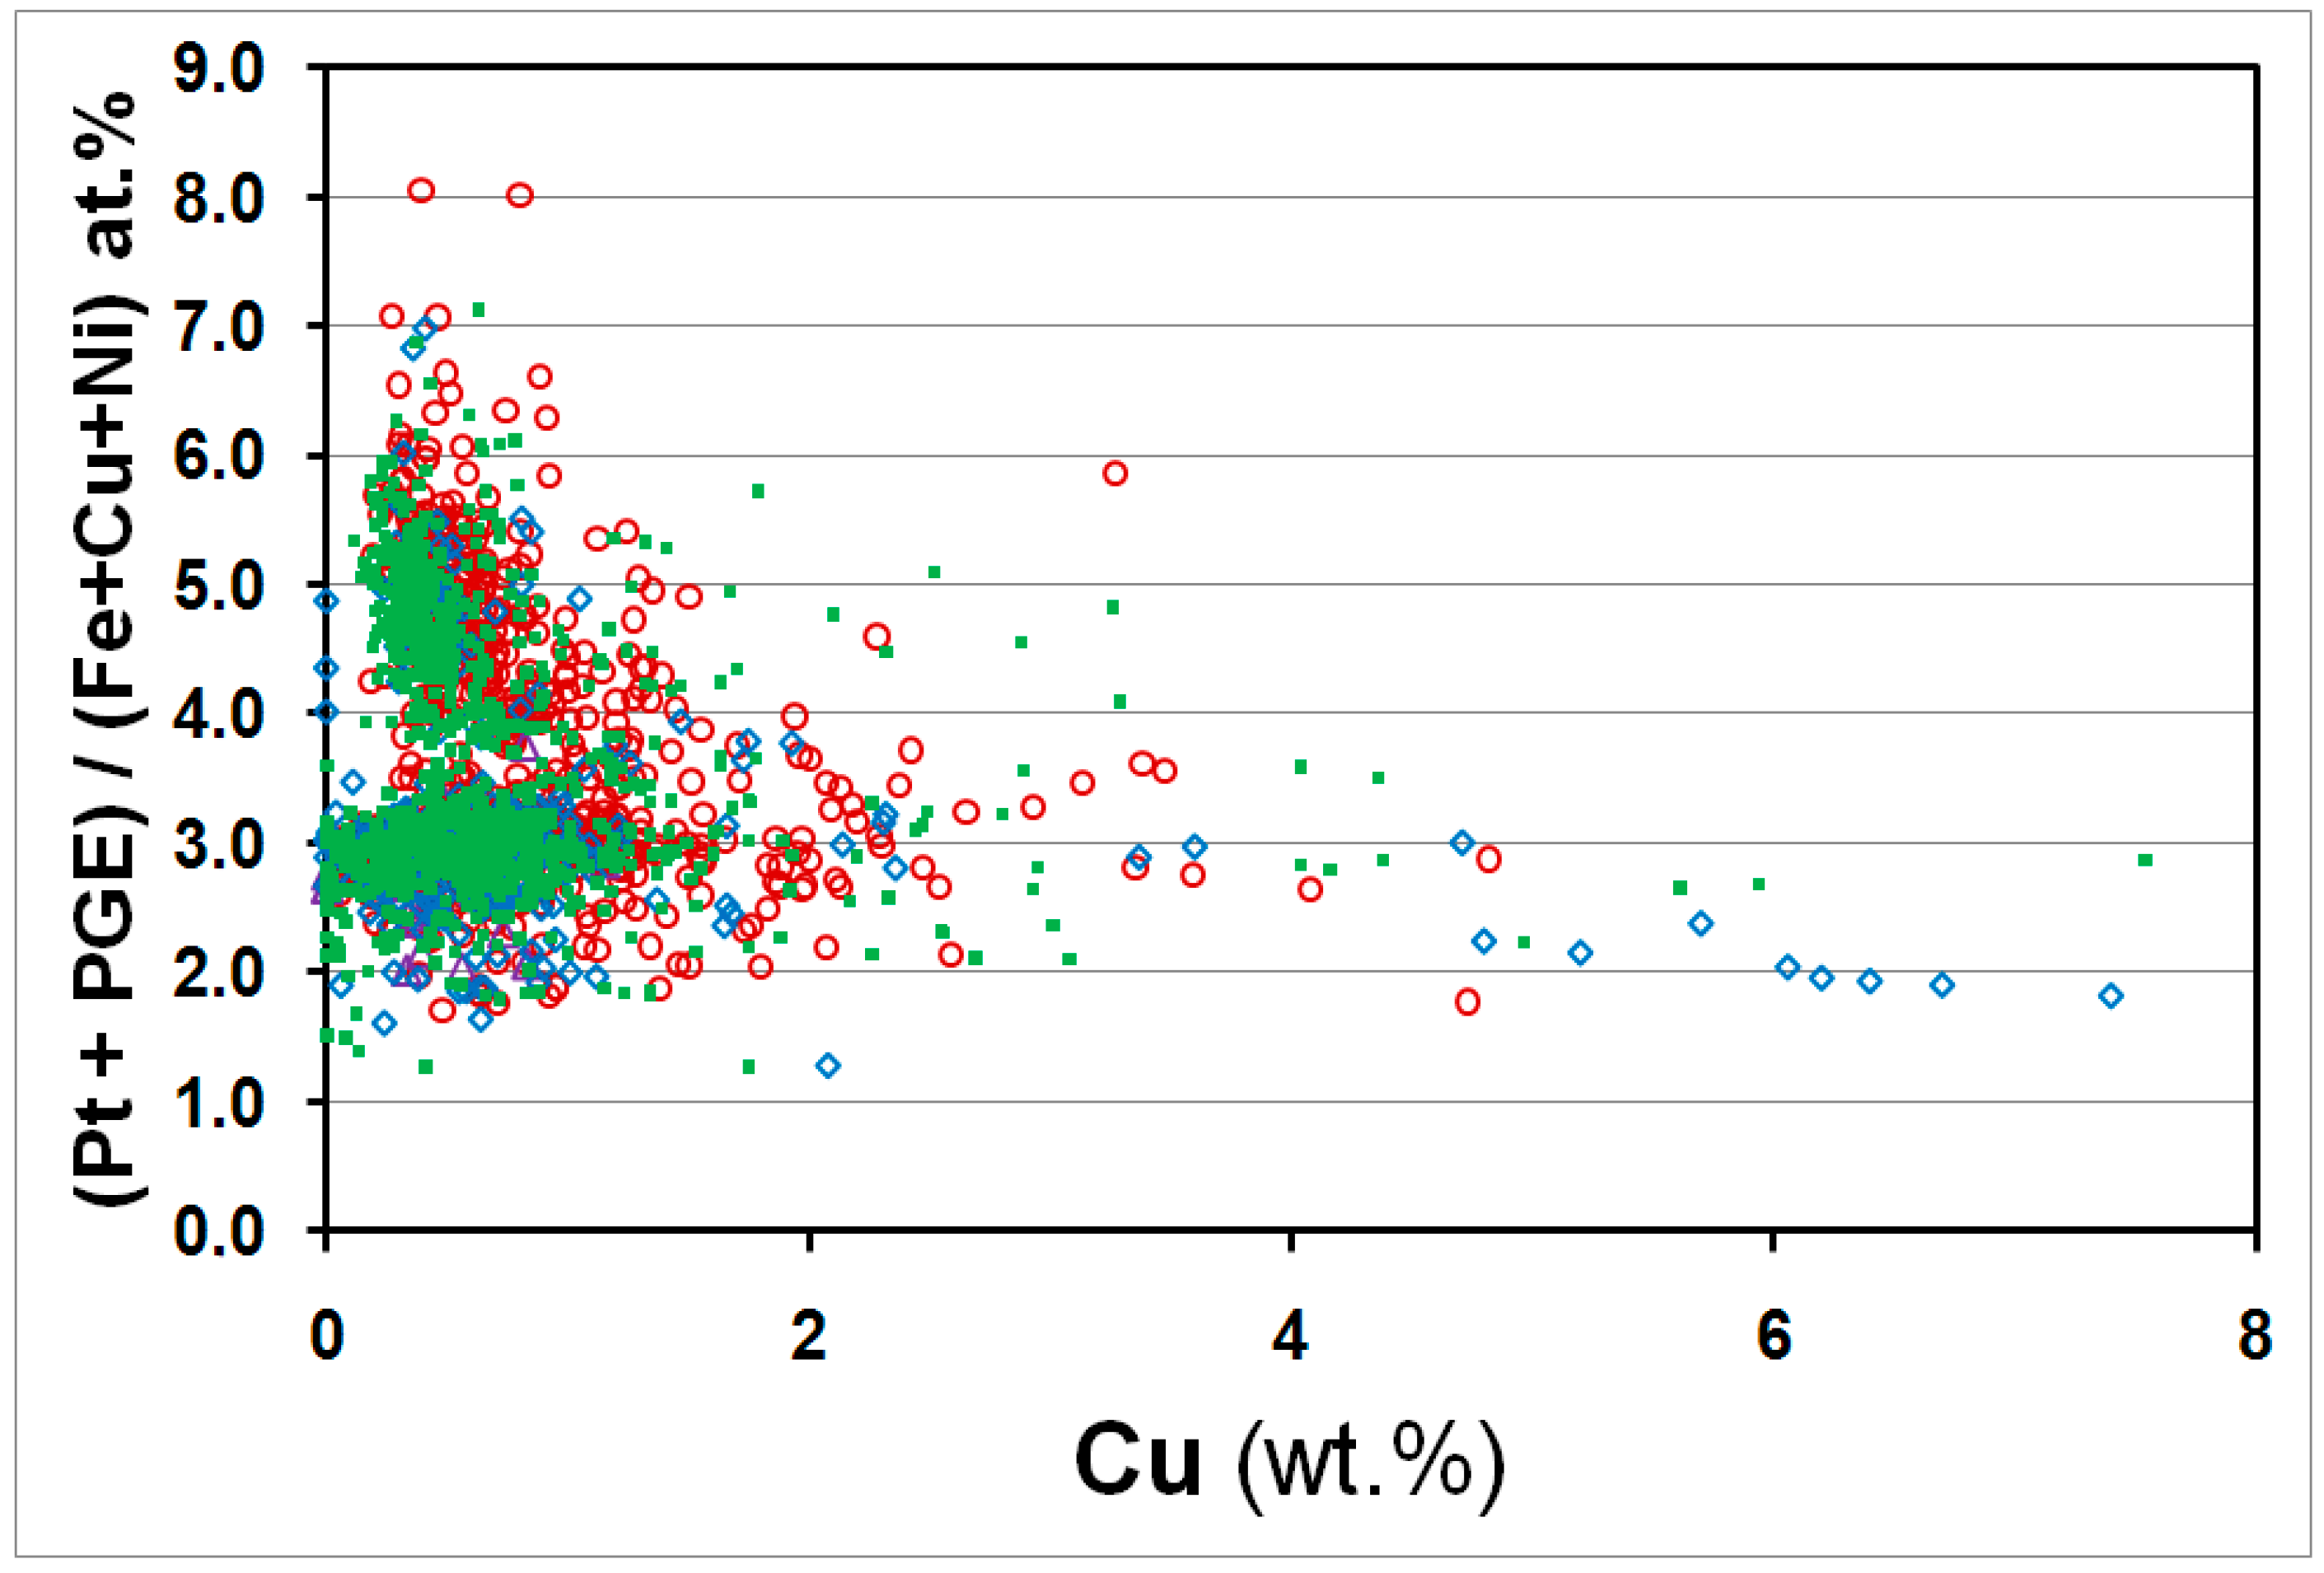
Similar to the Pt–Fe alloys from lode sources (Figure 5), the placer Pt–Fe grains display a trend of Cu enrichment that extends along the compositional series (Pt, PGE)2–3(Fe + Cu + Ni) (Figure 11). However, the majority of the plotted data-points are distributed more or less chaotically in the range n.d.–4 wt.% Cu (Figure 11).
Unlike the other elements, the distribution of minor Ni is most consistent in the Pt–Fe alloys from the lode deposits (Figure 6) and from the placers (Figure 12), showing similar trends of Ni-enrichment in the compositional series (Pt, PGE)2–3(Fe + Cu + Ni). Additionally, the maximum contents of Ni are close in the Pt–Fe alloys in the lode and placer occurrences (≤4 wt.% Ni).
3.3. Overall Variations in the Compositions of the Pt–Fe Alloys on a Global Scale
In Figure 13, the overall variations are shown in compositions of the Pt–Fe alloys in all types of occurrences, involving the examined lode and placer deposits (Table 1). In the Pt versus Fe diagram, the observed field of solid solutions displays a linear boundary due to the ideal scheme of Pt ↔ Fe substitution, with the observed equation of linear regression y = −x + 100 (Figure 13a).
The two main series of solid-solutions (Figure 13b,c and Figure 14a) are based on the incorporation of high levels of Ir (≤20 at.%), and an even greater content of Pd (≤35 at.%), which are both negatively correlated with Pt. In contrast, Cu (≤20 at.%) did not correlate with Pt, where the bulk of the EMP compositions had fairly low amounts of ≤6 at.% Cu (Figure 13d).
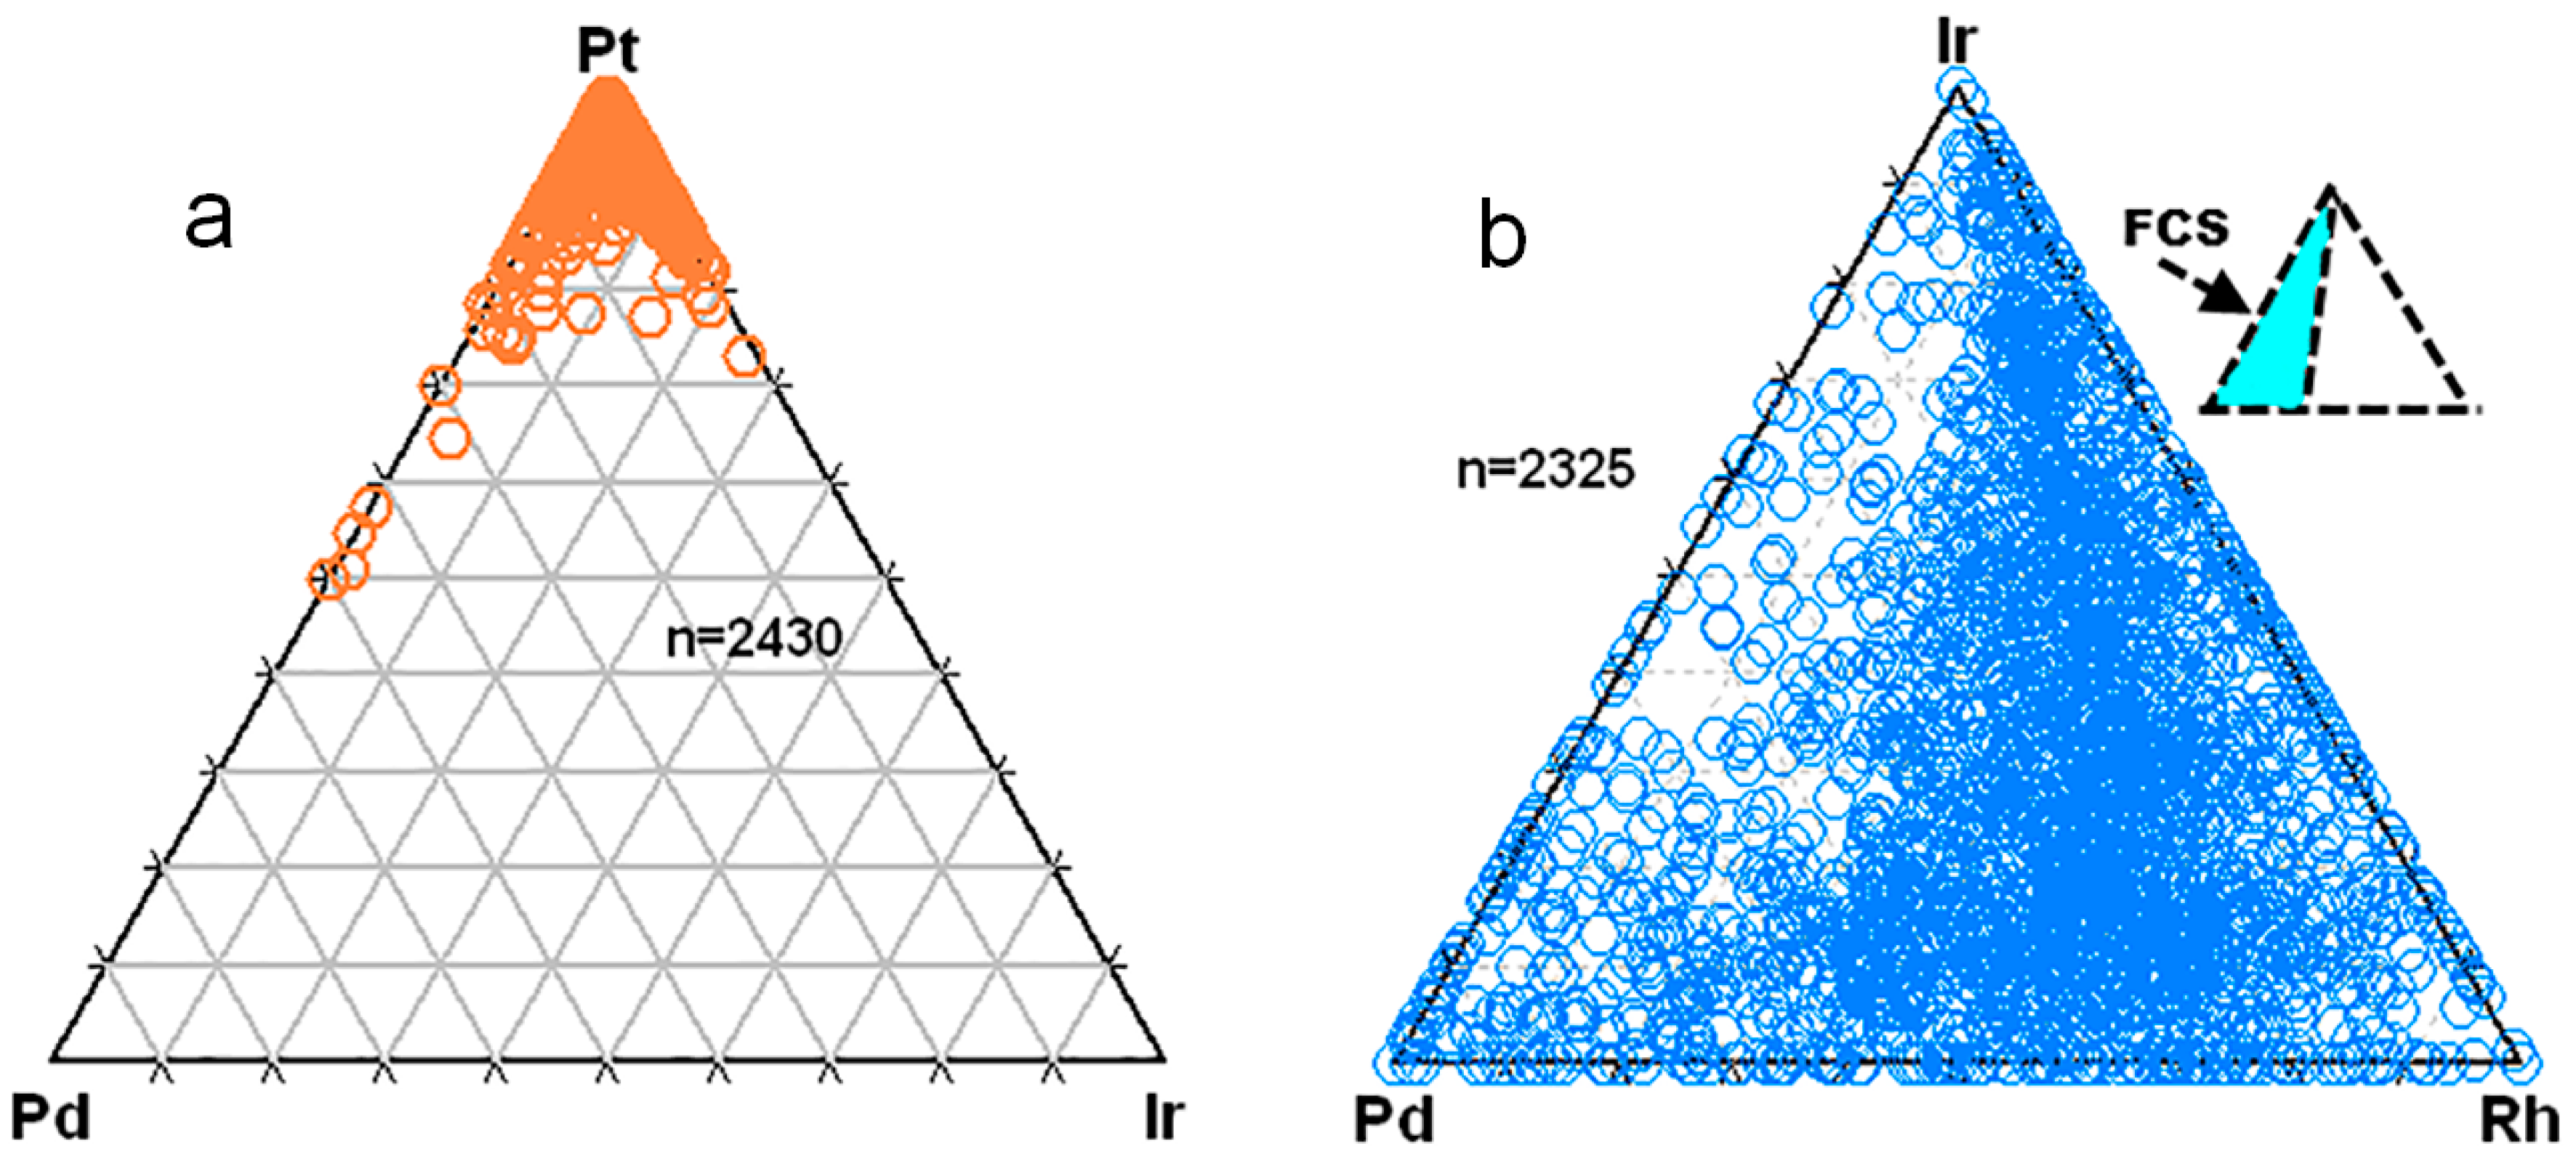
Thus, two series of extensive solid-solutions exist: Pt3−xFe (isoferroplatinum and ferroan platinum) ↔ Ir3−xFe (chengdeite, and possibly, its disordered modification), and a series extending toward Pd3Fe (unnamed), which was documented at Coldwell (Figure 14a). There is a good potential for the discovery of a new species of PGM with a Pd-dominant composition, (Pd, Pt)3Fe, in relation to the latter or another complex. The ordered and disordered variants of Pd3Fe exist in the Pd-Fe system, e.g., [45].
In the compositional Ir–Pd–Rh space, the presence of a “field of complicated substitutions” is proposed, which generally extends along the Ir–Pd axis (Figure 14b). In addition, there is a slightly rarefied area along the Ir–Rh axis, which could be ascribed to the lack of sufficient statistics. On the other hand, the observed solid-solution appears to extend, approximately, along the line Ir–(Pd:Rh = 2:3) in the Ir–Pd–Rh space, as inferred on the basis of a total of 2325 point analyses (Figure 14b).
In addition, Ru, Os, and Sb occur as traces or minor elements in the Pt–Fe alloys. The bulk of the compositions of alloy grains gave ≤0.5 wt.% Ru, with a maximum ~5 wt.% and mean 0.13 wt.% Ru (per n = 2430). The observed background of Os was notably higher. The majority of the Pt–Fe grains contained ≤0.5–2 wt.% Os, with episodic maximums ~6–8 wt.% and mean 0.53 wt.% Os (n = 2430). Typically, Sb appears to only occur in trace amounts (n.d. by EMP methods). Nevertheless, some grains of the Pt–Fe alloys yielded essential levels varying from ~0.4 to 1.4 wt.% Sb.
4. Discussion and Conclusions
In summary, we note the following observations:
(1) PGE admixtures (Ir, Rh, and Pd) are typically incorporated into the alloys of composition (Pt, PGE)2–3(Fe, Cu, Ni) in a variety of lode occurrences associated with ore zones and complexes of different types and geologic settings worldwide (Figure 2, Figure 3 and Figure 4). These compositional series extend along and below somewhat the line Σ(Pt + PGE):(Fe + Cu + Ni) = 3, which corresponds to isoferroplatinum.
(2) Generally, minor Cu follows the same pattern of distribution in the Pt–Fe alloys in the lode occurrences (Figure 5), showing a clear tendency of decrease in the values of the ratio Σ(Pt + PGE):(Fe + Cu + Ni), while the Cu content increased. The trend of Cu enrichment in the minerals that are relatively poor in Pt implies their crystallization from relatively fractionated melts at lower temperatures. This trend agrees with observations noted below for the Pt–Fe alloys from placer associations.
(3) Similarly, the Ni admixture enters preferentially in the Pt–Fe alloy, nominally (Pt, PGE)2(Fe, Cu, Ni) in the lode deposits reviewed (Figure 6). One of the suggested possibilities is that Pt2Fe may in fact represent “invisible” mixtures of Pt3Fe and PtFe (≤1 µm in size) that are exsolved upon cooling within the miscibility gap [46]. In contrast, examples of homogeneous Pt2Fe with a disordered fcc structure were documented in [33].
(4) The global-scale sets of EMP data generally display Figure 8-shaped compositional fields in the Pt–Fe diagram, which are based on a large number of compositions of the Pt–Fe minerals from a large variety of placer deposits worldwide (Figure 7). This distribution is likely a reflection of the miscibility gap existing between the ordered Pt3Fe structure (isoferroplatinum) and the disordered structure of native or ferroan platinum.
(5) The patterns of distribution of the admixtures of PGE (Ir, Rh, and Pd) appear to scatter chaotically in the plots of EMP compositions of placer grains of the Pt–Fe alloy minerals. There is no clear relationship observed between the amount of these elements and their values in the ratio Σ(Pt + PGE):(Fe + Cu + Ni). Minerals of the type (Pt, PGE)2–3(Fe, Cu, Ni) were not observed (Figure 8, Figure 9 and Figure 10).
(6) In contrast to the PGE, minor amounts of Cu and Ni admixtures yielded their maximums in alloys of the compositional series (Pt, PGE)2–3(Fe, Cu, Ni) in the placer occurrences (Figure 11 and Figure 12).
(7) The global-scale set of EMP compositions plotted in the Pt–Fe diagram indicates that the linear boundary observed in the overall compositional field is due to an ideal scheme of Pt ↔ Fe substitution (Figure 13a).
(8) Pairs of minor elements, Ir–Rh and Cu–Ni, despite an internal similarity in the observed character of distribution (Figure 2, Figure 3, Figure 8 and Figure 9), displayed incoherent behavior and formed separate trends in terms of the plots of Rh versus Ir and Cu versus Ni.
(9) The two series of solid solutions in the Pt–Fe alloys are based on the Ir-for-Pt and Pd-for-Pt substitutions. The incorporation of Ir is not restricted by the Pt3Fe–Ir3Fe substitution involving components of isoferroplatinum and chengdeite (also, likely their disordered modifications). Besides, Ir0 appears to replace Pt0 in disordered variants of the Pt–Fe alloys, as is implied by the observed pattern (Figure 8). There is a good potential for discovery of a new species of PGM having a Pd-dominant composition, (Pd, Pt)3Fe, most expectedly in association with the mineralized zones of mafic units of alkaline mafic-ultramafic or gabbroic complexes.
(10) The presence of a “field of complicated substitutions” is proposed, which generally extends along the Ir–Pd axis in the Ir–Pd–Rh diagram (Figure 14b). The inferred solid solution extends approximately along the line Ir–(Pd:Rh = 2:3), suggesting that minor Pd enters the solid solution via a coupled scheme of substitution in the combination with Rh.
The “field of complicated substitutions, FCC” (Figure 14b) may likely be a reflection of the crystallochemical differences existing between Pd and Ir, which, at least under normal crystallization conditions, seem to avoid each other, and they do not participate in mutual substitution schemes in all of the PGM species presently known. Only minor substitutions are known, e.g., ~1 wt.% Ir in laflammeite Pd3Pb2S2 [47].
The Pd-for-Rh substitution is not so common; nevertheless, it occurs in the series of solid solution of palladodymite (Pd, Rh)2As—rhodarsenide (Rh, Pd)2As [48,49]. Among the PGE, Pd has the smallest size of the calculated atomic radius, which is a consequence of its outermost electron density deriving predominantly from d-levels, instead of s-levels [50].
(11) Pt–Fe alloys analyzed in situ in the lode deposits display some distinctive features of their compositions relative to the Pt–Fe grains examined in placer associations. As noted, the compositional series (Pt, PGE)2–3(Fe, Cu, Ni) clearly dominates in the lode occurrences of the Pt–Fe alloys from different sources (Figure 2, Figure 3 and Figure 4). In contrast, this series was not as important in the placer occurrences (Figure 8 and Figure 9).
In addition, placer grains of the Pt–Fe alloys generally have large grain-sizes due to crystallization under special conditions in their now-eroded source rocks, a subject extensively debated in the literature that is well-documented and discussed in [51], and references therein.
A large grain-size is known for some Pt–Fe alloy nuggets derived from placers related to Alaskan-type complexes, such as the ~1.5 kg specimens of native ferroan platinum at Kondyor [32] or the crystals exceeding 10 cm across at Nizhniy Tagil [52]. These examples are consistent with the mineral-forming environments rich in volatiles and are likely related to ultramafic-mafic pegmatite facies. For example, at Kondyor, phlogopite-rich late zones rich in PGE are known in the Anomal’nyi area [53].
(12) As an indication of the very large quantity of host Pt-bearing rocks needed to be weathered and eroded to produce tenors found in commercially-viable placers, two publications on the Goodnews Bay placers are relevant [54,55]. Detailed study of the geology and geomorphology showed that Red Mountain is the source rock that has been eroded by 2000 vertical feet over a period of about 20 million years or longer. The amount of eroded rock in this case represents a volume of about 2.4 billion m3 and underlines the huge quantities of weathered and eroded source rocks involved and why large grains are statistically nearly impossible to find microscopically.
(13) There are some compositional features that are generally characteristic of the Pt–Fe alloy minerals hosted by the different types of source rocks, e.g., the trend of Ir-enrichment typically occurs in Alaskan-type complexes, and the strong Pd-enrichment is related with the mineralized rocks of gabbroic compositions in the Coldwell complex.
Based on our observations, we conclude that the Pt–Fe alloys of different origins (Table 1); [51,54,55,56,57,58,59,60] exhibit compositional overlaps that are too large to represent reliable index-minerals to define a provenance or to infer a source rock for detrital grains of Pt–Fe alloys. Nevertheless, the strong Pd enrichment in the Pt–Fe alloys from the lode source related to alkaline gabbroic deposits (e.g., Coldwell), or potentially, to another type of mineralized mafic rock (e.g., Pd-Pt zones in mafic units of layered intrusions), is distinctive and may presumably represent an indicator of provenance if found in detrital deposits.
Author Contributions
The authors wrote the article together.
Funding
A.Y.B. gratefully acknowledges the partial support of this investigation by the Russian Foundation for Basic Research (project # RFBR 16-05-00884 and # RFBR 19-05-00181).
Acknowledgments
We thank M. Economou-Eliopoulos, the editorial staff and three anonymous referees for their suggestions.
Conflicts of Interest
There are no conflicts of interest.
References
- Cabri, L.J.; Feather, C.E. Platinum-iron alloys: A nomenclature based on a study of natural and synthetic alloys. Can. Mineral. 1975, 13, 117–126. [Google Scholar]
- Cabri, L.J.; Rosenzweig, A.; Pinch, W.W. Platinum-group minerals from Onverwacht. I. Pt-Fe-Cu-Ni alloys. Can. Mineral. 1977, 15, 380–384. [Google Scholar]
- Cabri, L.J. (Ed.) The Geology, Geochemistry, Mineralogy, Mineral Beneficiation of the Platinum-Group Elements; Canadian Institute of Mining, Metallurgy and Petroleum: Montreal, QC, Canada, 2002; Volume 54, p. 852. [Google Scholar]
- Cabri, L.J.; Harris, D.C.; Weiser, T.W. Mineralogy and distribution of platinum-group mineral (PGM) placer deposits of the world. Explor. Min. Geol. 1996, 5, 73–167. [Google Scholar]
- Bowles, J.F.W. Platinum-iron alloys, their structural and magnetic characteristics in relation to hydrothermal and low-temperature genesis. Mineral. Petrol. 1990, 43, 37–47. [Google Scholar] [CrossRef]
- Nosé, Y.; Kushida, A.; Ikeda, T.; Nakajima, H.; Tanaka, K.; Numakura, H. Re-examination of Phase Diagram of Fe–Pt System. Mater. Trans. 2003, 44, 2723–2731. [Google Scholar] [CrossRef]
- Bowles, J.F.W.; Suárez, S.; Prichard, H.M.; Fisher, P.C. Weathering of PGE sulfides and Pt–Fe alloys in the Freetown Layered Complex, Sierra Leone. Miner. Depos. 2017, 52, 1127–1144. [Google Scholar] [CrossRef] [Green Version]
- Evstigneeva, T.L. Phases in the Pt-Fe system. Vestnik Otdeleniya nauk o Zemle RAN 2009, 1, 1–2. [Google Scholar]
- Barkov, A.Y.; Fleet, M.E.; Nixon, G.T.; Levson, V.M. Platinum-group minerals from five placer deposits in British Columbia, Canada. Can. Mineral. 2005, 43, 1687–1710. [Google Scholar] [CrossRef]
- Cabri, L.J. Mineralogical Study of Five Samples from a PGE Regolith, Kapalagulu Intrusion, Tanzania; Unpublished Report; Cabri Consulting Inc.: Ottawa, ON, Canada, 2004. [Google Scholar]
- Mostert, A.B.; Hofmeyr, P.K.; Potgieter, G.A. The platinum-group mineralogy of the Merensky Reef at the Impala platinum mines, Bophuthatswana. Econ. Geol. 1982, 77, 1385–1394. [Google Scholar] [CrossRef]
- Rudashevsky, N.S.; Avdontsev, S.N.; Dneprovskaya, M.B. Evolution of PGE mineralization in hortonolitic dunites of the Mooihoek and Onverwacht pipes, Bushveld Complex. Mineral. Petrol. 1992, 47, 37–54. [Google Scholar] [CrossRef]
- Wilhelmij, H.R.; Cabri, L.J. Platinum mineralization in the Kapalagulu Intrusion, western Tanzania. Miner. Depos. 2016, 51, 343–367. [Google Scholar] [CrossRef]
- Cabri, L.J.; Wilhelmij, H.R.; Eksteen, J.J. Contrasting mineralogical and processing potential of two mineralization types in the platinum group element and nickel-bearing Kapalagulu Intrusion, western Tanzania. Ore Geol. Rev. 2017, 90, 772–789. [Google Scholar] [CrossRef]
- Nixon, G.T.; Cabri, L.J.; Laflamme, J.H.G. Platinum-group element mineralization in lode and placer deposits associated with the Tulameen Alaskan type complex, British Columbia. Can. Mineral. 1990, 28, 503–535. [Google Scholar]
- Good, D.J.; Cabri, L.J.; Ames, D.E. PGM Facies variations for Cu–PGE deposits in the Coldwell Alkaline Complex, Ontario, Canada. Ore Geol. Rev. 2017, 90, 748–771. [Google Scholar] [CrossRef]
- Sidorov, E.G.; Kozlov, A.P.; Tolstykh, N.D. The Gal’moenan Basic-Ultrabasic Massif and Its Platinum Potential; Nauchnyi Mir Publisher: Moscow, Russia, 2012; p. 288. (In Russian) [Google Scholar]
- Nekrasov, I.Y.; Lennikov, A.M.; Zalishchak, B.L.; Oktyabrsky, R.A.; Ivanov, V.V.; Sapin, V.I.; Taskaev, V.I. Compositional variations in platinum-group minerals and gold, Konder alkaline-ultrabasic massif, Aldan Shield, Russia. Can. Mineral. 2005, 43, 637–654. [Google Scholar] [CrossRef]
- Augé, T.; Genna, A.; Legendre, O.; Ivanov, K.S.; Volchenko, Y.A. Primary Platinum Mineralization in the Nizhny Tagil and Kachkanar Ultramafic Complexes, Urals, Russia: A Genetic Model for PGE Concentration in Chromite-Rich Zones. Econ. Geol. 2005, 100, 707–732. [Google Scholar] [CrossRef]
- Zaccarini, F.; Garuti, G.; Pushkarev, E.; Thalhammer, O. Origin of Platinum-Group Minerals (PGM) Inclusions in Chromite Deposits of the Urals. Minerals 2018, 8, 379. [Google Scholar] [CrossRef]
- Cabri, L.J. Electro-Hydraulic (EH) Crushing and Hydroseparation (HS) Concentration of Three Samples from Yubdo, Ethiopia; Unpublished CNT-MC report 2007-3; CNT-MC Inc.: Ottawa, ON, Canada, 2007; 40p. [Google Scholar]
- Barkov, A.Y.; Martin, R.F.; LeBarge, W.; Fedortchouk, Y. Grains of Pt-Fe alloy and inclusions in a Pt-Fe alloy from Florence creek, Yukon, Canada: Evidence for mobility of Os in a Na-H2O-Cl-rich fluid. Can. Mineral. 2008, 46, 343–360. [Google Scholar] [CrossRef]
- Barkov, A.Y.; Martin, R.F.; Fleet, M.E.; Nixon, G.T.; Levson, V.M. New data on associations of platinum-group minerals in placer deposits of British Columbia, Canada. Mineral. Petrol. 2007, 92, 9–29. [Google Scholar] [CrossRef]
- Laflamme, J.H.G. Mineralogical Study of Platinum-Group Minerals from Au-Pt-Bearing Placer Samples from British Columbia; Report MMSL 02-038(CR): Appendix “Electron Microprobe Data”; CANMET Mining and Mineral Sciences Laboratories: Ottawa, ON, Canada, 2002; pp. A-1–A-19. [Google Scholar]
- Fedortchouk, Y.; LeBarge, W.; Barkov, A.Y.; Fedele, L.; Bodnar, R.J.; Martin, R.F. Platinum-group minerals from a placer deposit in Burwash creek, Kluane area, Yukon Territory, Canada. Can. Mineral. 2010, 48, 583–596. [Google Scholar] [CrossRef]
- Tolstykh, N.D.; Foley, J.Y.; Sidorov, E.G.; Laajoki, K.V.O. Composition of the platinum-group minerals in the Salmon River placer deposit, Goodnews bay, Alaska. Can. Mineral. 2002, 40, 463–471. [Google Scholar] [CrossRef]
- Barkov, A.Y.; Martin, R.F.; Shi, L.; Feinglos, M.N. New data on PGE alloy minerals from a very old collection (probably 1890s), California. Am. Miner. 2008, 93, 1574–1580. [Google Scholar] [CrossRef]
- Gornostayev, S.S.; Crocket, J.H.; Mochalov, A.G.; Laajoki, K.V.O. The Platinum-Group Minerals of the Baimka Placer Deposits, Aluchin Horst, Russian Far East. Can. Mineral. 1999, 37, 1117–1129. [Google Scholar]
- Airiyants, E.V.; Zhmodik, S.M.; Ivanov, P.O.; Belyanin, D.K.; Agafonov, L.V. Mineral inclusions in Fe-Pt solid solution from the alluvial ore occurrences of the Anabar basin (northeastern Siberian Platform). Russ. Geol. Geophys. 2014, 55, 945–958. [Google Scholar] [CrossRef]
- Sidorov, E.G.; Tolstykh, N.D.; Podlipsky, M.Yu.; Pakhomov, I.O. Placer PGE minerals from the Filippa clinopyroxenite-dunite massif (Kamchatka). Russ. Geol. Geophys. 2004, 45, 1080–1097. [Google Scholar]
- Barkov, A.Y.; Shvedov, G.I.; Silyanov, S.A.; Martin, R.F. Mineralogy of Platinum-Group Elements and Gold in the Ophiolite-Related Placer of the River Bolshoy Khailyk, Western Sayans, Russia. Minerals 2018, 8, 247. [Google Scholar] [CrossRef]
- Cabri, L.J.; Laflamme, J.H.G. Platinum-group minerals from the Konder massif, Russian Far East. Mineral. Rec. 1997, 28, 97–106. [Google Scholar]
- Malitch, K.N.; Thalhammer, O.A.R. Pt-Fe nuggets derived from clinopyroxenite-dunite massifs, Russia: A structural, compositional and osmium-isotope study. Can. Mineral. 2002, 40, 395–418. [Google Scholar] [CrossRef]
- Tolstykh, N.D.; Sidorov, E.G.; Laajoki, K.V.O.; Krivenko, A.P.; Podlipskiy, M. The association of platinum-group minerals in placers of the Pustaya River, Kamchatka, Russia. Can. Mineral. 2000, 38, 1251–1264. [Google Scholar] [CrossRef]
- Barkov, A.Y.; Shvedov, G.I.; Martin, R.F. PGE–(REE–Ti)-rich micrometer-sized inclusions, mineral associations, compositional variations, and a potential lode source of platinum-group minerals in the Sisim Placer Zone, Eastern Sayans, Russia. Minerals 2018, 8, 181. [Google Scholar] [CrossRef]
- Krivenko, A.P.; Tolstykh, N.D.; Nesterenko, G.V.; Lazareva, E.V. Types of mineral assemblages of platinum metals in auriferous placers of the Altai-Sayan region. Russ. Geol. Geophys. 1994, 35, 58–65. [Google Scholar]
- Zhmodik, S.M.; Nesterenko, G.V.; Airiyants, E.V.; Belyanin, D.K.; Kolpakov, V.V.; Podlipsky, M.Y.; Karmanov, N.S. Alluvial platinum—Group minerals as indicators of primary PGE mineralization (placers of southern Siberia). Russ. Geol. Geophys. 2016, 57, 1437–1464. [Google Scholar] [CrossRef]
- Zaccarini, F.; Pushkarev, E.; Garuti, G.; Krause, J.; Dvornik, G.P.; Stanley, C.; Bindi, L. Platinum–group minerals (PGM) nuggets from alluvial—Eluvial placer deposits in the concentrically zoned mafic-ultramafic Uktus complex (Central Urals, Russia). Eur. J. Miner. 2013, 25, 519–531. [Google Scholar] [CrossRef]
- Johan, Z.; Ohnenstetter, M.; Fischer, M.; Amossé, J. Platinum-Group Minerals from the Durance River Alluvium, France. Mineral. Petrol. 1990, 42, 287–306. [Google Scholar] [CrossRef]
- Augé, T.; Legendre, O. Pt-Fe nuggets from alluvial deposits in eastern Madagascar. Can. Mineral. 1992, 30, 983–1004. [Google Scholar]
- Oberthür, T.; Weiser, T.W.; Melcher, F.; Gast, L.; Wöhrl, C. Detrital platinum-group minerals in rivers draining the Great Dyke, Zimbabwe. Can. Mineral. 2013, 51, 197–222. [Google Scholar] [CrossRef]
- Oberthür, T.; Melcher, F.; Gast, L.; Wöhrl, C.; Lodziak, J. Detrital platinum-group minerals in rivers draining the eastern Bushveld complex, South Africa. Can. Mineral. 2004, 42, 563–582. [Google Scholar] [CrossRef]
- Melcher, F.; Oberthür, T.; Lodziak, J. Modification of detrital platinum-group minerals from the eastern Bushveld complex, South Africa. Can. Mineral. 2005, 43, 1711–1734. [Google Scholar] [CrossRef]
- Yu, Z. Chengdeite—An ordered natural iron-iridium alloy. Dizhi Xuebao 1995, 69, 215–220. (In Chinese) [Google Scholar]
- Bose, S.K.; Kudrnovsky, J.; van Schilfgaarde, M.; Blöchl, P.; Jepsen, O.; Methfessel, M.; Paxton, A.T.; Andersen, O.K. Electronic structure of ordered and disordered Pd3Fe. J. Magn. Magn. Mater. 1990, 87, 97–105. [Google Scholar] [CrossRef]
- Zhernovsky, I.V.; Mochalov, A.G.; Rudashevsky, N.S. Phase inhomogeneity of isoferroplatinum enriched in iron. Dokl. Akad. Nauk SSSR 1985, 283, 196–200. (In Russian) [Google Scholar]
- Barkov, A.Y.; Martin, R.F.; Halkoaho, T.A.A.; Criddle, A.J. Laflammeite, Pd3Pb2S2, a new platinum-group mineral species from the Penikat layered complex, Finland. Can. Mineral. 2002, 40, 671–678. [Google Scholar] [CrossRef]
- Tarkian, M.; Krstić, S.; Klaska, K.-H.; Ließmann, W. Rhodarsenide, (Rh, Pd)2As, a new mineral. Eur. J. Mineral. 1997, 9, 1321–1326. [Google Scholar] [CrossRef]
- Britvin, S.N.; Rudashevskiy, N.S.; Bogdanova, A.N.; Shcherbachev, D.K. Palladodymite (Pd,Rh)2As—A new mineral from placer in Miass River, Urals. Zap. Vseross. Mineral. Obshch. 1999, 128, 39–42. (In Russian) [Google Scholar]
- Rahm, M.; Hoffmann, R.; Ashcroft, N.W. Atomic and Ionic Radii of Elements 1–96. Chem. Eur. J. 2016, 22, 14625–14632. [Google Scholar] [CrossRef]
- Oberthür, T. The Fate of Platinum-Group Minerals in the Exogenic Environment—From Sulfide Ores via Oxidized Ores into Placers: Case Studies Bushveld Complex, South Africa, and Great Dyke, Zimbabwe. Minerals 2018, 8, 581. [Google Scholar] [CrossRef]
- Weiser, T.W. Platinum-Group Minerals (PGM) from placer deposits in the mineral collection of the Museum of Natural History, Vienna, Austria. Ann. Naturhist. Mus. Wien 2004, 105A, 1–28. [Google Scholar]
- Barkov, A.Y.; Shvedov, G.I.; Polonyankin, A.A.; Martin, R.F. New and unusual Pd-Tl-bearing mineralization in the Anomal’nyi deposit, Kondyor concentrically zoned complex, northern Khabarovskiy kray, Russia. Mineral. Mag. 2017, 81, 679–688. [Google Scholar] [CrossRef]
- Mertie, J.B., Jr. The Goodnews platinum deposits Alaska. U.S. Geol. Survey 1940, 918, 97. [Google Scholar]
- Mertie, J.B., Jr. Platinum deposits of the Goodnews Bay District Alaska. U.S. Geol. Survey 1976, 938, 42. [Google Scholar]
- O’Driscoll, B.; González-Jiménez, J.M. Petrogenesis of the Platinum-Group Minerals. Rev. Mineral. Geochem. 2015, 81, 489–578. [Google Scholar] [CrossRef] [Green Version]
- Garuti, G.; Pushkarev, E.V.; Zaccarini, F. Composition and paragenesis of Pt alloys from chromitites of the Uralian Alaskan-type Kytlym and Uktus complexes, northern and central Urals, Russia. Can. Mineral. 2002, 40, 357–376. [Google Scholar] [CrossRef]
- Ohnenstetter, M. Platinum group element enrichment in the upper mantle peridotites of the Monte Maggiore ophiolitic massif (Corsica, France): Mineralogical evidence for ore-fluid metasomatism. Mineral. Petrol. 1992, 46, 85–107. [Google Scholar] [CrossRef]
- Tolstykh, N.; Kozlov, A.; Telegin, Yu. Platinum mineralization of the Svetly Bor and Nizhny Tagil intrusions, Ural Platinum Belt. Ore Geol. Rev. 2015, 67, 234–243. [Google Scholar] [CrossRef]
- Stepanov, S.Y.; Malitch, K.N.; Kozlov, A.V.; Badanina, I.Y.; Antonov, A.V. Platinum group element mineralization of the Svetly Bor and Veresovy Bor clinopyroxenite–dunite massifs, Middle Urals, Russia. Geol. Ore Depos. 2017, 59, 244–255. [Google Scholar] [CrossRef]
Figure 1.
Compositional variations in the Pt–Fe alloy minerals from lode deposits associated with various complexes; contents of Pt plotted versus Fe are expressed in weight percent.
Figure 1.
Compositional variations in the Pt–Fe alloy minerals from lode deposits associated with various complexes; contents of Pt plotted versus Fe are expressed in weight percent.

Figure 2.
Plot of the values of the Σ(Pt + PGE):(Fe + Cu + Ni) ratio (in atomic %) versus the contents of Ir expressed in weight % in compositions of the Pt–Fe alloy minerals from various lode deposits. The symbols and sources used are the same as the ones shown in Figure 1 and listed Table 1. The dotted line displays the stoichiometry (Pt, PGE)3(Fe, Cu, Ni).

Figure 3.
Plot of the values of the Σ(Pt + PGE):(Fe + Cu + Ni) ratio (in atomic %) versus contents of Rh expressed in weight % in compositions of the Pt–Fe alloy minerals from various lode deposits. The symbols and sources used are the same as the ones shown in Figure 1 and listed in Table 1.
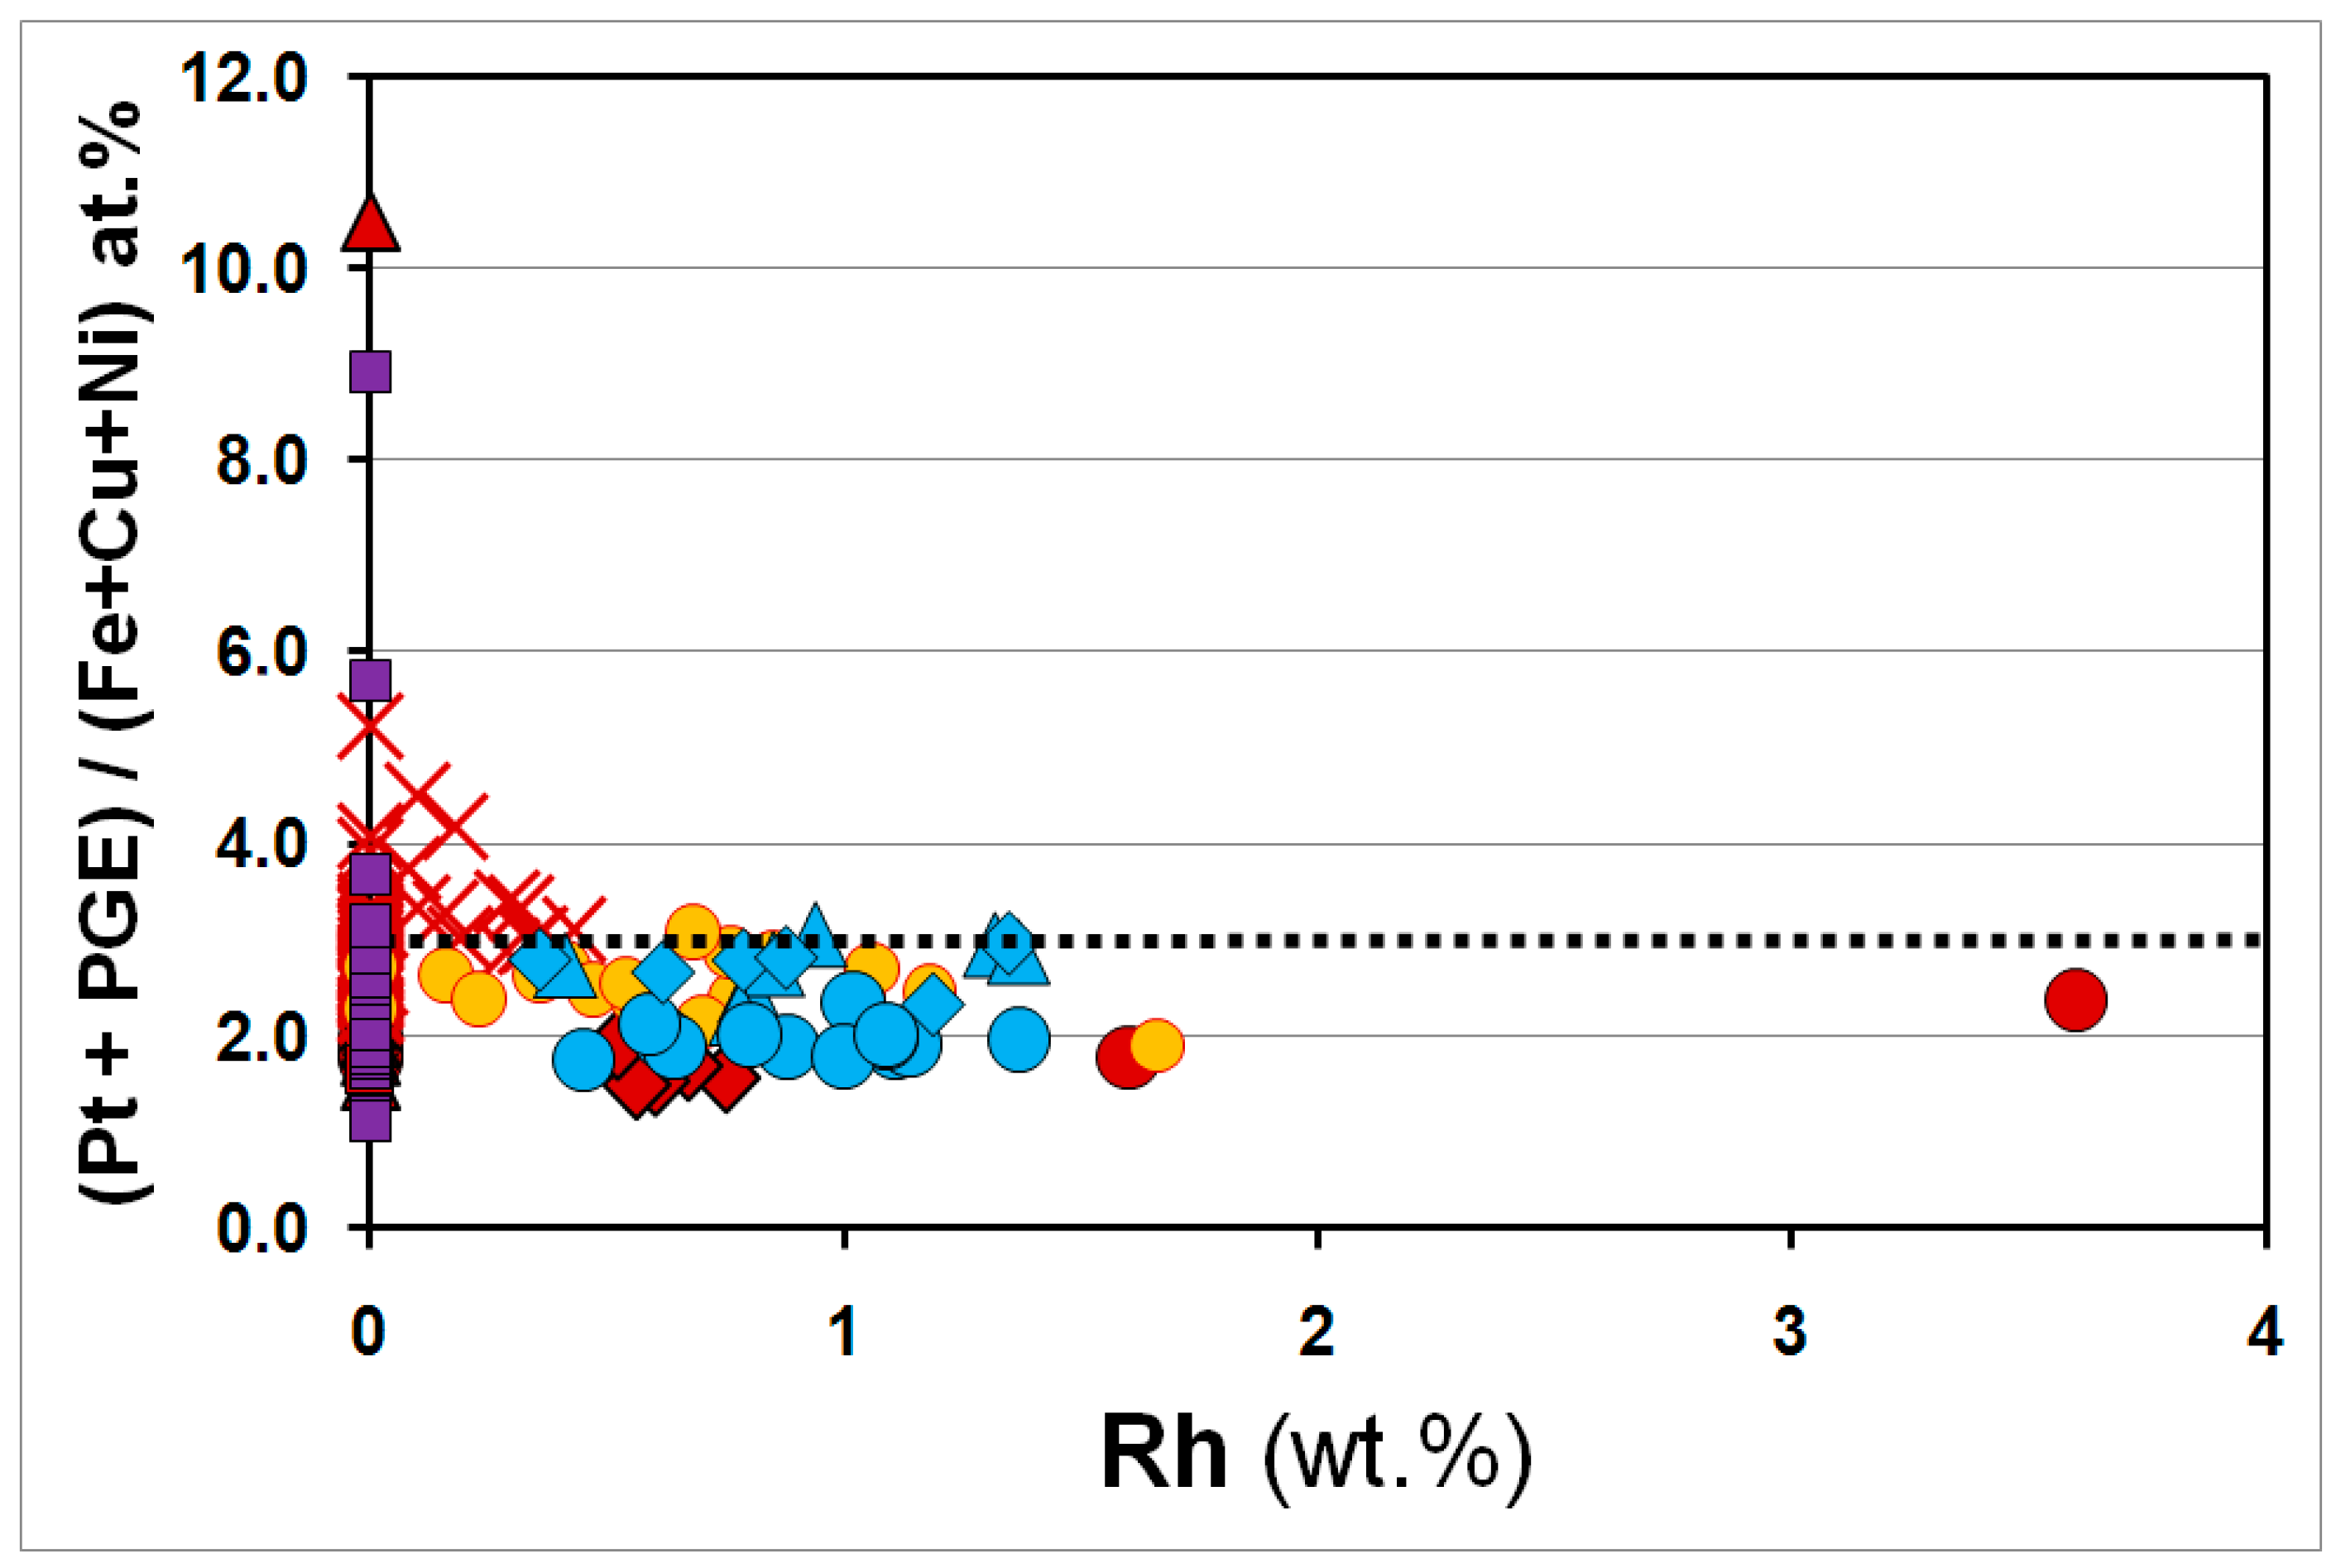
Figure 4.
Plot of the values of the Σ(Pt + PGE):(Fe + Cu + Ni) ratio (in atomic %) versus contents of Pd expressed in weight % in compositions of the Pt–Fe alloy minerals from various lode deposits. The symbols and sources used are the same as the ones shown in Figure 1 and listed in Table 1.

Figure 5.
Plot of the values of the Σ(Pt + PGE):(Fe + Cu + Ni) ratio (in atomic %) versus contents of Cu expressed in weight % in compositions of the Pt–Fe alloy minerals from various lode deposits. The symbols and sources used are the same as the ones shown in Figure 1 and listed in Table 1.

Figure 6.
Plot of the values of the Σ(Pt + PGE):(Fe + Cu + Ni) ratio (in atomic %) versus contents of Ni expressed in weight % in compositions of the Pt–Fe alloy minerals from various lode deposits. The symbols and sources used are the same as the ones shown in Figure 1 and listed in Table 1.

Figure 7.
Pt versus Fe diagram (in weight %) showing the compositional distribution of the Pt–Fe alloy minerals from placer deposits worldwide, which are listed in Table 1.
Figure 7.
Pt versus Fe diagram (in weight %) showing the compositional distribution of the Pt–Fe alloy minerals from placer deposits worldwide, which are listed in Table 1.

Figure 8.
Plot of the values of the Σ(Pt + PGE):(Fe + Cu + Ni) ratio (in atomic %) versus contents of Ir expressed in weight % in compositions of the Pt–Fe alloy minerals from various placer deposits. The symbols and sources used are the same as the ones shown in Figure 7 and listed in Table 1.

Figure 9.
Plot of the values of the Σ(Pt + PGE):(Fe + Cu + Ni) ratio (in atomic %) versus contents of Rh expressed in weight % in compositions of the Pt–Fe alloy minerals from various placer deposits. The symbols and sources used are the same as the ones shown in Figure 7 and listed Table 1.

Figure 10.
Plot of the values of the Σ(Pt + PGE):(Fe + Cu + Ni) ratio (in atomic %) versus contents of Pd expressed in weight % in compositions of the Pt–Fe alloy minerals from various placer deposits. The symbols and sources used are the same as the ones shown in Figure 7 and listed in Table 1.

Figure 11.
Plot of the values of the Σ(Pt + PGE):(Fe + Cu + Ni) ratio (in atomic %) versus contents of Cu expressed in weight % in compositions of the Pt–Fe alloy minerals from various placer deposits. The symbols and sources used are the same as the ones shown in Figure 7 and listed in Table 1.

Figure 12.
Plot of the values of the Σ(Pt + PGE):(Fe + Cu + Ni) ratio (in atomic %) versus contents of Ni expressed in weight % in compositions of the Pt–Fe alloy minerals from various placer deposits. The symbols and sources used are the same as the ones shown in Figure 7 and listed in Table 1.

Figure 13.
Plot of the contents of Pt. versus Fe (a), Pt. versus Ir (b), Pt versus Pd (c), and Pt versus Cu (d), all expressed in values of atomic %, in EMP compositions of Pt–Fe alloy minerals. A total of 2430 point analyses (n = 2430) are plotted, which pertain to a large variety of occurrences (Table 1).
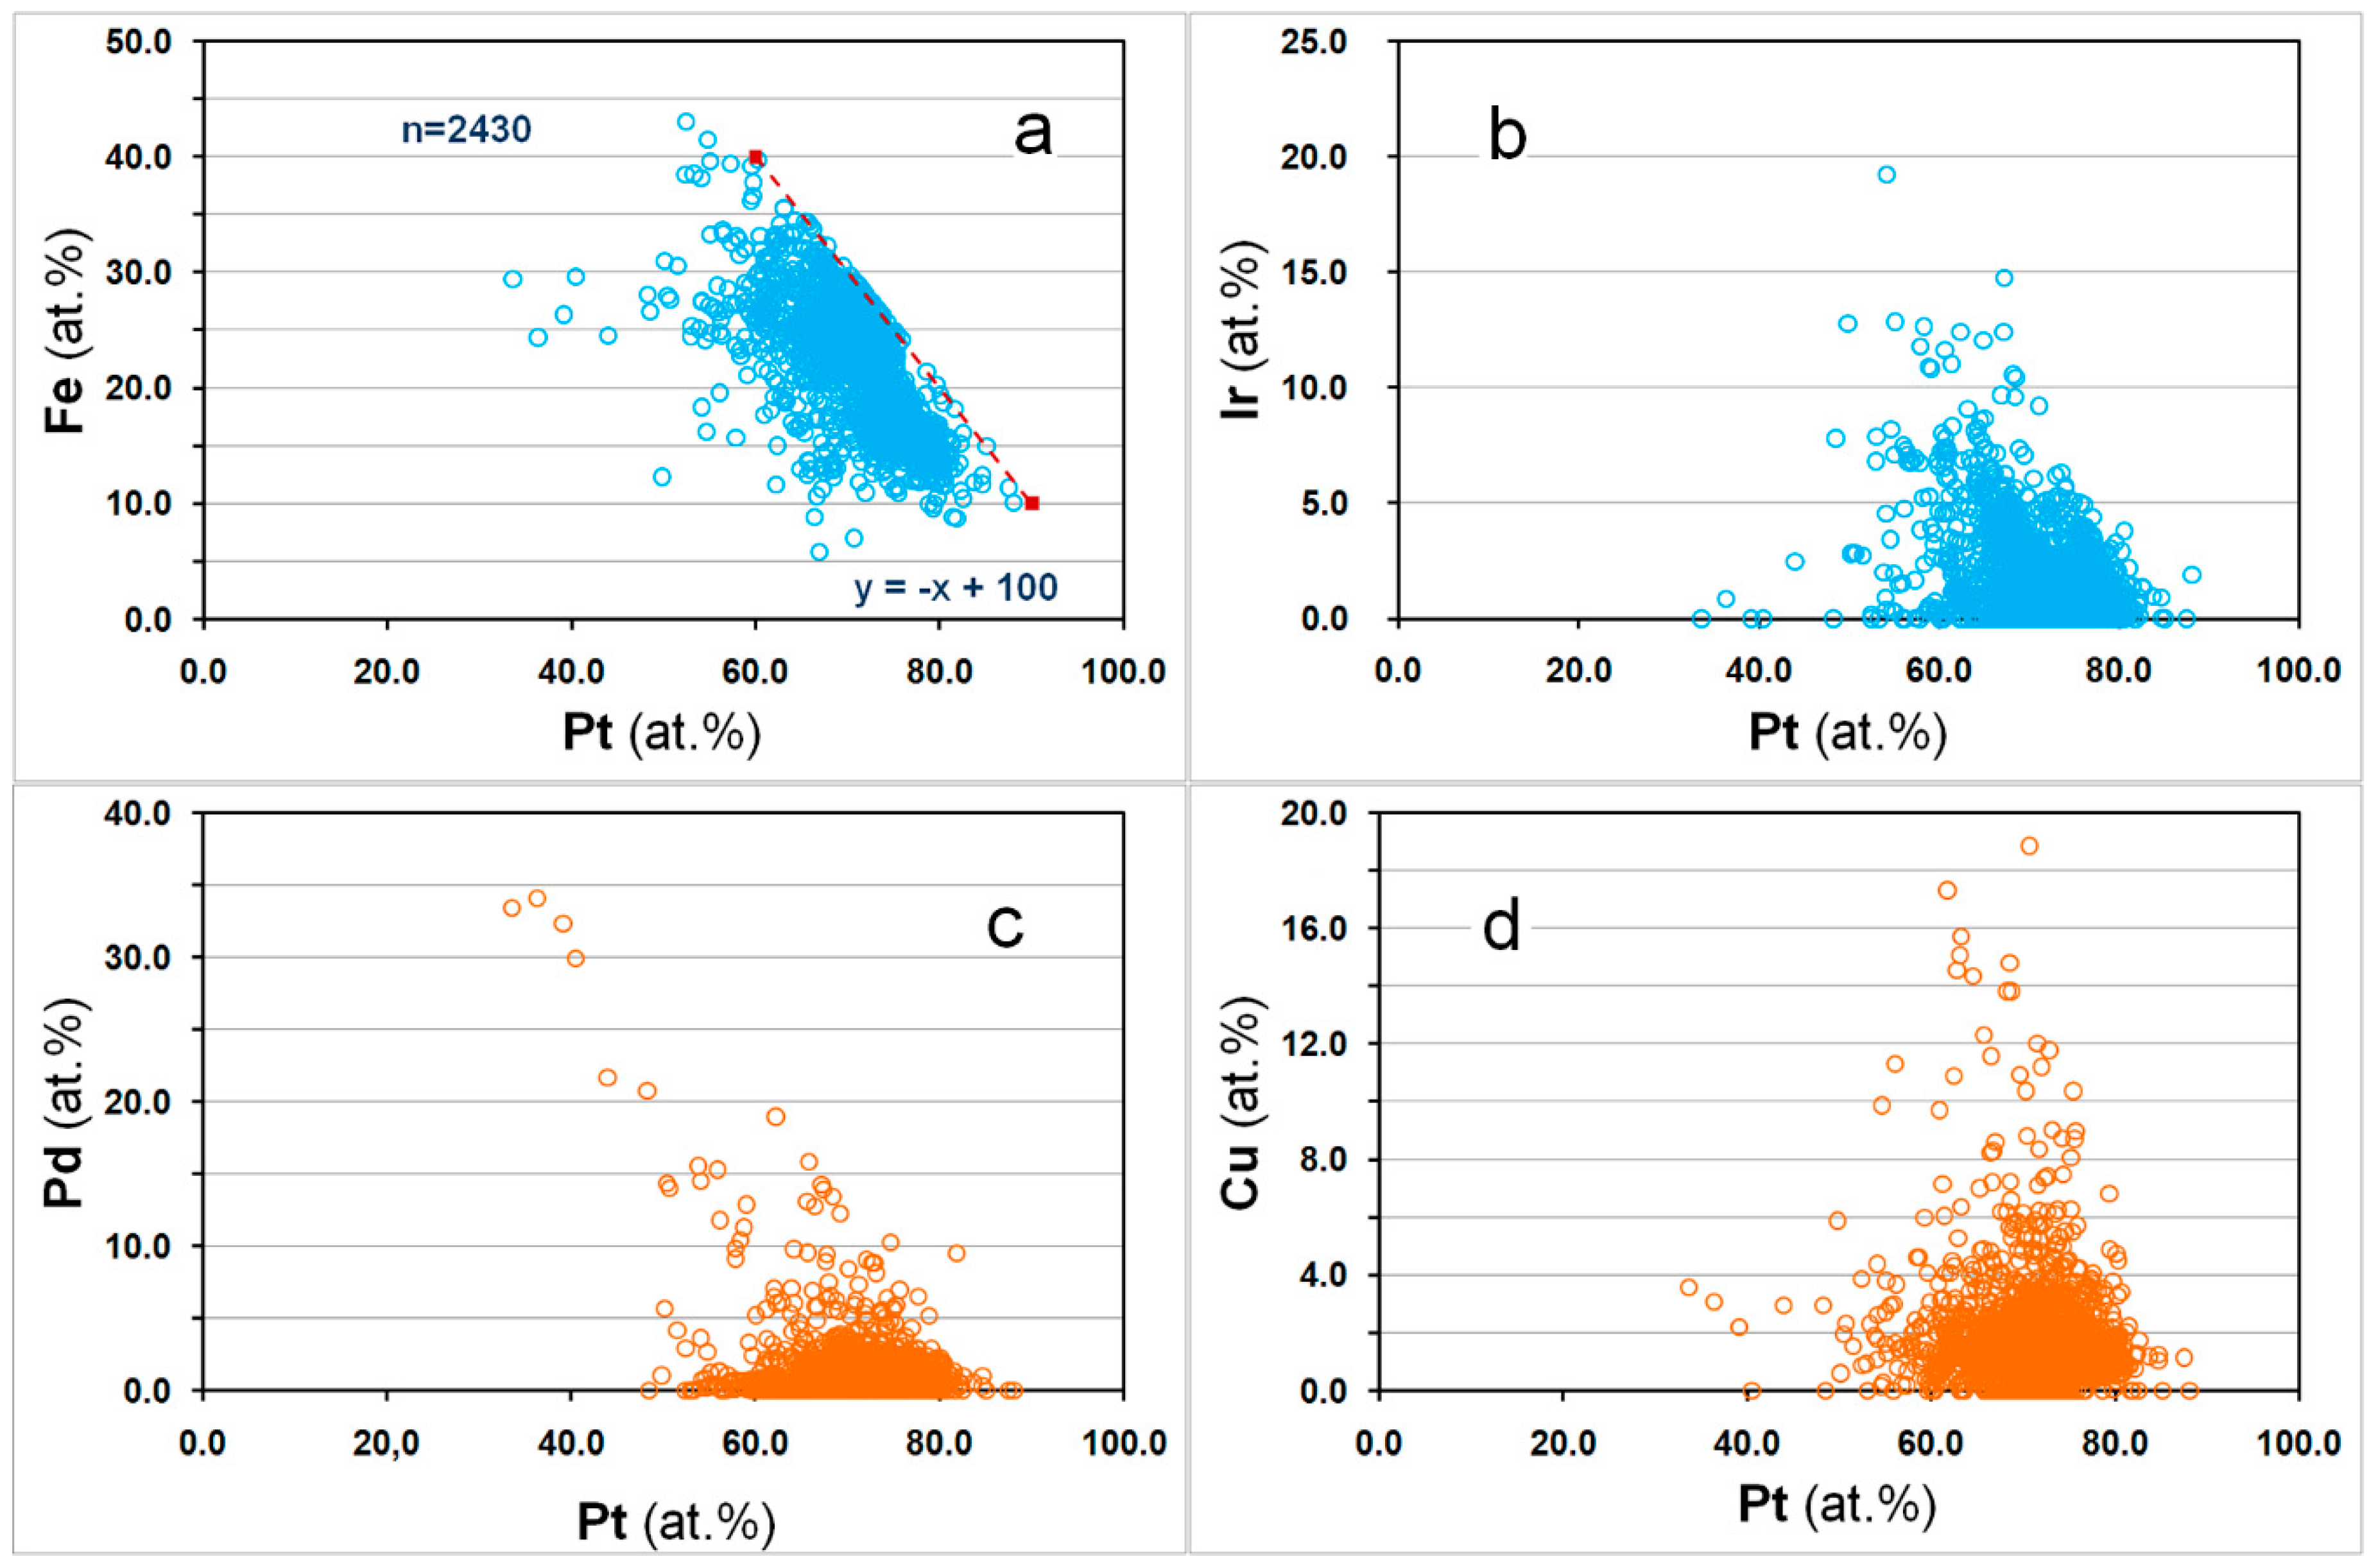
Figure 14.
Ternary diagrams of Pt–Pd–Ir (a) and Ir–Pd–Rh (b) showing atomic proportions of these elements in EMP compositions of the Pt–Fe alloy minerals from numerous localities (Table 1). The total number of point analyses is 2430 (a) and 2325 (b). FCS is the inferred “field of complicated substitutions”; see text for discussion.

Table 1.
Worldwide occurrences of Pt–Fe alloy minerals involved in the present review.
| Number of Data-Points (N) | Reference | ||
|---|---|---|---|
| Lode Deposits | |||
| 1 | Dunite pipes and Merensky Reef; Bushveld Layered Complex; South Africa | 9 | [2,11,12] |
| 2 | Kapalagulu Layered Intrusion; western Tanzania | 9 | [10,13,14] |
| 3 | Tulameen Alaskan-type Complex; British Columbia; Canada | 6 | [15] |
| 4 | Coldwell Alkaline Complex; Ontario; Canada | 10 | [16] |
| 5 | Gal’moenan Mafic-Ultramafic Complex; Koryak Upland; Kamchatka krai; Russia | 70 | [17] |
| 6 | Kondyor concentrically zoned Alkaline Ultramafic Complex, northern Khabarovskiy krai; Aldan Shield; Russia | 19 | [18] |
| 7 | Kachkanar Alaskan -Uralian-type Ultramafic Complex; Urals; Russia | 7 | [19] |
| 8 | Nizhniy Tagil Alaskan -Uralian-type Ultramafic Complex; Urals; Russia | 13 | [19] |
| 9 | Ophiolitic Chromitites; Uktus and Kytlym areas; central Urals; Russia | 6 | [20] |
| 10 | Saprolite after mineralized dunite weathered; Yubdo; Ethiopia | 83 | [21] |
| Placer Deposits | |||
| 11 | Placers of North Saskatchewan River; Alberta; Canada | 295 | [4] |
| 12 | Similkameen-Tulameen River System; British Columbia; Canada | 18 | [4,15] |
| 13 | Placers of Liard River; Northwest Territories; Canada | 196 | [4] |
| 14 | Placers of Saskatchewan River; Saskatchewan; Canada | 18 | [4] |
| 15 | Florence Creek; Yukon; Canada | 35 | [4,22] |
| 16 | Au-PGE placer deposits; British Columbia; Canada | 77 | [9,23] |
| 17 | Detrital grains from McConnell Stream; Dease Stream; Birch Stream; British Columbia; Canada | 99 | [24] |
| 18 | Detrital grains; Burwash Creek; Kluane area; Yukon; Canada | 15 | [25] |
| 19 | Fox Gulch; Alaska; USA | 2 | [4] |
| 20 | Salmon River Placer; Goodnews bay; Alaska; USA | 29 | [26] |
| 21 | Detrital grains from Trinity County; California; USA | 4 | [4,27] |
| 22 | Syssert Placer Zone; Omutnaya River; Urals; Russia | 6 | [4] |
| 23 | Placers from Nizhniy Tagil; Kushvinskiy and Nevyansk areas; Urals; Russia | 137 | [4] |
| 24 | Placers; western Chukotka; Russia | 47 | [4,28] |
| 25 | Placers; Anabar basin; northeastern Siberian Platform; Russia | 3 (mean of 105) | [29] |
| 26 | Placers derived from Filippa clinopyroxenite-dunite complex; Kamchatka; Russia | 43 | [30] |
| 27 | Placer of River Bolshoy Khailyk; western Sayans; Russia | 10 | [31] |
| 28 | Placer derived from Kondyor Alkaline Ultramafic Complex; northern Khabarovskiy krai; Russia | 14 | [32] |
| 29 | Placers associated with Kondyor, Inagli and Guli concentrically zoned Complexes; northeastern Russia | 13 | [33] |
| 30 | Placer at Pustaya River; Kamchatka; Russia | 15 | [34] |
| 31 | Sisim Placer Zone; eastern Sayans; Russia | 19 | [35] |
| 32 | Placer at River Ko; eastern Sayans; Russia | 17 | [36] |
| 33 | Placers of southern Siberia; Russia | 20 | [37] |
| 34 | Placers associated with concentrically zoned Uktus complex; central Urals; Russia | 4 | [38] |
| 35 | Placers from Rio Condoto area; Chocó; Colombia | 461 | [4] |
| 36 | Placers from Santiago River area; Esmeraldas Province; Ecuador | 104 | [4] |
| 37 | Placers at Yubdo; Ethiopia | 5 | [4] |
| 38 | Placers at Riam Kanan; South Kalimantan; Indonesia | 51 | [4] |
| 39 | Placers of Borneo; Sabah Province; Malaysia | 20 | [4] |
| 40 | Placers from Papua New Guinea | 6 | [4] |
| 41 | Placer of Ortakale River; Kars Province; Turkey | 3 | [4] |
| 42 | Placers of Transvaal and Orange Free State; South Africa | 24 | [4] |
| 43 | Placers of Tasmania; Australia | 9 | [4] |
| 44 | Placers from Itabira; Brazil | 5 | [4] |
| 45 | Placers of Chindwin River; Burma | 315 | [4] |
| 46 | Durance River; France | 5 | [39] |
| 47 | Placers of eastern Madagascar | 18 | [40] |
| 48 | Placers of rivers draining Great Dyke; Zimbabwe | 3 | [41] |
| 49 | Placers of rivers draining eastern Bushveld complex; South Africa | 7 | [42,43] |
© 2019 by the authors. Licensee MDPI, Basel, Switzerland. This article is an open access article distributed under the terms and conditions of the Creative Commons Attribution (CC BY) license (http://creativecommons.org/licenses/by/4.0/).
Share and Cite
MDPI and ACS Style
Barkov, A.Y.; Cabri, L.J. Variations of Major and Minor Elements in Pt–Fe Alloy Minerals: A Review and New Observations. Minerals 2019, 9, 25. https://doi.org/10.3390/min9010025
AMA Style
Barkov AY, Cabri LJ. Variations of Major and Minor Elements in Pt–Fe Alloy Minerals: A Review and New Observations. Minerals. 2019; 9(1):25. https://doi.org/10.3390/min9010025
Chicago/Turabian StyleBarkov, Andrei Y., and Louis J. Cabri. 2019. "Variations of Major and Minor Elements in Pt–Fe Alloy Minerals: A Review and New Observations" Minerals 9, no. 1: 25. https://doi.org/10.3390/min9010025
Note that from the first issue of 2016, this journal uses article numbers instead of page numbers. See further details here.