Article

Mineralogical and Geochemical Signatures of Metalliferous Sediments in Wocan-1 and Wocan-2 Hydrothermal Sites on the Carlsberg Ridge, Indian Ocean

1
Department of Marine Science, Ocean College, Zhejiang University, Zhoushan 316021, China
2
Key Laboratory of Submarine Geosciences, Second Institute of Oceanography, State Oceanic Administration, Hangzhou 310012, China
3
Nigerian Institute for Oceanography and Marine Research, Lagos, P.M.B 12729, Nigeria
*
Author to whom correspondence should be addressed.
Minerals 2019, 9(1), 26; https://doi.org/10.3390/min9010026
Submission received: 28 November 2018 / Revised: 25 December 2018 / Accepted: 27 December 2018 / Published: 4 January 2019
(This article belongs to the Special Issue Deep-Sea Minerals and Gas Hydrates)

Abstract

:
In this paper, we conduct a comparative study on the mineralogy and geochemistry of metalliferous sediment collected near the active hydrothermal site (Wocan-1) and inactive hydrothermal site (Wocan-2) from Wocan Hydrothermal Field, on the Carlsberg Ridge (CR), northwest Indian Ocean. We aim to understand the spatial variations in the primary and post-depositional conditions and the intensity of hydrothermal circulations in the Wocan hydrothermal systems. Sediment samples were collected from six stations which includes TVG-07, TVG-08 (Wocan-1), TVG-05, TVG-10 (Wocan-2), TVG-12 and TVG-13 (ridge flanks). The mineralogical investigations show that sediment samples from Wocan-1 and Wocan-2 are composed of chalcopyrite, pyrite, sphalerite, barite, gypsum, amorphous silica, altered volcanic glass, Fe-oxides, and hydroxides. The ridge flank sediments are dominated by biogenic calcite and foraminifera assemblages. The bulk sediment samples of Wocan-1 have an elevated Fe/Mn ratio (up to ~1545), with lower U contents (<7.4 ppm) and U/Fe ratio (<~1.8 × 10⁻⁵). The sulfide separates (chalcopyrite, pyrite, and sphalerite) are enriched in Se, Co, As, Sb, and Pb. The calculated sphalerite precipitation temperature (Sph.PT) yields ~278 °C. The sulfur isotope (δ34S) analysis returned a light value of 3.0–3.6‰. The bulk sediment samples of Wocan-2 have a lower Fe/Mn ratio (<~523), with high U contents (up to 19.6 ppm) and U/Fe ratio (up to ~6.2 × 10⁻⁵). The sulfide separates are enriched in Zn, Cu, Tl, and Sn. The calculated Sph.PT is ~233 °C. The δ34S returned significant values of 4.1–4.3‰ and 6.4–8.7‰ in stations TVG-10 and TVG-05, respectively. The geochemical signatures (e.g., Fe/Mn and U/Fe ratio, mineral chemistry of sulfides separates, and S-isotopes and Sph.PT) suggest that sediment samples from Wocan-1 are located near intermediate–high temperature hydrothermal discharge environments. Additionally, relatively low δ34S values exhibit a lower proportion (less than 20%) of seawater-derived components. The geochemical signatures suggest that sediment samples from Wocan-2 has undergone moderate–extensive oxidation and secondary alterations by seawater in a low–intermediate temperature hydrothermal environments. Additionally, the significant δ34S values of station TVG-05 exhibit a higher estimated proportion (up to 41%) of seawater-derived components. Our results showed pervasive hydrothermal contributions into station TVG-08 relative to TVG-07, it further showed the increased process of seafloor weathering at TVG-05 relative to TVG-10.

Graphical Abstract

1. Introduction

Seafloor hydrothermal circulations at the mid-ocean ridges are essential process that controls the heat and chemical exchange from the interior of the earth to the ocean [1,2,3]. The depth of hydrothermal fluid penetration, circulation, the axial magma chamber, and the intensity of tectonic activities generally increases with a decreasing spreading rate [4,5,6]. Massive sulfides and metalliferous sediments are one of the manifestations of these hydrothermal activities [5,7,8,9,10]. The sediments in the vicinity of active high-temperature hydrothermal fields are liable to act as a sink for leached metals from the underlying host rocks, which reflect the composition and temperature of discharged hydrothermal fluid [11,12]. They are characterized by distinct mineralogy and geochemical signatures in comparison to pelagic sediments [13]. After the cessation of high-temperature hydrothermal fluid discharge, the post-depositional seafloor weathering would occur when the sulfides are in contact with the oxygenated seawater, causing the collapse of hydrothermal chimneys and the formation of sulfide mounds. Therefore, the spatial distribution of surface hydrothermal sediment can reflect the intensity and position of hydrothermal activities of an active hydrothermal field [11], as well as the post-depositional processes and history of an inactive hydrothermal field.
The Wocan Hydrothermal Field (WHF) was discovered at 6°22′ N/60°31′ E on the Carlsberg Ridge, northwest Indian Ocean, during the Chinese Dayang (DY) 28th cruise [14] and re-visited in 2017 by manned submersible Jiaolong [15]. It is a basalt-hosted hydrothermal field formed on a neo-volcanic ridge [14]. Wocan-1 is an active hydrothermal site in the water depth ~3000 m, and Wocan-2 is an inactive hydrothermal site in the water depth ~3200 m. Wocan-2 is situated at ~2.7 km northwest of Wocan-1 (Figure 1A,B). The geological settings of the WHF, the mineralogy, and geochemistry of massive sulfides from Wocan-1 and Wocan-2 sites have previously been described by Wang et al. (2017) [14]. Additionally, Reference [14], reported the occurrence of hydrothermal plume particles that are enriched in Cu concentration (>1 wt. %), from bottom moored sediment traps near the Wocan-1 site, as an indication of an active high-temperature hydrothermal system. Moreover, an inactive toppled sulfide chimney around Wocan-2 site was used to portray previous widespread venting [14]. However, mineralogical and geochemical studies on sediments near Wocan-1 and Wocan-2 hydrothermal sites have not been conducted. Studies on this distinct sediment often serve as an indicator of the probable proximity and location of sampling stations to hydrothermal vents, and past information on secondary processes in a hydrothermal environment.
In this paper, we study the metalliferous sediments collected in the vicinity of the active Wocan-1 and inactive Wocan-2 hydrothermal sites. The goals of this study are to compare the geochemical compositions, mineralogy, mineral chemistry, and S-isotope signatures of the hydrothermal sediments from the active site and inactive site of WHF; and utilize these signatures to understand the spatial variations in the hydrothermal intensity, and primary and post-depositional conditions in the Wocan hydrothermal system.

2. Materials and Methods

Six sediment samples were collected in the Wocan Hydrothermal Field using TV-grab samplers during the Chinese DY 28th cruise in 2013. Station 28I-TVG07 and 28I-TVG08 are located near the active Wocan-1 hydrothermal sites. Station 28I-TVG10 and station 28I1-TVG05 are located near the inactive Wocan-2 hydrothermal sites. Station 28I-TVG12 and 28I-TVG13 are located on the ridge flanks (Table 1).
Bulk representative samples were washed with ultra-pure water to remove interstitial salts and dried at 60 °C. Approximately 30 g of the sub-samples were wet-sieved to separate into >63 µm (sand size fraction) and <63 µm (silt and clay size) using 240 mesh sizes. Cu–Fe–Zn sulfides in the >63 µm fractions were examined and hand-picked under the stereographic and binocular microscope. Standard electron microscope (SEM) equipped with an Energy Dispersive Spectrometer (EDX) analytical X-ray system operated at an accelerating voltage of 20–30 kV was used to study the grain morphology at the State Key Laboratory of Submarine Geosciences (KLSG), Hangzhou, China. The isolated sulfide grains were ultrasonically cleaned in ultra-pure alcohol to remove any seawater influence, then impregnated with epoxy resin and hardener (ratio 2:1), and polished similar to the method of References [8]. Fifty representative sulfide grains (68 spots) were analyzed using an electron probe microanalysis (EPMA, JEOL JXA-8100, JEOL, Tokyo, Japan) with an acceleration voltage of 24 kV, beam current of 1nA and a beam diameter of 5 µm at the KLSG, Hangzhou, China. EPMA concentrations of individual analyses are given in Tables S1–S3, with a minimum detection limit of >0.01 wt.%.
Part of the bulk samples was further pulverized into bulk powder with an agate mortar and pestle and analyzed using Inductively Coupled Plasma Mass Spectrometer (ICPMS) and X-ray powder diffraction analysis (XRD) for bulk sediment geochemistry and mineralogy. The XRD analysis was conducted on ~2 g of the bulk samples using an ‘X′ Per PRO Diffractometer (Cu Ka radiation) operated at 45 KV and 40 mA at KLSG. The bulk chemical compositions were analyzed using the method ME-MS61 at the Australian Laboratory Services (ALS) Chemex Guangzhou Limited Company, China, using an Agilent 7700 ICPMS. The results were corrected for inter-element interferences and reference samples MRGeo08 and GBM908-10 were used as standards. The analytical precision was better than ±10%. Details information on the ICPMS dataset, including minimum detection limit, are given in Table S4.
Sulfur isotope analysis was conducted on the powdered fractions at the State Key Laboratory of Geologic Processes and Mineral Resources (GPMR), in China University of Geosciences, Wuhan, according to the method of Reference [16]. Sample preparation was carried out by heating 20 mL of 12 mol/L HCl and 40 mL of 1 mol/L CrCl2 solution under N2 for 2 h. The liberated hydrogen sulfide (H2S) was trapped by 30 mL mixed solutions of 3 wt.% silver nitrate (AgNO3) and 10% ammonium hydroxide (NH4OH) to form silver sulfide (Ag2S). The resulting Ag2S precipitates were filtered, dried, and homogenized with a further combination of excess V2O5. Online combustion was adopted to measure the sulfur isotopic composition (δ34S) on a Thermo Fisher Scientific Delta V Plus isotope ratio mass spectrometer (IRMS) coupled with a Flash elemental analyzer. The δ34S data were calibrated by using three International Atomic Energy Agency (IAEA) standards: S1 (‒0.3‰), S2 (+22.65‰), and S3 (‒32.5‰), and reported in δ-notation relative to values for Cañon Diablo Troilite (V-CDT). The analytical error was better than ±0.2‰ based on replicate analyses of IAEA standards (Table S5).

3. Results

3.1. Mineralogy and Morphology of Sulfide and Non-Sulfide Grains

Based on optical microscopy, and SEM-EDS analysis (Figure A1), the dominant minerals in Wocan-1 sediment are pyrite, anhydrite, Fe oxides, and hydroxides, while, chalcopyrite, Fe-oxides, and hydroxides were dominant in Wocan-2 sediment (Table 2). Amorphous silica and secondary Cu-sulfide minerals (e.g., bornite and covellite) occurred in trace and minor abundance in Wocan-1 and Wocan-2 sediment respectively, while, sphalerite and barite occurred in trace abundance. The ridge flank sediment is dominated by biogenic calcite and trace abundance of Fe-oxyhydroxide (Table 2). XRD investigations (Figure A2, Figure A3 and Figure A4) also confirmed these minerals.
The relative abundance from each station shows that chalcopyrite increases in abundance from station TVG-07 to TVG-08, whereas there is a decrease in the abundance of chalcopyrite and secondary Cu-sulfides from station TVG-10 to TVG-05.
The morphological investigation of pyrite and chalcopyrite separates of the Wocan-1 sediment exhibits euhedral texture (Figure 2A,B), in contrast to the Wocan-2 sediment, which showed features that are typical of being reworked by weathering processes (Figure 2C–F). Other features were micro-chimney fragments from station TVG-08 (Figure 2G,H)

3.2. Bulk Sediment Geochemistry

The spatial variations in the bulk geochemical analysis of Wocan-1 sediment (Table 3) showed higher Fe (30.9–41.2 wt.%), Mg (0.49–1.31 wt.%), Al (0.09–1.38 wt.%), Zn (4710–8330 ppm), Pb (430–431 ppm), and Cr (22–32 ppm). However, the Wocan-2 sediments showed higher Ca (0.2–9.81 wt.%), Mn (0.06–0.09 wt.%), Ti (0.47–0.92 wt.%), Ag (3.4–16.25 ppm), and U (4.7–19.6 ppm). The Cu and Co concentration of station TVG-10 was 51,900 ppm and 16.7 ppm, in contrast to TVG-05, which have values of 8510 ppm and 235 ppm, respectively. The ridge flank sediment showed variations in Ba (500–600 ppm) and Th (1–13 ppm).

3.3. Mineral Chemistry of Sulfide Separates

The spatial variations in the EPMA investigations (Table 4) on the representative chalcopyrite separate of Wocan-1 sediments were enriched in Se (0.01–0.03 wt.%), Co (0.02–0.04 wt.%), Sb (0.01–0.03 wt.%), and Pb (0.05–0.12 wt.%). The Sn and Tl contents were below detection limit (bdl). The calculated stoichiometry formula and Cu/Fe atomic ratio were Cu1.000 Fe1.011 S2.038 and 0.99–1.01 (mean value: 1.00, n = 11). The Wocan-2 chalcopyrite separates are enriched in Zn (0.01–0.06 wt.%), Ag (bdl—0.07 wt.%), Sn (0.02–0.03 wt.%), and Tl (0.02–0.04 wt.%). The Se, Co, and Sb concentrations were below detection limit. The calculated stoichiometry formula and Cu/Fe atomic ratio were Cu0.999 Fe1.000 S2.001 and 0.98–1.01 (mean value: 0.99, n = 12).
The pyrite separates of the Wocan-1 (Table 4) were enriched in Se (0.02–0.05 wt.%), Co (0.04–0.06 wt.%), As (0.02–0.31 wt.%), Pb (0.30–0.12 wt.%), and Au (0.01–0.02 wt.%). The calculated stoichiometry formula and S/Fe atomic ratio were Fe1.000 S1.997 and 1.94–2.50 (mean value, 2.00, n = 26). The Wocan-2 pyrite separate show enriched Cu (0.01–0.17 wt.%) and Zn (bdl—0.02 wt.%) concentrations. The Se, Co, Sb, and Ag concentrations were bdl, and the calculated stoichiometry formula and S/Fe ratio were Fe1.000 S1.989 and 1.96–2.01 (mean value, 1.99, n = 12).
In summary, the Wocan-1 pyrite and chalcopyrite separate showed distinct enrichment in Se, Co, As, Sb, and Pb relative to the Sn, Tl, Cu, and Zn enrichments in the Wocan-2 separates.
The EPMA investigations (Table 5) on representative sphalerite separates from the Wocan-1 sediment showed distinct enrichment of Fe (4.04–4.06 wt.%), Cu (0.07–0.09 wt.%), Pb (0.04–0.05 wt.%), and Cd (up to 0.50 wt.%). The calculated stoichiometry formula were Zn1.000 Fe0.008 S1.135. The sphalerite minimum precipitation-temperature (Sph.PT) were calculated using the formula Fe/Zn + 0.0013 (T) − 0.2953 according to [17]. The calculated Sph.PT of Wocan-1 sediment are in the range of 278.03–278.15 °C (mean value: 278.08 °C, n = 3). The Wocan-2 sphalerite separates showed low Fe contents (0.19–1.36 wt.%), Cu (0.01–0.06 wt.%), and Pb (0.01–0.04 wt.%) concentrations relative to Wocan-1 separates. The calculated stoichiometry formula and sphalerite minimum precipitation-temperature were Zn1.000 Fe0.078 S1.040, and 229.40–243.47 °C (mean value: 232.73 °C, n = 5).
Our samples satisfied the conditions of sphalerite geothermometry based on the following reasons: (i) the samples were collected from a sediment starved (basalt-hosted) hydrothermal field, (ii) our samples had not been affected by metamorphic overprint, and (iii) chalcopyrite inclusion or disease on our samples were very rare [17].

3.4. Sulfur Isotopes

The results of 10 representative bulk sulfur isotope analysis (δ34S) are shown in Table 6. The δ34S values of the Wocan-1 sediment varied spatially from 3.0–3.6‰, from station TVG-08 to TVG-07 (mean value; 3.45‰, n = 4). The Wocan-2 sediments were slightly broader and heavier and varied spatially from 4.1–4.3‰ and 6.4–8.7‰ at station TVG-10 to TVG-05 (Figure 3), mean value; 6.28‰, n = 6).

4. Discussion

4.1. The Effect of Primary and Post-Depositional Changes, Evidence from Grain Texture, Bulk Chemical Compositions, and Mineral Chemistry

Detailed studies on separated mineral grains from sediments in hydrothermal environments can help enhance interpretation of the precipitation conditions of hydrothermal particles feeding the sediments. However geochemical investigations on isolated grains texture from metalliferous sediments are rare. Among the few studies are the work of Dias and Barriga [
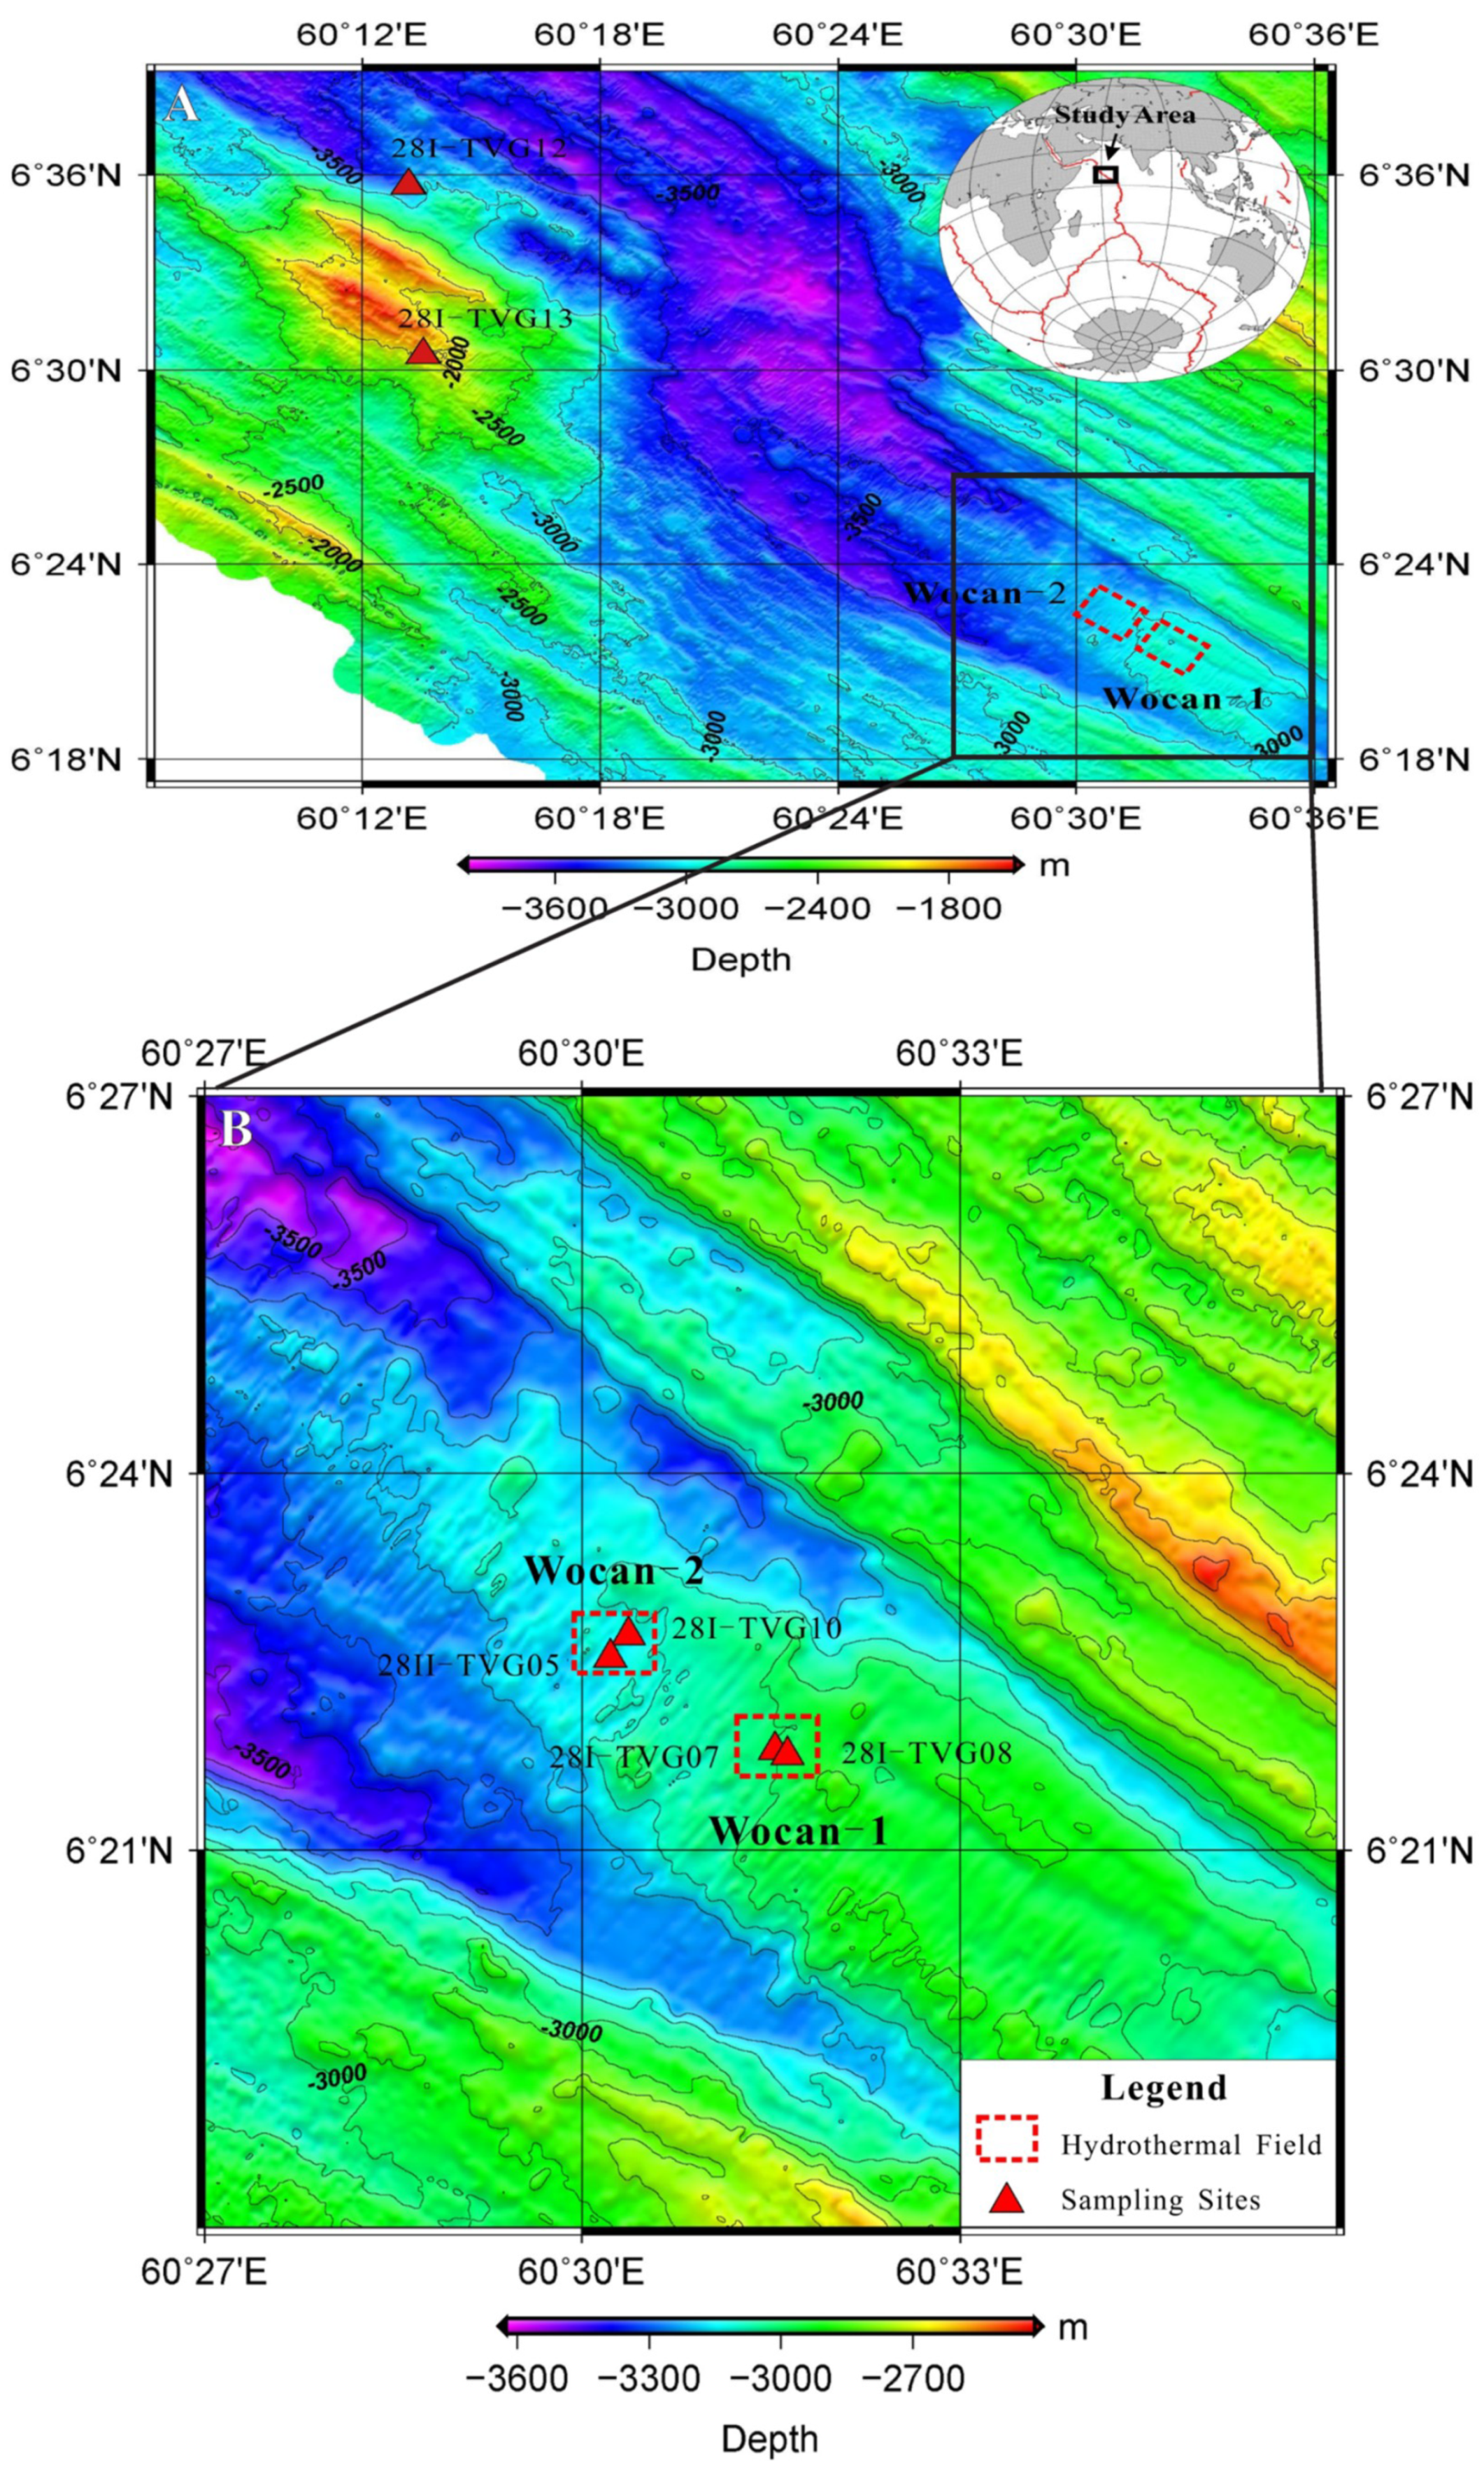
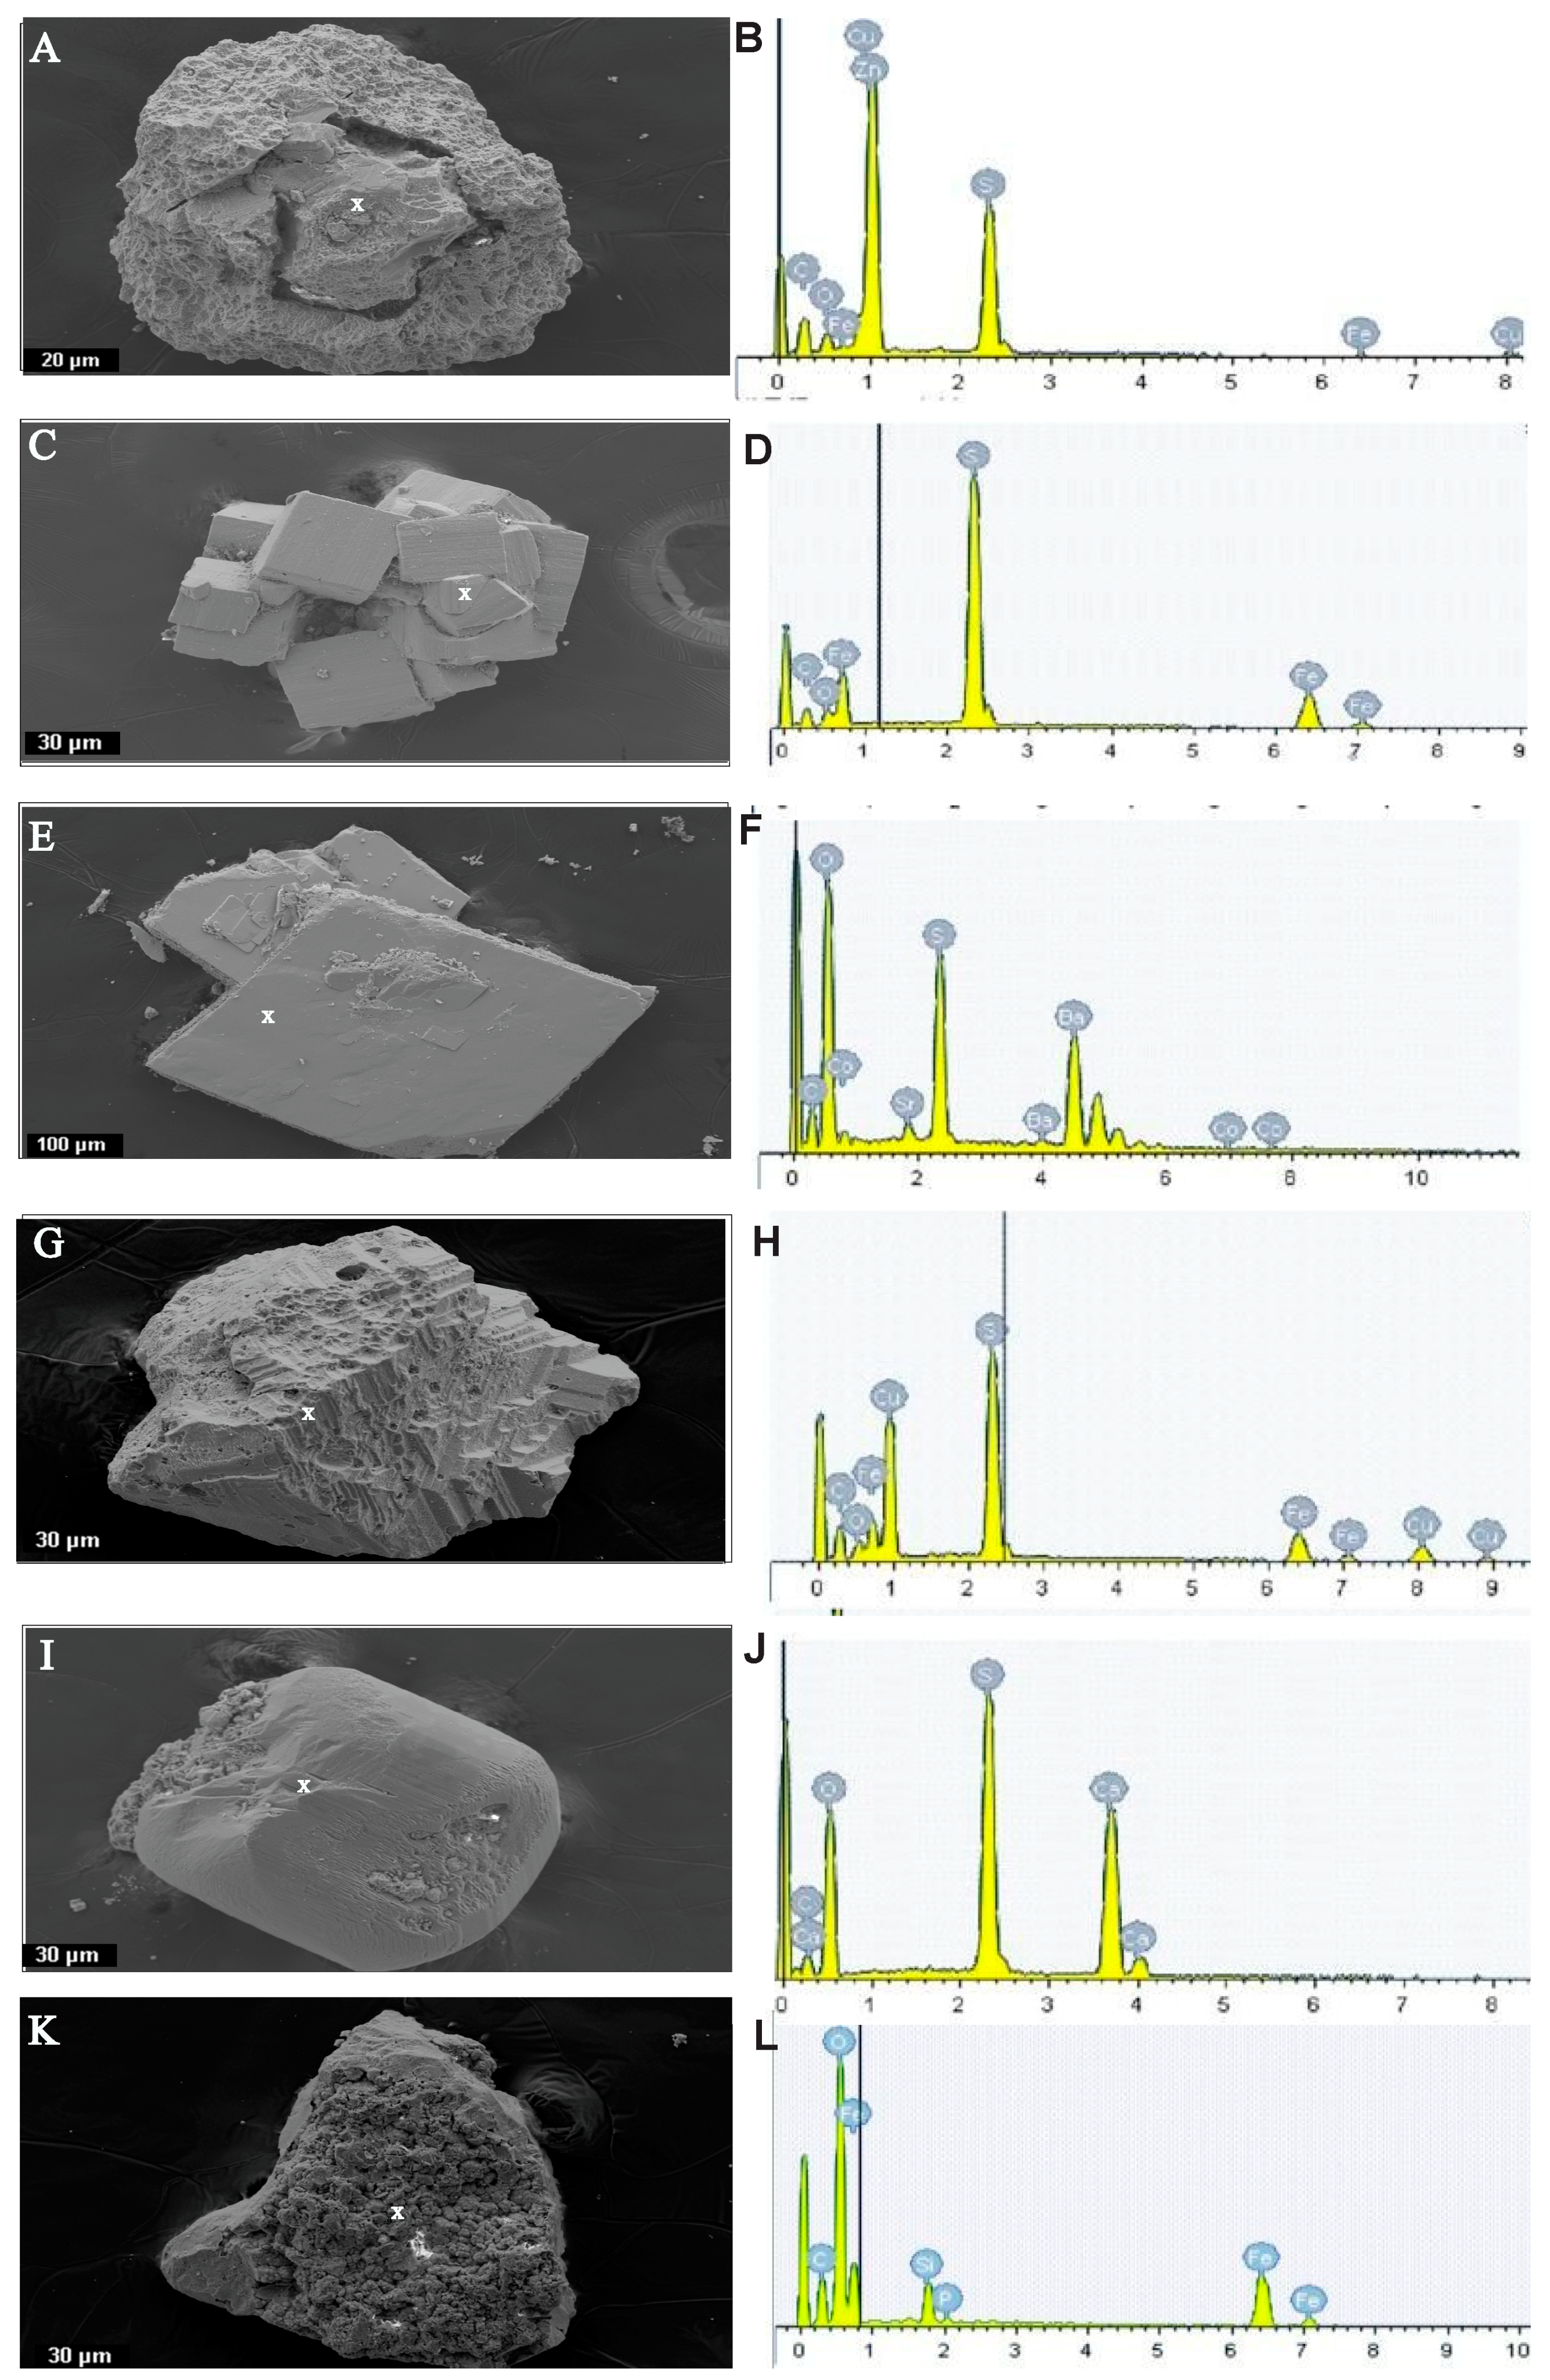
3] who used the occurrence of micro-chimney particles from metalliferous sediment of Mount Saldanha hydrothermal field to suggest the intensity of hydrothermal activity. The observed Cu and Fe sulfide-rich micro-chimney-like structure (Figure 2G,H) at station TVG-08 can be related to pervasive hydrothermal contributions into the station relative to TVG-07, TVG-10 and TVG-05. In contrast, the typical etched features shown by the pyrite and chalcopyrite separates of TVG-10 from Wocan-2 sediment (Figure 2C–F), can be related to dissolution arising from the effect of seafloor weathering and hydrothermal reworking process.
Concerning the bulk sediment geochemical compositions, previous studies had utilized elevated U/Fe ratios in metalliferous sediments to suggest secondary sulfide oxidation in hydrothermal environments [8,11,12,18,19]. Moreover, high U contents (>10 ppm) in hydrothermal sediments are consistent with the uptake of seawater and sulfide oxidation [8,11,18]. The high U concentrations (up to 19.6 ppm), and U/Fe enrichments (up to 6.24 × 10⁻⁵) in the bulk sediment samples of station TVG-10 from Wocan-2 suggested a higher rate of sulfide oxidation. The dominant weathering features on sulfide grain separates of metalliferous sediment of station TVG-10 (Figure 2C–F) is consistent with the high U/Fe ratio. Additionally, References [8,18,20] reported a wide range of Fe/Mn ratio in the near vent metal-enriched sediments of Lucky Strike hydrothermal field (1000–3000), Trans-Atlantic Geotraverse (TAG) hydrothermal field (900–2000), and OBS vent field(900–2400), and attributed the high ratio (e.g., >1000) to near-vent hydrothermal settings. The narrow range (1373–1545) in the Fe/Mn ratio of the Wocan-1 sediment relative to the OBS, TAG and Lucky Strike sediment suggests a homogeneous chemical composition of Wocan-1 sediment. Moreover, the >1000 values of the Fe/Mn ratio of the sediment samples of TVG-07 and TVG-08 suggest the proximity of the sampling stations to high temperature venting sites.
Concerning the mineral chemistry, Se concentration in pyrite had been suggested as a new geothermometer for hydrothermal ore deposits, and varied according to changes in pH and redox conditions of ore-forming fluids [21,22,23]. High concentration of Se and Co in pyrite are typical of high-temperature Cu-rich ores in the volcanogenic massive sulfide deposits (VMS) [22]. Distinct enrichments of Se (up to 0.046 wt.%, n = 6) and Co (up to 0.07 wt.%, n = 26), in pyrite separates of the Wocan-1 sediment, and below detection limit (< 0.01 wt.%) in the pyrite separates of TVG-10 and TVG-05 of Wocan-2 station (Table S2, n=11) can be related to higher temperature conditions and hydrothermal intensity in the Wocan-1 site, relative to Wocan-2.
Generally, the enriched bulk sediment Fe/Mn ratio in Wocan-1 (up to ~1545, Table 3) is consistent with the enriched Se, and Co content in pyrite separates (Table 4) and higher values of calculated sphalerite precipitation temperature (~278 °C) (
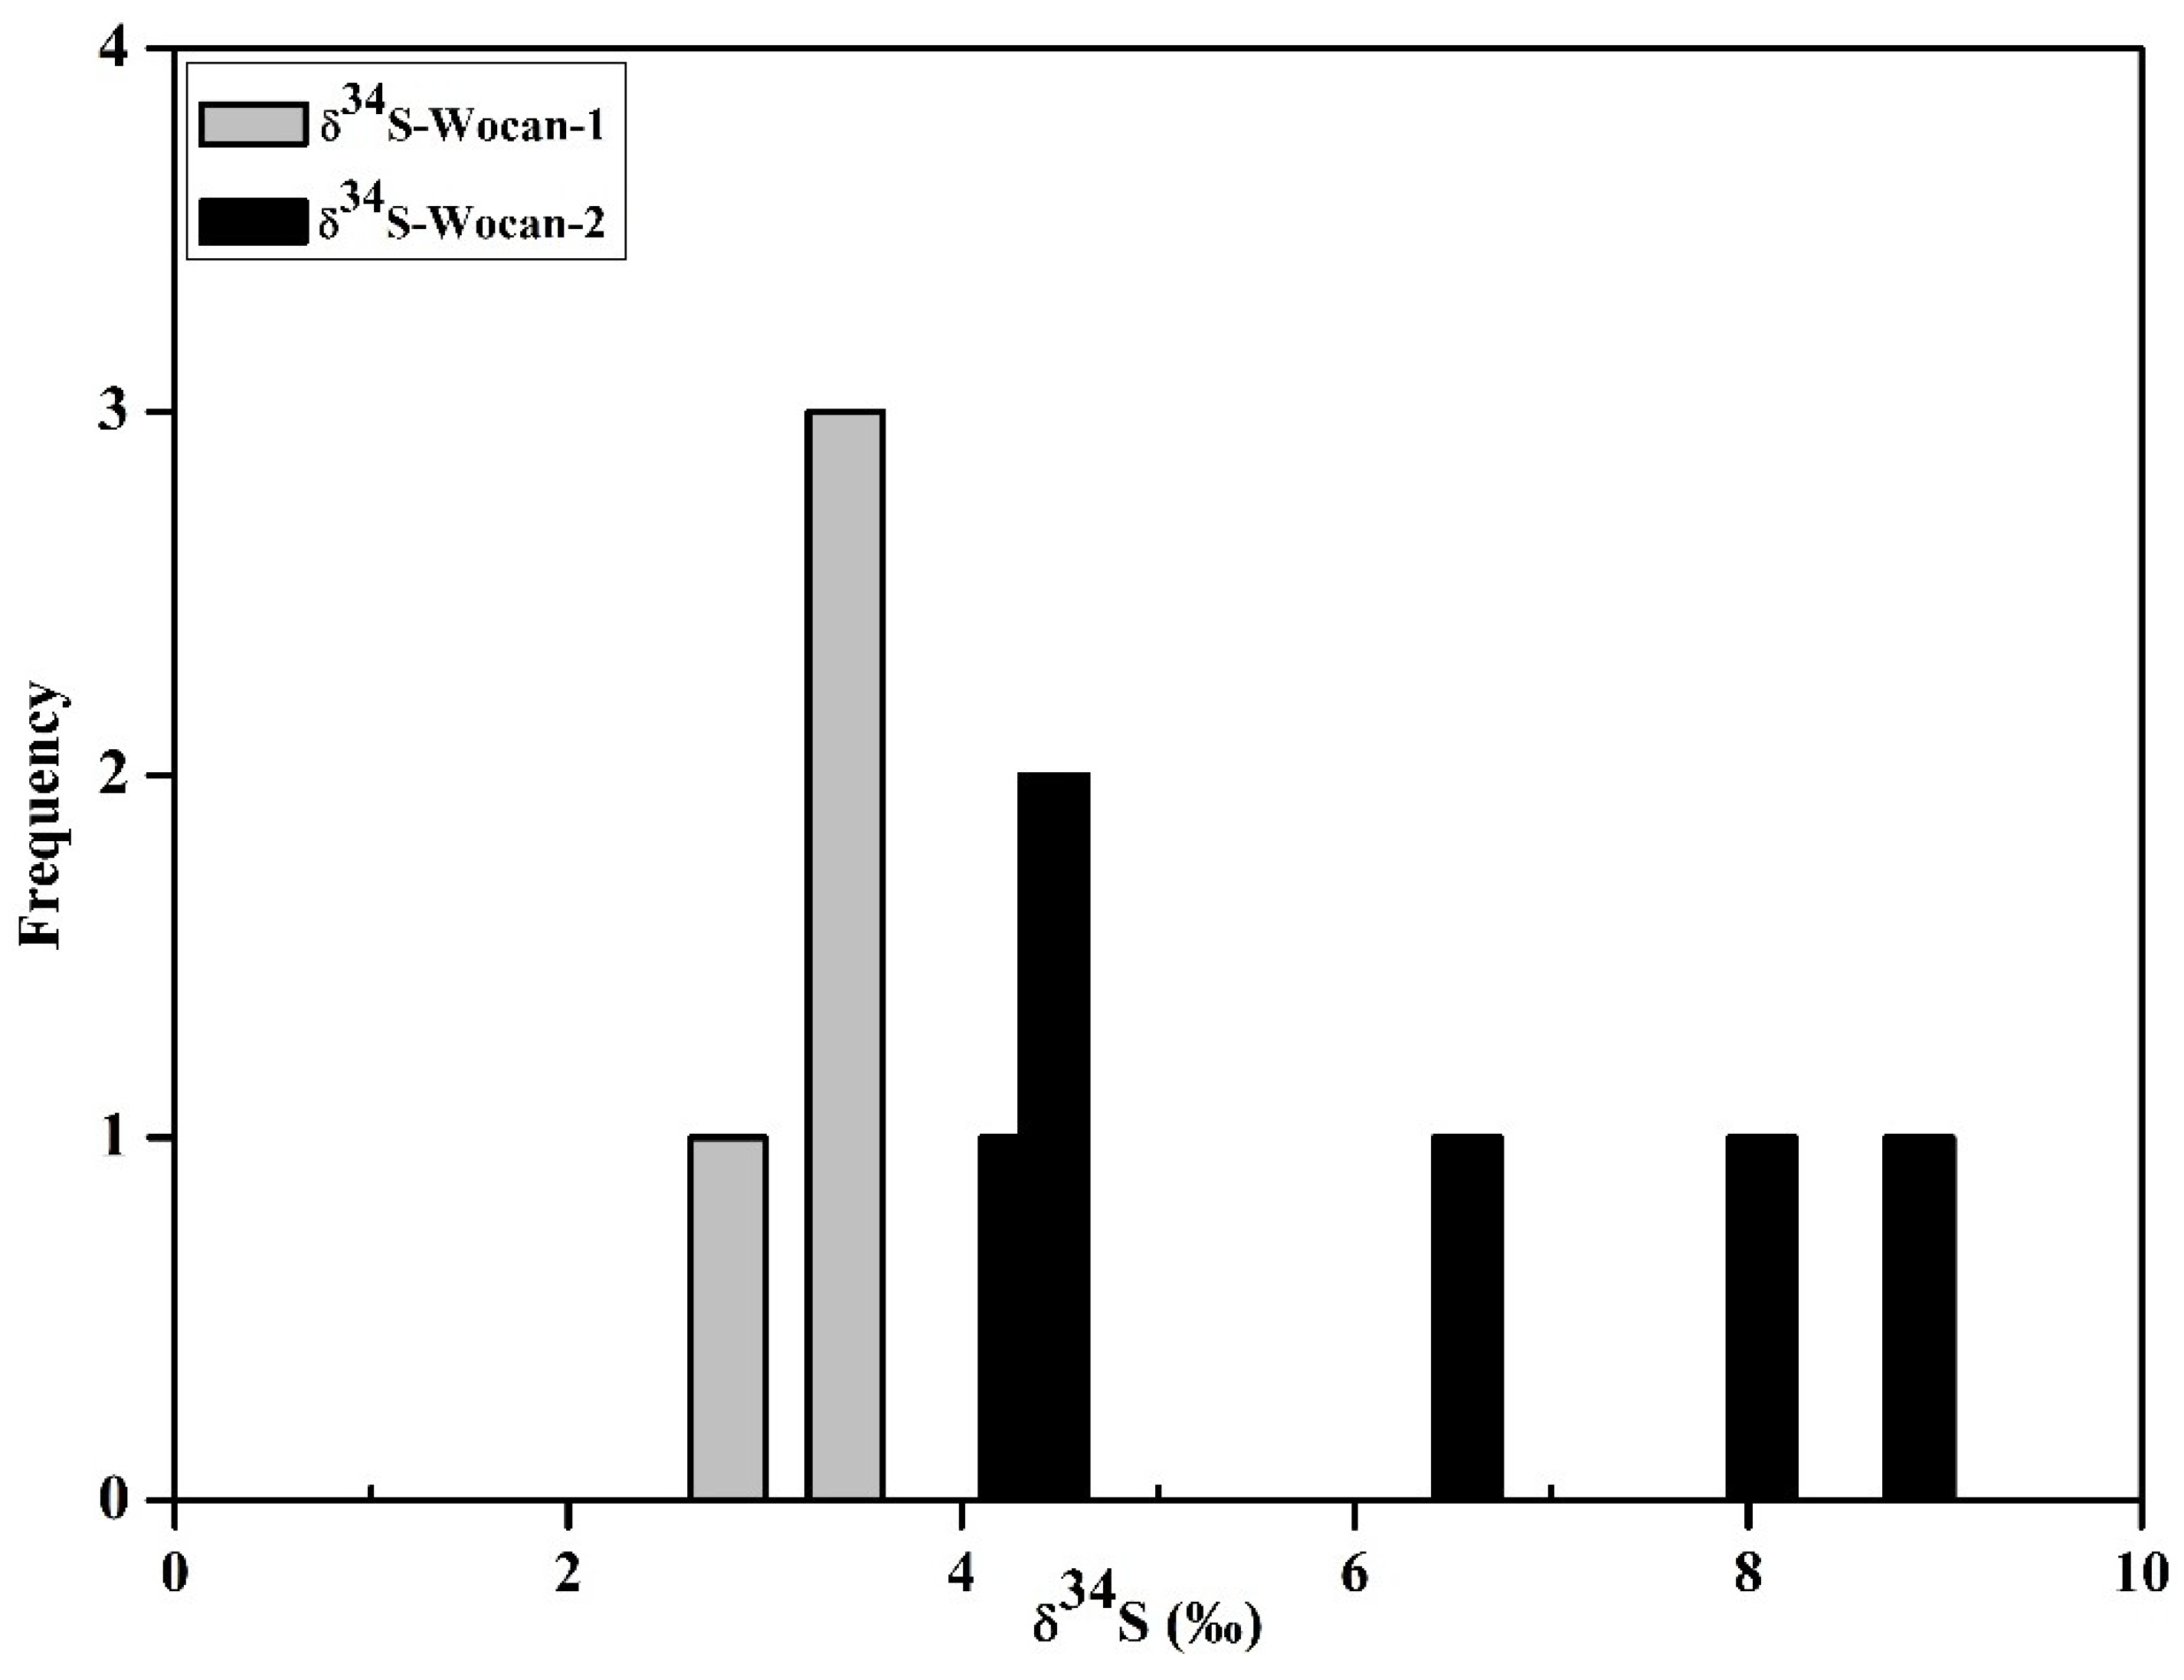
Table 5). Moreover, it is also consistent with the low S isotopes (3.0–3.6‰) values (Table 6) and euhedral grain morphology (
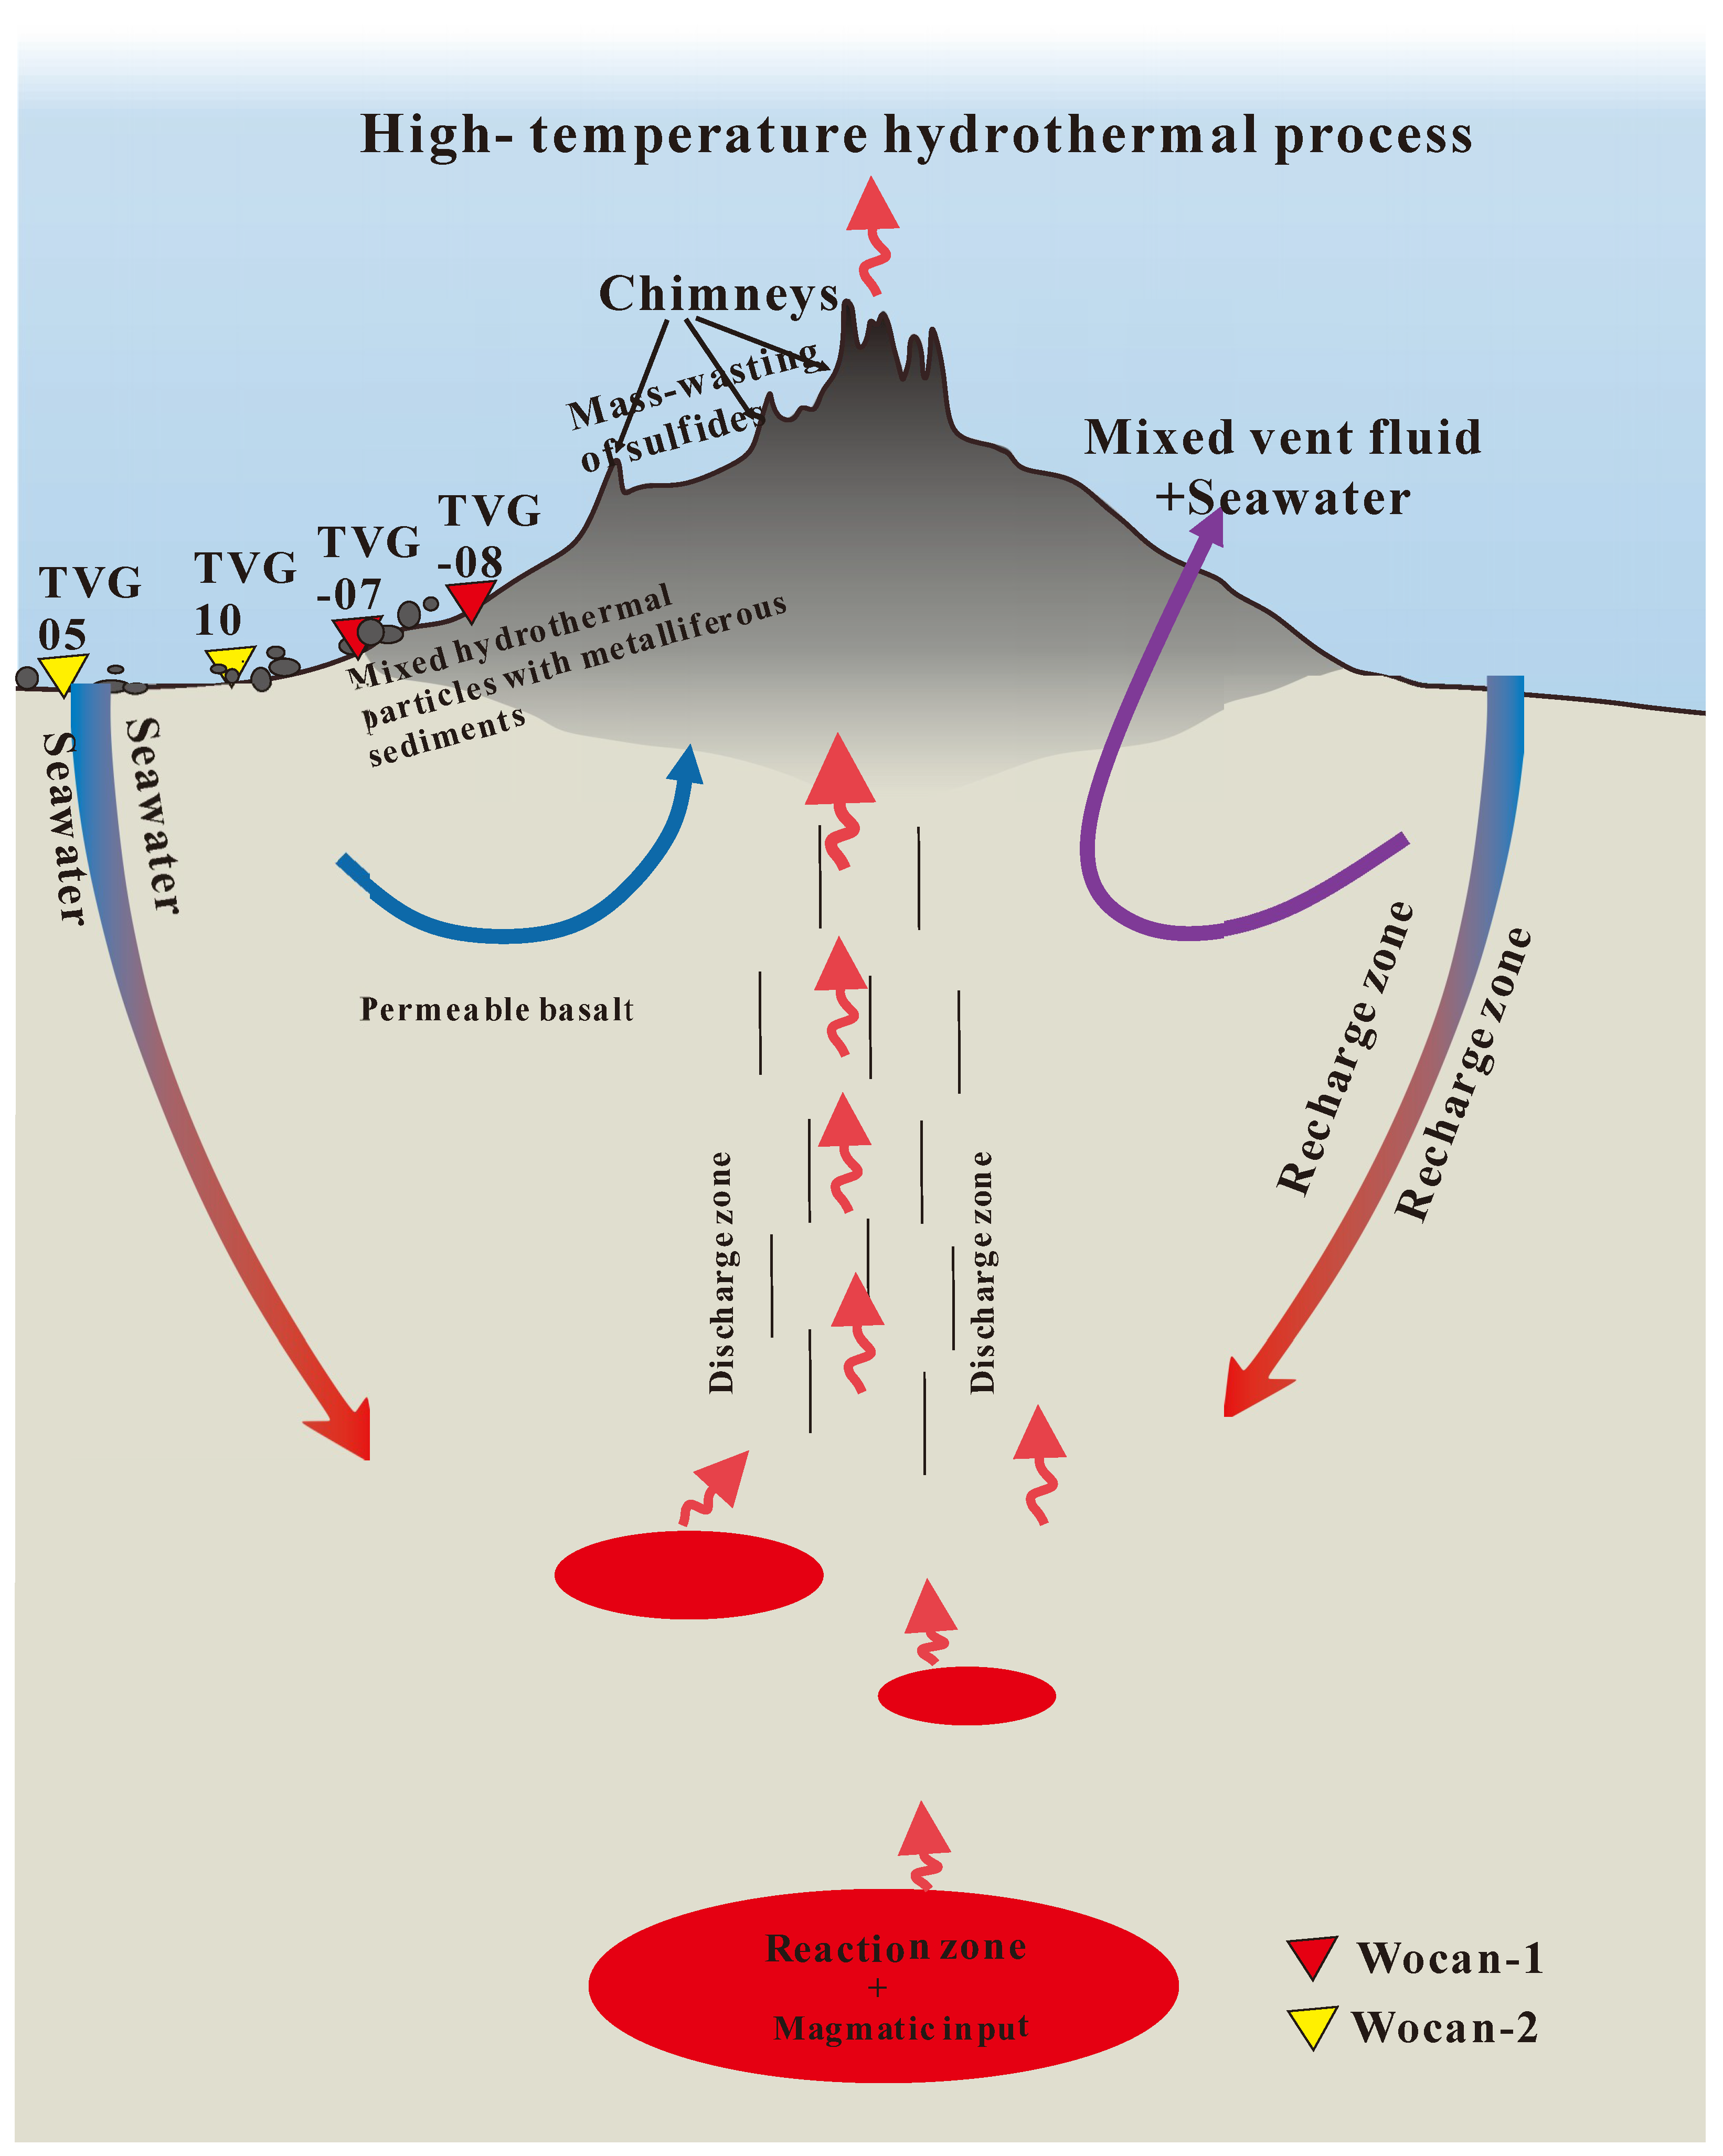
Figure 2A,B). According to these signatures, we suggest that the Wocan-1 stations (TVG-08 and TVG-07) were near high-temperature hydrothermal discharge environments (Figure 4).
The enriched bulk sediment U/Fe (up to 6.24 × 10⁻⁵) ratio, U contents (up to 19.6 ppm), and low Fe/Mn (288–523) ratio in the Wocan-2 sediments are consistent with the low Se and Co concentrations in pyrite separate. Moreover, the lower values of calculated sphalerite precipitation temperature (mean value, ~233 °C, n = 8) are also consistent with the heavy S isotopes (4.1–8.7‰) values and the weathered grain morphology (Figure 2C–F). The lower Fe/Mn ratio, high U values and U/Fe ratio, the relatively low Sph.PT, and depleted Se, Co concentration suggest lower temperature conditions in the sampling stations of TVG-10 and TVG-05 in Wocan-2 relative to Wocan-1 (Figure 4). Based on these signatures, we suggest that the Wocan-2 samples had undergone secondary oxidation in relation to seafloor weathering.

4.2. The Contributions of Hydrothermal Fluid, Evidence from S Isotope Values

Sulfur isotopes may be applied in hydrothermal systems to understand the isotope exchange process, the relative source of sulfur from magmatic rocks, biogenic pyrite re-mobilization and seawater sulfate (SO42−) reductions [24].
The S sources in sediment-starved fields were mainly seawater-derived sulfate and magmatic sulfur [25]. Based on two-component mixing model (δ34S-mix = X × δ34Sseawater + (1 − X) × δ34Sbasalt [25,26,27]). The δ34Sseawater, δ34Sbasalt, and δ34S-mix represent 21‰, 0‰ and the isotope values of the Wocan-1 and Wocan-2 samples, while, the unknown value (X) represents the amount of seawater component. We quantify the relative contributions of seawater-derived sulfur and magmatic sulfur to the Wocan-1 and Wocan-2 samples (Table 6). The sulfur source in the metalliferous sediments of Wocan-1 was dominated by magmatic sulfur and lower (<20%) seawater-derived components relative to Wocan-2.
The higher δ34S values of Wocan-2 sediment samples (e.g., 6.4–8.7‰) at station TVG-05 suggests a reduction of admixed seawater-sulfate (SO42−)-derived sulfur (H2S). This assumption is supported by the S isotope end-member modelling according to References [28,29,30] who attributed δ34S values of 1.5–7.0‰, 0.1 ± 0.5‰, and 21 ± 0.2‰ to vent-fluid/sulfide chimney, Mid Ocean Ridge Basalt (MORB), and seawater, respectively. Furthermore, References [9,31] suggested that the mixture of hydrothermal fluid with seawater is not liable to generate δ34S values that are heavier than 4.5‰. Also, References [32,33] suggested that a δ34S value more than 4.5‰ is an indication of excessive seawater sulfate derived sulfur.
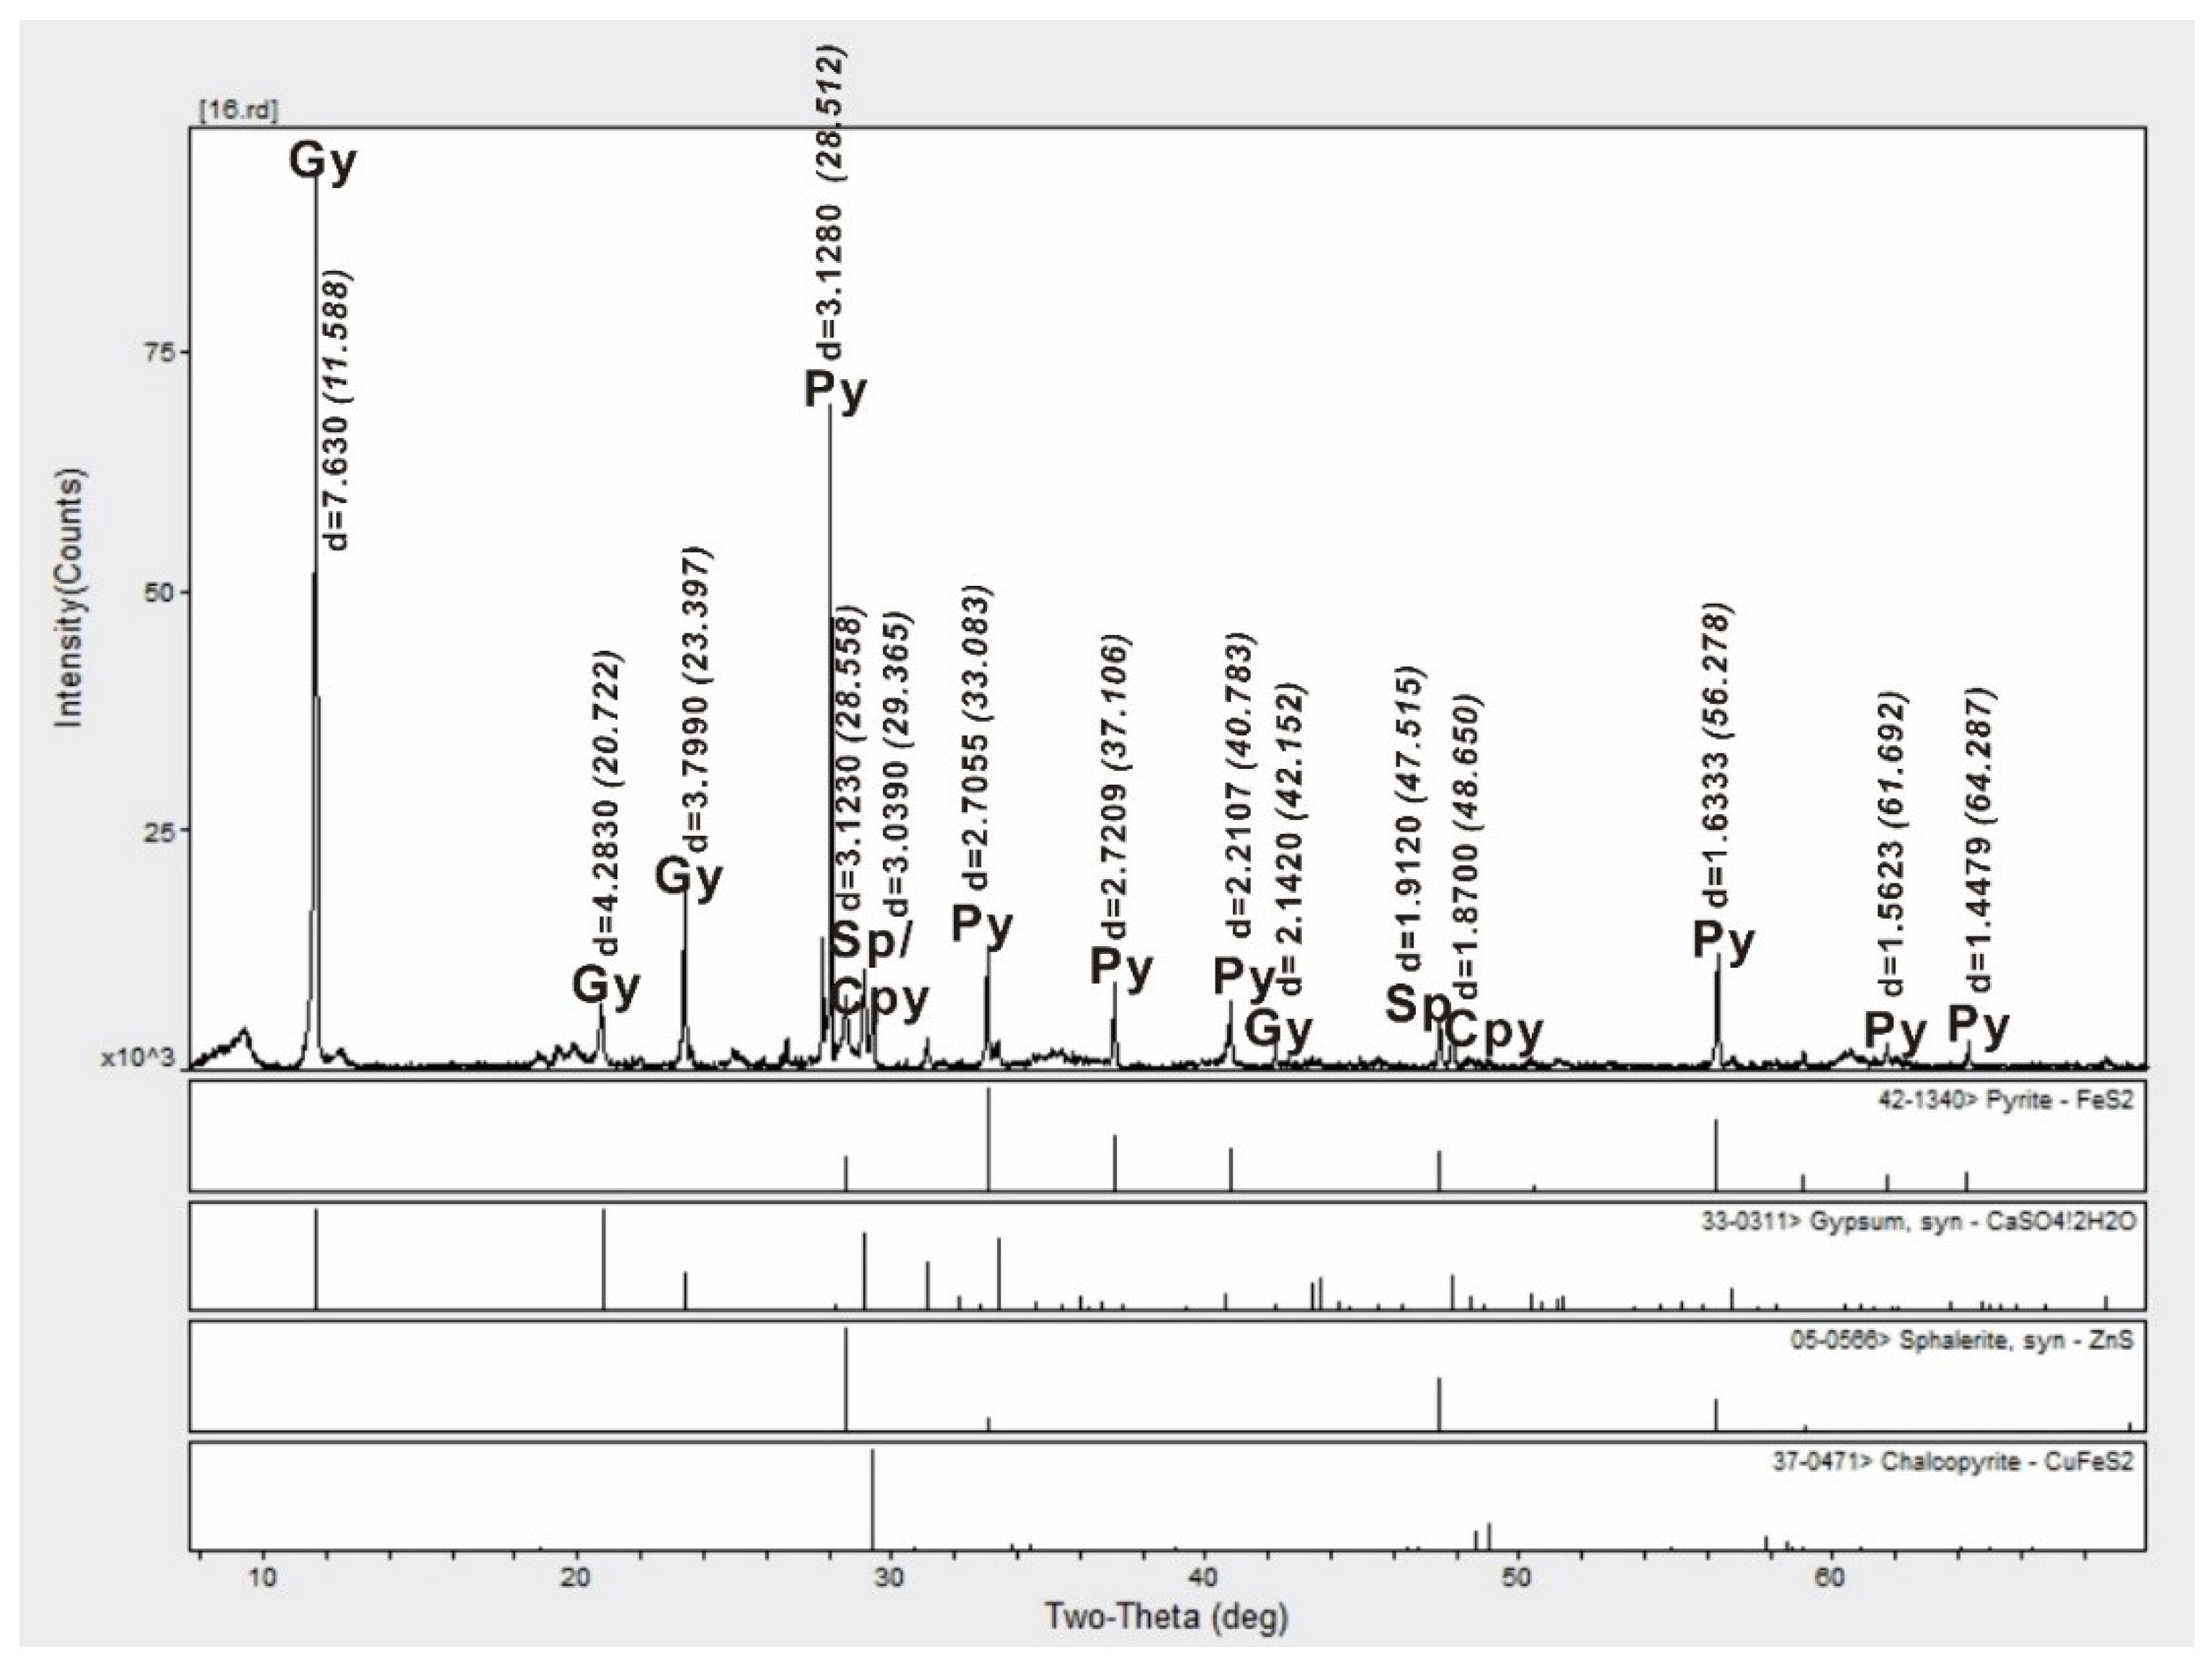
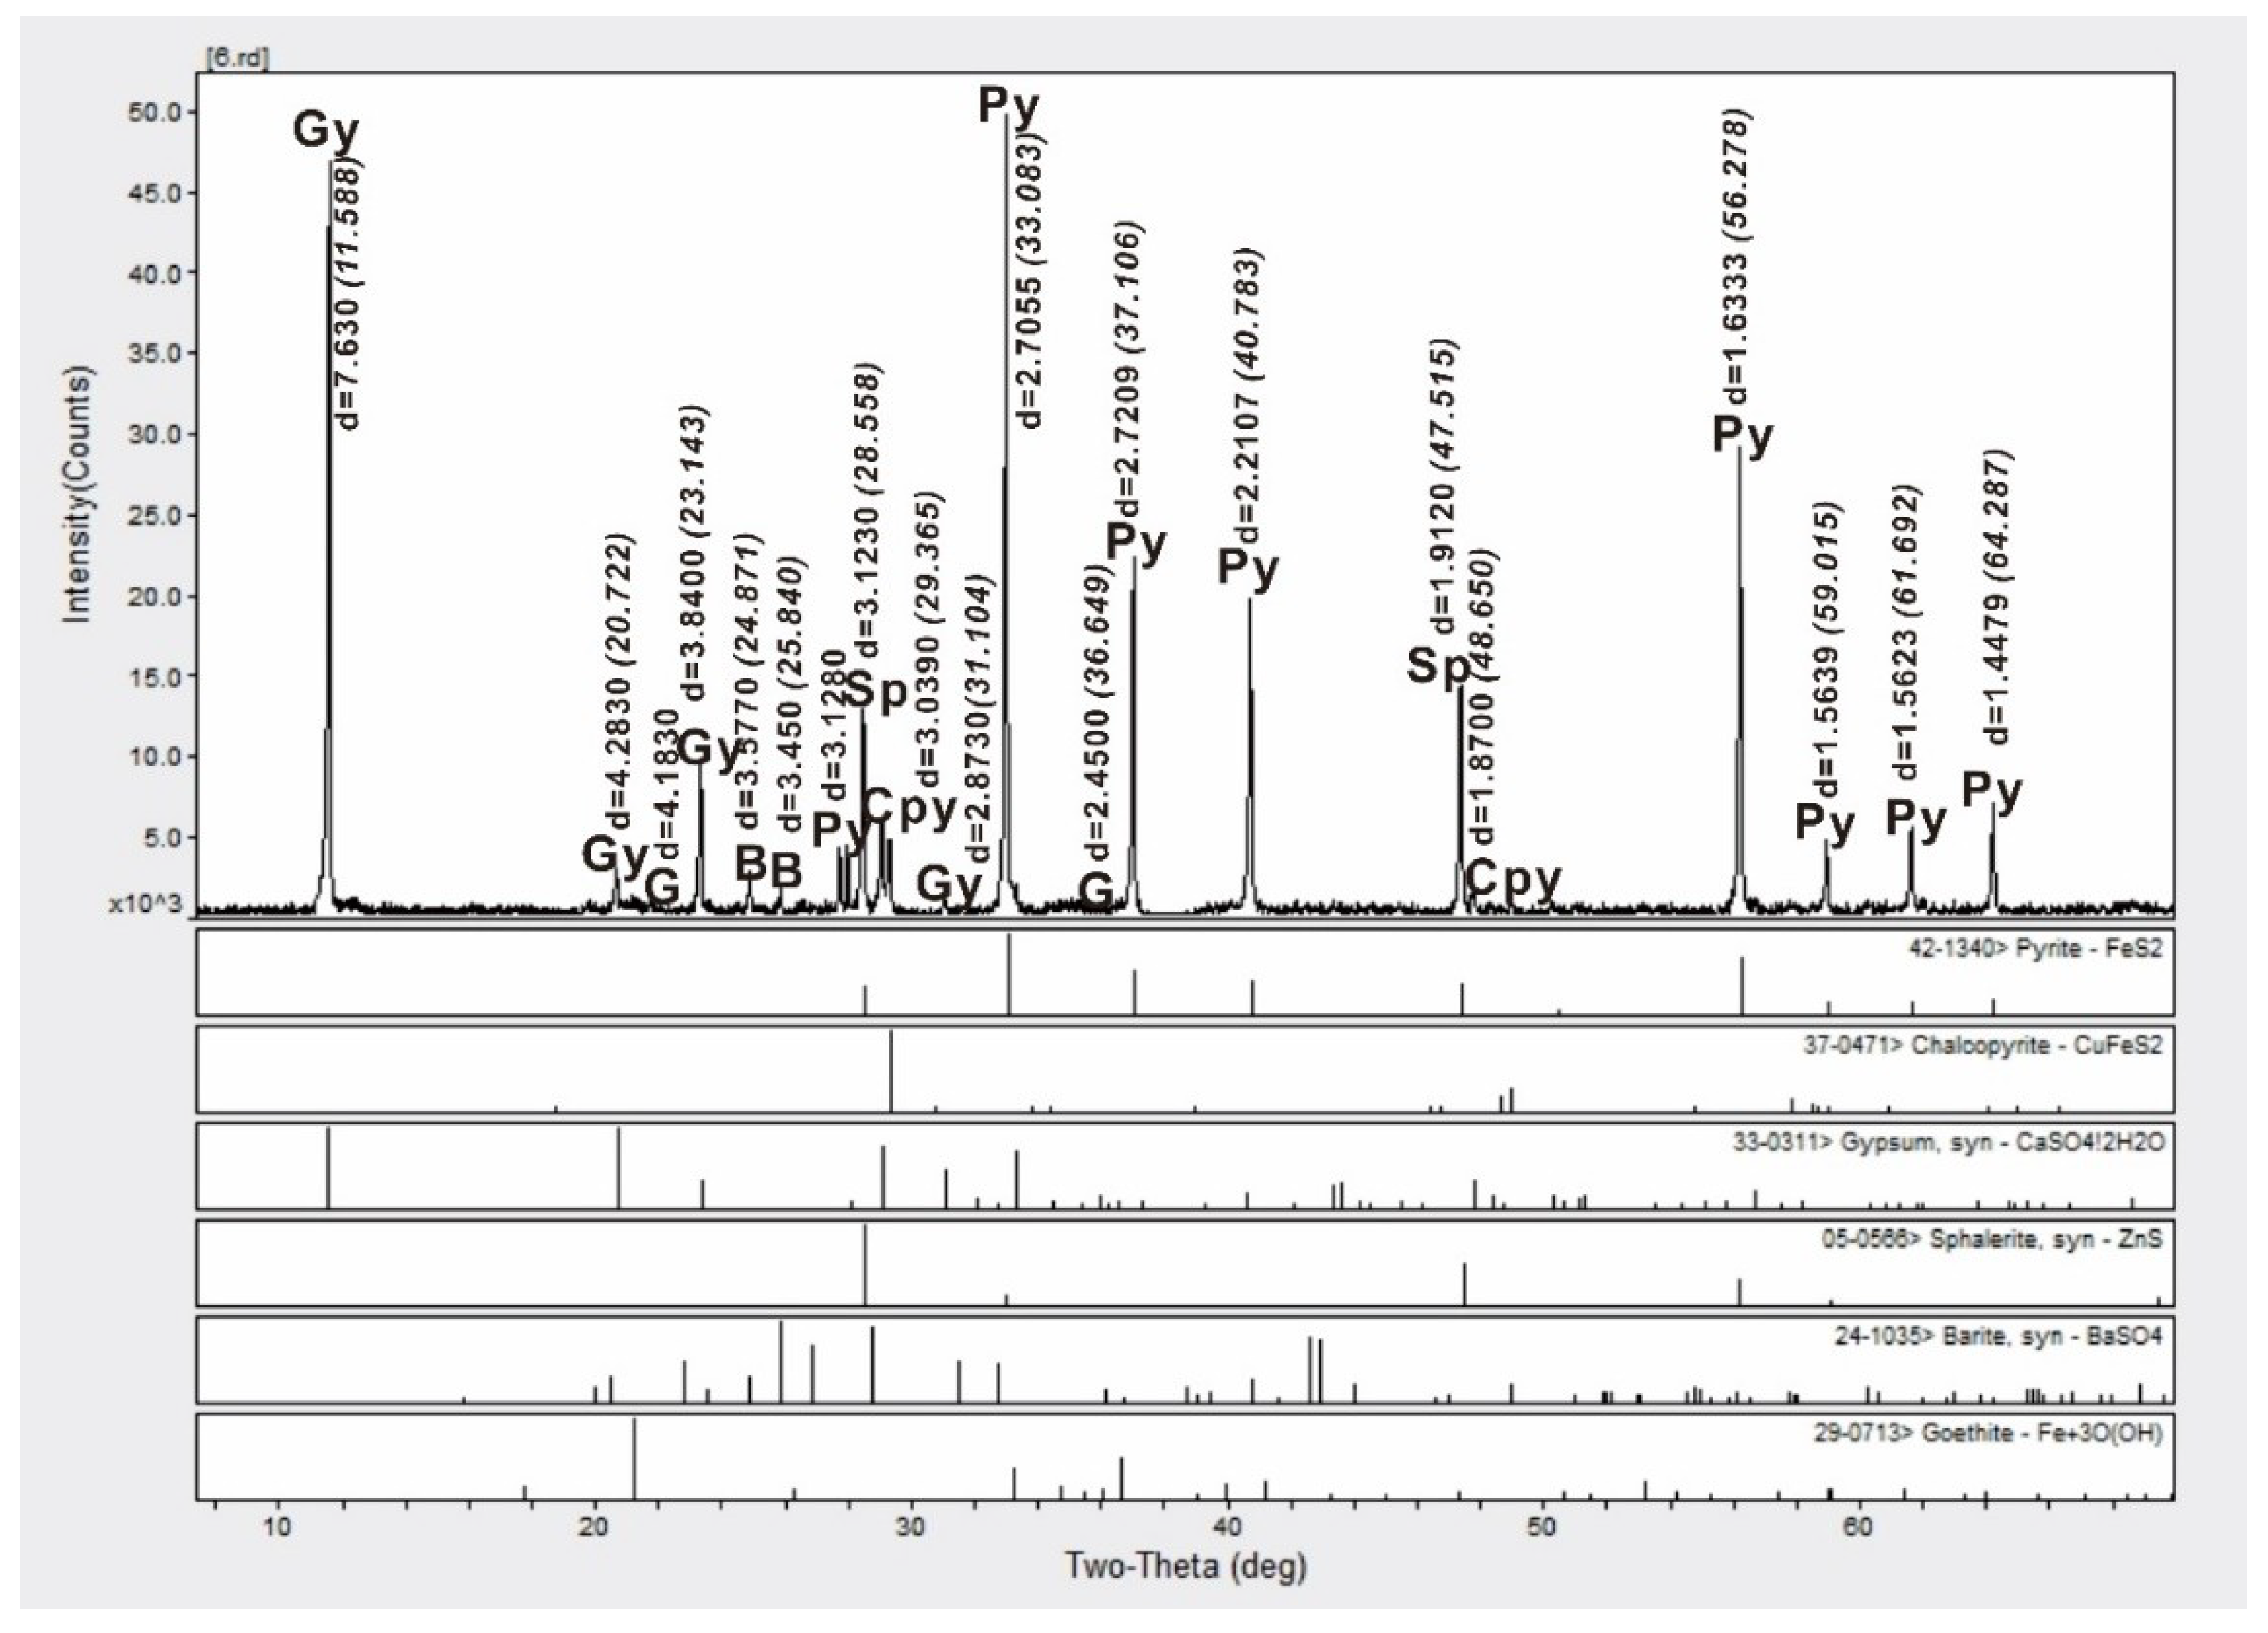
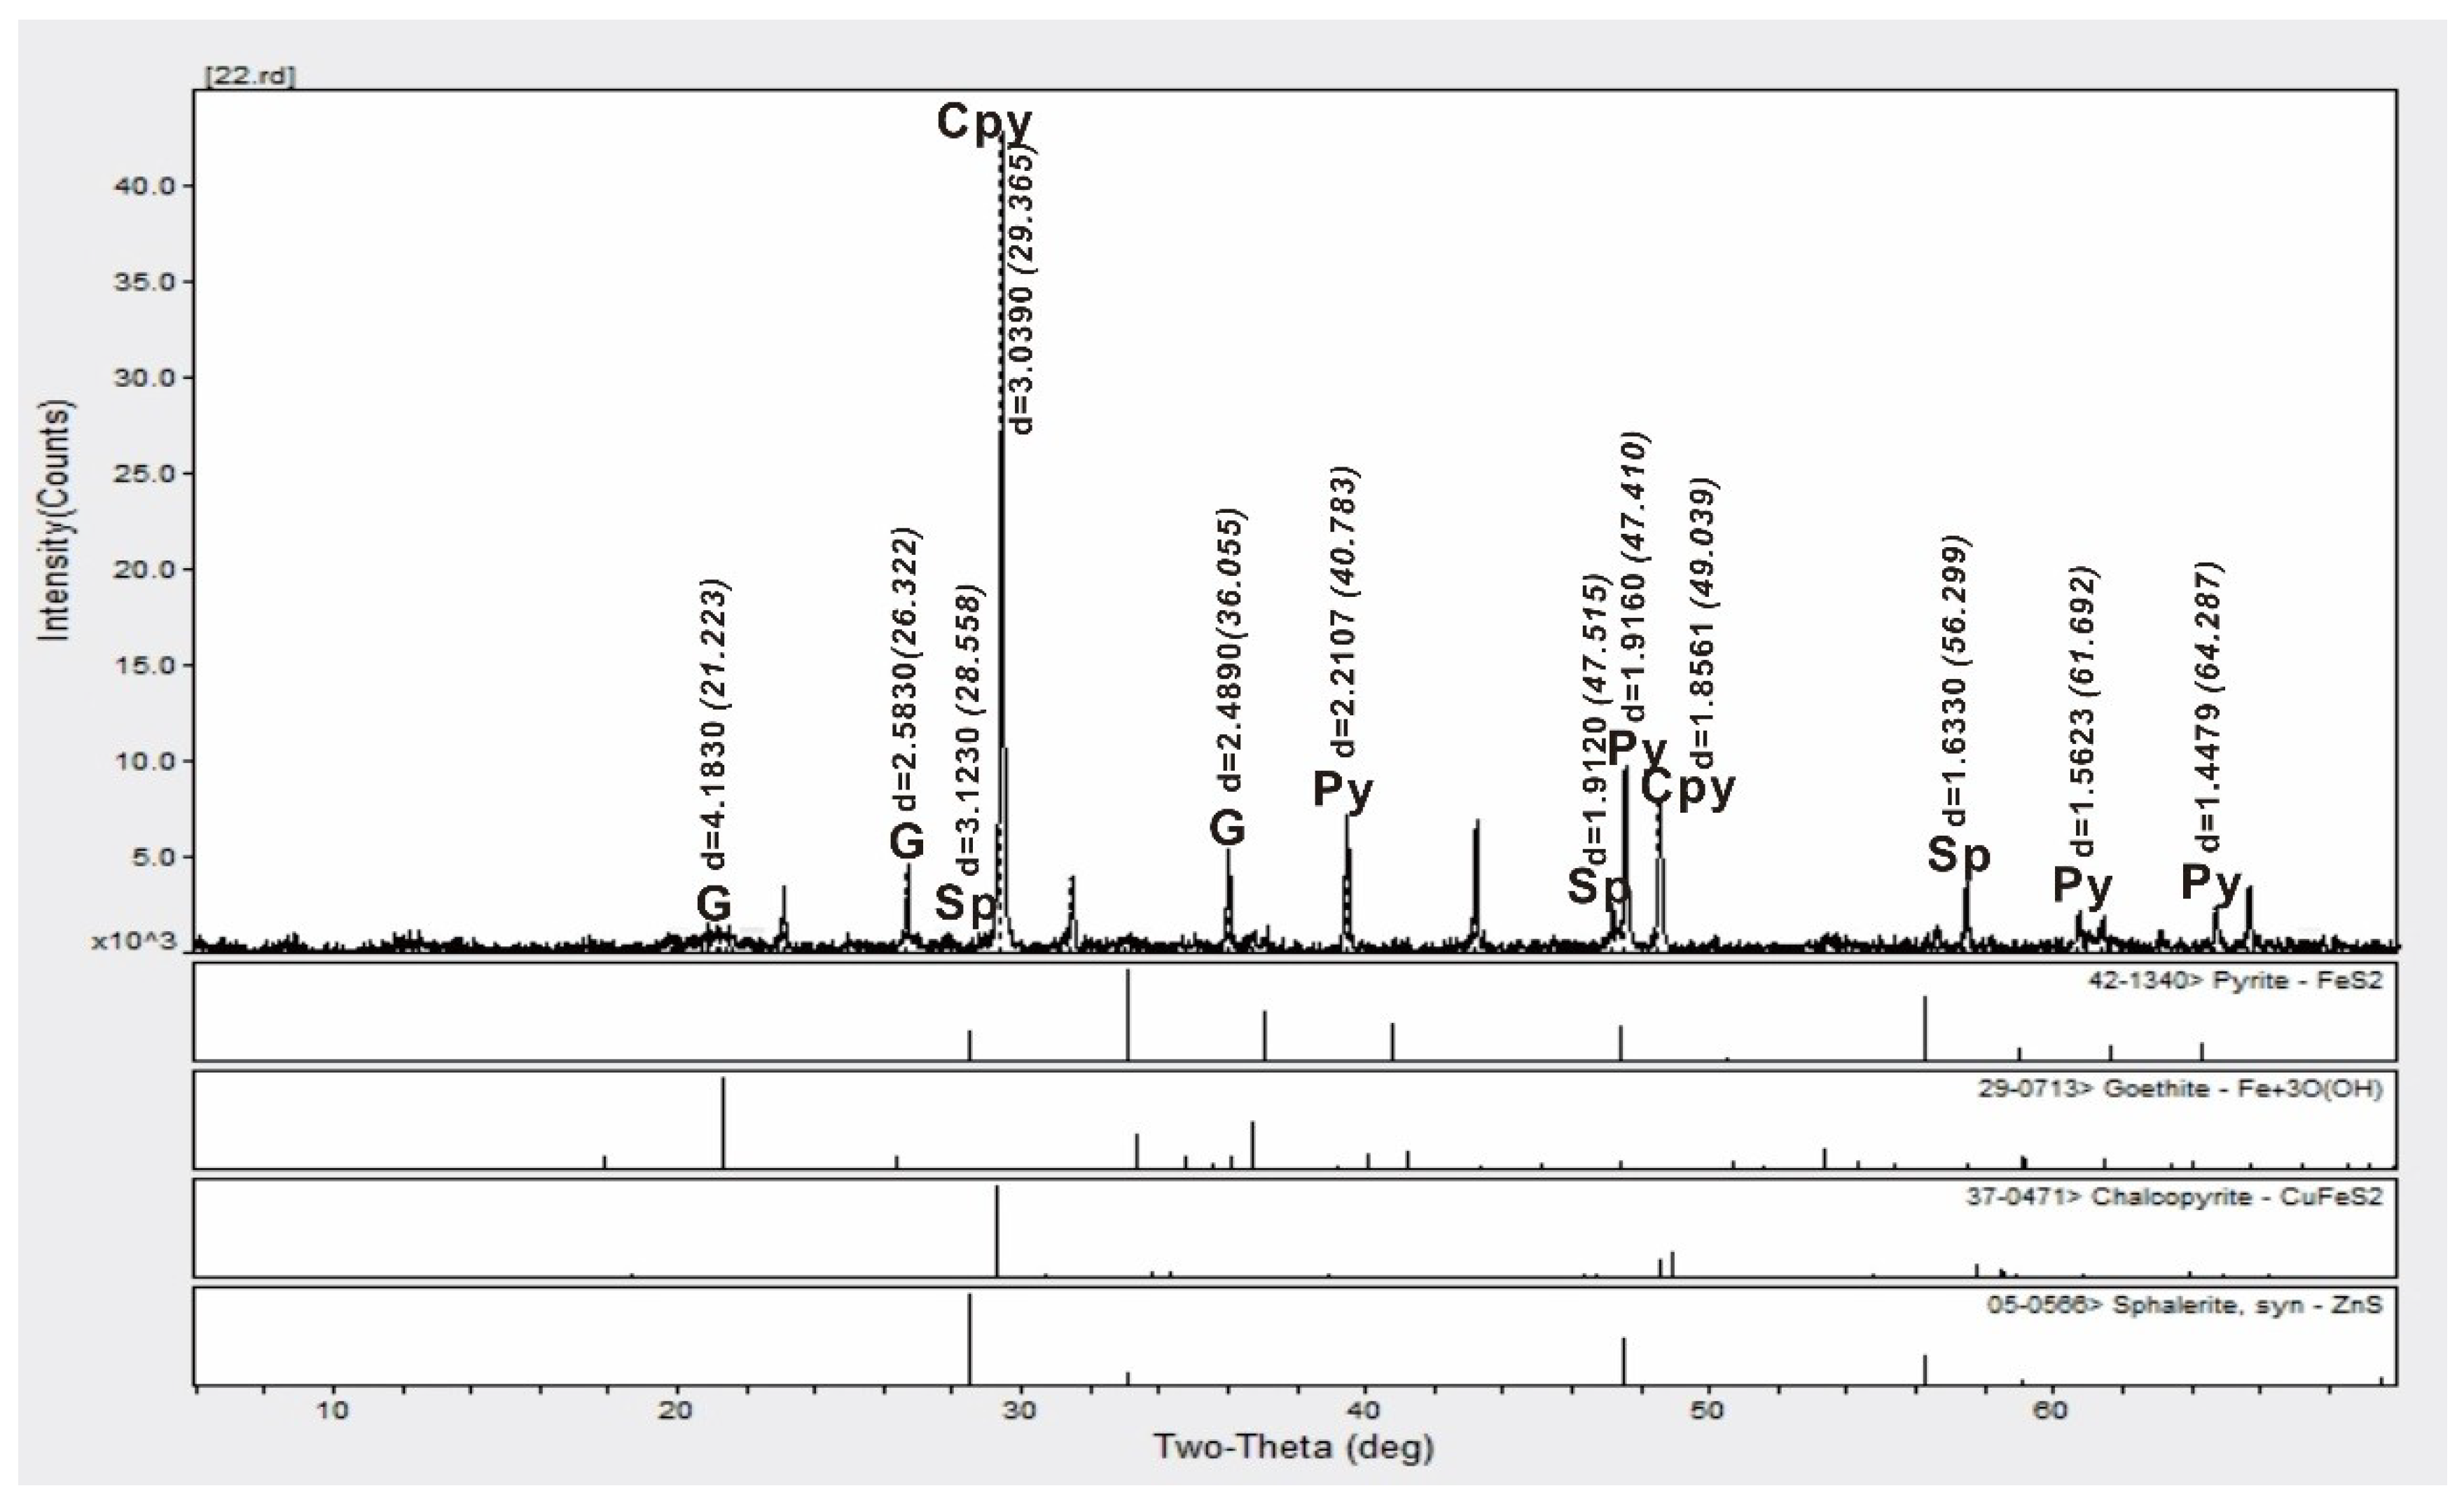
The overlap in S-isotope values (e.g., <4.5‰) between the Wocan-1 (3.0–3.6‰) and Wocan-2 sediments at station TVG-10 (4.1–4.3‰) suggest that station TVG-10 may not be entirely extinct. This assumption is supported by the dominant and minor abundance of chalcopyrite and secondary Cu-mineral assemblages (Table 2), and higher Cu (5.19 wt.%) contents in bulk sediment (Table 3) at TVG-10. A previous study [34] has suggested Fe-dominated mineral assemblages in extinct sulfide mounds in the TAG hydrothermal field. Also, the calculated sphalerite precipitation temperature (~233 °C, n = 5) further suggests the occurrence of a low-intermediate temperature hydrothermal venting, rather than extinction at TVG-10.
Similar heavier isotope values (6.4–7.4‰) at station TVG-05 (Wocan-2) were reported for sulfide-rich samples from the inactive sulfide chimney at a Yamanaka site in the back-arc spreading center of the southern Mariana Trough. The higher δ34S values were attributed to the incorporation of seawater sulfate derived sulfur without isotopic fractionation during the reducing process in a seafloor environment [9]. Therefore, the heavier isotope (6.4–8.7%) values and seawater-derived sulfur components of 37.6–41.4% (Table 6) further support pervasive post-depositional process via seafloor weathering on Wocan-2 sediments at station TVG-05 relative to TVG-10. However, the low δ34S values (3.0‰), the magmatic sulfur derived components of > 85%, and the seawater-derived sulfur of <15% (Table 6) support pervasive hydrothermal processes at station TVG-08 relative to TVG-07. Moreover, the observed micro-chimney structures (Figure 2G,H) further supports pervasive hydrothermal process at station TVG-08.
In summary, the grain texture, bulk geochemical analysis, mineral chemistry, calculated sphalerite precipitation temperature, and S isotope values show two distinct signatures (type-1 and type-2). Stations TVG-07 and TVG-08 from Wocan-1 shows the characteristics of the type-1 signature, while the type-2 signatures were mainly related to the station TVG-05 and TVG-10 of Wocan-2.

5. Conclusions

The sediment samples from the Wocan Hydrothermal Field were composed of sphalerite, barite, volcanic glass, amorphous silica, gypsum/anhydrite, chalcopyrite, pyrite, and Fe-oxides, and hydroxides in increasing order of abundance. Wocan-1 sediment showed distinct enrichment in pyrite and anhydrite, while Wocan-2 sediment (at TVG-10) showed distinct enrichment in chalcopyrite and Fe-oxyhydroxides. The bulk chemical compositions, mineral chemistry, calculated sphalerite precipitation temperature, and S-isotope signatures of the Wocan Hydrothermal field sediment demonstrated two distinct types (type-1 and type-2). The sediment samples from station TVG-07 and TVG-08 from Wocan-1 showed the signature of type-1, while the sediment samples of station TVG-05 and TVG-10 from Wocan-2 showed the type-2 signature. Wocan-1 sediment exhibited lower U contents, U/Fe ratio, and higher Fe/Mn values. The mineral chemistry of the sulfide separate was euhedral, with enriched Se and Co concentration relative to TVG-10 and TVG-05 of Wocan-2.
Moreover, the S-isotope values were lower, and the calculated sphalerite precipitation temperature was higher. The Wocan-2 sediment showed higher U contents, U/Fe ratio, and lower Fe/Mn values. The morphology of the sulfide separate was non-euhedral, with depleted Se and Co concentration. Moreover, the S-isotope values were higher, and the calculated sphalerite precipitation temperature was lower relative to TVG-07 and TVG-08 of Wocan-1.
Our results suggest that the sampling stations of Wocan-1 were near high temperature hydrothermal discharged environments. However, the sampling stations from Wocan-2 had undergone post-depositional alterations arising from the process of seafloor weathering. The hydrothermal contributions were higher in station TVG-08 relative to TVG-07, and TVG-05 had experienced stronger seafloor weathering relative to TVG-10.
Future geochemical investigations on subsurface core samples at TVG-10 is essential to have a better understanding of the evolution of the hydrothermal process at the station.

Supplementary Materials

The following are available online at https://www.mdpi.com/2075-163X/9/1/26/s1, Table S1–S3: Mineral chemistry (EPMA concentrations, wt.%) of sulfide separates of metal-enriched sediments. Table S4: Major and trace element composition of bulk sediment of Wocan Hydrothermal field. Table S5: S isotope data of metalliferous sediment from Wocan Hydrothermal Field.

Author Contributions

H.X. conceived, designed and fund the experiments; S.O.P. wrote the first draft (with contributions from all other co-authors), prepared the samples, and performed the experiments. C.Y. worked with the author during the sample investigations; Q.Z. analyzed the bulk samples, designed the bathymetric map, and supplied the needed laboratory materials; W.Y. co-supervised the SEM and EPMA investigations; Y.Y. co-supervised the project.

Funding

This research was funded by the National Key R&D program of China (2017YFC0306701; 2018YFC0309903), the National Natural Science Foundation of China (91228101), the China Ocean Mineral Resources R&D Association project (DY 135-S2-1), and the Fundamental Research Funds for National Non-profit Institute Grant (“No. JG1802”).

Acknowledgments

The authors sincerely appreciate the captains and crew of R/V Zhukezhen (DY 28th) for their immense support during the investigations and sampling of the WHF. We also thank the two anonymous reviewers for their valuable contributions on an earlier version of this paper.

Conflicts of Interest

The authors declare no conflict of interest.

Appendix A

Figure A1. SEM photomicrographs and EDS spectra of typical sulfide, sulfate, and oxyhydroxides. (A,B) sphalerite separates and EDS spectrum; (C,D) pyrite separates and EDS spectrum; (E,F) barite separates and EDS spectrum; (G,H) chalcopyrite separates and EDS spectrum (I,J) anhydrite separates and EDS spectrum; (K,L) Fe-oxyhydroxide separates and EDS spectrum.
Minerals 09 00026 g0a1

Appendix B

Figure A2. Bulk XRD patterns of representative samples of Wocan-1 (station 28I-TVG07); the 2θ values are enclosed in the bracket, whereas, the first values are the d values. Characteristic peak values were compared with References [35,36]. Abbreviations Sp: sphalerite; Cpy: chalcopyrite; Py: pyrite, Gy: Gypsum.
Minerals 09 00026 g0a2

Appendix C

Figure A3. Bulk XRD patterns of representative samples of Wocan-1 (station 28I-TVG08); the 2θ values are enclosed in the bracket, whereas the first values are the d values. Characteristic peak values were compared with References [35,36]. Abbreviations G: Goethite; B: Barite; Sp: sphalerite; Cpy: chalcopyrite; Py: pyrite, Gy: Gypsum.
Minerals 09 00026 g0a3

Appendix D

Figure A4. Bulk XRD patterns of representative samples of Wocan-2 (station 28I-TVG10); the 2θ values are enclosed in the brackets, whereas the first values are the d values. Characteristic peak values were compared with References [35,36]. Abbreviations G: Goethite; Sp: sphalerite; Cpy: chalcopyrite; Py: pyrite. Other XRD peaks on Wocan-2 sediment have been reported in Reference [37].
Minerals 09 00026 g0a4

References

  1. Edmond, J.M.; Measures, C.; McDuff, R.E.; Chan, L.H.; Collier, R.; Grant, B.; Gordon, L.I.; Corliss, J.B. Ridge crest hydrothermal activity and the balances of the major and minor elements in the ocean: The Galapagos data. Earth Planet. Sci. Lett. 1979, 46, 1–18. [Google Scholar] [CrossRef]
  2. Kadko, D.; Baross, J.; Alt, J.C. The Magnitude and Global Implications of Hydrothermal Flux. In Geophysical Monograph Series; American Geophysical Union: Washington, DC, USA, 1995; Volume 91, pp. 446–466. 091p. [Google Scholar]
  3. Dias, Á.S.; Barriga, F.J.A.S. Mineralogy and geochemistry of hydrothermal sediments from the serpentinite-hosted Saldanha hydrothermal field (36°34′ N; 33°26′ W) at MAR. Mar. Geol. 2006, 225, 157–175. [Google Scholar] [CrossRef]
  4. Baker, E.T.; German, C.R.; Elderfield, H. Hydrothermal plumes over Spreading-center axes: Global distribution and geological inferences. In Seafloor Hydrothermal Systems: Physical, Chemical, Biological, and Geological Interactions; American Geophysical Union: Washington, DC, USA, 1995; pp. 47–71. [Google Scholar] [CrossRef]
  5. Baker, E.T.; German, C.R. On the global distribution of hydrothermal vent Fields. In Mid-Ocean Ridges: Hydrothermal Interactions between the Lithosphere and Oceans; German, C.R., Lin, J., Parson, L., Eds.; American Geophysical Union: Washington, DC, USA, 2004; pp. 245–266. [Google Scholar]
  6. De Martins, B.J.; Sohn, R.A.; Canales, P.J.; Humphris, S.E. Kinematics and geometry of active detachment faulting beneath the Trans-Atlantic Geotraverse (TAG) hydrothermal field on the Mid-Atlantic Ridge. Geology 2007, 35, 711–714. [Google Scholar] [CrossRef]
  7. Mills, R.A. Hydrothermal deposits and metalliferous sediments from TAG, 26° N Mid-Atlantic Ridge. Geol. Soc. Lond. Spéc. Publ. 1995, 87, 121–132. [Google Scholar] [CrossRef]
  8. Dias, Á.S.; Mills, R.A.; Taylor, R.N.; Ferreira, P.; Barriga, F.J.A.S. Geochemistry of a sediment push-core from the Lucky Strike hydrothermal field, Mid-Atlantic Ridge. Chem. Geol. 2008, 247, 339–351. [Google Scholar] [CrossRef]
  9. Ikehata, K.; Suzuki, R.; Shimada, K.; Ishibashi, J.; Urabe, T. Mineralogical and Geochemical Characteristics of Hydrothermal Minerals Collected from Hydrothermal Vent Fields in the Southern Mariana Spreading Center. In Subseafloor Biosphere Linked to Hydrothermal Systems: TAIGA Concept; Ishibashi, J.-I., Okino, K., Sunamura, M., Eds.; Springer: Japan, Tokyo, 2015; pp. 275–287. [Google Scholar] [CrossRef]
  10. Humphris, S.E.; Klein, F. Progress in Deciphering the Controls on the Geochemistry of Fluids in Seafloor Hydrothermal Systems. Annu. Rev. Mar. Sci. 2018, 10, 315–343. [Google Scholar] [CrossRef] [PubMed]
  11. Gurvich, E.G. Metalliferous Sediments of the World Ocean: Fundamental Theory of Deep-Sea Hydrothermal Sedimentation; Springer: Berlin, Germany, 2006. [Google Scholar]
  12. Dias, A.S. Geochemistry of Deep-Sea Hydrothermal Sediments from the Saldanha and Lucky Strike Hydrothermal Fields (Mid-Atlantic Ridge), Universidade de Lisboa. 2009. Available online: https://core.ac.uk/display/12421951 (accessed on 12 August 2018).
  13. Mills, R.A.; Elderfield, H. Rare Earth Element geochemistry of hydrothermal deposits from the active TAG Mound 26° N Mid-Atlantic Ridge. Geochem. Cosmochim. Acta 1995, 59, 3511–3524. [Google Scholar] [CrossRef]
  14. Wang, Y.; Han, X.; Petersen, S.; Frische, M.; Qiu, Z.; Li, H.; Li, H.; Wu, Z.; Cui, R. Mineralogy and trace element geochemistry of sulfide minerals from the Wocan Hydrothermal Field on the slow-spreading Carlsberg Ridge, Indian Ocean. Ore Geol. Rev. 2017, 84, 1–19. [Google Scholar] [CrossRef]
  15. Qiu, Z.; Han, X.; Wang, Y. Manned deep submarine observation of modern seafloor hydrothermal activities in Northwest India Ocean, Abstract of proceedings at the 5th international sedimentological conference, Nanjing, China, 2017.
  16. Jin, C.; Li, C.; Algeo, T.J.; Planavsky, N.J.; Cui, H.; Yang, X.; Zhao, Y.; Zhang, X.; Xie, S. A highly redox-heterogeneous ocean in South China during the early Cambrian (∼529–514 Ma): Implications for biota-environment co-evolution. Earth Planet. Sci. Lett. 2016, 441, 38–51. [Google Scholar] [CrossRef] [Green Version]
  17. Keith, M.; Haase, K.M.; Schwarz-Schampera, U.; Klemd, R.; Petersen, S.; Bach, W. Effects of temperature, sulfur and oxygen fugacity on the composition of sphalerite from submarine hydrothermal vents. Geology 2014, 48, 699–702. [Google Scholar] [CrossRef]
  18. German, C.R.; Higgs, N.C.; Thomson, J.; Mills, R.; Elderfield, H.; Blusztajn, J.; Fleer, A.P.; Bacon, M.P. A geochemical study of metalliferous sediment from the TAG hydrothermal mound, 26°8′ N, Mid-Atlantic Ridge. J. Geophys. Res. 1993, 98, 9683–9692. [Google Scholar] [CrossRef]
  19. Mills, R.A.; Thomson, J.; Elderfield, H.; Hinton, R.W.; Hyslop, E. Uranium enrichment in metalliferous sediments from the Mid-Atlantic Ridge. Earth Planet. Sci. Lett. 1994, 124, 35–47. [Google Scholar] [CrossRef]
  20. German, C.R.; Hergt, J.; Palmer, M.R.; Edmond, J.M. Geochemistry of a hydrothermal sediment core from the OBS vent-field, 21° N East Pacific Rise. Chem. Geol. 1999, 155, 65–75. [Google Scholar] [CrossRef]
  21. Hannington, M.D.; Tivey, M.K.; Larocque, A.C.L.; Petersen, S.; Rona, P.A. The Occurrence of gold in sulfide deposits of the TAG hydrothermal field, Mid-Atlantic Ridge. Can. Miner. 1995, 33, 1285–1310. [Google Scholar]
  22. Hannington, M.D.; Poulsen, K.H.; Thompson, J.F.H.; Sillitoe, R.H. Volcanogenic gold in the massive sulfide environment. In Volcanic-Associated Massive Sulfide Deposits: Processes and Examples in Modern and Ancient Settings; Reviews in Economic Geology; Barrie, C.T., Hannington, M.D., Eds.; Society of Economic Geologists: Littleton, CO, USA, 1999; Volume 8, pp. 325–356. [Google Scholar]
  23. Keith, M.; Smith, D.J.; Jenkin, G.R.T.; Holwell, D.A.; Dye, M.D. A review of Te and Se systematics in hydrothermal pyrite from precious metal deposits: Insights into ore-forming processes. Ore Geol. Rev. 2018, 96, 269–282. [Google Scholar] [CrossRef]
  24. McDermott, J.M.; Ono, S.; Tivey, M.K.; Seewald, J.S.; Shanks, W.C.; Solow, A.R. Identification of sulfur sources and isotopic equilibria in submarine hot-springs using multiple sulfur isotopes. Geochim. Cosmochim. Acta 2015, 160, 169–187. [Google Scholar] [CrossRef]
  25. Zeng, Z.; Li, J.; Jiang, F.; Zhai, S.; Qin, Y.; Hou, Z. Sulfur isotopic composition of seafloor hydrothermal sediment from the Jade hydrothermal field in the central Okinawa Trough and its geological significance. Acta Oceanol. Sin. 2002, 21, 395–405. [Google Scholar]
  26. Keith, M.; Haase, K.M.; Klemd, R.; Krumm, S.; Strauss, H. Systematic variations of trace element and sulfur isotope compositions in pyrite with stratigraphic depth in the Skouriotissa volcanic-hosted massive sulfide deposit, Troodos ophiolite, Cyprus. Chem. Geol. 2016, 423, 7–18. [Google Scholar] [CrossRef]
  27. Zeng, Z.; Ma, Y.; Chen, S.; Selby, D.; Wang, X.; Yin, X. Sulfur and lead isotopic compositions of massive sulfides from deep-sea hydrothermal systems: Implications for ore genesis and fluid circulation. Ore Geol. Rev. 2017, 87, 155–171. [Google Scholar] [CrossRef] [Green Version]
  28. Herzig, P.M.; Petersen, S.; Hannington, M.D. Geochemistry and sulfur isotopic composition of the TAG hydrothermal mound, Mid-Atlantic Ridge, 26° N. Proc. Ocean Drill. Program Sci. Results 1998, 158, 47–70. [Google Scholar]
  29. Rees, C.E.; Jenkins, W.J.; Monster, J. The sulphur isotopic composition of ocean water sulphate. Geochim. Cosmochim. Acta 1978, 42, 377–381. [Google Scholar] [CrossRef]
  30. Gemmell, J.B.; Sharpe, R. Detailed sulfur-isotope investigation of the TAG hydrothermal mound and stock work zone, 26° N, Mid-Atlantic Ridge. Proceedings of the Ocean Drilling Program. Sci. Results 1998, 158, 71–84. [Google Scholar]
  31. Janecky, D.R.; Shanks, W.C. Computational modelling of chemical and sulfur isotopic reaction processes in seafloor hydrothermal systems: Chimneys, massive sulfides and subjacent alteration zones. Can. Miner. 1988, 26, 805–825. [Google Scholar]
  32. Lein, A.Y.; Grinenko, V.A.; Ulyanova, N.V.; Lisitsin, A.P. Evolution of Oceanic hydro-thermal system and sulphur isotope composition of sulphides. Geochimya 1991, 3, 307–319. [Google Scholar]
  33. Butler, B.; Fallick, A.E.; Nesbitt, R.W. Mineralogy, sulphur isotope Geochemistry and the development of sulphide structures at the Broken Spur hydrothermal vent site, 29°10′ N, Mid-Atlantic Ridge. J. Geol. Soc. 1998, 155, 773–785. [Google Scholar] [CrossRef]
  34. Lehrmann, B.; Stobbs, I.J.; Lusty, P.A.; Murton, B.J. Insights into Extinct Seafloor Massive Sulfide Mounds at the TAG, Mid-Atlantic Ridge. Minerals 2018, 8, 302. [Google Scholar] [CrossRef]
  35. Buseck, P.R. Structural relationship between pyrite and marcasite. Am. Mineral. 1996, 81, 119–125. [Google Scholar]
  36. Criddle, A.J.; Stanley, C.J. (Eds.) Quantitative Data File for Ore Minerals, 3rd ed.; Chapman & Hall: London, UK, 1993; Volume 84, Available online: http://handbookofmineralogy.org/pdfs (accessed on 22 December 2018).
  37. Popoola, S.; Han, X.; Wang, Y.; Qiu, Z.; Ye, Y. Geochemical investigations on Fe–Si–Mn oxyhydroxides deposits in Wocan Field on the slow spreading Carlsberg Ridge, Indian Ocean. Minerals 2019, 9. [Google Scholar] [CrossRef]
Figure 1. Bathymetric map of (A) showing the locations of Wocan-1 and Wocan-2 hydrothermal sites and the sampling stations in the ridge flank; (B) The enlarged map of A showing the sampling stations in Wocan-1 and Wocan-2 hydrothermal field.
Minerals 09 00026 g001
Figure 2. SEM and optical photomicrographs of typical sulfide separates: (A,B) euhedral pyrite and chalcopyrite separates in the Wocan-1 site (station 28I-TVGO7-28I-TVG08); (CF) effect of weathering on pyrite and chalcopyrite separates in the Wocan-2 site (station 28I-TVG10); (G,H) micro-chimney fragments separated from bulk sediment of Wocan-1 (station 28I-TVG-08). E, F were observed by optical microscope. Abbreviations: Fe-ox: Fe-oxyhydroxides; bn: bornite; Py: pyrite.
Minerals 09 00026 g002
Figure 3. Frequency histogram for δ34 S ‰ of Wocan-1 and Wocan-2 sediments.
Minerals 09 00026 g003
Figure 4. Schematic diagram showing the probable location of Wocan-I and Wocan-2 stations relative to high temperature seafloor hydrothermal systems, modified from Reference [10].
Minerals 09 00026 g004
Table 1. The location and sampling information of studied sediment samples in WHF.
SiteStationLongitude (E)Latitude (N)Depth (m)Type of Samples
Wocan-128I-TVG0760°31.534′6°21.796′2989Metalliferous sediment
28I-TVG0860°31.635′6°21.756′2973Metalliferous sediment
Wocan-228I-TVG1060°30.372′6°21.866′3104Metalliferous sediment
28II-TVG0560°30.226′6°22.534′3105Metalliferous sediment
Ridge flank28I-TVG1360°13.190′6°35.675′3254Pelagic sediment
28I-TVG1260°13.550′6°30.462′2009Pelagic sediment
Table 2. Qualitative mineral assemblages of Wocan-1 and Wocan-2 metalliferous sediments and the ridge flank sediment.
StationPyriteChalcopyriteSphaleriteSecondary Cu-sulfidesBariteGypsum/AnhydriteFe-oxyhydroxidesAmorphous SilicaVolcanic GlassBiogenic Calcite
Wocan-1
28I-07XXXXXX- XXXXXXXXX
28I-08XXXXXXXXXXXXXXXXX
Wocan-2
28I-10XXXXXXXXXXXXXXXXX
28II-05XXX ---XXXXXX
Ridge flanks
28I-12---------XXX
28I-13------X--XXX
Note: XXX: abundant, XX: minor, X: trace, -: not identified.
Table 3. Major and trace element compositions of the bulk sediment samples.
ElementWocan1Wocan2Ridge Flanks
TVG-07TVG-08TVG-05TVG-10TVG-12TVG-13
Fe (wt.%)30.941.22631.40.631.46
Mg (wt.%)1.310.490.50.140.440.79
Ca (wt.%)1.480.39.810.231.729.5
Mn (wt.%)0.020.030.090.060.040.03
Al (wt.%)1.380.090.820.470.631.52
Ti (wt.%)0.040.020.820.470.631.52
S (wt.%)7.87105.24100.631.52
Cu (ppm)31,10033,100851051,90060171
Zn (ppm)47108330289067504724
Pb (ppm)4314301584045.35.4
Ag (ppm)9.6615.853.416.250.250.09
Co (ppm)20.531.123516.74.67.7
Cr (ppm)322222171025
Ba (ppm)408019030600500
U (ppm)4.197.44.719.60.40.5
Th (ppm)0.50.21.10.211.3
V (ppm)2251502662251628
Fe/Mn154513732885231747
U/Fe1.36 × 10−51.80 × 10−51.81 × 10−56.24 × 10−56.35 × 10−53.42 × 10⁻⁵
Cu +Fe + Zn (wt.%)34.4845.3427.1437.270.641.48
Table 4. Micro-chemical (EPMA) compositions of chalcopyrite and pyrite separates.
(wt.%)StationSFeSeCuCoZnSbAgPbSnTlTotalCu/Fe Atom
ChalcopyriteMin34.2630.410.0132.690.02bdl0.010.010.05bdlbdl97.530.99
Max36.4930.860.0335.120.040.020.030.010.12bdlbdl101.731.01
n = 11Av35.4330.330.0234.460.03 0.020.010.08 100.381.00
Wocan-1STDEV±0.59±0.46±0.01±0.91±0.00 ±0.00 ±0.02 ±1.2±0.01
ChalcopyriteMin34.7930.13bdl34.47bdl0.01bdlbdl0.030.020.0299.470.98
Max35.5630.98bdl35.00bdl0.06bdl0.070.070.030.04101.811.01
n = 12Av35.1330.57 34.75 0.03 0.050.020.03100.580.99
Wocan-2STDEV±0.24±0.28 ±0.18 ±0.01 ±0.01±0.01±0.01±0.38±0.01
(wt.%)StationSFeAsSeCuCoZnSbAgPbBiAuNiS/Fe AtomTotal
PyriteMin51.7045.190.020.020.010.040.010.010.010.30bdl0.01bdl1.9497.14
Max53.1746.840.310.050.360.060.020.01 0.120.060.020.042.05101.23
n = 26Av53.1546.360.110.030.080.050.010.01 0.15 0.01 2.0099.97
Wocan-1STDEV±0.65±0.33±0.12±0.01±0.11±0.00±0.00±0.00 ±0.04 ±0.03±0.77
PyriteMin51.8746.120.10bdl0.01bdlbdlbdlbdl0.04bdlbdl 1.9698.14
Max53.9746.880.13bdl0.17bdl0.02bdlbdl0.08bdl0.01 2.01101.26
n = 11Av53.1446.540.12 0.08 0.06 1.9999.94
Wocan-2STDEV±0.59±0.25±0.02 ±0.05 ±0.02 ±0.01 ±0.01 0.01±0.78
Min: minimum; Max: maximum; Av: average; STDEV: standard deviation, EPMA values are reported in 2 decimal.
Table 5. Micro-chemical (EPMA) composition of sphalerite separates and precipitation temperature.
(wt.%)StationSFeSeCuMoZnCdPbTotalFe/ZnT (°C)
SphaleriteMin33.924.04 0.070.0161.080.460.0499.620.06278.03
Max34.204.060.010.090.0461.290.500.05100.240.07278.15
n = 3Av34.094.05 0.100.0261.220.480.05100.010.07278.08
Wocan-1STDEV±0.14±0.33 ±0.02±0.01±0.11±0.02±0.00±0.27±0.00±0.06
SphaleriteMin33.400.19bdl0.010.0264.110.200.0197.940.00229.40
Max32.751.360.010.060.0466.450.310.04101.020.02243.47
n = 5Av33.280.47 0.030.0365.140.270.0399.250.01232.73
Wocan-2STDEV±0.56±0.50 ±0.02±0.00±0.90±0.05±0.01±0.78±0.00±6.02
Min: minimum; Max: maximum; AV: average; STDEV: standard deviation, EPMA values are reported in 2 decimal.
Table 6. The results of bulk sulfur isotope analysis and proportions of sulfur sources of the Wocan-1 and Wocan-2 sediments.
Stationδ34Spy-VCDT (‰)Seawater Derived (%)Magmatic Origin (%)
TVG083.014.385.7
TVG073.617.182.9
TVG073.617.182.9
TVG073.617.182.9
TVG104.119.580.5
TVG104.320.579.5
TVG104.320.579.5
TVG056.430.569.5
TVG057.937.662.4
TVG058.741.458.6

