Article

Distribution of Rare Earth Elements plus Yttrium among Major Mineral Phases of Marine Fe–Mn Crusts from the South China Sea and Western Pacific Ocean: A Comparative Study

1
School of Marine Sciences, Sun Yat-sen University, Guangzhou 510006, China
2
Guangdong Provincial Key Laboratory of Marine Resources and Coastal Engineering, Guangzhou 510006, China
3
School of Earth Science and Engineering, Sun Yat-sen University, Guangzhou 510275, China
4
Fourth Institute of Oceanography, Ministry of Natural Resources, Beihai 536000, China
*
Authors to whom correspondence should be addressed.
Minerals 2019, 9(1), 8; https://doi.org/10.3390/min9010008
Submission received: 23 November 2018 / Revised: 14 December 2018 / Accepted: 19 December 2018 / Published: 23 December 2018

Abstract

:
Marine hydrogenetic Fe–Mn crusts on seamounts are known as potential mineral resources of rare earth elements plus yttrium (REY). In recent years, increasing numbers of deposits of Fe–Mn crusts and nodules were discovered in the South China Sea (SCS), yet the enrichment mechanism of REY is yet to be sufficiently addressed. In this study, hydrogenetic Fe–Mn crusts from the South China Sea (SCS) and the Western Pacific Ocean (WPO) were comparatively studied with mineralogy and geochemistry. In addition, we used an in situ REY distribution mapping method, implementing laser ablation inductively coupled plasma mass spectrometry (LA-ICP-MS) and a sequential leaching procedure to investigate the partitioning behavior of REY in the Fe–Mn crusts. The typical Fe–Mn crusts from SCS were mainly composed of quartz, calcite, vernadite (δ-MnO2), and amorphous Fe oxides/hydroxides (FeOOH). The Fe–Mn crusts from the Central SCS Basin and the WPO contained quartz, δ-MnO2, FeOOH, todorokite, and phillipsite. Furthermore, geochemical analysis indicated that the typical SCS crusts had a higher growth rate and lower REY concentrations. The LA-ICP-MS mapping results showed that the δ-MnO2 and FeOOH dominated the occurrence phases of REY in the SCS crusts. Four mineral phases (i.e., easily exchangeable and carbonate, Mn-oxide, amorphous FeOOH, and residual aluminosilicates) in these Fe–Mn crusts were separated by a sequential leaching procedure. In the SCS and WPO crusts, the majority of total REY (ΣREY) was distributed in the Mn-oxide and amorphous FeOOH phases. The post-Archean Australian shale-normalized REY patterns showed that light REY (LREY) and heavy REY (HREY) were preferentially adsorbed onto δ-MnO2 and FeOOH, respectively. It is noteworthy that ~27% of ΣREY was associated with the residual aluminosilicates phase of the WPO crusts. The La/Al ratios in the aluminosilicates phase of the typical SCS crusts were the values of the upper crust. We conclude that large amounts of terrigenous materials dilute the abundance of REY in the SCS crusts. In addition, the growth rates of Fe–Mn crusts have a negative correlation with the FeOOH-bound and aluminosilicate-bound REY. As a result of the fast growth rates, the SCS crusts contain relatively low concentrations of REY.

1. Introduction

Marine ferromanganese (Fe–Mn) crusts are Fe–Mn oxides/hydroxides that precipitate on seamounts, ridges, and plateaus devoid of sediments from seawater [1,2,3]. Fe–Mn crusts are classified into three main categories of origin: hydrogenetic, diagenetic, and hydrothermal [4,5]. The hydrogenetic Fe–Mn crusts are widespread in the open ocean and are important potential marine mineral resources containing a number of critical elements, such as Co, Cu, Ni, rare earth elements plus yttrium (REY), and other critical elements like V, Nb, Te, or Pt [1,2,6,7,8,9]. The Pacific holds significant reserves of Fe–Mn crust deposits, and there is a famous prime crust zone (PCZ) in the north-equatorial Pacific Ocean [1,7,10]. In addition, a number of mining areas with the potential for exploitation were also found in the Atlantic Ocean [8,11], Indian Ocean [12,13], and Arctic Ocean [14]. In addition to the open oceans, some Fe–Mn crust deposits were also discovered near the continental margin, such as the Baltic Sea [15], the California continental margin [2,16,17], and the South China Sea (SCS) [18,19,20,21].
The South China Sea (SCS), one of the largest marginal seas, is strongly subject to large terrestrial inputs and has very fast rates of sediment accumulation. Generally, the fast sediment accumulation rate is unfavorable for marine Fe–Mn precipitate mineralization. Yet, increasing numbers of deposits of Fe–Mn crusts and nodules were discovered in SCS in recent years and hotly studied [19,20,22]. Some mineral and geochemical data of the SCS Fe–Mn crusts were reported, showing that these SCS Fe–Mn crusts are hydrogenetic in origin [19,20]. Compared to the Fe–Mn crusts in the Pacific Ocean, the SCS ones have much higher contents of Li, Al, Si, Fe, Pb, and Th, but lower contents of Co, Ni, Cu, Zn, REY, and other heavy metals [19,20,23]. However, the interelement correlations and phase associations in the SCS crusts are yet to be sufficiently addressed. Previous studies were mostly concerned with the bulk composition of the deposits, which is not enough to understand how REY is scavenged from seawater in the continental marginal environment.
In this contribution, the Fe–Mn crusts from the SCS and WPO were comparatively studied with mineralogy and geochemistry. The samples were examined using in situ laser ablation inductively coupled plasma mass spectrometry (LA-ICP-MS) mapping in order to observe the occurrence phase of REY in the layer structure. Furthermore, major mineral phases (i.e., easily exchangeable and carbonate, Mn-oxide, amorphous FeOOH, and residual aluminosilicates phases) of these Fe–Mn crusts were separated using a sequential leaching experiment which was proven to be an effective method for understanding the incorporation of elements in mineral phases of Fe–Mn crusts [8,14,24,25,26,27]. These results are expected to provide better information on the process of REY incorporation into Fe–Mn crusts in a marginal sea.

2. Materials and Methods

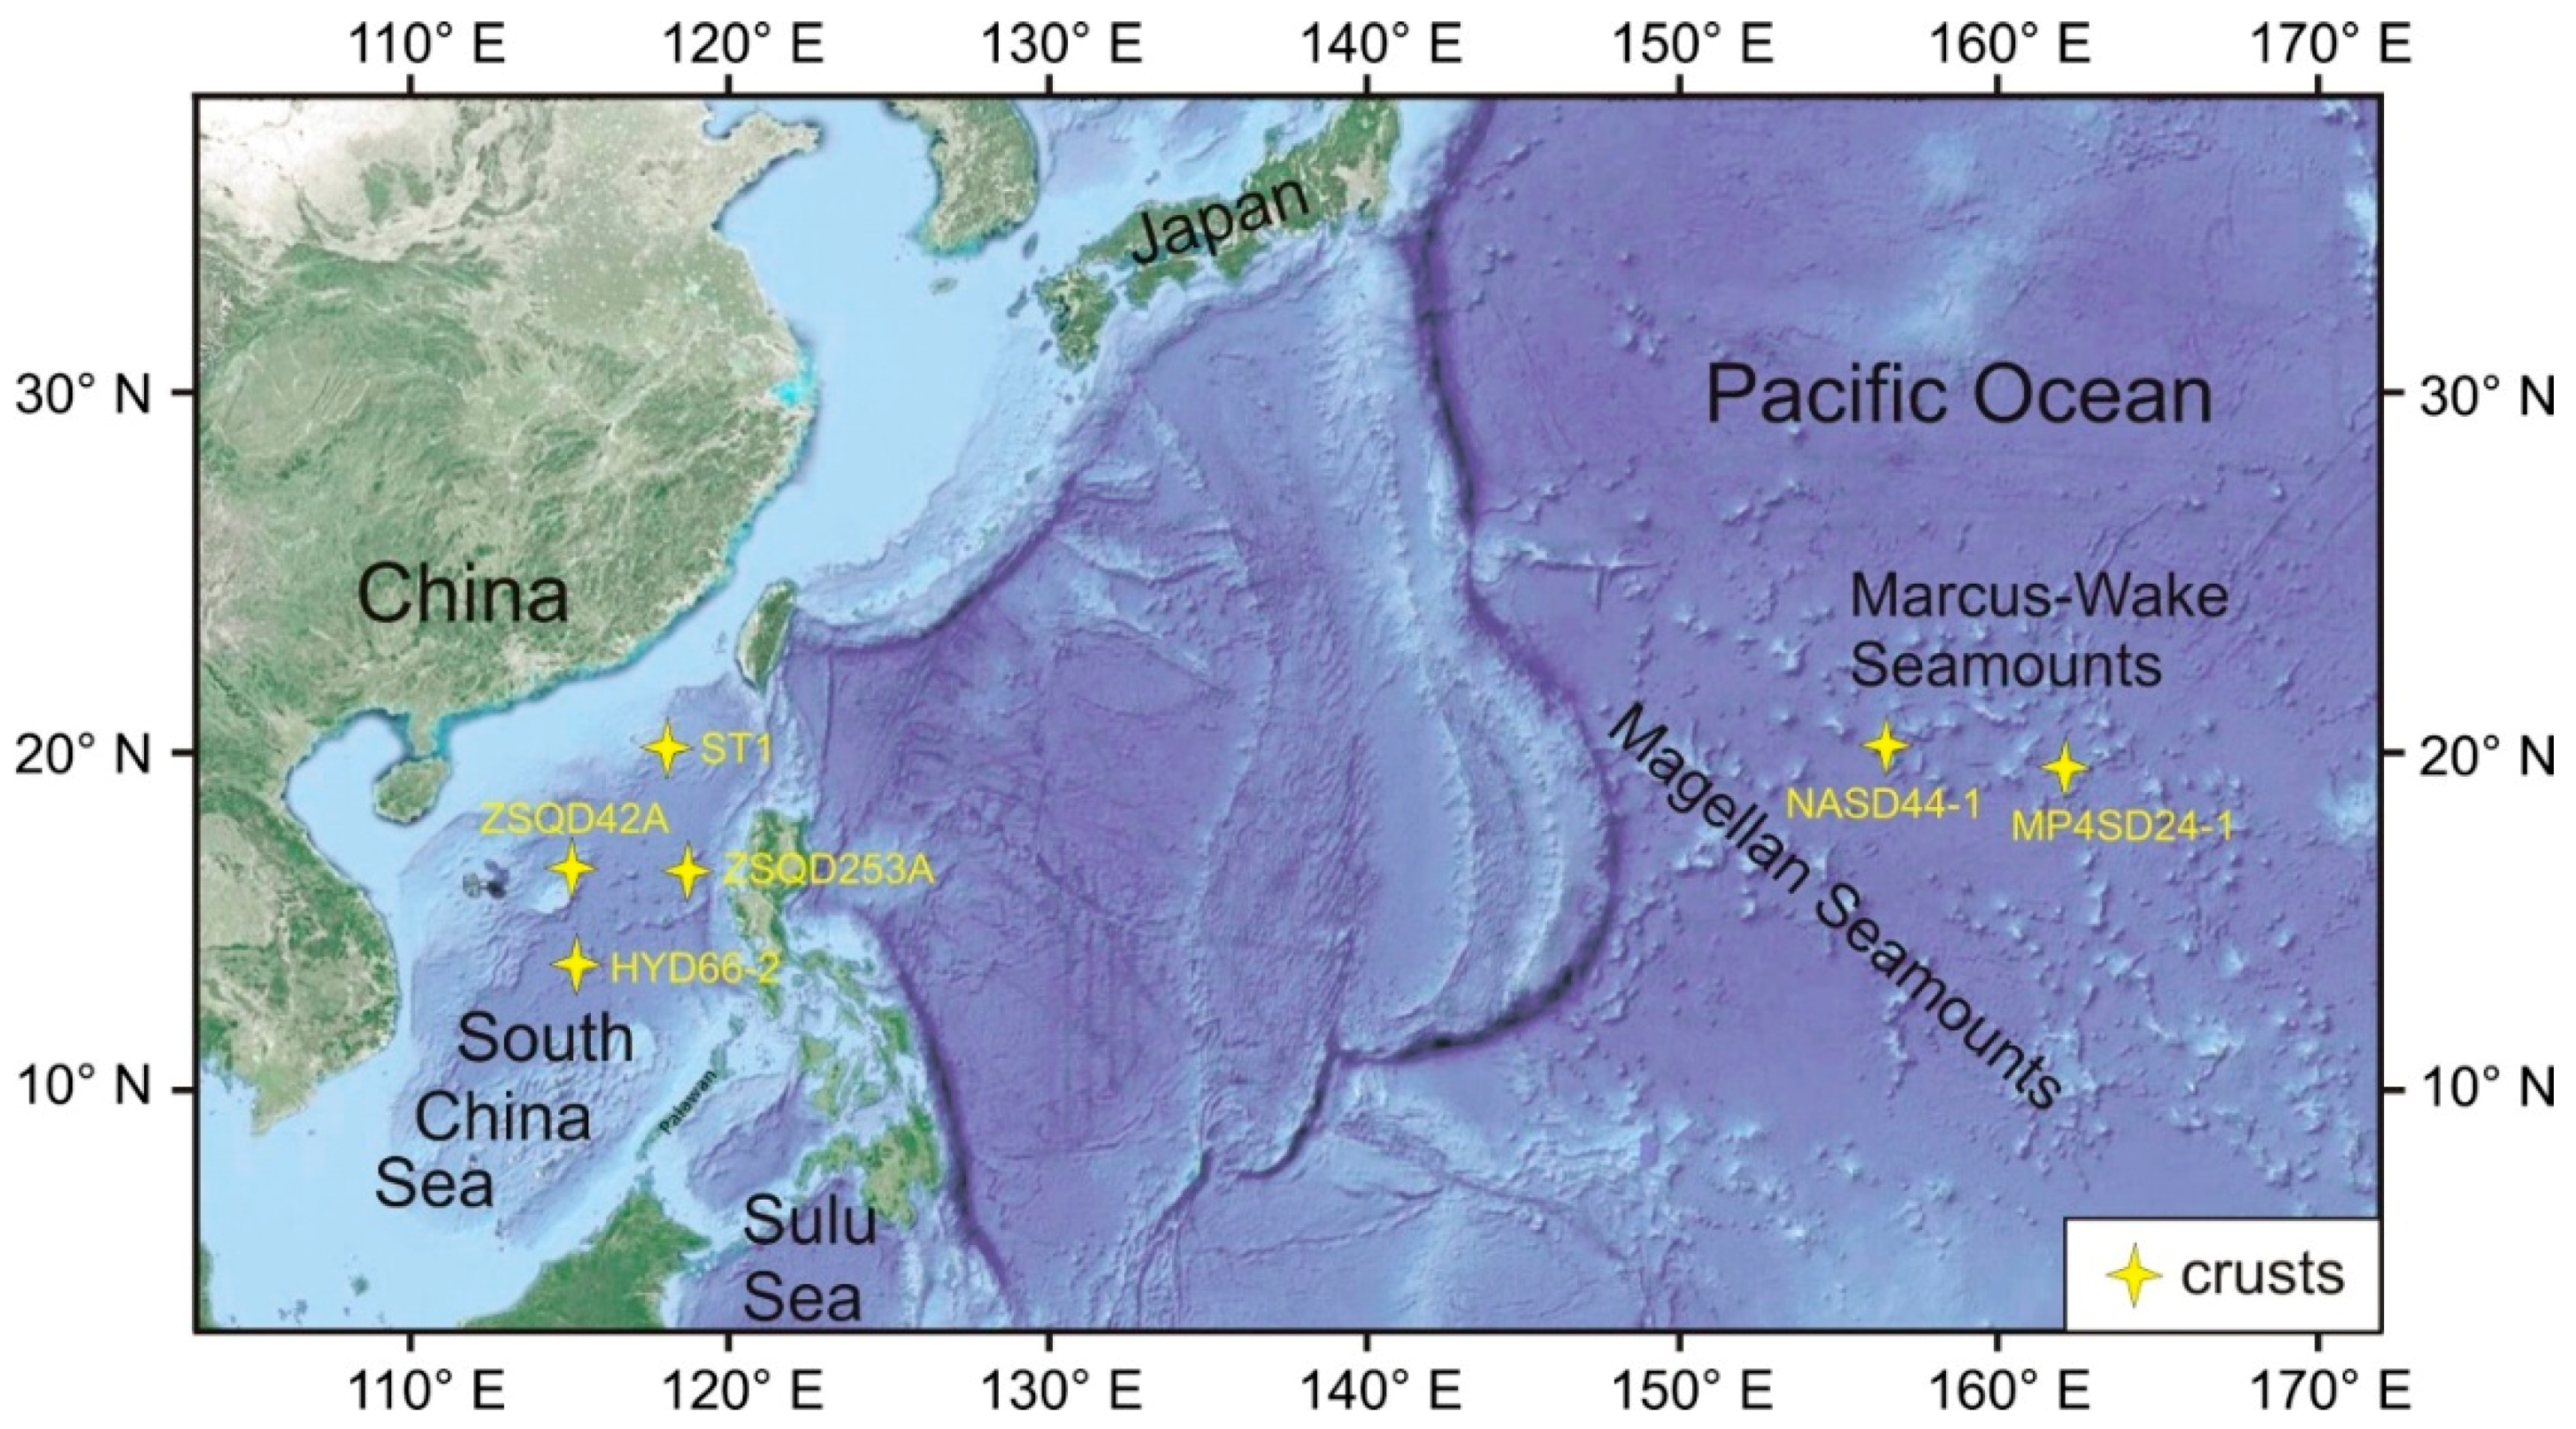
2.1. Geological Setting and Samples

The submarine topography of the SCS appears as a ladder-like form from the edge to the center (Figure 1) [28]. Located near the focus of the convergence among three plates (i.e., Eurasian, Pacific–Philippine Sea, and Indo-Australian) with two superconvergent zones (the circum-Pacific and Tethyan zones) [29], the SCS has a very complex developmental process and basement rocks from multiple periods. The basement of the SCS mainly consists of Cenozoic metamorphic rock in the center and Paleozoic–Mesozoic basement on the edge. The edge of the SCS is a continental slope with elevated seafloor features, while the center of the SCS is a deep-sea basin with many seamounts and sea hills. On the seafloor of the SCS, terrigenous sediment, hemipelagic clay, and siliceous ooze distribute from the continental slope to the Central SCS Basin [30]. The Western Pacific Ocean (WPO) has a deep basin with a depth of over 6000 m, where there are a large number of islands and chain-shaped seamounts (such as Magellan seamounts and Marcus-Wake seamounts).
Fe–Mn crusts from the SCS and WPO were studied (coordinates as shown in Table 1). The SCS crusts were collected by trawling on the research vessel “Haiyangsihao” of the Guangzhou Marine Geological Survey (GMGS) in 2011 and 2012, and the sampling depths ranged from 1150 m to 1160 m. The WPO crusts were collected by shallow core drilling on the research vessel ‘‘Haiyangsihao” of the GMGS during the 27th cruise in 2012. Sample ST1 involves the northern continental slope of the SCS; ZSQD42A involves the north-western (NW) continental slope of the SCS; ZSQD253A grows on the seamount in the eastern SCS; HYD66-2 involves the seamount in the Central SCS Basin; and NASD44-1 and MP4SD24-1 involve Magellan seamounts and Marcus-Wake seamounts, respectively. The substrates of these Fe–Mn crusts were limestone, altered basalt, and breccia (Table 1). The detail petrographic study was reported in Reference [19].

2.2. Analytical Techniques

2.2.1. Mineralogical Analysis of Bulk Samples

Each sample was washed with ultra pure water (Millipore, MA, USA), dried in a blower oven at 30 °C for 24 h, and then ground into 200-mesh powders in an agate grinder. Then, 200 mg of each of the powders was analyzed by X-ray diffraction (XRD). XRD data were collected on a two-dimensional (2D) image-plate detector using a Rigaku D/MAX Rapid II instrument (Rigaku, Tokyo, Japan) taken with a 0.1-mm collimator using Mo-Kα radiation at Guangdong Provincial Key Laboratory of Marine Resources and Coastal Engineering (GPKLMRCE), Sun Yat-sen University (SYSU, Guangzhou, China). All samples were analyzed twice under the same conditions; then, the signals were merged in order to improve the signal-to-noise ratio. Identification of major minerals was completed via PDXL2 software (Rigaku, Tokyo, Japan).

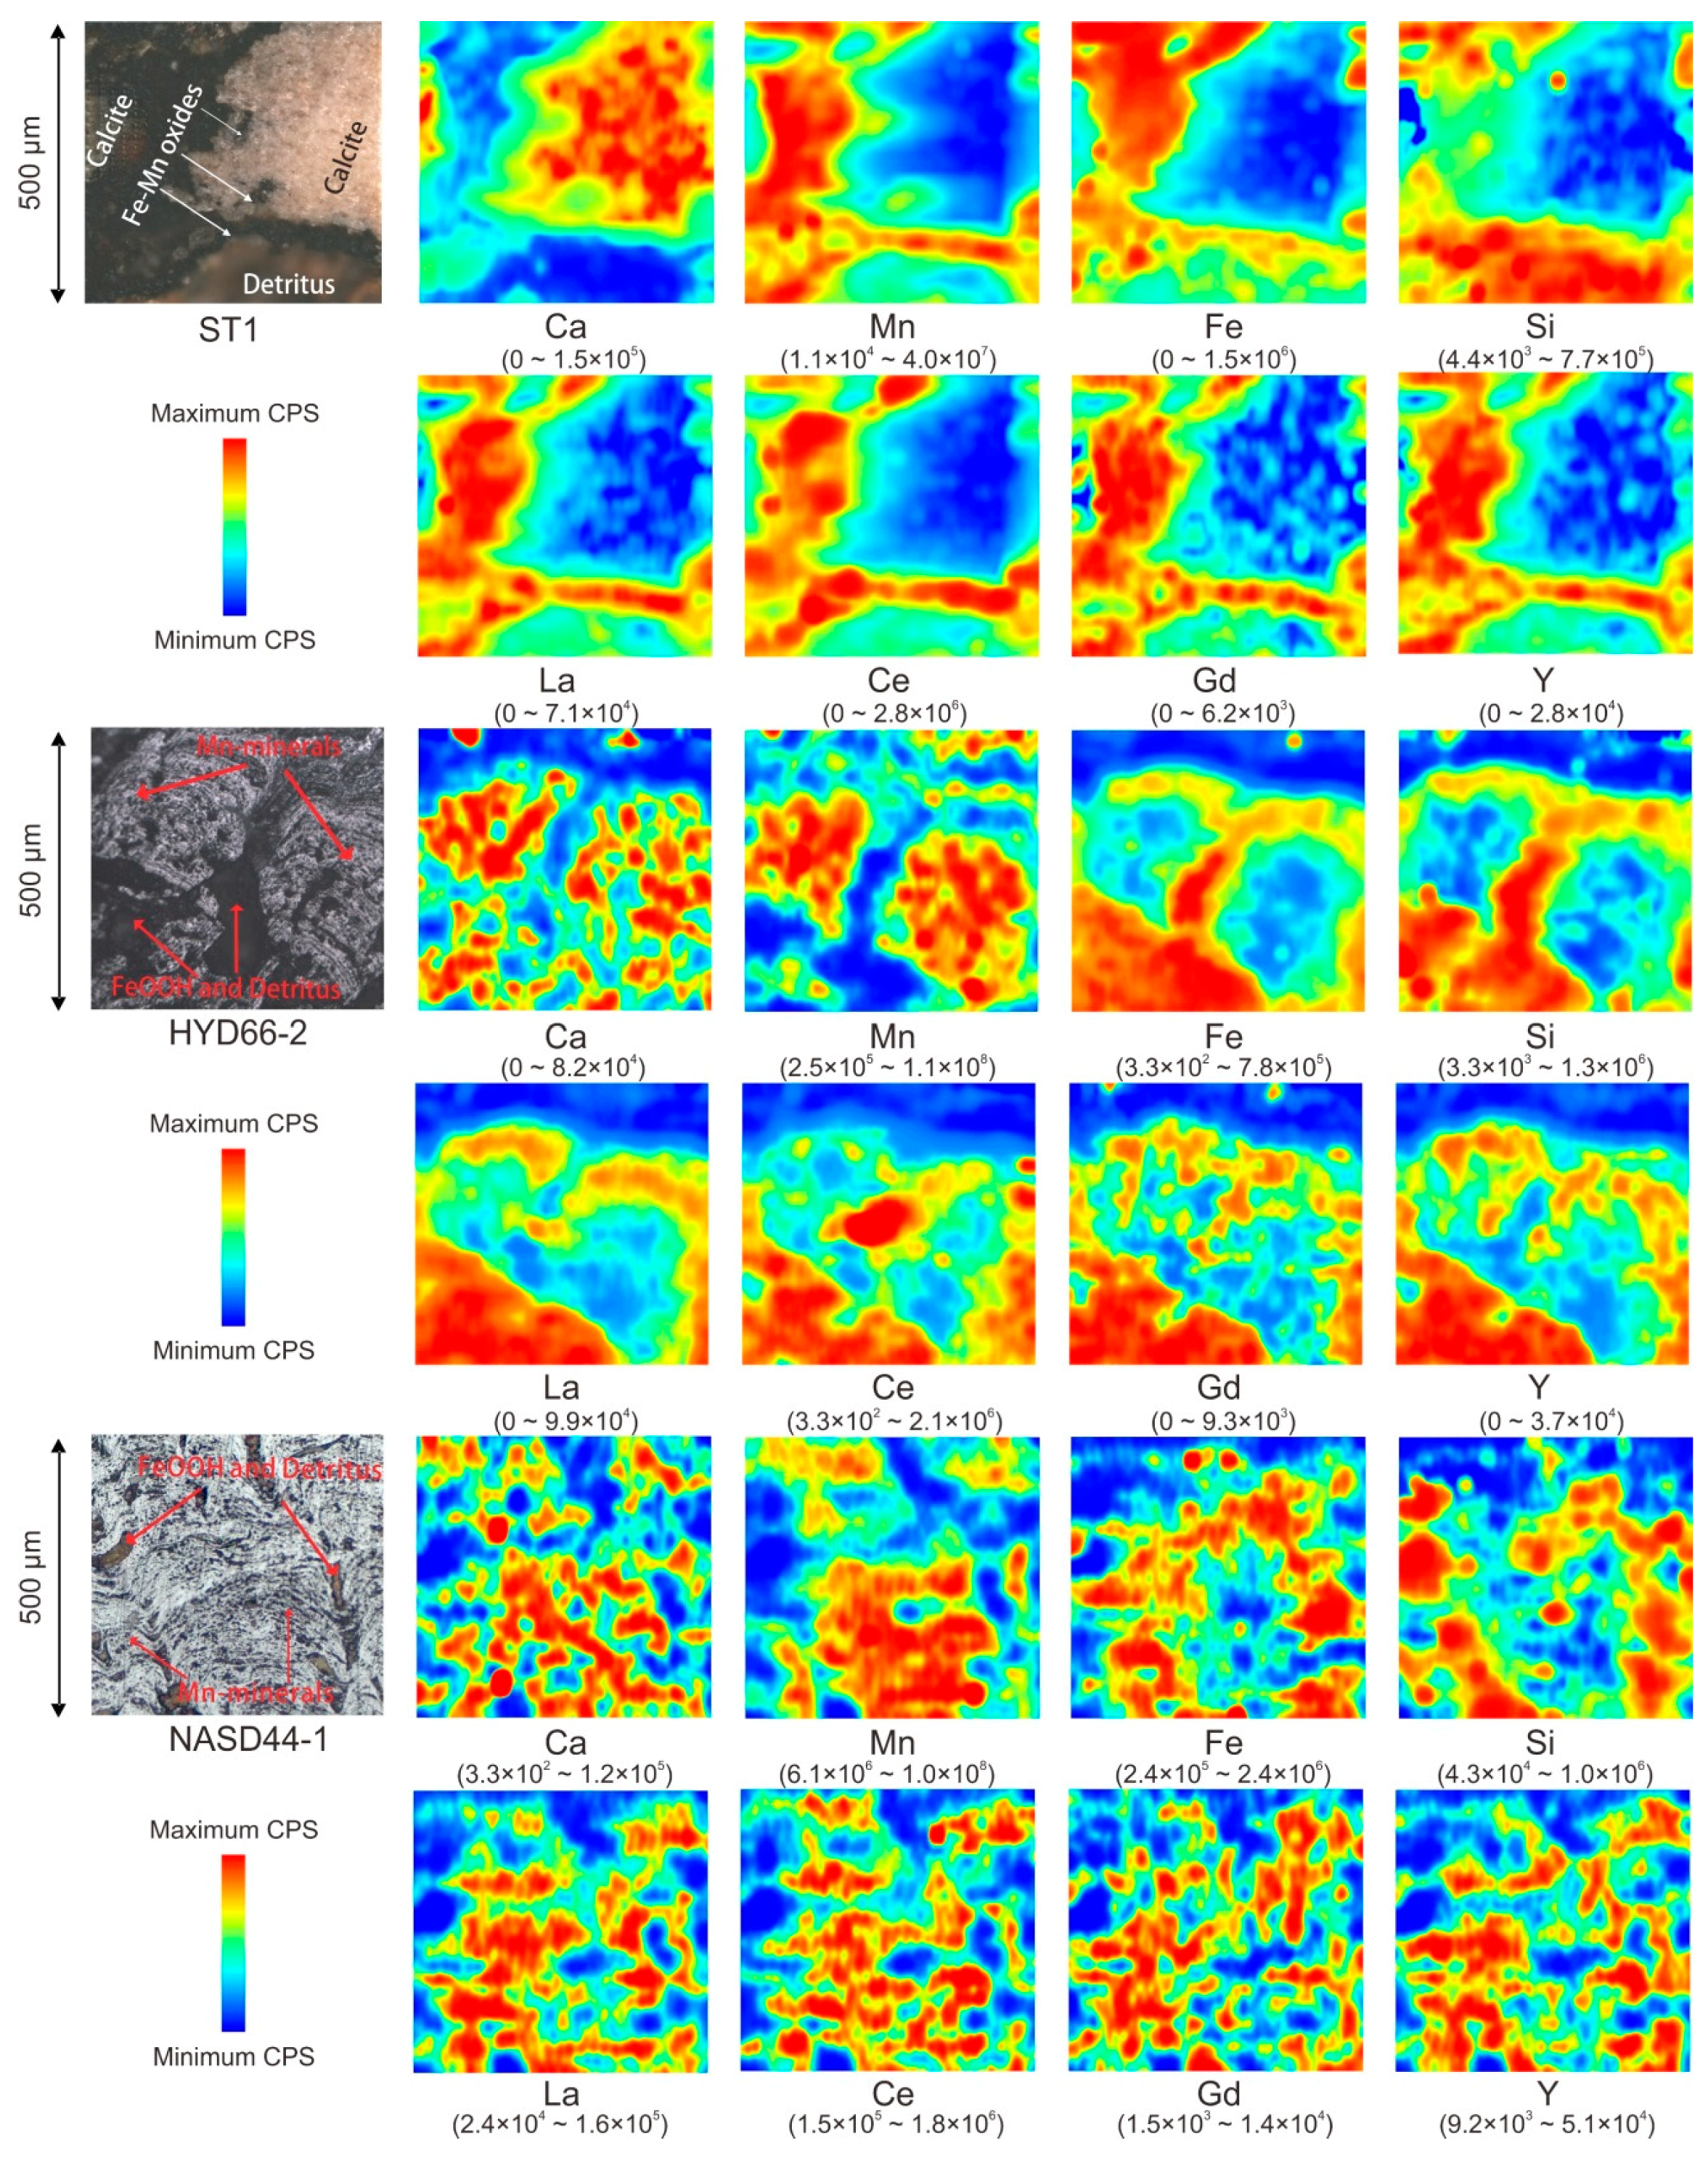
2.2.2. Qualitative Element Mapping by LA-ICP-MS

In situ element mapping was conducted at GPKLMRCE following the analysis procedure described by References [31,32] The basic principle involves the laser running along several parallel, adjoining, and equally long lines to generate an element map. In this study, laser sampling was performed using an ArF excimer laser ablation system (GeoLasPro, Coherent Inc., Dieburg, Germany) and the ion-signal intensities were acquired using an Agilent 7700× inductively coupled plasma mass spectrometer (ICP-MS) (Santa Clara, CA, USA). A beam size of 24 μm was employed with an energy density of 5 J/cm2 and a repetition rate of 5 Hz. A six-pulse ablation was done for each spot, and the next spot was 20 μm away, which eventually ablated a small overlap to avoid gaps. Once a line of spots was completed, the laser was immediately moved to the beginning of the next parallel line with a line spacing of 20 μm, and the protocol was repeated. After the data acquisition, data reduction was performed using the ioGAS software [31] and, eventually, a series of qualitative mapping images of the elements was produced.

2.2.3. Geochemical Analysis of Bulk Samples

For each sample, 50 mg of 200-mesh powder was treated with a 20-mL acid mixture (HF:HNO3:HClO4 = 7:3:1) in Teflon beakers for 2 h, and then evaporated to dryness on a hot plate at 200 °C. The dryness was dissolved in 10 mL of 50% HNO3 and diluted to different concentrations with 5% HNO3 before the measurement. The concentrations of major elements were measured using a PerkinElmer (Waltham, MA, USA) Optima 8300 inductively coupled plasma atomic emission spectrometer (ICP-AES) at Instrument Analysis and Research Center (IARC, SYSU) using an incident power of 1300 W, plasma gas flow of 12 L/min, and atomized gas flow of 0.55 L/min. The trace elements were determined using an Agilent 7700× ICP-MS at GPKLMRCE. Cerium anomaly (Ce/Ce*), europium anomaly (Eu/Eu*), yttrium anomaly (Yn/Hon*), and light and heavy REY (LREY/HREY) enrichment (Lan/Ybn) were calculated using the following equations:
Ce / Ce * = 2 × Ce Sample / Ce PAAS La Sample / La PAAS + Pr Sample / Pr PAAS
Eu / Eu * = 2 × Eu Sample / Eu PAAS Sm Sample / Sm PAAS + Gd Sample / Gd PAAS
Y n / Ho n = Y Sample / Y PAAS Ho Sample / Ho PAAS
La n / Yb n = La Sample / La PAAS Yb Sample / Yb PAAS
where the PAAS data referred to Reference [33].

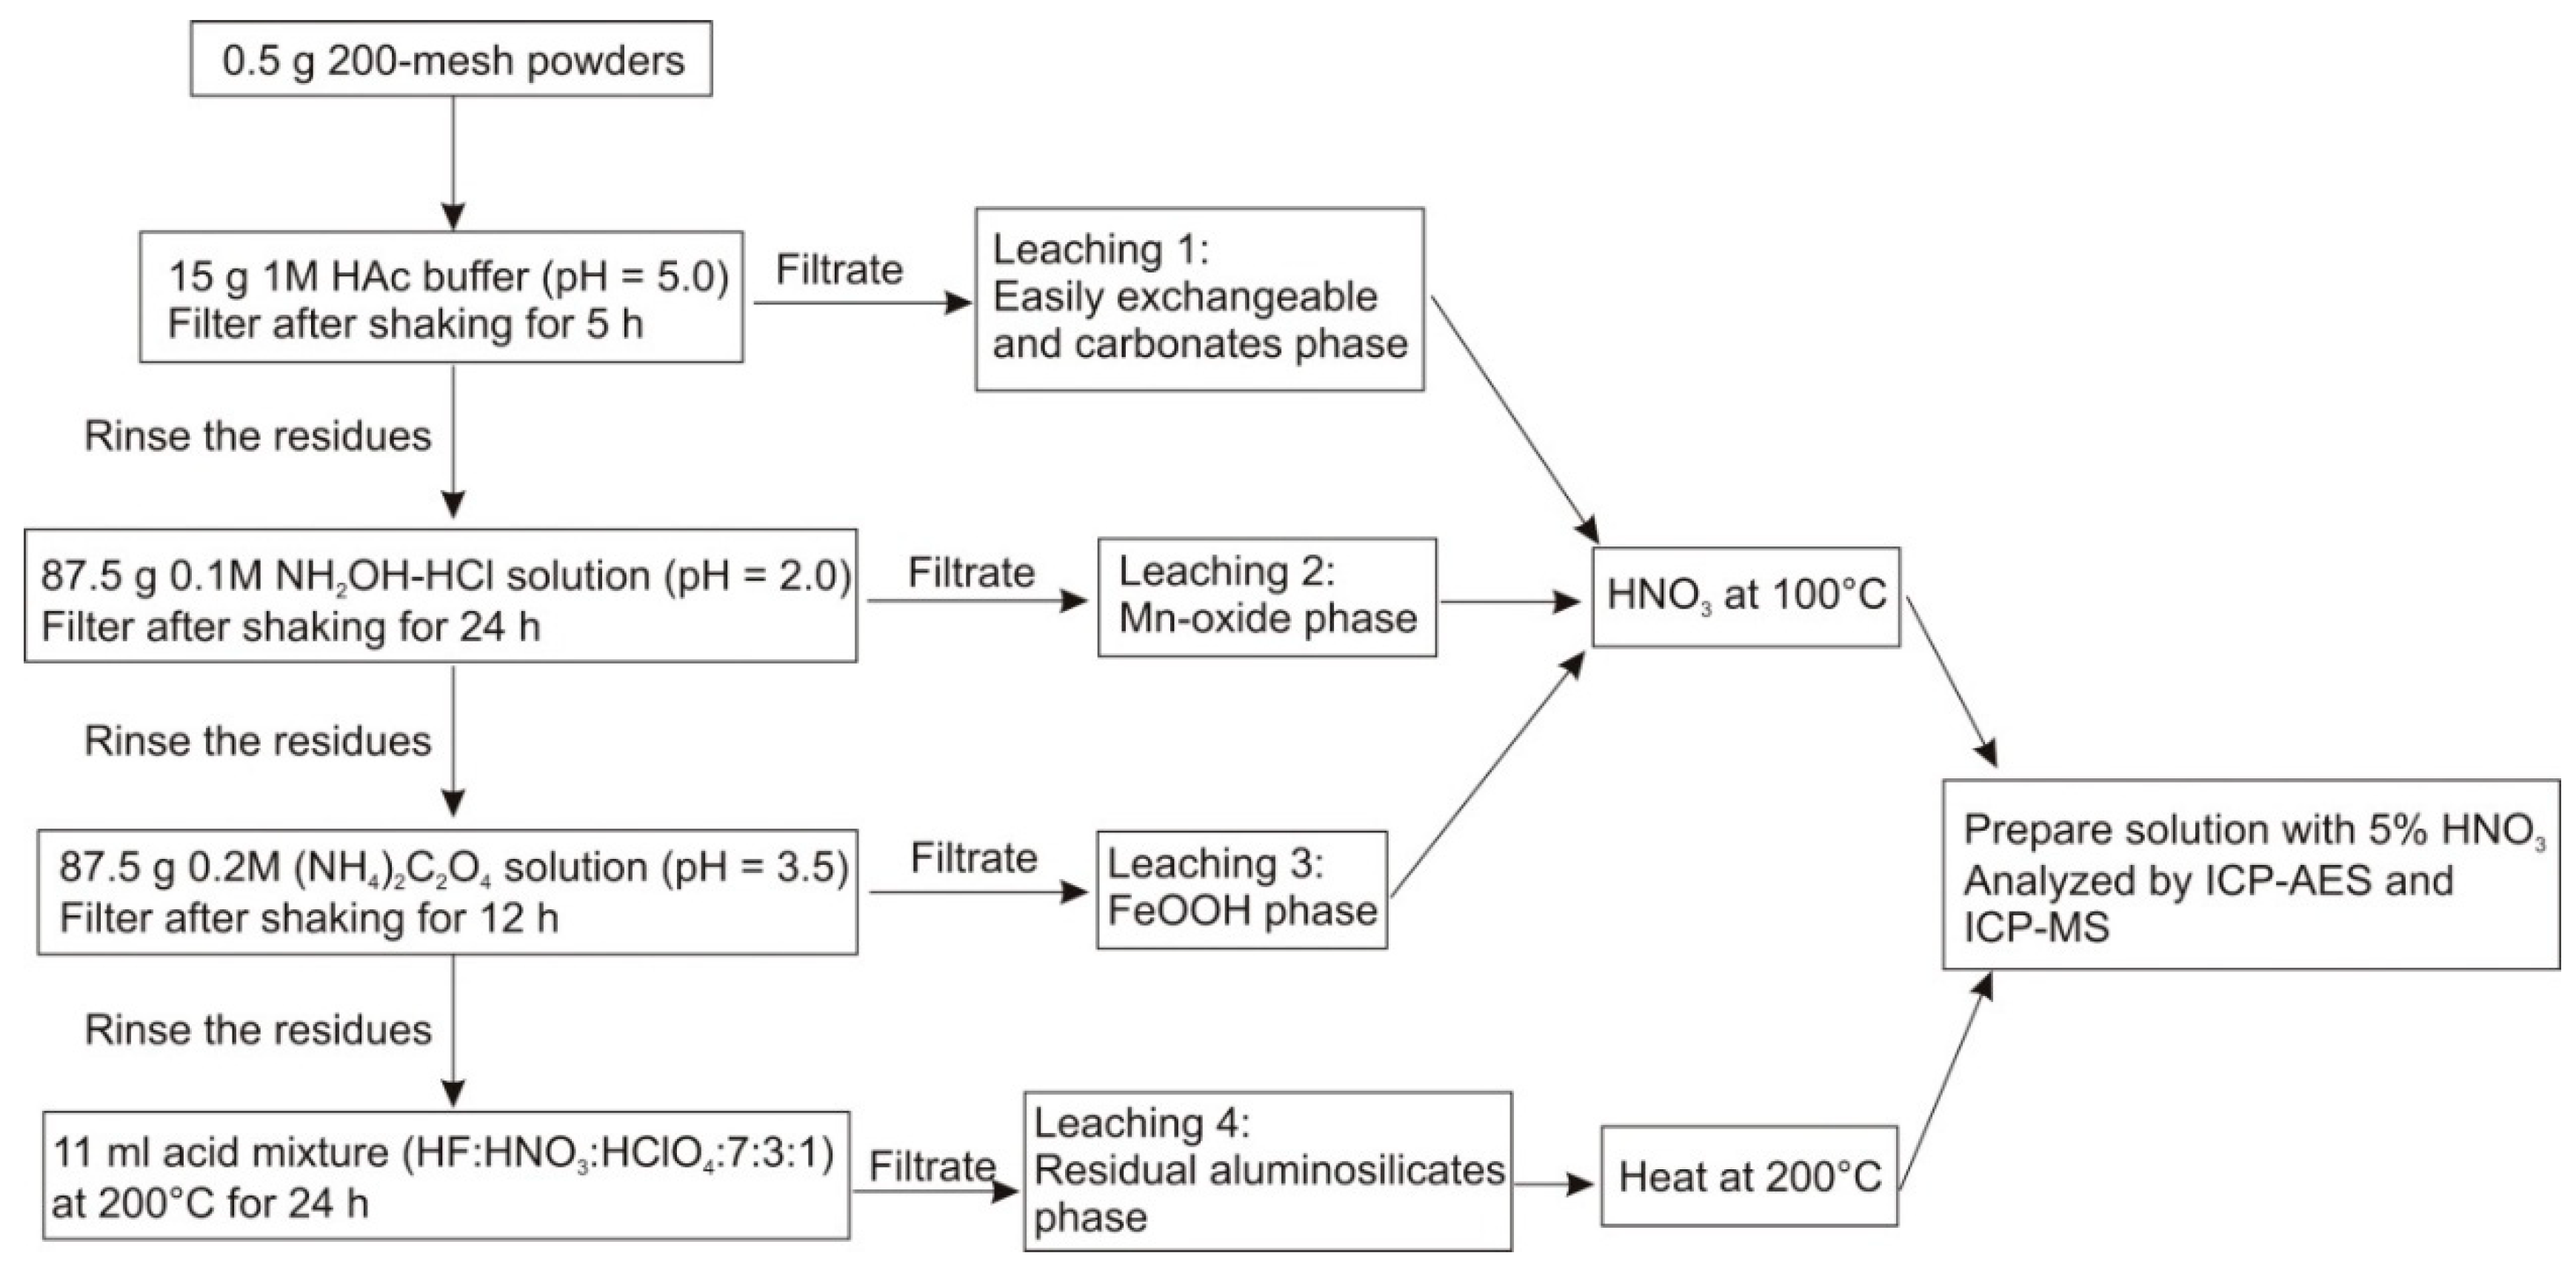
2.2.4. Sequential Leaching Experiment

The four major mineral phases of all crust samples were chemically separated following a sequential leaching procedure [27]; the flow chart of the procedure is shown in Figure 2. In brief, 0.5 g of the powdered samples was put in a 100-mL plastic centrifuge tube, mixed with the leaching reagent, and shaken at room temperature. The leaching solution was filtered through 0.45-μm Millipore filter paper, and the filtrate was stored for analysis. The residues on the filter paper were washed twice with Milli-Q water to clear the remaining dissolved fraction of the previous step and then immediately transferred to the next leaching step. The following four mineral phases were separated:
Leach 1 (L1): easily exchangeable and carbonate phase leachable with 15 g of 1.0 M acetic acid/Na-acetate buffer (pH = 5.0) solution;
Leach 2 (L2): Mn-oxide phase easily reducible with 87.5 g of 0.1 M hydroxylamine/hydrochloride solution (pH = 2.0);
Leach 3 (L3): amorphous Fe (hydr)oxide (FeOOH) phase moderately reducible with 87.5 g of 0.2 M ammonium oxalate buffer (pH = 3.5) solution;
Leach 4 (L4): residual aluminosilicates phase dissolved in 11 mL of acid mixture (HF:HNO3:HClO4 = 7:3:1) in perfluoroalkoxy alkane (PFA) vials with closures at 200 °C.
The leaching experiments were carried out in a Class-100,000 clean room at GPKLMRCE. Concentrations of major and trace elements in four leaches were determined in the same way as the bulk geochemical analysis. The concentrations of each element in the four leachates were summed up and compared with the corresponding bulk data to check the recovery (within the range of 80–120%; see Table S1, Supplementary Materials).

3. Results

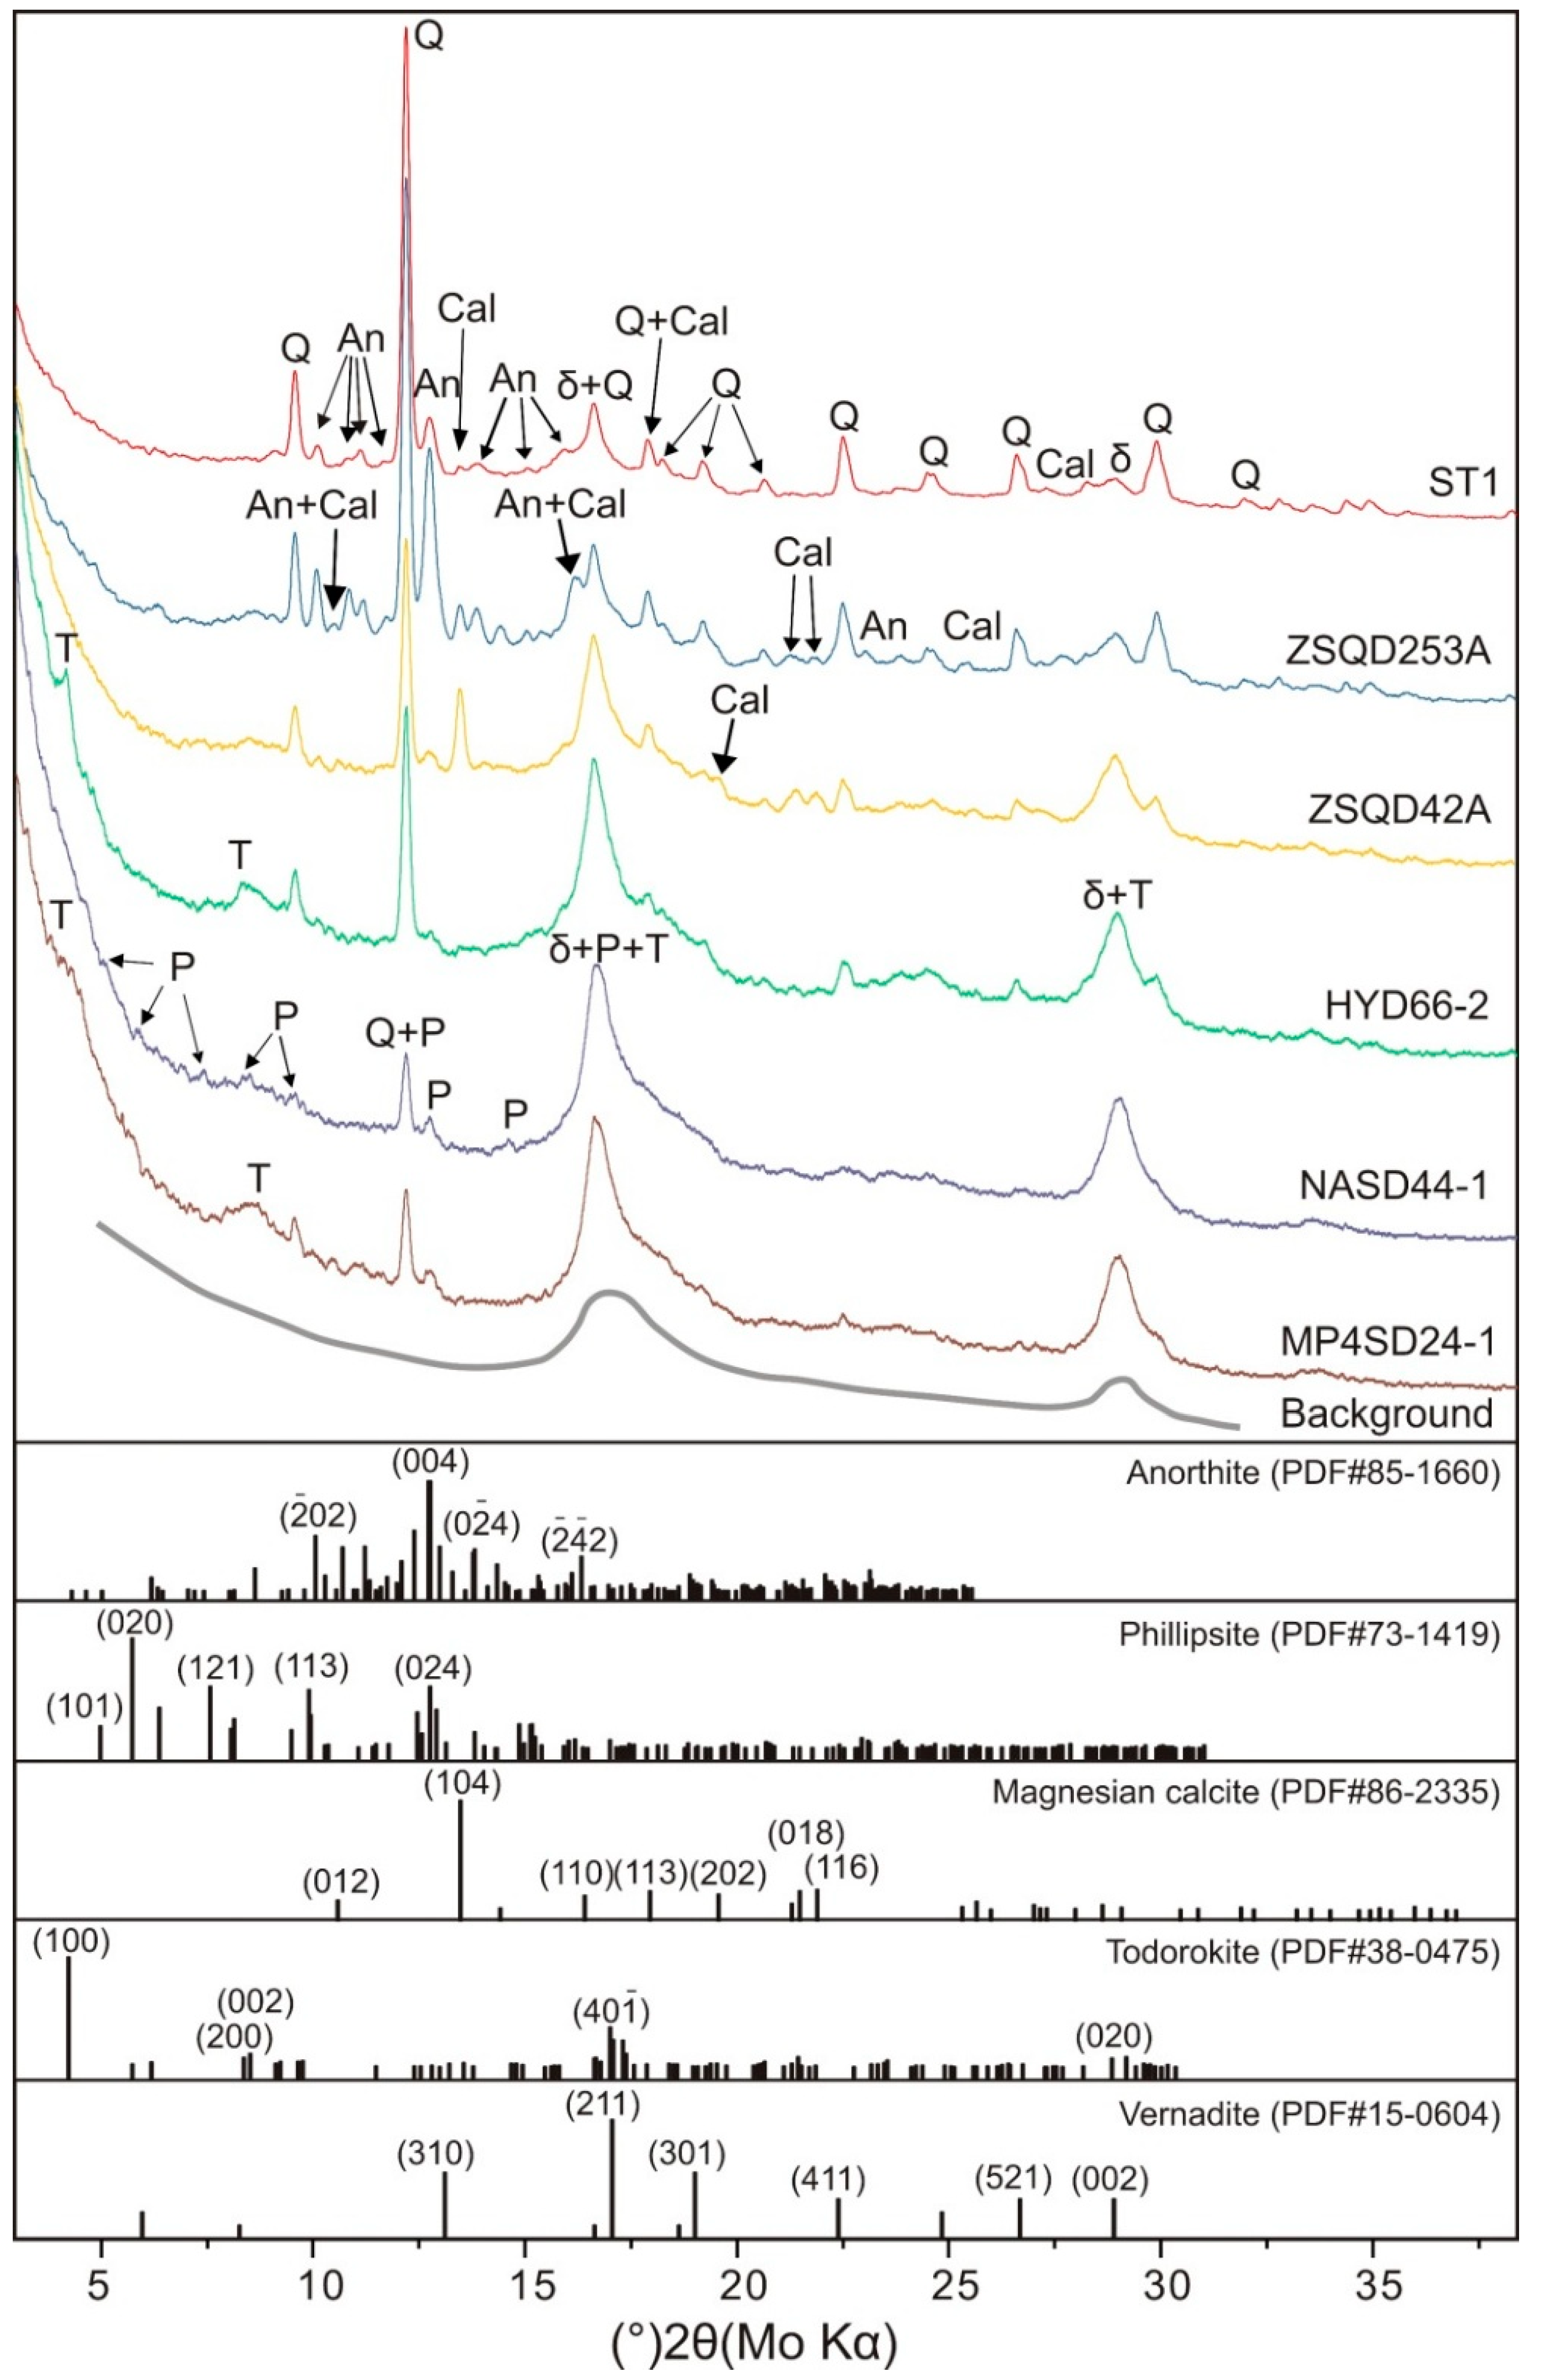
3.1. Mineralogy of the Fe–Mn Crusts

Sharp diffraction peaks at 4.26 Å (100)Qz, 3.34 Å (011)Qz, 2.45 Å (110)Qz, and 1.37 Å (203)Qz indicated the presence of crystalline quartz (Figure 3). Generally, there was also X-ray amorphous Fe oxyhydroxide (FeOOH) with no obvious peak or broad humps. All crusts showed two broad humps in the background, centered at ~2.6 and ~1.5 Å, indicating the presence of two-line ferrihydrite. Mn oxides were weakly crystallized Fe-vernadite (δ-MnO2), as indicated by the broadness of the diffraction peaks at ~2.4 and ~1.4 Å. Todorokite was found in sample HYD66-2 and the WPO samples, and it was characterized by broad peaks at 9.56 Å (100)Tod and 4.78 Å (overlapped (200)Tod and (002)Tod).
In the SCS crusts, the identified carbonate mineral phase was magnesian calcite, indicated by 3.84 Å (104)Cal, 3.02 Å (113)Cal, 2.08 Å (202)Cal, 1.90 Å (018)Cal, and 1.86 Å (116)Cal (Table 1 and Figure 3). The magnesian calcite was from the biological debris in the encrusts. Anorthite was identified in the SCS crusts. In sample HYD66-2 and the WPO samples, nanosized crystallites of phillipsite were indicated.

3.2. Distribution of REY in Fe–Mn Crusts

The photographs of samples ST1, HYD66-2, and NASD44-1 and their corresponding images of elemental distributions determined by LA-ICP-MS are shown in Figure 4. In the images of elemental distributions, the concentration of each element is qualitatively represented by the counts per second (CPS).
As shown in the photograph of ST1 (Figure 4), calcite and quartz were common in the Fe–Mn crusts. In the elemental images, distributions of Ca and Si matched well with calcite and quartz, respectively. Furthermore, the distribution of Mn was almost the same as the Fe distribution, indicating that the Mn minerals were intergrown with the amorphous FeOOH. The distributions of REY (e.g., La, Ce, Gd, and Y) were similar to each other. Sample ST1 showed a clear positive correlation between Fe, Mn, and REY, probably linked to the precipitation of Fe-vernadite or intergrowth of vernadite and Fe-oxyhydroxides instead of calcite and quartz. Nevertheless, the samples HYD66-2 and NASD44-1 showed an inverse correlation between Fe and Mn. In HYD66-2, Mn was clearly linked with Ca, probably indicating the todorokite phase. Fe was associated with REY and Si, indicating (1) the presence of aluminosilicates and Fe-oxyhydroxides and (2) that the REY mainly occurred in the aluminosilicates and/or Fe-oxyhydroxides. It is noticeable that the Ce distribution relatively differed from the other REY, showing Ce decoupling. In NASD44-1, REY showed some correlation with Mn, Fe, and Si.

3.3. Geochemistry of Bulk Fe–Mn Crusts

Table 2 shows the concentrations of major and trace elements of Fe–Mn crusts from the SCS and WPO. All samples had low P concentrations (0.22−0.41 wt.%) with low Mn to Fe ratios (0.61−1.56), which are characteristics of hydrogenetic non-phosphatized Fe–Mn crusts. The SCS crusts (including ST1, ZSQD42A, and ZSQD235A) had higher average concentrations of Fe (13.34 wt.%), Si (12.85 wt.%), Al (1.93 wt.%), and Ca (2.68 wt.%), whereas the WPO crusts contained a higher abundance of Mn (18.77 wt.%), Co (4228 ppm), Cu (1081 ppm), Zn (797.4 ppm), Mo (561.2 ppm), and ΣREY (1621 ppm). Sample HYD66-2 contained low concentrations of Si (6.11 wt.%), Al (0.99 wt.%), and Ca (1.90 wt.%), and a high content of Mn (19.21 wt.%), Fe (16.41 wt.%), Co (3256 ppm), Zn (645 ppm), Mo (544.9 ppm), Ce (1552 ppm), and ΣREY (2324 ppm), which was similar to the WPO samples. The results are close to the data measured by Reference [19].

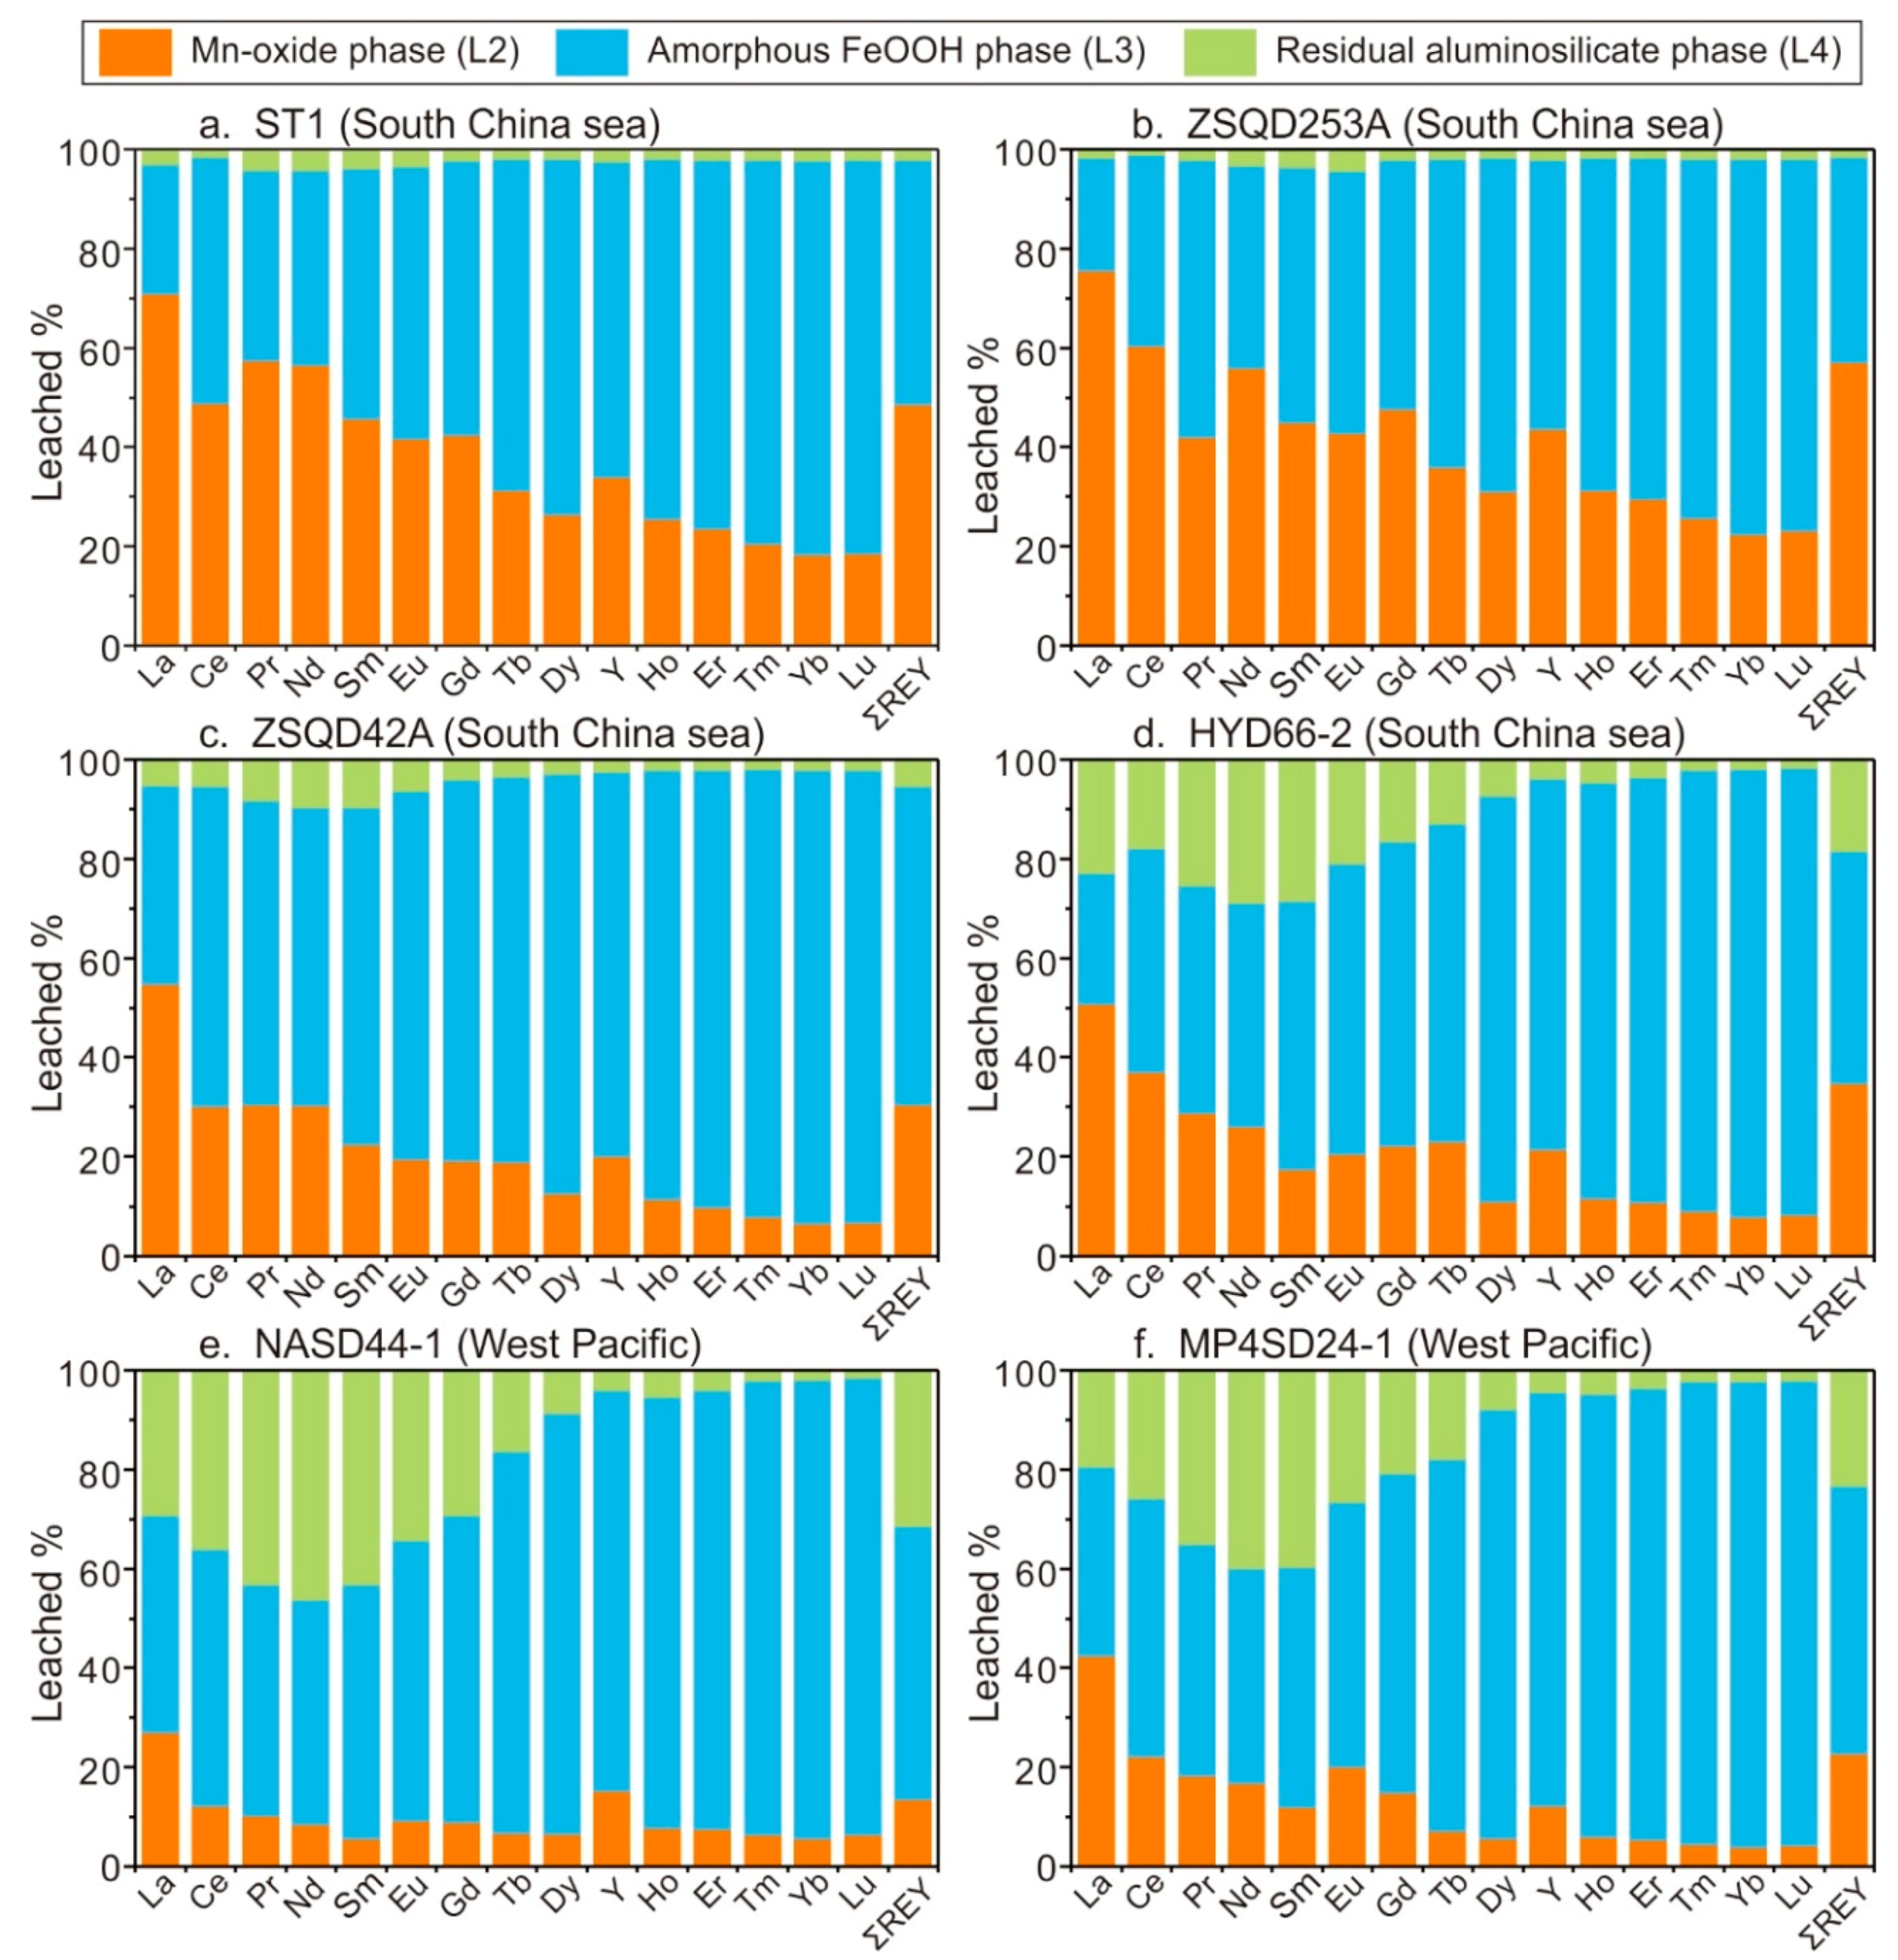
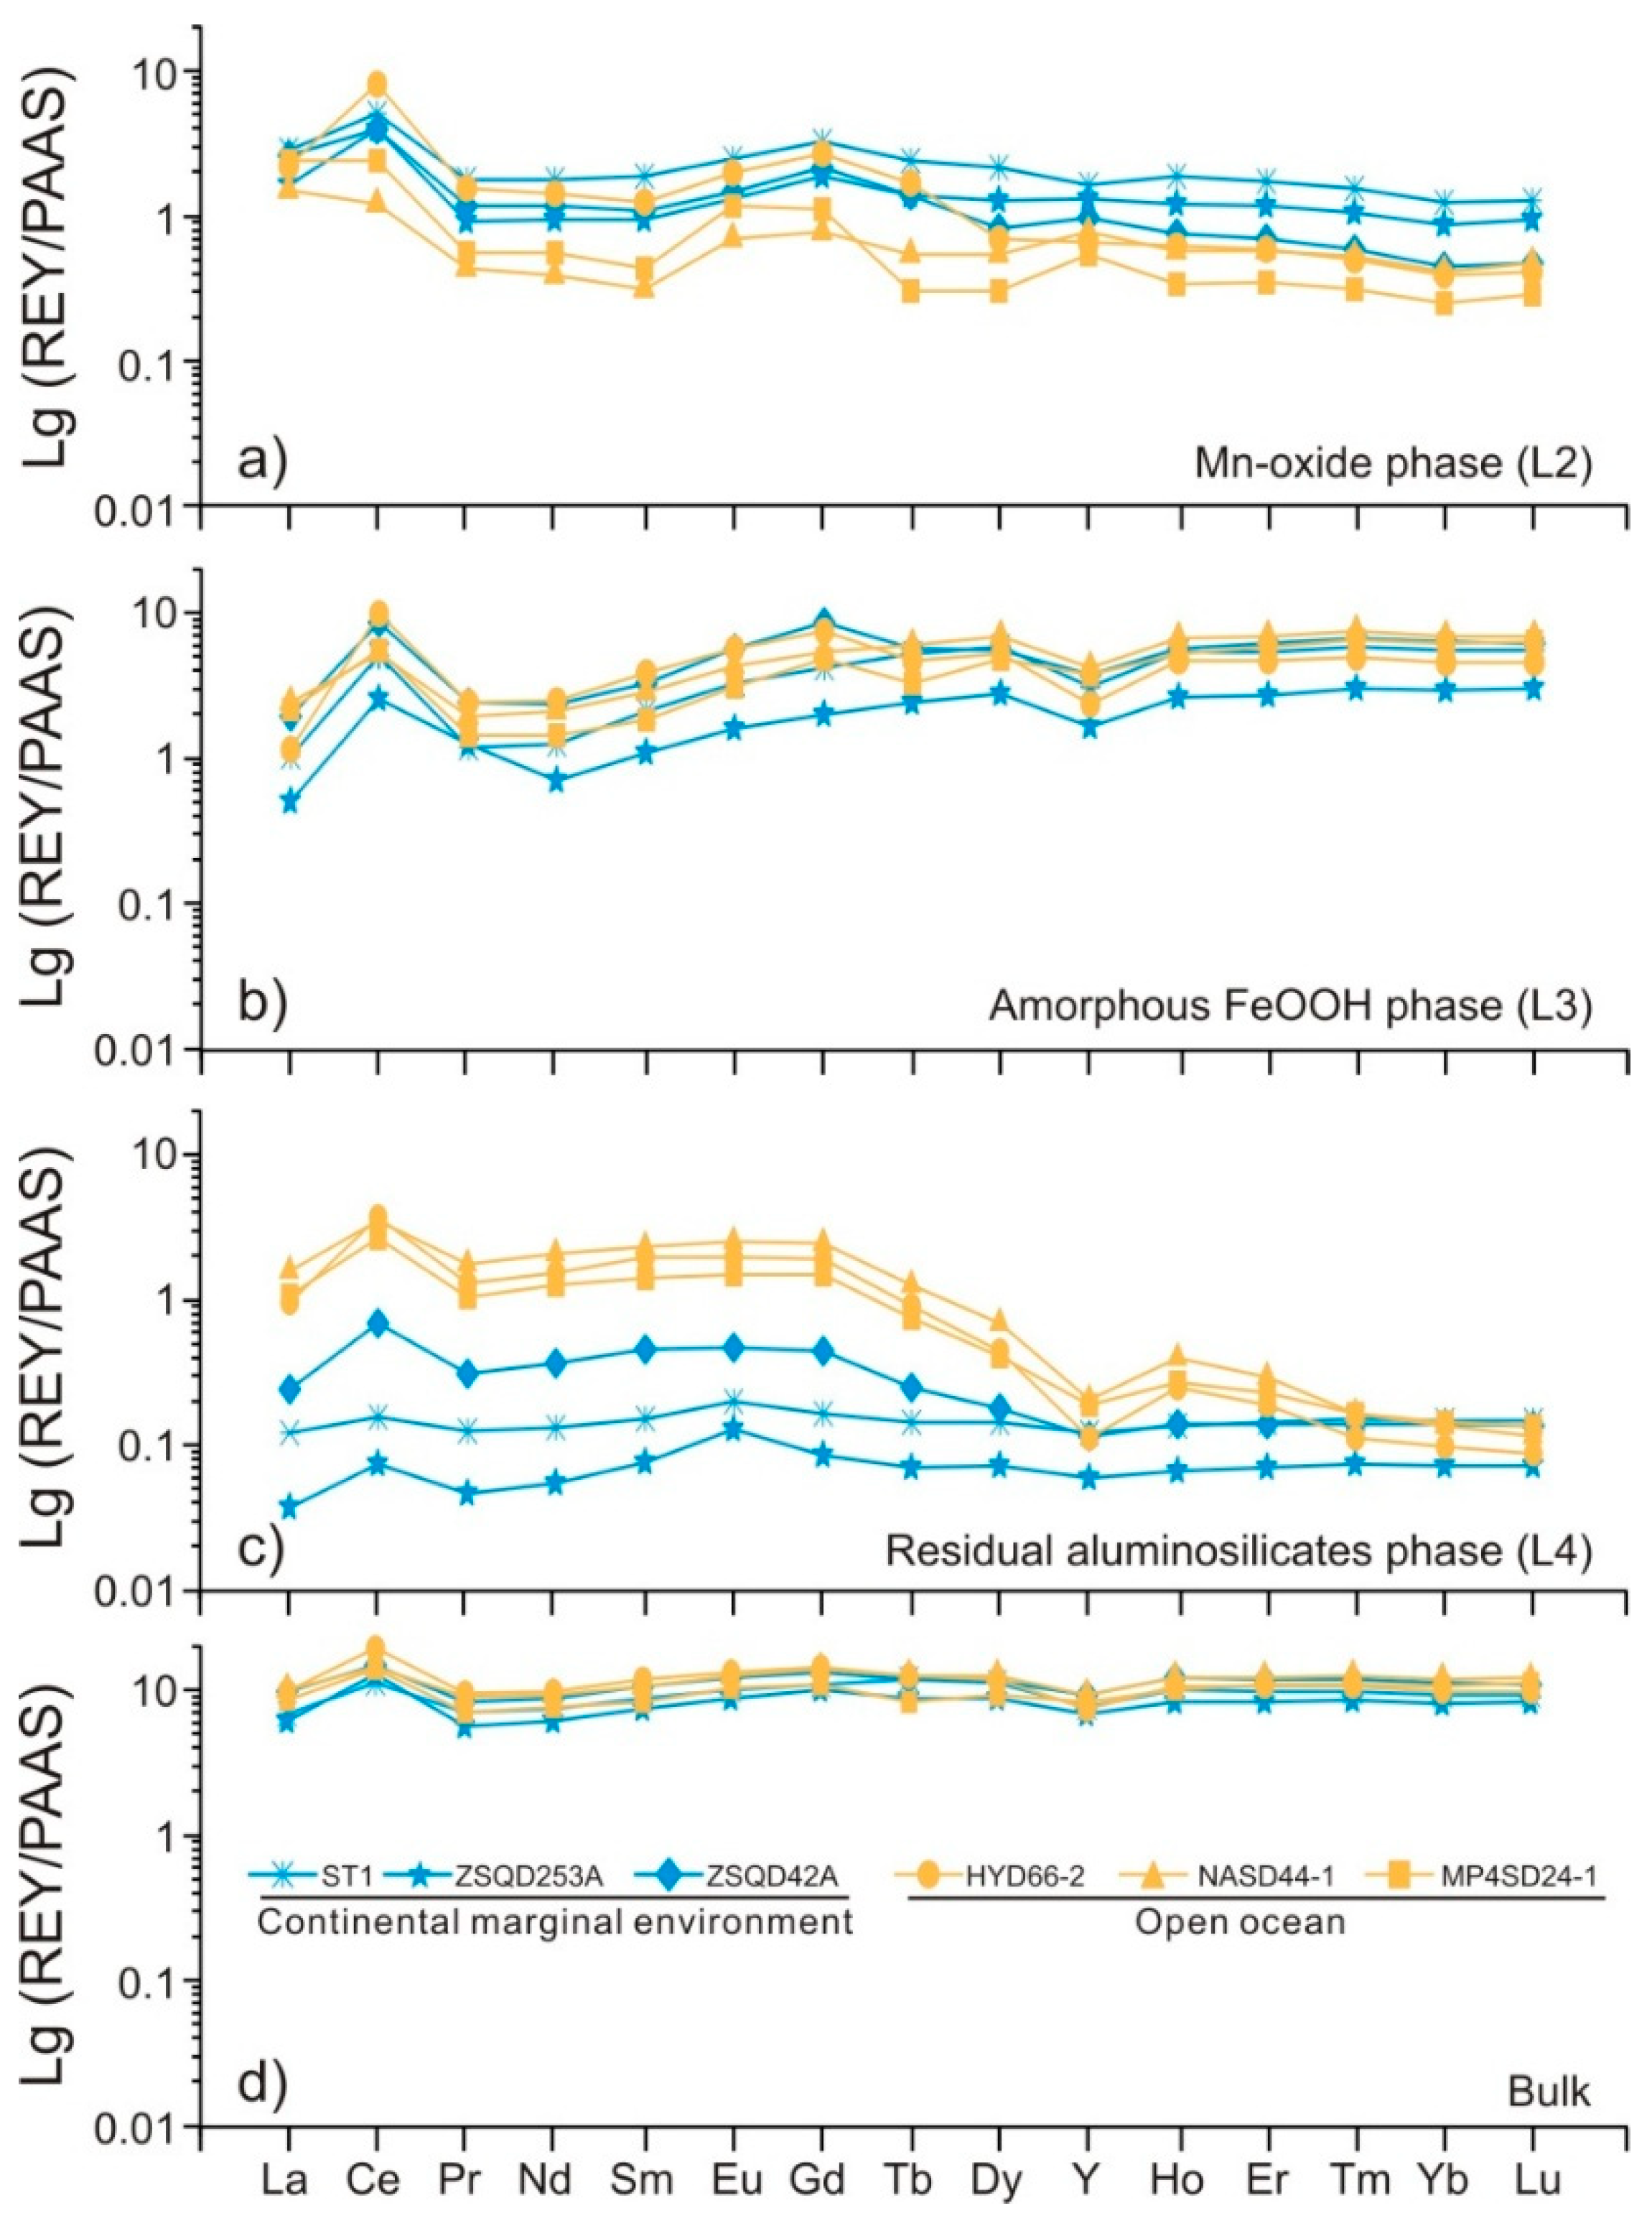
3.4. REY in Major Mineral Phases

The abundance of REY in the four leaching steps (from L1 to L4, in %) are shown in Figure 5. The proportions of total REY (ΣREY) in L1 of all samples were extremely low (<0.01%; see Table S1, Supplementary Materials) and were considered no further. Mn-oxide phase (L2) contained from 4% to 76% (average 24%) of the ΣREY. The average extraction proportions of light REY (LREY: La, Ce, Pr, and Nd), middle REY (MREY: Sm, Eu, Gd, Tb, and Dy), and heavy REY (HREY: Y, Ho, Er, Tm, Yb, and Lu) were 38%, 22%, and 15%, respectively. The post-Archean Australian shale-normalized (PAAS) REY patterns (Figure 6a) showed pronounced LREY enrichment (Lan/Ybn = 4.81 on average) and positive Ce anomalies (Ce/Ce* = 2.43). Amorphous FeOOH phase (L3) carried between 23% and 94% (average 67%) of ΣREY. The average extraction proportions of LREY, MREY, and HREY were 44%, 65%, and 83%, respectively. The PAAS-normalized REY patterns (Figure 6b) showed pronounced HREY enrichment (Lan/Ybn = 0.27 on average), positive Ce anomalies (Ce/Ce* = 3.75), and negative Y anomalies (Yn/Hon = 0.62).
The residual aluminosilicates phase (L4) hosted between 1% and 46% (average 10%) of ΣREY. There were significant differences among the respective fractions in the Fe–Mn crusts. In samples ST1, ZSQD253A, and ZSQD42A, the residual aluminosilicates phase carried a low proportion (1%–10%, average 3%) of ΣREY, and the proportions of LREY, MREY, and HREY were 4%, 4%, and 2%, respectively. The PAAS-normalized REY patterns (Figure 6c, blue patterns) were flat with positive Ce anomalies (average Ce/Ce* = 1.85) and positive Eu anomalies (average Eu/Eu* = 1.30). In samples HYD66-2, NASD21-1, and MP4SD24-1, 2%–40% (average 17%) of ΣREY was leached in L4 and the average extraction proportions of LREY, MREY, and HREY were 31%, 22% and 3% in L4, respectively. The normalized REY patterns (Figure 6c, yellow patterns) decreased from the LREY over the MREY to the HREY. There were positive Ce anomalies (Ce/Ce* = 2.65) and negative Y anomalies (Yn/Hon = 0.56).

4. Discussion

4.1. Validity of LA-ICP-MS Mapping

LA-ICP-MS mapping is an “only slightly” destructive technique and was previously applied to Fe–Mn crusts and Fe–Mn nodules [14,35]. The accuracy of the LA-ICP-MS is mainly influenced by a few critical factors. The first and most obvious shortcoming of the line scanning technique is the signal smearing. Both the accumulation of ablated material in linear ridges at the margins of raster trenches and the affection of washout characteristics of the sample cell of the laser machine contribute to the signal smearing, which is more pronounced for low-abundance refractory elements than major elements [36]. Reducing the beam size or the scanning speed [36] or implementing pre-ablation [36] could effectively reduce the effect of accumulation. In addition, previous studies confirmed that the ablation direction of LA-ICP-MS analysis cannot affect the real element distribution patterns [37]. Our experimental results showed that the distribution of the major elements (Ca, Si, Fe, and Mn) matched very well with the minerals (Figure 4), that is to say, the data arose simultaneously with laser ablation spots [31]. Furthermore, there was no pronounced signal smearing in the distribution of the trace elements, and even the refractory elements (e.g., REY) compared with the major elements (Figure 4), and the correlation of the elements coincided with the sequential leaching experiment.
Secondly, the internal standard has a strong influence. Mg was used as the internal standard in the LA-ICP-MS quantitative mapping because it is more homogeneously distributed than other elements in the Fe–Mn oxides [35]. However, it differs among the different minerals and is obviously lower in detrital minerals such as calcite and quartz. Thus, the Mg internal standard may cause too high corrections in the elemental concentrations when the crust contains a lot of detrital minerals. Here, we discarded the calibration of standards and used CPS to represent the relative level of content of each element directly. Eventually, the LA-ICP-MS mapping method could supply qualitative information of the elemental distribution in a straightforward way. Compared with the sequential leaching experiment, the LA-ICP-MS mapping technique is an in-situ, simpler, rapider, and highly reproducible technique regarding sample preparation, laboratory experiments, and data reduction [26,37]. Furthermore, the mapping results mutually corroborated the results of the sequential leaching experiment.

4.2. Occurrence Phases of REY

The mineralogical analysis of all samples showed that the δ-MnO2 and X-ray amorphous FeOOH were the dominant minerals, which is the typical mineral combination of hydrogenetic Fe–Mn crusts [10]. Since these Fe–Mn crusts are typically hydrogenetic in origin, the todorokite in some samples is more likely to indicate that they experienced lower-oxidation-potential seawater conditions [17] rather than a diagenetic input. The results of the sequential leaching experiment showed that most of the REY was extracted in the Mn-oxide and amorphous FeOOH phases (Figure 5), suggesting that the REY mainly occurred as δ-MnO2 and amorphous FeOOH in the Fe–Mn crusts. The same conclusion could be obtained from the LA-ICP-MS mapping results (Figure 5; Table S3, supplementary materials).
δ-MnO2 is composed of one or two water layers within Mn–O-octahedral sheets [38]. These sheets contain vacancies and abundant isomorphic substitution of Mn4+, both of which can induce charge deficits [38]. The incorporation of hydrated interlayer cations can compensate for the negative surface charge of these sheets and, thus, the δ-MnO2 is able to accommodate REY [38,39]. In contrast, todorokite contains a large three-dimensional (3D) tunnel structure [40], in which the Ce(IV) and REY(III) are unable to be incorporated. Other factors can affect the crusts during early diagenesis in some microlayers at the base of crusts, precipitating new minerals (e.g., todorokite). These processes were observed in nodules and crusts from the Pacific Ocean and the Atlantic Ocean [8]. Therefore, crystal structures of Mn minerals are another considerable factor in the proportion of Mn-bound REY.
Amorphous FeOOH has a large specific surface area and high chemical reactivity [41,42]; thus, it has a greater ability to adsorb heavy elements. Clay minerals also have surface charges and highly specific surfaces, and these characteristics are crucially important for the adsorption of REY [43]. The WPO crusts contain phillipsite (Figure 3) and have a high proportion of aluminosilicate-bound REY, which implies the clay might constitute an additional REY source. Instead, crystalized quartz and felspar account for most of the aluminosilicate material in the SCS crusts. These minerals carry some of the REY (Figure 5) and lead to low concentrations of aluminosilicate-bound REY in the SCS crusts.

4.3. Enrichment Process of REY

As mentioned above, δ-MnO2 and FeOOH are the most important occurrence phases of REY, that is to say, the process of REY participation in the δ-MnO2 and FeOOH is suggested to be a controlling factor for REY enrichment in hydrogenetic Fe–Mn crusts from the SCS and WPO [44,45,46,47]. To illustrate the REY distribution between δ-MnO2 and FeOOH [24], we calculated Lu-normalized ratios of Fe-bound REY (REY-FeOx) to Mn-bound REY (REY-MnOx) for the members of the REY series.
( Δ REY - FeOx / REY - MnOx ) Lu = [ REY ] FeOx / [ REY ] MnOx [ Lu ] FeOx / [ Lu ] MnOx
Laboratory experiments showed that the inorganic speciation of REY in seawater is dominated by REY ions and inorganic speciation REY-carbonate complexes [48,49,50,51]. Based on the [REY(CO3)2]/[REYCO3+ + REY3+] ratios in seawater of pH 8.2 calculated by Schijf [52], we obtained the Lu-normalized [REY(CO3)2]/[REYCO3+ + REY3+] ratio for each member of the REY series [24].
([REY(CO3)2]/[REYCO3+ + REY3+])Lu = ([REY(CO3)2]/[REYCO3+ + REY3+])/([Lu(CO3)2]/[LuCO3+ + Lu3+]).
The values of the (ΔREY-FeOx/REY-MnOx)Lu ratios were close to the values of the ([REY(CO3)2]/[REYCO3+ + REY3+])Lu ratios (Figure 7). The similarity demonstrates that the preferential adsorption of REY carbonates by Mn minerals and Fe minerals controls the REY enrichment in the Fe–Mn crusts [24]. Moreover, the [REY(CO3)2]/[REYCO3+ + REY3+]Lu ratios increased along the REY series (Figure 7). This indicates that LREY preferentially occurs as LREYCO3+ and LREY3+, while HREY prefers to form HREY(CO3)2 in seawater [53,54]. The zero-point charge (ZPC) of δ-MnO2 is 2.3 [55,56], while that of amorphous FeOOH is 8.8 [57]. Therefore, δ-MnO2 has an excessive negative surface charge, while the surface of FeOOH may be electrically neutral or weakly electropositive in seawater. In this case, the δ-MnO2 has a tendency to adsorb positively charged REY complexes (e.g., LREYCO3+ and LREY3+), whereas amorphous FeOOH prefers to adsorb negatively charged REY complexes such as HREY(CO3)2 [48]. This can explain the LREY enrichment in the Mn-oxide phase (Figure 6a) and HREY enrichment in the amorphous FeOOH phase (Figure 6b). The yttrium, unlike other HREY, prefers to form YCO3+ in seawater [24,26,49], which explains why there were negative Y anomalies in the amorphous FeOOH phase (Figure 6b).
Ce is a redox-sensitive element that is easily oxidized to Ce(IV) when the other REY elements remain strictly trivalent, which usually causes Ce decoupling [4]. In hydrogenetic Fe–Mn crusts, Ce is tetravalent [25]. The Ce oxidation absorption by δ-MnO2 is widespread because Mn ions are a strong oxidant in seawater [25,58]. Ce oxidation absorption by FeOOH, however, tends to get overlooked because of the slow rate of Ce(IV) oxidation [44]. In our experimental results, an average of 50% of Ce was leached in the FeOOH phase and the values of δCe (average 3.75) were even higher than the values of the Mn-oxide phase. This suggests that the Ce oxidation absorption by FeOOH is an essential part of the enrichment and fraction of Ce in the Fe–Mn crusts [13,24,59] and may be more important than Ce oxidation absorption by δ-MnO2 in seawater. Moreover, this may be the reason why sample HYD66-2 (with high Fe content) contained a high Ce concentration.

4.4. Factors of the Difference in REY Enrichment in the SCS and WPO Crusts

4.4.1. Terrigenous Input
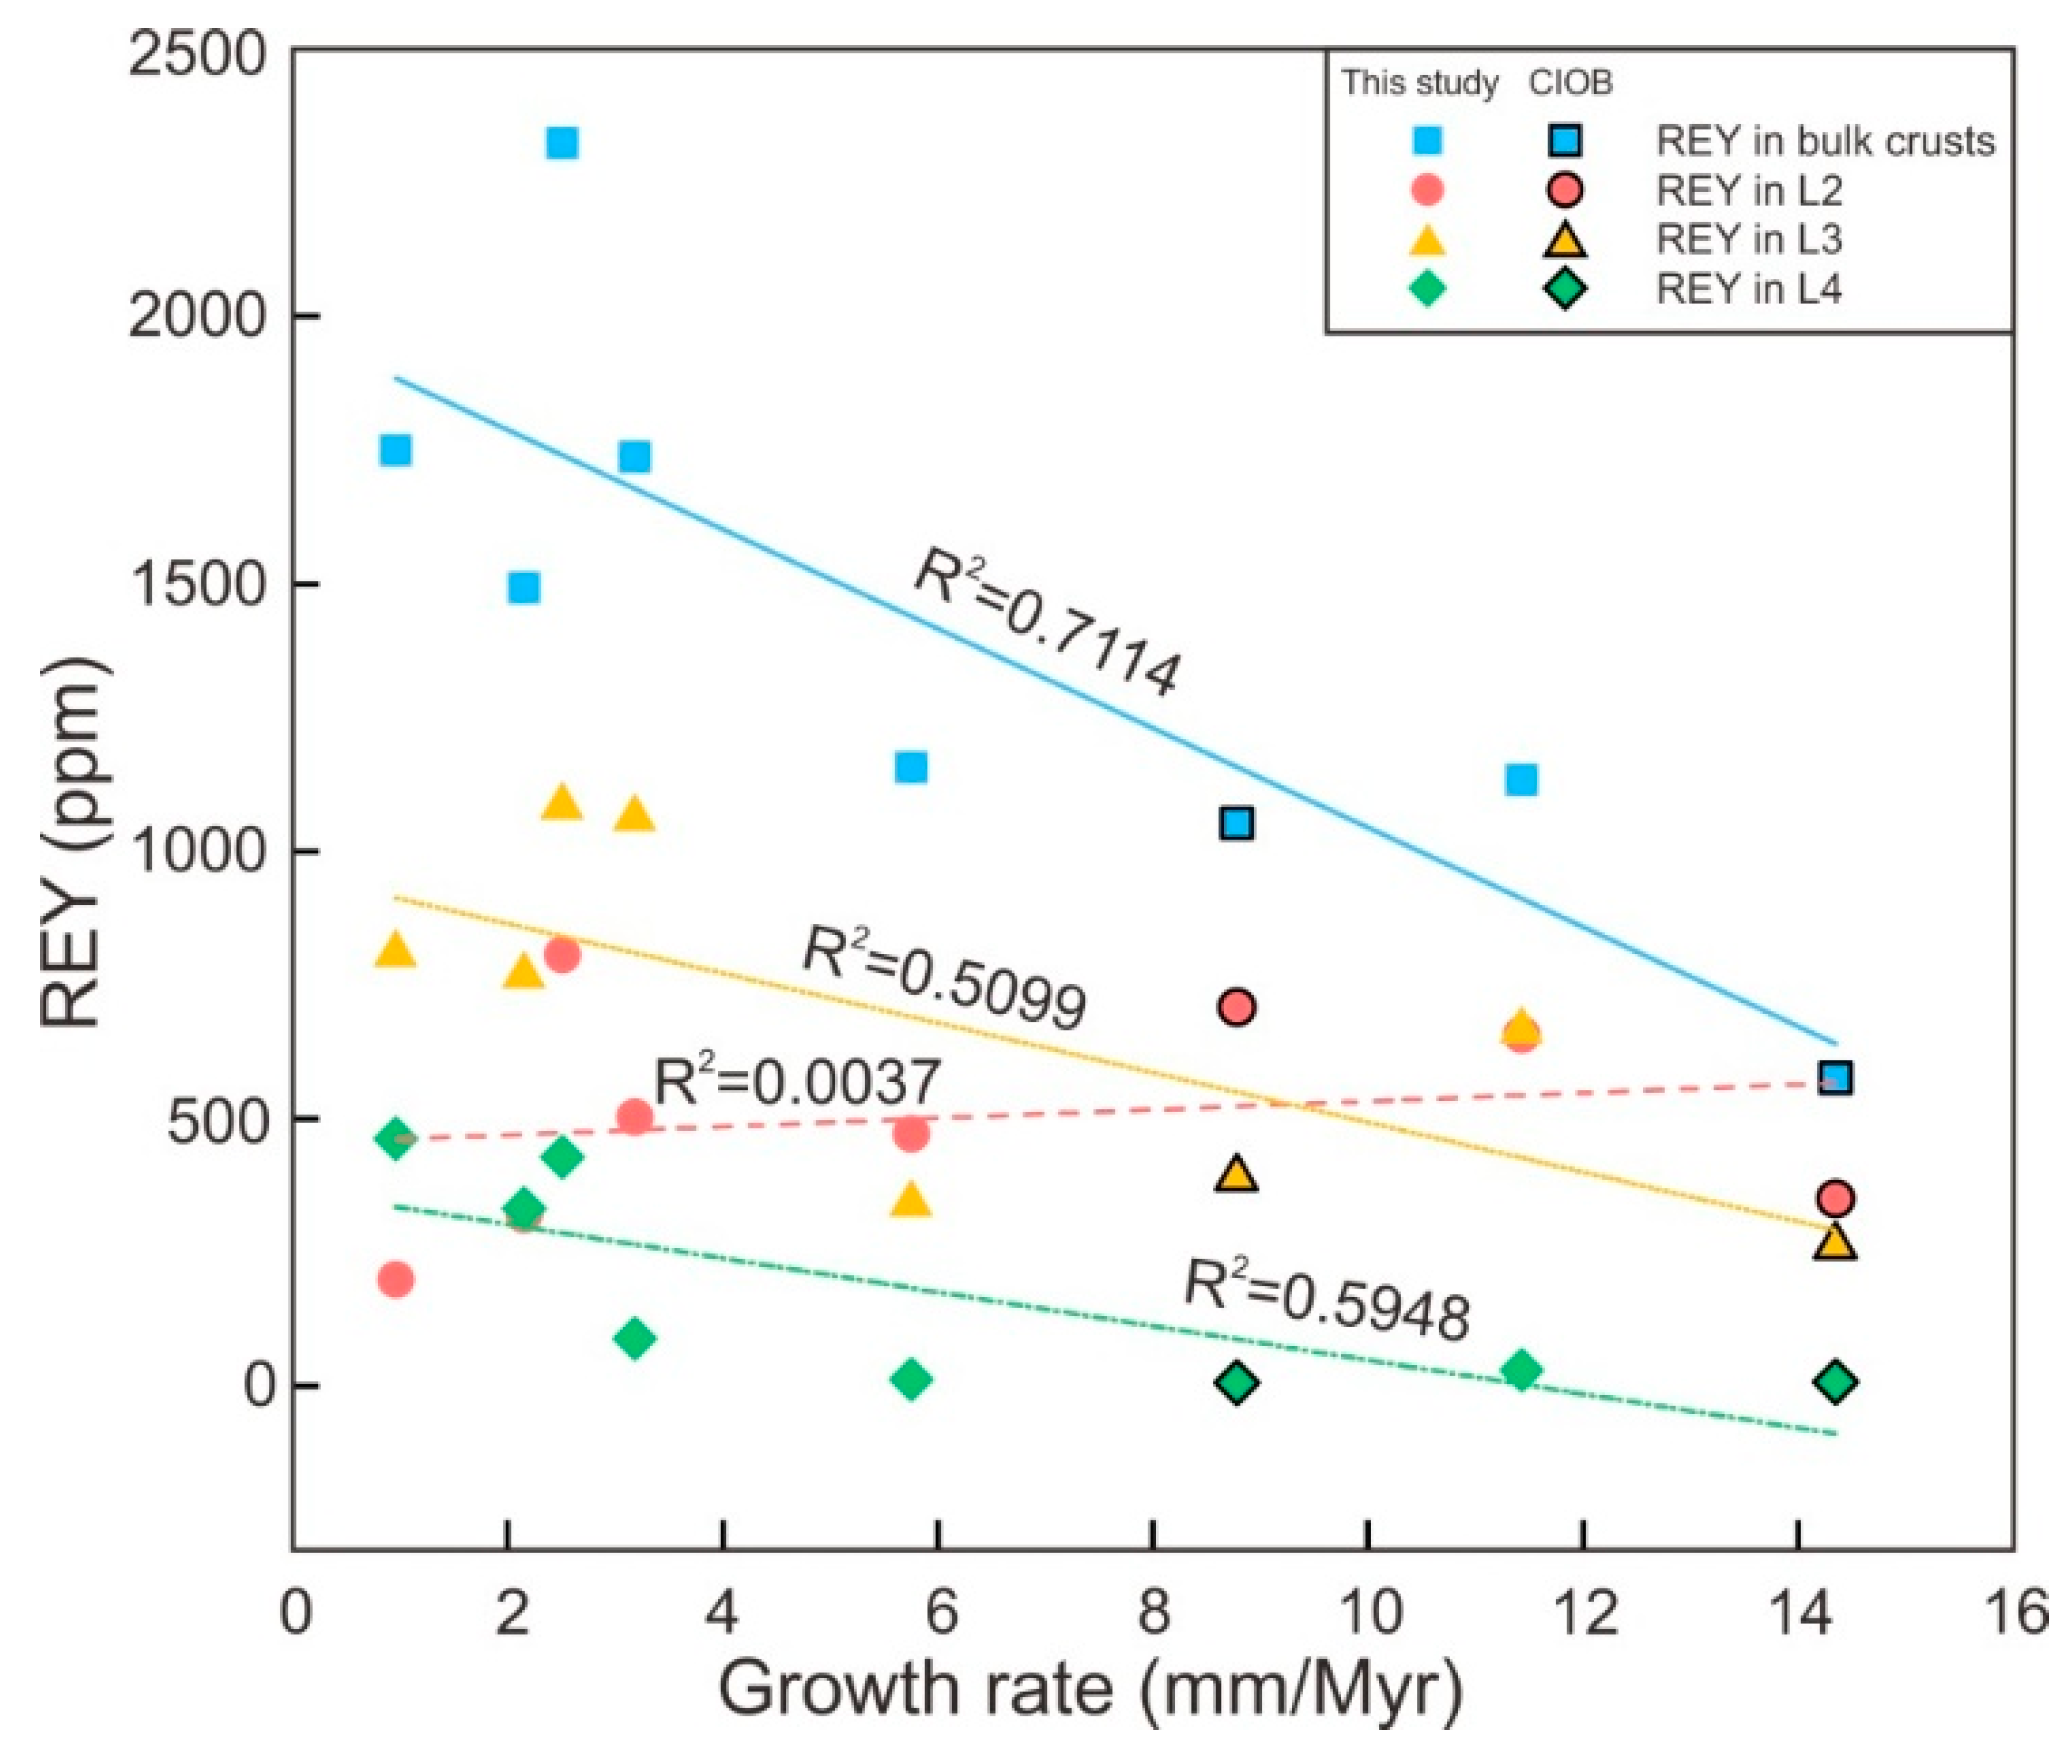
The SCS crusts (except sample HYD66-2) grow within the continental marginal environment and they are significantly affected by terrigenous materials [60]. The eolian dust and the huge river systems (e.g., the Pearl, Red, and Mekong Rivers) transport a large amount of terrigenous detrital minerals into the SCS [61,62], and these detrital minerals are mainly quartz and felspar. Quartz and felspar are the last to be leached into the residual aluminosilicates phase (L4) due to their insolubility [27]. In the SCS crusts (except sample HYD66-2), the PAAS-normalized REY patterns of the residual phase were relatively flat with minor positive Eu anomalies (Figure 6c). The felspars are responsible for the Eu anomalies because Eu2+ is more strongly stabilized in the structure of the residual felspars than other trivalent lanthanides [63]. The La/Al ratios (8.3 × 10⁻⁴) and Lu/Al ratios (10.6 × 10⁻⁶) of the residual aluminosilicate phase are close to the values of the upper crust (3.8 × 10⁻⁴ and 3.8 × 10⁻⁶, respectively) [64]. This indicates that the REY in the residual aluminosilicates phase can be explained by the presence of terrigenous aluminosilicates [65]. The terrigenous aluminosilicates contain very low concentrations of REY (Figure 5) and eventually dilute the abundance of REY in the SCS crusts [66,67].
The sample HYD66-2 was obtained from the Central SCS Basin, which is much less affected by the continent than other Fe–Mn crusts from SCS. The mineralogy (Figure 3 and Section 3.1), geochemistry (Table 2 and Section 3.3), and REY distribution in major mineral phases showed that the Fe–Mn crusts in the Central SCS Basin had similar characteristics to the WPO crusts. Thus, crusts of HYD66-2 represent mixed signatures between the SCS and WPO Fe–Mn crust, considering Fe–Mn crusts that formed in the open oceans for the convenience of subsequent comparison. In these open-ocean crusts, a large part of the REY was leached into the residual fraction (L4). The Lu/Al ratios (17.0 × 10⁻⁶) in L4 were close to the upper crust value, whereas the La/Al ratios (142 × 10−4) were much higher than in the upper crust. This indicates the existence of excess LREY, which cannot be explained by terrigenous quartz and felspar. It was found at numerous sites in the Pacific Ocean that deep-sea mud contains high concentrations of REY [68]; however, in the SCS, the REY concentrations in the sediments are much lower [66]. It can be inferred that, in the open oceans, the clay may constitute an additional REY source in the Fe–Mn crusts. In addition, oceanic phillipsite was marked by a positive Ce anomaly and the Ce concentration could reach 140 ppm [69]; thus, the phillipsite was a likely cause of the positive Ce anomalies in L4 (Figure 6c). Therefore, it can be suggested that REY adsorption by clay minerals may be a considerable factor in REY enrichment in the open-ocean Fe–Mn crusts [70,71].

4.4.2. Growth Rate

The SCS crusts (except sample HYD66-2) had a higher growth rate (Table 2) than the open-ocean crusts (including samples HYD66-2, NASD44-1, and MP4SD24-1). It is known that the SCS Fe–Mn crusts are subjected to large amounts of terrigenous inputs (see Section 4.4.1). The terrigenous materials eventually promote the growth rate of the SCS Fe–Mn crusts [11,17].
Apart from the terrigenous inputs, the growth rate of the hydrogenetic Fe–Mn crusts is significantly influenced by the development of the oxygen minimum zone (OMZ) [12,72,73]. Figure 8 shows the vertical profiles of dissolved oxygen in different sea areas and the water depth of the Fe–Mn crusts [74,75,76]. The core of the OMZ in the SCS (e.g., Zhongsha Islands) is generally located at a depth of 600−800 m [74]. The Central SCS Basin has a very wide OMZ at a depth of 600−1600 m, and the vertical change of dissolved O2 is more complex because of the influence by the North Pacific Intermediate Water through the Philippine Sea [77]. Obviously, sample HYD66-2 grows in the OMZ, while the other SCS crusts are below the OMZ (Figure 8). Generally, Fe–Mn crusts grow faster below the OMZ than in the OMZ [11,17]. Hence, sample HYD66-2 had a lower growth rate than the other SCS crusts. In the WPO crusts, the situation was the same. The depth of OMZ in the WPO (including the Magellan seamount and Marcus-Wake seamount areas) extends to approximately 1500 m, and the sample MP4SD24-1 below the OMZ had a faster growth rate than sample NASD44-1 in the OMZ (Figure 8).
The OMZ may influence the growth rate and then influence the adsorption/enrichment of metals [1,78]. As shown in Figure 9 (see Table S2 for correlation coefficients, Supplementary Materials), the growth rate of the Fe–Mn crusts was negatively correlated with the concentrations of REY (R2 = 0.7481), FeOOH-bound REY (L3, R2 = 0.5099), and aluminosilicate-bound REY (L4, R2 = 0.5948). Instead, there was no obvious correlation between growth rate and Mn-bound REY (L2, R2 = 0.0037). This may suggest that the slow growth rate conduces more adsorption of REY from the surrounding seawater into the FeOOH and aluminosilicates rather than the δ-MnO2 [70,78]. The SCS Fe–Mn crusts have fast growth rates, and this may be the reason why they contain lower concentrations of REY than the open-ocean crusts [1].

5. Conclusions

Based on our investigations into the mineralogy of the Fe–Mn crusts from the SCS and WPO and the partitioning behavior of REY among the major mineral phases, the following can be concluded:
1)
Mineral composition is a considerable factor in the REY enrichment. Primary occurrence phases for REY in the SCS crusts are δ-MnO2 and amorphous FeOOH, both of which have advantageous crystal structures for REY enrichment. The WPO crusts have a large proportion of aluminosilicate-bound REY. We suggest that REY adsorption by clay minerals may play a role in the REY enrichment in the open-ocean Fe–Mn crusts.
2)
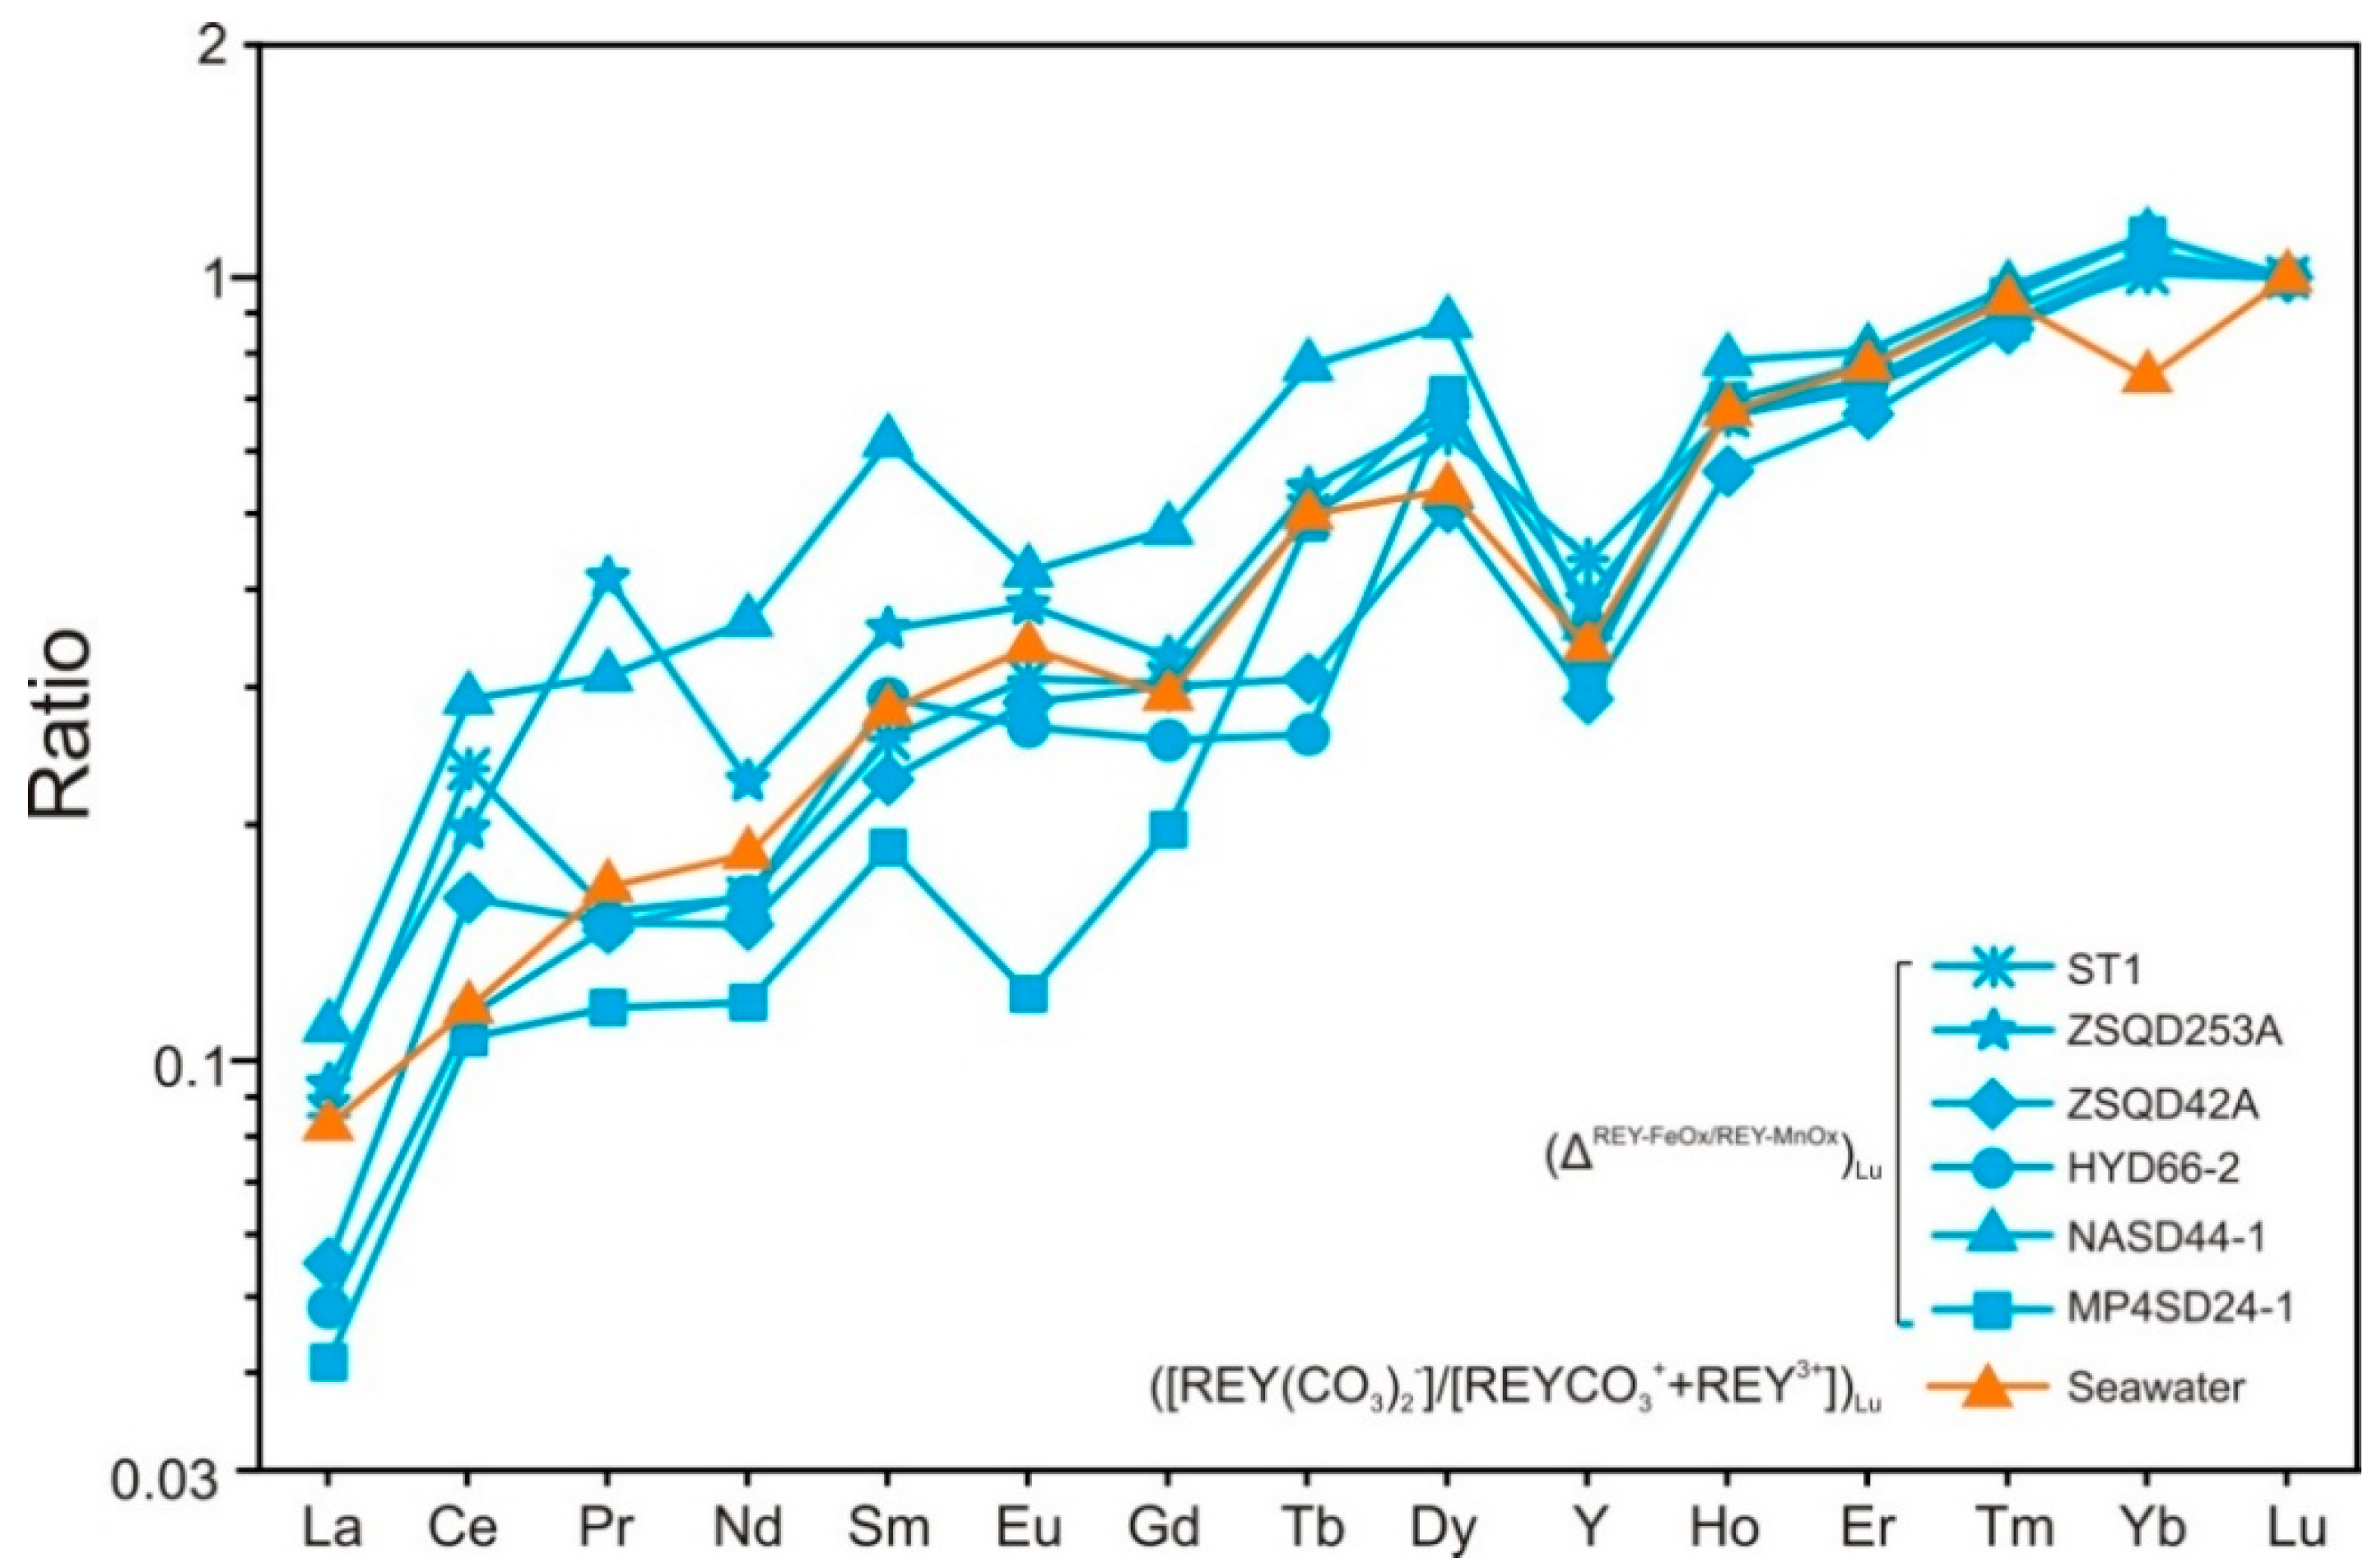
In the hydrogenetic Fe–Mn crusts from the SCS and WPO, most of the ΣREY is bound to Mn-oxide and amorphous FeOOH phases, with LREY and HREY preferentially adsorbed onto δ-MnO2 and FeOOH, respectively. REY-carbonate complexes are the dominate REY species in seawater. Thus, the selective adsorption of major REY complex species from seawater by δ-MnO2 and FeOOH is the predominant mechanism for REY enrichment in the hydrogenetic Fe–Mn crusts.
3)
The SCS crusts grow in the continental margin environment and they are significantly affected by terrigenous materials. The terrigenous aluminosilicate minerals in the SCS crusts dilute the abundance of REY. In contrast, Fe–Mn crusts in open oceans are rarely affected by the continent, and they contain a higher concentration of REY.
4)
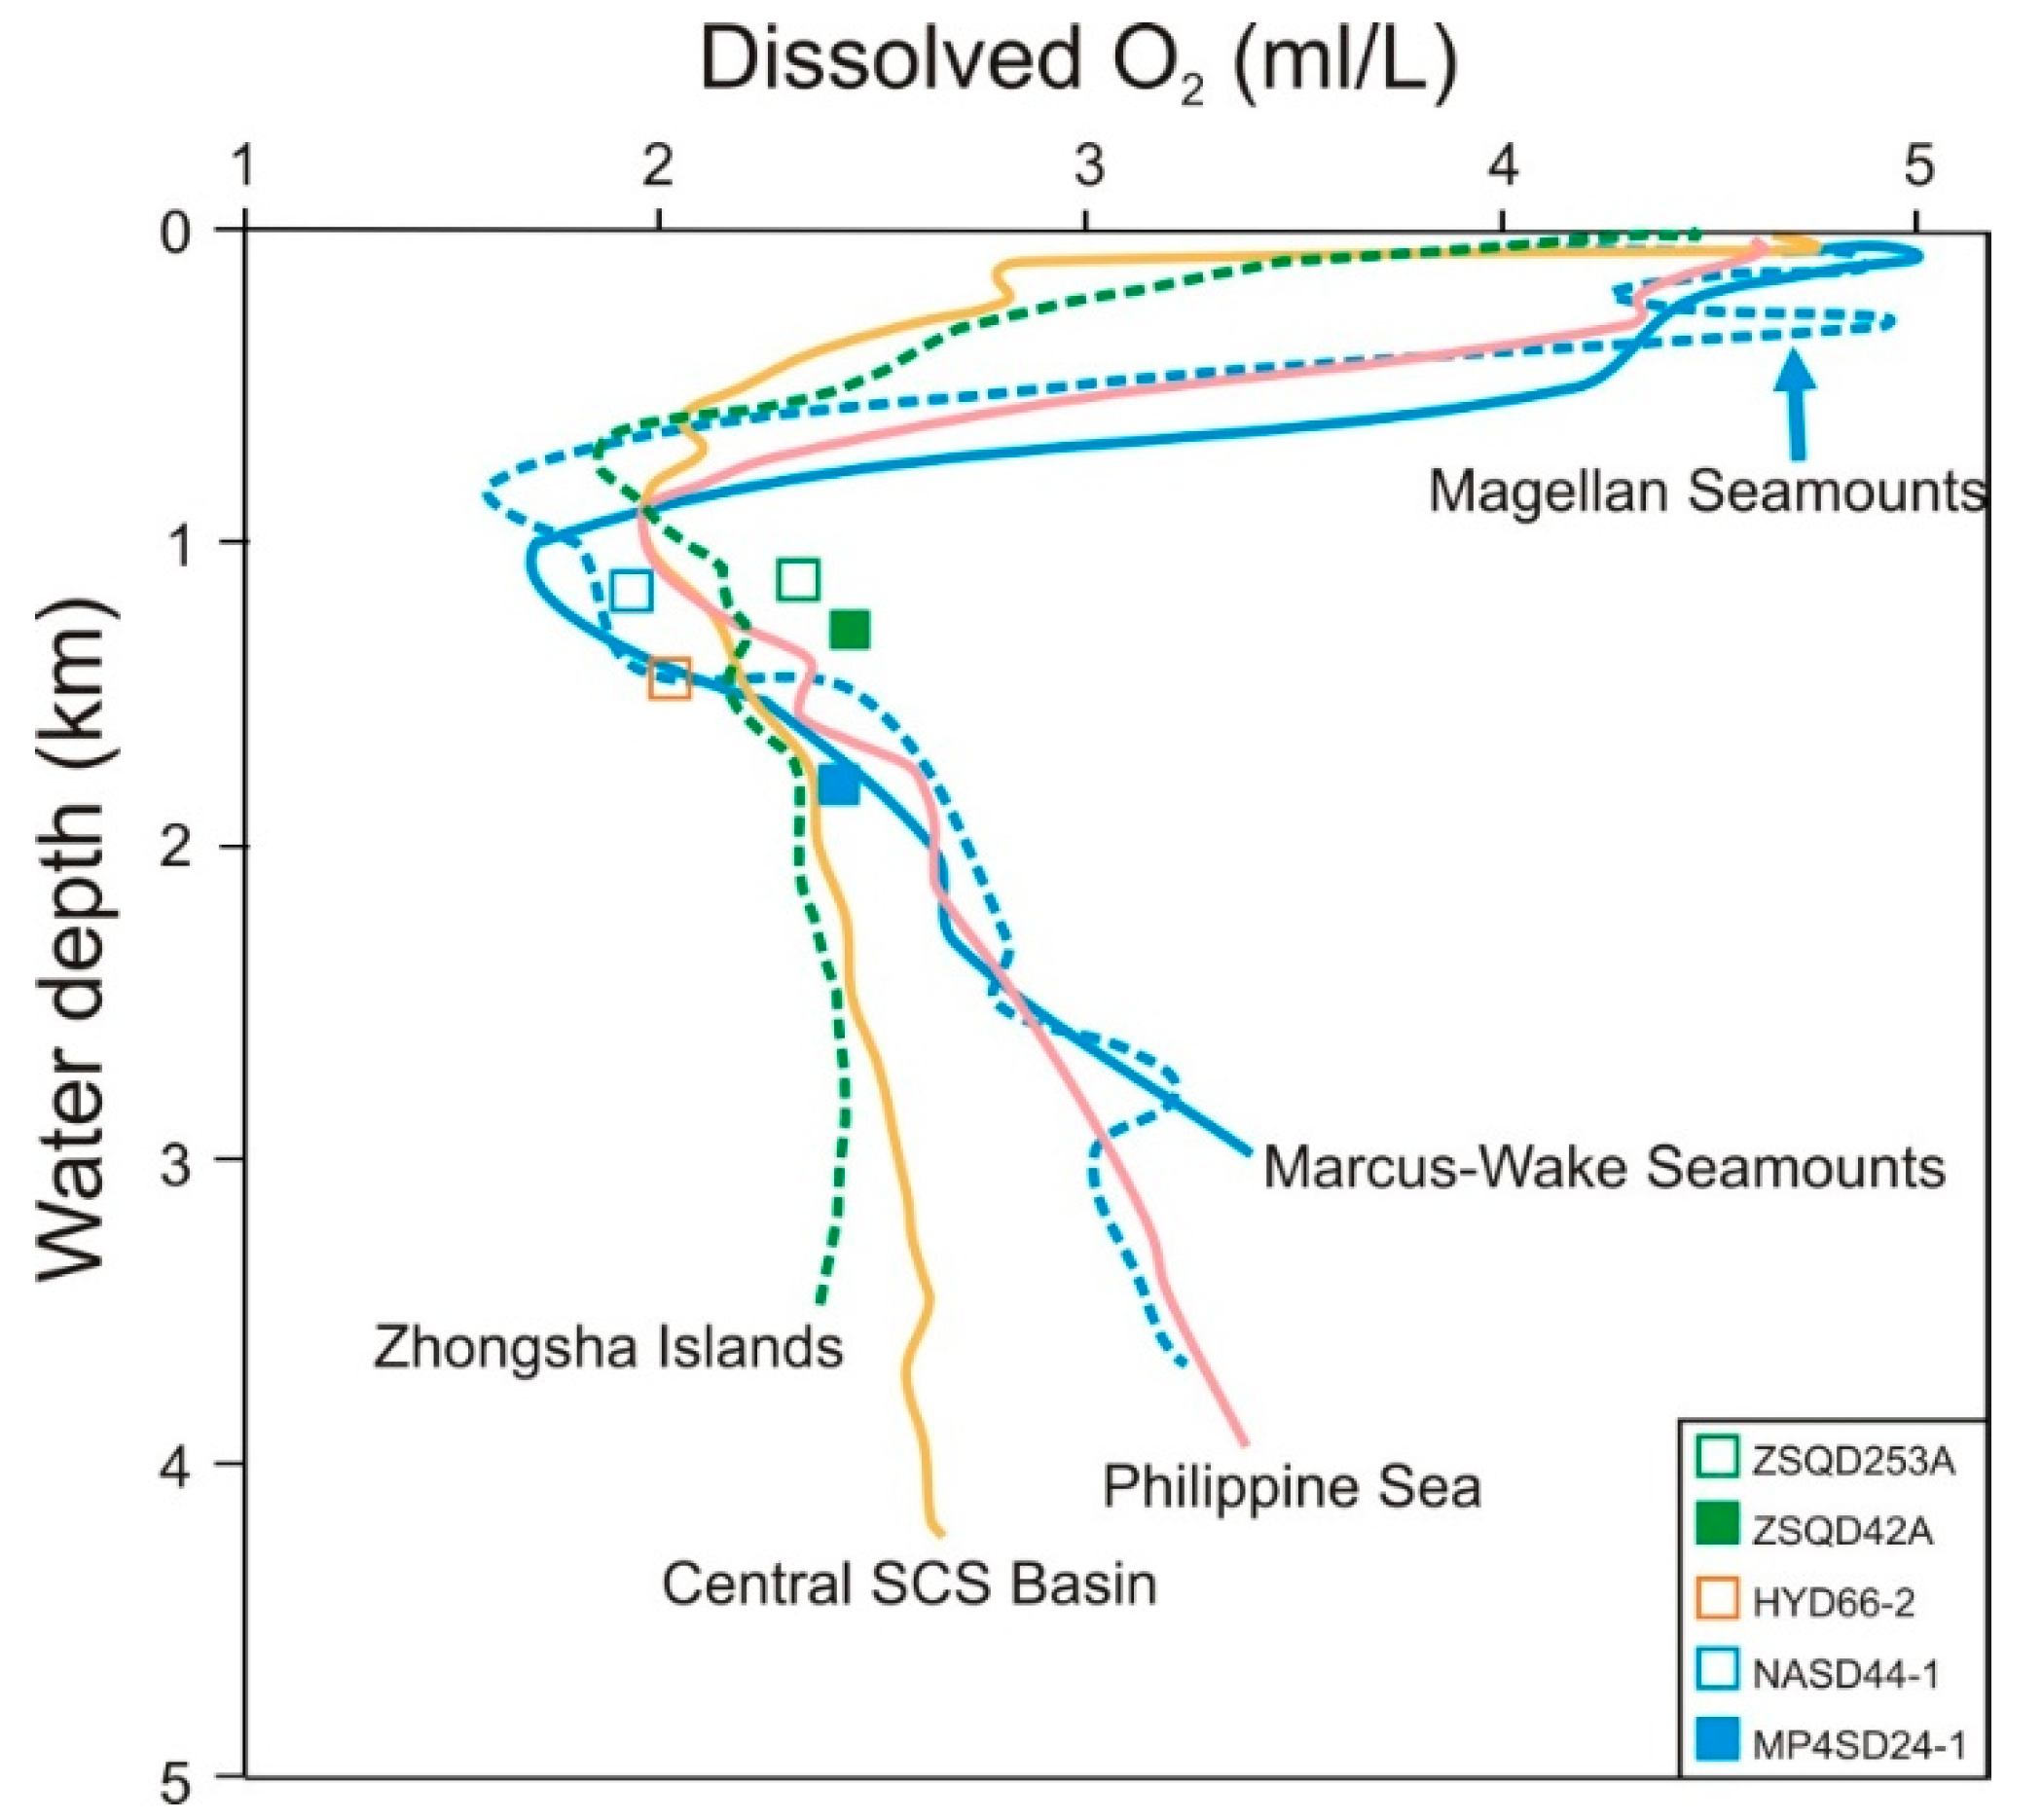
The terrigenous inputs and the development of OMZ determine the growth rate of the hydrogenetic Fe–Mn crusts. A fast growth rate is unfavorable for the adsorption of REY from the surrounding seawater into the FeOOH and aluminosilicates. Therefore, the SCS crusts with a faster growth rate contain lower REY enrichment.

Supplementary Materials

The following are available online at https://www.mdpi.com/2075-163X/9/1/8/s1: Table S1: Concentrations of REY in the leaches and in bulk crusts investigated in this study; Table S2: Correlation coefficient matrix for the growth rate and REY in different mineral phases; Table S3: LA-ICP-MS mapping data (CPS) of three Fe–Mn crusts samples; Figure S1: Microscope photograph of sample ST1 and the elemental maps determined by LA-ICP-MS; Figure S2: Microscope photograph of sample HYD66-2 and the elemental maps determined by LA-ICP-MS; Figure S3: Microscope photograph of sample NASD44-1 and the elemental maps determined by LA-ICP-MS.

Author Contributions

Y.R., X.S., and Y.G. conceived the experiments. Y.R. analyzed the data and wrote the paper. X.S. and Y.G. substantially revised the manuscript. Z.X. and Y.L. operated the XRD and LA-ICP-MS analysis, respectively. J.L. and Z.G. conducted the sequential leaching experiment.

Funding

This project was financially supported by the 13th and 12th Five Year Plan Project of International Maritime Resources Investigation and Development (DY135-C1-1-06, DY135-R2-1-01, DY125-13-R-05), the PhD Start-up Fund of the Natural Science Foundation of Guangdong Province, China (2018A030310264), the open-fund of Key Laboratory of Marine Mineral Resources, Ministry of Land and Resources (KLMMR-2017-B-02), and the open-fund of Key Laboratory of Mineralogy and Metallogeny, Chinese Academy of Sciences (KLMM20170203).

Acknowledgments

We are grateful to the Guangzhou Marine Geological Survey for supplying the samples. We thank Dengfeng Li and Yu Fu of Sun Yat-sen University for providing advice on the LA-ICP-MS analysis. Zhihui Lai and Simin Liang of the Instrumental Analysis Research Center (SYSU) are appreciated for their assistance in the geochemical analyses. Finally, we thank anonymous reviewers for their thoughtful and thorough suggestions/reviews that greatly assisted in the improvement of this manuscript.

Conflicts of Interest

The authors declare no conflict of interest.

References

  1. Hein, J.R.; Koschinsky, A.; Bau, M.; Manheim, F.T.; Kang, J.K.; Roberts, L. Cobalt-rich ferromanganese crusts in the Pacific. In Handbook of Marine Mineral Deposits; CRC Press: Boca Raton, FL, USA, 2000; pp. 239–279. [Google Scholar]
  2. Hein, J.R.; Reid, J.A.; Conrad, T.A.; Dunham, R.E.; Clague, D.A.; Schulz, M.S.; Davis, A.S. Seamounts and Ferromanganese Crusts Within and Near the U.S. EEZ off California—Data for RV Farnella Cruise F7-87-SC; U.S. Geological Survey: Reston, VA, USA, 2010. [CrossRef]
  3. Halbach, P.E.; Jahn, A.; Cherkashov, G. Marine Co-rich ferromangannese crust deposits: Description and formation, occurrences and distribution, estmated world-wide resources. In Deep-Sea Minerals: Distribution Characteristics and Their Resource Potential; Sharma, R., Ed.; Springer Nature: Basingstoke, UK, 2017; pp. 65–140. [Google Scholar]
  4. Bau, M.; Schmidt, K.; Koschinsky, A.; Hein, J.; Kuhn, T.; Usui, A. Discriminating between different genetic types of marine ferro-manganese crusts and nodules based on rare earth elements and yttrium. Chem. Geol. 2014, 381, 1–9. [Google Scholar] [CrossRef]
  5. Josso, P.; Pelleter, E.; Pourret, O.; Fouquet, Y.; Etoubleau, J.; Cheron, S.; Bollinger, C. A new discrimination scheme for oceanic ferromanganese deposits using high field strength and rare earth elements. Ore Geol. Rev. 2017, 87, 3–15. [Google Scholar] [CrossRef]
  6. Hein, J.R.; Koschinsky, A. Deep-ocean ferromanganese crusts and nodules. In Treatise on Geochemistry; Holland, H.D., Turekian, K.K., Eds.; Elsevier: Amsterdam, The Netherlands, 2014; pp. 273–291. [Google Scholar]
  7. Hein, J.R.; Mizell, K.; Koschinsky, A.; Conrad, T.A. Deep-ocean mineral deposits as a source of critical metals for high- and green-technology applications: Comparison with land-based resources. Ore Geol. Rev. 2013, 51, 1–14. [Google Scholar] [CrossRef]
  8. Marino, E.; González, F.J.; Lunar, R.; Reyes, J.; Medialdea, T.; Castillo-Carrión, M.; Bellido, E.; Somoza, L. High-resolution analysis of critical minerals and elements in Fe–Mn crusts from the Canary Island Seamount Province (Atlantic Ocean). Minerals 2018, 8, 285. [Google Scholar] [CrossRef]
  9. Hein, J.R.; Koschinsky, A.; Mikesell, M.; Mizell, K.; Glenn, C.; Wood, R. Marine phosphorites as potential resources for heavy rare earth elements and yttrium. Minerals 2016, 6, 88. [Google Scholar] [CrossRef]
  10. Hein, J.R.; Koschinsky, A.; Halbach, P.; Manheim, F.T.; Bau, M. Iron and manganese oxide mineralization in the Pacific. Geol. Soc. Lond. Spec. Publ. 1997, 119, 123–138. [Google Scholar] [CrossRef]
  11. Koschinsky, A.; Gerven, M.V.; Halbach, P. First investigations of massive ferromanganese crusts in the NE Atlantic in comparison with hydrogenetic Pacific occurrences. Mar. Georesour. Geotechnol. 1995, 13, 375–391. [Google Scholar] [CrossRef]
  12. Hein, J.R.; Conrad, T.; Mizell, K.; Banakar, V.K.; Frey, F.A.; Sager, W.W. Controls on ferromanganese crust composition and reconnaissance resource potential, Ninetyeast Ridge, Indian Ocean. Deep Sea Res. Part I Oceanogr. Res. Pap. 2016, 110, 1–19. [Google Scholar] [CrossRef]
  13. Prakash, L.S.; Ray, D.; Paropkari, A.L.; Mudholkar, A.V.; Satyanarayanan, M.; Sreenivas, B.; Chandrasekharam, D.; Kota, D.; Raju, K.A.K.; Kaisary, S.; et al. Distribution of REEs and yttrium among major geochemical phases of marine Fe–Mn-oxides: Comparative study between hydrogenous and hydrothermal deposits. Chem. Geol. 2012, 312–313, 127–137. [Google Scholar] [CrossRef]
  14. Konstantinova, N.; Hein, J.R.; Gartman, A.; Mizell, K.; Barrulas, P.; Cherkashov, G.; Mikhailik, P.; Khanchuk, A. Mineral Phase-Element Associations Based on Sequential Leaching of Ferromanganese Crusts, Amerasia Basin Arctic Ocean. Minerals 2018, 8, 460. [Google Scholar] [CrossRef]
  15. Grigoriev, A.G.; Zhamoida, V.A.; Gruzdov, K.A.; Krymsky, R.S. Age and growth rates of ferromanganese concretions from the gulf of Finland derived from 210Pb measurements. Oceanology 2013, 53, 345–351. [Google Scholar] [CrossRef]
  16. Hein, J.R. Mercury- and silver-rich ferromanganese oxides, southern California borderland: Deposit model and environmental implications. Econ. Geol. 2005, 100, 1151–1168. [Google Scholar] [CrossRef]
  17. Conrad, T.; Hein, J.R.; Paytan, A.; Clague, D.A. Formation of Fe–Mn crusts within a continental margin environment. Ore Geol. Rev. 2017, 87, 25–40. [Google Scholar] [CrossRef]
  18. Guan, Y.; Sun, X.; Jiang, X.; Sa, R.; Zhou, L.; Huang, Y.; Liu, Y.; Li, X.; Lu, R.; Wang, C. The effect of Fe–Mn minerals and seawater interface and enrichment mechanism of ore-forming elements of polymetallic crusts and nodules from the South China Sea. Acta Oceanol. Sin. 2017, 36, 34–46. [Google Scholar] [CrossRef]
  19. Guan, Y.; Sun, X.; Ren, Y.; Jiang, X. Mineralogy, geochemistry and genesis of the polymetallic crusts and nodules from the South China Sea. Ore Geol. Rev. 2017, 89, 206–227. [Google Scholar] [CrossRef]
  20. Zhong, Y.; Chen, Z.; González, F.J.; Hein, J.R.; Zheng, X.; Li, G.; Luo, Y.; Mo, A.; Tian, Y.; Wang, S. Composition and genesis of ferromanganese deposits from the northern South China Sea. J. Asian Earth Sci. 2017, 138, 110–128. [Google Scholar] [CrossRef] [Green Version]
  21. Guan, Y.; Ren, Y.; Sun, X.; Xiao, Z.; Guo, Z. Helium and argon isotopes in the Fe–Mn polymetallic crusts and nodules from the South China Sea: Constraints on their genetic sources and origins. Minerals 2018, 8, 471. [Google Scholar] [CrossRef]
  22. Zhang, Z.; Gao, L.; Shen, P.; Wang, Y.; Feng, G. Polimetallic nodules at the northwest continental margin of the South China Sea. Mar. Geol. Lett. 2010, 26, 32. [Google Scholar]
  23. Guan, Y.; Sun, X.; Shi, G.; Jiang, X.; Lu, H. Rare earth elements composition and constraint on the genesis of the polymetallic crusts and nodules in the South China Sea. Acta Geol. Sin. 2017, 91, 1751–1766. [Google Scholar] [CrossRef]
  24. Bau, M.; Koschinsky, A. Oxidative scavenging of cerium on hydrous Fe oxide: Evidence from the distribution of rare earth elements and yttrium between Fe oxides and Mn oxides in hydrogenetic ferromanganese crusts. Geochem. J. 2009, 43, 37–47. [Google Scholar] [CrossRef] [Green Version]
  25. Takahashi, Y.; Manceau, A.; Geoffroy, N.; Marcus, M.A.; Usui, A. Chemical and structural control of the partitioning of Co, Ce, and Pb in marine ferromanganese oxides. Geochim. Cosmochim. Acta 2007, 71, 984–1008. [Google Scholar] [CrossRef]
  26. Koschinsky, A.; Hein, J.R. Uptake of elements from seawater by ferromanganese crusts: Solid-phase associations and seawater speciation. Mar. Geol. 2003, 198, 331–351. [Google Scholar] [CrossRef]
  27. Koschinsky, A.; Halbach, P. Sequential leaching of marine ferromanganese precipitates: Genetic implications. Geochim. Cosmochim. Acta 1995, 59, 5113–5132. [Google Scholar] [CrossRef]
  28. Wang, Z.L.; Yamada, M. Geochemistry of dissolved rare earth elements in the Equatorial Pacific Ocean. Environ. Geol. 2006, 52, 779–787. [Google Scholar] [CrossRef]
  29. Zhou, D.; Yao, B. Tectonics and sedimentary basins of the South China Sea: Challenges and progresses. J. Earth Sci. 2009, 20, 1–12. [Google Scholar] [CrossRef]
  30. Yang, S.X.; Qiu, Y.; Zhu, B.Y. Atlas of Geology and Geophysics of the South China Sea; China Navigation Publications: Tianjing, China, 2015. [Google Scholar]
  31. Li, D.; Fu, Y.; Sun, X.; Hollings, P.; Liao, J.; Liu, Q.; Feng, Y.; Liu, Y.; Lai, C. LA-ICP-MS trace element mapping: Element mobility of hydrothermal magnetite from the giant Beiya Fe-Au skarn deposit, SW China. Ore Geol. Rev. 2018, 92, 463–474. [Google Scholar] [CrossRef]
  32. Zhou, H.; Sun, X.; Wu, Z.; Liao, J.; Fu, Y.; Li, D.; Hollings, P.; Liu, Y.; Lin, H.; Lin, Z. Hematite U-Pb geochronometer: Insights from monazite and hematite integrated chronology of the Yaoan gold deposit, southwest China. Econ. Geol. 2017, 112, 2023–2039. [Google Scholar] [CrossRef]
  33. McLennan, S.M. Rare earth elements in sedimentary rocks; Influence of provenance and sedimentary processes. Rev. Mineral. Geochem. 1989, 21, 169–200. [Google Scholar]
  34. Manheim, F.T.; Lane-Bostwick, C.M. Cobalt in ferromanganese crusts as a monitor of hydrothermal discharge on the Pacific sea floor. Nature 1988, 335, 59–62. [Google Scholar] [CrossRef]
  35. Hirata, J.; Takahashi, K.; Sahoo, Y.V.; Tanaka, M. Laser ablation inductively coupled plasma mass spectrometry for quantitative imaging of elements in ferromanganese nodule. Chem. Geol. 2016, 427, 65–72. [Google Scholar] [CrossRef]
  36. Raimondo, T.; Payne, J.; Wade, B.; Lanari, P.; Clark, C.; Hand, M. Trace element mapping by LA-ICP-MS: Assessing geochemical mobility in garnet. Contrib. Mineral. Petrol. 2017, 172, 17. [Google Scholar] [CrossRef]
  37. Ubide, T.; McKenna, C.A.; Chew, D.M.; Kamber, B.S. High-resolution LA-ICP-MS trace element mapping of igneous minerals: In search of magma histories. Chem. Geol. 2015, 409, 157–168. [Google Scholar] [CrossRef]
  38. Kuhn, T.; Wegorzewski, A.; Rühlemann, C.; Vink, A. Composition, Formation, and Occurrence of Polymetallic Nodules. In Deep-Sea Minerals: Distribution Characteristics and Their Resource Potential; Sharma, R., Ed.; Springer Nature: Basingstoke, UK, 2017; pp. 23–63. [Google Scholar]
  39. Lee, S.; Xu, H. Size-dependent phase map and phase transformation kinetics for nanometric Iron (III) Oxides (γ→ϵ→α pathway). J. Phys. Chem. C 2016, 120, 13316–13322. [Google Scholar] [CrossRef]
  40. Post, J.E. Manganese oxide minerals: Crystal structures and economic and environmental significance. Proc. Natl. Acad. Sci. USA 1999, 96, 3447–3454. [Google Scholar] [CrossRef] [PubMed] [Green Version]
  41. Marcus, M.A.; Manceau, A.; Kersten, M. Mn, Fe, Zn and As speciation in a fast-growing ferromanganese marine nodule. Geochim. Cosmochim. Acta 2004, 68, 3125–3136. [Google Scholar] [CrossRef]
  42. Sahai, N.; Lee, Y.J.; Xu, H.; Ciardelli, M.; Gaillard, J.F. Role of Fe (II) and phosphate in arsenic uptake by coprecipitation. Geochim. Cosmochim. Acta 2007, 71, 3193–3210. [Google Scholar] [CrossRef]
  43. Coppin, F.; Berger, G.; Bauer, A.; Castet, S.; Loubet, M. Sorption of lanthanides on smectite and kaolinite. Chem. Geol. 2002, 182, 57–68. [Google Scholar] [CrossRef]
  44. De Carlo, E.H.; McMurtry, G.M. Rare-earth element geochemistry of ferromanganese crusts from the Hawaiian Archipelago, Central Pacific. Chem. Geol. 1992, 95, 235–250. [Google Scholar] [CrossRef]
  45. Sholkovitz, E.R.; Landing, W.M.; Lewis, B.L. Ocean particle chemistry: The fractionation of rare earth elements between suspended particles and seawater. Geochim. Cosmochim. Acta 1994, 58, 1567–1579. [Google Scholar] [CrossRef]
  46. Ohta, A.; Kawabe, I. Rare earth element partitioning between Fe oxyhydroxide precipitates and aqueous NaCl solutions doped with NaHCO3: Determinations of rare earth element complexation constants with carbonatc ions. Geochem. J. 2000, 34, 439–454. [Google Scholar] [CrossRef]
  47. Schijf, J.; Marshall, K.S. YREE sorption on hydrous ferric oxide in 0.5 M NaCl solutions: A model extension. Mar. Chem. 2011, 123, 32–43. [Google Scholar] [CrossRef]
  48. Patten, J.T.; Byrne, R.H. Assessment of Fe(III) and Eu(III) complexation by silicate in aqueous solutions. Geochim. Cosmochim. Acta 2017, 202, 361–373. [Google Scholar] [CrossRef]
  49. Byrne, R.H. Inorganic speciation of dissolved elements in seawater: The influence of pH on concentration ratios. Geochem. Trans. 2002, 2, 11. [Google Scholar] [CrossRef]
  50. Liu, X.; Byrne, R.H. Comprehensive investigation of yttrium and rare earth element complexation by carbonate ions using ICP-mass spectrometry. J. Solut. Chem. 1998, 27, 803–815. [Google Scholar] [CrossRef]
  51. Erel, Y.; Stolper, E.M. Modeling of rare-earth element partitioning between particles and solution in aquatic environments. Geochim. Cosmochim. Acta 1992, 57, 513–518. [Google Scholar] [CrossRef]
  52. Schijf, J.; Christenson, E.A.; Byrne, R.H. YREE scavenging in seawater: A new look at an old model. Mar. Chem. 2015, 177, 460–471. [Google Scholar] [CrossRef] [Green Version]
  53. Akagi, T. Rare earth element (REE)-silicic acid complexes in seawater to explain the incorporation of REEs in opal and the “leftover” REEs in surface water: New interpretation of dissolved REE distribution profiles. Geochim. Cosmochim. Acta 2013, 113, 174–192. [Google Scholar] [CrossRef]
  54. Luo, Y.R.; Byrne, R.H. Carbonate complexation of yttrium and the rare earth elements in natural waters. Geochim. Cosmochim. Acta 2004, 68, 691–699. [Google Scholar] [CrossRef]
  55. Catts, J.G.; Langmuir, D. Adsorption of Cu, Pb and Zn by δ-MnO2: Applicability of the site binding-surface complexation model. Appl. Geochem. 1986, 1, 255–264. [Google Scholar] [CrossRef]
  56. Yao, W.S.; Millero, F.J. Adsorption of phosphate on manganese dioxide in seawater. Environ. Sci. Technol. 1996, 30, 536–541. [Google Scholar] [CrossRef]
  57. Sverjensky, D.A.; Sahai, N. Theoretical prediction of single-site surface-protonation equilibrium constants for oxides and silicates in water. Geochim. Cosmochim. Acta 1996, 60, 3773–3797. [Google Scholar] [CrossRef]
  58. Ohta, A.; Kawabe, I. REE(III) adsorption onto Mn dioxide (δ-MnO2) and Fe oxyhydroxide: Ce(III) oxidation by δ-MnO2. Geochim. Cosmochim. Acta 2001, 65, 695–703. [Google Scholar] [CrossRef]
  59. Bau, M. Scavenging of dissolved yttrium and rare earths by precipitating iron oxyhydroxide: Experimental evidence for Ce oxidation, Y-Ho fractionation, and lanthanide tetrad effect. Geochim. Cosmochim. Acta 1999, 63, 67–77. [Google Scholar] [CrossRef]
  60. Liu, Z.; Zhao, Y.; Colin, C.; Stattegger, K.; Wiesner, M.G.; Huh, C.A.; Zhang, Y.; Li, X.; Sompongchaiyakul, P.; You, C.F.; et al. Source-to-sink transport processes of fluvial sediments in the South China Sea. Earth Sci. Rev. 2016, 153, 238–273. [Google Scholar] [CrossRef] [Green Version]
  61. Wu, Q.; Colin, C.; Liu, Z.; Douville, E.; Dubois-Dauphin, Q.; Frank, N. New insights into hydrological exchange between the South China Sea and the Western Pacific Ocean based on the Nd isotopic composition of seawater. Deep Sea Res. Part II Top. Stud. Oceanogr. 2015, 122, 25–40. [Google Scholar] [CrossRef]
  62. Liu, J.; Xiang, R.; Chen, Z.; Chen, M.; Yan, W.; Zhang, L.; Chen, H. Sources, transport and deposition of surface sediments from the South China Sea. Deep Sea Res. Part I Oceanogr. Res. Pap. 2013, 71, 92–102. [Google Scholar] [CrossRef]
  63. Möller, P.; Muecke, G.K. Significance of europium anomalies in silicate melt and crystal-melt equilibria: A re-evaluation. Contrib. Mineral. Petrol. 1984, 87, 242–250. [Google Scholar] [CrossRef]
  64. Rudnick, R.L.; Gao, S. Composition of the continental crust. In The Crust; Holland, H.D., Turekian, K.K., Eds.; Elsevier-Pergamon: Oxford, UK, 2003; pp. 1–64. [Google Scholar]
  65. Akagi, T.; Fu, F.; Hongo, Y.; Takahashi, K. Composition of rare earth elements in settling particles collected in the highly productive North Pacific Ocean and Bering Sea: Implications for siliceous-matter dissolution kinetics and formation of two REE-enriched phases. Geochim. Cosmochim. Acta 2011, 75, 4857–4876. [Google Scholar] [CrossRef]
  66. Wang, S.; Zhang, N.; Chen, H.; Li, L.; Yan, W. The surface sediment types and their rare earth element characteristics from the continental shelf of the northern South China Sea. Cont. Shelf Res. 2014, 88, 185–202. [Google Scholar] [CrossRef]
  67. Wei, G.; Liu, Y.; Ma, J.; Xie, L.; Chen, J.; Deng, W.; Tang, S. Nd, Sr isotopes and elemental geochemistry of surface sediments from the South China Sea: Implications for provenance tracing. Mar. Geol. 2012, 319–322, 21–34. [Google Scholar] [CrossRef]
  68. Kato, Y.; Fujinaga, K.; Nakamura, K.; Takaya, Y.; Kitamura, K.; Ohta, J.; Toda, R.; Nakashima, T.; Iwamori, H. Deep-sea mud in the Pacific Ocean as a potential resource for rare-earth elements. Nat. Geosci. 2011, 4, 535–539. [Google Scholar] [CrossRef]
  69. Dubinin, A.V. Geochemistry of rare earth elements in oceanic phillipsites. Lithol. Miner. Resour. 2000, 35, 101–108. [Google Scholar] [CrossRef]
  70. Sa, R.; Sun, X.; He, G.; Xu, L.; Pan, Q.; Liao, J.; Zhu, K.; Deng, X. Enrichment of rare earth elements in siliceous sediments under slow deposition: A case study of the central North Pacifi. Ore Geol. Rev. 2018, 94, 12–23. [Google Scholar] [CrossRef]
  71. Khanchuk, A.I.; Mikhailik, P.E.; Mikhailika, E.V.; Zarubina, N.V.; Blokhina, M.G. Peculiarities of the distribution of rare earth elements and yttrium in mineral phases of the ferromanganese crusts from the Detroit Guyot (Pacific Ocean). Dokl. Earth Sci. 2015, 465, 479–483. [Google Scholar] [CrossRef]
  72. Hein, J.R.; Schwab, W.C.; Davis, A. Cobalt- and platinum-rich ferromanganese crusts and associated substrate rocks from the Marshall Islands. Mar. Geol. 1988, 78, 255–283. [Google Scholar] [CrossRef]
  73. Halbach, P.; Hebisch, U.; Scherhag, C. Geochemical variations of ferromanganese nodules and crusts from different provinces of the Pacific Ocean and their genetic control. Chem. Geol. 1981, 34, 3–17. [Google Scholar] [CrossRef]
  74. Li, L.; Qu, T. Thermohaline circulation in the deep South China Sea basin inferred from oxygen distributions. J. Geophys. Res. 2006, 111, C05017. [Google Scholar] [CrossRef]
  75. Alibo, D.S.; Nozaki, Y. Dissolved rare earth elements in the South China Sea: Geochemical characterization of the water masses. J. Geophys. Res. Oceans 2000, 105, 28771–28783. [Google Scholar] [CrossRef] [Green Version]
  76. He, G.W.; Sun, X.M.; Xue, T. Marine environment and chemistry in working areas. In A Comparative Study of the Geology, Geochemistry and Metallogenetic Mechanism of Polymetallic Nodules and Cobalt-Rich Crusts from the Pacific Ocean; Zhao, J., Cai, W., Eds.; Geological Publishing House: Beijing, China, 2011; pp. 41–45. [Google Scholar]
  77. Nozaki, Y.; Alibo, D.S.; Amakawa, H.; Gamo, T.; Hasumoto, H. Dissolved rare earth elements and hydrography in the Sulu Sea. Geochim. Cosmochim. Acta 1999, 63, 2171–2181. [Google Scholar] [CrossRef]
  78. Marino, E.; González, F.J.; Somoza, L.; Lunar, R.; Ortega, L.; Vázquez, J.T.; Reyes, J.; Bellido, E. Strategic and rare elements in Cretaceous-Cenozoic cobalt-rich ferromanganese crusts from seamounts in the Canary Island Seamount Province (northeastern tropical Atlantic). Ore Geol. Rev. 2017, 87, 41–61. [Google Scholar] [CrossRef]
Figure 1. Locations of the Fe–Mn crust samples in the South China Sea (SCS) and West Pacific Ocean (WPO).
Minerals 09 00008 g001
Figure 2. The flow chart of the sequential leaching procedure.
Minerals 09 00008 g002
Figure 3. X-ray diffraction patterns of the Fe–Mn crusts taken with a 0.1-mm collimator. δ = δ-MnO2; Q = quartz; An = anorthite; Cal = magnesian calcite; T = todorokite, P = phillipsite.
Minerals 09 00008 g003
Figure 4. Microscope photograph and the images of elemental distributions in samples ST1, HYD66-2, and NASD44-1 determined by laser ablation inductively coupled plasma mass spectrometry (LA-ICP-MS). The size of each image is 500 μm × 500 μm. In images of elemental distributions, red and blue colors represent the maximum and minimum determined values, respectively.
Minerals 09 00008 g004
Figure 5. Comparative rare earth elements plus yttrium (REY) abundance in Mn-oxide phase (L2), amorphous FeOOH phase (L3), and residual aluminosilicates phase (L4) of the Fe–Mn crusts.
Minerals 09 00008 g005
Figure 6. Post-Archean Australian shale-normalized (PAAS) patterns of REY leached in the (a) Mn-oxide phase, (b) amorphous FeOOH phase, and (c) residual aluminosilicate phase. (d) The PAAS-normalized REY patterns of bulk Fe–Mn crusts.
Minerals 09 00008 g006
Figure 7. The pattern of Lu-normalized distribution of the REY between dominate speciation ([REY(CO3)2]/[REYCO3+ + REY3+])Lu in seawater at pH 8.2 and the patterns of (ΔREY-FeOx/REY-MnOx)Lu values for hydrogenetic Fe–Mn crusts. The similarity demonstrates that the REY speciation in seawater can basically describe the distribution and fractionation of the REY between the Mn oxides and hydrous Fe oxides in Fe–Mn crusts. They further suggest that there are other factors in the fractionation of light REY (LREY) and middle REY (MREY) between the Mn oxides and hydrous Fe oxides.
Minerals 09 00008 g007
Figure 8. Vertical profiles curve of dissolved oxygen in different sea areas. The curves of the Philippines Sea and Zhongsha Islands in the South China Sea are modified from Reference [74]. Data from the Central SCS Basin refer to Reference [75]. Data for the Magellan seamounts and Marcus-Wake seamounts are from Reference [76]. The blocks represent the Fe–Mn crusts formed at different water depths in different sea areas. ZSQD253A and ZSQD42A formed in the Zhongsha Islands, HYD66-2 grew on a seamount in the Central SCS Basin, NASD44-1 grew on Magellan seamounts, and MP4SD24A-1 grew on Marcus-Wake seamounts.
Minerals 09 00008 g008
Figure 9. Bivariate diagram of growth rate and REY in different mineral phases of the hydrogenetic Fe–Mn crusts. Data are from six crusts in this study and from two hydrogenetic crusts from the Central Indian Ocean Basin (CIOB) [13].
Minerals 09 00008 g009
Table 1. Sample descriptions and bulk mineralogy of Fe–Mn crusts in the South China Sea (SCS) and West Pacific Ocean (WPO). XRD—X-ray diffraction; E—east; N—north.
SampleLocationDepth (m)SubstrateXRD Mineral Compositions
SCSST1117°54.6′ E, 20°28.4′ N1600Altered basalt covered by carbonateδ-MnO2, quartz, anorthite, and calcite
ZSQD253A118°36.4′ E, 16°46′ N1150Bioclastic limestoneδ-MnO2, quartz, anorthite, and calcite
ZSQD42A114°49′ E, 16°51′ N1230Reef limestoneδ-MnO2, quartz, anorthite, and calcite
HYD66-2115°16.4′ E, 13°40.7′ N1378Altered basaltTodorokite, δ-MnO2, quartz, and anorthite
WPONASD44-1115°35.4′ E, 19°54.2′ N1747Brecciaδ-MnO2, quartz, and phillipsite
MP4SD24A-1162°18.8′ E, 19°36′ N1191BrecciaTodorokite, δ-MnO2, quartz, and phillipsite
Table 2. Bulk geochemical compositions and relative growth rates of the Fe–Mn crusts in the South China Sea and West Pacific Ocean. Major elements are in wt.% and trace elements are in parts per million (ppm).
ElementsSouth China SeaWestern Pacific Ocean
ST1ZSQD253AZSQD42AHYD66-2NASD44-1MP4SD24A-1
Mn (%)8.98 8.78 14.84 19.21 21.71 15.83
Fe14.67 10.98 14.39 16.41 13.93 10.71
Mn/Fe0.61 0.80 1.03 1.17 1.56 1.48
Si a18.6612.697.206.112.091.90
Al2.88 2.02 0.88 0.99 0.88 0.44
Ca1.85 2.87 3.34 1.90 2.14 2.06
Mg0.96 1.16 1.23 1.07 1.04 0.99
Ti0.31 0.42 0.35 0.35 0.92 0.35
P0.28 0.22 0.32 0.37 0.31 0.41
As (ppm)173 105 207 258 204 172
Ba721 551 715 1527 1398 3035
Co873 1101 2320 3256 5788 2667
Cu424 418 366 571 1346 816
Mo200 125 303 545 498 625
Ni1540 2835 4016 3243 5762 3448
Pb1709 1034 2179 2797 1612 1205
Zn432 516 590 645 731 864
La125.0 101.5 228.5 222.9 237.4 181.8
Ce598.3 744.2 959.0 1552 924.7 883.1
Pr29.53 20.64 39.80 49.33 45.01 30.37
Nd126.3 90.0 168.8 200.6 187.0 130.4
Sm27.74 21.02 38.29 45.12 38.27 25.34
Eu6.94 5.49 9.46 10.91 9.95 7.21
Gd32.63 28.34 46.11 54.07 49.78 33.75
Tb6.26 3.85 6.34 7.10 6.95 3.51
Dy32.99 21.60 33.85 36.48 40.35 23.53
Y105.3 87.5 148.3 98.0 146.5 123.0
Ho6.13 4.38 8.42 6.82 8.36 6.19
Er17.24 12.93 23.83 19.14 24.76 20.13
Tm2.37 1.83 3.27 2.67 3.61 2.86
Yb15.20 11.97 20.63 16.89 23.40 18.89
Lu2.35 1.90 3.14 2.54 3.65 3.22
ΣREY1134 1157 1738 2324 1750 1493
Ce/Ce*2.25 3.72 2.28 3.39 2.04 2.68
Eu/Eu*2.25 1.01 1.03 1.01 1.03 1.11
Yn/Hon0.63 0.73 0.65 0.53 0.64 0.73
Lan/Ybn0.61 0.62 0.82 0.97 0.75 0.71
Growth rate (mm/Myr) **11.43 5.75 3.18 2.51 0.96 2.15
a Data were determined using X-ray fluorescence spectrometer by Reference [19]; Ce/Ce* = 2Cen/(Prn − Ndn); Eu/Eu* = 2Eu/(Smn + Gdn); Lan, Cen, Prn, Ndn, Smn, Gdn, Yn, Hon, Ybn to shale-normalized data. ** The growth rate was estimated following the empirical equation [34]: growth rate = 0.68/(wCon)1.67, where wCon indicates cobalt concentration normalized to Fe and Mn contents.

