Multi-Analytical Characterization of Slags to Determine the Chromium Concentration for a Possible Re-Extraction

 , , ,
, , , 
Abstract
:1. Introduction
2. Materials and Methods
2.1. Materials
- CS: Carbon steel EAF slags crushed to <5 mm
- SS: Fine fraction of stainless steel slags (<0.5 mm) (SS) resulting from a demetallization process
- LC FeCr: low-carbon ferrochrome slags (LC FeCr), obtained from a single slag pot, crushed, and sieved to a fraction 4–9 mm for homogenization
- HC FeCr: high-carbon ferrochrome slags crushed and sieved to 0–4 mm
2.2. Methods for Chemical Composition
2.3. Mineralogy and Mineral Liberation
3. Results
3.1. Chemical Composition
3.2. Mineralogy
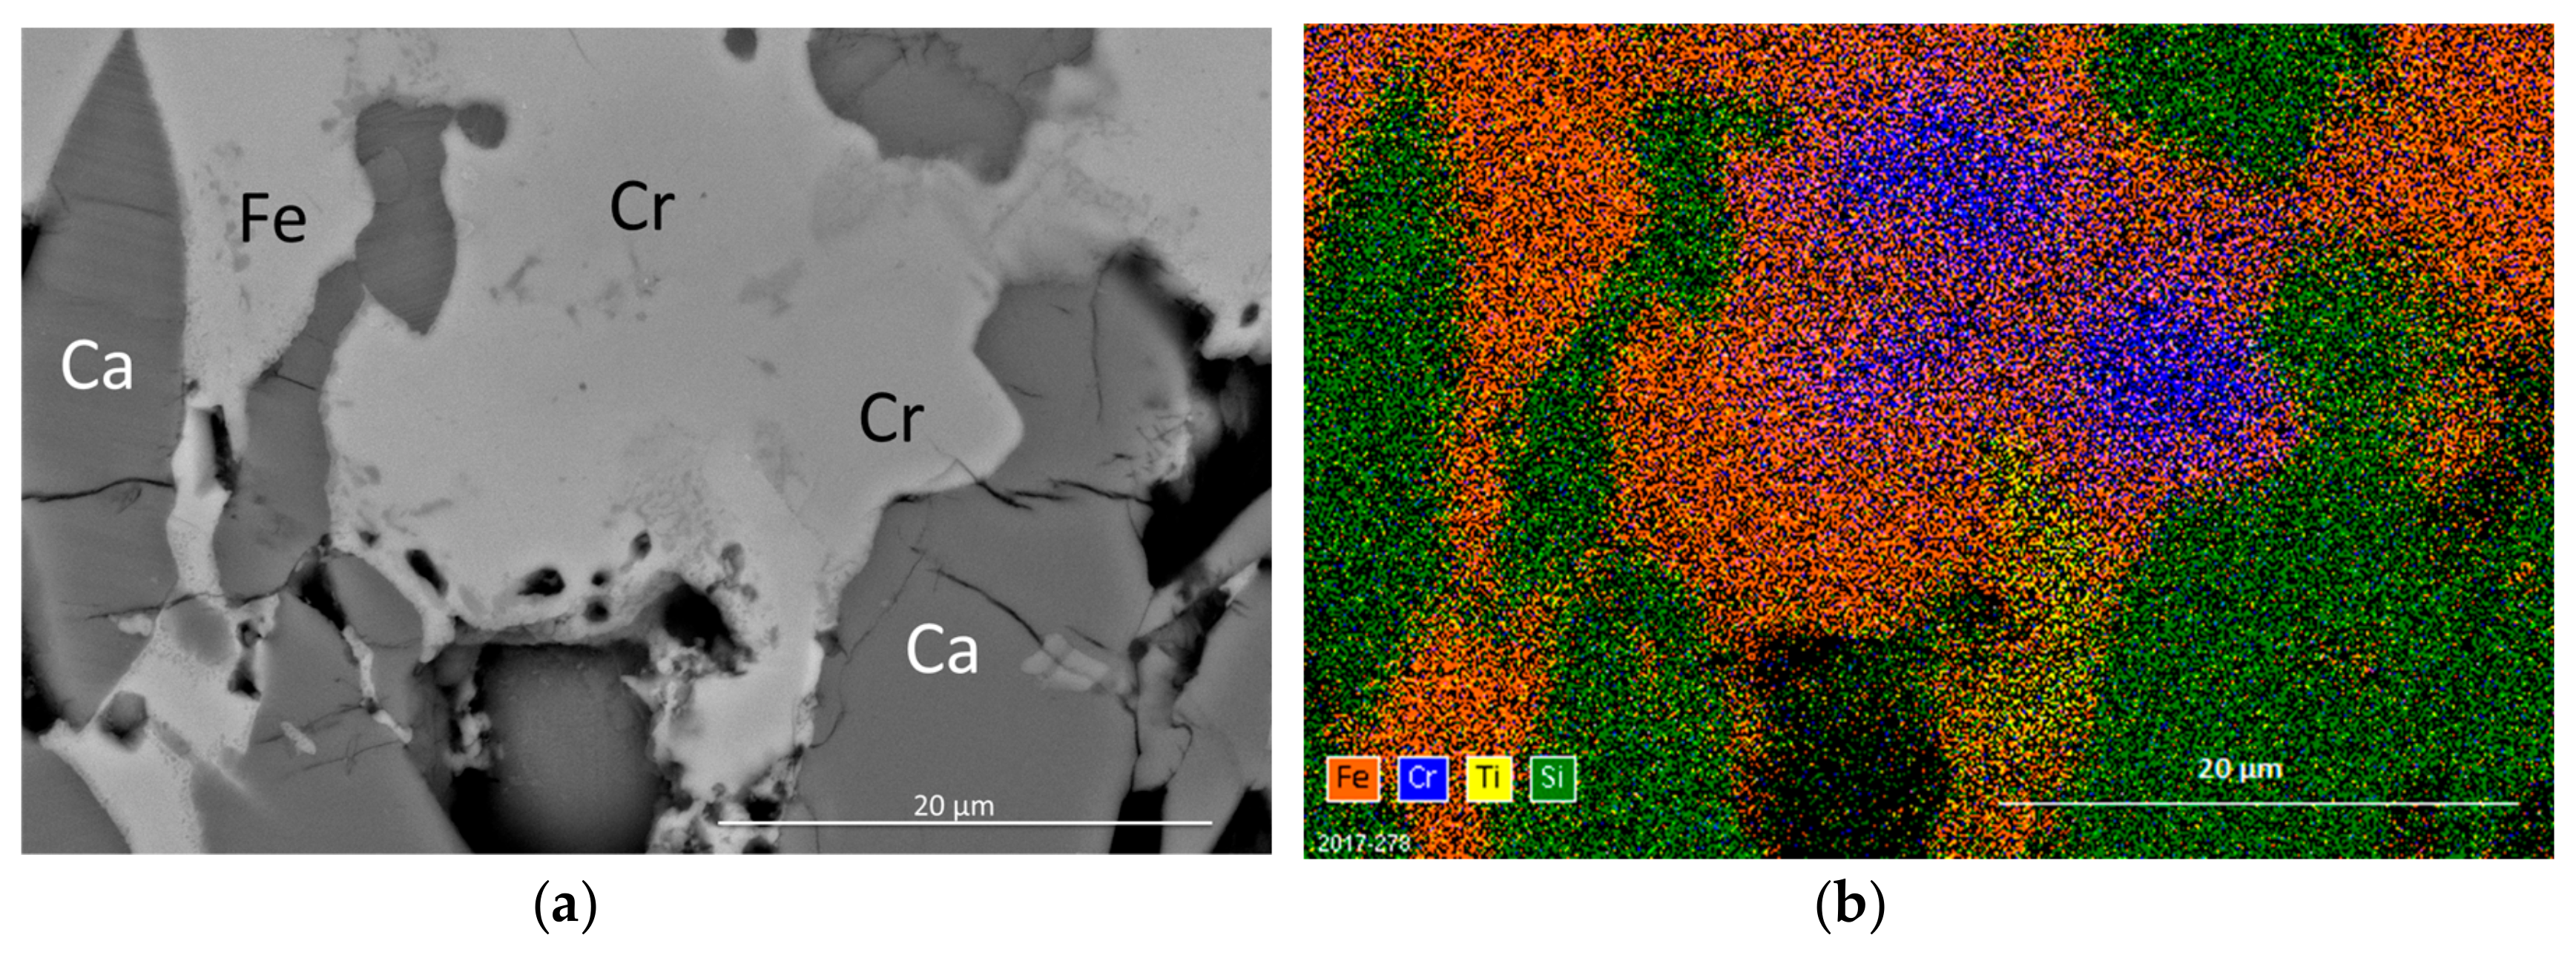
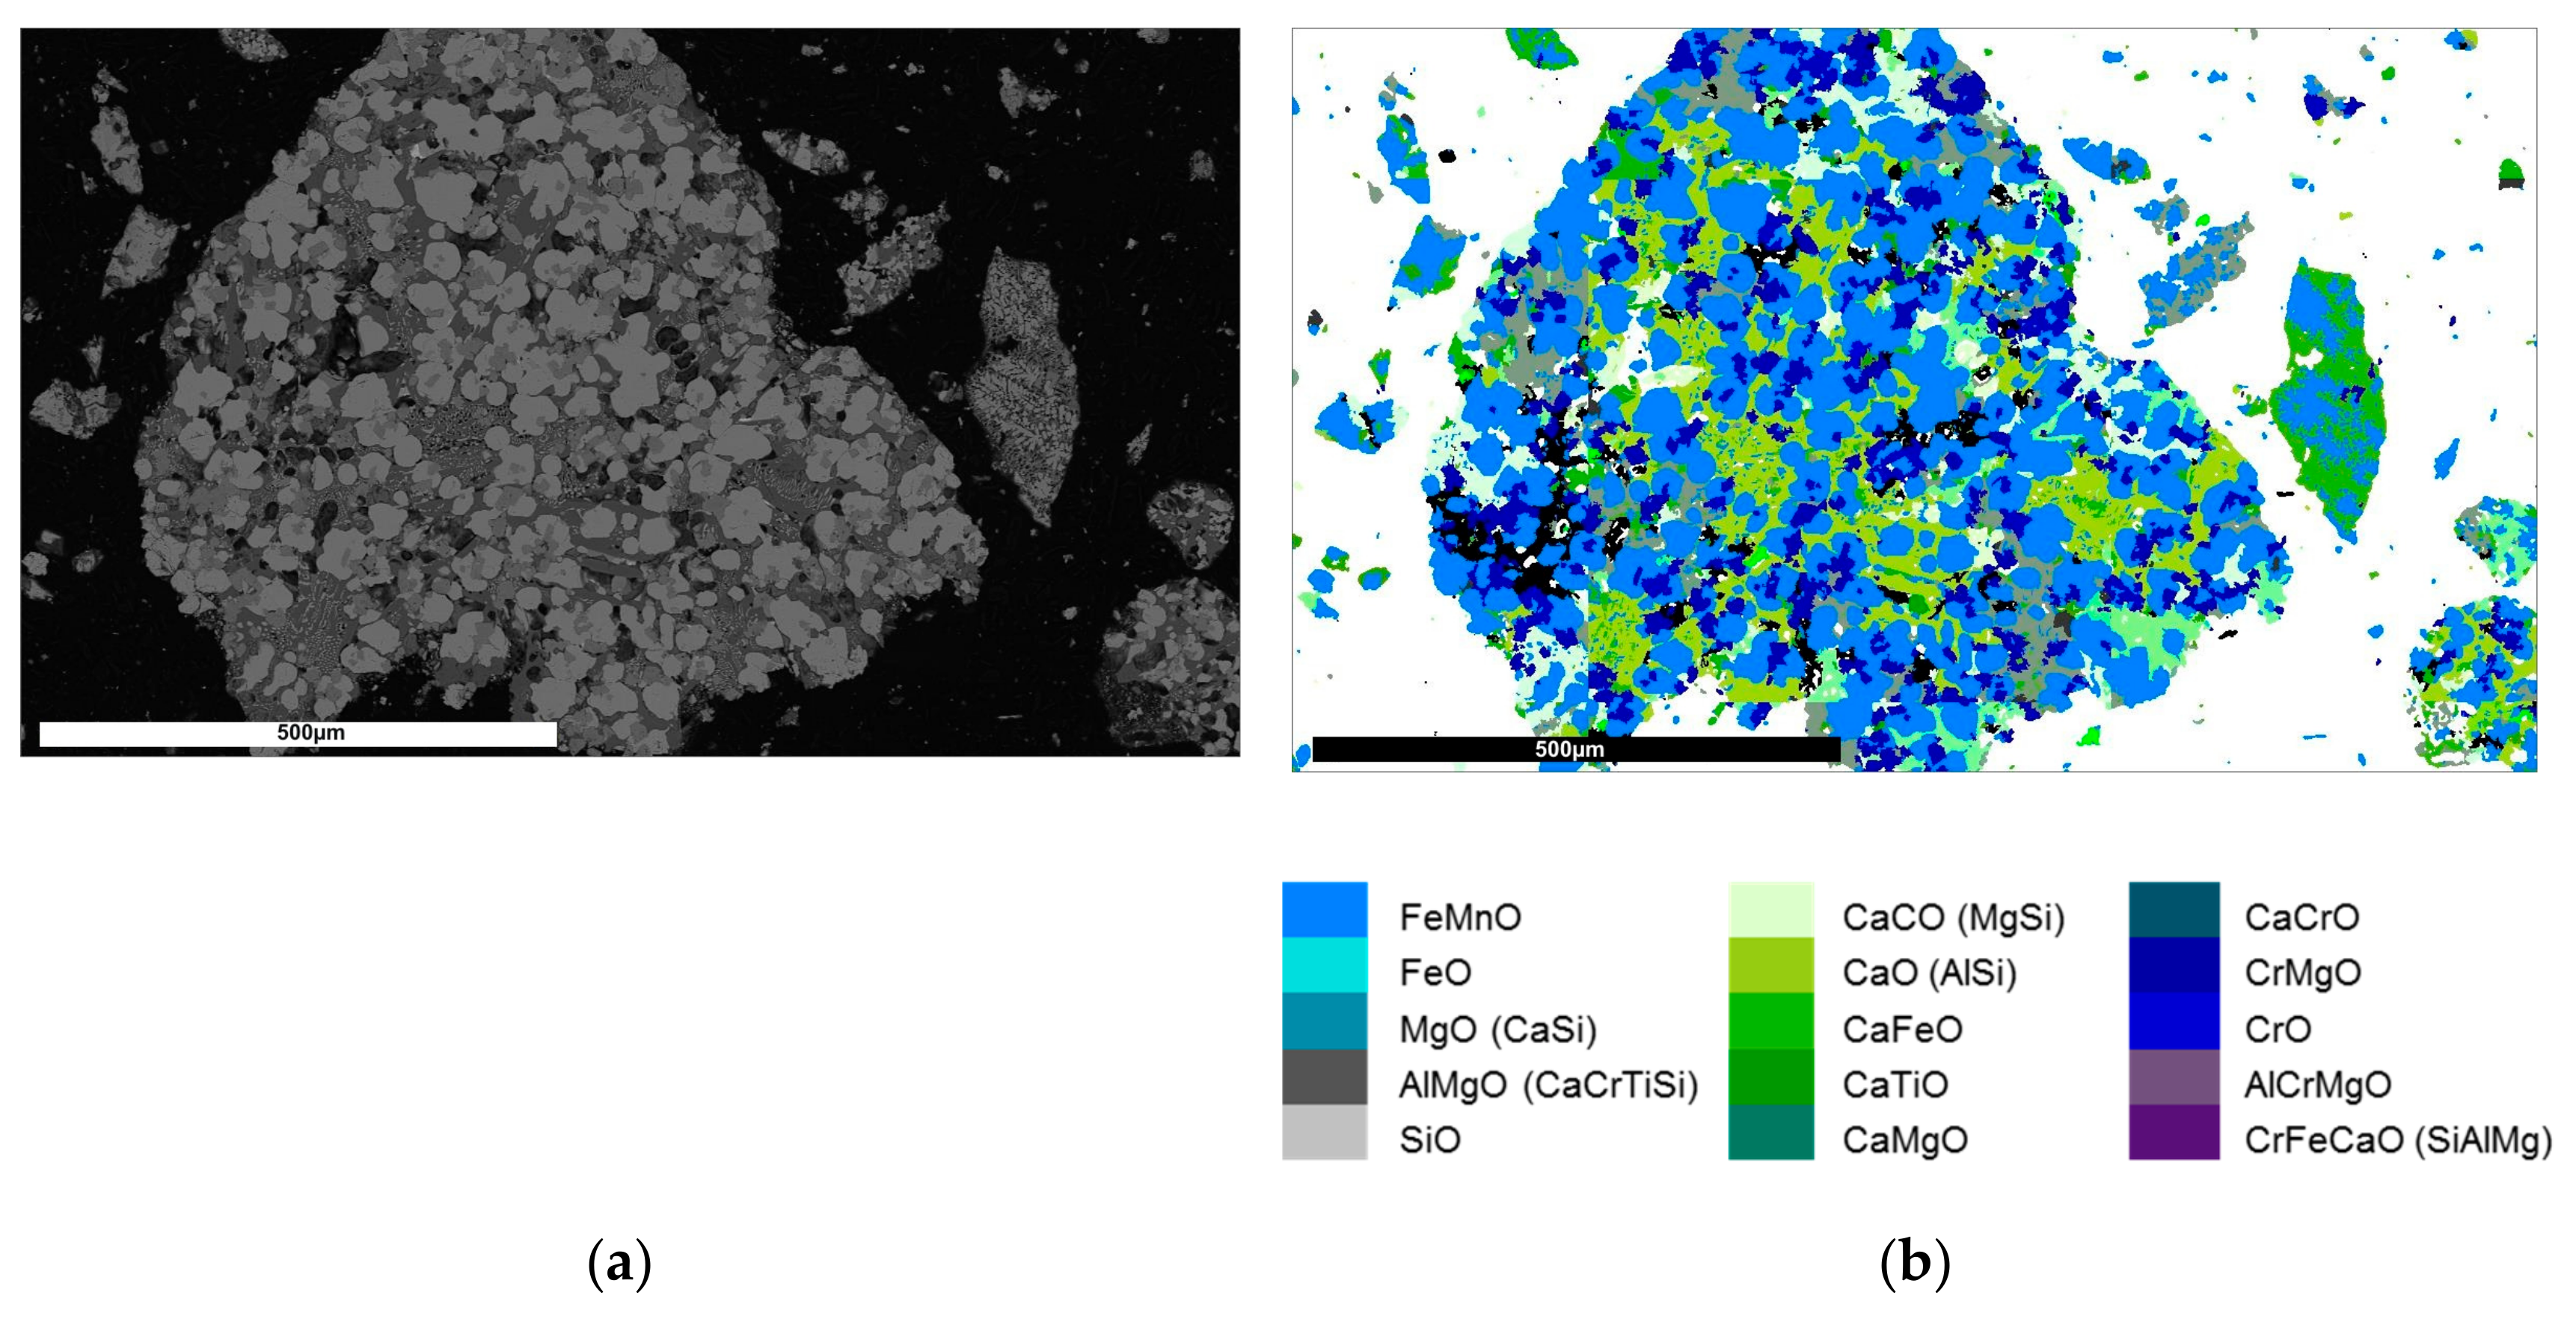
3.3. SEM and MLA
3.4. Chromium Quantification
4. Discussion
Author Contributions
Funding
Acknowledgments
Conflicts of Interest
References
- Fisher, L.V.; Barron, A.R. The recycling and reuse of steelmaking slags—A review. Resour. Conserv. Recycl. 2019, 146, 244–255. [Google Scholar] [CrossRef]
- Pan, S.-Y.; Adhikari, R.; Chen, Y.-H.; Li, P.; Chiang, P.-C. Integrated and innovative steel slag utilization for iron reclamation, green material production and CO2 fixation via accelerated carbonation. J. Clean. Prod. 2016, 137, 617–631. [Google Scholar] [CrossRef]
- Euroslag. Statistics. 2016. Available online: https://www.euroslag.com/wp-content/uploads/2019/01/Statistics-2016.pdf (accessed on 22 October 2019).
- Niemelä, P.; Kauppi, M. Production, characteristics and use of ferrochromium slags. In Proceedings of the Innovations in Ferry Alloy Industry INFACON XI, New Delhi, India, 18–21 February 2007; pp. 171–179. [Google Scholar]
- Sahu, N.; Biswas, A.; Kapure, G.U. A Short Review on Utilization of Ferrochromium Slag. Miner. Process. Extr. Metall. Rev. 2016, 37, 211–219. [Google Scholar] [CrossRef]
- ICDA. Statistical Bulletin; ICDA: Paris, France, 2019. [Google Scholar]
- Yi, H.; Xu, G.; Cheng, H.; Wang, J.; Wan, Y.; Chen, H. An Overview of Utilization of Steel Slag. Procedia Environ. Sci. 2012, 16, 791–801. [Google Scholar] [CrossRef] [Green Version]
- Holappa, L.; Xiao, Y. Slags in ferroalloys production—Review of present knowledge. J. S. Afr. Inst. Min. Metall. 2004, 104, 429–438. [Google Scholar]
- Kotás, J.; Stasicka, Z. Chromium occurrence in the environment and methods of its speciation. Environ. Pollut. 2000, 107, 263–283. [Google Scholar] [CrossRef]
- Shen, H.T.; Forssberg, E. An overview of recovery of metals from slags. Waste Manag. 2003, 23, 933–949. [Google Scholar] [CrossRef]
- Johnson, J.; Schewel, L.; Graedel, T.E. The contemporary anthropogenic chromium cycle. Environ. Sci. Technol. 2006, 40, 7060–7069. [Google Scholar] [CrossRef]
- Garcia-Ramos, E.; Romero-Serrano, A.; Zeifert, B.; Flores-Sanchez, P.; Hallen-Lopez, M.; Palacios, E.G. Immobilization of chromium in slags using MgO and Al2O3. Steel Res. Int. 2008, 79, 332–339. [Google Scholar] [CrossRef]
- Kuehn, M.; Mudersbach, D. Treatment of liquid EAF-slag from stainless steelmaking to produce environmental friendly construction materials. In Proceedings of the SCANMETII—2nd International Conference on Process Development in Iron and Steelmaking, Lulea, Sweden, 6–9 June 2004; pp. 369–377. [Google Scholar]
- Kim, E.; Spooren, J.; Broos, K.; Horckmans, L.; Quaghebeur, M.; Vrancken, K.C. Selective recovery of Cr from stainless steel slag by alkaline roasting followed by water leaching. Hydrometallurgy 2015, 158, 139–148. [Google Scholar] [CrossRef]
- Kim, E.; Spooren, J.; Broos, K.; Nielsen, P.; Horckmans, L.; Vrancken, K.C.; Quaghebeur, M. New method for selective Cr recovery from stainless steel slag by NaOCl assisted alkaline leaching and consecutive BaCrO4 precipitation. Chem. Eng. J. 2016, 295, 542–551. [Google Scholar] [CrossRef]
- Spooren, J.; Kim, E.; Horckmans, L.; Broos, K.; Nielsen, P.; Quaghebeur, M. In-situ chromium and vanadium recovery of landfilled ferrochromium and stainless steel slags. Chem. Eng. J. 2016, 303, 359–368. [Google Scholar] [CrossRef]
- Nicolae, M.; Vîlciu, I.; Zaman, F. X-ray diffraction analysis of steel slag and blast furnace slag viewing their use for road construction. UPB Sci. Bull. Ser. B 2007, 69, 99–108. [Google Scholar]
- Tsakiridis, P.; Papadimitriou, G.; Tsivilis, S.; Koroneos, C. Utilization of steel slag for Portland cement clinker production. J. Hazard. Mater. 2008, 152, 805–811. [Google Scholar] [CrossRef] [PubMed]
- Yildirim, I.Z.; Prezzi, M. Chemical, mineralogical, and morphological properties of steel slag. Adv. Civ. Eng. 2011, 2011, 463638. [Google Scholar] [CrossRef]
- Tossavainen, M.; Engstrom, F.; Yang, Q.; Menad, N.; Larsson, M.L.; Bjorkman, B. Characteristics of steel slag under different cooling conditions. Waste Manag. 2007, 27, 1335–1344. [Google Scholar] [CrossRef] [PubMed]
- Setién, J.; Hernández, D.; González, J. Characterization of ladle furnace basic slag for use as a construction material. Constr. Build. Mater. 2009, 23, 1788–1794. [Google Scholar] [CrossRef]
- Navarro, C.; Diíaz, M.; Villa-Garciía, M.A. Physico-chemical characterization of steel slag. Study of its behavior under simulated environmental conditions. Environ. Sci. Technol. 2010, 44, 5383–5388. [Google Scholar] [CrossRef]
- Chaurand, P.; Rose, J.; Domas, J.; Bottero, J.-Y. Speciation of Cr and V within BOF steel slag reused in road constructions. J. Geochem. Explor. 2006, 88, 10–14. [Google Scholar] [CrossRef]
- Waligora, J.; Bulteel, D.; Degrugilliers, P.; Damidot, D.; Potdevin, J.; Measson, M. Chemical and mineralogical characterizations of LD converter steel slags: A multi-analytical techniques approach. Mater. Charact. 2010, 61, 39–48. [Google Scholar] [CrossRef]
- Doebelin, N.; Kleeberg, R. Profex: A graphical user interface for the Rietveld refinement program BGMN. J. Appl. Crystallogr. 2015, 48, 1573–1580. [Google Scholar] [CrossRef] [PubMed]
- Heinig, T.; Bachmann, K.; Tolosana-Delgado, R.; Van Den Boogaart, G.; Gutzmer, J. Monitoring gravitational and particle shape settling effects on MLA sampling preparation. In Proceedings of the IAMG 2015-17th Annual Conference of the International Association for Mathematical Geosciences, Freiberg (Saxony), Germany, 5–13 September; 2015; pp. 200–206. [Google Scholar]
- SLACON. Control of Slag Quality for Utilisation in the Construction Industry; SLACON final report RFSR-CT-2012-00006; European Commission: Brussels, Belgium, 2015. [Google Scholar]
- Šulcek, Z.; Povondra, P.; Doležal, J.; Langmyhr, F.J. Decomposition procedures in inorganic analysis. CRC Crit. Rev. Anal. Chem. 1977, 6, 255–323. [Google Scholar] [CrossRef]
- Chao, T.T.; Sanzolone, R.F. Decomposition techniques. J. Geochem. Explor. 1992, 44, 65–106. [Google Scholar] [CrossRef]
- Rodgers, K.A. The decomposition and analysis of chrome spinel. A survey of some published techniques. Mineral. Mag. 1972, 38, 882–889. [Google Scholar] [CrossRef] [Green Version]


| Component | CS | LC FeCr | HC FeCr | SS |
|---|---|---|---|---|
| Al2O3 | 8.1 ± 0.3 | 7.2 ± 0.6 | 25.9 ± 0.3 | 4.2 ± 0.5 |
| CaO | 20.4 ± 1.9 | 43.0 ± 2.9 | 1.7 ± 0.0 | 45.1 ± 2.6 |
| Fe2O3 | 42.9 ± 5.2 | 0.4 ± 0.2 | 6.8 ± 1.9 | 0.8 ± 0.1 |
| MgO | 3.4 ± 1.3 | 14.0 ± 1.8 | 25.5 ± 5.0 | 10.9 ± 1.8 |
| MnO | 5.6 ± 0.5 | 0.10 ± 0.01 | 0.3 ± 0.1 | 1.1 ± 0.2 |
| SiO2 | 9.9 ± 0.2 | 30.3 ± 2.9 | 28.0 ± 1.5 | 30.8 ± 5.6 |
| Cr2O3 | 3.6 ± 0.5 | 4.6 ± 0.5 | 10.1 ± 1.9 | 3.3 ± 0.7 |
| Phase | CS | LC FeCr | HC FeCr | SS |
|---|---|---|---|---|
| Spinels (diff. compositions) | 26.7 ± 2.3 | 15.4 ± 0.6 | 43.3 ± 3.9 | 6.4 ± 0.4 |
| Quartz (SiO2) | 0.5 ± 0.2 | 0.3 ± 0.1 | 1.5 ± 0.6 | 0.5 ± 0.2 |
| Calcite (CaCO3) | 0.8 ± 0.2 | 1.8 ± 0.3 | - | 7.6 ± 0.6 |
| Wuestite (FeO) | 31.8 ± 0.4 | - | - | - |
| Hematite (Fe2O3) | 4.0 ± 0.9 | - | - | - |
| Periclase (MgO) | - | 2.7 ± 0.2 | - | 4.1 ± 0.6 |
| Dicalciumsilicate (“C2S”) | - | - | - | 13.9 ± 1.0 |
| Cuspidine (Ca4Si2O7F2) | - | - | - | 14.9 ± 0.7 |
| Larnite (Ca2SiO4) | 17.8 ± 0.5 | 6.3 ± 0.5 | - | 1.9 ± 0.4 |
| Wollastonite (CaSiO3) | - | - | - | 1.0 ± 0.3 |
| Enstatite (Mg2Si2O6) | - | - | 28.5 ± 1.1 | - |
| Forsterite (Mg2SiO4) | - | - | 16.7 ± 0.9 | - |
| Akermanite [Ca2(Al,Mg)(Al,Si)O7] | - | - | - | 9.8 ± 0.6 |
| Gehlenite [Ca2Al(AlSiO7)] | 14.8 ± 0.4 | 3.4 ± 0.4 | - | - |
| Brownmillerite Ca2(Al,Fe)2O5 | 3.8 ± 0.2 | - | - | - |
| Merwinite [Ca3Mg(SiO4)2] | - | 47.5 ± 0.6 | - | 24.0 ± 0.8 |
| Bredigite [Ca14Mg2(SiO4)8] | - | 22.7 ± 0.6 | - | 16.0 ± 0.9 |
| Material | Aqua Regia | HCl/HNO3/HBF4 | HNO3/HF/H2O2/H3BO3 | Na Peroxide |
|---|---|---|---|---|
| CS | 0.50 ± 0.02 | 0.99 ± 0.09 | 2.33 ± 0.20 | 2.59 ± 0.06 |
| LC FeCr | 0.34 ± 0.02 | 1.08 ± 0.11 | 1.10 ± 0.18 | 3.21 ± 0.07 |
| HC FeCr | 4.00 ± 0.91 | 5.72 ± 0.05 | 11.2 ± 0.69 | 16.60 ± 0.28 |
| SS | 0.23 ± 0.001 | 0.52 ± 0.13 | 0.86 ± 0.4 | 2.54 ± 0.05 |
| SARM 77 | n.a. | 3.43 ± 0.54 | n.a. | 7.78 ± 0.27 |
| Property | Wet Chemistry | XRD | SEM-EDX | MLA |
|---|---|---|---|---|
| Cr containing phase identification | not possible | possible (with restriction of overlapping peaks) | only chemical information | only chemical information |
| Cr quantification | accurate Cr determination from the solution, but insoluble residues | strongly depending on correct phase identification, backcalculated “assay” | Cr content for single grains well definable | in general possible, but gradually changing Cr contents make accurate quantification very hard, challenging for slags |
| spatial distribution | bulk method | bulk method | spatially resolved, zonation becomes visible | bulk method, basing on spatially resolved data |
| grain information | not possible | not possible | information available for a limited number | grain size distribution for different classes |
© 2019 by the authors. Licensee MDPI, Basel, Switzerland. This article is an open access article distributed under the terms and conditions of the Creative Commons Attribution (CC BY) license (http://creativecommons.org/licenses/by/4.0/).
Share and Cite
Horckmans, L.; Möckel, R.; Nielsen, P.; Kukurugya, F.; Vanhoof, C.; Morillon, A.; Algermissen, D. Multi-Analytical Characterization of Slags to Determine the Chromium Concentration for a Possible Re-Extraction. Minerals 2019, 9, 646. https://doi.org/10.3390/min9100646
Horckmans L, Möckel R, Nielsen P, Kukurugya F, Vanhoof C, Morillon A, Algermissen D. Multi-Analytical Characterization of Slags to Determine the Chromium Concentration for a Possible Re-Extraction. Minerals. 2019; 9(10):646. https://doi.org/10.3390/min9100646
Chicago/Turabian StyleHorckmans, Liesbeth, Robert Möckel, Peter Nielsen, Frantisek Kukurugya, Christine Vanhoof, Agnieszka Morillon, and David Algermissen. 2019. "Multi-Analytical Characterization of Slags to Determine the Chromium Concentration for a Possible Re-Extraction" Minerals 9, no. 10: 646. https://doi.org/10.3390/min9100646