Article

A Paris-Edinburgh Cell for High-Pressure and High-Temperature Structure Studies on Silicate Liquids Using Monochromatic Synchrotron Radiation

1
Center for Advanced Radiation Sources, The University of Chicago, Chicago, IL 60637, USA
2
Geophysical Laboratory, Carnegie Institution of Washington, Argonne, IL 60439, USA
3
HPCAT, X-ray Science Division, Argonne National Laboratory, Argonne, IL 60439, USA
4
Physics and Astronomy Department, Union College, Schenectady, NY 12308, USA
*
Author to whom correspondence should be addressed.
Currently at the Institute of Geology and Mineralogy, University of Cologne, Albertus-Magnus-Platz, 50674 Cologne, Germany.
Currently at the State Key Laboratory of Geological Processes and Mineral Resources, China University of Geosciences-Wuhan, Wuhan 430074, China.
§
Currently at the Applied Physics Department, Soreq Nuclear Research Center (NRC), Yavne 81800, Israel.
Currently at the Geodynamics Research Center, Ehime University, Matsuyama 790-8577, Japan.
Minerals 2019, 9(11), 715; https://doi.org/10.3390/min9110715
Submission received: 16 October 2019 / Revised: 13 November 2019 / Accepted: 14 November 2019 / Published: 19 November 2019
(This article belongs to the Special Issue Mineral Physics—In Memory of Orson Anderson)

Abstract

:
A Paris-Edinburgh press combined with a multi-channel collimator assembly has been commissioned at the GeoSoilEnviro Center for Advanced Radiation Sources (GSECARS) beamline for monochromatic X-ray scattering, with an emphasis on studying low-Z liquids, especially silicate liquids at high pressure. The Paris-Edinburgh press is mounted on a general-purpose diffractometer, with a pixel array detector mounted on the detector arm. The incident monochromatic undulator beam with energies up to 60 keV is focused both horizontally and vertically to a beam size about 30 × 30 µm. With this setup, background scattering from the surrounding pressure media is completely removed at 2θ angles above 10° for samples larger than 1.05 mm in diameter. Thirty minutes is typically sufficient to collect robust X-ray scattering signals from a 1.6 mm diameter amorphous silicate sample. Cell assemblies for the standard Paris-Edinburgh anvils have been developed and pressures and temperatures up to 7 GPa and 2300 K, respectively, have been maintained steadily over hours. We have also developed a cupped-toroidal Drickamer anvil to further increase pressure and temperature capabilities. The cupped-toroidal Drickamer anvil combines features of a modified Drickamer anvil and the traditional Paris-Edinburgh anvil. Pressures up to 12 GPa have been generated at temperatures up to 2100 K.

1. Introduction

Studying atomic-scale structures of silicate liquids can help us improve our understanding of the properties of magmas under pressure. Such properties play fundamental roles in the evolution of the Earth and other terrestrial planets. Crystalline silicates require very high temperatures to melt, and the melting points increase significantly with pressure. As a result, studying silicate liquids under high pressure is faced with tremendous technical challenges [1]. Most earlier studies have mainly focused on the structure of silicate glasses in order to gain information of their liquid counterparts. This is based on the general conception that a glass represents a frozen state of a liquid. Many silicate compositions have been reported in spectroscopy studies (see, e.g., review by [2]). However, structures of glasses are shown to depend on their thermal history [3,4]. Many properties of glasses, e.g., density and elastic moduli, also depend on their pressure and temperature history [5,6,7]. Such differences, as pointed out by Jing and Karato [8], are mainly due to the dominant roles played by entropy in the liquid state. In contrast, the entropic contribution to the Gibbs energy of glasses is negligible. A recent ambient-pressure angle-dispersive X-ray diffraction (ADXD) study on silicate glasses and melts of identical compositions suggests significant differences in their structures [9]. Therefore, developing a method for direct silicate liquid structure measurement under extreme pressure and temperature conditions becomes particularly important.
Funamori et al. [1] reported liquid structures of MgSiO3 and CaSiO3 up to 6 GPa in a cubic-anvil apparatus (DIA [10]) using a multi-angle energy-dispersive X-ray diffraction (MA-EDXD) technique developed by Tsuji et al. [11]. Yamada et al. [12] adapted the MA-EDXD technique to the Paris-Edinburgh press. These developments have enabled liquid silicate structural studies to ~7 GPa. The MA-EDXD technique has the ability to tightly collimate incident X-ray beam, thereby reducing background noise effectively. However, a complete X-ray scattering dataset at a given pressure and temperature condition typically requires several hours to collect, because X-ray scattering signals from liquids are extremely weak. An alternative to MA-EDXD is ADXD. In order to remove background scattering, Mezouar et al. [13] developed a multi-channel collimator system for the Paris-Edinburgh press for liquid structure studies. With the combination of a Paris-Edinburgh press with a multi-channel collimator, the liquid structure and density of iron-rich alloys have been studied up to 17 GPa and 1200 K [14].
For silicate liquids, which have much lower X-ray scattering power than metals and melts at generally much higher temperatures, measuring their structures is challenging. In this paper, we report our recent development at the GeoSoilEnviro Center for Advanced Radiation Sources (GSECARS) beamline 13-ID-C, using a combination of a Paris-Edinburgh press with a multi-channel collimator and an advanced photon-counting area detector for collection of angle-dispersive X-ray scattering data on amorphous materials, especially silicate liquids under high pressure and temperature conditions. The multi-channel collimator, i.e., Soller slits, consists of two arrays of fine slits made of tungsten carbide blades. The slits are aligned so that they rotate about the sample center. By oscillating the slits during data collection, background scattering from the material surrounding the sample can be effectively removed. The excellent spatial selectivity provides an exciting opportunity for glass and liquid structure studies in the Paris-Edinburgh press. Compared with the energy-dispersive X-ray diffraction (EDXD) method, commonly used to minimize unwanted X-ray scattering signal from surrounding pressure media in large-volume multi-anvil experiments, our multi-channel collimator combined with ADXD measurements are performed at fixed energy and undulator gap, eliminating the need for energy dependent absorption and the undulator spectrum corrections to the data as well as allowing us to take full advantage of the brilliance of the Advanced Photon Source synchrotron light source. Our optimized setup results in typical data collection times of 5 to 30 min for a single ADXD pattern, which is 2 to 3 orders of magnitude faster than the EDXD method. The elimination of energy dependent data corrections, the effective use of the brilliance of the source, and the dramatically reduced collection times allow users to collect rich data sets while pushing the sample cell to extreme pressures and temperatures.

2. Experimental Setup

Figure 1a shows the current layout of the GSECARS beamlines at the Advanced Photon Source, Argonne National Laboratory (Argonne, Lemont, IL, USA). The X-rays for the 13-ID-C/D branch are produced by a 3.0-cm-period undulator that delivers high brilliance and energy X-rays to the beamline X-ray optics and experiments performed in either the ID-C or ID-D hutches downstream. Monochromatic X-rays are produced with a cryogenically cooled double crystal silicon monochromator using either a Si(111) or Si(311) crystal set with a maximum energy of 42 keV and 60 keV respectively. These high energies are ideal for large volume high pressure experiments, since the sample is often surrounded by various high X-ray absorbing layers of ceramic cell parts. The beam is focused to 30 µm × 30 µm full width at half maximum (FWHM) using a pair of dynamically bent one-meter-long platinum-coated silicon mirrors in Kirkpatrick-Baez (KB) geometry. A 40 µm diameter clean-up pinhole is located approximately 70 mm upstream of the sample cell assembly. A nitrogen-filled ion chamber mounted immediately upstream of the pinhole is used to monitor the incident X-ray beam intensity and is later used to normalize the intensity of each collected pattern. The experimental setup is shown in the sketch in Figure 1b.

2.1. The Paris-Edinburgh Press

The large-volume Paris-Edinburgh press was originally designed for high pressure neutron scattering experiments due to the large sample volume required to perform meaningful measurements in a reasonable amount of time [15,16]. The VX5 (MG63) Paris-Edinburgh press in our setup with a wide-opening angle of 140° in the horizontal plane for the X-ray scattering signal to exit the sample allows us to easily collect structure data up to 20 A−1 in momentum transfer (Q; Q = 4 π s i n θ λ ; where λ is the wavelength and 2θ is the X-ray scattering angle) at incident X-ray energy of 42 keV. This is beneficial for the ADXD setup. Figure 2 shows the experimental setup in the ID-C hutch from two different viewing angles. The 180-ton VX5 Paris-Edinburgh press, which is mounted on a general-purpose diffractometer [17], has a base of 175 mm in diameter and a height of 212 mm, weighing about 30 kg. The compact form of this “large volume press” makes the apparatus easy to install and manipulate on the diffractometer where space is often limited. XYZ translation stages that allow the press to move along and perpendicular to the beam direction are mounted under the Paris-Edinburgh press. A heavy-duty Huber vertical stage (Series 5103) brings the sample to the beam center. The compression system of the Paris-Edinburgh press is a double-stage setup. The first-stage ENERPAC (Model P142, Menomonee Falls, WI, USA) hydraulic hand pump applies initial compression up to around 30 MPa, while the second-stage syringe pump (High Pressure Equipment Company; Model #37-6-30) is responsible for reaching higher pressure (maximum oil pressure ~190 MPa). By pumping hydraulic oil into the bottom ram, the main cylinder located at the lower part of the Paris-Edinburgh press advances towards the breech that is screwed into the top of the press frame, and we bring the two opposed tungsten carbide anvils towards each other along the uniaxial load direction to generate pressure. The sample pressure inside the cell assembly depends on the size, material, and geometry of the cell assembly. The sample center is determined before each data collection by scanning the Paris-Edinburgh cell in Y (vertical; perpendicular to the beam), X (horizontal; perpendicular to the beam), and Z (horizontal; along the beam) directions to locate the maximum X-ray scattering signal position from the sample.
Temperature is raised by the conventional resistive heating method. The DC power supply (Hewlett Packard 6671A) provides up to 8 V/200 A, which can bring the cell temperature up to 2100 K routinely. This is sufficient to melt many materials within the accessible pressure range of the Paris-Edinburgh press. Type C (W-5%Re vs. W-26%Re) thermocouples were used to establish heater power-temperature relationships at various loads for both the 3 mm standard and the 2 mm cupped-toroidal Drickamer Paris-Edinburgh cell assemblies. For these off-line temperature calibration runs, the thermocouple was placed at the center of the sample capsule. Such calibrations were conducted at various press loads, to establish a two-dimensional temperature-power grid [18], which was used to estimate temperatures in X-ray scattering experiments without thermocouples. According to the multiple heater power to temperature calibration curves acquired, the error in the estimated temperature is about 20 K at 373 K and about 90 K at 1800 K. The heater power is controlled by a proportional-integral-derivative controller programmed into our operation software. Because of its transparency to the X-ray beam and its good electrical stability under high pressures and temperatures, the most common heater material that we use is high purity graphite for the 3 mm standard cell assembly. A titanium diboride (TiB2) heater is selected for higher pressure applications, as graphite will transform to diamond at pressures above 10 GPa. TiB2 is a low density (4.52 g/cm3) hard material with high compressive strength, which is helpful to keep the sample cell mechanically stable under extreme pressure and temperature conditions. The only drawback for using TiB2 is the non-linearity of its resistance during heating at high pressure. There is a resistance turnover after reaching the peak value, which is probably due to a phase transition in TiB2, as the resistance after the turnover follows a smooth curve [19]. To prevent the tungsten carbide anvils from catastrophically failing under high temperature conditions, both the top and bottom anvils are cooled by a constant flow of cold water (~283 K) through copper blocks (heat sinks) that hold the anvils.

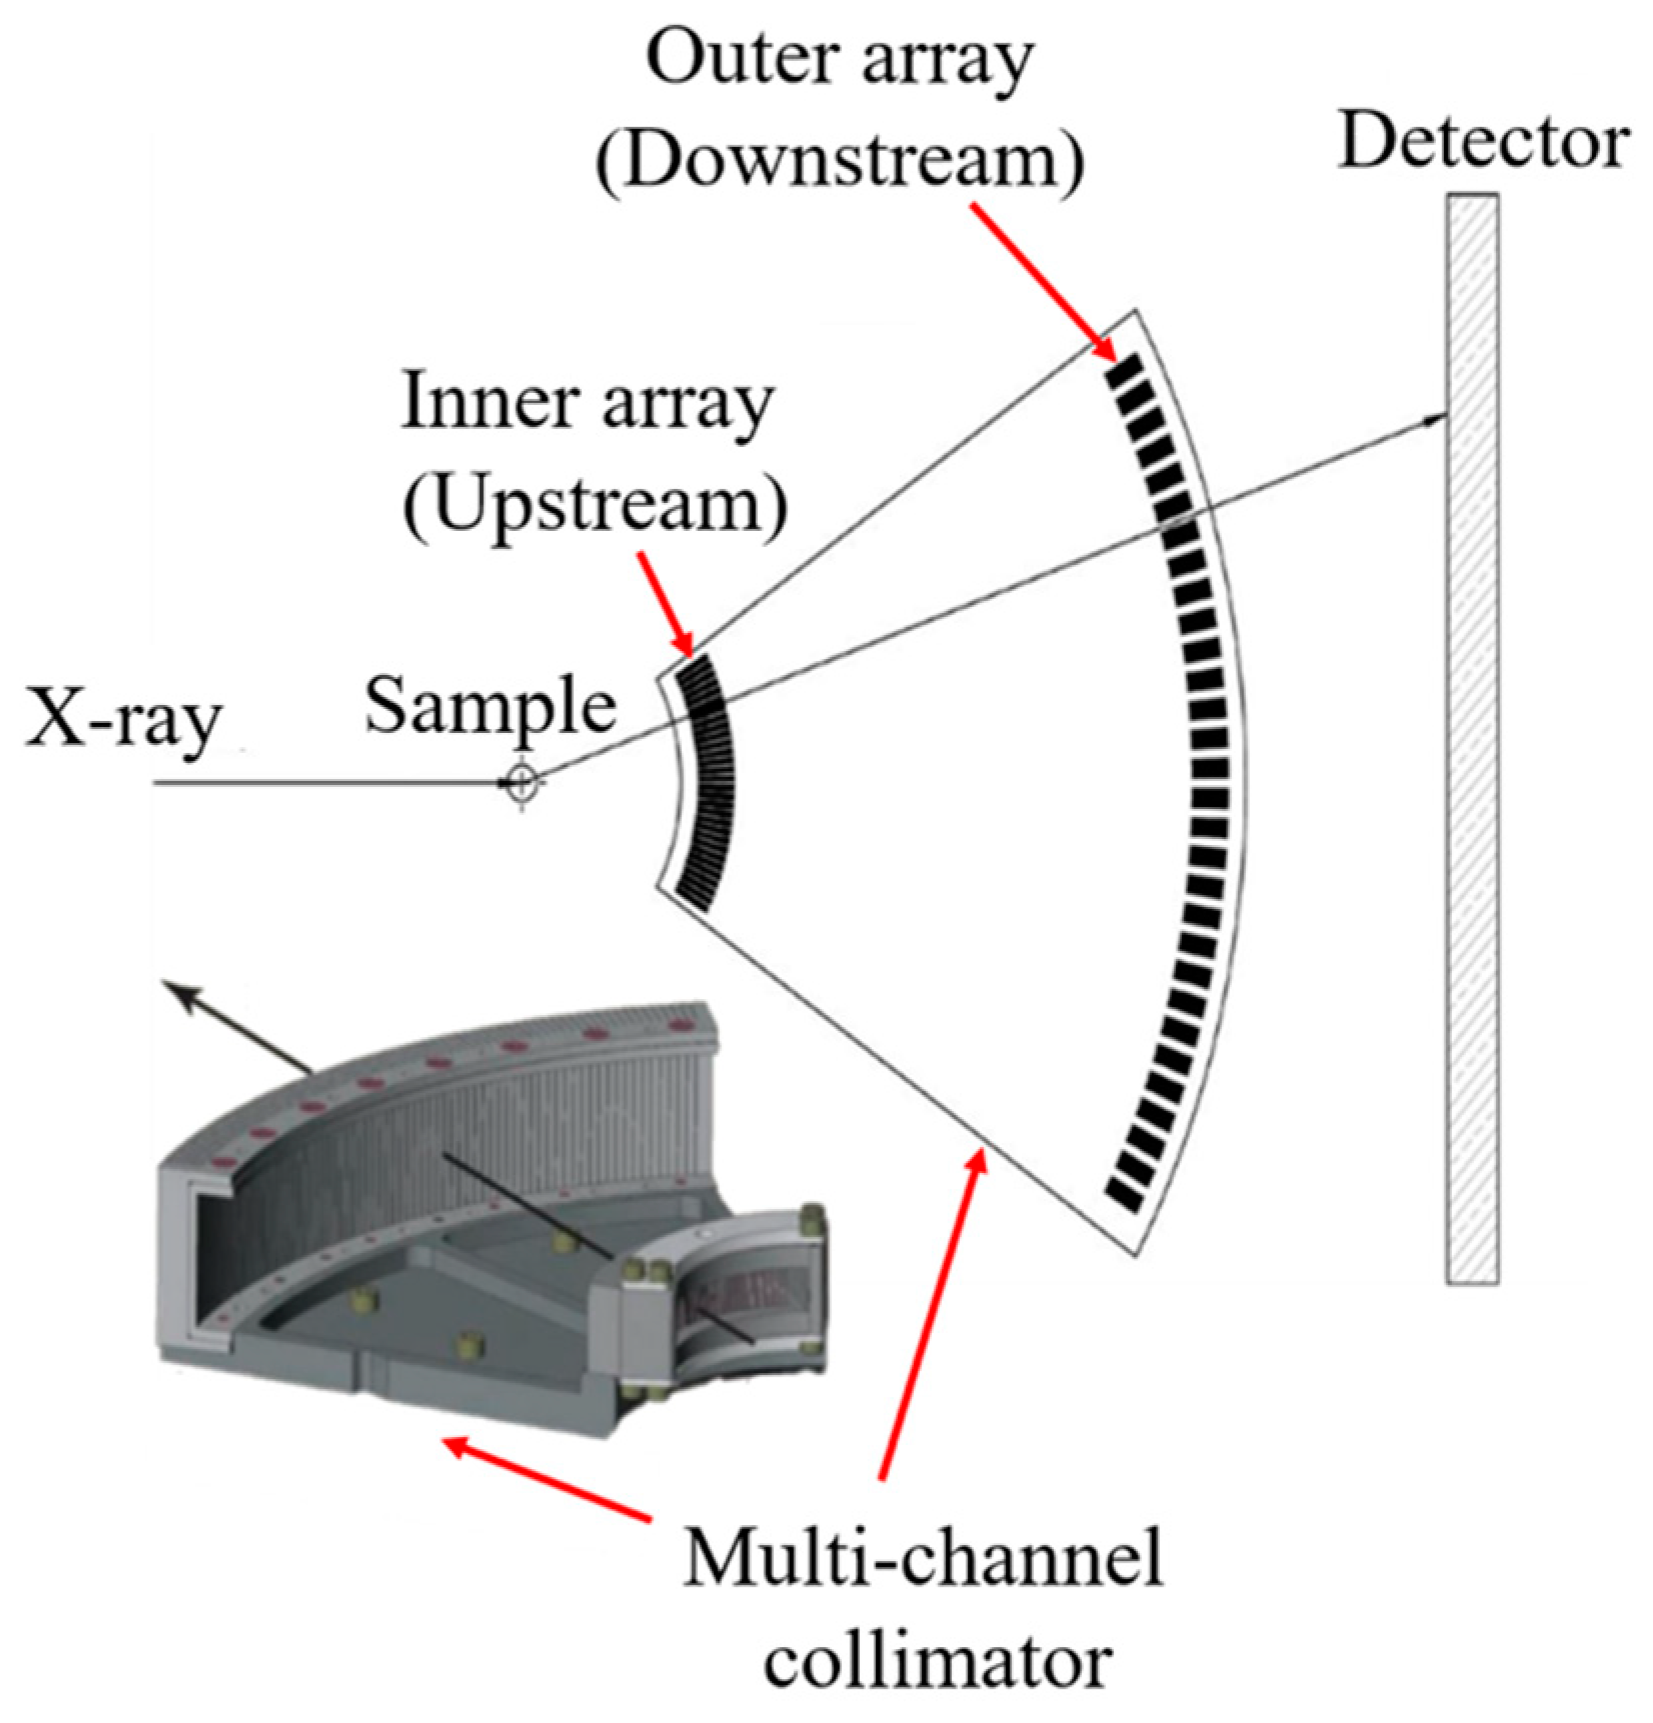
2.2. The Multi-Channel Collimator

The multi-channel collimator, a.k.a. Soller slits (custom made by Usinage and Nouvelles Technologies), consists of two arrays of fine slits that are made of tungsten carbide blades (Figure 3). The slits are arranged in two concentric circular arcs. Both arrays consist of 75 slits precisely separated by 0.8° and are located 50 and 200 mm, respectively, from the rotation center. The slit width of the inner array is 0.05 mm and the outer array has a slit width of 0.20 mm [13], therefore covering up to 60° in total angle. During data collection, the combination of a rotation stage and a pair of translation stages (one perpendicular to the beam direction and the other one along the beam direction) that move in the horizontal plane controls the multi-channel collimator oscillation. By oscillating the slits during data collection, background scattering from the material surrounding the sample gets blocked by the tungsten carbide blades and can be effectively removed. Only the sample signal within the diffraction volume defined by the two arrays of slits passes through the slits and reaches the detector. Our analysis shows that with an incident beam collimated at 0.05 mm, a molten sample with a diameter larger than 1.05 mm can be used to collect structural data without being interfered by crystalline peaks from the surrounding pressure media at 2-theta angles greater than 10° (Figure 4). This is a critical component for data collection of weak scattering materials, for example, non-crystalline borates or silicates that are of interest to Earth science related topics. Similar multi-channel collimator assemblies have also been used extensively with the Paris-Edinburgh press at the European Synchrotron Radiation Facility for studying metallic liquids and low-Z materials [13].
The oscillation of the multi-channel collimator, required to produce a continuous X-ray scattering pattern, involves two translation stages and one rotation stage to create a circular path with respect to the multi-channel collimator center. Correction parameters for the rotation are determined visually under a microscope lens. The oscillation motion during data collection is controlled using an in-house Python program. Once the detector is triggered for a data collection, in a fixed time of 15 s, the slits will rotate in one direction by an angle of 3.2° during data collection. This angle is a multiple of 0.8° to mitigate imperfections in the slits and slit spacings. After finishing the first scan, the slits will spend another 15 s moving in the opposite direction by the same 3.2° and return to their original starting position. One oscillation period takes 30 s to complete and it is the minimum data collection time required for a single X-ray scattering pattern in our setup.

2.3. The Detector

The Dectris Pilatus3 X CdTe 300K-W is a hybrid photon counting detector [20]. It is free of both dark current and readout noise, therefore, providing an excellent signal-to-noise ratio (the total intensity of an integrated pattern is less than 1 count for a 5 min dark field exposure). As a result, the visibility of weak signals is greatly improved. This is a great advantage for data collection from amorphous materials, which can have a very weak X-ray scattering signal especially at higher Q. The active area of the detector is 254 mm horizontal by 33.5 mm vertical with a square pixel size of 172 µm (1475 × 195 pixels array size). This active area is tiled horizontally by six large 1 mm thick CdTe crystals (sensors) each with dimensions of 42 mm × 34 mm with a 3-pixel (0.52 mm) gap between crystals and the point-spread function (PSF) of 1 pixel FWHM. These 1 mm sensors have a quantum efficiency greater than 80% between 40 and 75 keV and therefore are well matched to the energy used in our measurements. The combined low PSF, high efficiency and large dynamic range (~1e6/sec/pixel) allows closely spaced signals with huge intensity differences to be accurately resolved and measured. The detector has a fast (ns) electronic gate eliminating the need for a slow mechanical shutter and a readout time of less than 1 ms. The detector is water cooled by a closed loop chiller and requires a low flow of dry N2 to keep it moisture free. The detector weighs about 7 kg and is mounted on the large detector arm of the general-purpose diffractometer in ID-C with two rotation degrees of freedom allowing the active area of the detector to cover a large scattering angle range.

3. Sample Environment and Preparation

3.1. The Paris-Edinburgh Cell Assembly

Figure 5 shows the two main Paris-Edinburgh cell assemblies that have been developed at the beamline and have been used routinely since our operation began. The “standard” 3 mm Paris-Edinburgh cell assembly (Figure 5a) has been requested the most by users since it can accommodate the largest sample in volume (1.6 mm in diameter; 1.6 mm in height). The cell assembly consists of a boron epoxy ring with an inner MgO ring (pressure marker [21]). A graphite cylindrical heater is used to heat the sample. This cell assembly has been rigorously tested and proven to perform stably up to 7 GPa and 2300 K. The large sample size provides sufficient amount of sample material for good quality X-ray scattering signal. With the large sample volume, one can easily perform additional in-situ measurements of physical properties including density measurement using the absorption method, sound velocity measurement with the ultrasonic interferometry, and viscosity measurement using the falling sphere method, etc. The greatest advantage of our standard Paris-Edinburgh cell assembly is the capability of keeping liquid samples stable in the sample chamber under extreme pressure and temperature conditions, which makes studies of liquid possible.
To increase pressure and temperature range, we have developed and tested a cupped-toroidal Drickamer anvil [18] and a cell assembly for higher pressure experiments. The anvil design, with a central depression, a toroidal groove and a small tapered angle, combines features of a modified Drickamer anvil and the traditional Paris-Edinburgh anvil. By optimizing the parameters for the cupped-toroidal Drickamer anvil design, pressures corresponding to the mantle transition zone can be generated. The 2 mm cupped-toroidal Drickamer cell assembly with thermally insulating materials has been developed (Figure 5b). The cupped-toroidal Drickamer cells can reach >12 GPa in pressure and up to 2100 K in temperature. However, at temperatures above 2100 K, the anvil gap often closes to a point where X-ray scattering signal from the sample is restricted. We are currently working on modifying the cupped-toroidal Drickamer cell design to overcome this gap closing issue.

3.2. Sample Preparation

Sodium-silicate glass samples (Na2Si2O5, Na2SiO3, etc.) used in the preliminary experiments were prepared by grinding and thoroughly mixing high purity (>99.99%) Na2CO3 (Alfa Aesar #10861) and SiO2 (Alfa Aesar #88777) powders in an aluminum oxide mortar. The oxide mixtures were placed into a furnace and melted in a platinum crucible at temperatures 200 K above each composition’s melting point. Glass samples were formed by removing the crucible from the furnace at high temperature and immediately submerging the crucible in room temperature water without contacting the samples. Quenched glasses were crushed, ground into fine powder and re-melted. This process was repeated 3 times to create a homogeneous glass form. The final glass samples were colorless and transparent. The glass samples were examined using both the Raman spectroscopy and X-ray scattering to ensure that they were crystal-free. The glass samples were then machined into cylinders with proper dimensions that fit the sample capsule.

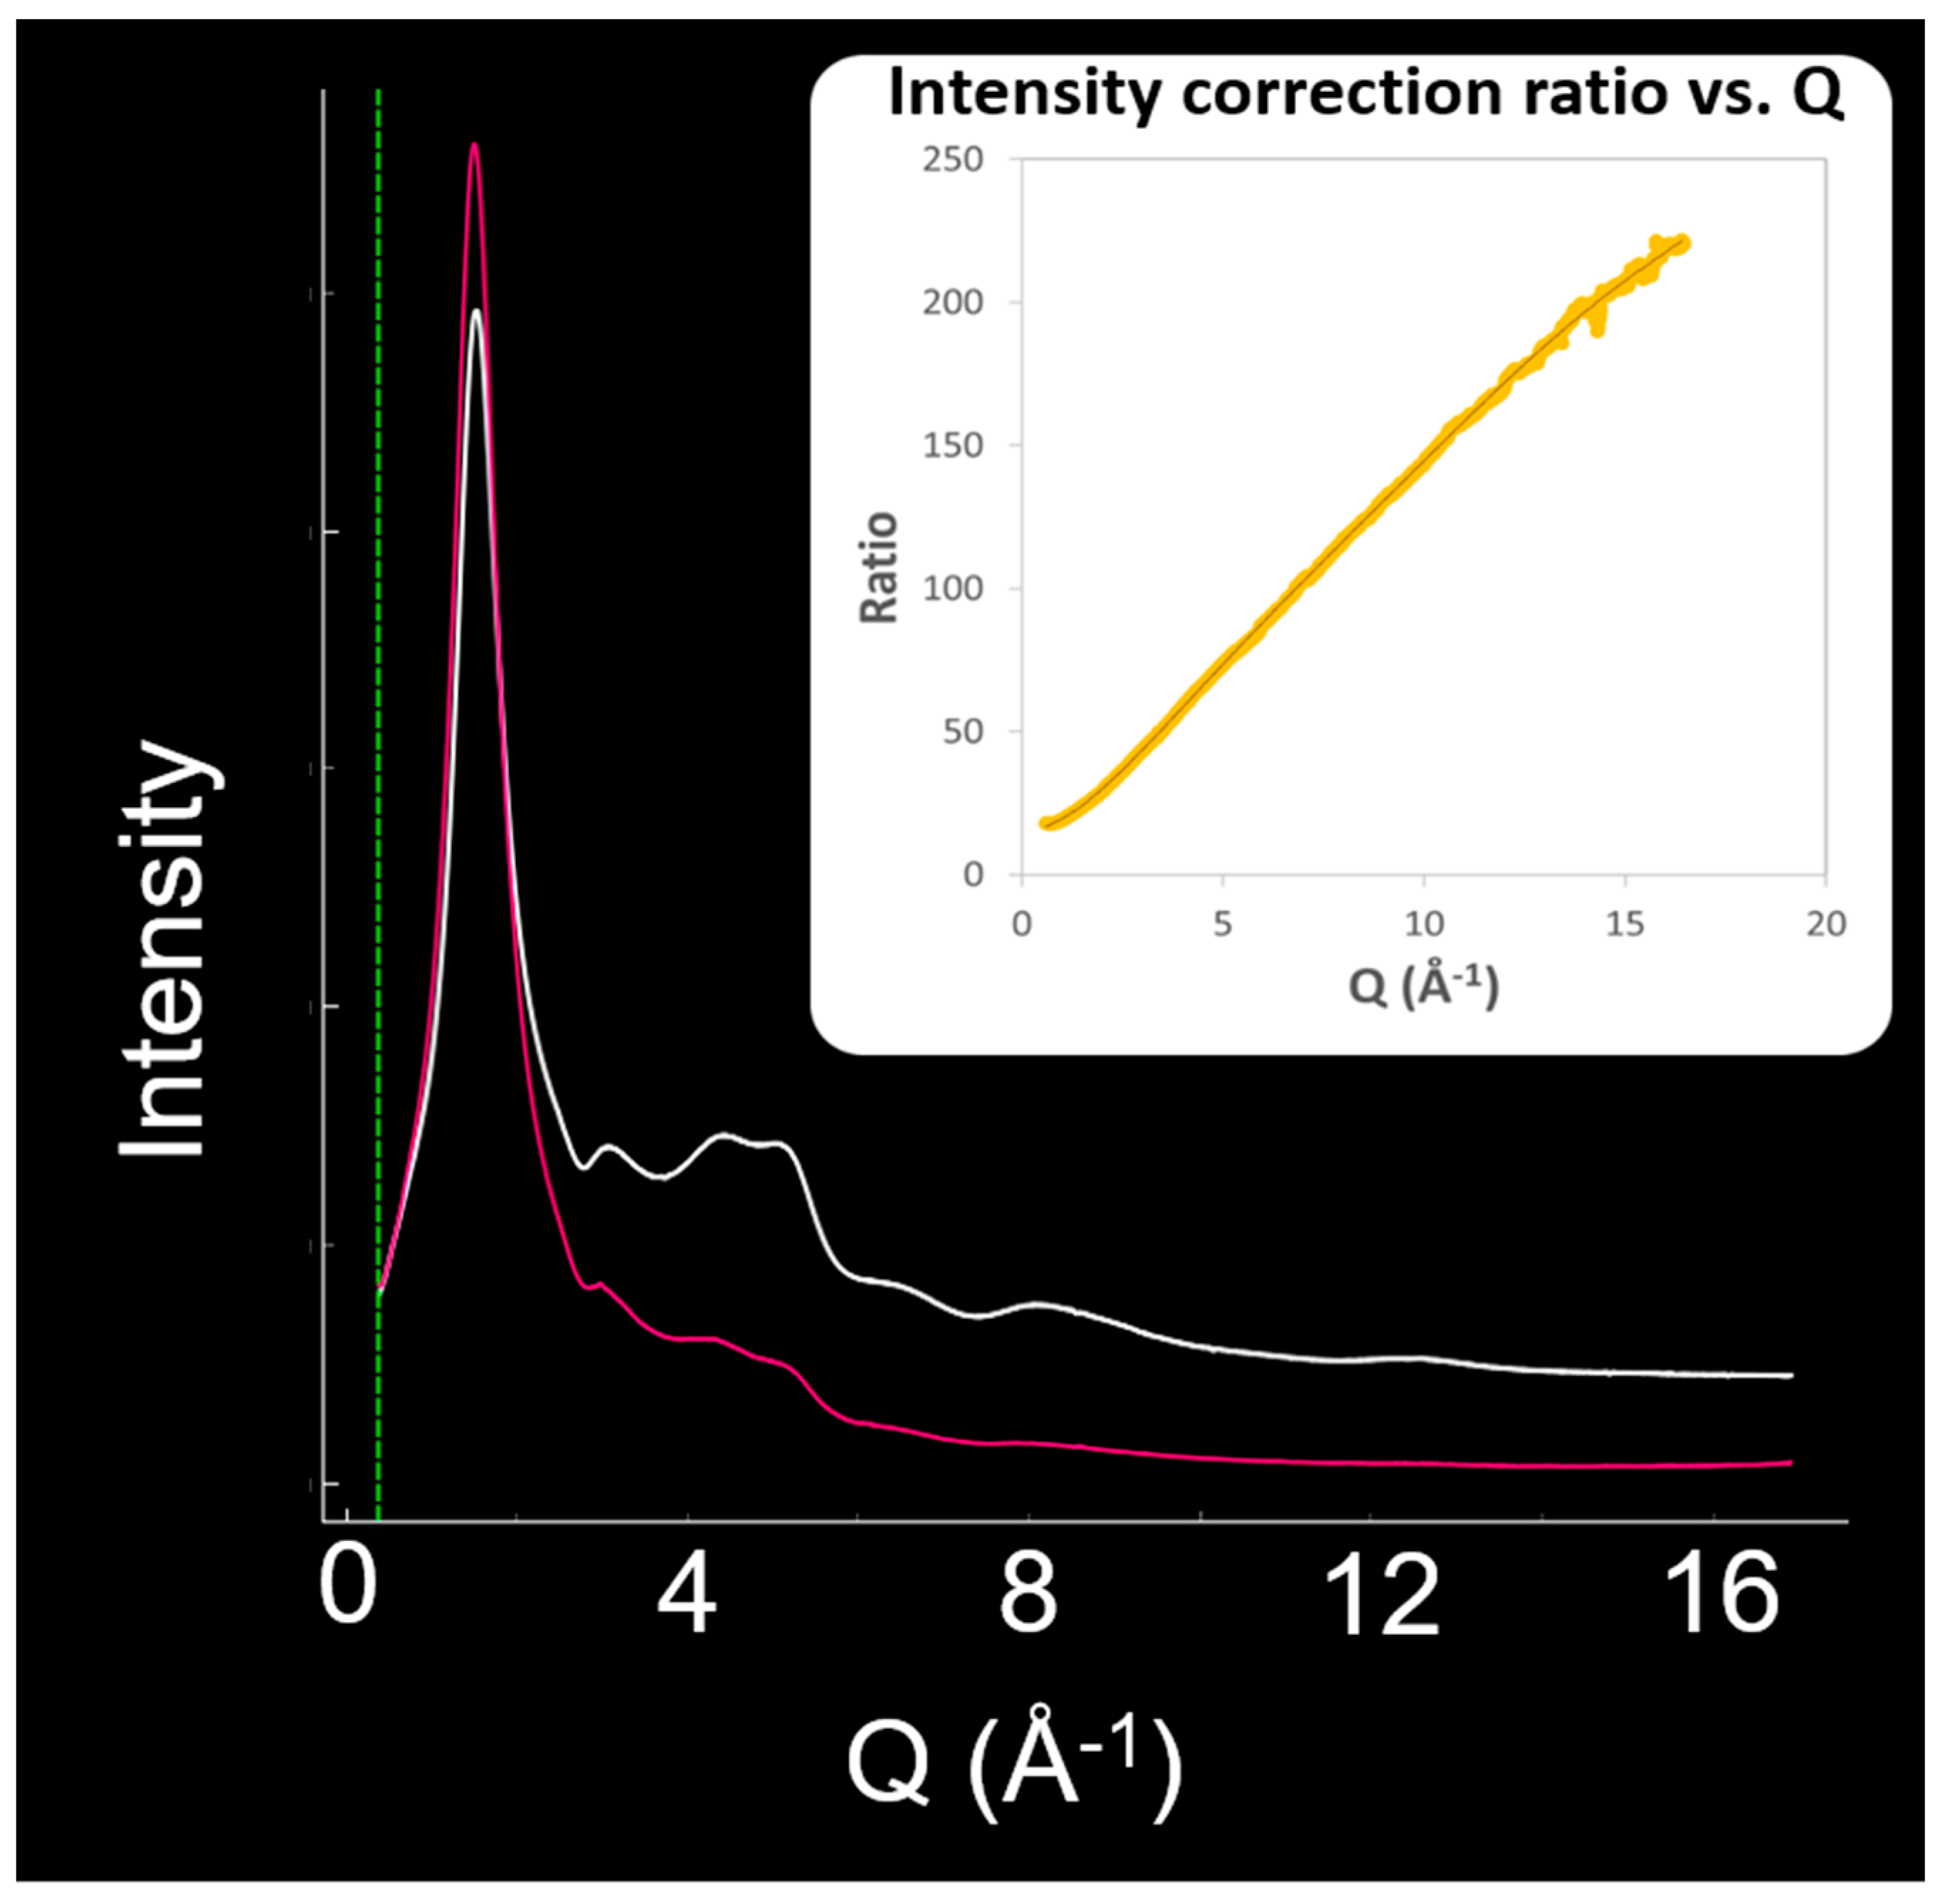
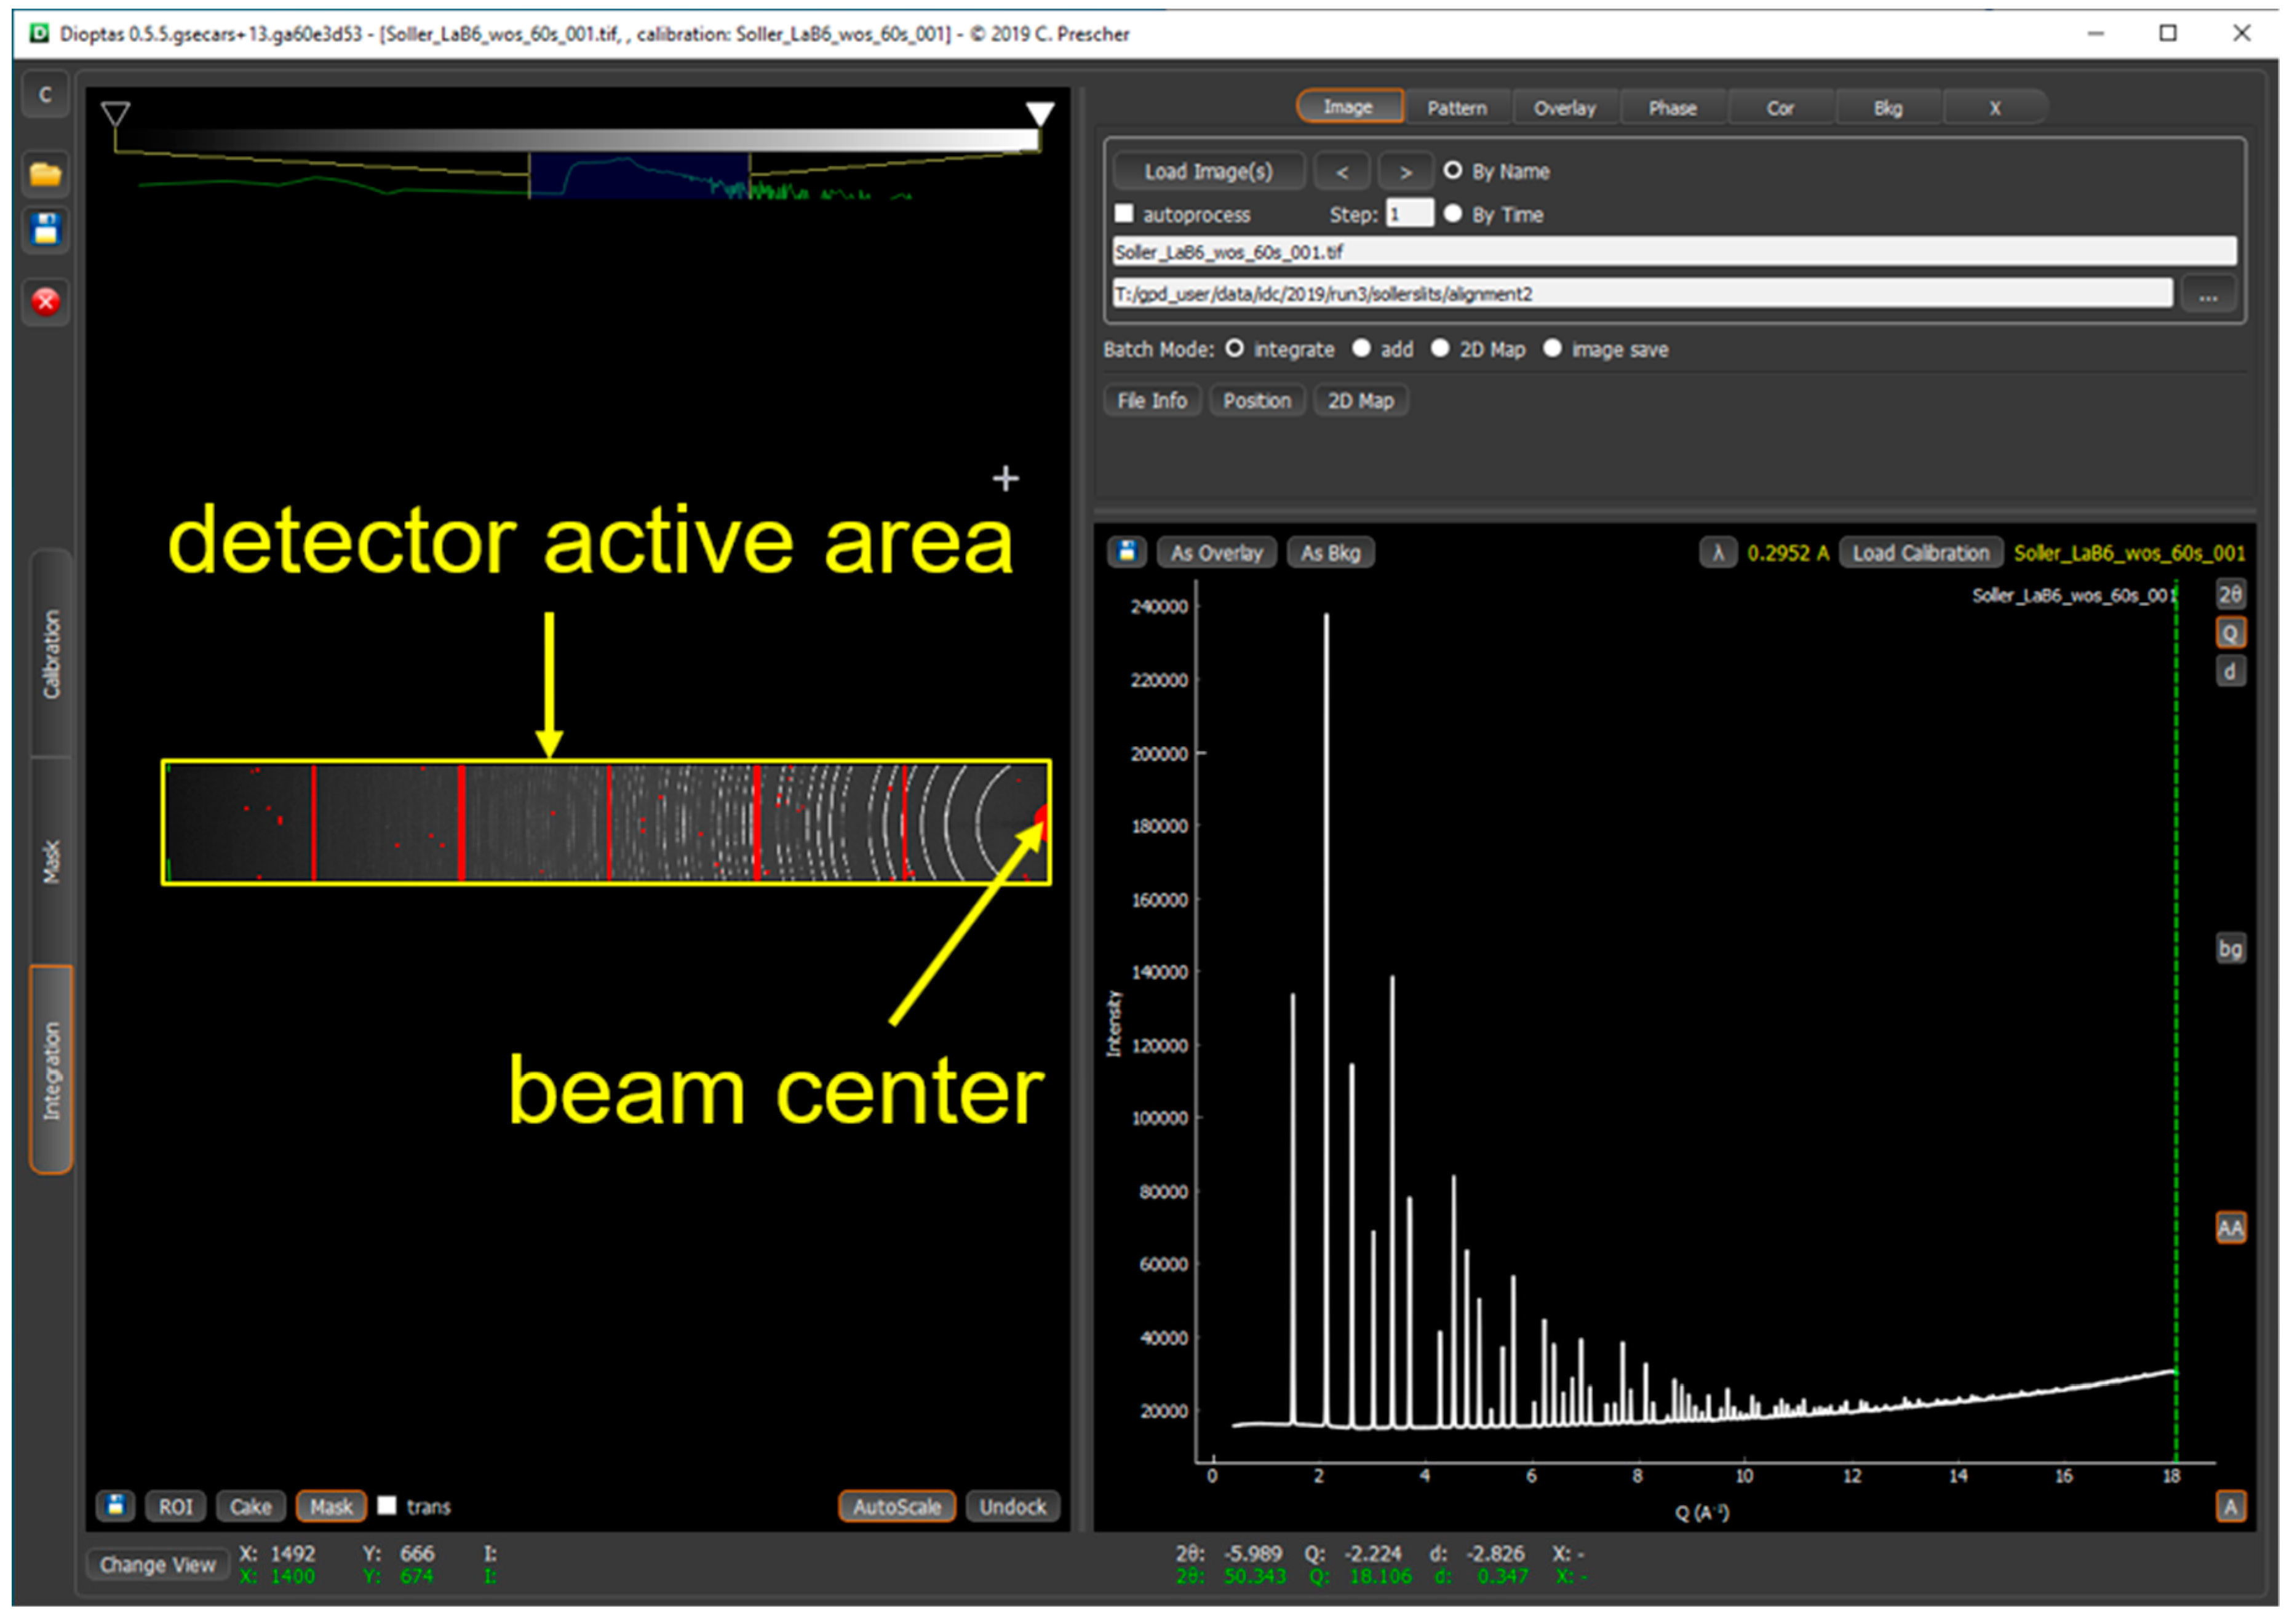
4. Data Collection and Analysis

The collected X-ray scattering data is saved as a 32-bit 2D TIFF image (1475 × 195 pixels) with a size of 1126 kilobytes. The raw image is processed (detector calibration, image integration, etc.) using the software package Dioptas [22]. Limited by the active area of the Dectris Pilatus3 X CdTe 300K-W detector, which is a 254 mm × 33.5 mm rectangular, only fractions of the full scattering rings are recorded. In addition, in order to utilize the entire area of the detector to collect scattering signals at high Q, the detector is setup so that the beam center (direct beam) is positioned at the edge of the detector (Figure 6). One advantage of processing our X-ray scattering patterns using Dioptas is that we can still run the detector calibration with only capturing a fraction of the diffracted powder rings (Figure 6), and the program also works for special setups where the beam center is not present in the X-ray scattering pattern.
To properly analyze X-ray scattering data of amorphous material, various background corrections become critical in order to extract the real X-ray scattering signal. The critical factors that should be considered include: (1) subtracting the background from the surrounding high pressure cell assembly; (2) eliminating multiple scatter of photons inside the experimental station (this may arise from optics components, the press, and other equipment), (3) eliminating collimation effects of the multi-channel collimator. We have developed and upgraded several major hardware in order to routinely collect these correction intensity profiles efficiently. One important improvement worth mentioning is the installation of a manually operated horizontal translation stage for the multi-channel collimator unit to move out of the beam path and to precisely return to its previous position for data collection without having to re-align it. By collecting data of a non-crystalline standard (e.g., a Pyrex glass rod) with and without the multi-channel collimator, one can determine the transfer function and apply the correction to the dataset.
A Pyrex glass rod with a diameter identical to the sample diameter is used to establish an X-ray scattering intensity correction for the sample. First, we collect data of the Pyrex glass rod in air with no surrounding cell material, no multi-channel collimator. This is our reference pattern for intensities. The next step is to collect data of the same Pyrex glass rod with the multi-channel collimator in place. We then calculate the transfer function of the multi-channel collimator. The transfer function is essentially the ratio of intensities of the reference pattern to the one with the multi-channel collimator. This is used later to rescale the intensities of XRD measurements under high pressure and temperature. Other patterns that are necessary for the intensity correction are collected subsequently, including the detector dark field, the multiple scattering signal inside the hutch, and the Paris-Edinburgh sample cell background. The latter is based on measurement of an empty (dummy) cell.
The transfer function (Figure 7) provides a correction ratio for the intensity of the sample pattern at each Q value to correct for the intensity differences generated by the air scattering inside the hutch, dark field of the detector, and the multi-channel collimator. Only with a properly derived transfer function can the background be successfully removed from the sample pattern. Since the scattered signal intensity from the sample/cell assembly is sensitive to the beam position, alignment of the pinhole, and the alignment of the multi-channel collimator, etc., each setup for a beamtime period requires its own transfer function for proper intensity correction. Furthermore, for different sample diameters, the geometric correction from the sample will be different.
The structure factors S(Q) and the pair distribution functions g(r) are calculated from the X-ray scattering patterns using the software package Glassure [23]. Detailed description of the pair distribution function can be found in [24,25]. The Python-based GUI program performs background subtraction, atomic form factor corrections, Fourier transform and optimization of the experimental data (Figure 8). The number density in atoms per cubic Å is used in the calculation. To minimize truncation error ripples in the pair distribution function, the optional Lorch function [26] was applied during the Fourier transforming process. An optimization process following [27] has also been applied to the final g(r).
Here we show results from two different samples: a sodium silicate liquid sample and a sodium disilicate glass sample. Figure 8 shows sodium silicate liquid X-ray scattering data collected at 3 ± 0.1 GPa and 1673 ± 90 K for 10 min. The experiment started with a sodium silicate glass sample with a diameter of 1.6 mm. Using a 42 keV monochromatic X-ray beam, we were able to collect X-ray scattering data of the liquid up to ~17 Å−1 in Q. However, the X-ray scattering signal becomes weak above Q = 12 Å−1. For better statistics, especially in high Q ranges, a longer data collection time is suggested.
We collected sodium disilicate (NS2) glass X-ray scattering patterns at ambient condition and compared the bond length results (Figure 9) with previous structure studies of sodium disilicate glass from neutron scattering [28] and molecular dynamics simulations [29,30] (Table 1). Bond lengths of Si–O, Na–O, O–O, and Si–Si were determined by fitting the assigned four peaks of the g(r) with Gaussian functions using the software Origin. Our measured bond lengths are consistent with previously reported values.

5. Conclusions

A Paris-Edinburgh press combined with a multi-channel collimator has been successfully commissioned at GSECARS at the Advanced Photon Source for monochromatic X-ray scattering studies on non-crystalline materials. The current Paris-Edinburgh press setup has the capability of reaching pressures and temperatures up to 12 GPa and 2100 K using the newly designed cupped-toroidal Drickamer cell assembly. With doubly focusing KB mirrors, monochromatic X-ray scattering has been conducted up to 60 keV with a beam size below 40 µm. The single-photon counting detector Pilatus3 X CdTe has low noise and yields reliable data. Sodium silicate and borosilicate glasses and melts, as well as Fe2O3 and FeCaSi2O6 liquids have been studied using this new setup. Atomic bond-lengths determined for sodium disilicate glass agree well with values from previous studies, demonstrating that our setup provides reliable structure data. The facility is open to the general mineral physics community for structure and physical property studies on non-crystalline materials at high pressures and high temperatures.

Author Contributions

Conceptualization, Y.W., T.Y.; methodology, Y.W., T.Y., V.P., C.P.; software, C.P. and E.G.; validation, T.Y.; formal analysis, T.Y.; investigation, T.Y.; resources, Y.J.R., F.S., H.W., P.E., J.S., Y.K., G.S.; data curation, T.Y.; writing—original draft preparation, T.Y.; writing—review and editing, all authors; project administration, M.L.R., S.R.S., Y.W.

Funding

This work is supported by the National Science Foundation-Earth Sciences (EAR-1620548). These experiments were performed at GSECARS (Sector 13), Advanced Photon Source (APS), Argonne National Laboratory. The APS is a U.S. Department of Energy (DOE) Office of Science User Facility operated for the DOE Office of Science by Argonne National Laboratory under Contract No. DE-AC02-06CH11357. The Paris-Edinburgh system was developed at GSECARS and HPCAT (Sector 16), APS, Argonne National Laboratory. GSECARS is supported by the National Science Foundation-Earth Sciences (EAR-1634415) and Department of Energy-Geosciences (DE-FG02-94ER14466). HPCAT operations are supported by DOE-NNSA’s Office of Experimental Sciences.

Acknowledgments

We are grateful to Mohamed Mezouar for his valuable input and assistance in the design, manufacturing and installation of the multi-channel collimator. We thank Curtis Kenney-Benson, Mike Proskey, Pasquale DiDonna, and Guy Macha for their wonderful help and excellent technical support during the commissioning process.

Conflicts of Interest

The authors declare no conflicts of interest.

References

  1. Funamori, N.; Yamamoto, S.; Yagi, T.; Kikegawa, T. Exploratory studies of silicate melt structure at high pressures and temperatures by in situ X-ray diffraction. J. Geophys. Res. 2004, 109, B03203. [Google Scholar] [CrossRef]
  2. McMillan, P. Structural studies of silicate glasses and melts—Applications and limitations of Raman spectroscopy. Am. Mineral. 1984, 69, 622–644. [Google Scholar]
  3. Stebbins, J.F.; Ellsworth, S.E. Temperature effects on structure and dynamics in borate and borosilicate liquids: High-resolution and high-temperature NMR results. J. Am. Ceram. Soc. 1996, 79, 2247–2256. [Google Scholar] [CrossRef]
  4. Angeli, F.; Villian, O.; Schuller, S.; Charpentier, T.; de Ligny, D.; Bressel, L.; Wondraczek, L. Effect of temperature and thermal history on borosilicate glass structure. Phys. Rev. B 2012, 85, 054110. [Google Scholar] [CrossRef]
  5. Susman, S.; Volin, K.J.; Price, D.L.; Grimsditch, M.; Rino, J.P.; Kalia, R.K.; Vashishta, P.; Gwanmesia, G.; Wang, Y.; Liebermann, R.C. Intermediate-range order in permanently densified vitreous SiO2: A neuton-diffraction and molecular-dynamics study. Phys. Rev. B 1991, 43, 1194–1197. [Google Scholar] [CrossRef]
  6. Zha, C.S.; Mao, H.K.; Hemley, R.J.; Duffy, T.S. Elasticity measurement and equation of state of MgO to 60 GPa. EOS. Trans. AGU 1997, 78, F752. [Google Scholar]
  7. Xu, M.; Jing, Z.; Chantel, J.; Jiang, P.; Yu, T.; Wang, Y. Ultrasonic velocity of diopside liquid at high pressure and temperature: Constraints on velocity reduction in the upper mantle due to partial melts. J. Geophys. Res. Sol. Earth 2018, 123, 8676–8690. [Google Scholar] [CrossRef]
  8. Jing, Z.; Karato, S. A new approach to the equation of state of silicate melts: An application of the theory of hard sphere mixtures. Geochim. Cosmochim. Acta 2011, 75, 6780–6802. [Google Scholar] [CrossRef]
  9. Wilding, M.C.; Benmore, C.J.; Weber, J.K.R. In situ diffraction studies of magnesium silicate liquids. J. Mater. Sci. 2008, 43, 4707–4713. [Google Scholar] [CrossRef]
  10. Inoue, K.; Asada, T. Cubic anvil X-ray diffraction press up to 100 kbar and 1000 °C. Jpn. J. Appl. Phys. 1973, 12, 1786–1793. [Google Scholar] [CrossRef]
  11. Tsuji, K.; Yaoita, K.; Imai, M.; Shimomura, O.; Kikegawa, T. Measurements of X-ray diffraction for liquid metals under high pressure. Rev. Sci. Instrum. 1989, 60, 2425–2428. [Google Scholar] [CrossRef]
  12. Yamada, A.; Wang, Y.; Inoue, T.; Yang, W.; Park, C.; Yu, T.; Shen, G. High-pressure X-ray diffraction studies on the structure of liquid silicate using a Paris-Edinburgh type large volume press. Rev. Sci. Instrum. 2011, 82, 015103–015107. [Google Scholar] [CrossRef] [PubMed]
  13. Mezouar, M.; Faure, P.; Crichton, W.; Rambert, N.; Sitaud, N.; Bauchau, S.; Blattmann, G. Multichannel collimator for structural investigation of liquids and amorphous materials at high pressures and temperautures. Rev. Sci. Instrum. 2002, 73, 3570–3574. [Google Scholar] [CrossRef]
  14. Morard, G.; Mezouar, M.; Bauchau, S.; Alvarez-Murga, M.; Hodeau, J.L.; Garbarino, G. High efficiency multichannel collimator for structural studies of liquids and low-Z materials at high pressures and temperatures. Rev. Sci. Instrum. 2011, 82, 023904. [Google Scholar] [CrossRef]
  15. Besson, J.M.; Nelmes, R.J.; Hamel, G.; Loveday, J.S.; Weill, G.; Hull, S. Neutron powder diffraction above 10 GPa. Phys. B Condens. Matter 1992, 180, 907–910. [Google Scholar] [CrossRef]
  16. Klotz, S.; Besson, J.M.; Hammel, G.; Nelmes, R.J.; Loveday, J.S.; Marshall, W.G. High pressure neutron diffraction using the Paris-Edinburgh cell: Experimental possibilities and future prospects. High Press. Res. 1996, 14, 249–255. [Google Scholar] [CrossRef]
  17. Rivers, M.L.; Duffy, T.S.; Wang, Y.; Eng, P.J.; Sutton, S.R.; Shen, G. A new facility for high-pressure research at the Advanced Photon Source. In Properties of Earth and Planetary Materials at High Pressure and Temperature; Manghnani, M.H., Yagi, T., Eds.; AGU: Washington, DC, USA, 1998; pp. 79–88. [Google Scholar]
  18. Kono, Y.; Park, C.; Kenney-Benson, C.; Shen, G.; Wang, Y. Toward comprehensive studies of liquids at high pressures and high temperatures: Combined structure, elastic wave velocity, and viscosity measurements in the Paris-Edinburgh cell. Phys. Earth Planet. Int. 2014, 228, 269–280. [Google Scholar] [CrossRef]
  19. Yu, T.; Wang, Y.; Rivers, M.L. Imaging in 3D under pressure: A decade of high-pressure X-ray microtomography development at GSECARS. Prog. Earth Planet. Sci. 2016, 3, 17. [Google Scholar] [CrossRef]
  20. Brönnimann, C.; Trüb, P. Hybrid pixel photon counting X-ray detectors for synchrotron radiation. In Synchrotron Light Sources and Free-Electron Lasers; Jaeschke, E., Khan, S., Schneider, J., Hastings, J., Eds.; Springer: Cham, Switzerland, 2016; pp. 995–1027. [Google Scholar]
  21. Dewaele, A.; Fiquet, G.; Andrault, D.; Hausermann, D. P-V-T equation of state of periclase from synchrotron radiation measurements. J. Geophys. Res. 2000, 105, 2869–2877. [Google Scholar] [CrossRef]
  22. Prescher, C.; Prakapenka, V.B. DIOPTAS: A program for reduction of two-dimensional X-ray diffraction data and data exploration. High Press. Res. 2015, 35, 223–230. [Google Scholar] [CrossRef]
  23. Prescher, C. Glassure: An API and GUI program for analyzing angular dispersive total X-ray diffraction data. Zenodo 2017, 2017. [Google Scholar] [CrossRef]
  24. Wagner, C.N.J. Direct methods for the determination of atomic-scale structure of amorphous solids (X-ray, electron, and neutron scattering). J. Non Cryst. Solids 1978, 31, 1–40. [Google Scholar] [CrossRef]
  25. Parise, J.B.; Antao, S.M.; Michel, F.M.; Martin, C.D.; Chupas, P.J.; Shastri, S.D.; Lee, P.L. Quantitative high-pressure pair distribution function analysis. J. Synchrotron Radiat. 2005, 12, 554–559. [Google Scholar] [CrossRef] [PubMed]
  26. Lorch, E. Neutron diffraction by Germania, silica and radiation-damaged silica glasses. J. Phys. C Solid State Phys. 1969, 2, 229–237. [Google Scholar] [CrossRef]
  27. Eggert, J.H.; Weck, G.; Loubeyre, P.; Mezouar, M. Quantitative structure factor and density measurements of high-pressrure fluids in diamond anvil cells by X-ray diffraction: Argon and water. Phys. Rev. B 2002, 65, 174105. [Google Scholar] [CrossRef]
  28. Misawa, M.; Price, D.L.; Suzuki, K. Short-range structure of alkali disilicate glasses by pulsed neutron total scattering. J. Non Cryst. Solids 1980, 37, 85–97. [Google Scholar] [CrossRef]
  29. Smith, W.; Greaves, G.N.; Gillan, M.J. Computer simulation of sodium disilicate glass. J. Chem. Phys. 1995, 103, 3031. [Google Scholar] [CrossRef]
  30. Huang, C.; Cormack, A.N. The structure of sodium silicate glass. J. Chem. Phys. 1990, 93, 8180–8186. [Google Scholar] [CrossRef]
Figure 1. Current layout of the GeoSoilEnviro Center for Advanced Radiation Sources (GSECARS) bending magnet (BM) and insertion device (ID) beamlines (a). X-ray optics of the ID beamlines are mainly installed in ID-A and ID-B hutches. The diffractometer that hosts the Paris-Edinburgh press + multi-channel collimator setup is located in the ID-C hutch (labeled: MCC-ADXD in the gray colored area). (b) is a sketch of the experimental setup showing the doubly focused mono beam passing through the entrance slits, pin hole then entering the sample in the Paris-Edinburgh press.
Minerals 09 00715 g001
Figure 2. A general-purpose diffractometer is used for glass and liquid structure studies in 13-ID-C. (a) is a bird’s-eye view of the experimental setup. The incident beam enters the press from the top of the image, the general-purpose diffractometer carries a Pilatus3 X CdTe 300K-W pixel array detector, and the detector arm is capable of rotating with respect to two axes with an angular accuracy of 0.002°. This allows convenient alignment of the setup relative to the focused X-ray beam and large Q coverage. The multi-channel collimator is aligned with respect to the incident X-ray beam, with the Paris-Edinburgh cell located at the rotation center of the general-purpose diffractometer. (b) shows the experimental setup with the heating cables and water-cooling hoses attached and the 40 µm wide pin hole projecting into the Paris-Edinburgh press.
Minerals 09 00715 g002
Figure 3. A multi-channel collimator is used for beam collimation on the X-ray scattering side. The inner and outer arrays, with slit opening widths of 0.05 and 0.2 mm, are composed of 75 slits with 0.8° separation. Schematic shows the basic concept of beam collimation (top view) (modified from [13]).
Minerals 09 00715 g003
Figure 4. Calculated collimation depth at the sample center (D0) and the maximum collimation depth (D1) that takes into account the size of the incident beam. As an example, with an incident beam size of 0.05 mm (red curve), a sample with a diameter >1.05 mm can be used without being interfered by crystalline peaks from the surrounding pressure media at two-theta angles greater than 10°.
Minerals 09 00715 g004
Figure 5. (a): The standard 3 mm Paris-Edinburgh cell assembly (bottom) that can reach 7 GPa and 2300 K. The 1.6 mm diameter sample size is the largest that we can accommodate in our setup. The 3 mm Paris-Edinburgh anvil (top) is custom-made by Fujilloy. The center part of the anvil is tungsten carbide with a steel ring surrounding it for lateral support. (b) For pressures up to 12 GPa, a 2 mm cell assembly (a TiB2 heater and a graphite sample capsule) is utilized (bottom). From both the full image and the cross section of the 2 mm cupped-toroidal Drickamer anvil (top), one can clearly see the toroidal-cut groove that helps to prevent the pressure medium from flowing outward under compression. Similar to the 3 mm standard anvils, the cupped-toroidal Dricakmer anvil also consists of a tungsten carbide center part and an outer supporting steel ring.
Minerals 09 00715 g005
Figure 6. A Dioptas window showing the 2D X-ray diffraction image of the lanthanum hexaboride (LaB6) powder (NIST 660C) collected using the Pilatus3 X CdTe 300K-W detector (left panel). We can work with image files that only recorded a portion of the diffracted powder rings. The right panel is the integrated diffraction pattern. LaB6 powder is filled in a 0.5 mm diameter amorphous silica capillary and mounted in the horizontal plane oriented perpendicular to the incident beam. LaB6 serves as the line position standard for calibrating detector parameters.
Minerals 09 00715 g006
Figure 7. Two sets of X-ray scattering data collected for the same Pyrex glass rod at ambient condition. The red line (scaled in intensity) is the data set collected using the multi-channel collimator while the white one is without the multi-channel collimator. Both were collected for 600 s. The inset shows an example of the transfer function (intensity correction ratio vs. Q) derived from one of the beamtime setups.
Minerals 09 00715 g007
Figure 8. A captured screenshot of the data analysis software “Glassure”. The top window shows the collected sodium silicate liquid data at 3 ± 0.1 GPa and 1673 ± 90 K. The red dotted line in the top window is the background collected using an empty cell assembly at ambient condition. The middle window shows the structure factor S(Q) of the liquid sample. The signal becomes noisy at Q > 12 Å−1. The bottom window is the pair distribution function of the liquid sample with a Max Q cutoff of the structure factor at 13 Å−1. We are currently working on data collection of sodium silicate liquids at higher pressures; detailed analysis will be published in the future.
Minerals 09 00715 g008
Figure 9. The pair distribution function g(r) of sodium disilicate glass collected at ambient pressure and temperature. Peaks representing atomic distances of Si–O, Na–O, O–O and Si–O are shown.
Minerals 09 00715 g009
Table 1. Comparison of the atomic bond lengths of sodium disilicate glass derived from our experiment (Figure 9) with values from previous studies. The results agree well, demonstrating that our setup is capable of collecting reliable structure data of non-crystalline materials (unit: Å).
Atomic Bond LengthsThis StudyNeutron Scattering
[28]
MD Simulation
[29]
MD Simulation
[30]
Si–O1.61 ± 0.011.631.71.61
Na–O2.20 ± 0.04-2.32.42
O–O2.60 ± 0.022.662.62.62
Si–Si3.14 ± 0.01-3.13.16

