Abstract
This study aims to model grinding of a Polish ferronickel slag and evaluate the particle size distributions (PSDs) of the products obtained after different grinding times. Then, selected products were alkali activated in order to investigate the effect of particle size on the compressive strength of the produced alkali activated materials (AAMs). Other parameters affecting alkali activation, i.e., temperature, curing, and ageing time were also examined. Among the different mathematical models used to simulate the particle size distribution, Rosin–Rammler (RR) was found to be the most suitable. When piecewise regression analysis was applied to experimental data it was found that the particle size distribution of the slag products exhibits multifractal character. In addition, grinding of slag exhibits non-first-order behavior and the reduction rate of each size is time dependent. The grinding rate and consequently the grinding efficiency increases when the particle size increases, but drops sharply near zero after prolonged grinding periods. Regarding alkali activation, it is deduced that among the parameters studied, particle size (and the respective specific surface area) of the raw slag product and curing temperature have the most noticeable impact on the compressive strength of the produced AAMs.
1. Introduction
Very large quantities of slags are generated during steel, ferrous- and non-ferrous metal production. Even though a certain share of the produced slag volume is used in the construction sector, large quantities are not properly managed and are considered as sources of environmental pollution. Thus, the development of an integrated management scheme that can transform this resource into valuable products is of great importance [1,2].
Slags are mainly used for cement and concrete production. This utilization option eliminates environmental problems and contributes to the reduction of the environmental footprint of the construction sector. It is known that cement production is one of the most energy intensive processes, since it consumes 12% to 15% of the total industrial energy requirements and is responsible for 7% to 10% of the global CO2 emissions [3,4]. Other alternative options for slag management include its use in road construction as aggregate [5], and in recent years the production of alkali activated materials (AAMs), called inorganic polymers (IPs) or “geopolymers”, can be used as construction materials or binders in the construction sector, thus improving its sustainability [6].
Alkaline activation, which is carried out with the use of NaOH, KOH, and Na2SiO3 solutions at relatively low temperature, is considered as a promising option for the management of various waste streams and the production of AAMs (alkali activated materials) exhibiting beneficial physico–chemical and thermal properties [7,8,9,10,11,12]. The potential of wastes for alkali activation depends on their content of aluminosilicates which defines their reactivity, the strength of the activating solution and the other synthesis conditions, mainly particle size of the raw material used, curing temperature, curing and ageing period [13,14].
So far various types of slags, rich in Ca or Fe, produced from various metal and steel production industries have been successfully alkali activated. Alkali activation involves the use of raw slags or their mixtures with other waste types to regulate their content of aluminosilicates and enable the formation of strong bonds [15,16,17,18]. It is mentioned that the produced structures may also exhibit other beneficial properties, including the sorption of contaminants from solutions and immobilization of hazardous ions [19,20].
Slag, prior to its use in most applications, requires grinding which is an energy intensive process, characterized by high CO2 emissions and increased processing cost. In addition, grinding is a low-efficiency process because a large share of the consumed energy is absorbed by the device and only a small part is used for size reduction [21,22]. Considering these factors, the investigation of grinding kinetics of any raw material, including slag, is an important aspect.
Among the different approaches used to improve grinding efficiency, phenomenological grinding kinetics models based on population balance considerations are used. Population balance modeling is based on two functions, namely the breakage rate and the breakage function [23,24]. Many studies have reported the advantages of these functions [25,26] and the variation of the kinetic model parameters under different mill operating conditions [27,28,29,30,31,32]. Another important issue associated with the grinding operation is the scale-up of ball mills based on laboratory test work [33].
The determination of the breakage rate for the mass fraction of feed size R is based on the assumption that grinding follows a first-order law as reported in previous studies [22,24], according to Equation (1),
where K is the grinding rate constant and t is the grinding time.
Generally, the first-order hypothesis is the most widely used one to describe the grinding process in a ball mill, however, many researchers have observed that, in fact, the breakage rate slows down with increasing grinding time and deviates from the first-order; this breakage is called non-first-order [34,35,36].
In light of the non-first-order behavior Alyavdin proposed that the following formula (Equation (2)) can be used to describe the grinding process [37,38],
where R0 is the mass fraction in the feed, and M is a constant depending on the material properties and grinding conditions.
The present study aims, through batch grinding experiments, to model grinding and evaluate the effect of grinding time on the particle size distribution of the slag products. Then, selected grinding products were alkali activated, and the effect of particle size, specific surface area, curing temperature, and ageing time on the properties of the produced AAMs was assessed. The novelty of the study is that it investigates in depth the grinding kinetics of an industrial waste and the effect of the particle size of the raw material for the production of AAMs, issues that so far have not been systematically investigated.
2. Mathematical Models for the Simulation of PSD
In the literature and also in industrial practice, several models have been tested to simulate mathematically the particle size distribution (PSD) of the grinding products. These include log-normal, logistic, Gates–Gaudin–Schuhmann (GGS) and Rosin–Rammler (RR) distributions, while truncated distributions, e.g., logarithmic distribution, Gaudin–Meloy, log-normal and the truncated version of RR distribution can also be used to describe particulate materials [39,40]. In addition, fractal geometry which is based on the idea of self-similarity is also widely used for describing various complex natural phenomena, including particle size distribution [41,42]. Other studies have used the Swrebec distribution model as an alternative to traditional distributions because of its goodness-of-fit in both coarse and fine size ranges [43,44]. The Rosin–Rammler distribution that was used in the present study is expressed by Equation (3),
where x is the screen aperture size, P is the mass or volume (in %) finer than size x, x’ is the size modulus (63.2% passing-screen size), and n is the distribution modulus (index of uniformity). The higher the n value the more uniform is the distribution [45]. The RR distribution can be transformed to:
Equation (4) indicates that if the data follow the RR distribution, the plot of loglog(100/(100-P)) versus logx will be a straight line from which n and x’ can be calculated.
The PSD of the grinding products can be also mathematically described by the logistic distribution as follows:
where x50 is the 50% passing-screen size and λ (>0) is the distribution modulus (sharpness index). Equation (5) can be transformed into a straight line as follows:
From the straight line of Equation (6) λ and x50 can be calculated.
The GGS model that was used in the present study is expressed by Equation (7),
where k is the particle size modulus (maximum particle size) and m is the distribution modulus (index of uniformity). Lower values of m suggest the production of more fines and large particles, while as the value of m increases the distribution gets narrower [45,46].
The GGS model follows a power-law and is therefore equivalent to fractal distribution, as proposed by Turcotte [47]. Logarithmic transformation of Equation (7) results in a linear relationship between logP and logx from which k and m can be determined using linear regression analysis. Then, the fragmentation fractal dimension could be calculated as follows,
Since simple linear models may not fit the entire dataset, a piecewise approximation could be used for the description of the PSD of the grinding products [48,49]. Based on this, it is assumed that there could be two intervals of particle sizes separated by a critical size. This could mean that the log-transformed data of Equation (7) would yield two straight lines, separated by a breakpoint (logxb) defined as the transition point between two particle intervals,
where m1 and m2 are the slopes and b1 and b2 are the intercepts of the straight lines. Each term in parenthesis represents a logical operation, i.e., if the term is true it will get the value 1, while if it is false it will get the value 0.
3. Materials and Methods
The material used in this study is slag produced from the pyrometallurgical treatment of Ni-bearing silicate ores in Szklary, southwestern Poland [50]. Its chemical composition, as obtained by X-ray fluorescence in the form of oxides is shown in Table 1. The main mineralogical phases present, as obtained by X-ray diffraction (XRD), were quartz (SiO2), hedenbergite (Ca(Fe,Mg)(SiO3)2), fayalite (Fe2SiO4), diopside (CaMgSi2O6), and magnetite (Fe3O4), while hatrurite (Ca3SiO5) is present as a minor phase. More data about the origin and the characteristics of this slag can be found in a previous recent study [2].

Table 1.
Chemical composition (wt %) of slag.
The received sample, approximately 200 kg, with a particle size of –100 mm was homogenized by the cone and quarter method, and a representative quantity was crushed to less than 0.850 mm using a Fritsch type jaw crusher (Fritsch pulverisette 1, Fritsch GmbH, Idar-Oberstein, Germany) for primary and a cone crusher (Sepor, Wilmington, NC, USA) for secondary crushing. The particle size distribution of the feed material and grinding product was determined using a Malvern type S Mastersizer (Malvern Instruments, Malvern, UK) (size range: 0.05 to 850 μm) and laser diffraction (LD) technique. LD was also used for the estimation of the specific surface area (SSA) of the feed material and grinding products using Equation (10).
Sw is the specific surface area, ρp is the particle density, D[3,2] is the surface area mean (Sauter mean diameter), and f, k are the surface and volume coefficients (for spheres f/k = 6).
LD involves the detection of the angular distribution of scattered light produced by a laser beam which passes through a dispersed particulate sample [51]. The data of the angular scattering intensity is then analyzed and the particle sizes are calculated using the Mie theory of light scattering and expressed as the volume equivalent sphere diameter [52,53]. Thus, since LD assumes a specific geometry for the particles without taking into consideration the particle shape, the Brunauer–Emmett–Teller (BET) nitrogen adsorption method (using a Quantachrome Nova 2200 analyser, Anton Paar QuantaTec Inc., Boynton Beach, FL, USA) was considered for the determination of SSA [54].
The techniques used for characterizing raw slag and the produced AAMs are (i) X-ray powder diffraction, for the identification of the mineral phases using a D8 Advance type (-AXS, Karlsruhe, Germany) diffractometer and (ii) X-ray fluorescence, for the chemical analysis using a Bruker S2 Ranger Energy-dispersive ED-XRF (Bruker, Karlsruhe, Germany) Spectrometer. Scanning electron microscopy (SEM) was also used to define the morphology of the raw slag and the grinding products, using a JEOL 6380LV microscope (JEOL Ltd., Tokyo, Japan) equipped with an Oxford INCA energy dispersive X-ray spectrometer (EDS).
Grinding tests were carried out in a ball mill (Sepor, Los Angeles, CA, USA) with dimensions of L × D = 166 × 204 mm using different grinding times (15, 30, 45, 60, 90, and 120 min) under dry conditions. Stainless steel balls (ρb = 7.85 g/cm3) with three different sizes, i.e., 40, 25.4, and 12.7 mm were used as grinding media. The total ball mass was almost constant at each ball size used corresponding to ball filling volume J = 20%, while the material filling volume fc was 4%. This means that 50% of the interstitial filling U of the void spaces of the balls was filled with material, according to Equation (11). The mill specification data and test conditions are shown in Table 2.
Table 2.
Mill specification data and test conditions.
The reactivity of the products obtained after 30, 60, and 120 min of grinding was evaluated through leaching of 1.0 g of solids in 100 mL of 8 mol/L (M) NaOH solution for 24 h at ambient temperature (~22 °C) under continuous magnetic stirring. After solid–liquid separation with the use of 0.45 μm pore size membrane filters (PTFE, Chromafil, Macherey-Nagel GmbH and Co. Düren, Germany), the concentration of Al and Si in the eluate was determined using an Agilent 7500cx Inductively Coupled Plasma Mass Spectrometry (ICP-MS) (Agilent Technologies Inc., Santa Clara, CA, United States) equipped with an Agilent ASX-500 Autosampler.
The slag products obtained after 30, 60, and 120 min of grinding were alkali activated using a mixture of sodium hydroxide (NaOH, Sigma Aldrich) and sodium silicate (Na2SiO3, Merck) as alkaline activating solution. Pellets (anhydrous) of NaOH dissolved in water to produce solutions with specific molarity, followed by the addition of sodium silicate solution (8 wt % Na2O, 27 wt % SiO2, and 65 wt % H2O). The final solution was allowed to cool at ambient temperature for 24 h and then mixed under continuous stirring with each grinding product to obtain a paste. Six sets of samples were prepared in order to investigate the effect of slag particle size and curing temperature on the properties of the produced AAMs, while the liquid/solid (L/S) ratio was kept constant at 0.25. The composition of the mixture was (wt %): 80% slag, 16.7% 8 M NaOH solution and 3.3% Na2SiO3. Under these conditions the molar ratio of H2O/Νa2O in the reactive paste was 12.9. According to the procedure followed, cubic metal molds (5 cm edge) were filled with the fresh paste and vibrated for compaction and removal of air voids. The molds remained at ambient temperature for a period of 3 to 9 h and when the paste hardened sufficiently the specimens were removed, sealed in plastic bags to avoid moisture loss, and cured for 24 h at either 60 or 80 °C in a laboratory oven (Jeio Tech ON-02G, Seoul, Korea). After curing, specimens were allowed to cool at room temperature, and after the ageing periods of 7 and 28 days the compressive strength was determined using a Matest C123N load frame (Matest S.p.A, Treviolo, Bergamo, Italy). The experimental conditions used in this study were based on the results of a previous study carried out in the laboratory and involving the same slag [2]. All tests and measurements were carried out in triplicate and the average values are provided in this study. Finally, the apparent density, porosity, and water absorption of selected AAMs were determined based on the standard BS EN 1936 [55].
4. Results and Discussion
4.1. Particle Morphology of Raw Slag and Grinding Products
The particle morphology of the raw slag and the grinding products obtained after 30, 60, and 120 min of grinding, as derived with the use of SEM at different magnifications, is shown in Figure 1a–e.
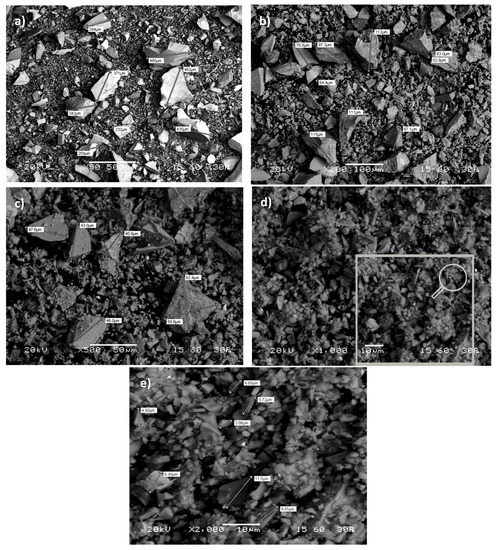
Figure 1.
Morphology of particles: (a) raw slag, and after (b) 30 min, (c) 60 min, (d,e) 120 min of grinding.
The obtained results indicate that, in general, the particles of raw slag have a flat-face, and an irregular and elongated shape, while no spherical particles are observed (Figure 1a). A broad particle size distribution is observed for particles smaller than ~500 μm. With increasing grinding time (30 to 60 min) the particles become progressively finer while their morphology shape remains almost similar (Figure 1b,c).
After prolonged grinding (120 min), even though finer particles are quite irregular, coarser particles tend to become more rounded due to their subjection to attrition (Figure 1d). At this stage, it is seen that particles are distinct and no agglomeration is observed. The evolution of particle morphology during grinding has been investigated in previous studies which reported that the type of material being ground, the mill type, as well as the mode of breakage may have a large impact on the shape of particles produced [56,57,58].
4.2. Grinding Kinetics Modeling
The particle size distributions of the feed (raw slag) and grinding products as a function of the grinding time are shown in Figure 2. It is seen that the particle size of the grinding product gradually decreases with the increase of grinding time. It is known that the degree to which finer particles are reduced depends on the mill, the material type, and the grinding conditions [58]. Figure 2 also shows that no particle agglomeration was observed even after 120 min of grinding, unlike the findings of previous studies which indicate potential agglomeration after long grinding periods [59,60]; the absence of agglomeration is due to the lack of clay minerals in the feed and is confirmed in Figure 1d which shows that particles are distinct.
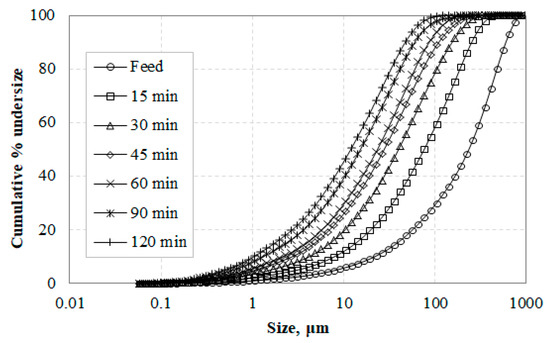
Figure 2.
Variation of particle size distribution with grinding time.
In order to investigate the grinding kinetics of the raw slag seven representative sizes (222.3, 65.51, 19.31, 5.69, 1.68, 0.49, and 0.15 μm) were selected, and the remaining volume (%) fraction for each size after various grinding times was determined, as seen in Figure 3. The results indicate that the remaining fraction of each representative size decreases with increasing grinding time and the experimental data can be expressed by Equation (2), which confirms that grinding of slag exhibits non-first-order behavior and the reduction rate of each size is time dependent. The deviation from the first order is more evident for the larger particle sizes which are ground more efficiently than finer particles during grinding. The non-first-order grinding behavior is due to either mill conditions or material properties and has been reported in several earlier studies [22,34,61,62].
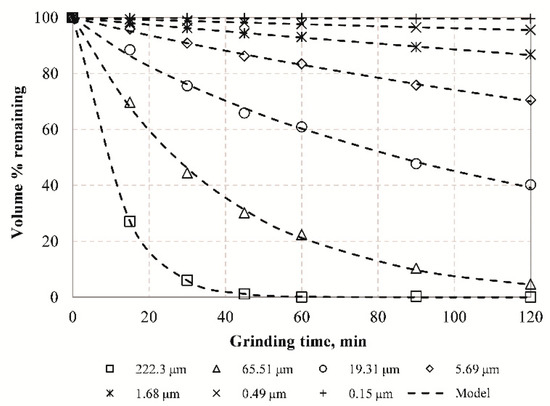
Figure 3.
Remaining fraction (% volume) for seven representative sizes vs. grinding time.
Table 3 presents the estimated parameters K and M by fitting the Alyavdin grinding kinetic equation to experimental data. This table also reveals the very good fitting curves, as indicated by the correlation coefficients (R2) values. Based on the grinding rate constant (K) values, it is confirmed that grinding rate and consequently grinding efficiency increases when the particle size increases, but drops sharply to near zero values after prolonged grinding (Figure 3). The grinding time at which the grinding rate decreases to zero depends on particle size; the larger the particle size the faster the grinding rate drops to zero. M values range between 0.652 and 1.110, indicating deviation from slope unity (M = 1) and the first-order grinding kinetics of the population balance model.
Table 3.
Parameters of Alyavdin formula (Equation (2)) for seven representative sizes (mm).
4.3. Particle Size and Specific Surface Area of Slag Products
The characteristic diameters of the cumulative distributions, i.e. d10, d50, d75, and d90, which refer to particle sizes passing 10%, 50%, 75%, or 90% cumulative undersize, were determined in order to investigate the fineness of the ground products for different grinding times (Table 4). In the LD technique particles are assumed to be spheres and therefore these characteristic diameters are typically the equivalent particle sizes (EPSs). This table also presents the SSA of the slag products determined by either the BET or LD techniques.
Table 4.
Equivalent particle size and specific surface area of slag grinding products at different times.
The results show that EPSs decrease during grinding, and no agglomeration is observed as indicated by the coarse part of the particle size distributions which continues to shift to finer sizes. This can be also seen from the d90 values (Table 4) which continue to decrease during grinding. More specifically, the d90 of slag grinding product obtained after 15 min of grinding was 252.2 μm and reduced after prolonged grinding (120 min) to 47.1 μm. Since surface area is intimately linked to particle size, the results of Table 4 show that the specific surface area increases during grinding. By comparing the different techniques, it is revealed that the measured surface areas with BET are almost three times bigger compared to those measured with LD, and this indicates clearly that gas adsorption provides an essential bulk measurement of surface area as it can access surface features close to the size of nitrogen molecules.
In order to investigate the grinding behavior of raw slag, non-linear regression analysis was carried out to correlate the equivalent particle size and grinding time (Figure 4).
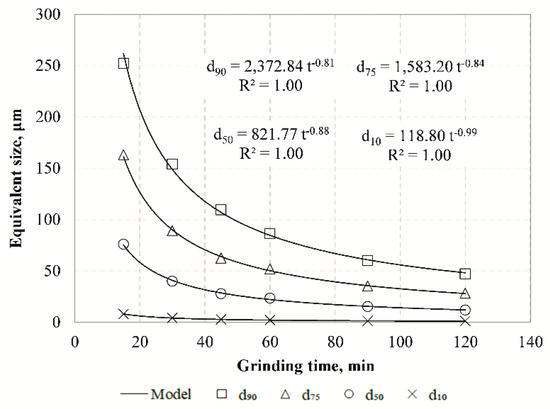
Figure 4.
Equivalent particle size of slag products versus grinding time.
The results indicate that with the use of inverse exponential functions very strong correlations are obtained between EPSs and grinding time. It is evident that the reduction rate of particle size is constantly decreasing, and after prolonged grinding the particle size can reach a theoretical constant value which is defined as the grinding limit. This means that there is a product size that cannot be further reduced by the mill and all energy consumed beyond this point is considered as loss. Apart from various parameters affecting grinding limit, namely material type as well as process or machine parameters, its prediction is sensitive to the technique used. Figure 5 presents the evolution of median size (d50) with grinding time in comparison with the particle size determined by the BET method using Equation (10).
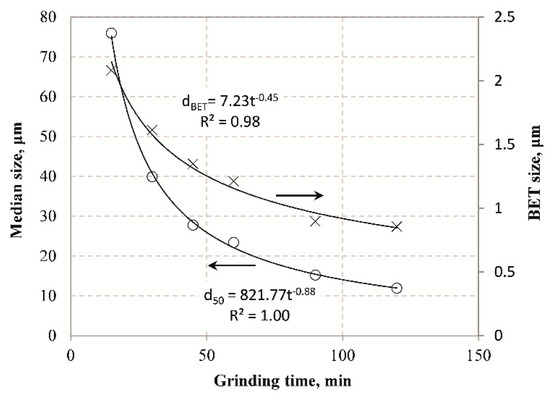
Figure 5.
Evolution of median size (d50) and Brunauer–Emmett–Teller (BET) size with grinding time.
In this equation the SSA values of BET provided in Table 4 were considered and the BET size at each grinding time was determined by using the relation f/k = π/6. The results of Figure 5 show that in both cases the product particle size decreases with the grinding time, and very strong correlation between them is obtained with the use of inverse exponential function. However, the use of BET results in much finer particle sizes in comparison with LD. The results obtained from BET allow the determination of the true grinding limit as already mentioned in previous studies [63].
4.4. Modeling of Particle Size Distributions of Grinding Product
4.4.1. Rosin–Rammler, Gates–Gaudin–Schuhmann and Logistic Distributions
Rosin–Rammler, Gates–Gaudin–Schuhmann as well as Logistic distribution models were used to describe the particle size distribution of the slag products. Figure 6a–c shows the PSDs obtained after grinding for various times and the fitted curves to data points using the RR (Equation (3)), Logistic model (Equation (5)) and GGS (Equation (7)), respectively. Non-linear least square analysis using the Solver tool of Microsoft Excel was used to fit the experimental data and the values of model parameters were estimated, as seen in Table 5.
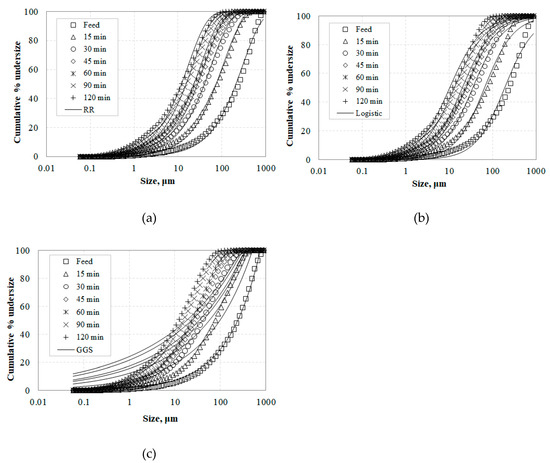
Figure 6.
Particle size distribution of slag grinding products using the (a) Rosin–Rammler (RR) and (b) Logistic model, and (c) Gates–Gaudin–Schuhmann (GGS) distributions.
Table 5.
Model distribution parameters for the slag grinding products.
The accuracy of the model distributions was assessed using the adjusted correlation coefficient R2 (Ads.). The results indicate that RR is a particularly suitable model for representing particle size distributions obtained after grinding in a ball mill, and fits the experimental data better than the GGS and Logistic models. It is known that the PSD of materials generated by comminution can be dependent on a variety of factors such as the initial particle size and the physical properties of the material, as well as the comminution mechanisms applied by the machines. In this regard, the comminution forces acting on the particles during grinding change depending on the machine type, and this affects the product particle size distribution. For example, Taşdemir and Taşdemir [45] mention that the GGS model describes better the PSDs obtained after grinding of chromite ores by low energy events, i.e., jaw and cone crushing, while the RR model is more suitable for PSDs obtained by high energy events, i.e., hammer crushing and ball milling.
Size parameters such as size modulus and uniformity index were also determined with the use of the RR model to characterize particle size distribution of the slag grinding products. As shown in Figure 7, the size modulus decreases with increasing grinding time, while the uniformity index becomes higher as grinding proceeds. These results indicate that the finer the product size the higher is the n value, and the PSD becomes narrower. Very strong correlations (R2 = 1.00) are obtained with the use of exponential functions between size modulus or uniformity index and grinding time.
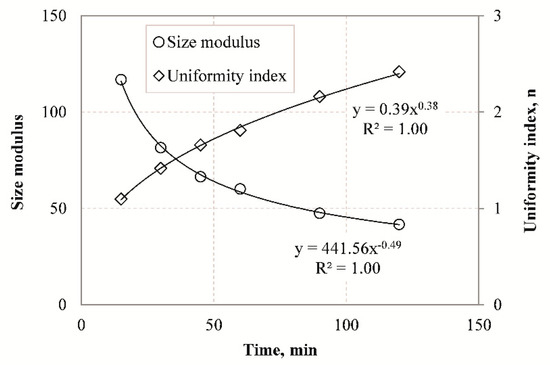
Figure 7.
Size modulus and uniformity index versus grinding time using the RR model.
4.4.2. Fractal Features of Products PSD
Table 6 presents the estimated fractal dimensions D of grinding products obtained after different grinding times using Equations (7) and (8). Linear regression analysis using the Solver tool of Microsoft Excel was used to fit the experimental data and the goodness of fit was assessed using the correlation coefficient R2. The results indicate that the values of D range between 2.58 and 2.75 which are consistent with the findings of Carpinteri and Pugno [64], who reported that the fractal dimension from comminution experiments ranges between 2 and 3. As reported by Taşdemir [48], the grinding products of chromite ore had different ranges of D values, depending on the type of machine used, which in turn affected their breakage mode. For example, in tumbling mills the ore is subjected to repeated forces and since the retention time is long they will eventually break. This results in higher D values, indicating wider particle size distribution and bigger proportion of fines in mill products compared to other machines. Table 6 also shows that the value of D increases with increasing grinding time, because as grinding proceeds more fines are produced. Due to fact that a large amount of energy is consumed for size reduction, especially for the production of very fine particles, the fractal dimension D is also considered a factor of comminution efficiency. However, the goodness-of-fit (R2 < 0.957) indicates that the single fractal model may not represent the entire range of measured particle sizes. The application of the fractal model to PSDs yielded a certain lack-of-fit which is more apparent during long grinding periods. This is also confirmed from the log-log plot of particle size distribution of slag after 15 min of grinding (Figure 8). It can be seen that the measured data points cannot be represented by a straight line and a significant increase in slope at finer sizes (below ~0.5 μm) is observed. To overcome this shortcoming, piecewise regression analysis by the quasi-Newton nonlinear estimation method was used to predict the size distributions derived. Figure 9 shows the presence of two different domains of particle sizes indicating that the PSDs of slag products may exhibit multi fractal character. These domains can be clearly identified by applying piecewise regression analysis, using Equation (9). Table 6 shows the estimated fractal dimensions D1 and D2 for the fine and coarse region of particle sizes, respectively. It is obvious that when piecewise regression analysis was applied to PSDs higher R2 are obtained compared to single linear regression. The fractal dimension of coarse region (D2) of particle sizes ranges between 2.29 and 2.49, and increases with increasing grinding time. However, the values of fractal dimension D1 are negative and thus have no physical meaning. It is noted that Mandelbrot [65] introduced the fractal geometry to describe very irregular forms that cannot be represented by classical geometry. Fractal dimension is not necessarily an integer, and ranges between the values of Euclidean geometry for a point and volume and varies from 0 to 3 [48]. Thus, the fine region of particles cannot be represented by a fractal dimension and this may be due to limitations of the laser diffraction (LD) technique used, as already mentioned in previous studies [66,67]. The validity of particle size measurements in the submicron range using light scattering systems is questionable, and thus the slope of the fine region of particle size distributions may be misleading.
Table 6.
Fractal dimensions calculated with the use of simple linear model and piecewise linear regression.
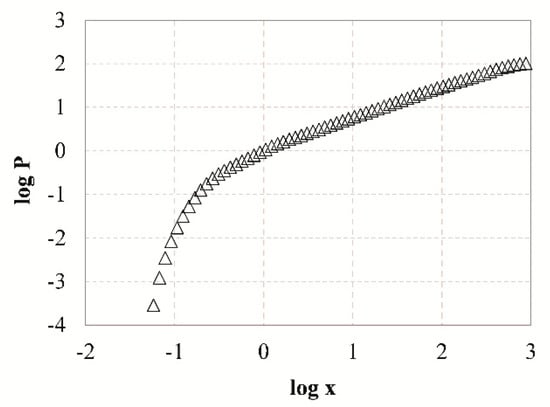
Figure 8.
Log-log plot of particle size distribution of slag particles after 15 min of grinding.
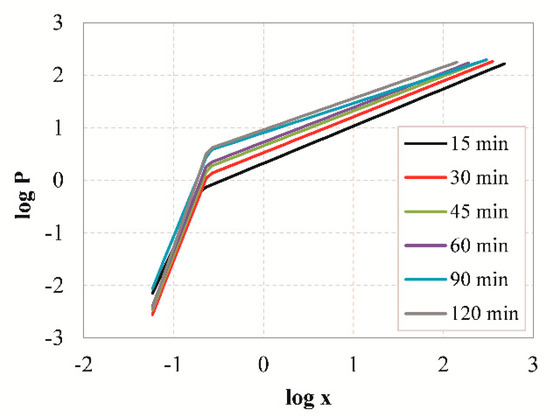
Figure 9.
Log-log plots of particle size distributions of slag particles obtained after grinding for different times, using piecewise regression analysis.
4.5. Alkali-Activation of Slag
4.5.1. Effect of Slag Particle Size and Curing Temperature
In order to investigate the effect of slag particle size on the compressive strength of the produced AAMs, three different median sizes of slag particles were selected, namely 39.9, 23.4, and 11.9 μm, obtained after 30, 60, and 120 min of grinding, respectively. The equivalent particle sizes of slag products are presented in Table 4. The other AAM synthesis conditions were the H2O/Νa2O molar ratio in the paste of 12.9, the curing period of 24 h and the ageing period of seven days. The setting time of the paste depends on the particle size of the slag product and ranges between 3 and 9 h for the different grinding products tested. It was observed that the paste consisting of finer particles requires much shorter setting time compared to the paste consisting of coarser particles. This is due to the fact that the finer particles have larger specific surface area and react faster with the activating solution [68]. Figure 10 shows the compressive strength of the AAMs produced as a function of particle size and curing temperature (60 or 80 °C).
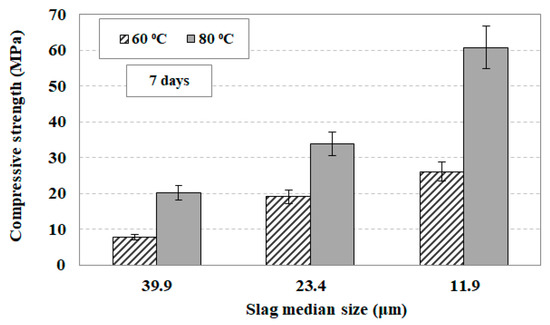
Figure 10.
Effect of slag median size and curing temperature on the compressive strength of the produced alkali activated materials (AAMs). Synthesis conditions: molar ratio in the reactive paste H2O/Νa2O 12.9, curing time 24 h, ageing period seven days; median sizes of 39.9, 23.4, 11.9 μm derived after 30, 60, and 120 min of grinding, respectively. Error bars indicate the standard deviation of three measurements.
It is seen from this data that at 60 °C when the median particle size of the slag grinding product decreases from 39.9 to 11.9 μm, and the compressive strength of the produced AAMs increases by 230%, from 7.9 to 26.2 MPa. On the other hand, when the curing temperature increases to 80 °C the produced AAMs acquire much higher compressive strength which increases by 200%, from 20.2 MPa to 60.8 MPa, when the median particle size decreases from 39.9 to 11.9 μm. These results indicate that when the raw material is finer, and thus has larger surface area, the reactions with the activating solution proceed faster, and thus the produced AAMs are denser and stronger [69,70]. It is noted that the increase of ageing period from seven to 28 days increases the compressive strength slightly, but the results are not provided in this study.
Other selected properties of the produced AAMs, namely, apparent density (g/cm3), porosity (%), and water absorption (%) when different slag particle sizes were used are presented in Table 7. This table also shows the compressive strength of the AAMs produced under the conditions: H2O/Νa2O molar ratio in the reactive paste 12.9, curing temperature 80 °C, curing time 24 h, and ageing period seven days. It can be seen from this data that there is an evident difference in all properties when three median sizes of slag particles were used. The main difference was observed in porosity which decreased from 13.5 to 6.7% when the slag median size decreased from 39.9 to 11.9 μm, indicating that this property may have a significant effect on the compressive strength of the produced AAMs. A similar trend was observed for water absorption which decreased from 5.9 to 3.8% by taking into account the same median sizes. On the other hand, the apparent density of the AAMs increased from 2.28 g/cm3 when slag with median size 39.9 μm was used to 2.54 g/cm3 when the median size was 11.9 μm. It is mentioned that the shrinkage of AAMs after curing at 60 or 80 °C was negligible. The reactivity of different slag products, as denoted by the concentration of Al and Si in solution after 8 mole/L NaOH leaching, and the respective Si/Al ratios, is shown in Table 8. It is observed that when the slag median size decreases from 39.9 to 11.9 μm the concentration of Si and Al in solution increases from 216 to 550 mg/L and 57 to 101.5 mg/L, respectively. Thus, the Si/Al ratio also increases and reaches 5.4 when the median size of slag was 11.9 μm. These results justify the magnitude of the compressive strength values obtained.
Table 7.
Selected properties of AAMs produced under the conditions 12.9 H2O/Νa2O, curing temperature 80 °C, curing time 24 h, ageing period seven days.
Table 8.
Concentration of Si and Al as well as Si/Al ratio in solution after leaching of slag with different particle size with NaOH.
Figure 11 shows SEM-back-scattered electron (BSE) images of selected AAMs produced when different slag particle sizes were used, i.e., 39.9 μm, 23.4 μm, and 11.9 μm. Overall, significant differences in the microstructure and the associated EDS analyses were observed among the AAMs studied. More specifically, the AAMs produced using slag with median size of 39.9 μm, obtained after 30 min of grinding, exhibit heterogeneous structures consisting of elongated and large in size unreacted slag particles (mostly diaspore, quartz, hedenbergite, and fayalite, in accordance with XRD analyses) surrounded by a porous and spongy inorganic gel matrix formed during alkali-activation (Figure 11a). EDS analysis of the inorganic gel (P1) revealed the abundance of Ca, Al, Si, and Fe, as well as the presence of Mg and Na in lower quantities (provided by the alkaline activators NaOH and Na2SiO3 as well as after partial solubilization of the raw slag). However, well-defined cracks and voids are seen in the microstructure of AAMs produced using slag with a median size of 39.9 μm due to incomplete gel formation, which probably explains the lower compressive strength obtained (20.2 MPa).
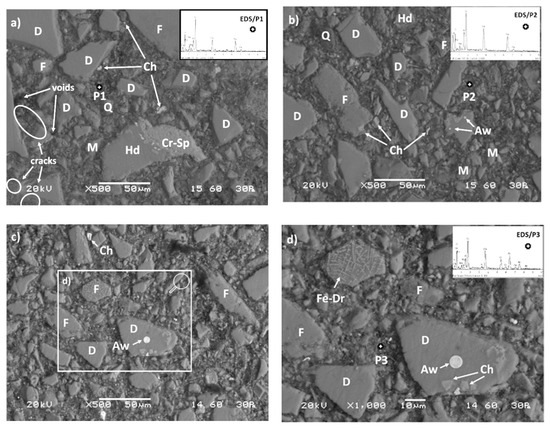
Figure 11.
SEM-back-scattered electron (BSE) images of cross-sections of AAMs produced using slag particles with median size of (a) 39.9 μm, (b) 23.4 μm, and (c,d) 11.9 μm. The presence of unreacted compounds, crack propagation and void formation is seen in several spot locations. Q: Quartz (SiO2), D: Diopside (CaMgSi2O6), M: Magnetite (Fe3O4), F: Fayalite (Fe2SiO4), Hd: Hedenbergite (Ca(Fe,Mg)(SiO3)2), Cr-Sp: Cr-Spinel, Fe-Dr: Ferrite dendrites, Ch: Chromite (FeCr2O4), Aw: Awaruite (Ni3Fe).
On the other hand, after prolonged grinding of the slag and the production of finer particles, i.e., median size 23.4 μm and 11.9 μm, almost negligible crack propagation and a highly dense and uniform/homogeneous inorganic matrix can be observed along the cross-sectional interfaces of the produced AAMs (Figure 11b,c, respectively). This microstructure suggests the formation of strong bonds due to polymeric reactions that took place between the alumino–silicate particles of the raw slag and the alkaline activators. In this context, particles with rounded edges or deteriorated are visible, indicating excessive dissolution of the raw slag by the attack of the alkaline solution. It also appears that the presence of finer slag particles, enhanced the dissolution of calcium ions present in diopside and hedenbergite.
In both AAMs produced using material obtained after prolonged grinding times (60 min and 120 min), N-A-S-H and C-A-S-H gels coexist in the alkaline matrix and contribute to the formation of products with higher cohesion and strength [71,72]. As can be seen in Table 9, which shows the elemental composition and selected properties of AAMs, a greater conversion of the precursor material (raw slag) to polymeric compounds is achieved in the prolonged grinding (median size 23.4 μm and 11.9 μm) compared to the AAMs produced from a slag median size of 39.9 μm due to the higher Ca/Si and Al/Si ratios present, as indicated by EDS analyses (P2 and P3, respectively). As a result, higher solubilization of Si and Al from the raw slag was attained that subsequently caused the formation of denser reaction products and the increase in compressive strength, up to 60.8 MPa. On the other hand, the lower content of Ca along with the higher Na content detected in AAMs produced when slag with median size of 39.9 μm was used, indicates that more N-A-S-H gel was formed, compared to C-A-S-H gel, and thus specimens with lower compressive strength was obtained (20.2 MPa). Finally, it is also interesting to mention that several other constituents were found in the alkaline matrix of the AAMs produced using slag particles with median size of 11.9 μm, such as Cr (up to 22%), and Ni (10%) due to dissolution of chromite (FeCr2O4) and awaruite (Ni3F) particles, respectively. Figure 11d (zoom of rectangular area of Figure 11c) shows the presence of chromite and awaruite as small single intergrown drops and inclusions embedded in the clinopyroxene (diopside) matrix as well as the development of ferrite dendrites in the fayalite matrix [2,73].
Table 9.
Elemental composition and selected properties of AAMs produced under the conditions H2O/Νa2O ratio 12.9, curing temperature 80 °C, curing time 24 h, ageing period seven days.
The AAMs produced using the same synthesis conditions were also characterized with XRD, as seen in Figure 12. The results indicate that the mineralogy of the AAMs produced using different slag median size have no significant differences. The specimens show a typical amorphous (broad hump between 20° and 40° 2θ) to semi-crystalline composition consisting of several crystalline phases, i.e., quartz (SiO2), hedenbergite (Ca(Fe,Mg)(SiO3)2), fayalite (Fe2SiO4), diopside (CaMgSi2O6), magnetite (Fe3O4), and hatrurite (Ca3SiO5).
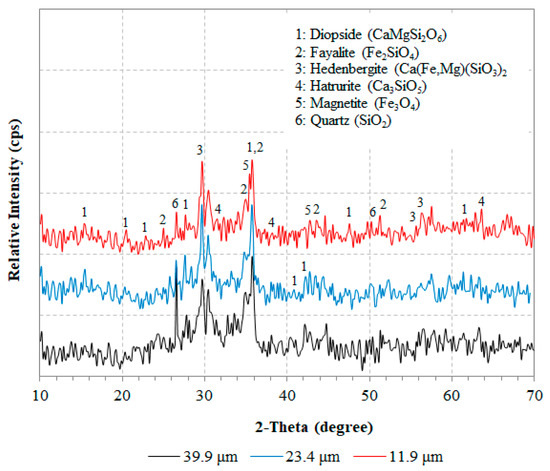
Figure 12.
XRD patterns of produced AAMs when different median sizes of slag particles were used. Synthesis conditions were: molar ratio in the reactive paste H2O/Νa2O 12.9, curing temperature 80 °C, curing time 24 h, ageing period seven days.
4.5.2. Prediction of the Compressive Strength of AAMs
Figure 13 shows the effect of d50 slag particle size and BET specific surface area (SSA) on the compressive strength (CS) of the AAMs produced under the conditions H2O/Νa2O molar ratio 12.9, heating 80 °C, curing period 24 h, and ageing period seven days. Three different median sizes of slag were used, namely 39.9, 23.4 and 11.9 μm corresponding to raw material obtained after 30, 60, and 120 min of grinding, respectively. Table 4 shows the respective values of SSA of the slag grinding products. Simple regression analysis with the use of Excel software was carried out to establish potential correlations between CS and d50, SSA and equations with the highest correlation coefficient R2 were obtained. As seen in Figure 13, very strong correlation between CS and d50 is obtained using inverse exponential equation, while CS is correlated very well with SSA using linear equations. The experimental data were validated with the execution of additional experiments using as raw material slag with a median size 15.2 μm (90 min of slag grinding), and the results are given in Figure 13. The obtained equations are the following
where CS, SSA, and d50 represent compressive strength (MPa), specific surface area (m2/kg), and median size (μm), respectively.
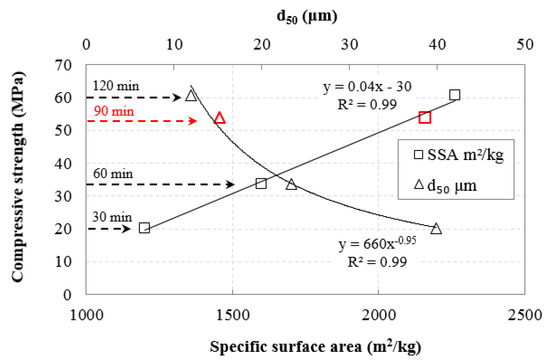
Figure 13.
Correlations between compressive strength of AAMs produced and median size (d50), BET specific surface area of slag.
5. Conclusions
The present experimental study studied the ball mill grinding kinetics of Polish slag in order to produce fractions that after alkali activation can be used for the production of AAMs with beneficial properties.
The results show that the particle size of slag products decreases with increasing grinding time, while particle agglomeration is not observed even after prolonged grinding (120 min). The equivalent particle sizes (EPSs) are very well correlated with grinding time, as derived through the use of inverse exponential functions. It is evident that the size reduction rate of particles is constantly decreasing and after prolonged grinding particle size can reach a constant value which is defined as the grinding limit. Among the different mathematical models used, i.e., Rosin–Rammler, Gates–Gaudin–Schuhmann, and Logistic distributions to simulate the particle size distribution, Rosin–Rammler was found to be the most suitable for the slag products. The piecewise regression analysis by the quasi-Newton nonlinear estimation method showed that the PSDs of slag products exhibit multifractal character. It is seen that when piecewise regression analysis was applied to PSDs higher R2 are obtained compared to single linear regression.
In addition, grinding of slag exhibits non-first-order behavior and the reduction rate of each size is time dependent. The deviation from the first order is more evident for the coarse particles indicating that these particles exhibit higher grinding efficiency than fine particles. Based on breakage rate constant K values, it is shown that grinding efficiency increases when the particle size increases, but drops sharply near zero after prolonged grinding.
The results also indicate that the compressive strength of the produced AAMs is significantly affected by the slag particle size used. The finer particles of the raw slag have larger surface areas and react faster with the activating solution, and thus the produced AAMs acquire higher compressive strength, the maximum value of which reached 60.8 MPa under the conditions slag median size 11.9 μm, H2O/Νa2O 12.9 molar ratio, curing temperature 80 °C, curing period 24 h, and ageing period seven days. Τhe results also indicate that the curing temperature is a crucial parameter during alkali activation, since higher temperatures accelerate activation reactions and thus AAMs with better mechanical properties are produced. The determination of selected properties of the produced AAMs revealed that porosity and water absorption decreased when the slag median size decreased, indicating that these properties have also an impact on the compressive strength. As expected, the apparent density (g/cm3) showed an inverse trend. Finally, correlations between particle size/specific surface area of the raw material and compressive strength of the produced specimens were established.
Author Contributions
E.P. designed and performed the experiments, critically analyzed results and wrote the paper. V.K. carried out experiments and analytical techniques and analyzed data. G.B. carried out SEM analysis and reviewed the paper. K.K. critically reviewed the experimental design, the analysis of the results and wrote the paper.
Funding
This research has received funding from the European Union’s Horizon 2020 research and innovation programme under grant agreement No. 690088.
Conflicts of Interest
The authors declare no conflict of interest.
References
- Mo, L.; Zhang, F.; Deng, M.; Jin, F.; Al-Tabbaa, A.; Wang, A. Accelerated carbonation and performance of concrete made with steel slag as binding materials and aggregates. Cem. Concr. Compos. 2017, 83, 138–145. [Google Scholar] [CrossRef]
- Komnitsas, K.; Bartzas, G.; Karmali, V.; Petrakis, E.; Kurylak, W.; Pietek, G.; Kanasiewicz, J. Assessment of alkali activation potential of a Polish ferronickel slag. Sustainability 2019, 11, 1863. [Google Scholar] [CrossRef]
- Chen, C.; Habert, G.; Bouzidi, Y.; Jullien, A. Environmental impact of cement production: Detail of the different processes and cement plant variability evaluation. J. Clean. Prod. 2010, 18, 478–485. [Google Scholar] [CrossRef]
- Ali, M.; Saidur, R.; Hossain, M. A review on emission analysis in cement industries. Renew. Sustain. Energy Rev. 2011, 15, 2252–2261. [Google Scholar] [CrossRef]
- Maharaj, C.; White, D.; Maharaj, R.; Morin, C. Re-use of steel slag as an aggregate to asphaltic road pavement surface. Cogent Eng. 2017, 4, 1416889. [Google Scholar] [CrossRef]
- Komnitsas, K. Potential of geopolymer technology towards green buildings and sustainable cities. Procedia Eng. 2011, 21, 1023–1032. [Google Scholar] [CrossRef]
- Penpolcharoen, M. Utilization of secondary lead slag as construction material. Cem. Concr. Res. 2005, 35, 1050–1055. [Google Scholar] [CrossRef]
- Komnitsas, K.; Zaharaki, D. Geopolymerisation: A review and prospects for the minerals industry. Miner. Eng. 2007, 20, 1261–1277. [Google Scholar] [CrossRef]
- Komnitsas, K.; Zaharaki, D.; Perdikatsis, V. Geopolymerisation of low calcium ferronickel slag. J. Mater. Sci. 2007, 42, 3073–3082. [Google Scholar] [CrossRef]
- Shi, C.; Meyer, C.; Behnood, A. Utilization of copper slag in cement and concrete. Resour. Conserv. Recycl. 2008, 52, 1115–1120. [Google Scholar] [CrossRef]
- Komnitsas, K.; Zaharaki, D.; Perdikatsis, V. Effect of synthesis parameters on the compressive strength of low-calcium ferronickel slag inorganic polymers. J. Hazard. Mater. 2009, 161, 760–768. [Google Scholar] [CrossRef] [PubMed]
- Mehta, A.; Siddique, R. Sustainable geopolymer concrete using ground granulated blast furnace slag and rice husk ash: Strength and permeability properties. J. Clean. Prod. 2018, 205, 49–57. [Google Scholar] [CrossRef]
- Xu, H.; Van Deventer, J.S.J. The geopolymerisation of alumino-silicate minerals. Int. J. Miner. Process. 2000, 59, 247–266. [Google Scholar] [CrossRef]
- Zaharaki, D.; Komnitsas, K.; Perdikatsis, V. Use of analytical techniques for identification of inorganic polymer gel composition. J. Mater. Sci. 2010, 45, 2715–2724. [Google Scholar] [CrossRef]
- Perera, D.S.; Cashion, J.D.; Blackford, M.G.; Zhang, Z.; Vance, E.R. Fe speciation in geopolymers with Si/Al molar ratio of ∼2. J. Eur. Ceram. Soc. 2007, 27, 2697–2703. [Google Scholar] [CrossRef]
- Zaharaki, D.; Galetakis, M.; Komnitsas, K. Valorization of construction and demolition (C&D) and industrial wastes through alkali activation. Constr. Build. Mater. 2016, 121, 686–693. [Google Scholar]
- Arnold, M.C.; de Vargas, A.S.; Bianchini, L. Study of electric-arc furnace dust (EAFD) in fly ash and rice husk ash-based geopolymers. Adv. Powder Technol. 2017, 28, 2023–2034. [Google Scholar] [CrossRef]
- Peys, A.; White, C.E.; Rahier, H.; Blanpain, B.; Pontikes, Y. Alkali-activation of CaO-FeOx-SiO2 slag. Formation mechanism from in-situ X-ray total scattering. Cem. Concr. Res. 2019, 122, 179–188. [Google Scholar] [CrossRef]
- Komnitsas, K.; Zaharaki, D.; Bartzas, G. Effect of sulphate and nitrate anions on heavy metal immobilisation in ferronickel slag geopolymers. Appl. Clay Sci. 2013, 73, 103–109. [Google Scholar] [CrossRef]
- Alshaaer, M.; Zaharaki, D.; Komnitsas, K. Microstructural characteristics and adsorption potential of zeolitic tuff—Metakaolin geopolymers. Desalin. Water Treat. 2015, 56, 338–345. [Google Scholar] [CrossRef]
- Djordjevic, N. Improvement of energy efficiency of rock comminution through reduction of thermal losses. Miner. Eng. 2010, 23, 1237–1244. [Google Scholar] [CrossRef]
- Petrakis, E.; Stamboliadis, E.; Komnitsas, K. Identification of optimal mill operating parameters during grinding of quartz with the use of population balance modelling. KONA Powder Part. J. 2017, 34, 213–223. [Google Scholar] [CrossRef]
- Herbst, J.A.; Fuerstenau, D.W. Scale-up procedure for continuous grinding mill design using population balance models. Int. J. Miner. Process. 1980, 7, 1–31. [Google Scholar] [CrossRef]
- Austin, L.G.; Klimpel, R.R.; Luckie, P.T. Process Engineering of Size Reduction: Ball Milling; SME–AIME: New York, NY, USA, 1984. [Google Scholar]
- Ipek, H.; Göktepe, F. Determination of grindability characteristics of zeolite. Physicochem. Probl. Miner. Process. 2011, 47, 183–192. [Google Scholar]
- Gupta, V.K.; Sharma, S. Analysis of ball mill grinding operation using mill power specific kinetic parameters. Adv. Powder Technol. 2014, 25, 625–634. [Google Scholar] [CrossRef]
- Katubilwa, F.M.; Moys, M.H. Effect of ball size distribution on milling rate. Miner. Eng. 2009, 22, 1283–1288. [Google Scholar] [CrossRef]
- Deniz, V. The effects of ball filling and ball diameter on kinetic breakage parameters of barite powder. Adv. Powder Technol. 2012, 23, 640–646. [Google Scholar] [CrossRef]
- Olejnik, T.P. Selected mineral materials grinding rate and its effect on product granulometric composition. Physicochem. Probl. Miner. Process. 2013, 49, 407–418. [Google Scholar]
- Shin, H.; Lee, S.; Jung, H.S.; Kim, J.-B. Effect of ball size and powder loading on the milling efficiency of a laboratory-scale wet ball mill. Ceram. Int. 2013, 39, 8963–8968. [Google Scholar] [CrossRef]
- Petrakis, E.; Komnitsas, K. Correlation between material properties and breakage rate parameters determined from grinding tests. Appl. Sci. 2018, 8, 220. [Google Scholar] [CrossRef]
- Mulenga, F.K.; Gharehgheshlagh, H.H.; Chehreghani, S. Assessing the dependency of selection function parameters with batch mill design. Adv. Powder Technol. 2019, 30, 242–251. [Google Scholar] [CrossRef]
- Gupta, V.K. An appraisal of the energy-size reduction relationships for mill scale-up design. Adv. Powder Technol. 2019, 30, 73–84. [Google Scholar] [CrossRef]
- Rajamani, R.K.; Guo, D. Acceleration and deceleration of breakage rates in wet ball mills. Int. J. Miner. Process. 1992, 34, 103–118. [Google Scholar] [CrossRef]
- Bilgili, E.; Scarlett, B. Population balance modeling of non-linear effects in milling processes. Powder Technol. 2005, 153, 59–71. [Google Scholar] [CrossRef]
- Barani, K.; Balochi, H. First-order and second-order breakage rate of coarse particles in ball mill grinding. Physicochem. Probl. Miner. Process. 2016, 52, 268–278. [Google Scholar]
- Harris, C.C. The Alyavdin-Weibull Plot of Grinding Data and the Order of Kinetics. Powder Technol. 1973, 7, 123–127. [Google Scholar] [CrossRef]
- Beke, B. Process of Fine Grinding; Dr. W. Junk Publications: The Hague, The Netherlands, 1981. [Google Scholar]
- King, R.P. Modeling and Simulation of Mineral Processing Systems; Butterworth-Heinemann: Oxford, UK, 2001; p. 416. [Google Scholar]
- Allen, T. Powder Sampling and Particle Size Determination; Elsevier: Amsterdam, The Netherlands, 2003; p. 682. [Google Scholar]
- Millán, H.; González-Posada, M.; Aguilar, M.; Domı́nguez, J.; Céspedes, L. On the fractal scaling of soil data. Particle-size distributions. Geoderma 2003, 117, 117–128. [Google Scholar] [CrossRef]
- Zhong, W.; Yue, F.; Ciancio, A. Fractal behavior of particle size distribution in the rare earth tailings crushing process under high stress condition. Appl. Sci. 2018, 8, 1058. [Google Scholar] [CrossRef]
- Menéndez-Aguado, J.M.; Peña-Carpio, E.; Sierra, C. Particle size distribution fitting of surface detrital sediment using the Swrebec function. J. Soils Sediments 2015, 15, 2004–2011. [Google Scholar] [CrossRef]
- Osorio, A.M.; Menéndez-Aguado, J.M.; Bustamante, O.; Restrepo, G.M. Fine grinding size distribution analysis using the Swrebec function. Powder Technol. 2014, 258, 206–208. [Google Scholar] [CrossRef]
- Taşdemir, A.; Taşdemir, T. A comparative study on PSD models for chromite ores comminuted by different devices. Part. Part. Syst. Charact. 2009, 26, 69–79. [Google Scholar] [CrossRef]
- Lu, P.; Jefferson, I.F.; Rosenbaum, M.S.; Smalley, I.J. Fractal characteristics of loess formation: Evidence from laboratory experiments. Eng. Geol. 2003, 69, 287–293. [Google Scholar] [CrossRef]
- Turcotte, D.L. Fractals and fragmentation. J. Geophys. Res. 1986, 91, 1921–1926. [Google Scholar] [CrossRef]
- Taşdemir, A. Fractal evaluation of particle size distributions of chromites in different comminution environments. Miner. Eng. 2009, 22, 156–167. [Google Scholar] [CrossRef]
- Petrakis, E.; Stamboliadis, E.; Komnitsas, K. Evaluation of the relationship between energy input and particle size distribution in comminution with the use of piecewise regression analysis. Part. Sci. Technol. 2017, 35, 479–489. [Google Scholar] [CrossRef]
- Kierczak, J.; Neel, C.; Puziewicz, J.; Bril, H. The Mineralogy and weathering of slag produced by the smelting of lateritic Ni ores, Szklary, Southwestern Poland. Can. Miner. 2009, 47, 557–572. [Google Scholar] [CrossRef]
- Ferraris, C.; Garboczi, E.J. Identifying improved standardized tests for measuring cement particle size and surface area. Transport. Res. Rec. 2013, 2342, 10–16. [Google Scholar] [CrossRef]
- De Boer, G.B.J.; de Weerd, C.; Thoenes, D.; Goossens, H.W.J. Laser diffraction spectrometry: Fraunhofer diffraction versus Mie scattering. Part. Part. Syst. Charact. 1987, 4, 138–146. [Google Scholar] [CrossRef]
- Xu, R. Particle Characterization: Light Scattering Methods; Kluwer Academic: Dordrecht, The Netherlands, 2002. [Google Scholar]
- Kuila, U.; Prasad, M. Specific surface area and pore-size distribution in clays and shales. Geophys. Prospect. 2012, 61, 341–362. [Google Scholar] [CrossRef]
- British Standards Institute. BS EN 1936: Natural Stone Test Methods. Determination of Real Density and Apparent Density and of Total and Open Porosity; NP EN 1936:2006; BSI: London, UK, 2007. [Google Scholar]
- Kaya, E.; Hogg, R.; Kumar, S.R. Particle shape modification in comminution. KONA Powder Part. J. 2002, 20, 188–195. [Google Scholar] [CrossRef]
- Hogg, R.; Turek, M.L.; Kaya, E. The Role of Particle Shape in Size Analysis and the Evaluation of Comminution Processes. Part. Sci. Technol. 2004, 22, 355–366. [Google Scholar] [CrossRef]
- Petrakis, E.; Komnitsas, K. Effect of energy input in a ball mill on dimensional properties of grinding products. Min. Metall. Explor. 2019, 36, 803–816. [Google Scholar] [CrossRef]
- Bailon-Poujol, I.; Bailon, J.-P.; L’Espérance, G. Ball-mill grinding kinetics of master alloys for steel powder metallurgy applications. Powder Technol. 2011, 210, 267–272. [Google Scholar] [CrossRef]
- Zhao, J.; Wang, D.; Yan, P.; Li, W. Comparison of grinding characteristics of converter steel slag with and without pretreatment and grinding aids. Appl. Sci. 2016, 6, 237. [Google Scholar] [CrossRef]
- Austin, L.G.; Bagga, P. An analysis of fine dry grinding in ball mills. Powder Technol. 1981, 28, 83–90. [Google Scholar] [CrossRef]
- Fuerstenau, D.W.; Phatak, P.B.; Kapur, P.C.; Abouzeid, A.-Z.M. Simulation of the grinding of coarse/fine (heterogeneous) systems in a ball mill. Int. J. Miner. Process. 2011, 99, 32–38. [Google Scholar] [CrossRef]
- Knieke, C.; Sommer, M.; Peukert, W. Identifying the apparent and true grinding limit. Powder Technol. 2009, 195, 25–30. [Google Scholar] [CrossRef]
- Carpinteri, A.; Pugno, N. A fractal comminution approach to evaluate the drilling energy dissipation. Int. J. Numer. Anal. Methods Geomech. 2002, 26, 499–513. [Google Scholar] [CrossRef]
- Mandelbrot, B.B. The Fractal Geometry of Nature; Freeman: New York, NY, USA, 1982. [Google Scholar]
- Austin, L.G.; Yekeler, M.; Dumm, T.F.; Hogg, R. The kinetics and shape factors of ultrafine dry grinding in a laboratory tumbling ball mill. Part. Part. Syst. Charact. 1990, 7, 242–247. [Google Scholar] [CrossRef]
- Hogg, R. Issues in particle size analysis. KONA Powder Part. J. 2008, 26, 81–93. [Google Scholar] [CrossRef][Green Version]
- Traven, K.; Češnovar, M.; Ducman, V. Particle size manipulation as an influential parameter in the development of mechanical properties in electric arc furnace slag-based AAM. Ceram. Int. 2019, 45, 22632–22641. [Google Scholar] [CrossRef]
- Heah, C.Y.; Kamarudin, H.; Mustafa, A.L.; Bakri, A.M.; Binhussain, M.; Luqman, M.; Khairul Nizar, I.; Ruzaidi, C.M.; Liew, Y.M. Effect of Curing Profile on Kaolin-based Geopolymers. Phys. Procedia 2011, 22, 305–311. [Google Scholar] [CrossRef]
- Yahya, Z.; Abdullah, M.M.A.B.; Hussin, K.; Ismail, K.N.; Razak, R.A.; Sandu, A.V. Effect of Solids-To-Liquids, Na2SiO3-To-NaOH and Curing Temperature on the Palm Oil Boiler Ash (Si+Ca) Geopolymerisation System. Materials 2015, 8, 2227–2242. [Google Scholar] [CrossRef]
- Yip, C.K.; Lukey, G.C.; Van Deventer, J.S.J. Coexistence of geopolymeric gel and calcium silicate hydrate at the early stage of alkali activation. Cem. Concr. Res. 2005, 35, 1688–1697. [Google Scholar] [CrossRef]
- Peng, H.; Cui, C.; Liu, Z.; Cai, C.S.; Liu, Y. Synthesis and reaction mechanism of an alkali-activated metakaolin-slag composite system at room temperature. J. Mater. Civ. Eng. 2019, 31, 04018345. [Google Scholar] [CrossRef]
- Parbhakar-Fox, A.; Gilmour, S.; Fox, N.; Olin, P. Geometallurgical Characterization of Non-Ferrous Historical Slag in Western Tasmania: Identifying Reprocessing Options. Minerals 2019, 9, 415. [Google Scholar] [CrossRef]
© 2019 by the authors. Licensee MDPI, Basel, Switzerland. This article is an open access article distributed under the terms and conditions of the Creative Commons Attribution (CC BY) license (http://creativecommons.org/licenses/by/4.0/).