Acid and Thermal Treatment of Alkali-Activated Zeolite Foams


Unipetrol Centre for Research and Education, a.s, Areál Chempark 2838, Záluží 1, 436 70 Litvinov, Czech Republic
*
Author to whom correspondence should be addressed.
Minerals 2019, 9(12), 719; https://doi.org/10.3390/min9120719
Submission received: 17 October 2019
/
Revised: 13 November 2019
/
Accepted: 18 November 2019
/
Published: 20 November 2019
(This article belongs to the Special Issue Alkali Activated Materials: Advances, Innovations, Future Trends)
Abstract
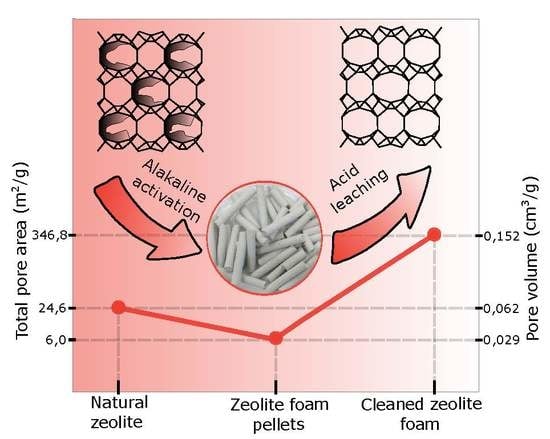
:The foamed alkali-activated zeolite materials have been studied primarily in terms of mechanical and structural properties as potential substitutes for concrete and other building materials. However, they also have interesting textural and acid properties that make them much more useful, especially in the chemical industry. The aim of the study is to map in detail the influence of post-synthesis modifications of alkali-activated natural zeolite foams on their chemical, mechanical, and textural properties for possible use in catalytic and adsorption applications. Alkali-activated natural zeolite foam pellets were prepared by activation with mixed potassium hydroxide and sodium silicate activator and foamed using H2O2 solution. The foam pellets were post-synthetic modified by leaching with mineral and organic acids and calcination. The properties of the modified materials were characterised on the basis of XRF, XRD, N2 physisorption, DRIFT, SEM, NH3-TPD analyses, and the strength measurements. Our data showed that the basic clinoptilolite structure remains unchanged in the material which is stable up to 600 °C after acid leaching. In two-step leaching, the specific surface area increases to 350 m2/g and the leaching process allows the acid properties of the materials to be varied.
1. Introduction
Alkali-activated foamed zeolites represent a new group of materials potentially useful in the chemical industry, especially in the field of catalysis and sorption. The use of the zeolite materials is limited primarily to building applications, especially as a substitute for concrete, ceramic materials, and thermal insulation. Natural zeolites are mainly used as sorbents for the purification of water (Cs+, Rb+, and NH4+) and gases (NH3) [1,2]. Alkali-activated materials are similar to zeolites but have an amorphous structure and do not form crystalline structures as do zeolites. In the case of alkaline activation of metakaolin (geopolymerization), the original layered structure is completely dissolved, and a new amorphous network is formed. The amorphous network is formed by an N(K)–A–S–H matrix exhibiting zeolite-like properties. In contrast, alkaline activation of natural zeolites containing predominantly clinoptilolite produces a composite material composed of the original structure and the binder N(K)–A–S–H matrix from the original zeolite (clinoptilolite). The N(K)–A–S–H matrix is formed by dissolving the surface of the individual grains and the accompanying minerals which in the case of natural zeolites are other aluminosilicate minerals such as feldspars, mica, and clays [3].
Clinoptilolite is a zeolite from the heulandite group. Both zeolites (clinoptilolite and heulandite) are isostructural and are distinguished by the Si/Al ratio, where a mineral with a Si/Al ratio greater than 4 is called clinoptilolite. The zeolite grid consists of tetrahedrons [SiO4] and [AlO4]−.Tetrahedrons are organized into porous structures formed by a system of interconnected channels. The clinoptilolite contains three types of these channels. Two types of the channels are a parallel eight-member ring and 10-member ring, and the third type eight-member ring intersects them [4]. The pore structure of natural zeolites is not perfect, pores are not perfectly developed or are blocked by accompanying minerals (spar, mica, clays, etc.) or amorphous SiO2 structures that have formed during hydrothermal synthesis of the zeolitic rock [5]. Pore blocking is particularly evident on the low specific surface area of natural zeolites, which is usually in the range of units up to several tens of m2/g [6]. However, these pores can be purified and made available by methods such as acid leaching [7,8,9]. Purified and available pores make the material usable in other applications. Acid leaching can also be used to prepare materials obtained by alkaline activation of metakaolin [10,11,12] or natural zeolites [3].
Acid leaching (dealumination) is often used for post-synthesis modification of synthetic zeolites to remove framework aluminium (FAL) and thereby increase the Si/Al molar ratio. Most commonly, strong mineral acids (HCl, HNO3, H2SO4) or organic acids (oxalic, citric) [13] are used. Organic acids simultaneously act as chelating agents and are usually more effective to remove Al from the structure. The removal of Al often leads to a disruption of the zeolite structure and the formation of octahedral coordinated extra framework aluminium (EFAL) inside the pores [14]. EFAL creates strong acid Lewis centres formed by AlO+, Al(OH)2+, and Al(OH)2+ groups [15]. Brønsted acidity of zeolites is generally attributed to bridging hydroxyl groups (Si–(OH)–Al). Therefore, the concentration of the Brønsted sites is directly related to the number of FAL atoms [16,17]. Acid leaching in the material creates another additional mesoporosity which is important for the transport of larger molecules. Easier permeability is supported by the presence of macropores formed in the preparation of zeolite foam by foaming of the alkali-activated mixture with powder metals or hydrogen peroxide solution. In the reaction of powder metals or hydrogen peroxide solution (strong alkaline medium), gases are evolved and thus the mixture is foamed [3,18].
The aim of the work was to find out the influence of acid leaching, especially the influence of time, temperature, leaching method and the concentration of hydrochloric acid, including leaching with other organic and mineral acids, on chemical, mechanical, and textural properties of foamed zeolites. An equally important parameter in the field of catalysis is the thermal resistance of the catalyst support and therefore the influence of the calcination temperature of the zeolite foam on the mentioned properties was studied. The post-synthetic modification will make it possible to increase the potential of these materials for further, not only constructional use, namely in catalytic and sorption applications.
2. Materials and Method
2.1. Materials
Analytical grade potassium hydroxide, hydrogen peroxide (30 wt %), hydrochloric acid (35 wt %), phosphoric acid (85 wt %), sulphuric acid (98 wt %), nitric acid (65 wt %), oxalic acid (OXAL), tartaric acid (TART), and citric acid (CITR) were supplied by Lach-Ner s.r.o. Sodium silicate (Na—water glass) with silicate modulus 3.22 was purchased from Labar s.r.o. in a technical grade purity. The powdered natural zeolite from the Swiss company Unipoint AG (Ossingen, Switzerland) with the trade name Klinofeed® (KLI) and with the particle size distribution d50 = 28.9 and d90 = 73.8 μm was used for the preparation of the samples. The particle size distribution was determined by MASTERSIZER 2000 with HYDRO 2000 MU (Malvern Panalytical, Malvern, UK).
Klinofeed® contains at least 85 wt% of clinoptilolite, other minor mineral components present in Klinofeed® are clays (9 wt %), feldspar (4 wt %), mica (2 wt %). The specific surface area of this natural zeolite is 24.6 m2/g. The chemical composition was obtained by the XRF method and is shown in Table 1.
2.2. Synthesis of Zeolite Foams
The pellets of the zeolite foam were obtained by the same procedure described in our previous publication [3] and the zeolite foam pellets were produced by the method described in the CZ 307364 patent. The natural zeolite (400 g) was activated using a mixed activator (KOH solution with a water glass) and foamed with a hydrogen peroxide solution. Parameters of the alkaline activator and the mixture:
| Ms = (SiO2)/(Me2O) = 1.51 |
| w = mwater/mnatural zeolite = 0.7 |
| Me2O = 8.2 wt % (Me = K + Na) |
| Na2O: K2O = 0.56 |
| 0.125 wt % |
*Silicate modulus (Ms) is the molar ratio of SiO2 to Me2O (Me = Na, K).
**Water coefficient (w) is the weight of the aluminosilicate compound (natural zeolite) to the weight of water in a mixture.
The foam was shaped into pellets of 5 mm in diameter, and the material was activated for 48 h at 50 °C. Prepared pellets (Figure 1) were aged under laboratory conditions in a closed plastic bag for one month prior to further processing. A prepared sample is designated “S”.
2.3. Post-Synthesis Modifications of Zeolite Foams
The sample of prepared foam pellets (S) was first dried overnight at 120 °C, then, part of them was leached in a beaker with a stirrer at 40 °C to 80 °C using 0.1–6.0 M HCl for 1 to 6 h. The solution ratio (g/mL) of the foam was 1:20 for all samples. The samples were after leaching washed under the flow of demineralized water until reaching neutral pH and then dried at 120 °C overnight. The samples of this series were denoted as “temperature (40–80 °C)/time of leaching (1–6 h)/concentration of HCl (0.1–6 M)”, e.g., 80/6/0.1 was the sample leached at 80 °C for 6 h by 0.1 M HCl. The other part of pellets was leached by “two-step” acid leaching with a combination of 0.1 and 3 M HCl (80 °C/6 h). The sample was denoted as 0.1 M + 3 M. The second part of pellets was leached by different mineral and organic acids with 1 M concentration at 80 °C for 6 h. The samples were denoted as “acid (H3PO4, H2SO4, HNO3, OXAL, CITR, TART)”. The two-step leached samples were subsequently calcined from 300 to 1000 °C for 6 h (heating rate 1 °C/min). The samples were denoted as “120” for dried 0.1 M + 3 M or “calcination temperature 300–1000 °C” for calcined samples.
2.4. Characterisation
The chemical composition of foams was determined by X-ray fluorescence analysis (XRF) using S8 Tiger (Bruker AXS GmbH, Karlsruhe, Germany) with Rh cathode. The results were processed by Spectra plus software (Version 3).
The crystal phase identification was performed by X-ray diffraction (XRD) analysis and the crystallinity at 2θ 9.9° [020] was determined. The instrument D8 Advance ECO powder diffractometer (Bruker AXS GmbH, Karlsruhe, Germany) was used for XRD with CuKα radiation (λ = 1.5406 Å). The resolution of 0.02° and the period of 0.5 were used. The measurements were performed over a 2θ range of 5° to 70° and evaluated by the Diffrac.EVA software (Bruker AXS GmbH, Karlsruhe, Germany) using the Powder Diffraction File Database (PDF 4 + 2018, International Centre for Diffraction Data, Newtown Square, PA, USA).)
The textural properties were determined by N2 physisorption at −196 °C using an Autosorb iQ (Quantachrome Instruments, Boynton Beach, FL, USA) and by mercury porosimetry using an AutoPore IV 9510 (Micromeritics Instrument Corporation, Norcross, GA, USA). The specific surface area (BET) was determined by N2 adsorption/desorption. Samples for BET were dried under vacuum before the analysis. Drying was carried out in glass cells at 110 °C and drying of the calcined samples at 200 °C for 16 h. Macroporous properties were determined using mercury porosimetry. Samples for mercury porosimetry were dried under vacuum at 110 °C for 16 h.
SEM images were obtained by scanning electron microscope (SEM) JSM-7500F (JEOL Ltd., Tokyo, Japan) with a cold cathode-field emission SEM with parameters of measurements 1 kV and GB high mode.
Diffuse reflectance infrared Fourier transform spectroscopy (DRIFT) of dried and calcined samples was obtained using Nicolet iS 10 (Thermo Scientific, Waltham, MA, USA). The sample (15 mg) was mixed with 300 mg of KBr and analysed. The parameters of the analysis were: Number of scans 128 and resolution 2 cm−1. Gaussian deconvolution of broadband at approximately 850–1350 cm−1 was used for a detailed analysis of the measured data.
The strength in the cutting edge was measured on 10 samples using UMZ-3k (Micro-Epsilon, Bechyně, Czech Republic) with a corresponding trapezoidal flat blade attachment (area size 1 mm). Maximum strength parameter 375 N, load speed 10 mm/min. Results were obtained by statistical data processing.
The acid properties of the samples were determined by ammonia temperature-programmed desorption (NH3-TPD) using Autochem 2950 HP device (Micromeritics Instrument Corporation, Norcross, GA, USA). Powdered sample (100 mg) was weighed into a quartz tubular reactor with a quartz wool plug. First, the sample was pre-treated by heating to 450 °C (heating rate 10 °C/min) in the flow of pure helium (flow rate 25 mL/min). After reaching 450 °C, the sample was cooled down to 100 °C. Then, the sample was saturated with ammonia by a flowing gas mixture containing 90 vol % of He and 10 vol % of ammonia (flow rate 25 mL/min) for 30 min. Weakly bounded NH3 molecules were removed by flushing the sample out in the flow of helium (25 mL/min) for 15 min. Finally, NH3-TPD experiment was carried out by increasing the temperature from 100 °C to 450 °C (heating rate 10 °C/min). The desorbed ammonia in the outlet gas was detected using TCD detector.
3. Results and Discussion
The alkaline activation of natural zeolites with the mixed KOH activator and Na—water glass and subsequent foaming of the alkaline activated mixture resulted in the formation of inorganic materials which are structurally similar to geopolymers. Due to the gradual decomposition of hydrogen peroxide in a strongly alkaline medium (Equation (1)), the released oxygen caused foaming of the mixture and the formation of macroporous materials. The textural properties of the macroporous materials can be changed by post-synthetic modifications.
2 H2O2 (l) → 2 H2O (l) + O2 (g)
3.1. Influence of Acid Leaching
One of the possibilities of influencing the textural, chemical, and mechanical properties of the samples is leaching with different types of acids under different conditions such as leaching temperature, leaching time or concentration, and the type of the acid. The influence of individual parameters was studied by several characterization techniques and showed advantages and disadvantages of individual procedures.
The chemical composition of samples was determined by X-ray fluorescence (XRF) and is shown in Table 2. It is clear from the results that the concentration, type of the acid, temperature, and the leaching time had a crucial effect on the resulting chemical properties of the modified samples.
The degree of removal of other elements from the material is expressed by the modified silicate modulus (MSi) (Equation (2)).
The results in Table 2 show that increasing temperature, leaching time, and concentration of hydrochloric acid increased the number of extracted components from the zeolite foam. The extracted components were indicated by the MSi parameter and by the Si/Al molar ratio which increased from the original value of 4.96 to 19.07 using 6 M HCl. The use of varying concentrations of HCl showed that if weakly concentrated HCl (up to 0.5 M) is used, only free alkali, especially sodium and potassium, supplied in the alkaline activator, were neutralized. All other elements (Ca, Fe, Al, Mg), including potassium contained in the Klinofeed® feedstock, were removed with the use of stronger acids. The influence of leaching time and the temperature was not significant. Using 3 M HCl, the MSi parameter sharply increased from the original value of 4.96 to 23.07 after the first hour of leaching (Table 2). The increase in the MSi parameter indicated that Na and K were easily and rapidly leached from the material and the process resulted in the removal of most of sodium and potassium. The Si/Al ratio was raised by about ½. During the next leaching, a gradual decrease in the content of all elements was observed. The similar trend was observed when the leaching temperature was changed. At temperatures of 40 °C and 60 °C only Na and K were removed. A more significant decrease in other elements, especially Al and Fe, was observed only at 80 °C. During acid leaching, a material loss occurred. While leaching, 0.1 M HCl eliminated approximately 10 wt % of the material. When using more concentrated acid, the decrease was not so significant, e.g., when using 3 M HCl, the decrease was only 13 wt %. It follows that the excess alkaline activator (Na and K silicates and hydroxides) was removed before the zeolite matrix itself was leached. With the increasing temperature the removing of other elements began, and the Msi parameter and the Si/Al ratio gradually increased. Leaching with 3 M HCl at 60 °C for 6 h had a very similar effect to leaching at 80 °C for 2 h. There were no distinct differences in the chemical composition when using two-step leaching compared to the use of 3 M HCl. However, the differences were particularly evident in textural properties. Hydrochloric acid has been chosen for foam leaching tests because of its ability to remove iron from the samples. For comparison, tests with other mineral and simple organic acids were also performed at the initial concentration of 1 M. From the point of view of the chemical composition, it can be seen that the mineral acids H2SO4 and HNO3 gave similar results in terms of Si/Al ratio, but a lesser K and Fe removal effect was observed. Weak acids only neutralized free alkalis from alkaline activator and H3PO4 also partly removed calcium (Table 2). The use of H2SO4 and H3PO4 resulted in the zeolite foam contaminated with sulphur (in the form of sulphates) or phosphorus (in the form of phosphates). The contamination by sulphur and phosphate is undesirable for most possible catalytic and sorption applications. The samples additionally contained 0.21 wt % S or 0.23 wt % P.
The organic acids such as CITR and TART had a very similar effect to H3PO4 (Table 2). The oxalic acid was the most effective for the removal of aluminium. The removal of aluminium was evident in the Si/Al ratio which increased from 7.43 to 12.12 compared to the sample leached with 1 M HCl. The MSi parameter was only 11.62 in the sample which was due to a lower rate of potassium and especially of calcium elimination. Calcium forms a water-insoluble Ca-oxalate by reaction with oxalic acid which remains trapped in the pores of the aluminosilicate foam and blocks their further purification.
The crystalline structure specified by X-Ray powder diffraction (XRD) showed clinoptilolite as the main crystalline phase with typical reflections at 2θ 9.9°, 11.2°, 17.5°, and 22.4°. The XRD also showed other minor components that belong to mineralogical groups of clays, feldspar, and mica (Figure 2). The crystallinity decreased with increasing leaching time, temperature, and concentration of acid during leaching. However, the powder diffraction patterns show that the basic zeolite structure always remained. The exception was the samples leached using 6 M HCl where a collapse of the zeolite structure occurred, and the powder diffraction pattern displayed only a reflection of quartz and accompanying minerals (Figure 2a). The comparison of the sample’s crystallinity with the original natural zeolite showed that a decrease (approximately 40%) of crystallinity (2θ 9.9°, [020]), due to the alkaline activation occurred. On the other hand, the alkaline activation simultaneously increased the intensity of the second most significant reflection (2θ reflection 11.2°, [200]) because of the higher electron density in the crystal plane. The higher electron density was caused by the presence of sodium and potassium cations. The relative ratio of these two reflections (2θ 11.2°/9.9°) was 0.4 (PDF 83–1261) for clinoptilolite. The ratio increased to 0.9 in case of zeolite foam (sample “S”), and gradually decreased to the original value 0.4 to 0.5 with increasing concentration of leaching acid. This value was achieved using the concertation higher than 2 M HCl. The decrease was visible in the results of the XRF analysis and the Na and K content decreased with increasing acid concentration. There was an increase in crystallinity using low concentration acid (0.1 M to 1 M), compared to sample “S” (Figure 2a). The increase of crystallinity is related to the removal of amorphous structures formed from excess of alkaline activator (sodium and potassium silicates) on the surface of formed zeolite foam.
A similar effect was observed using 3 M HCl at leaching temperature of 40 °C (Figure 2c). The leaching time did not have a significant effect on the crystallinity and the values of the crystallinity were almost constant after 1 h (Figure 2b). The use of other acids did not have a substantial effect on the crystalline structure. A significant decrease was observed only with the use of oxalic acid. The decrease of crystallinity was associated with a high increase of Si/Al ratio and thereby disruption of the zeolite structure. There were significant intensities at 2θ 14.9°, 24.3°, and 30.1° pertaining to Ca-oxalate, in the XRD patterns of OXAL sample which was formed by leaching calcium from the zeolite structure (Figure 2d).
The DRIFT method, which was used to determine the sample structure, showed only small differences between the natural zeolite and the prepared foam samples (Figure 3). Bands characteristic for aluminosilicates and alkali-activated materials are visible in the DRIFT spectra [19,20,21,22,23]. In the measured spectra, there was a typical broadband (3400–3700 cm−1) related to the stretching vibration of bridged hydroxyl groups (Si–OH) in zeolite channels [24]. The intensity of this broadband increased with increasing acid concentration, leaching time, and temperature (Figure 3a–c) due to the increase in OH groups content. The increase in the amount of –OH groups was because of acid leaching and the formation of new silanol and aluminol sites (nests). In the case of the use of other mineral and organic acids with a concentration of 1 M, the differences in the band intensity were not significant (Figure 3d). The band around 1600 cm−1 corresponded to vibration of –OH groups in water. Band 470 cm−1 belonged to the Si–O–Si bending vibrations. The Sample “S” showed the vibrations of carbonates produced by air-ageing of foam (880 and 1420–1460 cm−1).
The main band of aluminosilicate materials was located at 850–1300 cm−1 and was related to the asymmetric stretching vibrations of the Si–O–T group (T = Si or Al) that were formed by tetrahedral units [SiO4] and [AlO4]− of a zeolite and geopolymer network. The band around 1060–1090 cm−1 was attributed to the asymmetric stretching of Si–O–Al and Si–O–Si bonds in the natural zeolite (Klinofeed®). The location of the main band was almost the same for natural zeolites and alkaline-activated zeolite foams (S). This suggested that there are no structural changes in the zeolite after alkaline activation. Acid leaching caused the shift of the band to 1090 cm−1 (Figure 4a). The band shift is related to the loss of aluminium in the structure, the change in the Si–O–Si angle and the change in the strength of the bends [9,21]. The band observed around 1200 cm−1 can be related to external vibrations of the TO4 tetrahedron [25]. The reduction of this band was observed using more than 0.5 M HCl (Figure 3a). The high-frequency shoulder of the clinoptilolite band complex can be also assigned to vibrations between Si–O(Si) neighbours [26]. Our results of acid leaching showed that the band around 1200 cm−1 was related to vibrations between Si–O(Si) neighbours, due to the increase in the intensity of this band during acid leaching. With the increasing acid concentration, the amount of leached aluminium and the intensity of this band increased (Figure 3a).
The intensity of these bands increased in the same manner as the silanol band. Two bands of different vibrations of Al–O–Si (800 cm−1 bending vibrations, 610 cm−1 stretching vibrations) were noticeable in the spectra. The intensity of the band around 800 cm−1, its intensity did not change much during post-synthesis treatments, however the band intensity of 610 cm−1 decreased with increasing HCl concentration (Figure 3a). This was the effect of dissolution of aluminium from foams. The loss was not observed after leaching with diluted HCl. In the case of the OXAL sample, the band of 1330 cm−1 apparently belongs to the vibrations of C–O– present in the calcium oxalate formed by leaching the sample using 1 M oxalic acid [27].
The deconvolution of the peaks in the wavenumber range of 850–1350 cm−1 (Figure 4a) showed a band shift corresponding to asymmetric vibrations of the Si–O–T groups. The band shift was from the original value of 1060 (1057 cm−1) to 1080–1092 cm−1 depending on the concentration of acid, for sample “S”. This shift corresponded to the loss of aluminium from the matrix (reduction of Si–O–Al units). At the same time the intensity of the band 1210–1215 cm−1 increased. For sample “S”, this band was shifted to 1203 cm−1. The shift was related to the structural disruption due to alkaline activation, and the surface covering with amorphous components of the unreacted alkaline activator.
The comparison of the effect of leaching using 1 M acids showed only slight differences in the band displacement. The band was shifted from 1060 to 1073–1077 cm−1 for weak acids (organic acids—TATR, CITR, and mineral acids—H3PO4). Strong mineral acids and OXAL moved the band to 1082–1085 cm−1. The shift was proportional to the aluminium content of a sample (Table 2). The band about 1215 cm−1 was most intensive using 1 M HCl (Figure 4a). HCl is the most efficient acid for removing other elements (Al, Na, K, Fe, Mg) during acid leaching that had HCl. This effect was demonstrated by the MSi parameter (Table 2) and was also observed directly during sample preparation at different colour intensity of the mother liquor.
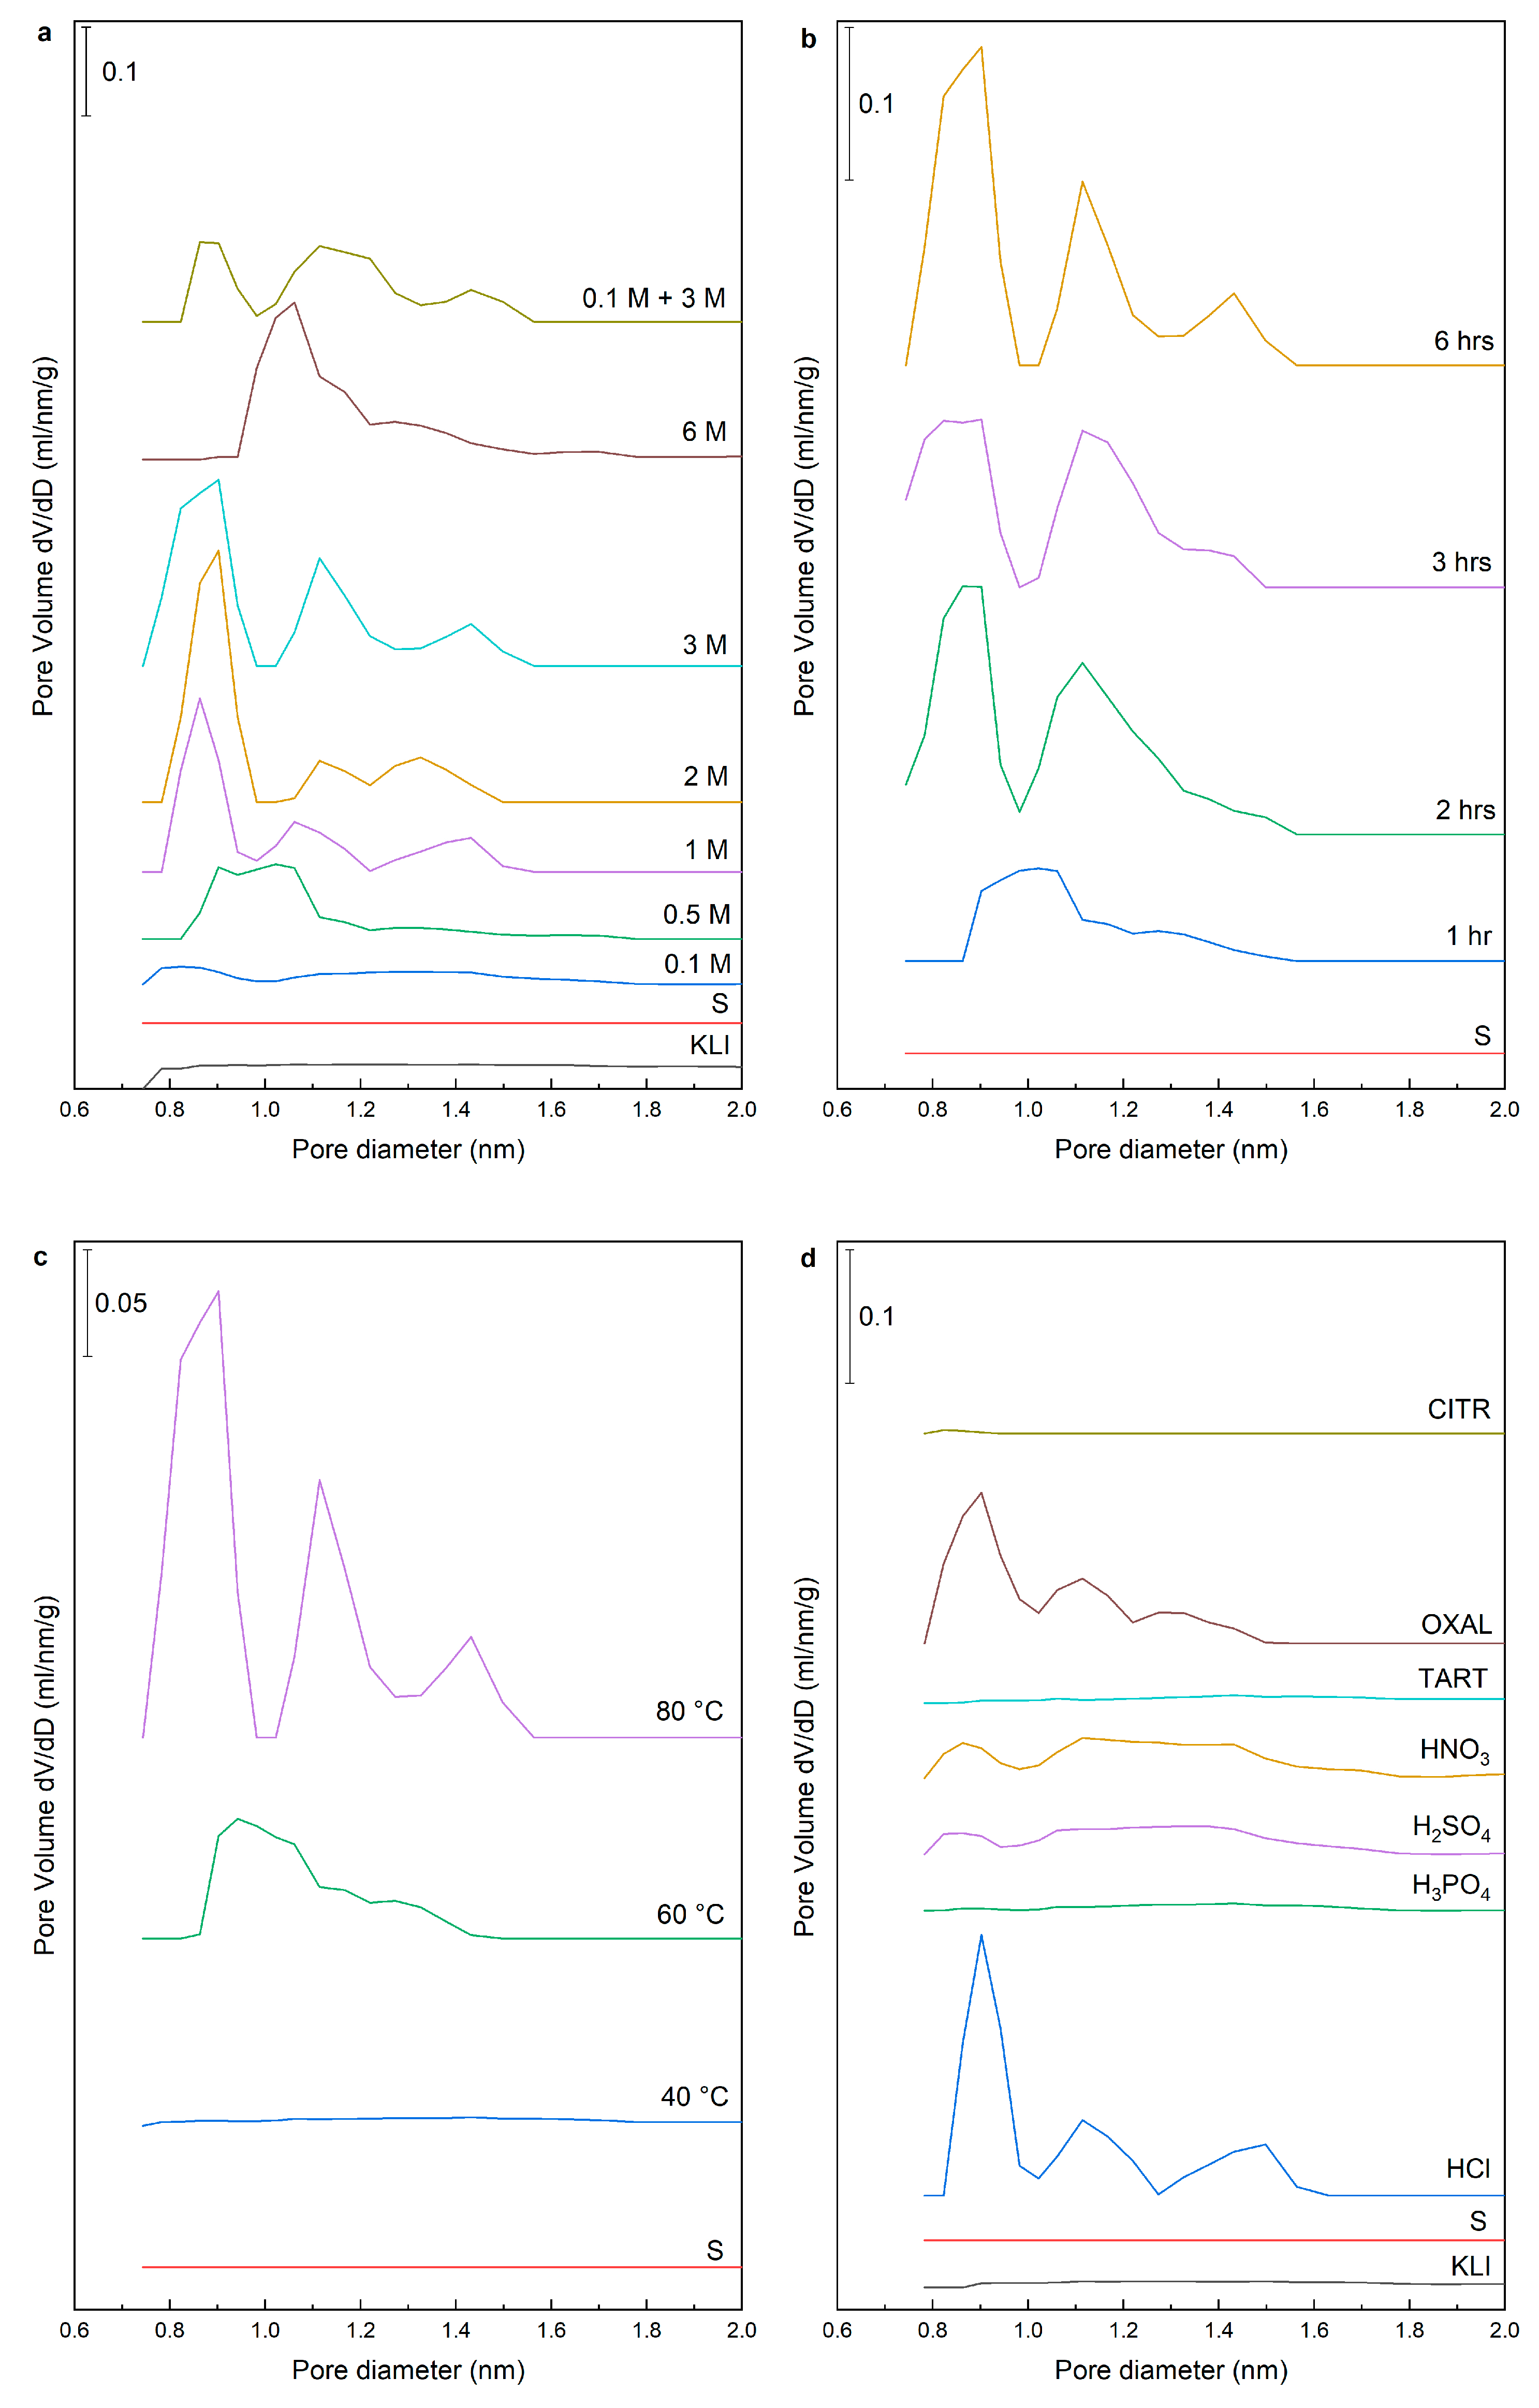
The textural properties were studied by N2 physisorption and macroporous structure also by mercury porosimetry. The mercury porosimetry showed a relatively large dispersion of total intrusion volume due to macroporous inhomogeneity of individual samples, and also some measurement error caused by the presence of macropores (hundreds of micrometres). As previously published in the article [3], the material mainly contains four pore size groups. These four groups include micropores with a size up to 2 nm, mesopores transitioning smoothly into macropores with size up to 150 nm, as well as macropores of characteristic size hundreds of nm up to 1 μm, and “supermacropores” with a typical size of tens to hundreds of micrometres. While the natural zeolite Klinofeed® had a small specific surface area and contained only mesopores, a detailed evaluation of the N2 physisorption data of the leached samples (Table 3) showed a significant increase in the total specific surface area and pore volume, depending on the increase of acid leaching concentration. The increase of surface area was caused by cleaning and purifying the micropores present in the zeolite and binder matrix. The specific surface area increased from 6 m2/g for the sample “S” to 282 m2/g for the sample leached using 3 M HCl, and almost 350 m2/g for the sample leached in two-step leaching using 0.1 M and 3 M HCl (Table 3). The same trend was observed in the total pore volume where larger volume of micropores was obtained when acid with the concentration above 0.5 M was used. First, wide micropores were leached (size about 1 nm) but differentiation to micropores with a characteristic size from 0.8 to 0.9 nm, 1.0 to 1.1 nm, and micropores from 1.3 nm to 1.5 nm were evident when using acid with concentration higher than 1 M (Figure 5a). When a sample was leached with 6 M HCl, the zeolite structure was disrupted, which was accompanied by the decrease in specific surface area, but also in the distribution of micropores where the collapse of individual types of micropores was distinct and their merging into wide micropores (size from 1.0 nm to 1.5 nm).
The better cleaning of pores was achieved with increasing the leaching time using 3 M HCl (Figure 5b). The samples leached with 3 M HCl at 40 °C did not contain any micropores. Moreover, there was no significant cleaning of pores at 60 °C and the structure was similar to a sample leached using 0.5 M HCl (Figure 5c). The results for other acids indicated that only oxalic acid was able to remove the micropores even though they are partially blocked by insoluble Ca-oxalate. The OXAL sample had a microporous structure with well-purified micropores but with a less sharp distribution of micropores than with HCl. Partial purification was achieved also with 1 M HNO3 and 1 M H2SO4. Other acids did not affect the microporous structure (Figure 5d).
When leaching using different concentration of acids, the volume of mesopores increased two or three times compared to the original sample “S” and was not significantly dependent on the concentration of the acid (Table 3). The exception was the sample “0.1 M + 3 M” prepared by two-step leaching using 0.1 and 3 M HCl, and later used to determine the effect of calcination. Another exception was the OXAL sample leached using 1 M oxalic acid where the increase in mesopore volume was almost four times higher. The increase of the pore volume and the total surface area was similar when using different temperatures and leaching times. It was evident from the measured values of samples leached with different acids (except OXAL) that these samples had lower specific surface area and pore volume than the sample leached with 1 M HCl. Our results showed that HCl is the most suitable for post-synthesis treatments. Oxalic acid was better than HCl in terms of textural parameters than HCl but due to the rapid decrease in aluminium content, the zeolite structure was partially collapsed under selected conditions.
The leaching temperature, similar to the concentration of an acid used, had a significant effect on the change in the texture of the materials Leaching at 40 °C partially increased porosity by cleaning the mesopores (Table 3). At 60 °C, an increase in the micropore volume was observed, the volume of mesopores increased twice and the surface area increased four times. At 80 °C, a significant increase in all parameters was observed. The specific surface area and the micropore volume increased up to three times compared to leaching at 60 °C, the volume of mesopores did not change much. The results obtained with various leaching times using 3 M HCl showed that the mesopores were cleaned in the first h of leaching and micropores were cleaned in the second h of leaching. Leaching using 3 M HCl for 1 h has a very similar effect to leaching using 0.1 M HCl for 6 h.
From the point of view of the mechanical properties of samples (Table 3), there was a noticeable decrease in volume density in contrast to the changes in specific surface area and pore volume. The increasing acid concentration, leaching time, and temperature reduced volume density from 1.08 to 0.8 cm3/g. This decrease was related to the removal of the excess alkaline activator in the pores, which strengthened the material. As the data obtained by cutting edge strength measurements in Table 3 show, the strength of the material decreased significantly after the removal of this excess alkaline activator. However, with changing leaching conditions (acid concentration, temperature, or leaching time) the pellet strengths were almost identical and showed very low dispersion due to a measurement error. When leaching at different concentrations of HCl and at different temperatures, only the sample leached using 0.1 M HCl and a sample leached at 40 °C showed a higher strength than the others. This increase was due to residual (imperfectly removed) activator. The average strength value for a range of acid concentrations used is 21.6 N (RSD = 6.6%) and was therefore 4.5 times lower than for the original sample without leaching. A slight decrease in the strength was observed for the other acids used when compared to 1 M HCl.
The number of acid sites on the surface of acid-modified samples was determined by NH3-TPD. Typically, the TPD curves of the modified samples contain a dominant low-temperature peak with a centre of between 165 and 200 °C. This peak is attributed to the ammonia desorption from the weakly acid Lewis centres (low-acid sites). Acid leaching results to a further and less intense desorption peak at a higher temperature with a maximum of about 470 °C (strong-acid sites). This desorption peak is usually assigned to ammonia bound at Brønsted acid centres of zeolite and stronger Lewis acid centres [28]. Unfortunately, NH3-TPD does not allow a distinction between Lewis and Brønsted. The quantitative results of the NH3-TPD curves are summarized in Table 4 and Table 5.
The acid leaching (0.1 M) led to an increase in total acidity compared to sample “S” and centres with a maximum of about 300 °C were generated (Figure 6a). When leaching using low-concentrated acids, the surface was cleaned from the alkaline activator and Na+ and K+ ions were removed. There was a partial micropore opening of the zeolite and N(K)–A–S–H matrixes due to polycondensation of the dissolved aluminosilicates. The matrix had the Lewis sites on the surface which were presented by Ca2+, Mg2+, Al3+, and Fe3+ cations. The removal of cations occurred with higher concentration of the leaching acid. The similar effect was by leaching with 0.5 M or 3 M HCl at the leaching temperature 40 °C (Figure 6c). With increasing acid concentration, temperature, or leaching time, the number of acid sites gradually decreased. The amount of strong acid sites changed slightly with time and temperature, their population was in the range of 5% to 14%. The exception was the higher acidity of the sample leached using 6 M HCl, where the zeolite structure was disintegrated, which led to a significant increase in strong acid sites and an increase in their population to 35% (Table 4 and Table 5). The two-step leached material had a slightly higher total amount of acid sites compared to the material leached with 3 M HCl. This is due to more efficient surface cleaning and a higher total surface area.
In the case of leaching with 1 M mineral H3PO4 and 1 M organic TATR and CITR, the total acidity of the material increased compared to HCl (Table 5). These acids are weak acids and leaching has an effect very similar to leaching with 0.1 M HCl. Mineral acids H2SO4 and HNO3 had a similar effect to the acidity of the materials as HCl. The most significant difference occurred with oxalic acid, where the total acidity was only half than of HCl (Figure 6d). This low value was due to the efficient removal of octahedral aluminium from the structure of the material that bears Lewis acidity.
3.2. Influence of Calcination
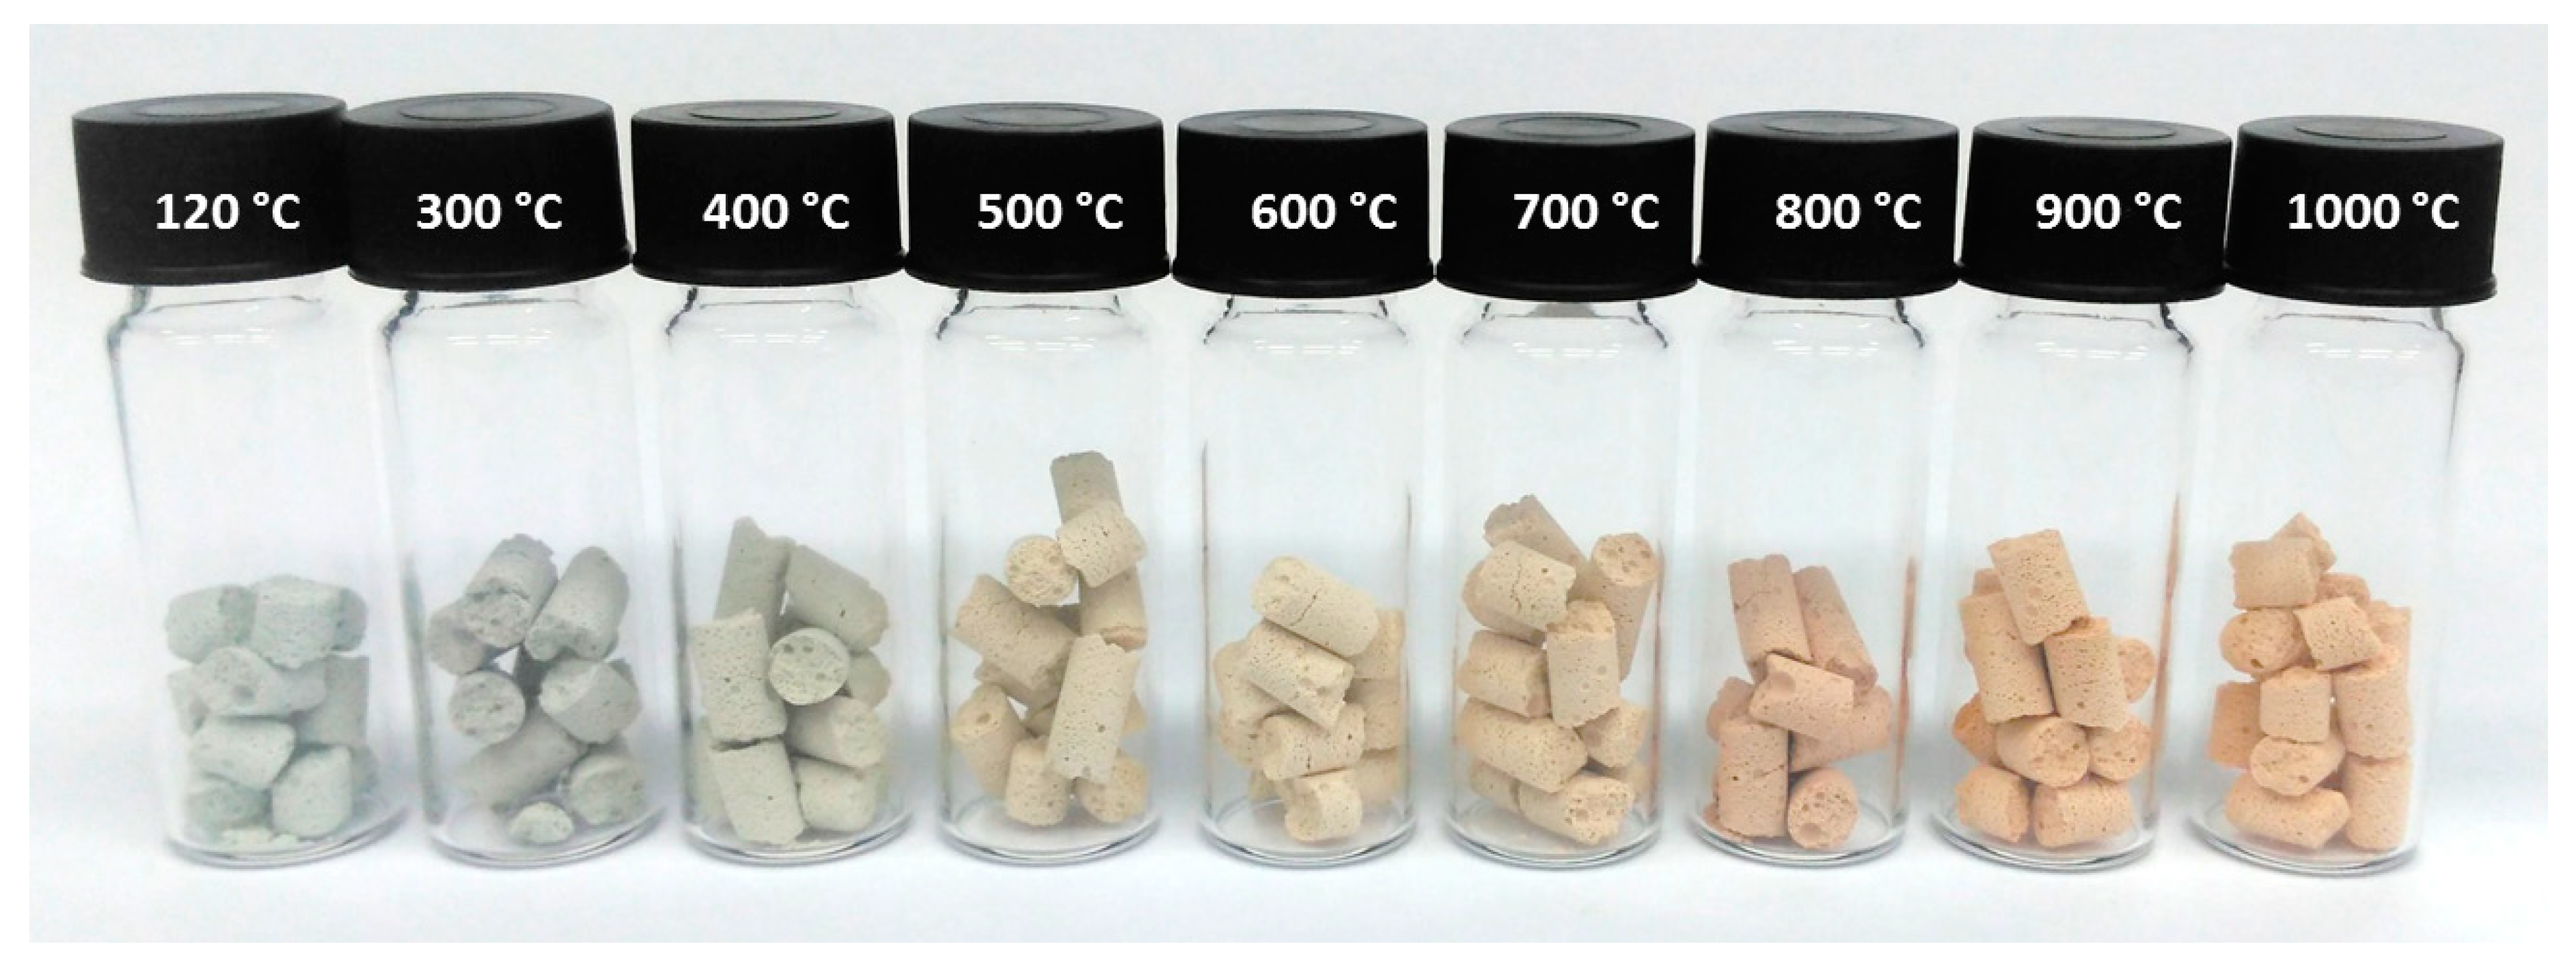
To determine the effect of calcination temperature to structural, textural, and mechanical properties, a two-step leached sample with 0.1 M and 3 M HCl was used. The two-step leached sample showed the best parameters from modified samples. The sample heating was accompanied by the colour change from light green to yellow and then to orange. This change was related to the formation of iron oxides during the calcination of samples (Figure 7).
As stated in the article [3], it is clear from thermogravimetry data that during the heating process freely bound water, water from micropores, and water released from hydroxyls bound in silanol and aluminol groups of the zeolite and N(K)–A–S–H binder matrix gel gradually escape. This process is terminated at 650 °C. No further weight change occurs at higher temperatures.
X-ray diffraction patterns (Figure 8a) showed that there were changes in the crystal structure of the samples during calcination at 300 °C to 1000 °C. Diffraction analysis of the samples showed a gradual decrease in the sample crystallinity. The decrease was observed up to 700 °C. At higher temperatures the clinoptilolite phase was removed and only diffraction lines of quartz, crystobalite, albite, and anorthite were visible on the diffractograms.
The DRIFT spectra (Figure 8b) showed the same bands as the spectra taken during the leaching experiments. The intensity of the vibration bands of the OH groups decreased as the temperature increased, typical is broadband 3400–3600 cm−1 (silanol and aluminol groups) and the band at about 1635 cm−1 corresponding to bending vibration of OH groups of adsorbed water, until these bands were gradually disappeared. Typical bands belonging to aluminosilicate materials 850–1350 cm−1, 800 cm−1, and 470 cm−1 stayed almost unchanged.
The deconvolution of the band 850–1350 cm−1 (Figure 4b) showed that the main band intensity of 1060–1100 cm−1 did not change much, but compared to the leached samples it moved to 1102 cm−1 at the calcination temperature of 1000 °C. This shift was related to the disintegration of the structure and the formation of silica phases and feldspars (albite, anothite) [29]. In the spectra, there were changes at temperatures of about 600 °C, especially visible for the 1160–1180 cm−1 band, which was vibration-dependent between tetrahedrons and the intensity of the band was constant at this temperature. This suggests that during the thermal stress of samples a certain part of the Al atoms passes into cationic positions, forming the complex Al3+ (OH−...H+). The complex continues to fall apart when the temperature rises. [30]
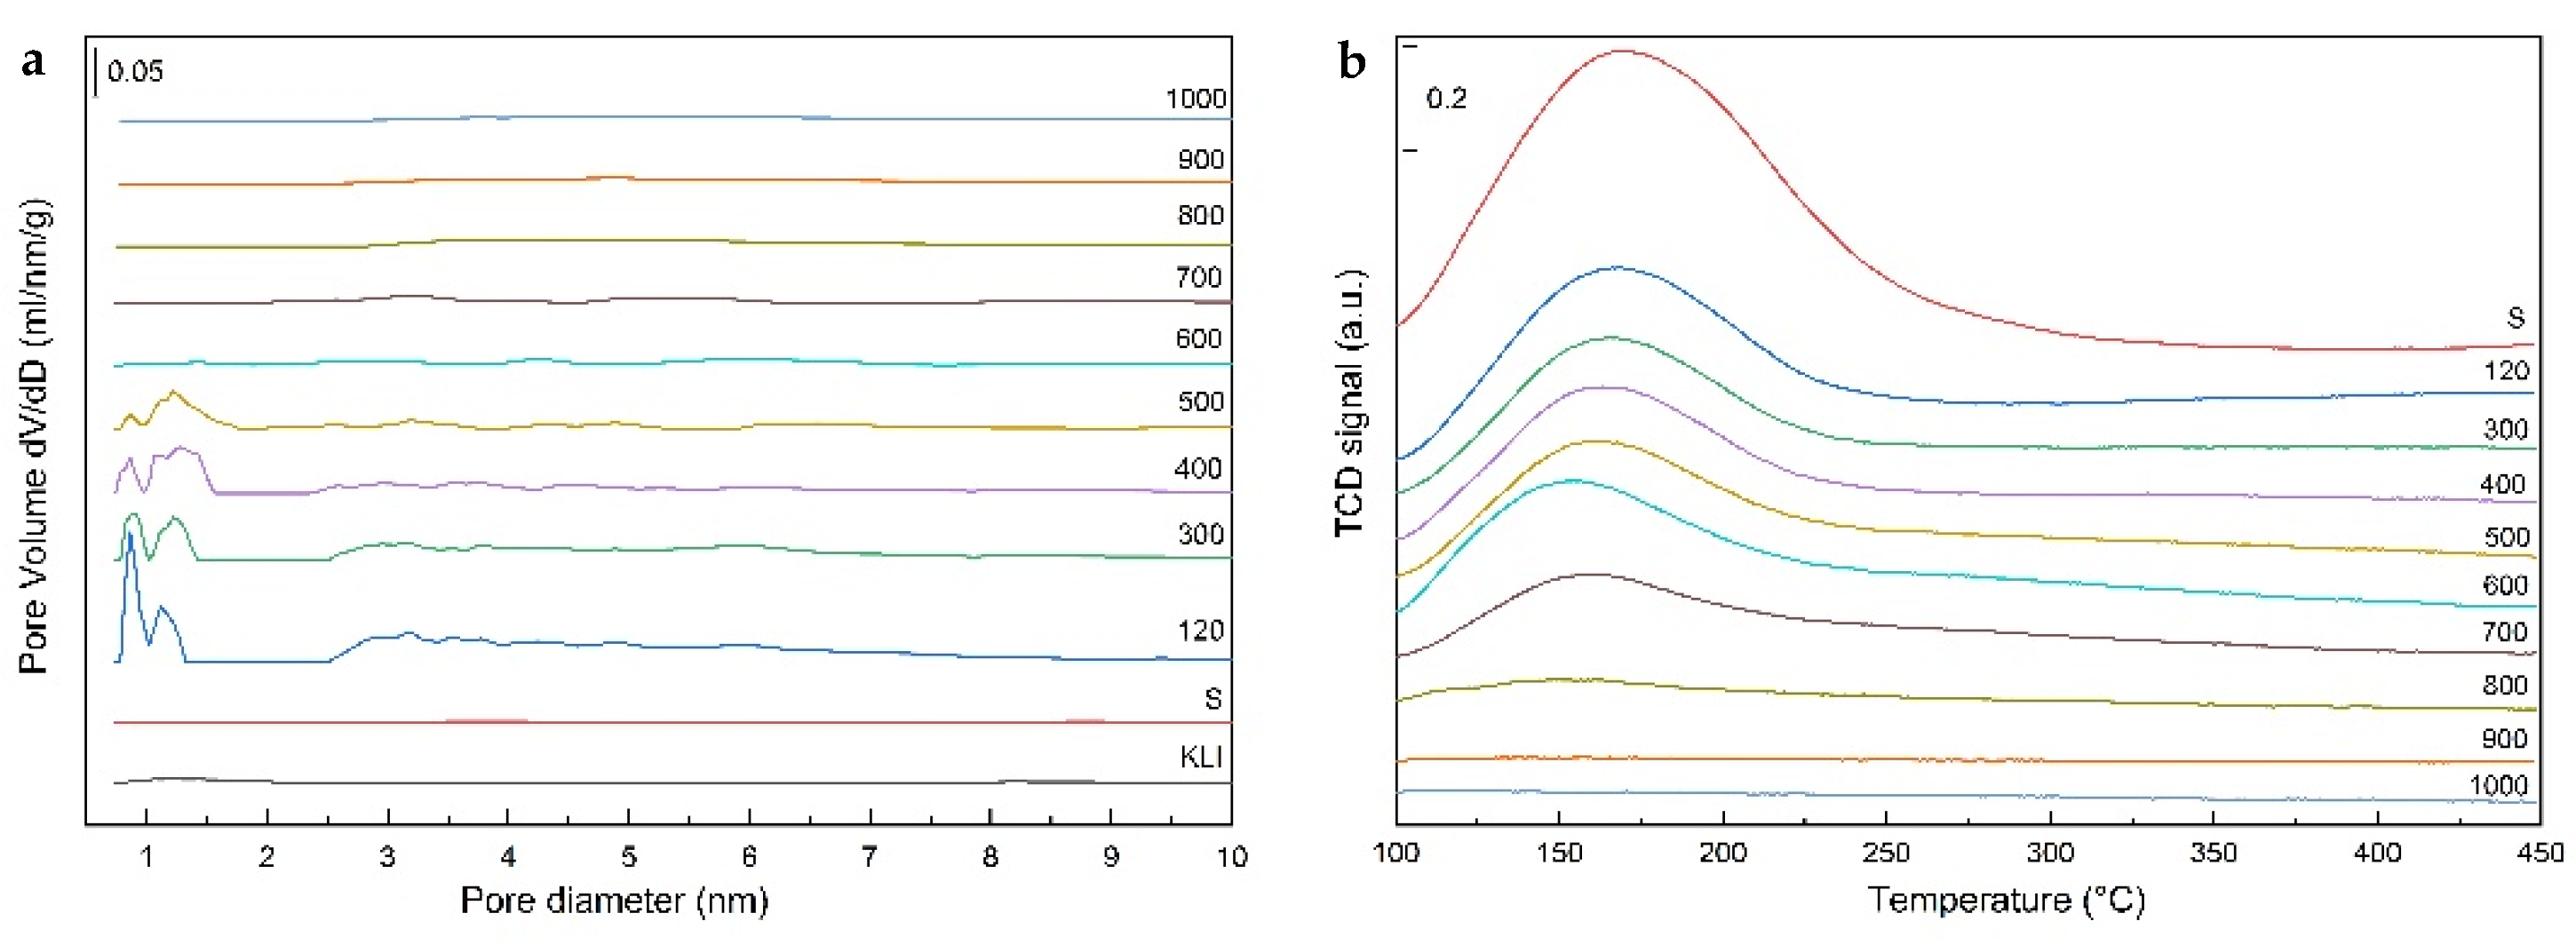
From the sample texture point of view (Table 6), the collapse of the microporous structure in samples calcined at temperatures above 600 °C was obvious. N2 physisorption measurements indicated that micropores are no longer present in the samples (Figure 9a). Similarly, there was a rapid decrease in the specific surface area from nearly 350 to only about 20 m2/g, mainly due to the disappearance of micropores counted in the total surface area (Table 6). The volume of mesopores did not change too much and decreased slowly. There was also slow growth of density from 600 °C due to gradual shrinkage of the samples. This phenomenon was related to the gradual increase in the strength of the calcined samples, where the shrinkage led to the strengthening of the porous structure. The porous structure was presented only by the “supermacropores” of inert aluminosilicate ceramic material.
The pictures from the scanning electron microscope (Figure 10) showed the structure of studied samples. Sample “S” (Figure 10a) showed silicate crystals from excess activator which were removed by subsequent two-step leaching. The surface was cleared and a large number of pores were formed (Figure 10b,d). The appearance of the sample calcined at 600 °C (Figure 10c) was very similar to the 120 °C dried sample and showed no major structural changes. There was only the colour change (Figure 7) associated with the oxidation of Fe present in the structure.
The amount of acid sites of the calcined samples was determined by NH3-TPD. The TPD curves (Figure 9b) of the calcined samples contained a dominant low-temperature peak whose intensity decreased with increasing of calcination temperature and the peak was not visible at the calcination temperature above 800 °C. The decrease of the intensity was caused by a decrease in the specific surface which also decreased with increasing temperature and by structural changes (dehydration) of the N (K)–A–S–H matrix and the zeolite phase. A high-temperature peak with a maximum of typically about 300 °C was not very distinct and the population reached a maximum of 20% in our samples. Results of the quantitative analysis of the NH3-TPD curves were summarized in Table 7.
The significant decrease in the total number of acid centres was observed in calcined samples compared to the two-step leached dried sample (Table 7). In the region of 300–600 °C, the total acidity was constant and there were not too many changes in the acid sites, due to the retained zeolite structure and the N (K)–A–S–H matrix. This trend was also observed in XRD and DRIFT methods. At higher temperatures, the decomposition of these structures occurred, and the acidity decreased significantly. The initial rapid decrease was because of the dehydration of the sample, where water was removed from the zeolite structure and the binder matrix. For the dried sample, ammonia was primarily bound by a quite strong hydrogen bond to water molecules. At higher temperatures, dehydroxylation of the surface (silanol and aluminol groups) occurs [31].
This study examines the patterns associated with the preparation and possible subsequent use of a group of materials that have been so far the domain of the construction industry. There are some studies concerning the alkaline activation of natural zeolites, but not in terms of materials or the study of their properties for use in catalytic and sorption applications. These materials have great potential as it has been proven in a number of national patents and also in our earlier publications [32,33,34]. Currently, research is going on and the materials or catalysts prepared from them are tested for catalytic decomposition of N2O (Co catalysts), deoxygenation of oils, and condensates from aldolization reactions (MoCx/MoNx catalysts), but also for heavy metal sorption applications.
4. Conclusions
The zeolite foams prepared by alkaline activation of the natural zeolite represent the heat resistant materials in which further post-synthesis treatments can be performed to improve their properties.
Chemical, textural, and acid-base properties can be adjusted by acid leaching and heat treatment. The leaching with mineral and organic acids allows the removal of elements from the structure and the release and purification of the micro- and mesopores of the base zeolite matrix. The release and purification of pores cause an increase of the porosity of the zeolite foam. The two-step leaching is the most advantageous procedure which removes the accompanying elements (Al, K, Na, Ca, Mg, Fe) from the structure and perfectly cleans pores, especially the micropores. The two-step leaching does not lead to a collapse of the zeolite structure as it does the high concentrated acids. In addition, the study showed that very similar characteristics can be obtained by different procedures (acid concentration versus temperature or leaching time). The effect of organic acids such as citric acid and tartaric acid is very similar to the use of low concentrated HCl (0.1–0.5 M). An exception is oxalic acid (compared to HCl), which is able to remove aluminium from the zeolite structure even at relatively low concentrations (1 M). The use of weak organic acids or low-concentration mineral acids leads to an increase in the total amount of acid centres. The increase of acid centres is because of gaining the access to acid Lewis sites on the zeolite surface and the N(K)–A–S–H binder matrix.
The thermal resistance of the material was monitored at temperatures up to 1000 °C. However, at this temperature it is no longer a zeolitic material, since the zeolite structure disintegrates at temperatures above 500–600 °C. The collapse of the zeolite structure has been clearly demonstrated by XRD, DRIFT, and N2 physisorption techniques. At temperatures above 600 °C, the acidity of the zeolite foams decreases, and the material is converted to an inert macroporous ceramics.
Based on these results—it is clear that these materials have, after using other post-synthesis processes, a much wider potential and are applicable not only in the building industry but also in catalytic and sorption applications.
Author Contributions
Conceptualization, Z.T.; methodology, Z.T.; validation, Z.T.; formal analysis, J.Š.; investigation, J.Š., L.P. and K.H.; writing—original draft preparation, Z.T.; writing—review and editing, K.H., E.S.; visualization, E.S., K.H.; supervision, Z.T.
Funding
The publication is a result of the project Development of the UniCRE Centre (project code LO1606) which has been financially supported by the Ministry of Education, Youth and Sports of the Czech Republic (MEYS) under the National Sustainability Programme I. The result was achieved using the infrastructure of the project Efficient Use of Energy Resources Using Catalytic Processes (LM2015039) which has been financially supported by MEYS within the targeted support of large infrastructures. Special thanks to the University of Pardubice (Czech Republic) for SEM images processing.
Conflicts of Interest
The authors declare no conflict of interest. The funders had no role in the design of the study; in the collection, analyses, or interpretation of data; in the writing of the manuscript, or in the decision to publish the results.
References
- Melenová, L.; Ciahotný, K.; Jirglová, H.; Kusá, H.; Růžek, P. Odstraňování amoniaku z odpadních plynů adsorpcí na zeolitech a jejich následné využití v zemědělství. Chem. Listy 2003, 97, 562–568. [Google Scholar]
- Zeocem®, Bystré, Slovenská Republika. 2019. Available online: http://www.zeocem.com/sk/zeolit (accessed on 25 April 2019).
- Tišler, Z.; Horáček, J.; Šafář, J.; Velvarská, R.; Pelíšková, L.; Kocík, J.; Gherib, Y.; Marklová, K.; Bulánek, R.; Kubička, D. Clinoptilolite foams prepared by alkali activation of natural zeolite and their post synthesis modifications. Microporous Mesoporous Mater. 2019, 282, 169–178. [Google Scholar] [CrossRef]
- Iza-structure, Structure Commission of the International Zeolite Association. 2017. Available online: http://www.iza-structure.org/databases (accessed on 29 April 2019).
- Mansouri, N.; Rikhtegar, N.; Panah, H.A.; Atabi, F.; Shahraki, B.K. Porosity, characterisation and structural properties of natural zeolite—Clinoptilolite—As a sorbent. Environ. Prot. Eng. 2013, 39, 139. [Google Scholar] [CrossRef]
- Baerlocher, C.; McCusker, L.B.; Olson, D.H. Atlas of Zeolite Framework Types, 6th ed.; Elsevier: Amsterdam, The Netherlands, 2007; ISBN 978-0-444-53064-6. [Google Scholar]
- Kowalczyk, P.; Sprynskyy, M.; Terzyk, A.P.; Lebedynets, M.; Namieśnik, J.; Buszewski, B. Porous structure of natural and modified clinoptilolites. J. Colloid Interface Sci. 2006, 297, 77–85. [Google Scholar] [CrossRef] [PubMed]
- Sprynsky, M.; Golembiewski, R.; Trykowski, G.; Buszewski, B. Heterogeneity and hierarchy of clinoptilolite porosity. J. Phys. Chem. Solids 2010, 71, 1269–1277. [Google Scholar] [CrossRef]
- Cakicioglu-Ozkan, F.; Ulku, S. The effect of HCl treatment on water vapor adsorption characteristics of clinoptilolite rich natural zeolite. Microporous Mesoporous Mater. 2005, 77, 47–53. [Google Scholar] [CrossRef]
- Alzeer, M.I.M.; MacKenzie, K.J.D.; Keyzers, R.A. Facile synthesis of new hierarchical aluminosilicate inorganic polymer solid acids and their catalytic performance in alkylation reactions. Microporous Mesoporous Mater. 2017, 241, 316–325. [Google Scholar] [CrossRef]
- Alzeer, M.I.M.; MacKenzie, K.J.D.; Keyzers, R.A. Porous aluminosilicate inorganic polymers (geopolymers): A newclass of environmentally benign heterogeneous solid acid catalysts. Appl. Catal. A Gen. 2016, 524, 173–181. [Google Scholar] [CrossRef]
- Brylewska, K.; Rożek, P.; Król, M.; Mozgawa, W. The influence of dealumination/desilication on structural properties of metakaolin-based geopolymers. Ceram. Int. 2018, 44, 12853–12861. [Google Scholar] [CrossRef]
- Bernasconi, S. Liquid Phase Nitration of Toluene and 2-Nitrotoluene Using Acetyl Nitrate: Zeolite BEA as Para-Selective Catalyst. Ph.D. Thesis, Swiss Federal Institute of Technology Zurich, Zürich, Switzerland, 2003. [Google Scholar]
- Giudici, R. Synthesis, Dealumination and Adsorption Behavior of Mordenite Extrudates. Ph.D. Thesis, Swiss Federal Institute of Technology Zurich, Zürich, Switzerland, 1999. [Google Scholar]
- Mavrodinova, V.; Popova, M.; Mihályi, R.M.; Páł-Borbély, G.; Minchev, C. Transalkylation of toluene with cumene over zeolites Y dealuminated in solid-state. Part II. Effect of the introduced Lewis acid sites. Appl. Catal. A Gen. 2003, 248, 197–209. [Google Scholar] [CrossRef]
- Ayrault, P.; Datka, J.; Laforge, S.; Martin, D.; Guisnet, M. Characterization of the Internal and External Acidity of H-MCM-22 Zeolites. J. Phys. Chem. B 2004, 108, 13755–13763. [Google Scholar] [CrossRef]
- Giudici, R.; Kouwenhoven, H.W.; Prins, R. Comparison of nitric and oxalic acid in the dealumination of mordenite. Appl. Catal. A Gen. 2000, 203, 101–110. [Google Scholar] [CrossRef]
- Lynch, J.L.V.; Baykara, H.; Cornejo, M.; Soriano, G.; Ulloa, N.A. Preparation, characterization, and determination of mechanical and thermal stability of natural zeolite-based foamed geopolymers. Constr. Build. Mater. 2018, 172, 448–456. [Google Scholar] [CrossRef]
- Chen, L.; Wang, Z.; Wang, Y.; Feng, J. Preparation and Properties of Alkali Activated Metakaolin-Based Geopolymer. Materials 2016, 9, 767. [Google Scholar] [CrossRef] [PubMed]
- Catauro, M.; Papale, F.; Lamanna, G.; Bollino, F. Geopolymer/PEG Hybrid Materials Synthesis and Investigation of the Polymer Influence on Microstructure and Mechanical Behavior. Mater. Res. 2015, 18, 698–705. [Google Scholar] [CrossRef]
- Perná, I.; Šupová, M.; Hanzlíček, T. The characterisation of the Ca–K geopolymer/solidifield fluid fly-ash interlayer. Ceram. Silik. 2017, 61, 26–33. [Google Scholar] [CrossRef]
- Tinti, A.; Tugnoli, V.; Bonora, S.; Francioso, O. Recent applications of vibrational mid-Infrared (IR) spectroscopy for studying soil components: A review. J. Cent. Eur. Agric. 2015, 16, 1–22. [Google Scholar] [CrossRef]
- Toktarev, A.V.; Malysheva, L.V.; Paukshtis, E.A. Effect of Thermal Treatment Conditions on the Acid Properties of Zeolite Beta. Kinet. Catal. 2010, 51, 318–324. [Google Scholar] [CrossRef]
- Boronat, M.; Corma, A. What Is Measured When Measuring Acidity in Zeolites with Probe Molecules? ACS Catal. 2019, 9, 1539–1548. [Google Scholar] [CrossRef]
- Pechar, F.; Rykl, D. Infrared spectra of natural zeolites of the stilbite group. Chem. Zvesti 1981, 35, 189–202. [Google Scholar]
- Snellings, R.; Mertens, G.; Gasharova, B.; Garbev, K.; Elsen, J. The pozzolanic reaction between clinoptilolite and portlandite: A time and spatially resolved IR study. Eur. J. Mineral. 2010, 22, 767–777. [Google Scholar] [CrossRef]
- Braconnier, L.; Clemencon, I.; Legens, C.; Moizan, V.; Diehl, F.; Pilliere, H.; Echegut, P.; Meneses, D.S.; Schuurman, Y. An X-ray diffractometer coupled with diffuse reflectance infrared Fourier transform spectroscopy and gas chromatography for in situ and in operando characterization: An innovative analytical laboratory instrument. J. Appl. Cryst. 2013, 46, 262–266. [Google Scholar] [CrossRef]
- Hidalgo, C.V.; Itoh, H.; Hattori, T.; Niwa, M.; Murakami, Y. Measurement of the acidity of various zeolites by temperature-programmed desorption of ammonia. J. Catal. 1984, 85, 362–369. [Google Scholar] [CrossRef]
- Akyuz, S.; Akyuz, T.; Basaran, S.; Bolcal, C.; Gulec, A. Analysis of ancient potteries using FT-IR, micro-Raman and EDXRF spectrometry. Vib. Spectrosc. 2008, 48, 276–280. [Google Scholar] [CrossRef]
- Pechar, F.; Rykl, D. Study of the thermal stability of the natural zeolite heulandite. Chem. Papers 1985, 39, 369–377. [Google Scholar]
- Ekimova, M.; Quevedo, W.; Szyc, Ł.; Iannuzzi, M.; Wernet, P.; Odelius, M.; Nibbering, E.T. Aqueous solvation of ammonia and ammonium: Probing hydrogen bond motifs with FT-IR and soft X-ray spectroscopy. J. Am. Chem. Soc. 2017, 139, 12773–12783. [Google Scholar] [CrossRef]
- Tišler, Z.; Šafář, J.; Velvarská, R.; Pelíšková, L. Modifikované Alkalicky Aktivované Zeolitové Pěny: Příprava a Charakterizace. Chem. Listy 2019, 113, 111–116. [Google Scholar]
- Hidalgo, J.M.; Tišler, Z.; Vráblík, A.; Velvarská, R.; Lederer, J. Acid-modified phonolite and foamed zeolite as supports for NiW catalysts for deoxygenation of waste rendering fat. Reaction Kinetics. Mech. Catal. 2019, 129, 773–793. [Google Scholar] [CrossRef]
- Tišler, Z.; Velvarská, R.; Skuhrovcová, L.; Pelíšková, L.; Akhmetzyanova, U. Key Role of Precursor Nature in Phase Composition of Supported Molybdenum Carbides and Nitrides. Materials 2019, 12, 415. [Google Scholar] [CrossRef] [Green Version]
Figure 1.
The prepared zeolite foam pellets (a) and cross-section of pellet—5 mm diameter (b).

Figure 2.
Powder diffraction patterns of modified foams: Influence of acid concentration (a), time (b), temperature (c), and type of acid (d).
Figure 2.
Powder diffraction patterns of modified foams: Influence of acid concentration (a), time (b), temperature (c), and type of acid (d).

Figure 3.
DRIFT spectra of modified foams: Influence of acid concentration (a), time (b), temperature (c), and type of acid (d).
Figure 3.
DRIFT spectra of modified foams: Influence of acid concentration (a), time (b), temperature (c), and type of acid (d).

Figure 4.
Deconvolution of the main band of DRIFT spectra in the range 850–1350 cm−1 for acid leached zeolite foams (a) and for calcined zeolite foams (b). Deconvolution curves: Measured curve (yellow), 1st deconvolution peak (violet), 2nd deconvolution peak (green), 3rd deconvolution peak (blue), 4th deconvolution peak (red).

Figure 5.
Micropore distribution of modified foams: Influence of acid concentration (a), time (b), temperature (c), and type of acid (d).
Figure 5.
Micropore distribution of modified foams: Influence of acid concentration (a), time (b), temperature (c), and type of acid (d).

Figure 6.
NH3-TPD of acid leached zeolite foams: Influence of acid concentration (a), time (b), temperature (c), and type of acid (d).
Figure 6.
NH3-TPD of acid leached zeolite foams: Influence of acid concentration (a), time (b), temperature (c), and type of acid (d).

Figure 7.
Pictures of the calcined foams.

Figure 8.
Powder diffraction patterns (a) and DRIFT spectra (b) of calcined foams.

Figure 9.
Pore size distribution (a) and NH3-TPD (b) of calcined zeolite foams.

Figure 10.
SEM pictures of prepared and modified foams: S (a), 0.1 M + 3 M (b), 600 (c)—magnification 5000×, and 0.1 M+ 3 M (d)—magnification 20,000×.
Figure 10.
SEM pictures of prepared and modified foams: S (a), 0.1 M + 3 M (b), 600 (c)—magnification 5000×, and 0.1 M+ 3 M (d)—magnification 20,000×.


Table 1.
Chemical composition of natural zeolite Klinofeed®.
| Sample | Chemical Composition (wt %) | LOI * | SUM | Si/Al Ratio ** | |||||||
|---|---|---|---|---|---|---|---|---|---|---|---|
| SiO2 | Al2O3 | K2O | Fe2O3 | CaO | Na2O | MgO | TiO2 | ||||
| KLI | 66.80 | 10.98 | 4.23 | 1.97 | 4.23 | 0.22 | 0.65 | 0.24 | 9.97 | 9.29 | 5.16 |
* LOI is the loss on ignition at 900 °C; ** Si/Al ratio is the molar ratio of Si to Al.
Table 2.
Chemical composition of acid leached zeolite foam pellets.
| Sample | Chemical Composition (wt %) | SUM | Si/Al Ratio | MSi | |||||||
|---|---|---|---|---|---|---|---|---|---|---|---|
| SiO2 | Al2O3 | K2O | Fe2O3 | CaO | Na2O | MgO | TiO2 | ||||
| S | 71.20 | 10.50 | 8.71 | 1.37 | 3.25 | 3.84 | 0.72 | 0.16 | 99.75 | 5.75 | 4.96 |
| 80/6/0.1 | 78.60 | 11.20 | 5.36 | 1.40 | 1.88 | 0.56 | 0.55 | 0.19 | 99.74 | 5.95 | 10.73 |
| 80/6/0.5 | 83.20 | 10.10 | 3.50 | 1.20 | 0.91 | 0.40 | 0.43 | 0.19 | 99.93 | 6.99 | 17.76 |
| 80/6/1 | 85.00 | 9.71 | 2.38 | 1.10 | 0.79 | 0.34 | 0.45 | 0.19 | 99.96 | 7.43 | 22.50 |
| 80/6/2 | 86.50 | 9.04 | 1.68 | 1.04 | 0.72 | 0.31 | 0.43 | 0.18 | 99.90 | 8.12 | 27.29 |
| 80/6/3 | 89.50 | 6.84 | 1.26 | 0.95 | 0.62 | 0.25 | 0.33 | 0.19 | 99.93 | 11.10 | 35.09 |
| 80/6/6 | 92.60 | 4.12 | 1.06 | 0.85 | 0.55 | 0.29 | 0.21 | 0.20 | 99.88 | 19.07 | 42.48 |
| 0.1 M + 3 M | 88.20 | 7.54 | 1.55 | 1.10 | 0.71 | 0.23 | 0.34 | 0.22 | 99.89 | 9.93 | 30.54 |
| 40/6/3 | 83.30 | 11.00 | 2.22 | 1.40 | 0.91 | 0.29 | 0.57 | 0.19 | 99.87 | 6.43 | 20.62 |
| 60/6/3 | 86.30 | 9.10 | 1.61 | 1.20 | 0.77 | 0.30 | 0.47 | 0.20 | 99.94 | 8.05 | 26.22 |
| 80/1/3 | 85.20 | 9.46 | 2.20 | 1.26 | 0.78 | 0.30 | 0.47 | 0.21 | 99.87 | 7.64 | 23.07 |
| 80/2/3 | 87.30 | 8.24 | 1.66 | 1.14 | 0.72 | 0.28 | 0.42 | 0.20 | 99.96 | 8.99 | 27.66 |
| 80/3/3 | 87.30 | 8.35 | 1.52 | 1.11 | 0.71 | 0.29 | 0.40 | 0.21 | 99.88 | 8.87 | 28.93 |
| H3PO4 | 79.90 | 10.80 | 5.18 | 1.06 | 1.19 | 0.55 | 0.46 | 0.19 | 99.86 | 6.28 | 12.89 |
| H2SO4 | 84.10 | 9.42 | 2.73 | 1.16 | 0.91 | 0.34 | 0.42 | 0.19 | 99.80 | 7.58 | 20.51 |
| HNO3 | 84.20 | 9.64 | 2.93 | 1.33 | 0.79 | 0.36 | 0.43 | 0.21 | 99.90 | 7.41 | 20.00 |
| TART | 79.00 | 11.40 | 5.50 | 1.30 | 1.35 | 0.63 | 0.48 | 0.19 | 99.86 | 5.88 | 11.66 |
| OXAL | 85.00 | 5.95 | 2.97 | 1.12 | 3.86 | 0.41 | 0.31 | 0.22 | 99.85 | 12.12 | 11.62 |
| CITR | 79.00 | 11.30 | 5.43 | 1.29 | 1.43 | 0.66 | 0.51 | 0.18 | 99.80 | 5.93 | 11.49 |
Table 3.
Mechanical and textural properties of acid leached zeolite foam pellets.
| Sample | Density (cm3/g) * | Cutting Edge Strength (N) ** | Specific Surface Area (m2/g) | Total Pore Volume (cm3/g) | Micropore Volume (cm3/g) | Mesopore Volume (cm3/g) |
|---|---|---|---|---|---|---|
| KLI | - | - | 24.6 | 0.062 | 0.005 | 0.055 |
| S | 1.08 | 96.5 | 6.0 | 0.029 | 0.000 | 0.024 |
| 80/6/0.1 | 0.96 | 23.3 | 96.7 | 0.076 | 0.014 | 0.055 |
| 80/6/0.5 | 0.89 | 21.3 | 119.2 | 0.091 | 0.023 | 0.061 |
| 80/6/1 | 0.89 | 22.7 | 160.2 | 0.093 | 0.032 | 0.056 |
| 80/6/2 | 0.87 | 19.7 | 268.8 | 0.117 | 0.052 | 0.061 |
| 80/6/3 | 0.86 | 22.1 | 281.9 | 0.128 | 0.057 | 0.065 |
| 80/6/6 | 0.82 | 20.2 | 166.6 | 0.110 | 0.035 | 0.068 |
| 0.1 M + 3 M | 0.85 | 17.3 | 346.8 | 0.152 | 0.060 | 0.086 |
| 40/6/3 | 0.90 | 27.6 | 24.8 | 0.045 | 0.004 | 0.035 |
| 60/6/3 | 0.86 | 23.4 | 103.1 | 0.100 | 0.016 | 0.077 |
| 80/1/3 | 0.87 | 21.4 | 99.2 | 0.082 | 0.018 | 0.059 |
| 80/2/3 | 0.85 | 27.7 | 238.9 | 0.110 | 0.052 | 0.052 |
| 80/3/3 | 0.90 | 23.4 | 278.4 | 0.122 | 0.052 | 0.065 |
| H3PO4 | 0.88 | 14.0 | 32.9 | 0.042 | 0.006 | 0.030 |
| H2SO4 | 0.80 | 19.4 | 95.4 | 0.081 | 0.017 | 0.055 |
| HNO3 | 0.88 | 11.0 | 102.6 | 0.070 | 0.021 | 0.041 |
| TART | 0.88 | 16.2 | 23.6 | 0.040 | 0.004 | 0.029 |
| OXAL | 0.86 | 15.1 | 252.5 | 0.133 | 0.040 | 0.085 |
| CITR | 0.80 | 10.6 | 42.3 | 0.065 | 0.001 | 0.058 |
* average values from five measured samples; ** average values from 10 measured samples.
Table 4.
Acidity of zeolite foam pellets modified by HCl, determined by NH3-TPD.
| Sample | cSUM (mmol/g) | Tmax1 (°C) | cLT (mmol/g) | Population LT (%) | Tmax2 (°C) | cHT (mmol/g) | Population HT (%) |
|---|---|---|---|---|---|---|---|
| S | 0.809 | 171 | 0.809 | 100 | |||
| 80/6/0.1 | 1.182 | 167 | 1.055 | 89 | 298 | 0.127 | 11 |
| 80/6/0.5 | 0.968 | 166 | 0.882 | 91 | 327 | 0.086 | 9 |
| 80/6/1 | 0.779 | 175 | 0.734 | 94 | 319 | 0.045 | 6 |
| 80/6/2 | 0.719 | 173 | 0.680 | 95 | 313 | 0.039 | 5 |
| 80/6/3 | 0.493 | 170 | 0.422 | 86 | 293 | 0.071 | 14 |
| 80/6/6 | 0.148 | 143 | 0.096 | 65 | 280 | 0.052 | 35 |
| 0.1 M + 3 M | 0.518 | 166 | 0.464 | 90 | 309 | 0.054 | 10 |
| 40/6/3 | 0.939 | 178 | 0.892 | 95 | 318 | 0.047 | 5 |
| 60/6/3 | 0.712 | 167 | 0.661 | 93 | 312 | 0.051 | 7 |
| 80/1/3 | 0.725 | 173 | 0.649 | 90 | 306 | 0.076 | 10 |
| 80/2/3 | 0.614 | 162 | 0.576 | 94 | 312 | 0.038 | 6 |
| 80/3/3 | 0.581 | 163 | 0.533 | 92 | 313 | 0.048 | 8 |
cSUM—total concentration of acid sites (mmol/g); Tmax1—the first temperature maximum (°C); cLT—concentration of low-temperature acid sites (mmol/g); Tmax2—the second temperature maximum (°C); cHT—concentration of high-temperature acid sites (mmol/g); LT—low temperature peak (weak acid sites); HT—high temperature peak (strong acid sites).
Table 5.
Acidity of 1 M acids modified zeolite foam pellets determined by the NH3-TPD.
| Sample | cSUM (mmol/g) | Tmax1 (°C) | cLT (mmol/g) | Population LT (%) | Tmax2 (°C) | cHT (mmol/g) | Population HT (%) |
|---|---|---|---|---|---|---|---|
| S | 0.809 | 171 | 0.809 | 100 | 0 | ||
| HCl | 0.779 | 175 | 0.734 | 94 | 319 | 0.045 | 6 |
| HNO3 | 0.931 | 169 | 0.876 | 94 | 327 | 0.055 | 6 |
| H3PO4 | 1.224 | 170 | 1.118 | 91 | 314 | 0.106 | 9 |
| H2SO4 | 0.891 | 175 | 0.816 | 92 | 318 | 0.075 | 8 |
| OXAL | 0.394 | 153 | 0.369 | 94 | 272 | 0.025 | 6 |
| TART | 1.145 | 175 | 1.007 | 88 | 301 | 0.138 | 12 |
| CITR | 1.144 | 170 | 1.036 | 91 | 297 | 0.108 | 9 |
Table 6.
Mechanical and textural properties of calcined zeolite foam pellets.
| Sample-Calcination Temperature (°C) | Density (cm3/g) | Cutting Edge Strength (N) | Specific Surface Area (m2/g) | Total Pore Volume (cm3/g) | Micropore Volume (cm3/g) | Mesopore Volume (cm3/g) |
|---|---|---|---|---|---|---|
| KLI | - | - | 24.6 | 0.062 | 0.005 | 0.055 |
| S | 1.08 | 96.5 | 6.0 | 0.029 | 0.000 | 0.024 |
| 120 | 0.85 | 17.3 | 346.8 | 0.152 | 0.060 | 0.086 |
| 300 | 0.79 | 10.4 | 199.9 | 0.140 | 0.028 | 0.105 |
| 400 | 0.78 | 9.5 | 151.5 | 0.092 | 0.028 | 0.060 |
| 500 | 0.78 | 12.1 | 88.5 | 0.075 | 0.018 | 0.049 |
| 600 | 0.81 | 11.2 | 40.4 | 0.077 | 0.003 | 0.064 |
| 700 | 0.80 | 12.1 | 26.0 | 0.060 | <0.001 | 0.052 |
| 800 | 0.82 | 13.2 | 24.7 | 0.055 | 0.000 | 0.049 |
| 900 | 0.82 | 14.0 | 21.3 | 0.056 | 0.000 | 0.049 |
| 1000 | 0.84 | 14.6 | 14.6 | 0.039 | 0.000 | 0.034 |
Table 7.
Properties of acid sites determined by NH3-TPD.
| Sample | cSUM (mmol/g) | Tmax1 (°C) | cLT (mmol/g) | Population LT (%) | Tmax2 (°C) | cHT (mmol/g) | Population HT (%) |
|---|---|---|---|---|---|---|---|
| 120 | 0.518 | 166 | 0.464 | 90 | 309 | 0.054 | 10 |
| 300 | 0.130 | 164 | 0.109 | 84 | 299 | 0.021 | 16 |
| 400 | 0.136 | 162 | 0.104 | 77 | 299 | 0.032 | 23 |
| 500 | 0.130 | 160 | 0.101 | 78 | 297 | 0.029 | 22 |
| 600 | 0.129 | 152 | 0.108 | 84 | 293 | 0.021 | 16 |
| 700 | 0.081 | 156 | 0.054 | 76 | 262 | 0.028 | 24 |
| 800 | 0.023 | 149 | 0.021 | 92 | 310 | 0.002 | 8 |
| 900 | 0.006 | -* | 0.006 | 100 | - | - | - |
| 1000 | 0.006 | -* | 0.006 | 100 | - | - | - |
* flat peak without a significant maximum.
© 2019 by the authors. Licensee MDPI, Basel, Switzerland. This article is an open access article distributed under the terms and conditions of the Creative Commons Attribution (CC BY) license (http://creativecommons.org/licenses/by/4.0/).
Share and Cite
MDPI and ACS Style
Tišler, Z.; Hrachovcová, K.; Svobodová, E.; Šafář, J.; Pelíšková, L. Acid and Thermal Treatment of Alkali-Activated Zeolite Foams. Minerals 2019, 9, 719. https://doi.org/10.3390/min9120719
AMA Style
Tišler Z, Hrachovcová K, Svobodová E, Šafář J, Pelíšková L. Acid and Thermal Treatment of Alkali-Activated Zeolite Foams. Minerals. 2019; 9(12):719. https://doi.org/10.3390/min9120719
Chicago/Turabian StyleTišler, Zdeněk, Kateřina Hrachovcová, Eliška Svobodová, Jan Šafář, and Lenka Pelíšková. 2019. "Acid and Thermal Treatment of Alkali-Activated Zeolite Foams" Minerals 9, no. 12: 719. https://doi.org/10.3390/min9120719
Note that from the first issue of 2016, this journal uses article numbers instead of page numbers. See further details here.