Chlorite-White Mica Pairs’ Composition as a Micro-Chemical Guide to Fingerprint Massive Sulfide Deposits of the Bathurst Mining Camp, Canada


 ,
,
Abstract
:
1. Introduction
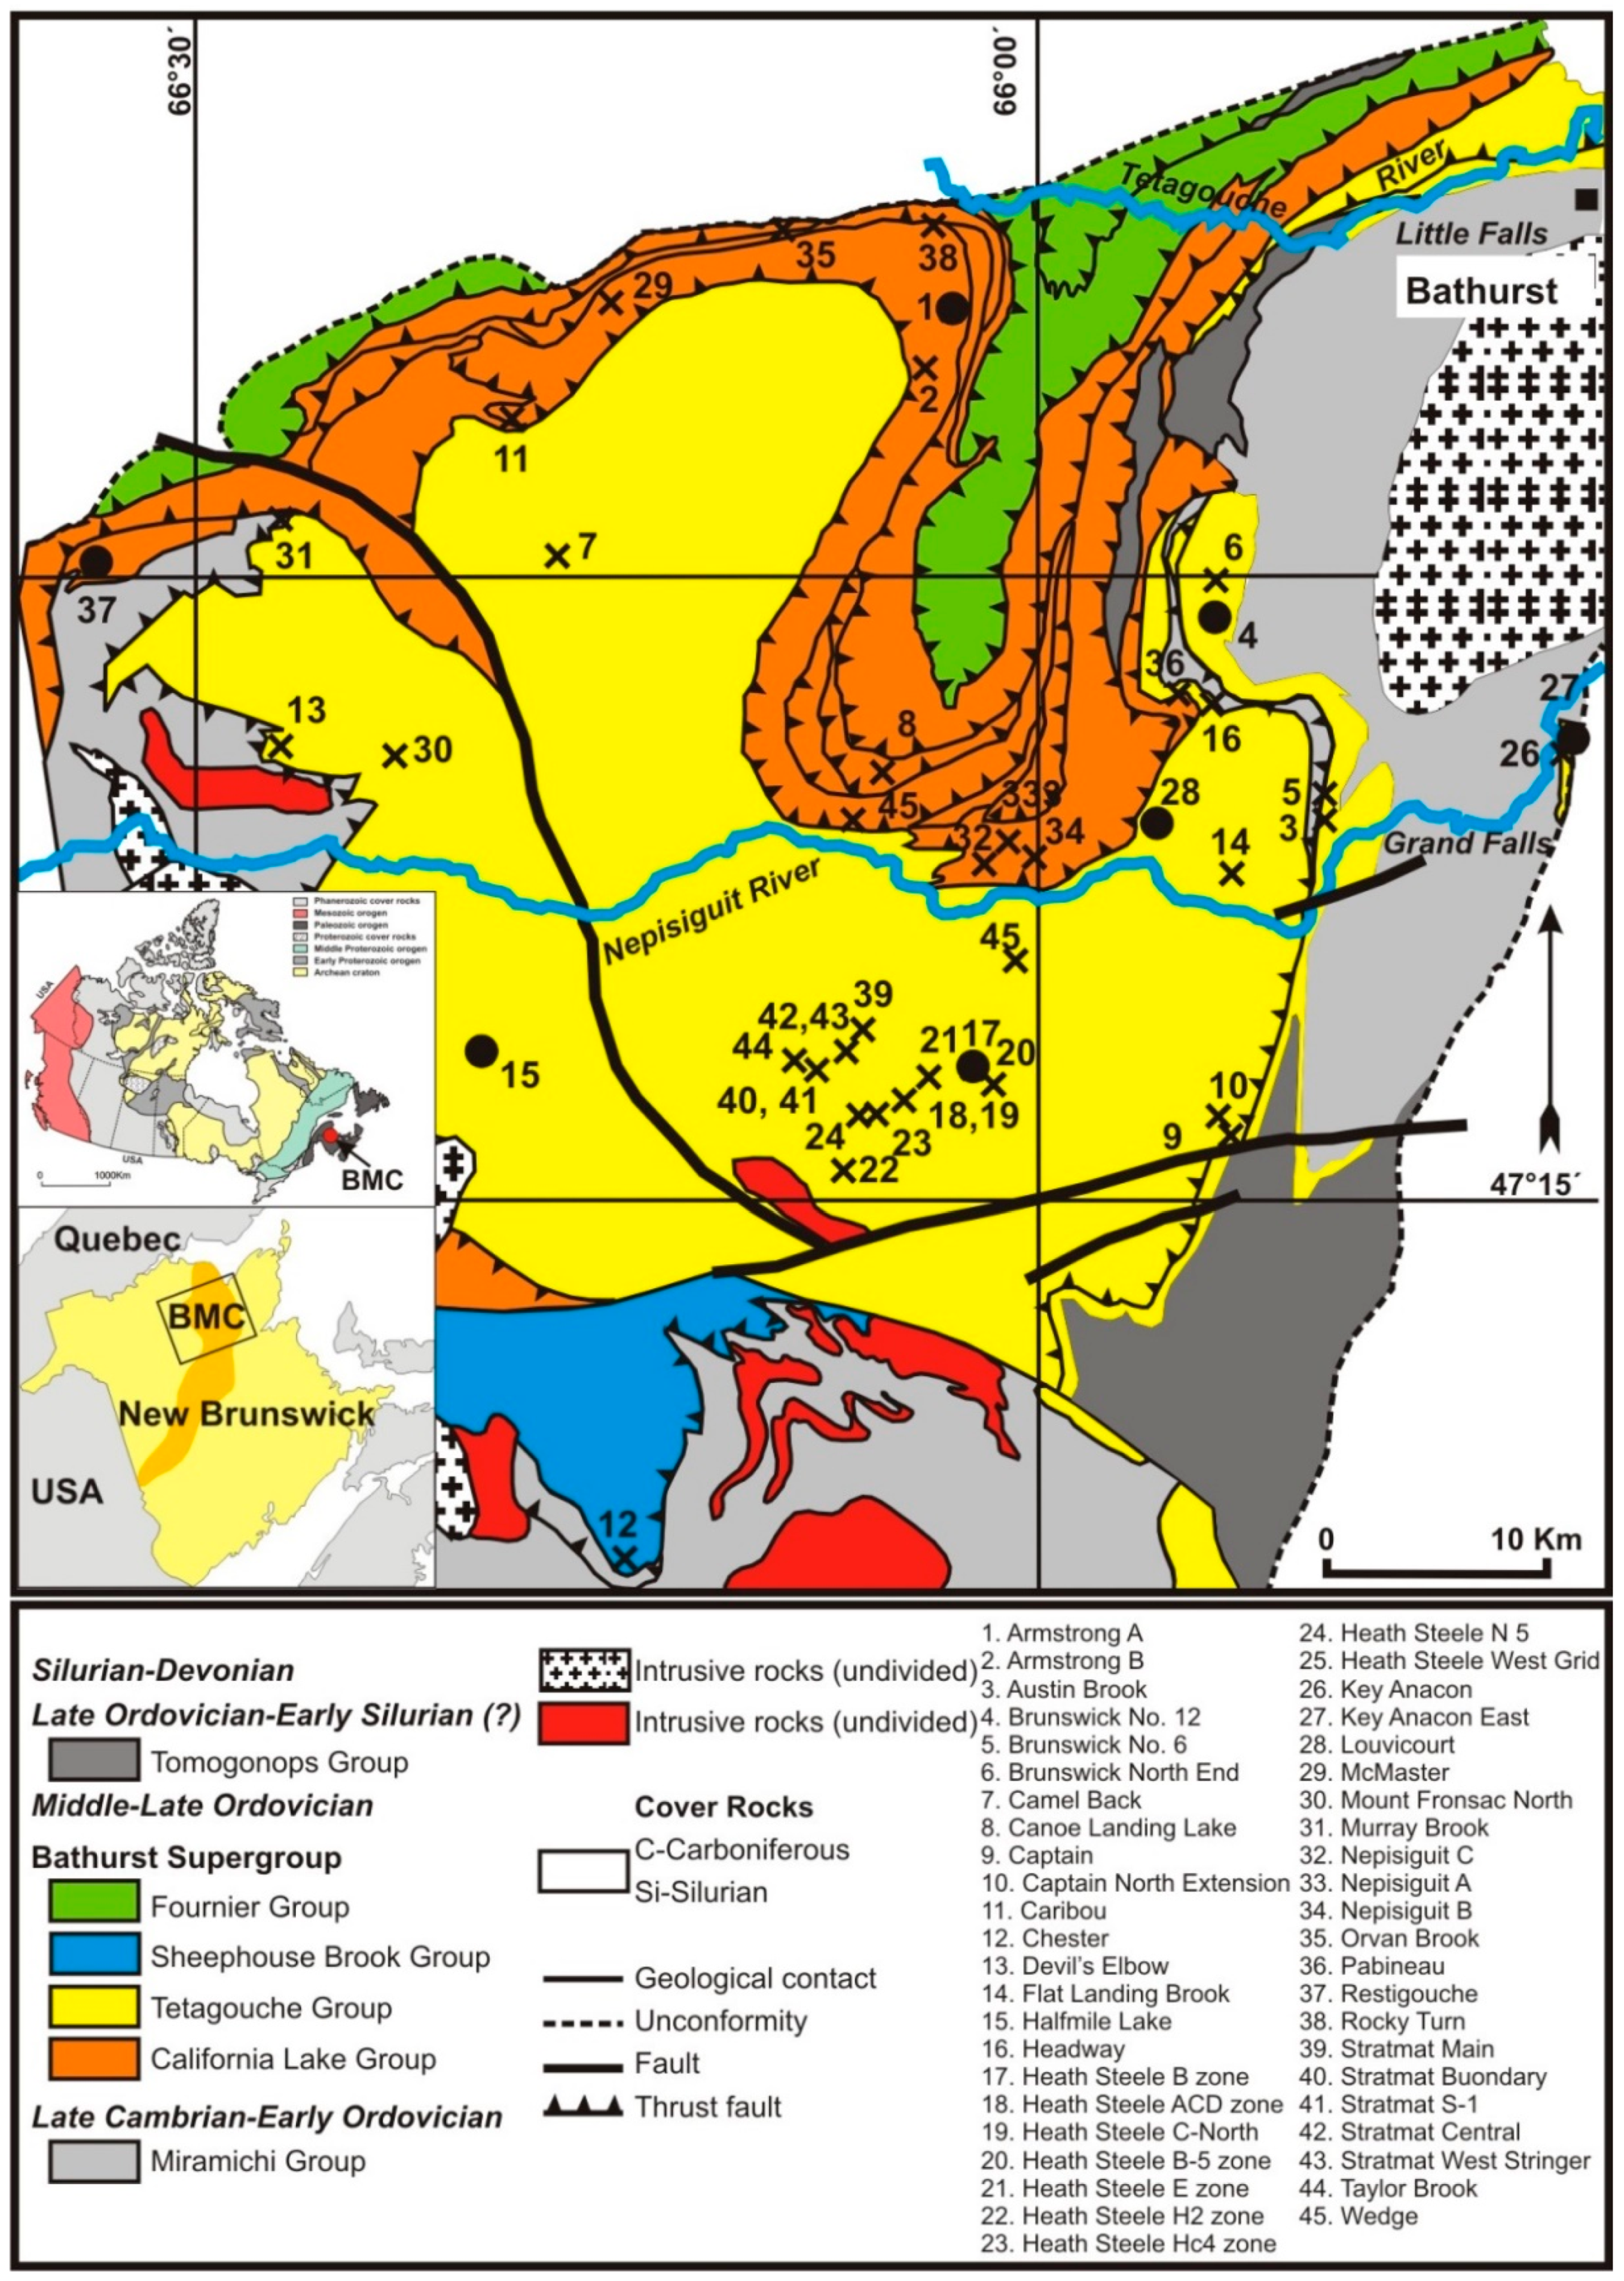
2. Geological Setting
2.1. Regional Geology
2.2. Geology of the Studied Deposits
2.3. Metamorphism and Deformation
2.4. Hydrothermal Architecture of the BMC
3. Analytical Methods
3.1. EPMA
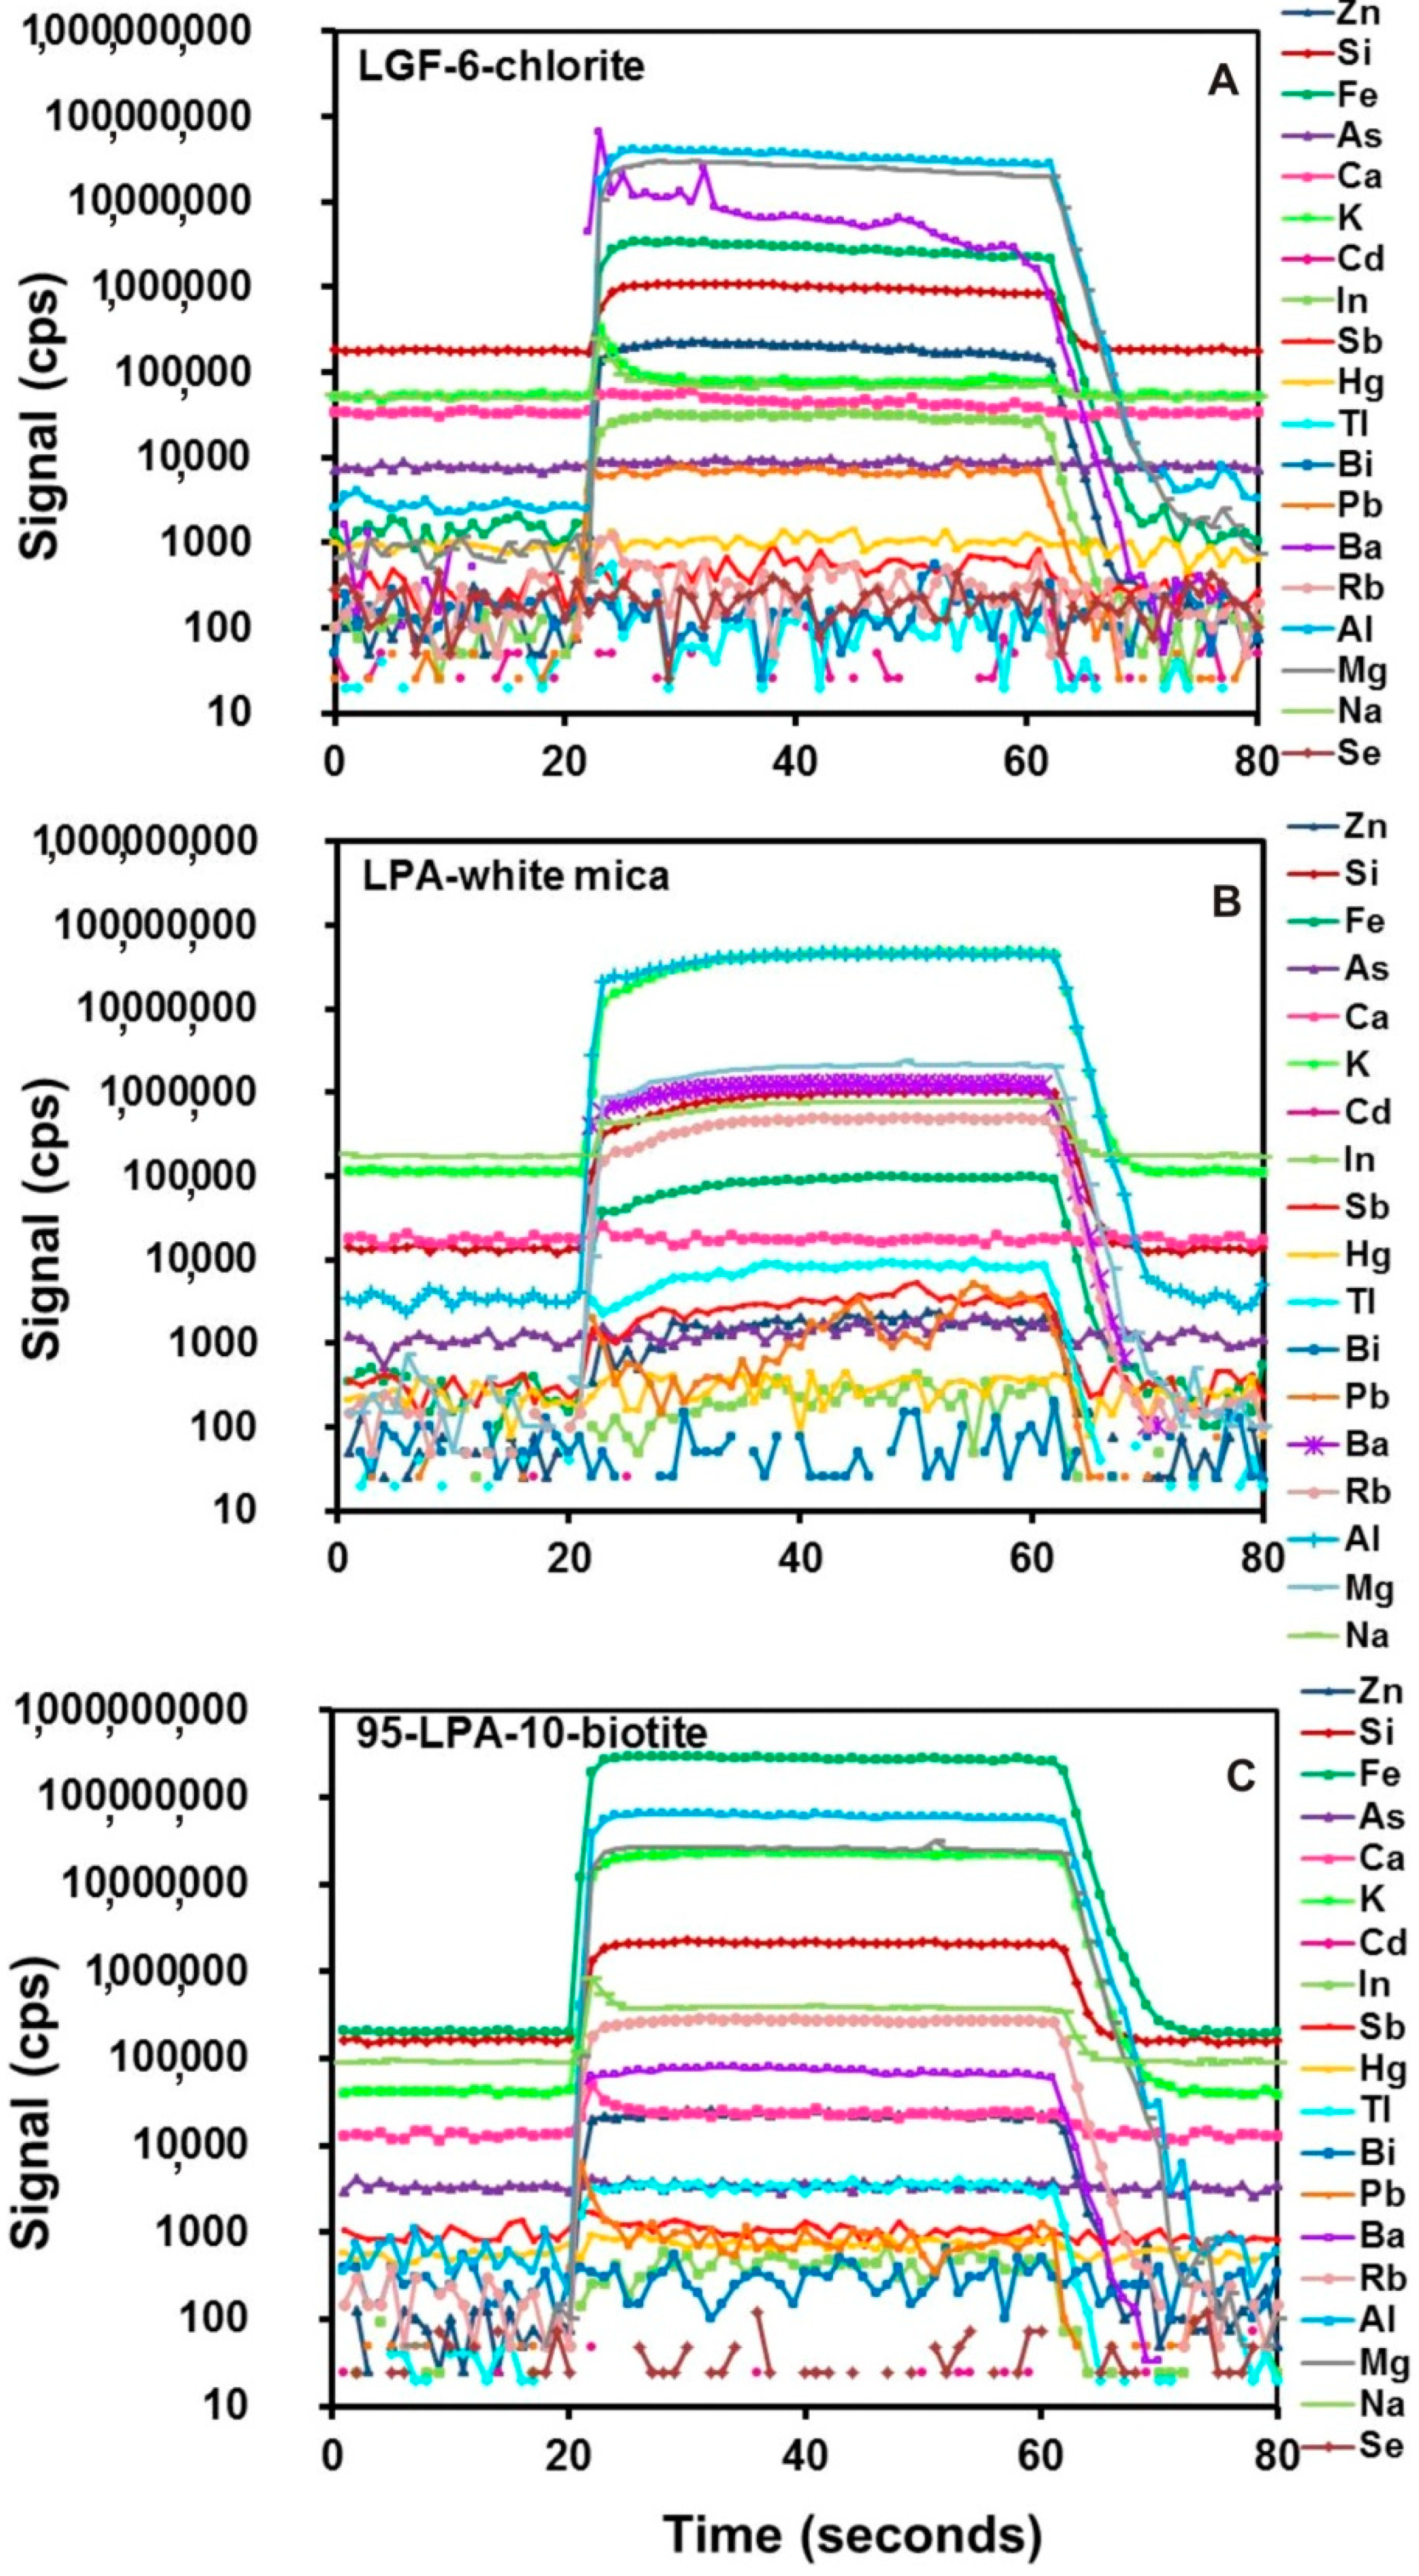
3.2. LA-ICP-MS
4. Results
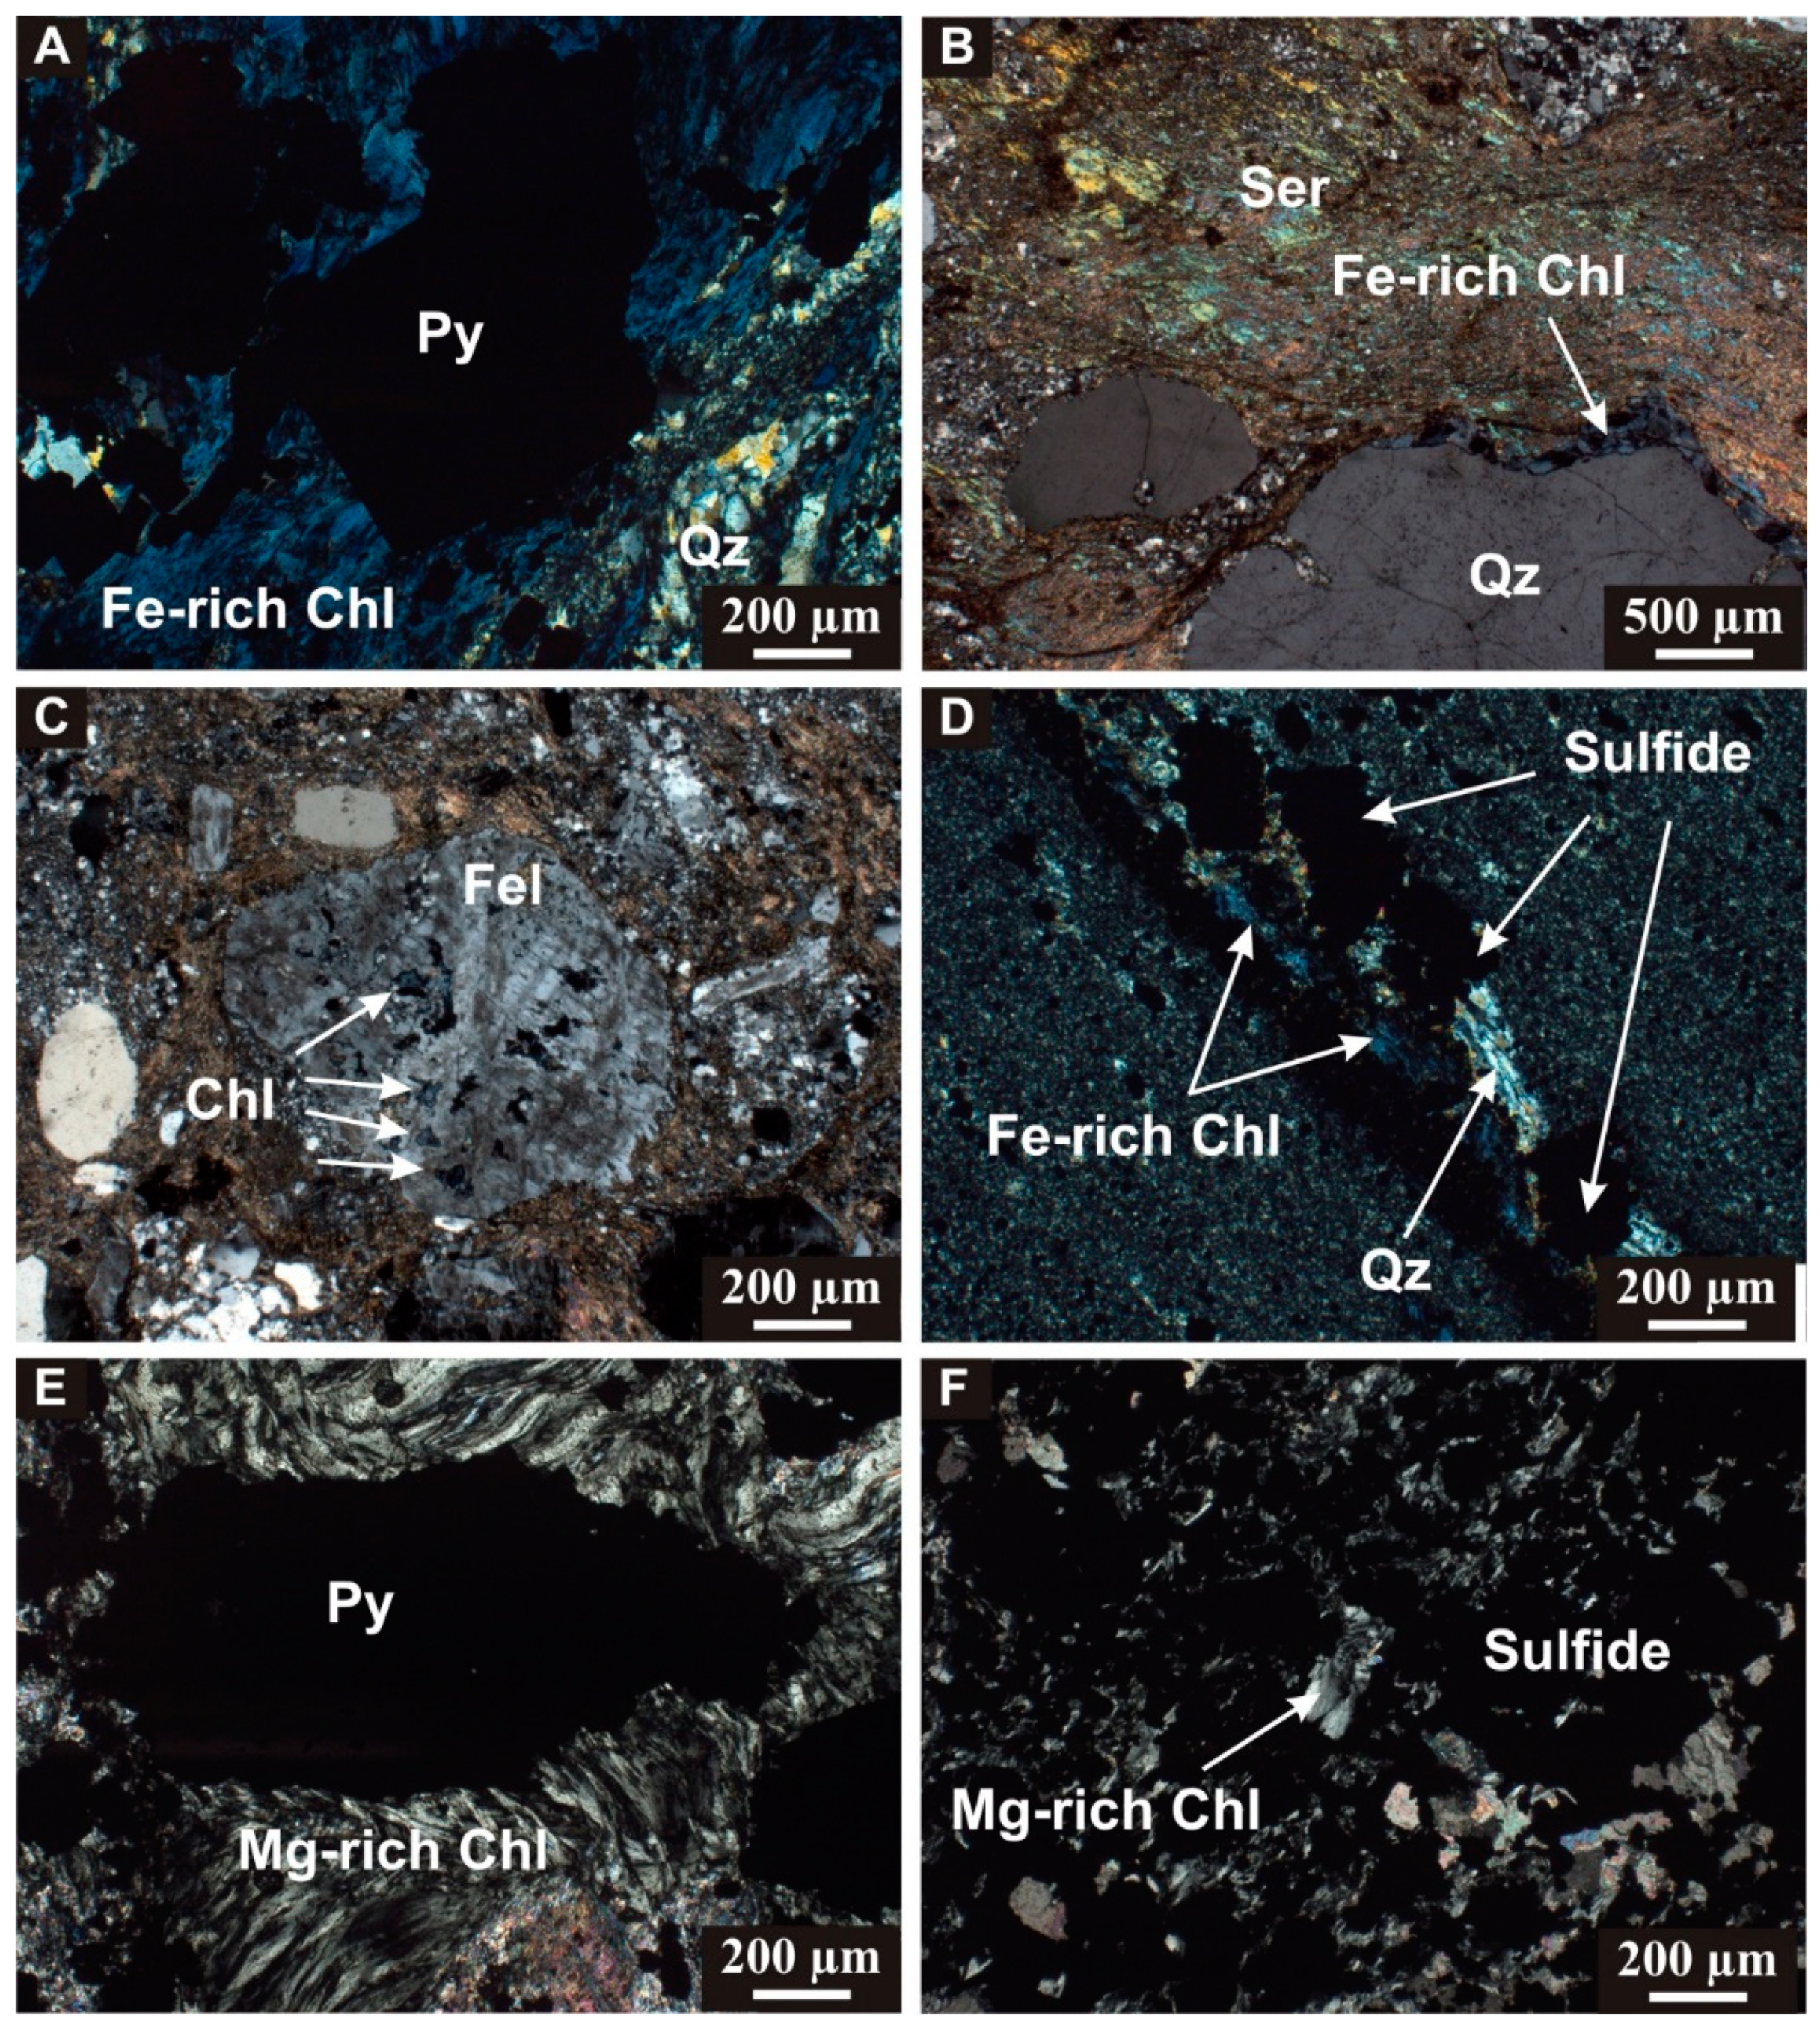
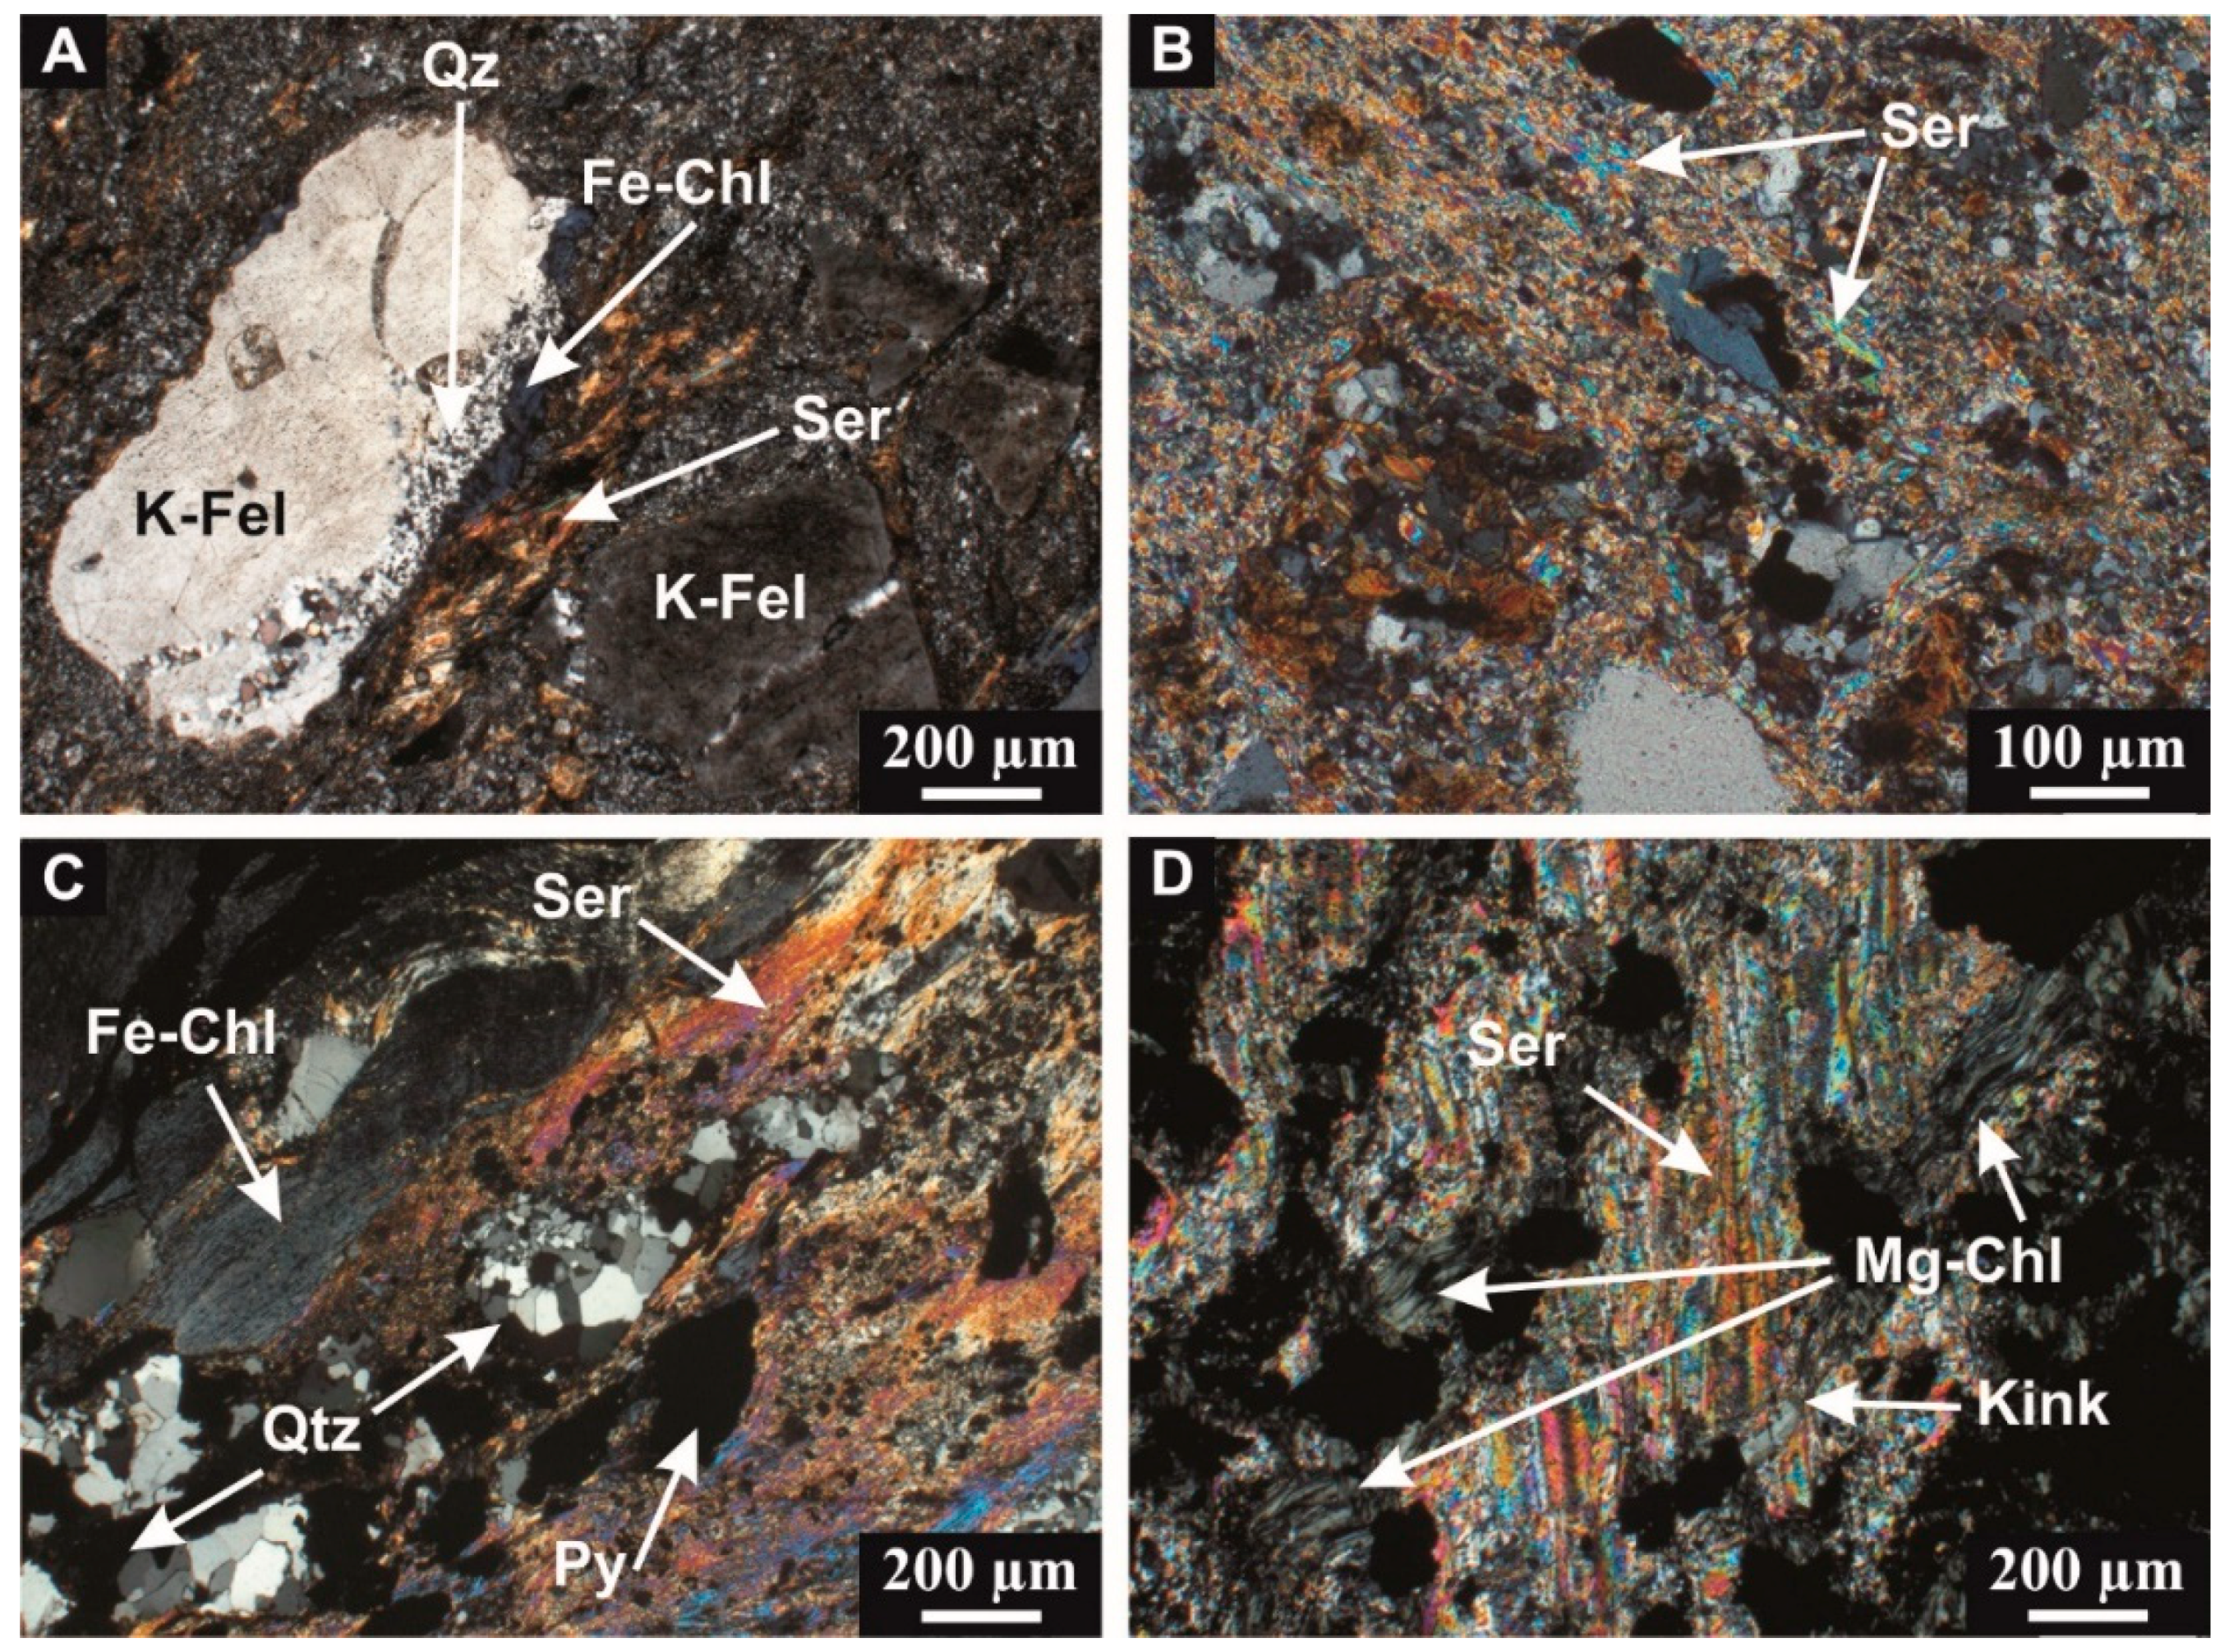
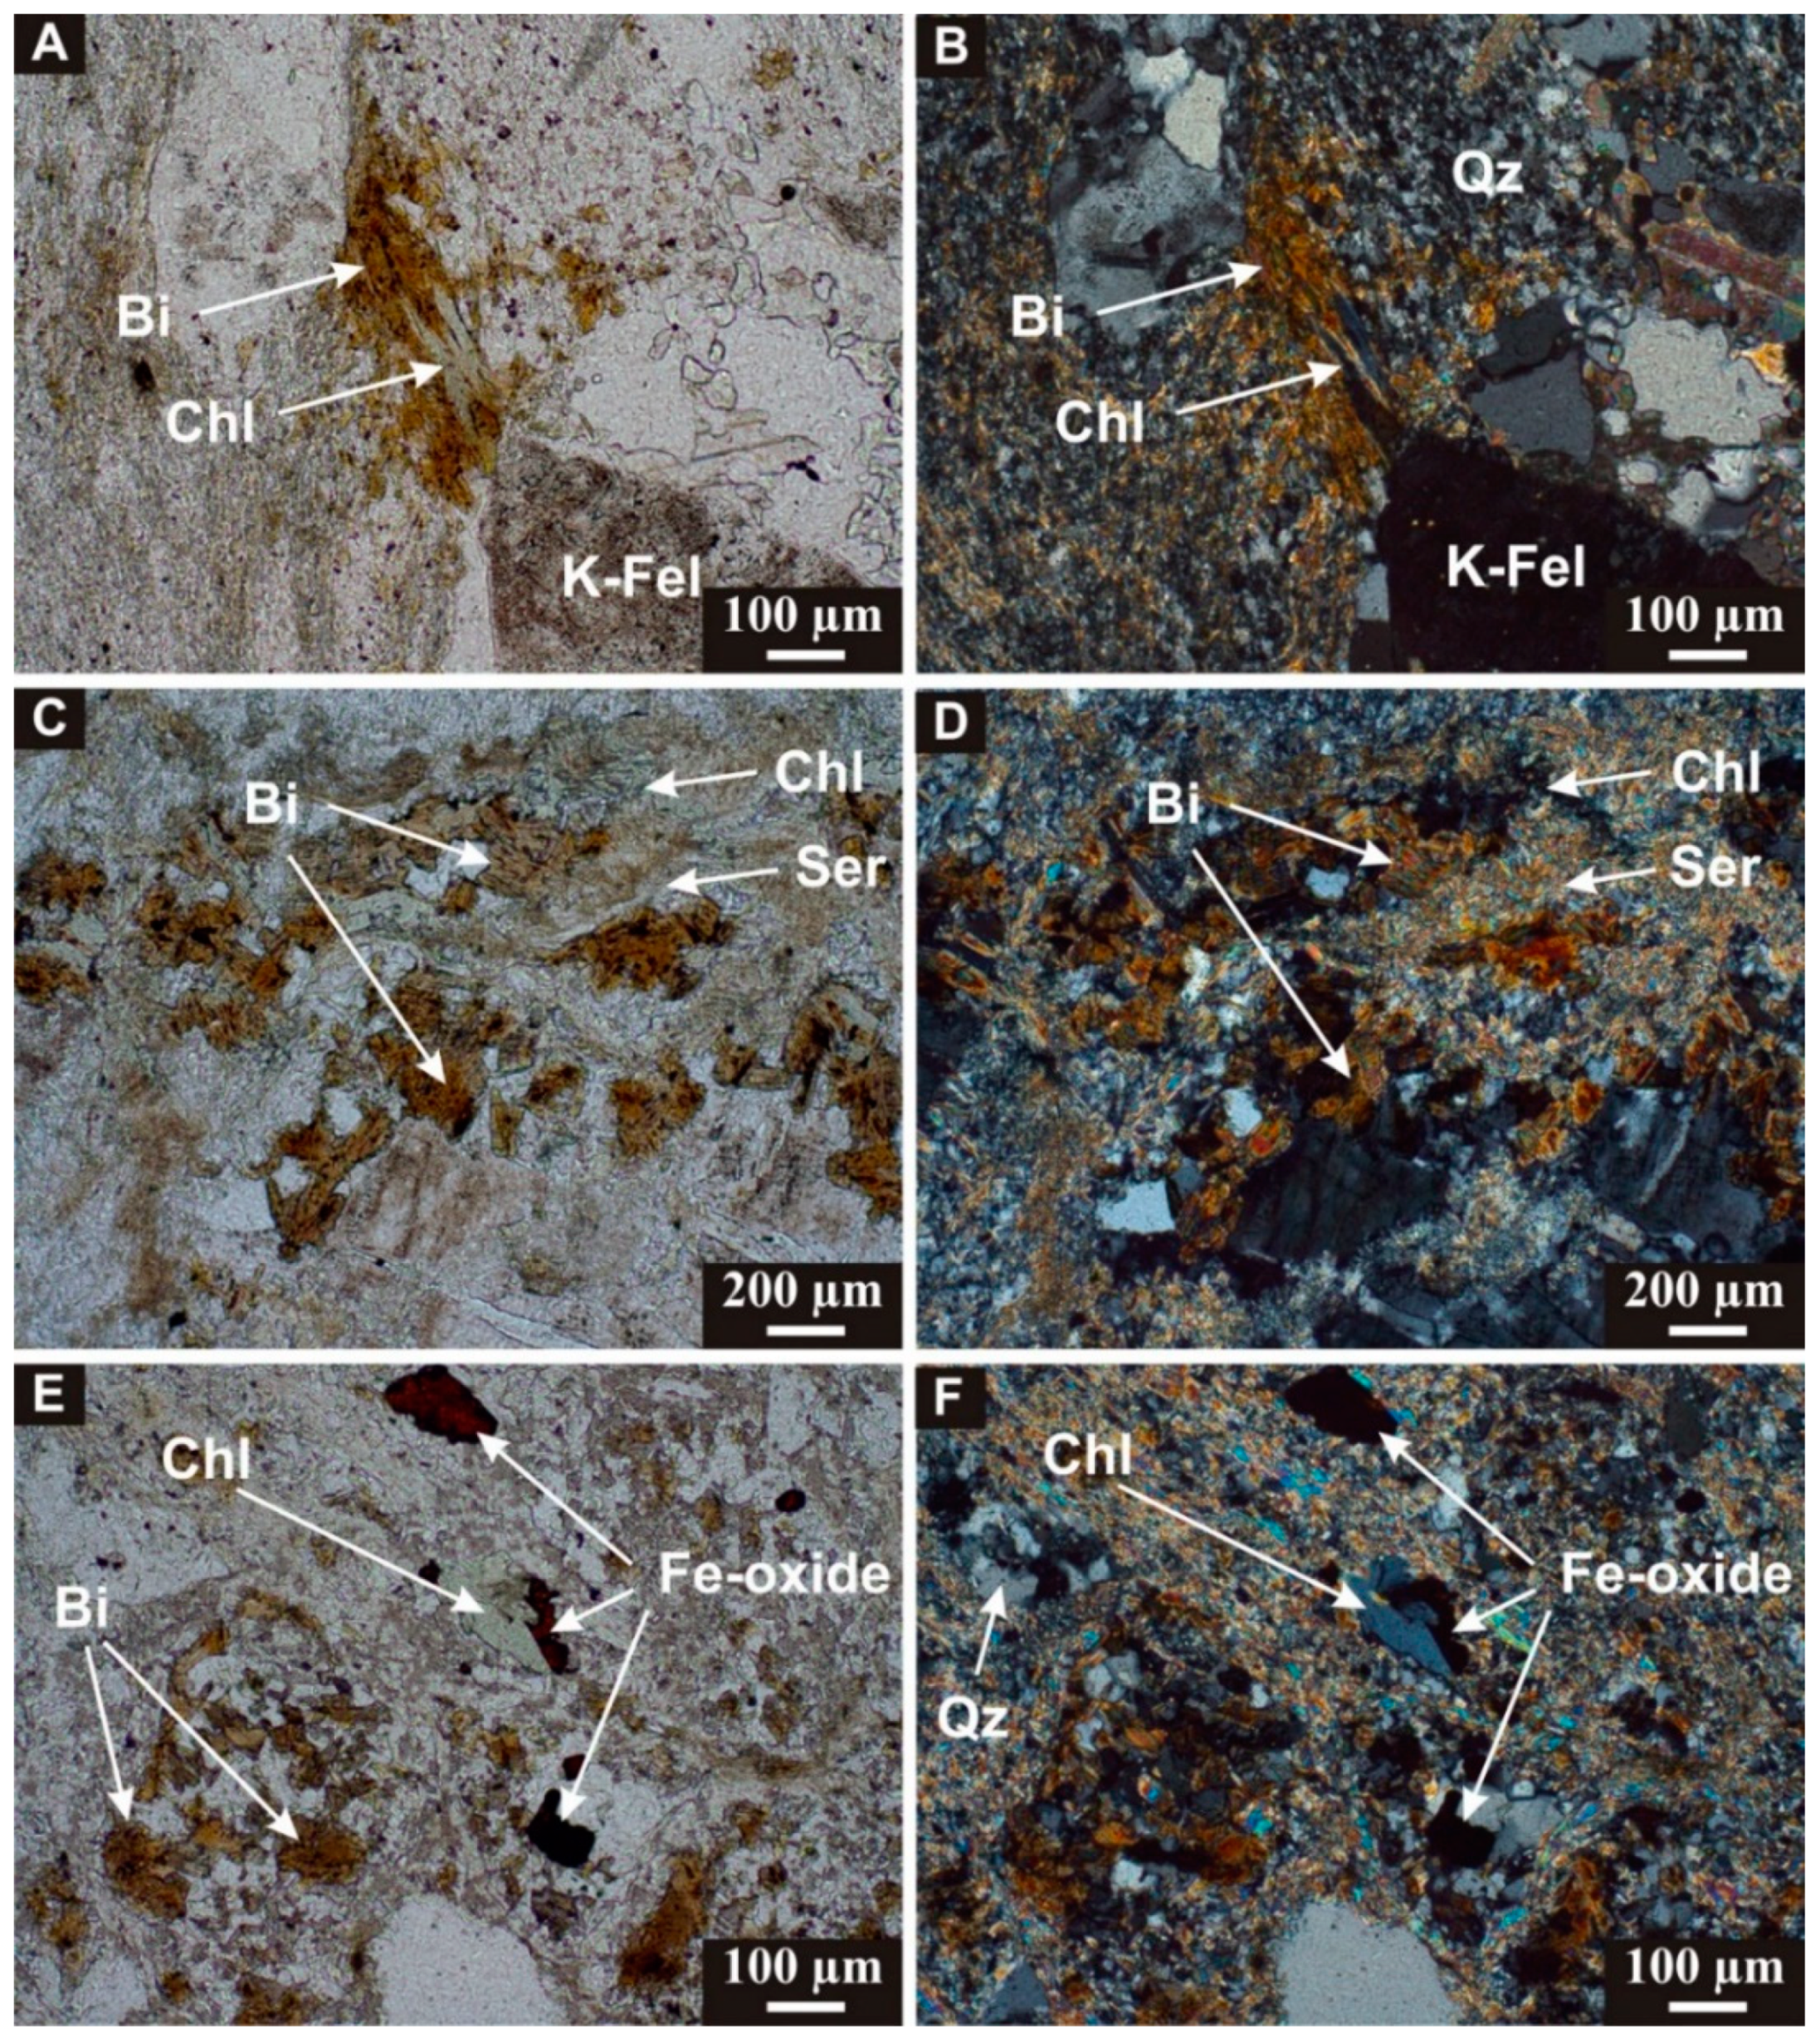
4.1. Petrography
4.1.1. Chlorite
4.1.2. White Mica
4.1.3. Biotite
4.2. Geochemical Results of Individual Phyllosilicates
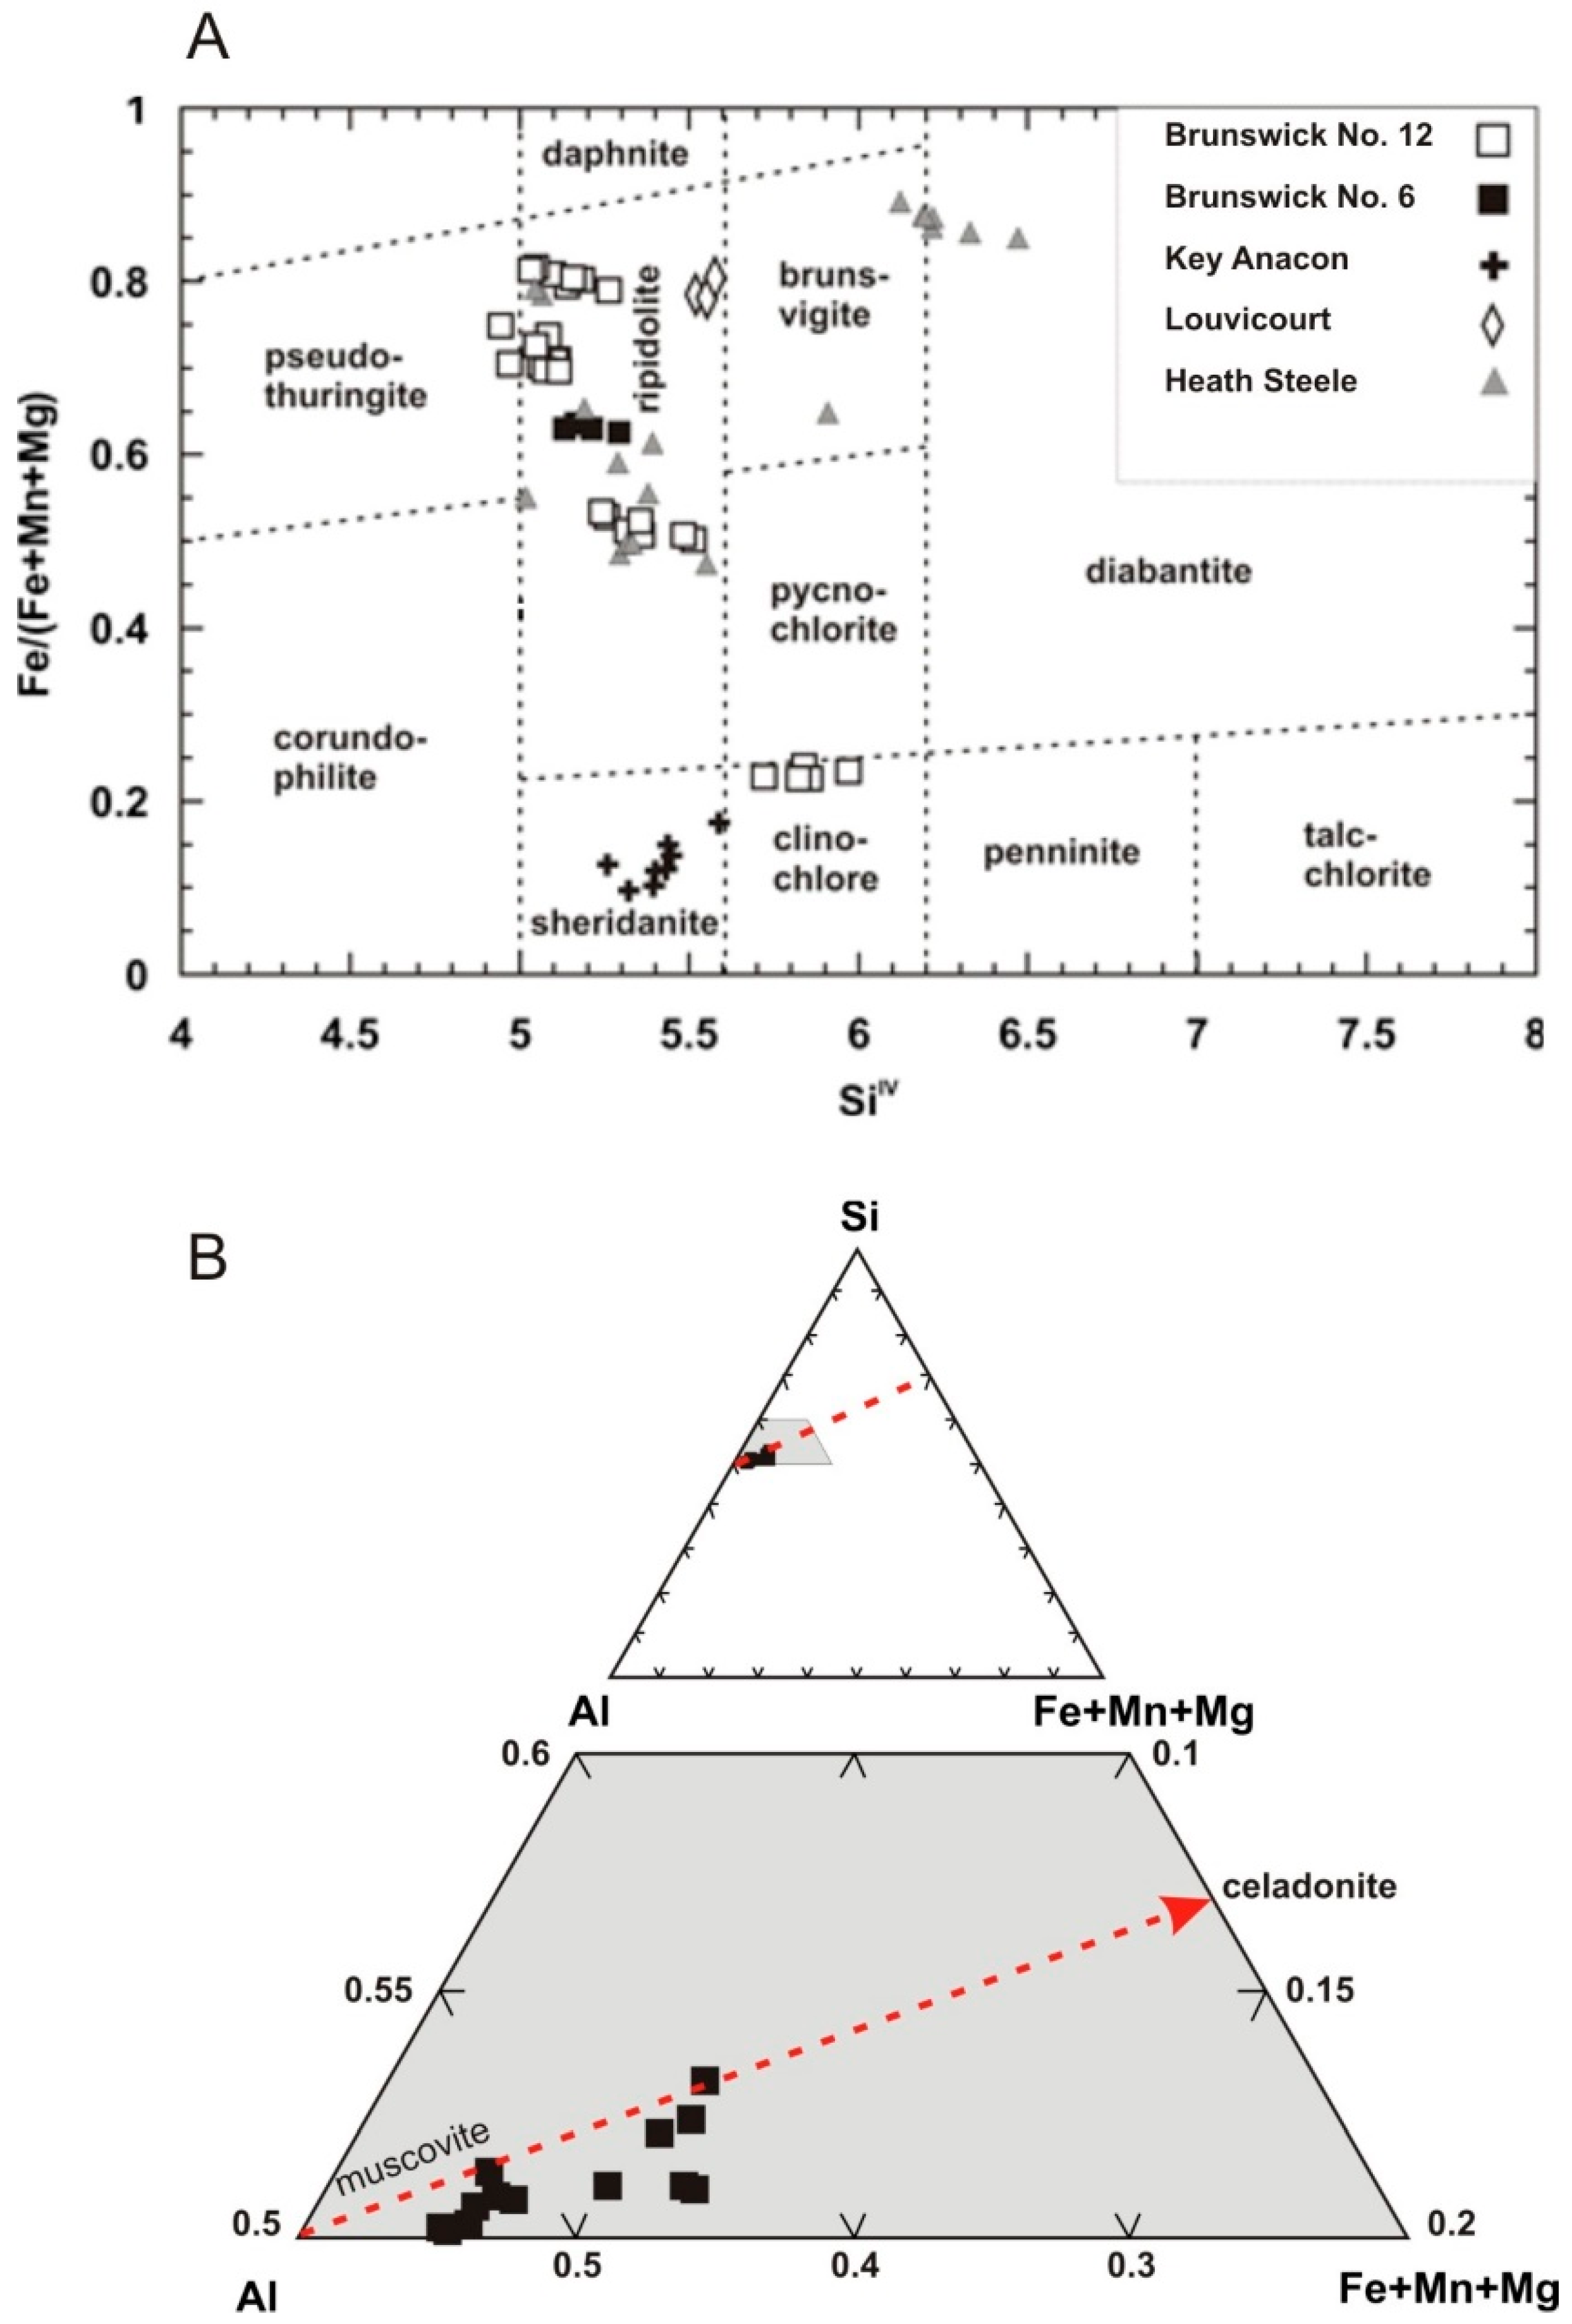
4.2.1. Chlorite Chemical Variations
4.2.2. White Mica Chemical Variations
4.2.3. Biotite Chemical Variations
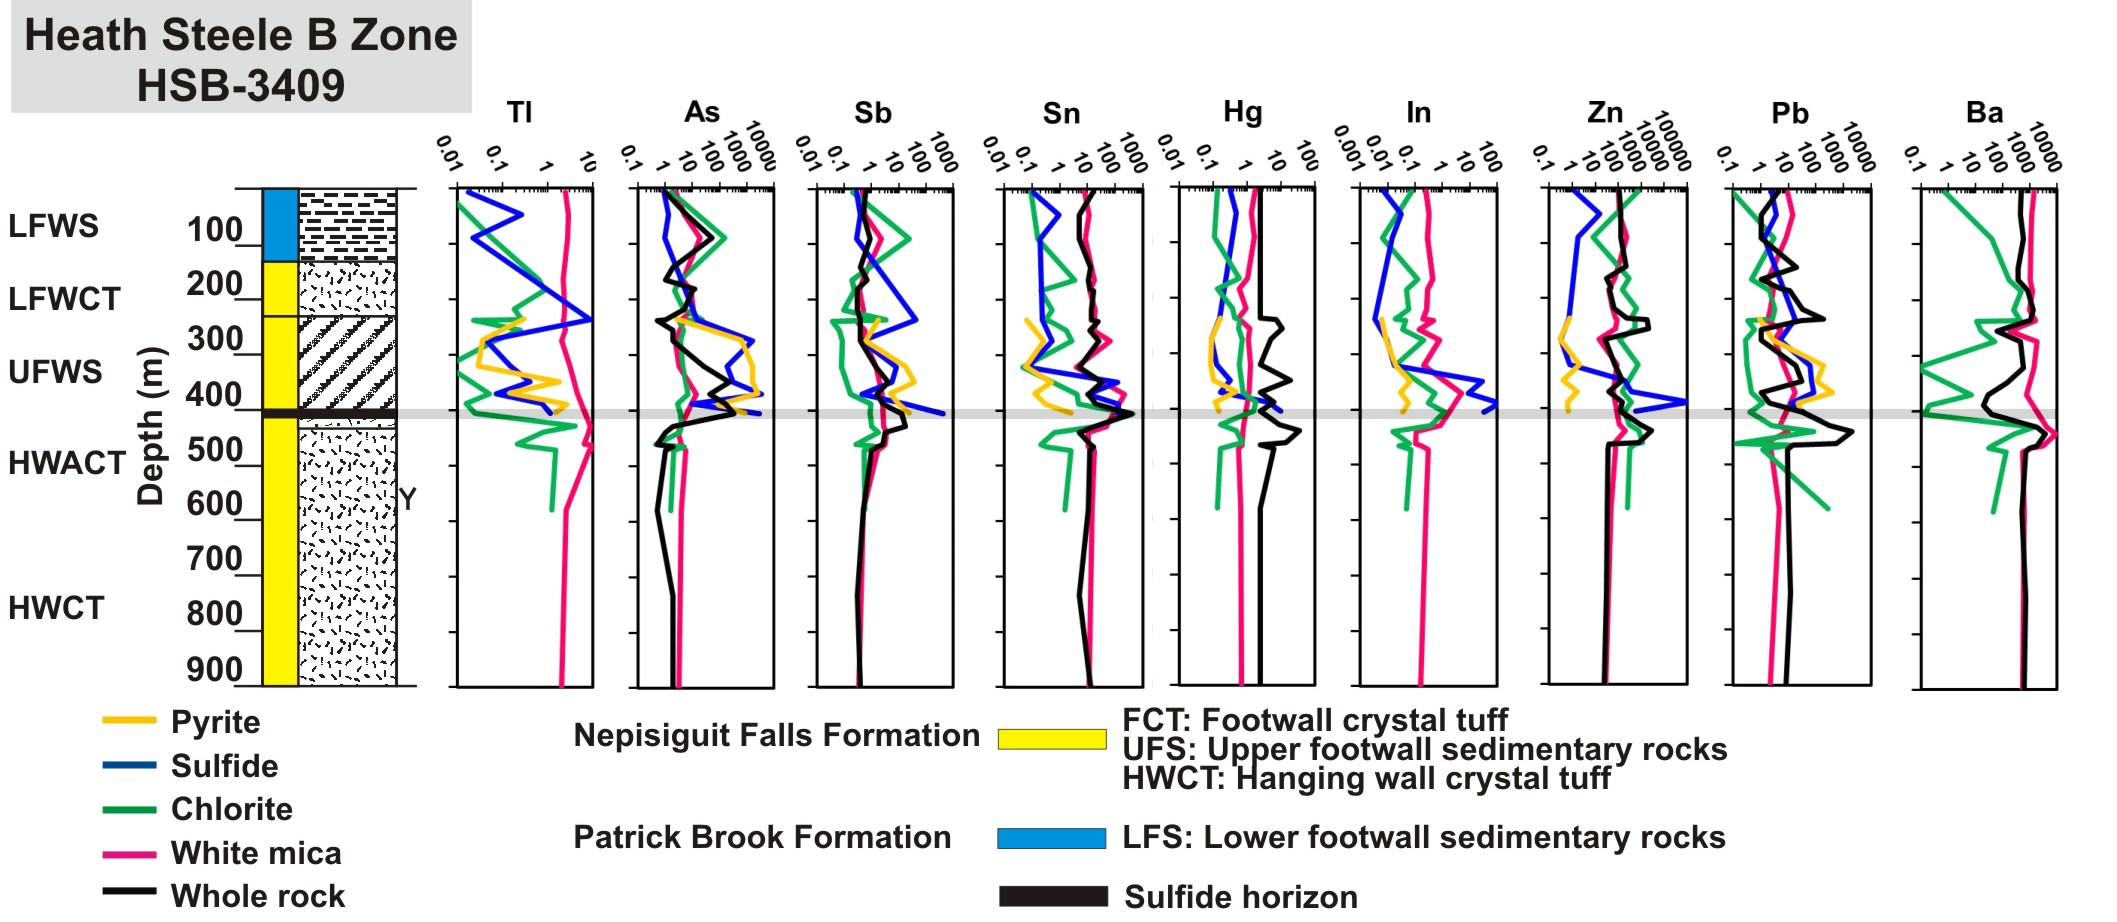
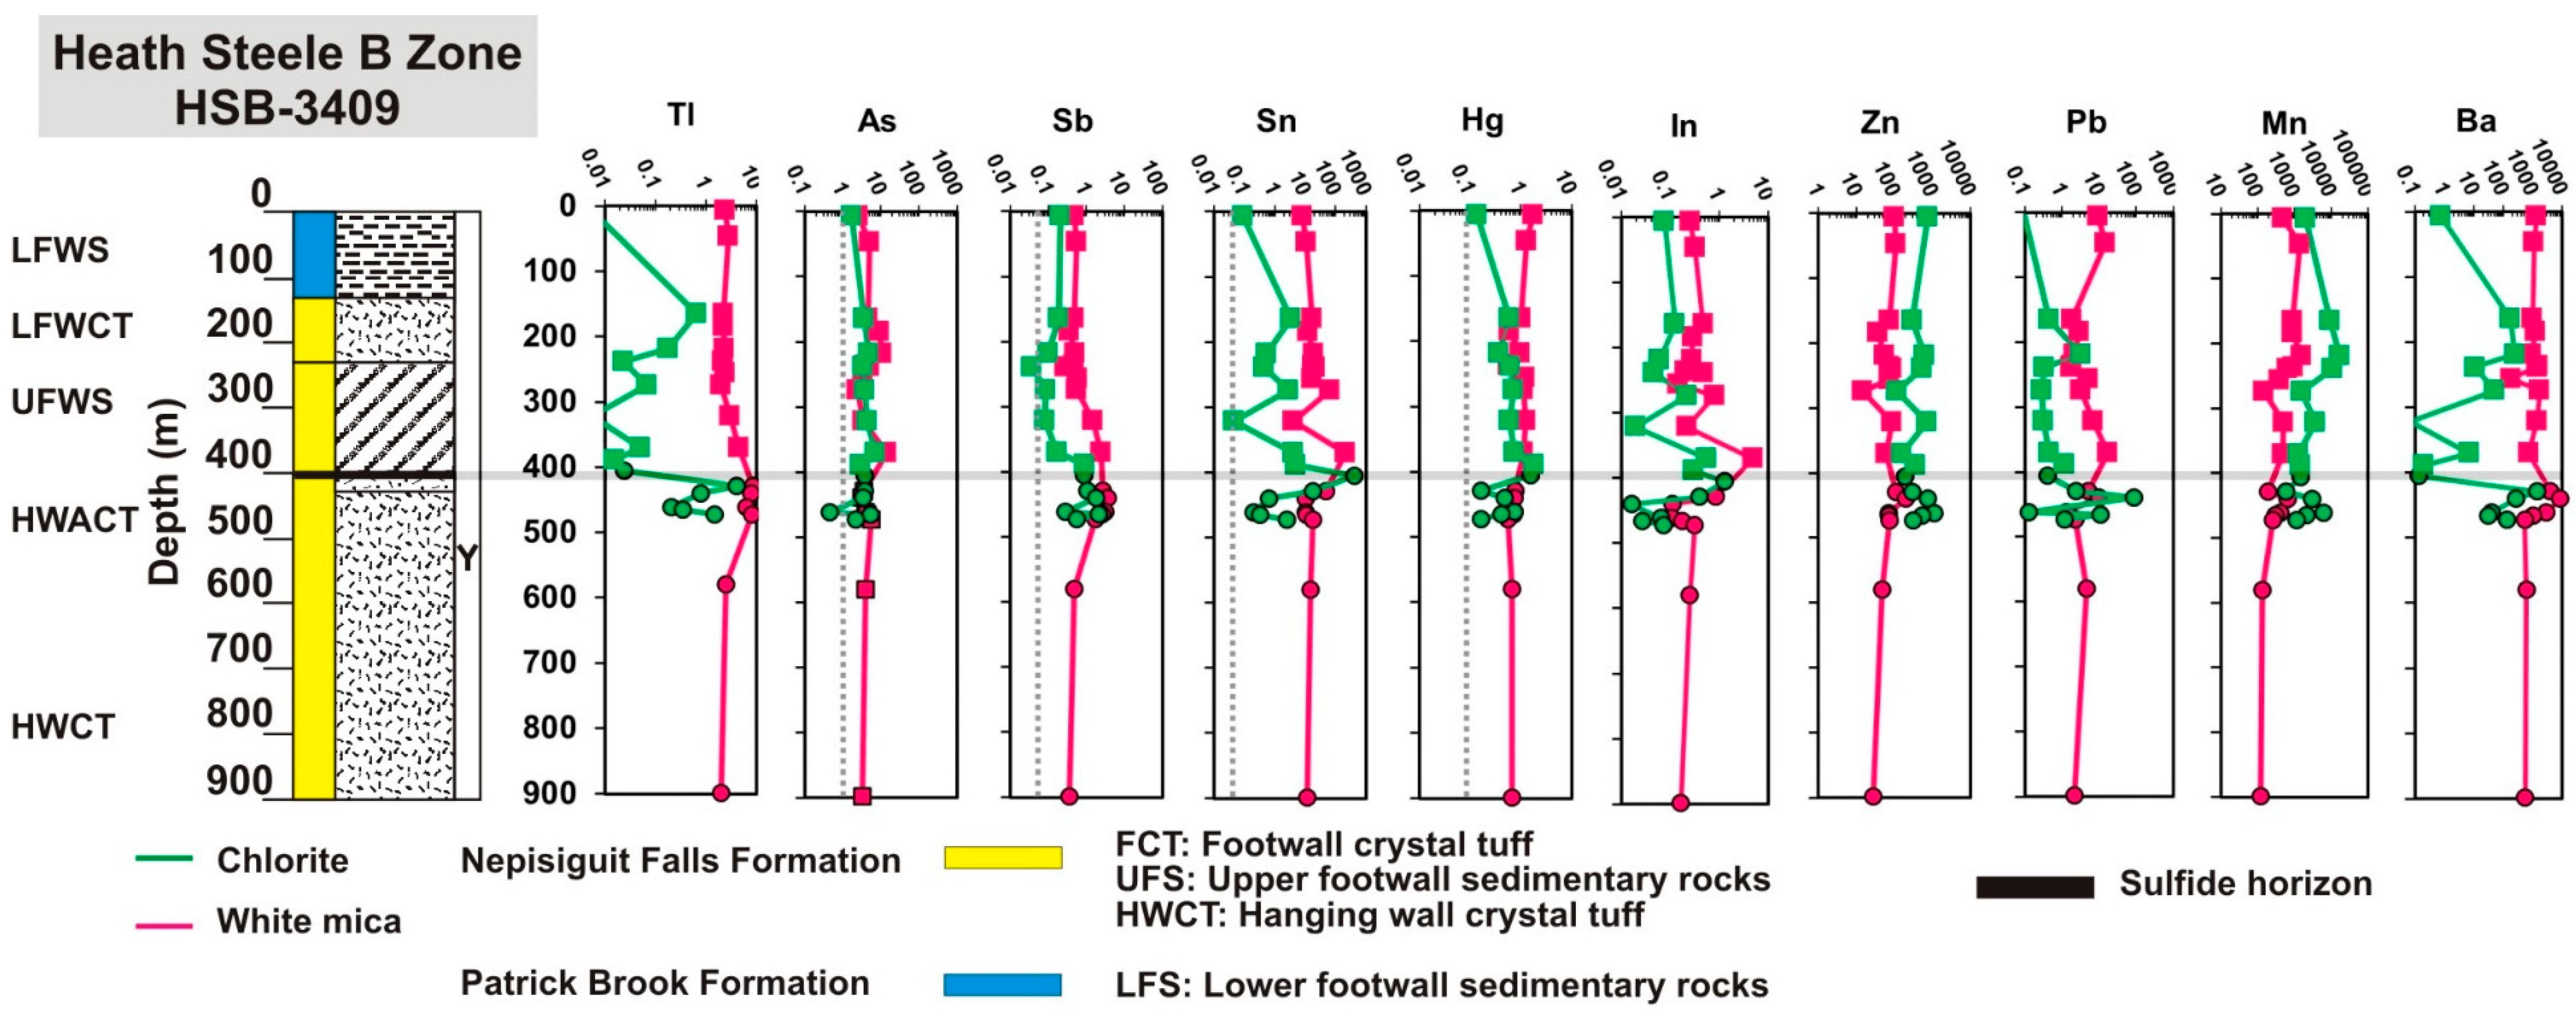
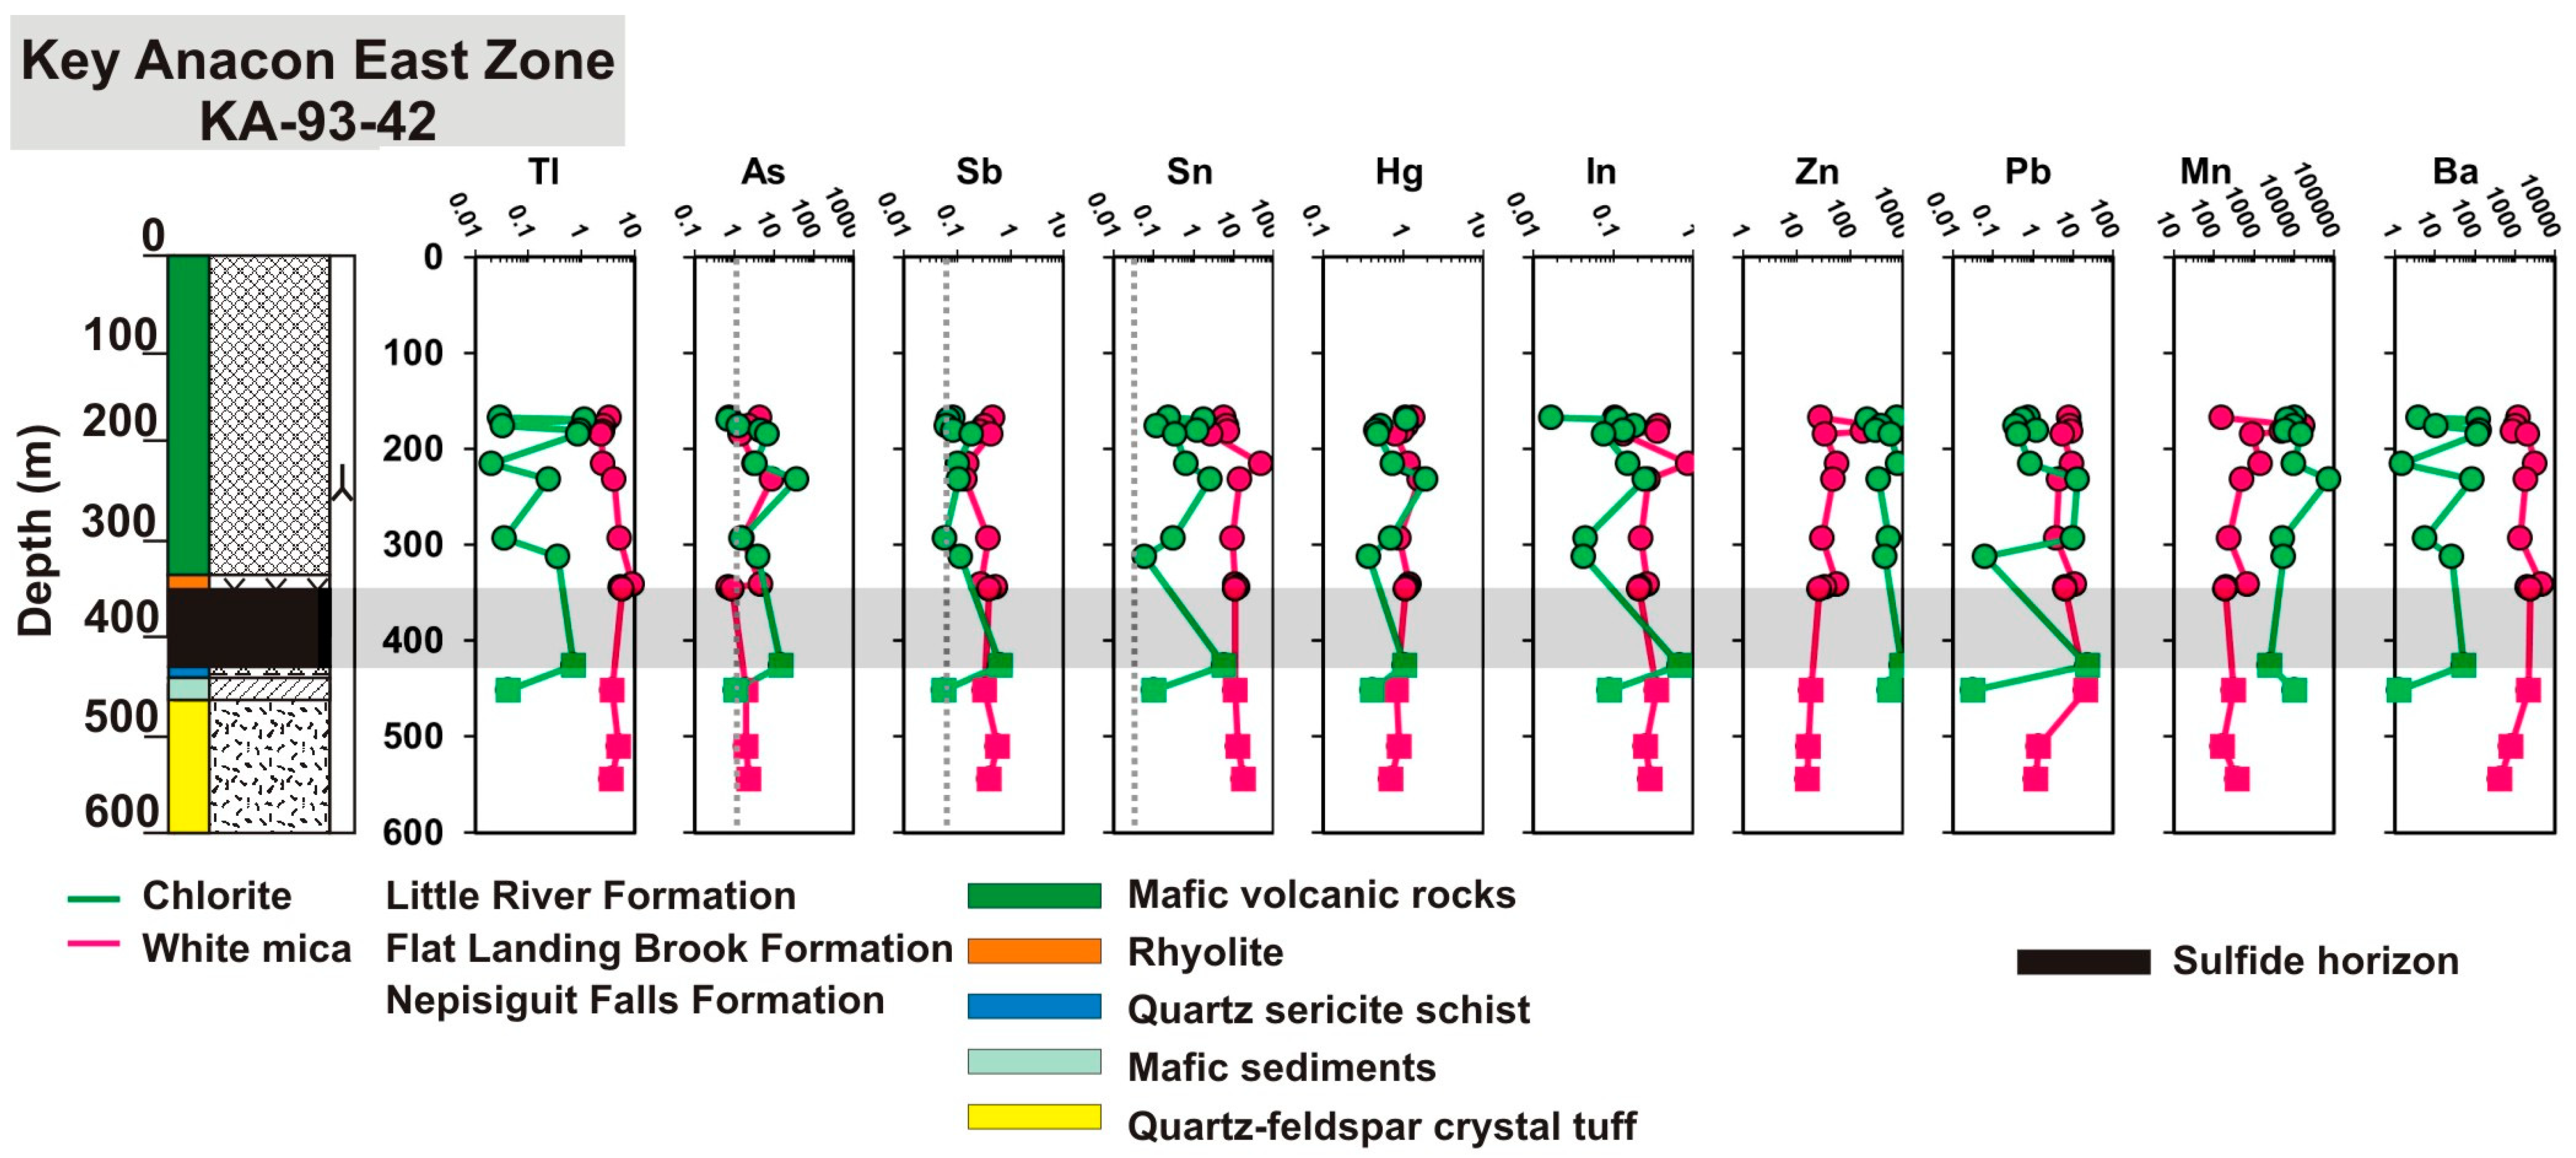
4.3. Fluid-Mobile Elements Variation of Phyllosilicates from the Studied Deposit Profiles
4.3.1. Tetagouche Group Deposits
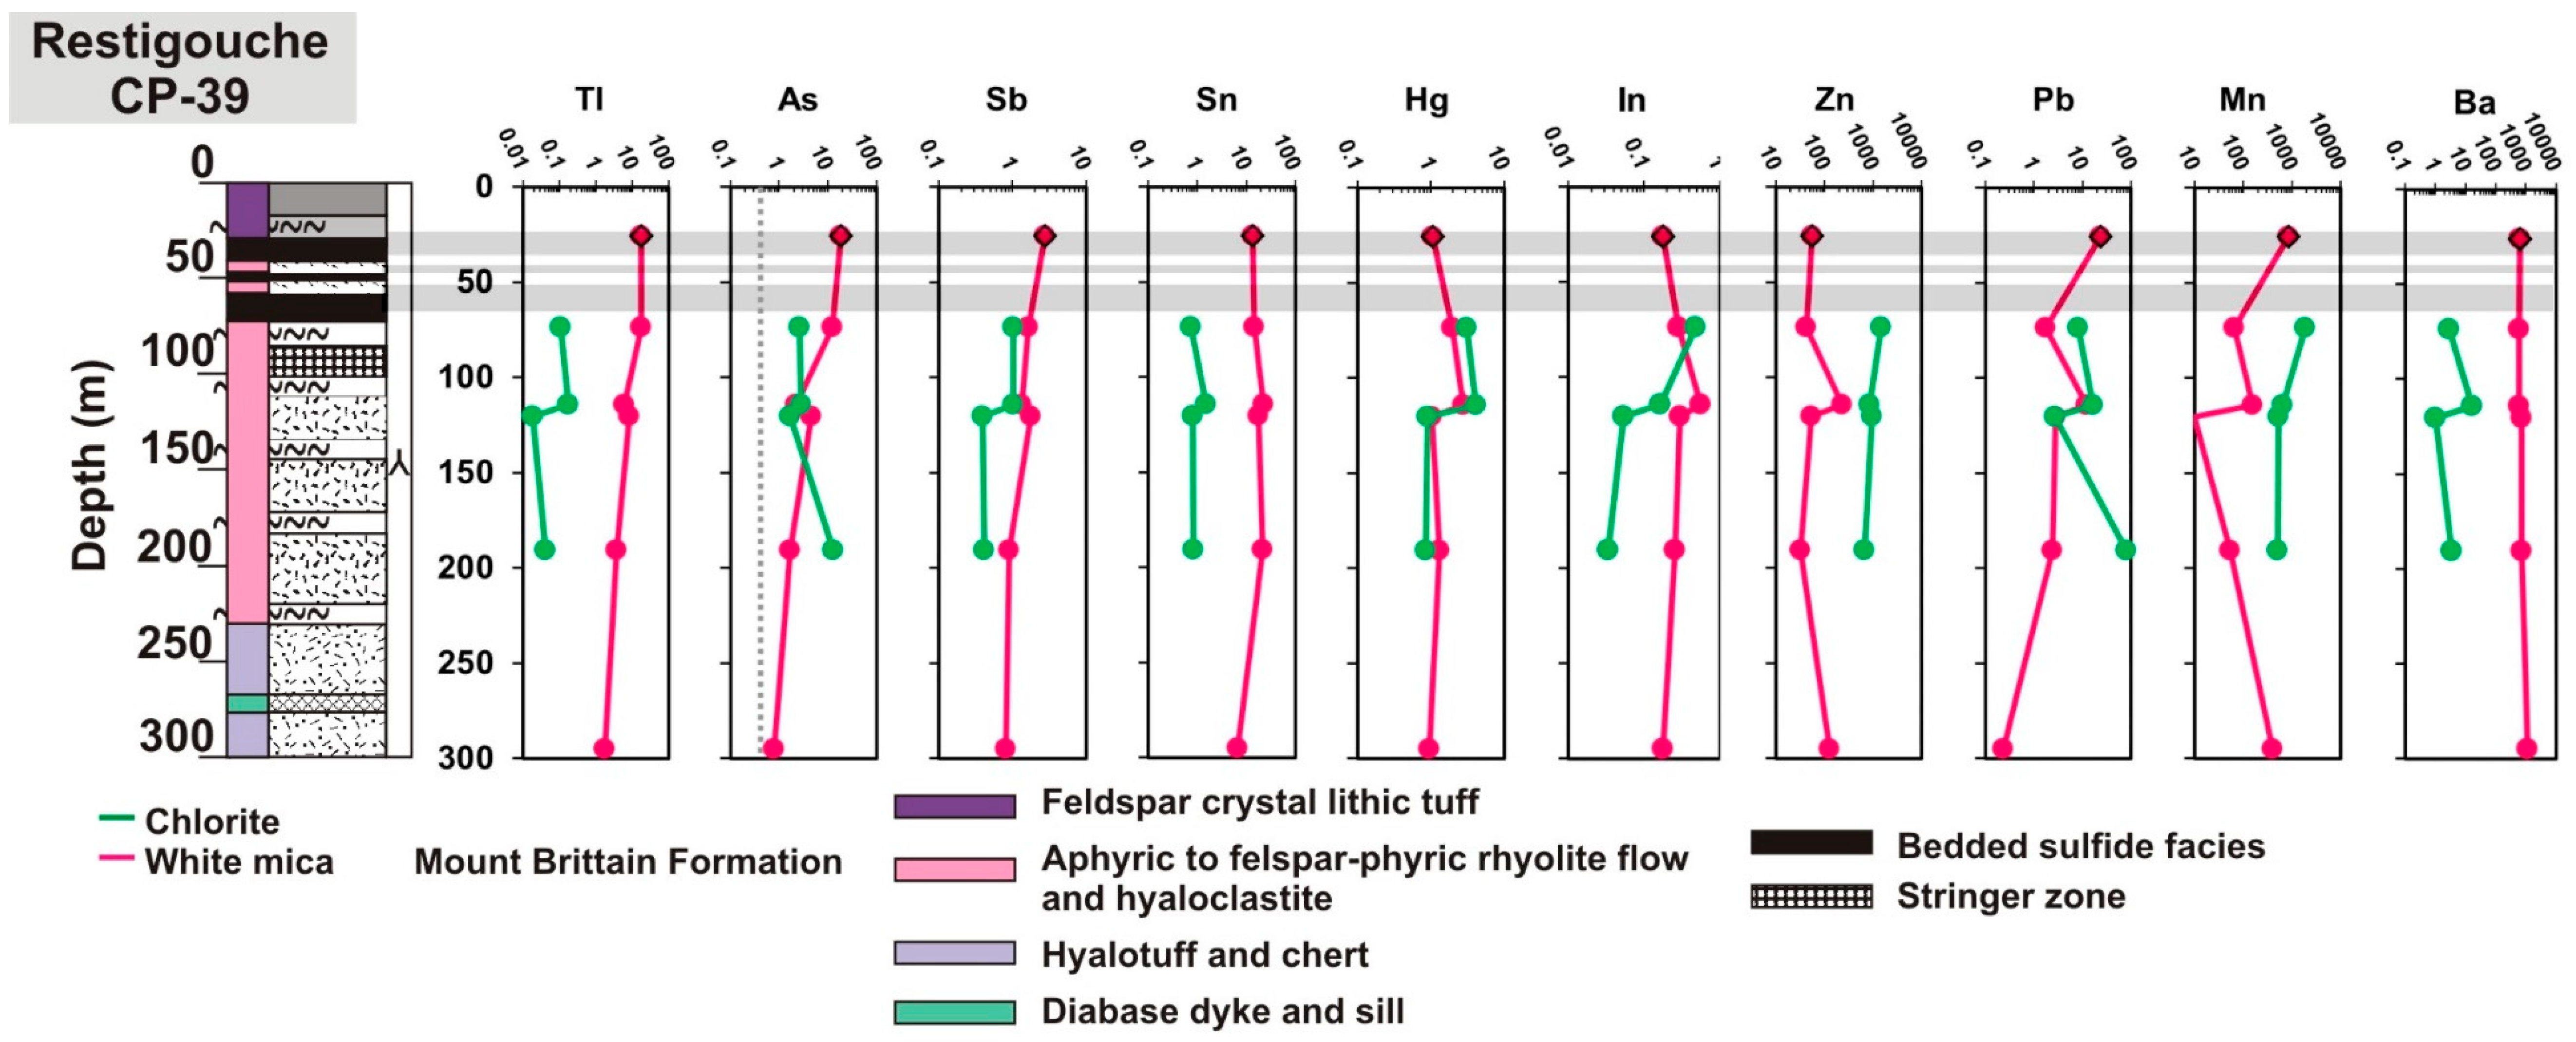
4.3.2. California Lake Group Deposit
5. Discussion
5.1. Origin of Phyllosilicates in the BMC
5.2. Distribution of Fluid-Mobile Elements in Phyllosilicates
5.3. Fluid-Mobile Element Distribution Patterns at Deposit Scale
6. Conclusions and Implication for VMS Exploration
Supplementary Materials
Author Contributions
Funding
Acknowledgments
Conflicts of Interest
References
- Galley, A.G.; Hannington, M.D.; Jonasson, I.R. Volcanogenic massive sulfide deposits. In Mineral Deposits of Canada: A Synthesis of Major Deposit-Types, District Metallogeny, the Evolution of Geological Provinces, and Exploration Methods; Goodfellow, W.D., Ed.; Special Publication No. 5; Geological Association of Canada, Mineral Deposits Division: St. John’s, NL, Canada, 2007; pp. 141–161. [Google Scholar]
- Fleet, M.E.; Deer, W.A.; Howie, R.A.; Zussman, J. Rock-Forming Minerals: Micas; Geological Society of London: London, UK, 2003; p. 782. [Google Scholar]
- Urabe, T.; Scott, S. Geology and footwall alteration of the South Bay massive sulfide deposit, northwestern Ontario, Canada. Can. J. Earth Sci. 1983, 20, 1862–1879. [Google Scholar] [CrossRef]
- Gemmell, J.B.; Fulton, R. Geology, genesis, and exploration implications of the footwall and hanging-wall alteration associated with the Hellyer volcanic-hosted massive sulfide deposit, Tasmania, Australia. Econ. Geol. 2001, 96, 1003–1035. [Google Scholar] [CrossRef]
- Large, R.R.; McPhie, J.; Gemmel, J.B.; Herrmann, W.; Davidson, G.J. The spectrum of ore deposit types, volcanic environments, alteration halos, and related exploration vectors in submarine volcanic successions: Some examples from Australia. Econ. Geol. 2001, 96, 913–938. [Google Scholar]
- Herrmann, W.; Blake, M.; Doyle, M.; Huston, D.; Kamprad, J.; Merry, N.; Pontual, S. Short wavelength infrared (SWIR) spectral analysis of hydrothermal alteration zones associated with base metal sulfide deposits at Rosebery and Western Tharsis, Tasmania, and Highway-Reward, Queensland. Econ. Geol. 2001, 96, 939–955. [Google Scholar] [CrossRef]
- Paulick, H.; Herrmann, W.; Gemmell, J.B. Alteration of felsic volcanics hosting the Thalanga massive sulfide deposit (Northern Queensland, Australia) and geochemical proximity indicators to ore. Econ. Geol. 2001, 96, 1175–1200. [Google Scholar] [CrossRef]
- Lentz, D.R.; Hall, D.C.; Hoy, L.D. Chemostratigraphic, alteration, and oxygen isotopic trends in a profile through the stratigraphic sequence hosting the Heath Steele B zone massive sulfide deposit, New Brunswick. Can. Mineral. 1997, 35, 841–874. [Google Scholar]
- Lentz, D.R.; Goodfellow, W.D. Geochemistry of the stringer sulfide zone in the discovery hole at the Brunswick No. 12 massive sulfide deposit, Bathurst, New Brunswick. Geol. Surv. Can. Curr. Res. 1993, 93E, 259–269. [Google Scholar]
- Lentz, D.R.; Goodfellow, W.D. Character, distribution, and origin of zoned hydrothermal alteration features at the Brunswick No. 12 massive sulfide deposit, Bathurst Mining Camp, New Brunswick. In Current Research; Abbott, S.A., Ed.; New Brunswick Department: New Brunswick, Canada, 1994; Volume 1, pp. 94–119. [Google Scholar]
- Lentz, D.R.; Goodfellow, W.D. Intense silicification of footwall sedimentary rocks in the stockwork alteration zone beneath the Brunswick No. 12 massive sulfide deposit, Bathurst, New Brunswick. Can. J. Earth Sci. 1996, 33, 284–302. [Google Scholar] [CrossRef]
- Walker, J.A.; McCutcheon, S.R. A chemostratigraphic assessment of core from the discovery hole of the Halfmile Lake Deep VMS Zone, Bathurst Mining Camp, northeastern New Brunswick. In Geological Investigations in New Brunswick for 2010; Martin, G.L., Ed.; Lands, Minerals and Petroleum Division, Mineral Resource Report; New Brunswick Department of Natural Resources: South Tetagouche, NB, Canada, 2011; Volume 2, pp. 1–49. [Google Scholar]
- Goodfellow, W.D. Geology and genesis of the Caribou deposit, Bathurst Mining Camp, New Brunswick, Canada. Econ. Geol. Monogr. 2003, 11, 327–360. [Google Scholar]
- Bein, A. Volcanic Stratigraphy, Chemostratigraphy, and Hydrothermal Alteration of Felsic Volcanic Rocks of the Mount Brittain Formation that Host the Restigouche VMS Deposit, Bathurst Mining Camp, northern New Brunswick. Master’s Thesis, The University of New Brunswick, Fredericton, NB, Canada, 2010. [Google Scholar]
- Zulu, J.D.S. Deformation and metamorphism of the Key Anacon Zn-Pb-Cu-Ag deposits, Bathurst Mining Camp, New Brunswick, Canada. Ph.D. Thesis, The University of New Brunswick, Fredericton, NB, Canada, 2012. [Google Scholar]
- MacLean, W.; Hoy, L.D. Geochemistry of hydrothermally altered rocks at the Horne mine, Noranda, Quebec. Econ. Geol. 1991, 86, 506–528. [Google Scholar] [CrossRef]
- Eastoe, C.J.; Solomon, M.; Walshe, J. District-scale alteration associated with massive sulfide deposits in the Mount Read Volcanics, western Tasmania. Econ. Geol. 1987, 82, 1239–1258. [Google Scholar] [CrossRef]
- Urabe, T.; Scott, S.; Hattori, K. A comparison of footwall-rock alteration and geothermal systems beneath some Japanese and Canadian volcanogenic massive sulfide deposits. Econ. Geol. Monogr. 1983, 5, 345–364. [Google Scholar]
- Kranidiotis, P.; MacLean, W. Systematics of chlorite alteration at the Phelps Dodge massive sulfide deposit, Matagami, Quebec. Econ. Geol. 1987, 82, 1898–1911. [Google Scholar] [CrossRef]
- Yang, K.; Huntington, J.; Gemmell, J.; Scott, K. Variations in composition and abundance of white mica in the hydrothermal alteration system at Hellyer, Tasmania, as revealed by infrared reflectance spectroscopy. J. Geochem. Explor. 2011, 108, 143–156. [Google Scholar] [CrossRef]
- Large, R.R.; Allen, R.L.; Blake, M.D.; Herrmann, W. Hydrothermal alteration and volatile element halos for the Rosebery K lens volcanic-hosted massive sulfide deposit, western Tasmania. Econ. Geol. 2001, 96, 1055–1072. [Google Scholar] [CrossRef]
- McClenaghan, S.H. Trace-element Systematics of Volcanogenic Massive Sulfide Deposits in the Bathurst Mining Camp, New Brunswick, Canada: Exploration to Petrogenetic Implications. Ph.D. Thesis, The University of New Brunswick, Fredericton, NB, Canada, 2011; p. 694. [Google Scholar]
- Relvas, J.M.; Barriga, F.J.; Ferreira, A.; Noiva, P.C.; Pacheco, N.; Barriga, G. Hydrothermal alteration and mineralization in the Neves-Corvo volcanic-hosted massive sulfide deposit, Portugal. I. Geology, mineralogy, and geochemistry. Econ. Geol. 2006, 101, 753–790. [Google Scholar] [CrossRef]
- Clarke, D.B.; Bogutyn, P.A. Oscillatory epitactic-growth zoning in biotite and muscovite from the Lake Lewis leucogranite, South Mountain Batholith, Nova Scotia, Canada. Can. Mineral. 2003, 41, 1027–1047. [Google Scholar] [CrossRef]
- Yang, P.; Rivers, T. Trace element partitioning between coexisting biotite and muscovite from metamorphic rocks, Western Labrador: Structural, compositional and thermal controls. Geochim. Cosmochim. Acta 2000, 64, 1451–1472. [Google Scholar] [CrossRef]
- Wilkinson, J.J.; Chang, Z.; Cooke, D.R.; Baker, M.J.; Wilkinson, C.C.; Inglis, S.; Chen, H.; Gemmell, J.B. The chlorite proximitor: A new tool for detecting porphyry ore deposits. J. Geochem. Explor. 2015, 152, 10–26. [Google Scholar] [CrossRef] [Green Version]
- Soltani Dehnavi, A. Volatile-Element Signature of Volcanigenic Massive sulfide Deposits in the Bathurst Mining Camp, New Brunswick, Canada. Ph.D. Thesis, The University of New Brunswick, Fredericton, NB, Canada, 2017. [Google Scholar]
- Soltani Dehnavi, A.; Lentz, D.R.; McFarlane, C.R.M.; Walker, J.A. Quantification of fluid-mobile elements in white mica by LA-ICP-MS: A potential micro-chemical vectoring tool in VMS exploration. J. Geochem. Explor. 2018, 188, 290–307. [Google Scholar] [CrossRef]
- Van Staal, C.R.; Wilson, R.; Rogers, N.; Fyffe, L.R.; Gower, S.J.; Langton, J.P.; McCutcheon, S.R.; Walker, J.A. A new geologic map of the Bathurst Mining Camp and surrounding areas—A product of integrated geological, geochemical, and geophysical data. Econ. Geol. Monogr. 2003, 11, 61–64. [Google Scholar]
- Van Staal, C.R.; Wilson, R.; Rogers, N.; Fyffe, L.; Langton, J.; McCutcheon, S.; McNicoll, V.; Ravenhurst, C. Geology and tectonic history of the Bathurst Supergroup, Bathurst Mining Camp, and its relationships to coeval rocks in southwestern New Brunswick and adjacent Maine-a synthesis. Econ. Geol. Monogr. 2003, 11, 37–60. [Google Scholar]
- Goodfellow, W.D.; McCutcheon, S. Geologic and genetic attributes of volcanic sediment-hosted massive sulfide deposits of the Bathurst Mining Camp, northern New Brunswick-a synthesis. Econ. Geol. Monogr. 2003, 11, 245–301. [Google Scholar]
- Van Staal, C.R.; Wilson, R.A. The Popelogan arc—Tetagouche backarc basin, the Brunswick Subduction Complex and the Salinic Orogeny in northern New Brunswick. In Proceedings of the GAC-MAC Joint Annual Meeting, Fredericton, NB, Canada, 21–23 May 2014; Field Trip Guidebook A2. p. 41. [Google Scholar]
- Van Staal, C.R. Brunswick subduction complex in the Canadian Appalachians: Record of the Late Ordovician to Late Silurian collision between Laurentia and the Gander margin of Avalon. Tectonics 1994, 13, 946–962. [Google Scholar] [CrossRef]
- Currie, K.; Van Staal, C.R.; Peter, J.; Rogers, N. Conditions of metamorphism of the main massive sulfide deposits and surrounding host rocks in the Bathurst Mining Camp: Massive Sulfide Deposits of the Bathurst Mining Camp, New Brunswick, and northern Maine. Econ. Geol. Monogr. 2003, 11, 65–78. [Google Scholar]
- McCutcheon, S.R.; Walker, J.A.; McClenaghan, S.H. The geologic setting of massive sulfide deposits in the Bathurst Mining Camp: A synthesis. In Current Research 2000; Carroll, B.M.W., Ed.; New Brunswick Department of Natural Resources and Energy, Minerals and Energy Division, Mineral Resources Report; Society of Economic Geologists: Littleton, CO, USA, 2001; Volume 4, pp. 63–95. [Google Scholar]
- Goodfellow, W.D.; McCutcheon, S.R.; Peter, J.M. Massive sulfide deposits of the Bathurst Mining Camp, New Brunswick, and northern Maine. Massive Sulfide Deposits of the Bathurst Mining Camp, New Brunswick and Northern Maine; Society of Economic Geologists: Littleton, CO, USA, 2003; Volume 11. [Google Scholar]
- Van Staal, C.R.; Rogers, N.; Taylor, B. Formation of low-temperature mylonites and phyllonites by alkali-metasomatic weakening of felsic volcanic rocks during progressive, subduction-related deformation. J. Struct. Geol. 2001, 23, 903–921. [Google Scholar] [CrossRef]
- De Roo, J.A.; van Staal, C.R. Transpression and extensional collapse: Steep belts and flat belts in the Appalachian Central Mobile Belt, northern New Brunswick, Canada. Geol. Soc. Am. Bull. 1994, 106, 541–552. [Google Scholar] [CrossRef]
- Luff, W.M.; Goodfellow, W.D.; Juras, S.J. Evidence for a feeder pipe and associated alteration at Brunswick No. 12 massive-sulfide deposit. Explor. Min. Geol. 1992, 1, 167–185. [Google Scholar]
- Yang, K.; Scott, S.D.; Goodfellow, W. Footwall alteration associated with massive sulfide deposits in the Bathurst Mining Camp, New Brunswick: Implication for seafloor hydrothermal mixing processes: Massive Sulfide Deposits of the Bathurst Mining Camp, New Brunswick, and northern Maine. Econ. Geol. Monogr. 2003, 11, 435–456. [Google Scholar]
- Yang, K.; Scott, S.D. Geochemical relationships of felsic magmas to ore metals in massive sulfide deposits of the Bathurst Mining Camp, Iberian Pyrite Belt, Hokuroku District, and the Abitibi Belt. Econ. Geol. Monogr. 2003, 11, 457–478. [Google Scholar]
- McFarlane, C.R.; Luo, Y. U-Pb geochronology using 193 nm Excimer LA-ICP-MS optimized for in-situ accessory mineral dating in thin sections. Geosci. Can. 2012, 39, 158–172. [Google Scholar]
- McFarlane, C.R.; McKeough, M. Petrogenesis of the Kulyk Lake monazite-apatite-Fe (Ti)-oxide occurrence revealed using in-situ LA-(MC)-ICP-MS trace element mapping, U-Pb dating, and Sm-Nd isotope systematics on monazite. Am. Mineral. 2013, 98, 1644–1659. [Google Scholar] [CrossRef]
- Paton, C.; Hellstrom, J.; Paul, B.; Woodhead, J.; Hergt, J. Iolite: Freeware for the visualisation and processing of mass spectrometric data. J. Anal. At. Spectrom. 2011, 26, 2508–2518. [Google Scholar] [CrossRef]
- Pearce, N.J.; Perkins, W.T.; Westgate, J.A.; Gorton, M.P.; Jackson, S.E.; Neal, C.R.; Chenery, S.P. A compilation of new and published major and trace element data for NIST SRM 610 and NIST SRM 612 glass reference materials. Geostand. Newsl. 1997, 21, 115–144. [Google Scholar] [CrossRef]
- Peter, J.M.; Kjarsgaard, I.M.; Goodfellow, W.D. Hydrothermal sedimentary rocks of the Heath Steele Belt, Bathurst Mining Camp, New Brunswick: Part 1. Mineralogy and mineral chemistry. Econ. Geol. Monogr. 2003, 11, 361–390. [Google Scholar]
- Peter, J.M.; Goodfellow, W.D. Mineralogy, bulk and rare earth element geochemistry of massive sulfide-associated hydrothermal sediments of the Brunswick Horizon, Bathurst Mining Camp, New Brunswick. Can. J. Earth Sci. 1996, 33, 252–283. [Google Scholar] [CrossRef]
- Hey, M.H. A new review of the chlorites. Mineral. Mag. 1954, 30, 277–292. [Google Scholar] [CrossRef]
- Cipriani, C.; Sassi, F.; Scolari, A. Metamorphic white micas: Definition of paragenetic fields. Schweizerische mineralogische und petrographische Mitteilungen 1971, 51, 259–302. [Google Scholar]
- Laird, J. Chlorites; metamorphic petrology. Rev. Mineral. Geochem. 1988, 19, 405–453. [Google Scholar]
- Utzmann, A.; Hansteen, T.; Schmincke, H. Trace element mobility during sub-seafloor alteration of basaltic glass from Ocean Drilling Program site 953 (off Gran Canaria). Int. J. Earth Sci. 2002, 91, 661–679. [Google Scholar] [CrossRef]
- Gifkins, C.C.; Allen, R.L.; McPhie, J. Apparent welding textures in altered pumice-rich rocks. J. Volcanol. Geotherm. Res. 2005, 142, 29–47. [Google Scholar] [CrossRef]
- Wolff-Boenisch, D.; Gislason, S.R.; Oelkers, E.H. The effect of crystallinity on dissolution rates and CO2 consumption capacity of silicates. Geochim. Cosmochim. Acta 2006, 70, 858–870. [Google Scholar] [CrossRef]
- Giorgetti, G.; Monecke, T.; Kleeberg, R.; Hannington, M.D. Low-temperature hydrothermal alteration of silicic glass at the Pacmanus hydrothermal vent field, Manus basin: An XRD, SEM and AEM-TEM study. Clays Clay Miner. 2006, 54, 240–251. [Google Scholar] [CrossRef]
- Valle, N.; Verney-Carron, A.; Sterpenich, J.; Libourel, G.; Deloule, E.; Jollivet, P. Elemental and isotopic (29Si and 18O) tracing of glass alteration mechanisms. Geochim. Cosmochim. Acta 2010, 74, 3412–3431. [Google Scholar] [CrossRef]
- Lentz, D.R. Recent Advances in Lithogeochemical Exploration for Massive-Sulfide Deposits in Volcano-Sedimentary Environments: Petrogenetic, Chemostratigraphic, and Alteration Aspects with Examples from the Bathurst Camp, New Brunswick; New Brunswick: New Brunswick Department of Natural Resources, Minerals, Policy and Planning Division, Mineral Resource Report; Society of Economic Geologists: Littleton, CO, USA, 1996; pp. 73–119. [Google Scholar]
- Hannington, M.D.; Kjarsgaard, I.M.; Galley, A.G.; Taylor, B. Mineral-chemical studies of metamorphosed hydrothermal alteration in the Kristineberg volcanogenic massive sulfide district, Sweden. Miner. Depos. 2003, 38, 423–442. [Google Scholar] [CrossRef]
- Lentz, D.R. Deformation-induced mass transfer in felsic volcanic rocks hosting the Brunswick No. 6 massive-sulfide deposit, New Brunswick: Geochemical effects and petrogenetic implications. Can. Mineral. 1999, 37, 489–512. [Google Scholar]
- Kellett, D.A.; van Staal, C.R.; Wilson, R.A.; Rogers, N. The age of salinic deformation constrained by 40Ar/39Ar dating of multiple cleavage domains: Bathurst Supergroup, New Brunswick Appalachians. Am. J. Sci. 2017, 317, 338–368. [Google Scholar] [CrossRef]
- Zane, A.; Sassi, R.; Guidotti, C.V. New data on metamorphic chlorite as a petrogenetic indicator mineral, with special regard to greenschist-facies rocks. Can. Mineral. 1998, 36, 713–726. [Google Scholar]
- Zane, A.; Weiss, Z. A procedure for classifying rock-forming chlorites based on microprobe data. Rendiconti Lincei 1998, 9, 51–56. [Google Scholar] [CrossRef]
- Bailey, S. X-ray diffraction identification of the polytypes of mica, serpentine, and chlorite: Clays Clay Miner. 1988, 36, 193–213. Clays Clay Miner. 1988, 36, 193–213. [Google Scholar] [CrossRef]
- Guidotti, C.V.; Sassi, F.P. Miscellaneous isomorphous substitutions in Na-K white micas: A review, with special emphasis to metamorphic micas. Rendiconti Lincei 1998, 9, 57–78. [Google Scholar] [CrossRef]
- Guidotti, C.V.; Sassi, F.P. Petrogenetic significance of Na-K white mica mineralogy: Recent advances for metamorphic rocks. Eur. J. Mineral. 1998, 10, 815–854. [Google Scholar] [CrossRef]
- Guidotti, C.V.; Sassi, F.P.; Blencoe, J.G.; Selverstone, J. The paragonite-muscovite solvus: I. PTX limits derived from the Na-K compositions of natural, quasibinary paragonite-muscovite pairs. Geochim. Cosmochim. Acta 1994, 58, 2269–2275. [Google Scholar] [CrossRef]
- Guidotti, C.; Sassi, F.; Sassi, R.; Blencoe, J. The effects of ferromagnesian components on the paragonite-muscovite solvus: A semiquantitative analysis based on chemical data for natural paragonite-muscovite pairs. J. Metamorph. Geol. 1994, 12, 779–788. [Google Scholar] [CrossRef]
- Shaw, D.M. The geochemistry of thallium. Geochim. Cosmochim. Acta 1952, 2, 118–154. [Google Scholar] [CrossRef]
- Ryan, P.C.; Reynolds, R.C. The chemical composition of serpentine/chlorite in the Tuscaloosa Formation, United States Gulf Coast: EDX vs. XRD determinations, implications for mineralogic reactions and the origin of anatase. Clays Clay Miner. 1997, 45, 339–352. [Google Scholar] [CrossRef]
- Soltani Dehnavi, A.; McFarlane, C.R.M.; Lentz, D.R.; Walker, J.A. Assessment of pyrite composition by LA-ICP-MS techniques from massive sulfide deposits of the Bathurst Mining Camp, Canada: From textural and chemical evolution to its application as a vectoring tool for the exploration of VMS deposits. Ore Geol. Rev. 2018, 92, 656–671. [Google Scholar] [CrossRef]
- O’Brien, J.J.; Spry, P.G.; Teale, G.S.; Jackson, S.E.; Koenig, A.E. Gahnite composition as a means to fingerprint metamorphosed massive sulfide and non-sulfide zinc deposits. J. Geochem. Explor. 2015, 159, 48–61. [Google Scholar] [CrossRef] [Green Version]


© 2019 by the authors. Licensee MDPI, Basel, Switzerland. This article is an open access article distributed under the terms and conditions of the Creative Commons Attribution (CC BY) license (http://creativecommons.org/licenses/by/4.0/).
Share and Cite
Soltani Dehnavi, A.; McFarlane, C.R.M.; Lentz, D.R.; McClenaghan, S.H.; Walker, J.A. Chlorite-White Mica Pairs’ Composition as a Micro-Chemical Guide to Fingerprint Massive Sulfide Deposits of the Bathurst Mining Camp, Canada. Minerals 2019, 9, 125. https://doi.org/10.3390/min9020125
Soltani Dehnavi A, McFarlane CRM, Lentz DR, McClenaghan SH, Walker JA. Chlorite-White Mica Pairs’ Composition as a Micro-Chemical Guide to Fingerprint Massive Sulfide Deposits of the Bathurst Mining Camp, Canada. Minerals. 2019; 9(2):125. https://doi.org/10.3390/min9020125
Chicago/Turabian StyleSoltani Dehnavi, Azam, Christopher R. M. McFarlane, David R. Lentz, Sean H. McClenaghan, and James A. Walker. 2019. "Chlorite-White Mica Pairs’ Composition as a Micro-Chemical Guide to Fingerprint Massive Sulfide Deposits of the Bathurst Mining Camp, Canada" Minerals 9, no. 2: 125. https://doi.org/10.3390/min9020125