Article

Real-Time Observation of Fibrous Zeolites Reactivity in Contact with Simulated Lung Fluids (SLFs) Obtained by Atomic Force Microscope (AFM)

by
Matteo Giordani
1,*,
Georgia Cametti
1,
Fulvio Di Lorenzo
1 and
Sergey V. Churakov
1,2
1
Institut of Geological Sciences, University of Bern, Baltzerstrasse 3+1, CH-3012 Bern, Switzerland
2
Paul Scherrer Institute, Forschungsstr 111, Villigen PSI, CH-3012 Bern, Switzerland
*
Author to whom correspondence should be addressed.
Minerals 2019, 9(2), 83; https://doi.org/10.3390/min9020083
Submission received: 27 December 2018 / Revised: 13 January 2019 / Accepted: 22 January 2019 / Published: 29 January 2019
(This article belongs to the Special Issue Natural Zeolites)

Abstract

:
Inhalation of fibrous erionite particles has been linked to malignant mesothelioma. Accordingly, erionite is considered the most carcinogenic mineral. The reactivity and the nature of erionite biotoxicity has been the subject of intensive research. Despite very close chemical and structural relationships between erionite and offretite, the reactivity of offretite in lung fluids remains unknown. In this paper, the interaction of erionite and offretite surfaces with simulated lung fluids was investigated by means of in situ atomic force microscope (AFM). To simulate different environments in the lungs, artificial lysosomal fluid (ALF) and Gamble’s solution were used. In ALF (4.15 < pH < 4.31) the dissolution of erionite and offretite surfaces was detected, as well as an evident removal of particles (mainly attributed to impurities) from the crystal faces. Instead, the growth of a layer of a yet unknown phase on the surface of both zeolites was observed during the interaction with Gamble’s solution (7.4 < pH < 8.48). The thickness of this layer reached a few tens of nanometers and covered all the observed areas. The understanding of the observed processes is of paramount importance, since they could be potentially involved in the mechanisms triggering the toxicological effects of erionite fibres.

1. Introduction

Erionite is a natural zeolite, occurring as a diagenetic alteration product of sediments, in cavities of altered basalts, or as a hydrothermal alteration product of volcanic rocks [1,2,3]. The idealized chemical formula of erionite is K2(NaCa0.5)8[Al10Si26O72]·28H2O [4,5]. From a structural point of view, this zeolite belongs to the ABC-6 family, with space group P63/mmc and unit-cell parameters a = 13.19–13.34 Å, c = 15.04–15.22 Å. The habit ranges from prismatic to extremely fibrous [6]. The exposure of erionite fibres to humans has been unambiguously linked to malignant mesothelioma, and in vivo studies have demonstrated that, at present, erionite is the most carcinogenic mineral [7]. Accordingly, a growing concern has developed regarding the potential health risks associated with environmental and occupational exposures to erionite in different countries, such as Turkey, the USA, Mexico, Iran and Italy [8,9,10,11,12].
Offretite is another zeolite mineral, closely related to erionite both structurally and chemically. The space group of offretite is P-6m2. The cell parameters are a = 13.27–13.32 Å, c = 7.56–7.61 Å and the average chemical formula is KCaMg(Al5Si13O36)·15H2O [4,13]. Offretite typically occurs as fine microscopic crystals of hydrothermal origin clustered in vugs and veins of basic volcanic rocks, but it has also been found in cavities of arenaceous metasiltites or hornfels [14]. Along with commonly observed prismatic habit, asbestiform offretite has also been found [15]. Due to chemical and structural similarities and possible intergrowth, the distinction between erionite and offretite can be challenging. Despite the large number of studies, the relationships between mineralogical features and biological activity of erionite are not yet fully understood. A potential carcinogenic hazard of offretite fibres has neither been confirmed nor dismissed so far and it remains unclear whether the mineralogical distinction between erionite and offretite has any health implications.
Recently, the epidemiological, mineralogical and toxicological effects of erionite have been intensively investigated [12,16,17,18,19,20,21,22,23,24,25]. Studies regarding erionite fibres were conducted on their interacting capability and the interactions with micelles and model membranes [26,27]. Investigations using human cell cultures [28,29] and from in-vivo studies [30], demonstrated that erionite is extremely biopersistent and could spread its cytotoxic action over decades. Moreover, biological activity of erionite samples from different localities was demonstrated to be similar [8].
Depending on the size and morphology, the inhaled particles can be deposited in various parts of the respiratory system with very different in situ biochemical conditions (Figure 1). Between the epithelial tissue of alveoli (the deeper air spaces of the lungs) and the endothelial tissue of blood vessels (capillary), there is a space called the interstitium. Alveolar macrophages (AM), phagocytic cells in the alveolar space, are the first line of defense against inhaled particles and organisms. Recruited from blood monocytes, macrophages could penetrate into the interstitium (interstitial macrophages, IM) and subsequently migrate to the alveolar space and vice versa [31,32]. Macrophages (size 14–21 µm in humans) can completely engulf particles smaller than their size. However, big particles and in particular long fibres are not removed by macrophages, or are partially phagocytized and subsequently released onto the epithelial surface or in the interstitium. In these cases, macrophages will become activated and release, for example, reactive oxygen species (ROS) and reactive nitrogen species (RNS), which are mutagenic [33].
To simulate the diversity of the biochemical environments within the lungs, two artificial solutions are mainly used: (1) artificial lysosomal fluid (ALF) with pH 4.5–5 is analogous to the fluid with which inhaled particles would come into contact after phagocytosis by alveolar and interstitial macrophages; (2) Gamble’s solution pH 7.4 simulates interstitial lung fluid [34]. The structural analysis of erionite fibres leached with artificial simulated lung fluids (SLFs) highlighted a partial amorphisation and a slight reduction of the fibre diameter, probably due to partial dissolution during the leaching processes [25,35,36].
Although these studies were extremely useful in determining the reaction of erionite fibres in contact with organic matter or with lung fluids, they do not provide information on modifications at nanometric scale at the fibre surface. Considering that the chemical reactions involved in pathogenesis mainly take place at the solid-liquid interface [37,38], the information about the mechanisms of surface reactivity are of paramount importance. This is particularly relevant for zeolites due to their channel structure and the possible accommodation of several chemical species within the framework. Moreover, studies focused on the characterization of zeolite surfaces demonstrated that they do not always match with the bulk structure [39,40]. Thus, results obtained from the investigation of bulk processes can be significantly different from those extrapolated by analysing the crystal surface (i.e., outer atomic layers). Previous to our research, direct imaging, i.e., in real-time, of the morphological changes occurring at mineral fibre surfaces was missing.
In this work the interactions of the zeolites erionite and offretite with SLFs at nanometric scale were investigated in situ by means of an atomic force microscope (AFM). The results show superficial dissolution of erionite and offretite crystals and removal of adhered particles during interaction with acid SLF, while a layer of an unknown phase, likely amorphous, grew on the surface of both zeolites in neutral-basic pH of SLF. In the first section of the paper we report the characterization of the samples performed by standard mineralogical techniques. In the second part, the results obtained by AFM analyses are presented and discussed and finally considerations on health effects are addressed.

2. Materials and Methods

2.1. Samples

Two different samples, referred to as FF (offretite) and MB2404 (erionite), were investigated. The samples were selected on the basis of their relative size and morphology (well-shaped prisms).
The FF sample is offretite originating from Nogare (VI), in the Lessini Mountains (northern Italy), where it occurs as a secondary mineral in vesicles of basalts and basanites [41]. Morpho-chemical and mineralogical characteristics of the FF sample were preliminarily studied by X-ray powder diffraction and scanning electron microscopy with energy dispersive spectroscopy (SEM-EDS) by [15]. However, due to the abundance of other mineralogical phases (mainly chabazite and calcite), an accurate structural refinement through X-ray powder diffraction could not be obtained. Thus, in order to check the chemical variability of the sample and its crystalline structure, new chemical and structural data were acquired in the present study.
The sample MB2404 is erionite from Bog Hill Quarry, Northern Ireland, where it occurs in amygdales in various rhyolitic and basaltic lavas [42]. Due to the lack of chemical and structural data on erionite from this locality, a preliminary characterization was performed by means of single crystal X-ray diffraction (SC-XRD, Bruker AXS, Karlsruhe, Germany) and SEM-EDS (Zeiss, Jena, Germany).

2.2. Simulated Lung Fluids (SLFs)

Two simulated lung solutions were used: artificial lysosomal fluid (ALF) and Gamble’s solution, prepared according to standard formulation by [34]. The choice of the two fluids followed the suggestion of the National Institute for Occupational Safety and Health (NIOSH) for solubility assays [43]. The components of Gamble’s solution were added in the order presented by [44] to avoid salt precipitation. However, the Gamble’s solution appeared turbid and was filtered with a 0.45 µm syringe filter to avoid the deposition of eventual particles on the crystals during the AFM scans.
In order to use fresh solutions during the whole period of the experiments, both ALF and Gamble were prepared twice. The pH of the solutions was measured at 25 °C and at 37 °C to simulate the body temperature. As described by [25], buffer reagents could be added to the solution to stabilize the pH. Thus, HCl was added to Gamble’s solution to obtain a pH value of ~7.4 [34]. The measured pH values are reported in Table 1.

2.3. Single Crystal X-ray Diffraction

Diffraction data were collected at room temperature on a BRUKER APEX II diffractometer equipped with a MoKα radiation (λ = 0.71073 Å) and a CCD area detector. The selected crystals of erionite with a dimension of 0.17 × 0.08 × 0.08 mm and of offretite of 0.17 × 0.06 × 0.09 mm were glued on the tip of a glass fibre and mounted on a goniometer head.
The reflection intensities were integrated and corrected for absorption using an Apex 2v. 2011.4-1 software package (Bruker AXS, Karlsruhe, Germany). Structures were solved using Shelxtl-2008 [45] and structural refinements were carried out by SHELXL-2014 [46] using neutral atomic scattering factors. Crystal data and refinement parameters are reported in Table 2. Structural data in cif-format have been deposited as Supplementary Material.

2.4. SEM-EDX

The chemical compositions as well as the morphology of both samples were checked before and after the treatment with simulated lung fluids SLFs by SEM-EDX using a Zeiss EVO50 instrument (Zeiss, Jena, Germany) coupled with an EDAX TEAM system (4.0, EDAX, Draper, UT, USA). Operating conditions were: 20 kV accelerating voltage, 10 mm working distance, 0° tilt angle. Chemical data were collected on at least three analytical points on five different crystals. After the interaction with SLFs, the chemical composition was retrieved on the same crystals used for AFM images.
The final crystal-chemical formula were calculated by normalizing the chemical composition with an assumed water content of 18 wt % (corresponding to ca. 30 water molecules per formula unit (pfu)) and on the basis of 36 (Si + Al) atoms per formula unit (apfu) for both samples. To minimize the alkali migration, as suggested by [47], chemical data were acquired using a low counting time, up to 30 s for each measurement. The reliability of the chemical analyses of both offretite and erionite crystals were evaluated by using the charge balance error formula E%, [48], the K-content test [15,49], and the Mg-content test [50].

2.5. AFM

Mineral surfaces were examined in situ using a Cypher ES© Atomic Force Microscope (AFM, Oxford Instruments, Abingdon, UK). Crystals were extracted from the natural bulk samples, using a binocular microscope. At least 6 well shaped hexagonal or pseudo-hexagonal crystals with compact aspect and size of about 200 × 80 × 80 µm were selected for each sample. The crystals were then attached to a sample holder by carbon tapes, cleaned with compressed air and washed in Milli-Q water to remove fragments and impurities without any chemical treatment.
The topography scans were performed in tapping mode with a NanoWorld ArrowUHFAuD cantilever under different experimental conditions: preliminarily in Milli-Q water, then in ALF and Gamble’s solution at 25 °C and 37 °C to simulate the body temperature [25,51]. Moreover, an additional measurement was carried out using the corrected Gamble’s solution (pH 7.4) at 37 °C. Default zero order flattening was applied to all collected images.
In order to select a well-exposed surface, preliminary imaging of crystal surfaces was acquired in Milli-Q water. Afterwards, SLFs were injected directly on crystal surfaces through a capillary system. Real-time acquisitions were performed starting from the introduction of the lung fluid, in-continuo for about 1 h, and successively by alternating scans and pauses, for several hours. The in-situ experimental time, for each sample in SLF, was on average 72 h. The imaging time was from ~5 h to ~53 h on the same surfaces. To assess whether the observed processes were due to lever-surface interactions during scanning, the tip was disengaged from the surface for several minutes, many times during the experiments [52], and attention was paid to minimize the lever-surface interaction forces during scanning to avoid scan artefacts [53,54].
To better discriminate the role of the tip from the actual fluid-surface interaction, additional measurements were performed in air and in water in contact mode using an Al-coated NanoWorld Arrow-Contr cantilever.

2.6. Thermodynamic Stability Model

To evaluate the thermodynamic stability of erionite and offretite in comparison with nontronite (see discussion section), their solubility was estimated using the geochemical software PHREEQC (3.4.0, USGS, Denver, CO, USA) [55]. The Gibbs free energy of formation (ΔG°f) of erionite was taken from [56]. The thermodynamic parameters for Na, K and Ca-nontronite are available in the standard PHREEQC (minteq.dat). ΔG°f and thermodynamic parameters of Ca-bearing zeolite (laumontite) were taken from [56] and PHREEQC (minteq.dat), respectively, and both used to test the reliability of the proposed modelling. The agreement between these two values gives us confidence in the consistency of the data reported in two databases and the definition of the aqueous species. To the best of our knowledge, (ΔG°f) for offretite has never been reported. We assume that the thermodynamic properties of offretite should be similar to the ones of erionite, due to their similarities in structure and chemical composition. The values for erionite and laumontite corresponding to vugs were selected from [56]. For erionite we used the formula unit (K1.6Na1.2Ca3.1)Al9Si27O72·30H2O (ΔG°f = −40,778.0 kJ/mol) and for laumontite (K0.6Na0.6Ca5.4)Al12Si24O72·24H2O (ΔG°f = −40,293.6 kJ/mol). Starting from these formula units we derived the dissolution equations for erionite and laumontite, respectively:
(K1.6Na1.2Ca3.1)Al9Si27O72·30H2O + 36H+ + 6H2O = 1.6K+ + 1.2Na+ + 3.1Ca2+ + 9Al3+ + 27H4SiO4
(K0.6Na0.6Ca5.4)Al12Si24O72·24H2O + 48H+ = 0.6K+ + 0.6Na+ + 5.4Ca2+ + 12Al3+ + 24H4SiO4.
The Gibbs free energies of formation for all the ions involved in the reactions were taken from [57], with the exception of the values corresponding to Na+ and K+ that were obtained from [58]. The solubility constant calculated for erionite (according to reaction 1) was pKs = 41.48.

3. Results

3.1. Samples Characterization

3.1.1. Morphology and Morphometry

The FF sample is composed of prismatic crystals of offretite with different sizes, as described in [15], with compact well-shaped hexagonal or pseudo-hexagonal individuals, while others show a complex network of fractures. The crystal size ranges from ~50 µm to ~150 µm in diameter and from ~100 µm to ~300 µm in length. The crystal surfaces are covered by particles of rounded or irregular shape, with a size between ~0.3 µm to ~4 µm.
The erionite crystals of the sample MB2404 are prisms of different size, with a diameter of ~250–600 µm and length of ~600–800 µm. Under optical microscope the high fragmentation of these prisms (cleavage fragments) was evident. Fibrils ranging from ~50 µm to <3 µm in diameter and from ~100 µm to less than ~10 µm in length, were observed using SEM. For this sample, the smaller fraction is definitively below the limit of breathability that is, for elongated particles, length >5 µm and diameter <3 µm, and diameter-length ratio >1:3 [59]. The erionite surface is cleaner than that of offretite, and only rare particles are present in the range size from ~0.3 µm to ~5 µm.

3.1.2. Crystal Chemistry

The average chemical compositions and related range of values (min–max) obtained from the investigated natural zeolites and for the crystals after interaction with lung fluids are reported in Table 3. The average chemical composition of the natural offretite sample (FF), based on 7 points analysis, is (K1.85Mg1.55Ca2.03)·(Al8.99Si27.01O72]·28.57H2O. Our new data acquired on the FF sample are consistent with the data reported by [15] for the same sample. The point analyses performed on visible particles (at SEM images) on the surface of natural crystals showed the presence of Fe, P and Cl.
The average chemical composition of the natural MB2404 erionite sample, based on 7 points analysis, is (Ca3.49K1.78Mg0.67Na0.3)·(Al10.81Si25.29O72]∙29.08H2O, and is therefore classified as erionite-Ca. Furthermore, in this case iron was detected on visible particles (at SEM images) occurring as impurities on the crystal surface.
The structural data obtained for both samples were consistent overall with those reported in literature [60,61]. Four extraframework cations and six H2O were located within the structural channels of erionite (Table S1). Residual electron density at (−0.09, 0.33, 1/4) was modelled by an additional site (T2S) refined with Si scattering factor (Occ. = 0.045(5)). This site forms an additional 6-ring stacked along the c-axis which was interpreted as stacking faults of offretite [62]. Due to low occupancy, only one oxygen bridge (at OS site) between two adjacent T2S sites could be detected.
Structural data of the offretite sample FF are reported in Table S2. In agreement with previous structural refinements, the K is found in the cancrinite cage, Mg together with H2O occupied the gmelinite cage and Ca with residual H2O is disordered along the three-fold axis in the centre of the wide channel parallel to c.

3.1.3. Surface Morphology and Topography of the Natural Samples

The initial imaging of both FF and MB2404 samples was performed in Milli-Q water. A representative number of different areas at different scales of various crystals of both samples were observed to preliminarily check the eventual variability of the superficial features, which are known to be sensitive to surface reactivity, especially for zeolites [63,64]. Based on the morphology of offretite and erionite crystals, the examined surface was indexed approximately as {110}.
No variation in the reactivity of the surface was observed in the range of pH 4.15–4.31 employed for ALF solution (Table 1). In a similar way, surface reactivity in Gamble’s solution with pH varying from 7.4 to 8.48 was the same (Table 1). However, the behaviour of the system in Gamble’s and ALF solutions are clearly different.

Offretite (FF)

The surface of offretite is characterized by a widespread presence of small particles attached to the mineral faces. Clean surfaces were rarely observed. The typical particle sizes ranged from less than 40 nm in diameter and ~1 nm in height, to ~2 µm in diameter and ~250 nm in height (Figure 2a,d). As described by [65], the inaccuracy in estimating the size, shape and sharpness of very small particles due to the tip characteristics must be taken into account. Due to this effect, features appear more rounded and width measurements may be erroneous.
After few minutes of scanning in water, a small fraction of the particles disappeared, probably due to the mechanical interaction with the tip, while most of them remained uninfluenced after several hours of scan (Figure S1), indicating strong bonding to the offretite surface. Due to their small size, these particles were not observable at SEM, but were clearly detectable by AFM.
Steps parallel to c-direction were also appreciable, especially in the cleaner portions: the width of these elongated terraces ranges from less than ~100 nm to 2 µm, while the height ranges from ~20 nm to 250 nm (Figure 2b,c).

Erionite (MB2404)

The surface of MB2404 erionite sample is in general cleaner than that of the offretite sample (Figure 3a) and very few particles could be detected on the surface (Figure 3b). The particle sizes range from less than 30 nm in diameter and ~2 nm in height, to ~400 nm in diameter and ~80 nm in height (Figure 3b,c). Similar to offretite, a small fraction of the particles disappeared after scanning frames in H2O while most of them remained unchanged after about 2 h of scanning. It is worth noting that also in this case, most of the particles are not visible using SEM due to the small size.
Steps parallel to the c-axis were more evident than in offretite. The size of elongated singular steps ranges from less than ~30 nm to 4 µm in width and from ~1 nm to 900 nm in height (Figure 3a,d–f).

3.2. Interaction with SLFs

3.2.1. Changes in Chemical Compositions

In contrast to the pristine material, the chemical compositions of both samples after the interactions with the SLFs were not homogenous as indicated by the variability of the extraframework cations content (Table 3). This is not surprising considering (i) the limited interaction time (approximately 3 days per each sample) and (ii) that the crystals were not immersed in the solutions but only partially in contact with them (as required for AFM experiments). Despite the variability of the data, modifications in chemical composition were observed for both samples, indicating that cation exchange occurred during the AFM experiments.
The most important chemical changes, with respect to the pristine materials, can be summarized as following: (a) the amount of silicon in offretite crystals after contact with Gamble’s solution, clearly decreased from 27.01 apfu, in natural offretite, to 24.84 apfu; (b) overall, both in ALF and Gamble fluids, the uptake of Na+ at the expense of Ca2+ was observed.
Regarding erionite, no significant changes after the interaction with the SLFs were observed in Si and Al contents. Instead, also in this case, the decrease of Ca2+ both in ALF and Gamble was evident. The shift amounted from 3.49 apfu in the natural sample to 0.0 apfu and 0.44 apfu after interaction, respectively. The increase of Na+ was also significant from 0.3 apfu to 9.2 and 7.02 apfu after being in contact with ALF and Gamble’s fluid respectively. After interaction with Gamble, also K+ increased from 1.78 to 2.66 apfu.
It is worth noting that in previous dissolution experiments on erionite in contact with SLFs [25,30] the pristine sample had a different chemical composition (erionite-Na) compared to the one used in the present study (erionite-Ca), and as a consequence a different exchange process was reported.

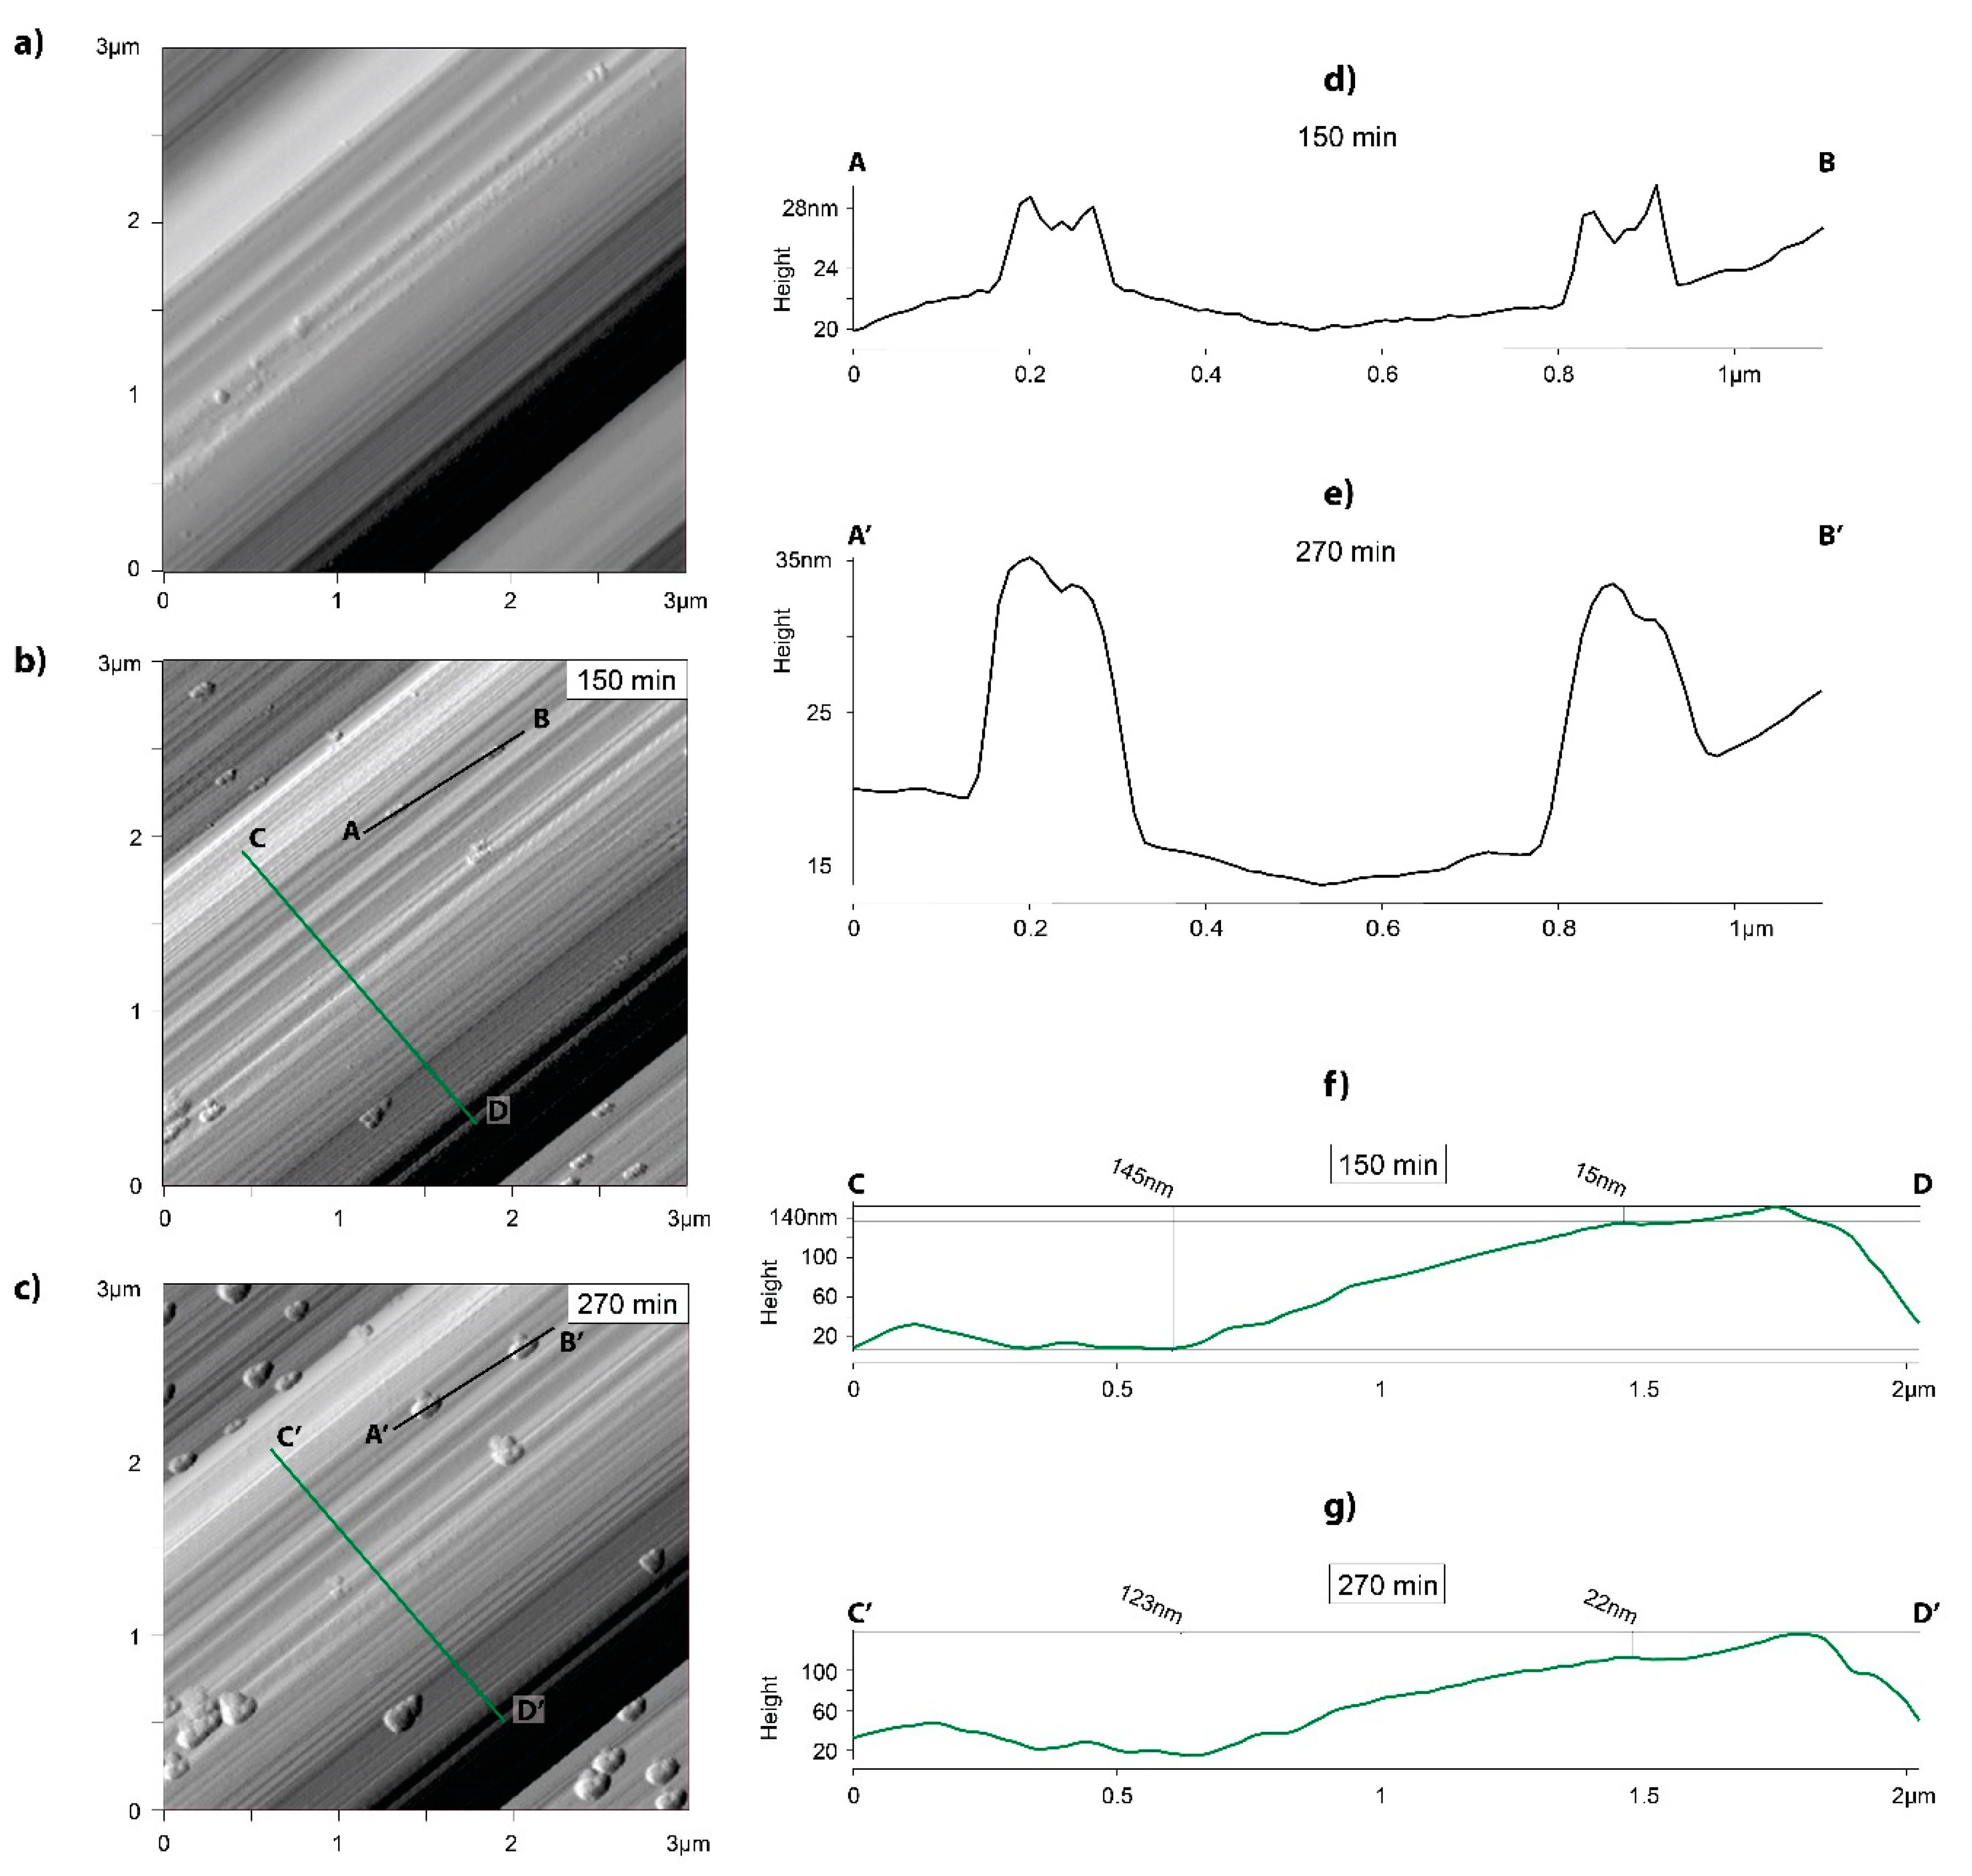
3.2.2. SLFs Interaction with Offretite (FF)

The interaction between the offretite sample (FF) and ALF at 25 °C led to superficial changes, especially concerning the attached particles. In water, apart from the initial removal of loosely bound particles from the surface during the first scans, the detachment basically stopped. In contrast, in ALF solution this behaviour was significantly different. After about 30 min, particles started disappearing from one scan to the next. The particles removal became obvious after about one hour with disengaged tip, followed by a short-period (t ~10 min) of scan. Performing quick individual scans with long intervals in between was very useful to assess whether the dissolution process was solely induced by the mechanical interaction with the tip or was controlled by interaction with the solution [52]. Surface changes were evident after longer intervals between scans. The same 3 × 3 µm area of the offretite surface after ~18 h(a), ~25 h(b), ~50 h(c) of interaction times in ALF solution is shown in Figure 4a–c. The number of small particles attached to the surface (Figure 4a) progressively decreased during the interaction with the fluid. The green circles highlight the bigger particles that disappeared from 4(a) to 4(b) images, while the yellow ones are related to the particles that appeared, although only temporarily (Figure 4c). At the end of the scanning session (~50 h), the surface was almost completely free of particles and appeared very different with respect to the starting image (4c). Terraces parallel to the c-axis became well defined and clearly visible.
In the profiles reported in Figure 4d,e the height of adjacent reliefs, as a function of interaction time, decreased. This observation indicated general dissolution that was not uniform but proceeded with different rates reflecting local structural and chemical variability of the surface. The detachment of the particles can also be explained by this dissolution process: the particles do not dissolve (their dimensions did not vary significantly with time) but adhesion with the zeolite surface is minimized by the dissolution mechanism.
The results obtained in ALF solution at 37 °C are similar to those obtained at 25 °C. Furthermore, in this case, the particles density at the surfaces of offretite crystals decreased with the observation time and the surface became particles free after 8 h of scanning (Figure 5a–e).
To evaluate potential artefacts due to the scanning mode, the measurements in contact mode were also performed. The behaviour of the system in contact and in tapping mode was found to be similar. Based on these observations we conclude that the observed changes of the surface are not scanning artefacts but reflect the chemical interaction with the solution.
Gamble’s experiments on FF sample were also conducted at two different temperatures, 37 °C and 25 °C.
The area (2 × 2 µm) of an FF crystal at different interaction times with Gamble’s solution at 25 °C is shown in Figure 6a. This area was observed for approximately 51 h. During the observation the entire offretite surface was progressively covered by a thin layer of a neo-formed phase of unknown chemical composition. The nucleation started from terraces and irregularities present on the surface. The original surface was fully masked by the thin layer after 4 h of interaction. The profiles in Figure 6b demonstrate the growth of the new phase in lateral and vertical directions. The width of the growing phase forming on the offretite surface was approximately 490 nm, and about 1 h later increased to 590 nm, suggesting that the substance grew especially at the edge of the steps. The final height of the layer was in the range of a few tens of nanometers (Figure 6).
The same behaviour (e.g., neo formation of the surface layer) was also observed in the experiments at 37 °C where an equivalent surface area of (2 × 2 µm) was covered within 5 h.

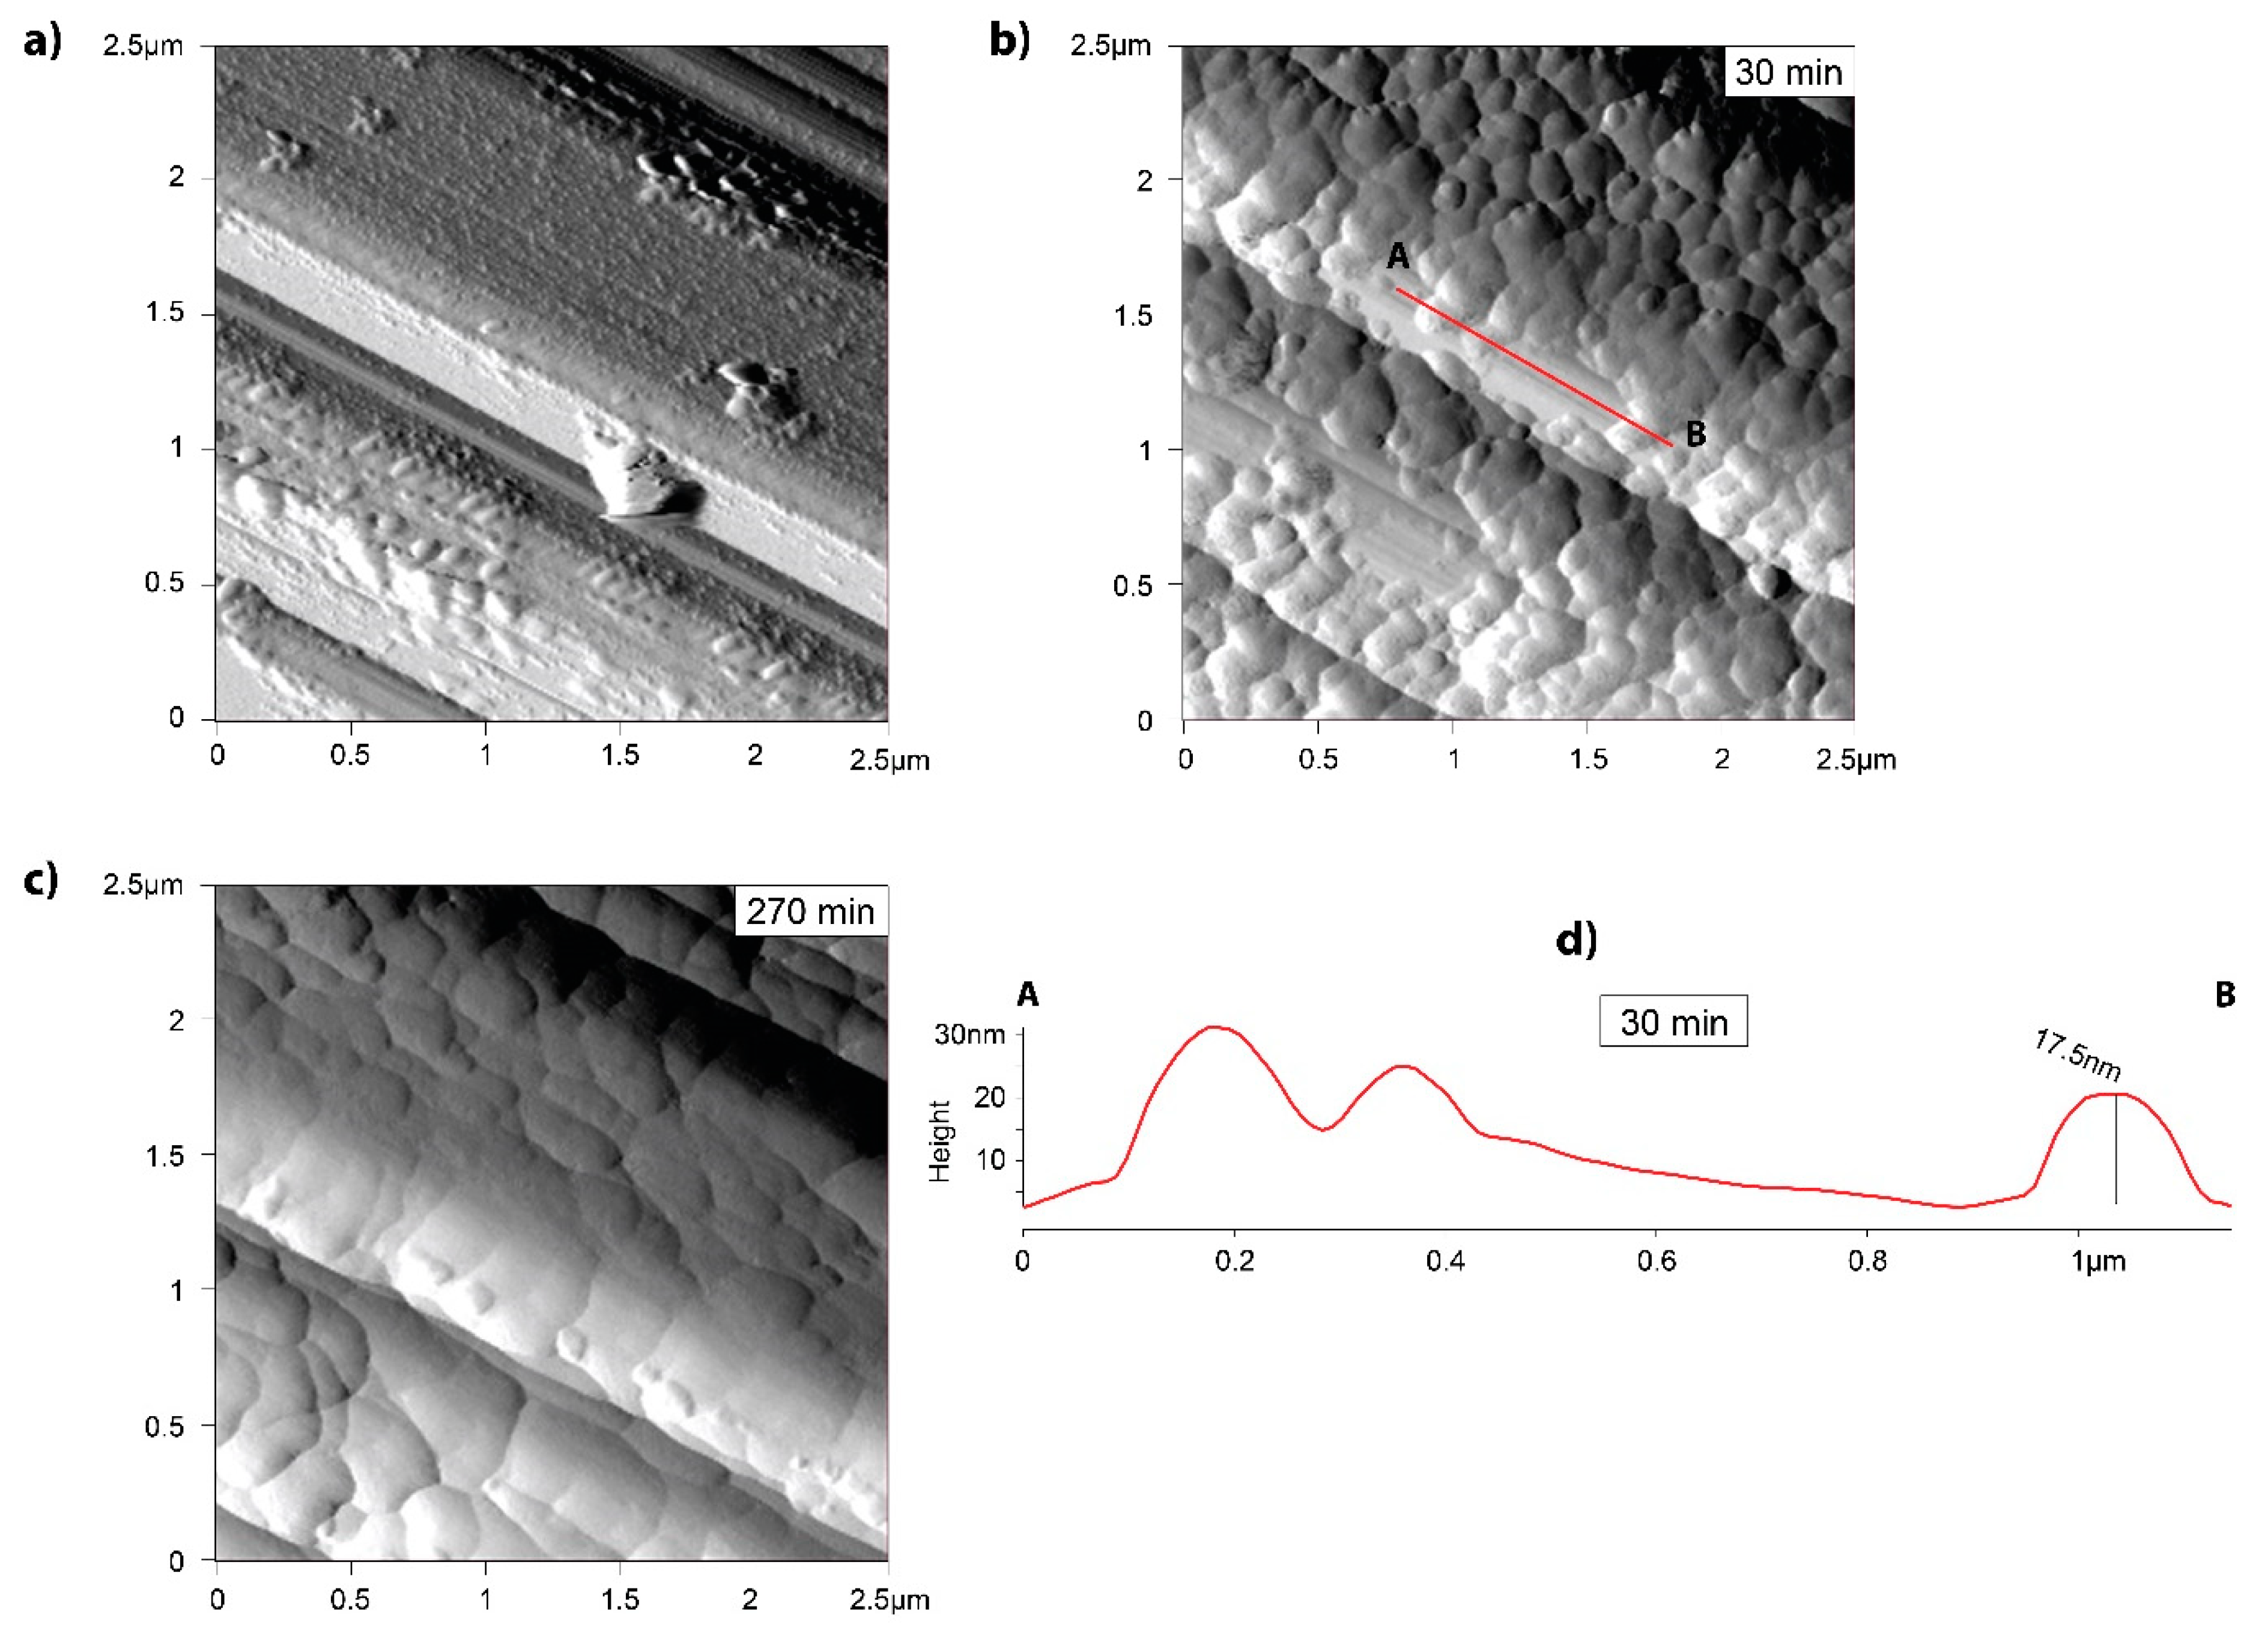
3.2.3. SLFs Interaction with Erionite (MB2404)

The erionite MB2404 was also investigated in ALF and Gamble’s solution, both at body temperature of 37 °C and at 25 °C. The behaviour of the system was found to be similar at both temperature conditions. The scans were performed periodically, alternating periods with disengaged tip, and the surface was continuously exposed to the solution.
Profiles orthogonal to the elongation of erionite crystals, obtained after 7 h of interaction with ALF at 25 °C, highlighted a dissolution process that is clearly not uniform on the crystal surfaces (Figure 7a–d). The same kind of analysis was done on several areas, always obtaining similar results. This indicated a general dissolution of the erionite surface but with a strong dependence on the local topography. The same behaviour was observed during the experiments performed at 37 °C (Figure 8a–d). In addition, in this case the surface underwent a gradual but anisotropic dissolution.
The observation time per each surface area was approximately 9 h. Figure 9a–g shows the images acquired on erionite surface in contact with Gamble’s solution at 25 °C. The growth of an additional phase on the surface of erionite was observed, in a similar fashion to offretite. However, the process was significantly slower compared to offretite. After 270 min the maximum extension of the growing phase reached only ~180 nm (Figure 9). Apart from this growth, the heights of the elongated steps parallel to the c-axis varied as a function of the interaction time, demonstrating that overall the surface was subject to a dissolution occurring at different rates, probably depending on the local characteristics of the surface itself.
Interestingly, the results obtained by measurements at 37 °C indicated that a few minutes after the injection of the Gamble’s solution the second phase started growing very fast (Figure 10a–d), and this process continued during the whole time of the experiment. The resulting layer was always very thin, in the order of a few tens of nanometers.
To check if the growing layer was a unique characteristic of offretite and erionite, we performed identical AFM experiments using Gamble’s solution with natrolite, a Na-rich zeolite with ideal chemical formula Na16[Al16Si24O80]∙16H2O, scolecite, a Ca-rich zeolite with chemical composition Ca8[Al16Si24O80]∙24H2O [4] and a freshly cleaved muscovite. The formation of precipitate layer was not detected in any of these control experiments (Figures S2 and S3), suggesting that the neo-formation of surface layer is characteristic to offretite and erionite.

4. Discussion

4.1. Surface Dissolution

Our results show different evolution of erionite and offretite surfaces depending on the SLF. ALF and Gamble’s solution (4.15 < pH < 4.31 and 7.4 < pH < 8.48, respectively) represent very different chemical environments that control the surface reactivity. In contact with Gamble’s solution, the precipitation of a thin layer, a few tens of nanometers thick, of an unknown phase was observed for both zeolites, whereas the same process did not take place during surface interaction with ALF. We could show that the observations do not depend on the imaging conditions and are not related to the colloid formation in the bulk SLF solutions. The observed surface modifications are therefore related to the dissolution precipitation at the fluid-surface interface.
The surface reactivity of aluminosilicates depends on the protonation state of surface >Si–OH and >Al–OH groups [66]. The dissolution process at intermediate and high pH is mainly controlled by the detachment of silicon, whereas at low pH aluminol groups are preferentially dissolved [58,67]. Thus, the Si/Al ratio plays a crucial role in determining the dissolution mechanism and as a consequence influences the nature of the dissolution products. In particular, [68] hypothesized that dissolution processes of zeolites are controlled by the selective removal of aluminium leading to different results depending on the initial Si/Al ratio. In our case, the investigated samples are Si-rich (2.5 and 2.6 for erionite and offretite, respectively) and little or no silicon dissolution is expected under acidic environment [68].
Interestingly, previous studies on erionite dissolution at pH 4, and in general on zeolites under acidic environment [69,70], reported the formation of a surface layer consisting of amorphous silica as result of de-cationization and de-alumination of bulk structure in the near surface layer [25]. In our experiments, a minor dissolution took place when both zeolites were in contact with ALF solution (pH ca. 4) but the formation of a residual surface layer was not observed. This observation is in agreement with previous experimental studies that demonstrated that for Si-rich zeolites (Y-zeolite) the Al removal is not sufficient to weaken the structure and promote Si detachment and re-precipitation of undissolved silicate framework [68]. A slow initial dissolution rate was also reported for heulandite (Si/Al = 3.2) under low pH (<4) [66]. Furthermore, fibrous erionite-Na showed only minor signs of amorphisation even after 9–12 months of interaction with SLF at pH 4 [25].
Under intermediate to high pH values the dissolution rate of aluminosilicates is controlled by the detachment of Si, the amount of which is proportional to the concentration of the Si surface sites [67]. Therefore, in the experiments carried out in Gamble’s solution (pH 7.4–8.48) the dissolution mechanism is mainly controlled by >Si–O- species removal. Thus, the formation of the thin superficial layer could be explained (similarly to what occurs in Al-rich zeolites at low pH) [68] as an initial dissolution of Si-species followed by subsequent re-precipitation of silicate phases.
Although we could not determine whether the precipitated layer was amorphous or crystalline, on the basis of previous studies [35,36] the formation of an amorphous phase is also plausible. Indeed, amorphisation of erionite fibres in contact with Gamble’s solution was also reported by [35,36].
The observed behaviour could be explained by combined effect of pH, which controls the dissolution mechanism, and the ionic composition of Gamble’s solution. The solution mainly contains sodium bicarbonate and sodium chloride [34]. In our experiments, we had evidence that cation exchange (Na uptake at Ca expenses) occurred in both zeolites during AFM analyses (Table 3); the release of Ca2+ ions into the solution could lead to the formation, and subsequent precipitation on crystal surface, of a new mineral phase. The nature of the grown layer yet remains unknown.

4.2. Consideration on Health Effects

In this study we used prismatic crystals of offretite and erionite, with the aim of having large and flat surfaces for AFM analysis. We implicitly assumed that the surface properties of prismatic and fibrous crystals are similar. SEM images of the erionite sample clearly show the presence of small fibres of inhalable size, whereas, in agreement with [15], no inhalable fibres were detected in the offretite sample.
In our study, for the first time, the removal of micro/nanoparticles from the erionite and offretite surface in SLFs and in particular in acidic environment (ALF solution) was observed. These particles were not involved in dissolution processes because their sizes didn’t significantly change during the interaction with SLFs. Such release may obviously have a direct implication on the mechanisms that trigger carcinogenic reactions.
Although we could not determine the chemical composition of the particles, we may speculate that they represent binding iron particles. Indeed, it is well-known that erionite fibres, due to their negative surface charge, have a strong tendency to be coated by nano/microcrystalline iron-bearing materials [71]. Theoretically, Fe2+ and Fe3+ could also be present in the framework as replacement of Si4+ and Al3+ or in extraframework cavities [23], but up to now these models are not supported by data. In contrast, particles and nanoparticles containing iron such as oxides (e.g., goethite and hematite), hydrate sulphate (jarosite), clays (nontronite) and thin coating of iron-bearing silicates, were detected using SEM, micro-Raman spectroscopy and transmission electron microscopy [23,36,49,71,72]. Similarly, iron-rich clay minerals were also reported in association with offretite [73], as well as iron-rich nanoparticles on other fibrous zeolites [25]. In our case, this hypothesis is further supported by the small amount of Fe detected in the EDX-spectra of both offretite and erionite (Figure S4). Therefore, we may attribute iron presence to impurities occurring at crystal surfaces.
The presence of iron nanoparticles is considered as one of the key factors for explaining fibres toxicity [74]. In particular, erionite toxicity has been partially ascribed to ion-exchanged and/or surface deposited Fe participating in Fenton chemistry [75,76]. Moreover, a strong tendency of Fe2+ to bind to the erionite structure (in the erionite cage), through an ion exchange process, was provided in [77].
The difference between structural and impurity-related iron is important to consider, with regard to a different bioavailability, and then, potential carcinogenicity. For example [78], in their study on synthetic stoichiometric chrysotile, demonstrated that chrysotile nanofibres devoid of iron did not exert genotoxic and cytotoxic effects, contrary to those with an iron-loaded structure. Similarly, erionite could be a passive carrier of vehiculating iron within the respiratory system via iron-bearing materials (or ion exchange mechanism occurring within the lungs) [35].
It is well established that Fe2+ is the most active, dangerous and toxic species [79,80]. Although the detected Fe on the erionite surface was attributed mainly to Fe3+-bearing, superparamagnetic, oxide-like nanoparticles and hematite particles [71], within the human body several metabolites can act as reductant species leading to the formation of Fe2+ [81]. Theoretically, sub-spherical or nano particles, eventually released in the lung environment, will not be active (and hence toxic) because they are phagocytized by macrophages [23]. In this case iron should not be involved in the toxicity mechanism of erionite fibres. However, ref. [80] suggested an alternative model in which iron-rich nanoparticles and nontronite dissolve in the intracellular acidic environment (during phagocytosis), leaving a residue of active iron atoms (Fe2+) at specific surface sites anchored to the windows of the zeolite channels [80]. Interestingly, the release of flaky aggregates of nontronite was also reported for erionite fibres leached 4 months in Gamble’s solution (pH 7.4) [36].
Assuming that also in our case the particles observed on erionite and offretite surfaces are nontronite, we compared the thermodynamic stability of erionite and nontronite in aqueous solution. In Figure 11a,b the equilibrium [Al]aq, [Si]aq concentrations as a function of pH are reported for erionite, Na-, Ca-, and K-nontronite and laumontite. The latter was chosen as a reference to test the validity of our model.
Data in Figure 11 demonstrate that equilibrium [Al]aq, [Si]aq concentrations are much higher for zeolites than for nontronite. Therefore, we can argue that nontronite should not dissolve as much as a zeolite in pure water. The calculations support our hypothesis that the observed particles detachment from erionite and offretite surfaces was mainly due to the dissolution of the zeolite in combination with the stress generated by the tip. If particles are nontronite, their dissolution would be lower than underlying zeolites and they will be mechanically removed by the AFM tip during the measurements. This process is also supported by literature results, reporting that under several pH conditions, the dissolution of zeolites compared to clay minerals and, in particular, to nontronite (one of the most stable clay minerals) is faster [82,83].

5. Conclusions

This work presents a comparative analysis of the morphological changes taking place at the surface of zeolites erionite and offretite in contact with SLFs under room and body temperature conditions. Two lung fluids (ALF and Gamble’s) were tested to simulate different environments in the lungs. Direct imaging was performed by means of an in situ atomic force microscope (AFM).
Our results showed that (i) in contact with ALF solution (4.15 < pH < 4.31) an evident removal of particles adhering at zeolite surfaces accompanied by superficial dissolution takes place; (ii) during the interaction with Gamble’s solution (7.4 < pH < 8.48) the surface of both zeolites is progressively covered by a thin layer (a few tens of nanometers) of a new phase.
These outcomes represent an important step in understanding the complex processes occurring at the surfaces of mineral fibres that could be involved in the toxicological pathway. For the first time we could observe in situ the detachment of mineral particles adhering at erionite surface in contact with SLFs. As discussed above, one of the possible roles of erionite fibres is to carry Fe-bearing phases within the lungs [35,71]. In the acid environment of alveolar and interstitial macrophages, such particles will be released, eventually triggering the carcinogenic mechanism [23].
The fact that under the effect of Gamble’s solution the zeolites surface is covered by a superficial layer (after few hours of interaction) leads to an important consideration: the neo-formed phase could hamper or somehow limit the reactivity of the mineral fibre. Hence, in the interstitial fluid the fibres may trigger different biological processes compared to what occurs within the macrophages. According to our results, we hypothesize that the new layer may be either an amorphous silicon phase or a crystalline phase precipitating as a consequence of the interaction between the cations released by the zeolite with the Gamble’s solution.
With a view to better understanding what the consequences of the formation of the new layer are, further research is needed in order to ascertain (i) whether it is an amorphous or crystalline phase and (ii) its chemical composition. Interestingly, our test measurements performed on two additional zeolites (scolecite and natrolite) showed that in both cases the surfaces were not covered by any layer under the effect of Gamble’s solution. Although further research is needed to exploit the process in a systematic way, these preliminary results suggested that the observed surface layer precipitation is peculiar to the interaction of erionite and offretite with Gamble’s solution.

Supplementary Materials

The following are available online at https://www.mdpi.com/2075-163X/9/2/83/s1, Figure S1: Offretite in water, Figure S2: Natrolite in Gamble, Figure S3: Scolecite in Gamble, Figure S4: EDX of detected iron, Table S1: Structural data of erionite, Table S2: Structural data of offretite.

Author Contributions

M.G. and G.C. conceived the research, analysed the results, wrote and revised the manuscript; F.D.L. produced and analysed the thermodynamic model; M.G. performed the AFM experiments; F.D.L. and S.V.C. analysed the data and revised the manuscript.

Funding

R’EQUIP grant 164017 from Swiss National Science Foundation is acknowledged. “Società Italiana di Mineralogia e Petrologia” is acknowledged for the grant “Borsa di studio all’estero” awarded to M.G.

Acknowledgments

Thanks are due to Thomas Armbruster, Michele Mattioli and Michele Betti for their important suggestions. The authors would like to thank Franco Filippi and Matteo Boscardin for kindly providing the FF102 and MB2404 samples, respectively. We also acknowledge two anonymous reviewers for their very helpful comments and suggestions which improved the manuscript.

Conflicts of Interest

The authors declare no conflicts of interest.

References

  1. Sheppard, R.A.; Gude, A.J. Zeolites and Associated Authigenic Silicate Minerals in Tuffaceous Rocks of the Big Sandy Formation; US Govt. Print. Off: Mohave County, AZ, USA, 1973.
  2. Tschernich, R.W. Zeolites of the World; Geoscience Press Inc.: Phoenix, AZ, USA, 1992. [Google Scholar]
  3. Bargar, K.E.; Keith, T.E. Calcium zeolites in rhyolitic drill cores from Yellowstone National Park, Wyoming. Nat. Zeolites 1995, 93, 69–86. [Google Scholar]
  4. Gottardi, G.; Galli, E. Natural Zeolites; Springer: Heidelberg, Germany, 1985. [Google Scholar]
  5. Armbruster, T.; Gunter, M.E. Crystal structures of natural zeolites. In Natural Zeolites: Occuerrence, Properties, Applications; Bish, D.L., Ming, D.W., Eds.; Reviews in Mineralogy and Geochemistry; Mineralogical Society of America: Washington, DC, USA, 2001; Volume 45, pp. 1–67. [Google Scholar]
  6. Dogan, A.U.; Dogan, M.; Hoskins, J.A. Erionite series minerals: Mineralogical and carcinogenic properties. Environ. Geochem. Health 2008, 30, 367–381. [Google Scholar] [CrossRef] [PubMed]
  7. International Agency for Research on Cancer (IARC). IARC Monographs on the Evaluation of the Carcinogenic Risk to Humans; Overall Eval. Carcinog. Updating IARC Monographs Vol. 1 to 42; IARC: Lyon, France, 1987. [Google Scholar]
  8. Carbone, M.; Baris, Y.I.; Bertino, P.; Brass, B.; Comertpay, S.; Dogan, A.U.; Gaudino, G.; Jube, S.; Kanodia, S.; Petridge, C.R.; et al. Erionite exposure in North Dakota and Turkish villages with mesothelioma. Proc. Natl. Acad. Sci. USA 2011, 108, 13623–13628. [Google Scholar] [CrossRef] [PubMed]
  9. Saini-Eidukat, B.; Triplet, J.W. Erionite and offretite from the Killdeer Mountains, Dunn County, North Dakota, USA. Am. Mineral. 2014, 99, 8–15. [Google Scholar] [CrossRef]
  10. Ortega-Guerrero, M.A.; Carrasco-Núñez, G. Environmental occurrence, origin, physical and geochemical properties, and carcinogenic potential of erionite near San Miguel de Allende, Mexico. Environ. Geochem. Health 2014, 36, 517–529. [Google Scholar] [CrossRef] [PubMed]
  11. Ilgren, E.B.; Kazemian, H.; Hoskins, J.A. Kandovan the next ‘Capadoccia’? A potential public health issue for erionite related mesothelioma risk. Epidemiol. Biostat. Public Health 2015, 12, 1–12. [Google Scholar] [CrossRef]
  12. Giordani, M.; Mattioli, M.; Ballirano, P.; Pacella, P.; Cenni, M.; Boscardin, M.; Valentini, L. Geological occurrence, mineralogical characterization and risk assessment of potentially carcinogenic erionite in Italy. J. Toxicol. Environ. Health B 2017, 20, 81–103. [Google Scholar] [CrossRef] [PubMed]
  13. Gualtieri, A.; Artioli, G.; Passaglia, E.; Bigi, S.; Viani, A.; Hanson, J.C. Crystal structure-crystal chemistry relationships in the zeolites erionite and offretite. Am. Mineral. 1998, 83, 590–606. [Google Scholar] [CrossRef]
  14. Passaglia, E.; Tagliavini, A. Chabazite-offretite epitaxial overgrowths in cornubianite from Passo Forcel Rosso, Adamello, Italy. Eur. J. Mineral. 1994, 6, 379–405. [Google Scholar] [CrossRef]
  15. Mattioli, M.; Giordani, M.; Arcangeli, P.; Valentini, L.; Boscardin, M.; Pacella, A.; Ballirano, P. Prismatic to Asbestiform Offretite from Northern Italy: Occurrence, Morphology and Crystal-Chemistry of a New Potentially Hazardous Zeolite. Minerals 2018, 8, 69. [Google Scholar] [CrossRef]
  16. Ballirano, P.; Pacella, A.; Cremisini, C.; Nardi, E.; Fantauzzi, M.; Atzei, D.; Rossi, A.; Cametti, G. Fe (II) segregation at a specific crystallographic site of fibrous erionite: A first step toward the understanding of the mechanisms inducing its carcinogenicity. Microporous Mesoporous Mater. 2015, 211, 49–63. [Google Scholar] [CrossRef]
  17. Ortega-Guerrero, M.A.; Carrasco-Núñez, G.; Barragán-Campos, H.; Ortega, M.R. High incidence of lung cancer and malignant mesothelioma linked to erionite fibre exposure in a rural community in Central Mexico. Occup. Environ. Med. 2015, 72, 216–218. [Google Scholar] [CrossRef] [PubMed]
  18. Pollastri, S.; D’Acapito, F.; Trapananti, A.; Colantoni, I.; Andreozzi, G.B.; Gualtieri, A.F. The chemical environment of iron in mineral fibres. A combined X-ray absorption and Mössbauer spectroscopic study. J. Hazard. Mater. 2015, 298, 282–293. [Google Scholar] [CrossRef]
  19. Ballirano, P.; Pacella, A. Erionite-Na upon heating: Dehydration dynamics and exchangeable cations mobility. Sci. Rep. 2016, 6, 22786. [Google Scholar] [CrossRef] [PubMed]
  20. Bloise, A.; Barca, D.; Gualtieri, A.F.; Pollastri, S.; Belluso, E. Trace elements in hazardous mineral fibres. Environ. Pollut. 2016, 216, 314–323. [Google Scholar] [CrossRef] [PubMed]
  21. Bursi Gandolfi, N.; Gualtieri, A.F.; Pollastri, S.; Tibaldi, E.; Belpoggi, F. Assessment of asbestos body formation by high resolution FEG-SEM after exposure of Sprague Dawley rats to chrysotile, crocidolite, or erionite. J. Hazard. Mater. 2016, 306, 95–104. [Google Scholar] [CrossRef] [PubMed]
  22. Giordani, M.; Mattioli, M.; Dogan, M.; Dogan, A.U. Potential carcinogenic erionite from Lessini Mounts, NE Italy: Morphological, mineralogical and chemical characterization. J. Toxicol. Environ. Health A 2016, 79, 808–824. [Google Scholar] [CrossRef]
  23. Gualtieri, A.F.; Gandolfi, N.B.; Pollastri, S.; Pollok, K.; Langenhorst, F. Where is iron in erionite? A multidisciplinary study on fibrous erionite-Na from Jersey (Nevada, USA). Sci. Rep. 2016, 6, 37981. [Google Scholar] [CrossRef] [PubMed]
  24. Pacella, A.; Fantauzzi, M.; Atzei, D.; Cremisini, C.; Nardi, E.; Montereali, M.R.; Rossi, A.; Ballirano, P. Iron within the erionite cavity and its potential role in inducing its toxicity: Evidences of Fe (III) segregation as extra-framework cation. Microporous Mesoporous Mater. 2017, 237, 168–179. [Google Scholar] [CrossRef]
  25. Gualtieri, A.F.; Pollastri, S.; Gandolfi, N.B.; Gualtieri, M.L. In vitro acellular dissolution of mineral fibres: A comparative study. Sci. Rep. 2018, 8, 7071. [Google Scholar] [CrossRef] [PubMed]
  26. Mattioli, M.; Giordani, M.; Dogan, M.; Cangiotti, M.; Avella, G.; Giorgi, R.; Dogan, A.U.; Ottaviani, M.F. Morpho-chemical characterization and surface properties of carcinogenic zeolite fibers. J. Hazard. Mater. 2016, 306, 140–148. [Google Scholar] [CrossRef] [PubMed]
  27. Cangiotti, M.; Battistelli, M.; Salucci, S.; Falcieri, E.; Mattioli, M.; Giordani, M.; Ottaviani, M.F. Electron paramagnetic resonance and transmission electron microscopy study of the interactions between asbestiform zeolite fibers and model membranes. J. Toxicol. Environ. Health A 2017, 80, 171–187. [Google Scholar] [CrossRef] [PubMed]
  28. Pollastri, S.; Gualtieri, A.F.; Vigliaturo, R.; Ignatyev, K.; Strafella, E.; Pugnaloni, A.; Croce, A. Stability of mineral fibres in contact with human cell cultures. An in situ μXANES, μXRD and XRF iron mapping study. Chemosphere 2016, 164, 547–557. [Google Scholar] [CrossRef] [PubMed]
  29. Cangiotti, M.; Salucci, S.; Battistelli, M.; Falcieri, E.; Mattioli, M.; Giordani, M.; Ottaviani, M.F. EPR, TEM and cell viability study of asbestiform zeolite fibers in cell media. Colloids Surf. B Biointerfaces 2018, 161, 147–155. [Google Scholar] [CrossRef] [PubMed]
  30. Gualtieri, A.F.; Gandolfi, N.B.; Pollastri, S.; Burghammer, M.; Tibaldi, E.; Belpoggi, F.; Dražić, G. New insights into the toxicity of mineral fibres: A combined in situ synchrotron μ-XRD and HR-TEM study of chrysotile, crocidolite, and erionite fibres found in the tissues of Sprague-Dawley rats. Toxicol. Lett. 2017, 274, 20–30. [Google Scholar] [CrossRef] [PubMed]
  31. Sebring, R.J.; Lehnert, B.E. Morphometric comparisons of rat alveolar macrophages, pulmonary interstitial macrophages, and blood monocytes. Exp. Lung Res. 1992, 18, 479–496. [Google Scholar] [CrossRef] [PubMed]
  32. Carlos, T.M.; Harlan, J.M. Leukocyte-endothelial adhesion molecules. Blood 1994, 84, 2068–2101. [Google Scholar] [PubMed]
  33. Carbone, M.; Yang, H. Molecular pathways: Targeting mechanisms of asbestos and erionite carcinogenesis in mesothelioma. Clin. Cancer Res. 2012, 18, 598–604. [Google Scholar] [CrossRef]
  34. Stopford, W.; Turner, J.; Cappellini, D.; Brock, T. Bioaccessibility testing of cobalt compounds. J. Environ. Monit. 2003, 5, 675–680. [Google Scholar] [CrossRef]
  35. Ballirano, P.; Cametti, G. Crystal chemical and structural modifications of erionite fibers leached with simulated lung fluids. Am. Mineral. 2015, 100, 1003–1012. [Google Scholar] [CrossRef]
  36. Matassa, R.; Familiari, G.; Relucenti, M.; Battaglione, E.; Downing, C.; Pacella, A.; Cametti, G.; Ballirano, P. A Deep Look Into Erionite Fibres: An Electron Microscopy Investigation of their Self-Assembly. Sci. Rep. 2015, 5, 16757. [Google Scholar] [CrossRef] [PubMed]
  37. Guthrie, G.D.J.; Mossman, B.T. Health Effects of Mineral Dusts; Reviews in Mineralogy and Geochemistry; Mineralogical Society of America; Bookcrafters: Chelsea, MI, USA, 1993; Volume 28. [Google Scholar]
  38. Fubini, B.; Bolis, V.; Cavenago, A.; Volante, M. Physico-chemical properties of crystalline silica dusts and their possible implication in various biological responses. Scand. J. Work Environ. Health 1995, 21, 9–14. [Google Scholar] [PubMed]
  39. Komiyama, M.; Gu, M.; Wu, H.M. Determination of extraframework cation positions and their occupancies on heulandite (010) by atomic force microscopy. J. Phys. Chem. B 2001, 105, 4680–4683. [Google Scholar] [CrossRef]
  40. Ono, S.S.; Matsuoka, O.; Yamamoto, S. Surface structures of zeolites studied by atomic force microscopy. Microporous Mesoporous Mater. 2001, 48, 103. [Google Scholar] [CrossRef]
  41. Mattioli, M.; Cenni, M.; Passaglia, E. Secondary mineral assemblages as indicators of multi stage alteration processes in basaltic lava flows: Evidence from the Lessini Mountains, Veneto Volcanic Province, Northern Italy. Per. Mineral. 2016, 85, 1–24. [Google Scholar] [CrossRef]
  42. Embrey, P.G. Fourth supplementary list of British minerals. Mineral. Mag. 1978, 42, 169–177. [Google Scholar] [CrossRef]
  43. Nelson, A.R.; Liverman, C.T.; Eide, E.A.; Abt, E. A Review of the NIOSH Roadmap for Research on Asbestos Fibers and other Elongate Mineral Particles; The National Academies Press: Washington, DC, USA, 2009. [Google Scholar]
  44. Midander, K.; Wallinder, I.O.; Leygraf, C. In vitro studies of copper release from powder particles in synthetic biological media. Environ. Pollut. 2007, 145, 51–59. [Google Scholar] [CrossRef] [PubMed]
  45. Sheldrick, G.M. A short history of SHELX. Acta Crystallogr. A Fund. Adv. 2008, 64, 112–122. [Google Scholar] [CrossRef] [PubMed]
  46. Sheldrick, G.M. Crystal structure refinement with SHELXL. Acta Crystallogr. C Struct. Chem. 2015, 71, 3–8. [Google Scholar] [CrossRef]
  47. Pacella, A.; Ballirano, P.; Cametti, G. Quantitative chemical analysis of erionite fibres using a micro-analytical SEM-EDX method. Eur. J. Mineral. 2016, 28, 257–264. [Google Scholar] [CrossRef]
  48. Passaglia, E. The crystal chemistry of chabazites. Am. Mineral. 1970, 55, 1278–1301. [Google Scholar]
  49. Cametti, G.; Pacella, A.; Mura, F.; Rossi, M.; Ballirano, P. New morphological, chemical, and structural data of woolly erionite-Na from Durkee, Oregon, USA. Am. Mineral. 2013, 98, 2155–2163. [Google Scholar] [CrossRef]
  50. Dogan, A.U.; Dogan, M. Re-evaluation and re-classification of erionite series minerals. Environ. Geochem. Health 2008, 30, 355–366. [Google Scholar] [CrossRef] [PubMed]
  51. Pacella, A.; Fantauzzi, M.; Turci, F.; Cremisini, C.; Montereali, M.R.; Nardi, E.; Atzei, D.; Rossi, A.; Andreozzi, G.B. Dissolution reaction and surface iron speciation of UICC crocidolite in buffered solution at pH 7.4: A combined ICP-OES, XPS and TEM investigation. Geochim. Cosmochim. Acta 2014, 127, 221–232. [Google Scholar] [CrossRef]
  52. Maurice, P.A.; Hochella, M.F.; Parks, G.A.; Sposito, G.; Schwertmann, U. Evolution of hematite surface microtopography upon dissolution by simple organic acids. Clays Clay Miner. 1995, 43, 60–81. [Google Scholar] [CrossRef]
  53. Dove, P.M.; Platt, F.M. Compatible real-time reaction rates for in situ imaging of mineral–water interactions using scanning force microscopy. Chem. Geol. 1996, 127, 331–338. [Google Scholar] [CrossRef]
  54. Eggleston, C.M. High-resolution scanning probe microscopy: Tip-surface interaction, artifacts, and applications in mineralogy and geochemistry. In Scanning Probe Microscopy of Clay Minerals, CMS Workshop Lectures; The Clay Minerals Society: Boulder, CO, USA, 1978; Volume 7, pp. 3–90. [Google Scholar]
  55. Parkhurst, D.L.; Appelo, C.A.J. Description of Input and Examples for PHREEQC Version 3—A Computer Program for Speciation, Batch-Reaction, One-Dimensional Transport, and Inverse Geochemical Calculations; U.S. Geological Survey, Techniques and Methods: Denver, CO, USA, 2013; Volume 6, p. 43.
  56. Chipera, S.J.; Apps, J.A. Geochemical stability of natural zeolites. In Natural Zeolites: Occuerrence, Properties, Applications; Bish, D.L., Ming, D.W., Eds.; Reviews in Mineralogy and Geochemistry; Mineralogical Society of America: Washington, DC, USA, 2001; Volume 45, pp. 117–161. [Google Scholar]
  57. Stumm, W.; Morgan, J.J. Aquatic Chemistry: Chemical Equilibria and Rates in Natural Waters, 3rd ed.; Wiley-Interscience Publication: New York, NY, USA, 1995. [Google Scholar]
  58. Oelkers, E.H.; Helgeson, H.C.; Shock, E.L.; Sverjensky, D.; Johnson, J.W.; Pokrovskii, V.A. Summary of the Apparent Standard Partial Molal Gibbs Free Energies of Formation of Aqueous Species, Minerals, and Gases at Pressures 1 to 5000 Bars and Temperatures 25 to 1000 °C. J. Phys. Chem. Ref. Data 1995, 24, 1401–1560. [Google Scholar] [CrossRef]
  59. World Health Organization (WHO). Asbestos and other Natural Mineral Fibers; Environmental Health Criteria: Geneva, Switzerland, 1986; Volume 53, pp. 69–107. [Google Scholar]
  60. Alberti, A.; Cruciani, G.; Galli, E.; Vezzalini, G. A re-examination of the crystal structure of the zeolite offretite. Zeolites 1996, 17, 457–461. [Google Scholar] [CrossRef]
  61. Alberti, A.; Martucci, A.; Galli, E.; Vezzalini, G. A re-examination of the crystal structure of erionite. Zeolites 1997, 19, 349–352. [Google Scholar] [CrossRef]
  62. Schlenker, J.L.; Pluth, J.J.; Smith, J.V. Dehydrated natural erionite with stacking faults of the offretite type. Acta Crystallogr. B 1977, B33, 3265–3268. [Google Scholar] [CrossRef]
  63. Fischer, C.; Kurganskaya, I.; Schäfer, T.; Lüttge, A. Variability of crystal surface reactivity: What do we know? Appl. Geochem. 2014, 43, 132–157. [Google Scholar] [CrossRef]
  64. Yamamoto, S.; Sugiyama, S.; Matsuoka, O.; Kohmura, K.; Honda, T.; Banno, Y.; Nozoye, H. Dissolution of zeolite in acidic and alkaline aqueous solutions as revealed by AFM imaging. J. Phys. Chem. 1996, 100, 18474–18482. [Google Scholar] [CrossRef]
  65. Eaton, P.; West, P. Atomic Force Microscopy; Oxford University Press: New York, NY, USA, 2010; ISBN 978-0-19-957045-4. [Google Scholar]
  66. Ragnarsdóttir, K.V. Dissolution kinetics of heulandite at pH 2–12 and 25 °C. Geochim. Cosmochim. Acta 1993, 57, 2439–2449. [Google Scholar] [CrossRef]
  67. Brady, P.V.; Walther, J.V. Controls on silicate dissolution rates in neutral and basic pH solutions at 25 °C. Geochim. Cosmochim. Acta 1989, 53, 2823–2830. [Google Scholar] [CrossRef]
  68. Hartman, R.L.; Fogler, H.S. Understanding the dissolution of zeolites. Langmuir 2007, 23, 5477–5484. [Google Scholar] [CrossRef]
  69. Delannay, F.; Cçekiewicz, S. Dark field TEM and XPS of proton exchanged erionite-offretite (T) zeolites. Zeolites 1985, 5, 69–71. [Google Scholar] [CrossRef]
  70. Ohsuna, T.; Terasaki, O.; Watanabe, D.; Anderson, M.W.; Carr, S.W. Dealumination of hexagonal (EMT)/cubic (FAU) zeolite intergrowth materials: A SEM and HRTEM study. Chem. Mater. 1994, 6, 2201–2204. [Google Scholar] [CrossRef]
  71. Ballirano, P.; Andreozzi, G.B.; Dogan, M.; Dogan, A.U. Crystal structure and iron topochemistry of erionite-K from Rome, Oregon, U.S.A. Am. Mineral. 2009, 94, 1262–1270. [Google Scholar] [CrossRef]
  72. Croce, A.; Allegrina, M.; Rinaudo, C.; Gaudino, G.; Yang, H.; Carbone, M. Numerous iron-rich particles lie on the surface of erionite fibers from Rome (Oregon, USA) and Karlik (Cappadocia, Turkey). Microsc. Microanal. 2015, 21, 1341–1347. [Google Scholar] [CrossRef]
  73. Wise, W.S.; Tschernich, R.W. The chemical compositions and origin of the zeolites offretite, erionite and levyne. Am. Mineral. 1976, 61, 853–863. [Google Scholar]
  74. Bonneau, L.; Malard, M.; Pezerat, H. Studies on surface properties of asbestos II. Role of dimensional characteristics and surface properties of mineral fibers in the induction of pleural tumors. Environ. Res. 1986, 41, 268–275. [Google Scholar] [CrossRef]
  75. Eborn, S.K.; Aust, A.E. Effect of iron acquisition on induction of DNA single-strand breaks by erionite, a carcinogenic mineral fiber. Arch. Biochem. Biophys. 1995, 316, 507–514. [Google Scholar] [CrossRef] [PubMed]
  76. Fach, E.; Kristovich, R.; Long, J.; Waldman, W.J.; Dutta, P.K.; Williams, M. The effect of iron on the biological activities of erionite and mordenite. Environ. Int. 2003, 29, 451–458. [Google Scholar] [CrossRef]
  77. Pacella, A.; Cremisini, C.; Nardi, E.; Montereali, M.R.; Pettiti, I.; Giordani, M.; Mattioli, M.; Ballirano, P. Different erionite species bind iron into the structure: A potential explanation for fibrous erionite toxicity. Minerals 2018, 8, 36. [Google Scholar] [CrossRef]
  78. Gazzano, E.; Turci, F.; Foresti, E.; Putzu, M.G.; Aldieri, E.; Silvagno, F.; Lesci, I.G.; Tomatis, M.; Riganti, C.; Romano, C.; et al. Iron-loaded synthetic chrysotile: A new model solid for studying the role of iron in asbestos toxicity. Chem. Res. Toxicol. 2007, 20, 380–387. [Google Scholar] [CrossRef] [PubMed]
  79. Aust, A.E.; Cook, P.M.; Dodson, R.D. Morphological and chemical mechanisms of elongated mineral particle toxicities. J. Toxicol. Environ. Health B 2011, 14, 40–75. [Google Scholar] [CrossRef] [PubMed]
  80. Gualtieri, A.F.; Mossman, B.T.; Roggli, V.L. Towards a general model to predict the toxicity and pathogenicity of mineral fibres. Chapter 15. In Mineral Fibres: Crystal Chemistry, Chemical-Physical Properties, Biological Interaction and Toxicity; Gualtieri, A.F., Ed.; European Mineralogical Union: Jena, Germany; Mineralogical Society of Great Britain & Ireland: London, UK, 2017; Volume 18, pp. 501–532. [Google Scholar]
  81. Fubini, B.; Arean, C.O. Chemical aspects of the toxicity of inhaled mineral dusts. Chem. Soc. Rev. 1999, 28, 373–381. [Google Scholar] [CrossRef]
  82. Schofield, R.E.; Hausrath, E.M.; Gainey, S.R. Zeolite weathering in laboratory and natural settings, and implications for Mars. In Proceedings of the 46th Lunar and Planetary Science Conference, The Woodlands, TX, USA, 16–20 March 2015. [Google Scholar]
  83. Gainey, S.R.; Hausrath, E.M.; Hurowitz, J.A.; Milliken, R.E. Nontronite dissolution rates and implications for Mars. Geochim. Cosmochim. Acta 2014, 126, 192–211. [Google Scholar] [CrossRef]
Figure 1. Schematic image of lung environment and, in particular, of the alveolus, reachable by small inhaled fibres. Artificial lysosomal fluid (ALF) solution simulates the acid environment inside the alveolar and interstitial macrophages (in red), while Gamble’s solution simulates the neutral environment of interstitial fluid (blue).
Minerals 09 00083 g001
Figure 2. Atomic force microscope (AFM) images of offretite FF surface, in MilliQ water at 25 °C, at different magnifications: (a) height retrace image of particles of different sizes on surface and related sections (d); (b) amplitude retrace image of particularly clean surface terraces and related section (c).
Minerals 09 00083 g002
Figure 3. Amplitude retrace AFM images of erionite MB2404 surface in MilliQ water at 25 °C, at different magnifications: (a) typical clean surface (without particles) and related section (d); (b) particular of an area covered by particles and corresponding sections (c); (e) particular of steps parallel to c-direction and related section (f).
Minerals 09 00083 g003
Figure 4. Sequence of amplitude retrace AFM images of the same area of FF in ALF solution at 25 °C (pH 4.15), at different time of interaction: (a) 18 h; (b) 25 h; (c) 50 h. The particles movement and removal (yellow and green circle in (a,b)) and the surface dissolution in sections (d,e) is appreciable.
Minerals 09 00083 g004
Figure 5. Sequence of amplitude retrace AFM images of the same surface area of FF surface at 37 °C (a) in water and at different time of interaction in ALF solution (pH 4.34): (b) 1 h; (c) 8 h. From the images and related sections (d,e) the surface dissolution and particles removal is notable.
Minerals 09 00083 g005
Figure 6. Sequence of amplitude retrace AFM images of the same surface area (a) and related sections (b) of offretite surface at 25 °C, at different time of interaction in Gamble’s solution (pH 8.17). A new growing phase on the surface is recognizable.
Minerals 09 00083 g006
Figure 7. Amplitude retrace AFM images of the same area of erionite surface at 25 °C: (a) in water and (b) after 7 h of interaction in ALF solution (pH 4.15). Corresponding profiles of AB section (c) and A’B’ section (d).
Minerals 09 00083 g007
Figure 8. AFM images in amplitude retrace of same area of erionite surface at 37 °C, (a) in water and (b) after 4 h of interaction in ALF (pH 4.34). Corresponding profiles of AB section (c) and A’B’ section (d). A differential dissolution of surface and particles removal is appreciable.
Minerals 09 00083 g008
Figure 9. AFM images in amplitude retrace of same area on erionite surface at 25 °C, (a) in water and at different interaction times in Gamble’s solution (pH 8.51): (b) after 150 min; (c) after 270 min. Sections of growing phase (d,e) and steps on surface (f,g) are shown.
Minerals 09 00083 g009
Figure 10. Amplitude retrace AFM images of same area on erionite surface at 37 °C, (a) in water and at different interaction time in Gamble’s solution (pH 8.48): (b) after 30 min; (c) after 270 min. A layer growth is recognizable, and the height of this new phase is showed in the related section (d).
Minerals 09 00083 g010
Figure 11. Solubility of erionite and nontronite calculated as function of pH: (a) total Si concentration at equilibrium and (b) total Al concentration at equilibrium. Results obtained for laumontite are also reported as a reference.
Minerals 09 00083 g011
Table 1. Measured pH values of the prepared lung fluid solutions.
SLFsPreparation DayWeeks Later37 °CCorrected by HCl
1°ALF4.15
1°Gamble’s7.918.17
2°ALF4.31 4.34
2°Gamble8.128.518.487.4
Table 2. Crystal data and refinement parameters of MB2404 erionite and FF offretite samples.
Crystal DataMB2404FF
Crystal size (mm)0.17 × 0.08 × 0.080.17 × 0.06 × 0.09
a-axis (Å)13.2949(5)13.2890(4)
c-axis (Å)15.0768(11)7.5788(2)
Cell volume (Å3)2307.9(2)1159.09(8)
Z21
Space groupP63/mmcP-6m2
Refined chemical formulaCa3.73K2(Si,Al)36O72∙31H2OCa1.96K0.98Mg0.87(Si,Al)18O36∙13.67H2O
Data Collection
DiffractometerBruker APEX II SMARTBruker APEX II SMART
X-ray radiationMoKα λ = 0.71073 ÅMoKα λ = 0.71073 Å
X-ray power50 kV, 30 mA50 kV, 30 mA
MonochromatorGraphiteGraphite
Temperature (°C)2525
Time per frame (s)1010
Max. 2θ51.7065.39
Index ranges−15 < h < 16−20 < h < 20
−16 < k < 16−17 < k < 19
−18 < l < 11−11 < l < 11
No. of measured reflections13,20019,142
No. of unique reflections8791669
No. of observed reflections I > 2σ (I)6101466
Structure Refinement
No. of parameters used in the refinement7588
R(int)0.06400.0415
R(σ)0.03290.0218
GooF1.0441.094
R1, I>2σ (I)0.06020.0440
R1, all data0.09150.0508
wR2 (on F2)0.19470.1248
Δρmin (−eÅ−3) close to0.80 W41.11 W3
Δρmax (−eÅ−3) close to−0.72 W1−0.60 Mg
Table 3. Chemical composition of the investigated samples: average values (N is the number of point analyses), minimum and maximum values. ƩT is the sum of cations in tetrahedral sites; E%, measure of charge balance: E% = 100 × [Al − Alkth]/Alkth where Alkth = Na + K + 2 × (Ca + Mg); R = Si/(Si + Al) ratio. Crystal chemical formula calculated on the basis of 36 (Si + Al) apfu. Assumed water content of 18 wt %.
FFNatural N = 7In ALF 2 Days N = 7In Gamble’s 2 Days N = 10
AverageMinMaxAverageMinMaxAverageMinMax
SiO256.7654.8958.2353.7051.2758.6552.4650.4063.30
Al2O316.0314.8917.5418.1914.3020.5620.1919.4322.99
MgO2.191.463.142.581.712.942.681.883.21
CaO3.983.504.683.212.573.933.412.704.93
Na2O0.000.000.001.560.612.601.530.003.00
K2O3.052.664.032.882.693.093.532.854.90
H2O18.0018.0018.0018.0018.0018.0018.0018.0018.00
Total82.0081.9982.0182.0081.9982.0182.0081.9982.01
Si27.0126.1527.5925.7424.5427.8524.8424.5725.15
Al8.998.329.8510.288.0011.6011.2810.7611.56
ƩT35.9935.8436.1936.0235.7436.1836.1235.9136.26
Mg1.551.052.231.851.212.111.901.372.31
Ca2.031.772.411.651.322.031.741.402.58
Na0.000.000.001.450.572.441.380.002.61
K1.851.602.471.761.641.902.141.763.05
H2O28.5728.3828.8528.7828.5129.0429.0628.8829.36
R0.750.730.770.710.680.780.690.680.70
E%−0.08−6.738.780.64−9.576.664.71−3.219.97
Mg/(Ca + Na)0.780.431.210.610.440.810.620.460.80
MB2404Natural N = 7In ALF 2 Days N = 9In Gamble’s 2 Days N = 12
AverageMinMaxAverageMinMaxAverageMinMax
SiO252.2250.4552.6951.1149.9252.3450.0848.1351.52
Al2O318.9318.1519.8818.3817.7019.4319.1917.9920.11
MgO0.930.001.300.080.000.710.380.000.93
CaO6.725.808.700.000.000.000.840.002.10
Na2O0.320.000.989.617.9510.727.305.139.87
K2O2.882.723.012.822.613.304.213.904.65
H2O18.0018.0018.0018.0018.0018.0018.0018.0018.00
Total82.0081.9982.0182.0081.9982.0182.0082.0082.00
Si25.2924.6725.5325.2124.6925.6224.8124.1425.39
Al10.8110.3711.4510.6910.2811.3211.2110.4811.81
ƩT36.1035.9036.2135.9035.7136.1336.0235.7536.23
Mg0.670.000.930.060.000.520.280.000.68
Ca3.493.004.560.000.000.000.440.001.11
Na0.300.000.919.207.5610.317.024.899.60
K1.781.681.861.771.652.062.662.452.94
H2O29.0828.9529.3529.6229.3829.8129.7529.4330.10
R0.700.680.710.700.690.710.690.670.71
E%4.07−3.548.51−3.39−9.845.411.10−8.108.39
Mg/(Ca + Na)0.190.000.290.010.000.070.040.000.11

