Mechanical Characteristics and Failure Prediction of Cement Mortar with a Sandwich Structure

1
State Key Laboratory of Mining Disaster Prevention and Control Co-founded by Shandong Province and the Ministry of Science and Technology, Shandong University of Science and Technology, Qingdao 266590, China
2
School of Mining and Safety Engineering, Shandong University of Science and Technology, Qingdao 266590, China
*
Author to whom correspondence should be addressed.
Minerals 2019, 9(3), 143; https://doi.org/10.3390/min9030143
Submission received: 28 January 2019
/
Revised: 22 February 2019
/
Accepted: 23 February 2019
/
Published: 28 February 2019
(This article belongs to the Special Issue Backfilling Materials for Underground Mining)
Abstract
:It is necessary to master the mechanical properties and failure prediction of the composite of mortar and rock block in a mined-out area. In this study, uniaxial compression and acoustic emission (AE) synchronous tests of mortar specimens with different sandwich materials and cement–sand ratios were carried out. The results showed that the compressive strength and elastic modulus of mortar specimens increased with an increase in the cement–sand ratio and the stiffness of the sandwich material. The AE counts and energy of mortar specimens with a high-stiffness sandwich material were maximum when they were destroyed. The b value, a number that reflects the extent of fracture propagation, decreased first and then increased with the increase in strain. The inflection point of the b value can be taken as the indication of the imminent failure of the mortar. A method for determining the b value at the turning point was proposed and verified.
1. Introduction
The dense population and high degree of urbanization in Central and Eastern China have created an increased demand for land for urban constructions and farming in recent years. Furthermore, these regions are important coal production centers and home to many goafs [1,2,3,4]; these goafs further strain the availability of useful land for urbanization and farming. Therefore, one effective way to address this situation might be to stabilize collapsing mines to improve their load-bearing capacities to make them suitable sites for building construction [5,6,7].
However, ensuring the long-term safety of buildings constructed on such restored mined-out sites is a key issue that needs attention [8,9]. At present, strengthening a foundation is fundamental to solving the problem of instability of buildings constructed on restored mined-out lands [10,11,12]. This objective is generally achieved by filling goafs with cemented material, high-water-content materials, or granular materials [2]. It is more reliable and safer to fill goafs with cemented materials than with granular materials to make them conform to the stability requirements for construction.
After filling the spaces between rock blocks in a goaf by grouting, rock block and cement materials are cemented into a complex, thus providing support for the upper strata. The physical and mechanical properties of the cemented composites are influenced, not only by the cementing materials, but also by the structure of the cemented composite. At present, research on goaf treatment mainly focuses on the development and selection of filling materials, mechanical properties of filling materials and surrounding rock, and evaluation and control of the stability of the coal mine roof [13,14,15,16,17,18,19,20,21,22,23,24,25,26,27]. Already, many significant results have been obtained. For example, Zhao et al. studied the application of slag cement and fly ash for strength development in cemented paste backfills, and found that the mix designs “3% slag-blended cement” and “2.5% slag-blended cement +2–2.5% fly ash” satisfied the 700 kPa strength threshold required for slope stability [13]. Wang et al. applied the coal mine roof rating (CMRR) to evaluate the roof stability of coal mines in China and found that the CMRR guidelines are useful to preliminarily investigate stability in Panjiang Coal Field mines [16]. Such research results have promoted the development of stability evaluation and management of mined-out areas in China. While the cemented material and rock block are a supporting whole, the influence of sandwich material on the mechanical properties of composite cannot be ignored. Furthermore, as a real-time monitoring technology, acoustic emission (AE) technology can retrieve the formation and propagation of internal cracks in the process of material deformation by collecting and analyzing elastic wave information. It has been well applied in both test and engineering applications; many scholars have monitored the AE information (AE ring count, AE energy, AE amplitude, etc.) of mortar materials or rock under compression to obtain the damage and fracture evolution law of materials indirectly [28,29,30,31,32,33]. However, research attention paid to the prediction of mortar failure based on AE information is very rare.
For the same filling materials, the mechanical properties of the composite of mortar and rock block are affected by the proportion of filling materials, the stiffness of the rock block, and the complex structure. In this study, we simplified mortar-enclosed stone into a mortar with a sandwich structure in the middle. The mechanical and AE behaviors of cement mortar with a sandwich structure and different cement–sand ratios were explored, using iron and pine to simulate rock block of different stiffnesses. A method to predict the specimen failure is proposed and verified based on AE energy.
2. Materials and Experiments
2.1. Materials
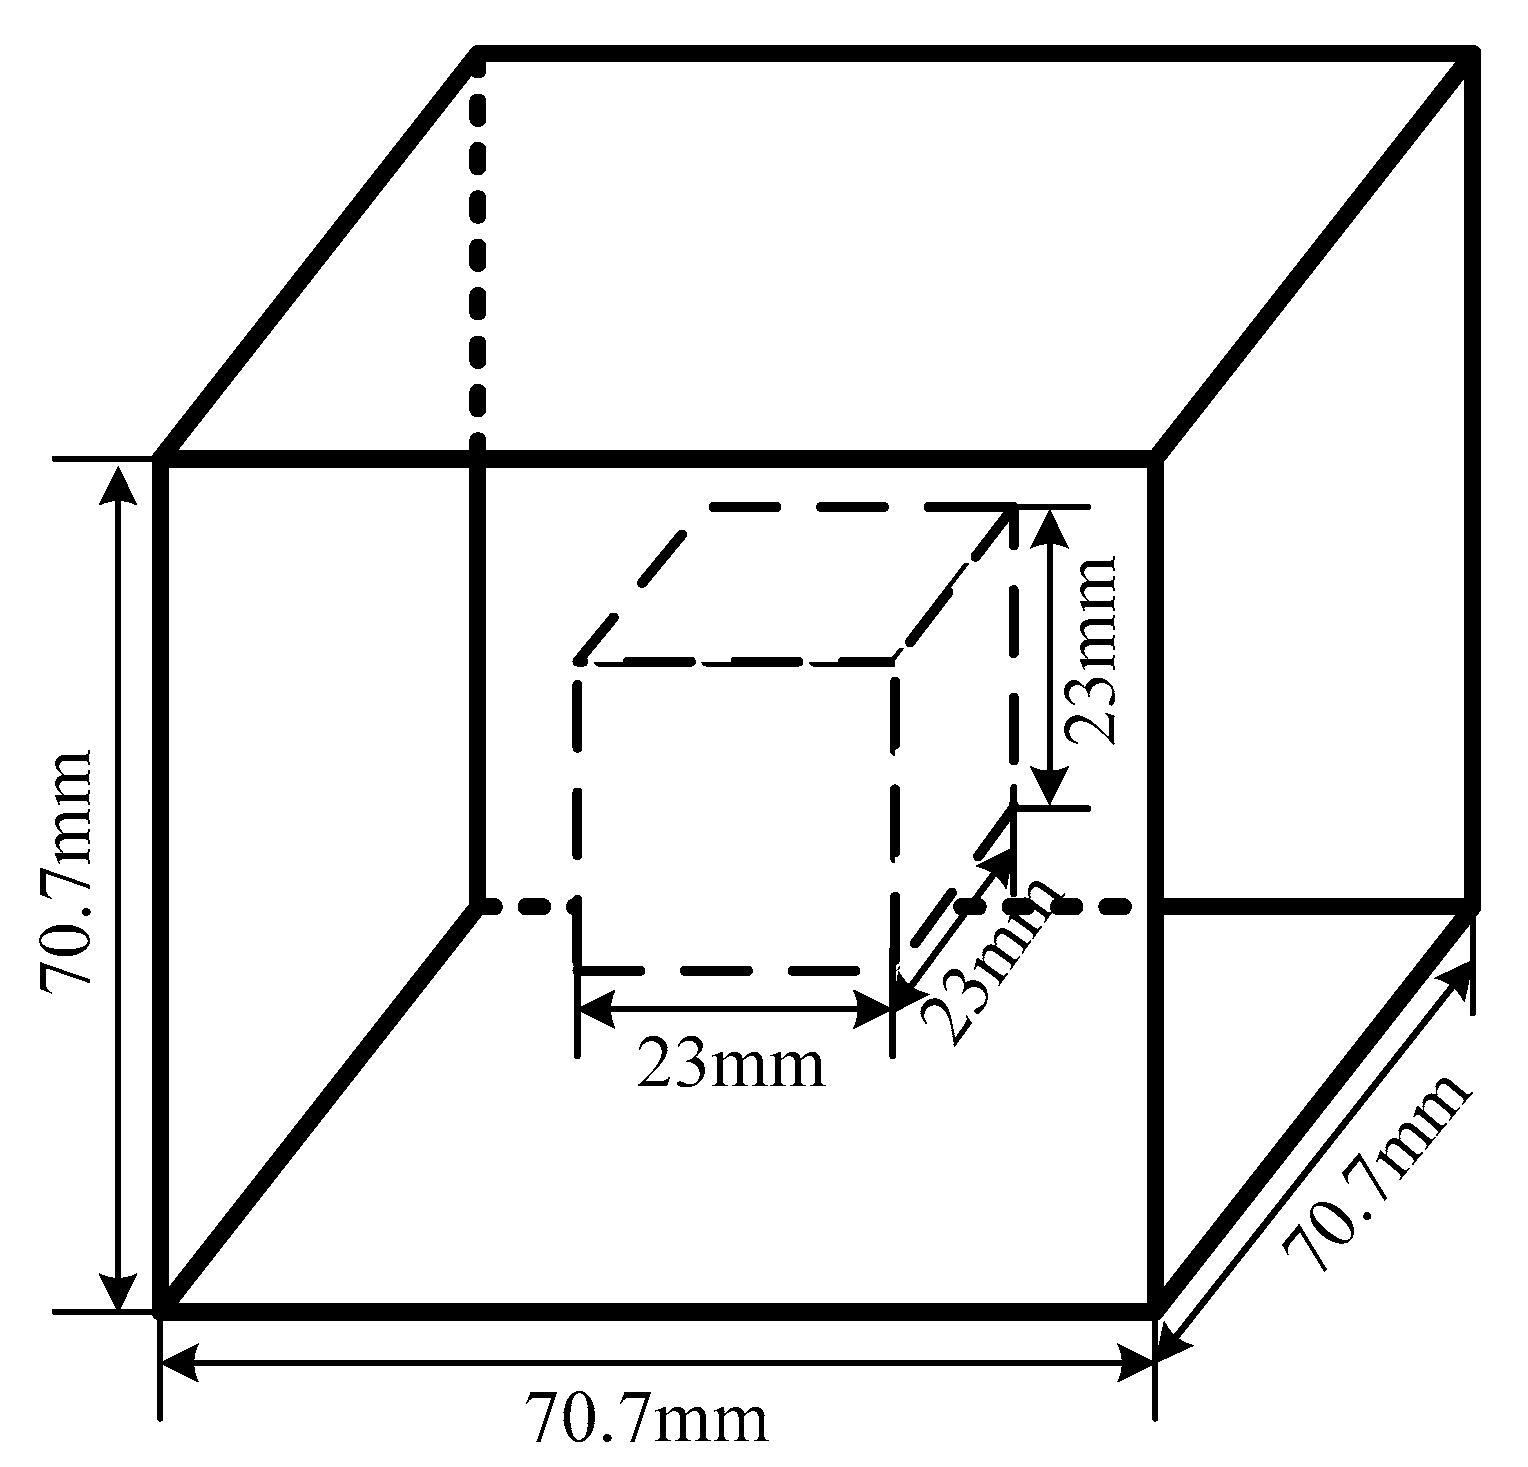
Ordinary Portland cement of the ASTM Type-I with a bulk density of 1.65 g/cm3, ordinary river sand with a particle size of 2–2.36 mm, and potable water were used for preparing test specimens. The specific gravity, bulk density, and water absorption of sand were 2.46 g/cm3, 1.21 g/cm3, and 1.07%, respectively. Considering the influence of the stiffness of rock block on the properties of the composite, iron cube with a density of 8.21 g/m3 and pine cube with a density of 0.72 g/cm3 of dimensions 23 mm × 23 mm × 23 mm were selected as sandwich materials for the mortar, as shown in Figure 1.
2.2. Sample Preparation
Standard metallic cube molds (70.7 mm) were used to prepare mortar specimens to test their compressive strength. Three kinds of mortar materials with different cement–sand ratios (1:2, 1:1.5, 1:1) were designed in this experiment; that is, the cement and river sand in the mortar materials were 0.50 g/cm3 and 1.00 g/cm3, 0.56 g/cm3 and 0.84 g/cm3, 0.68 g/cm3 and 0.68 g/cm3, respectively. Water accounted for 16% of mortar materials. The production of mortar mixtures was carried out in accordance with "Standards for testing methods of basic performance of building mortar" (JGJ/T 70-2009) [34], but there are no relevant standards for the preparation of mortar samples with a sandwich structure. After many attempts to make specimens with a sandwich structure before formal tests, repeatable steps for making mortar samples with a sandwich structure were established as follows:
- Put all the raw materials on the weighing scales, then put them into a blender for mixing.
- Pour the mixed mortar material into a mold gradually, and tamp down the material with a tamping hammer until the compacted material fills one third of the mold.
- Put the sandwich material in the middle of the trial mold, then pour the mixture into the remaining space. Tamp down the material by tamping the hammer frequently.
- Put the test mold with the compacted mortar material on the vibration table with a slight vibration to make the mixture uniform. Tamp down the mixture by tamping the hammer again.
- Keep the mold with mortar material in a sealed state for 24 h, then remove all specimens from the mold and put them in a curing tank for 28 days.
At least three mortar specimens of each cement–sand ratio and sandwich material were prepared. A set of pure mortar specimens without the sandwich was also prepared for comparison purposes.
2.3. Experimental Equipment and Procedure
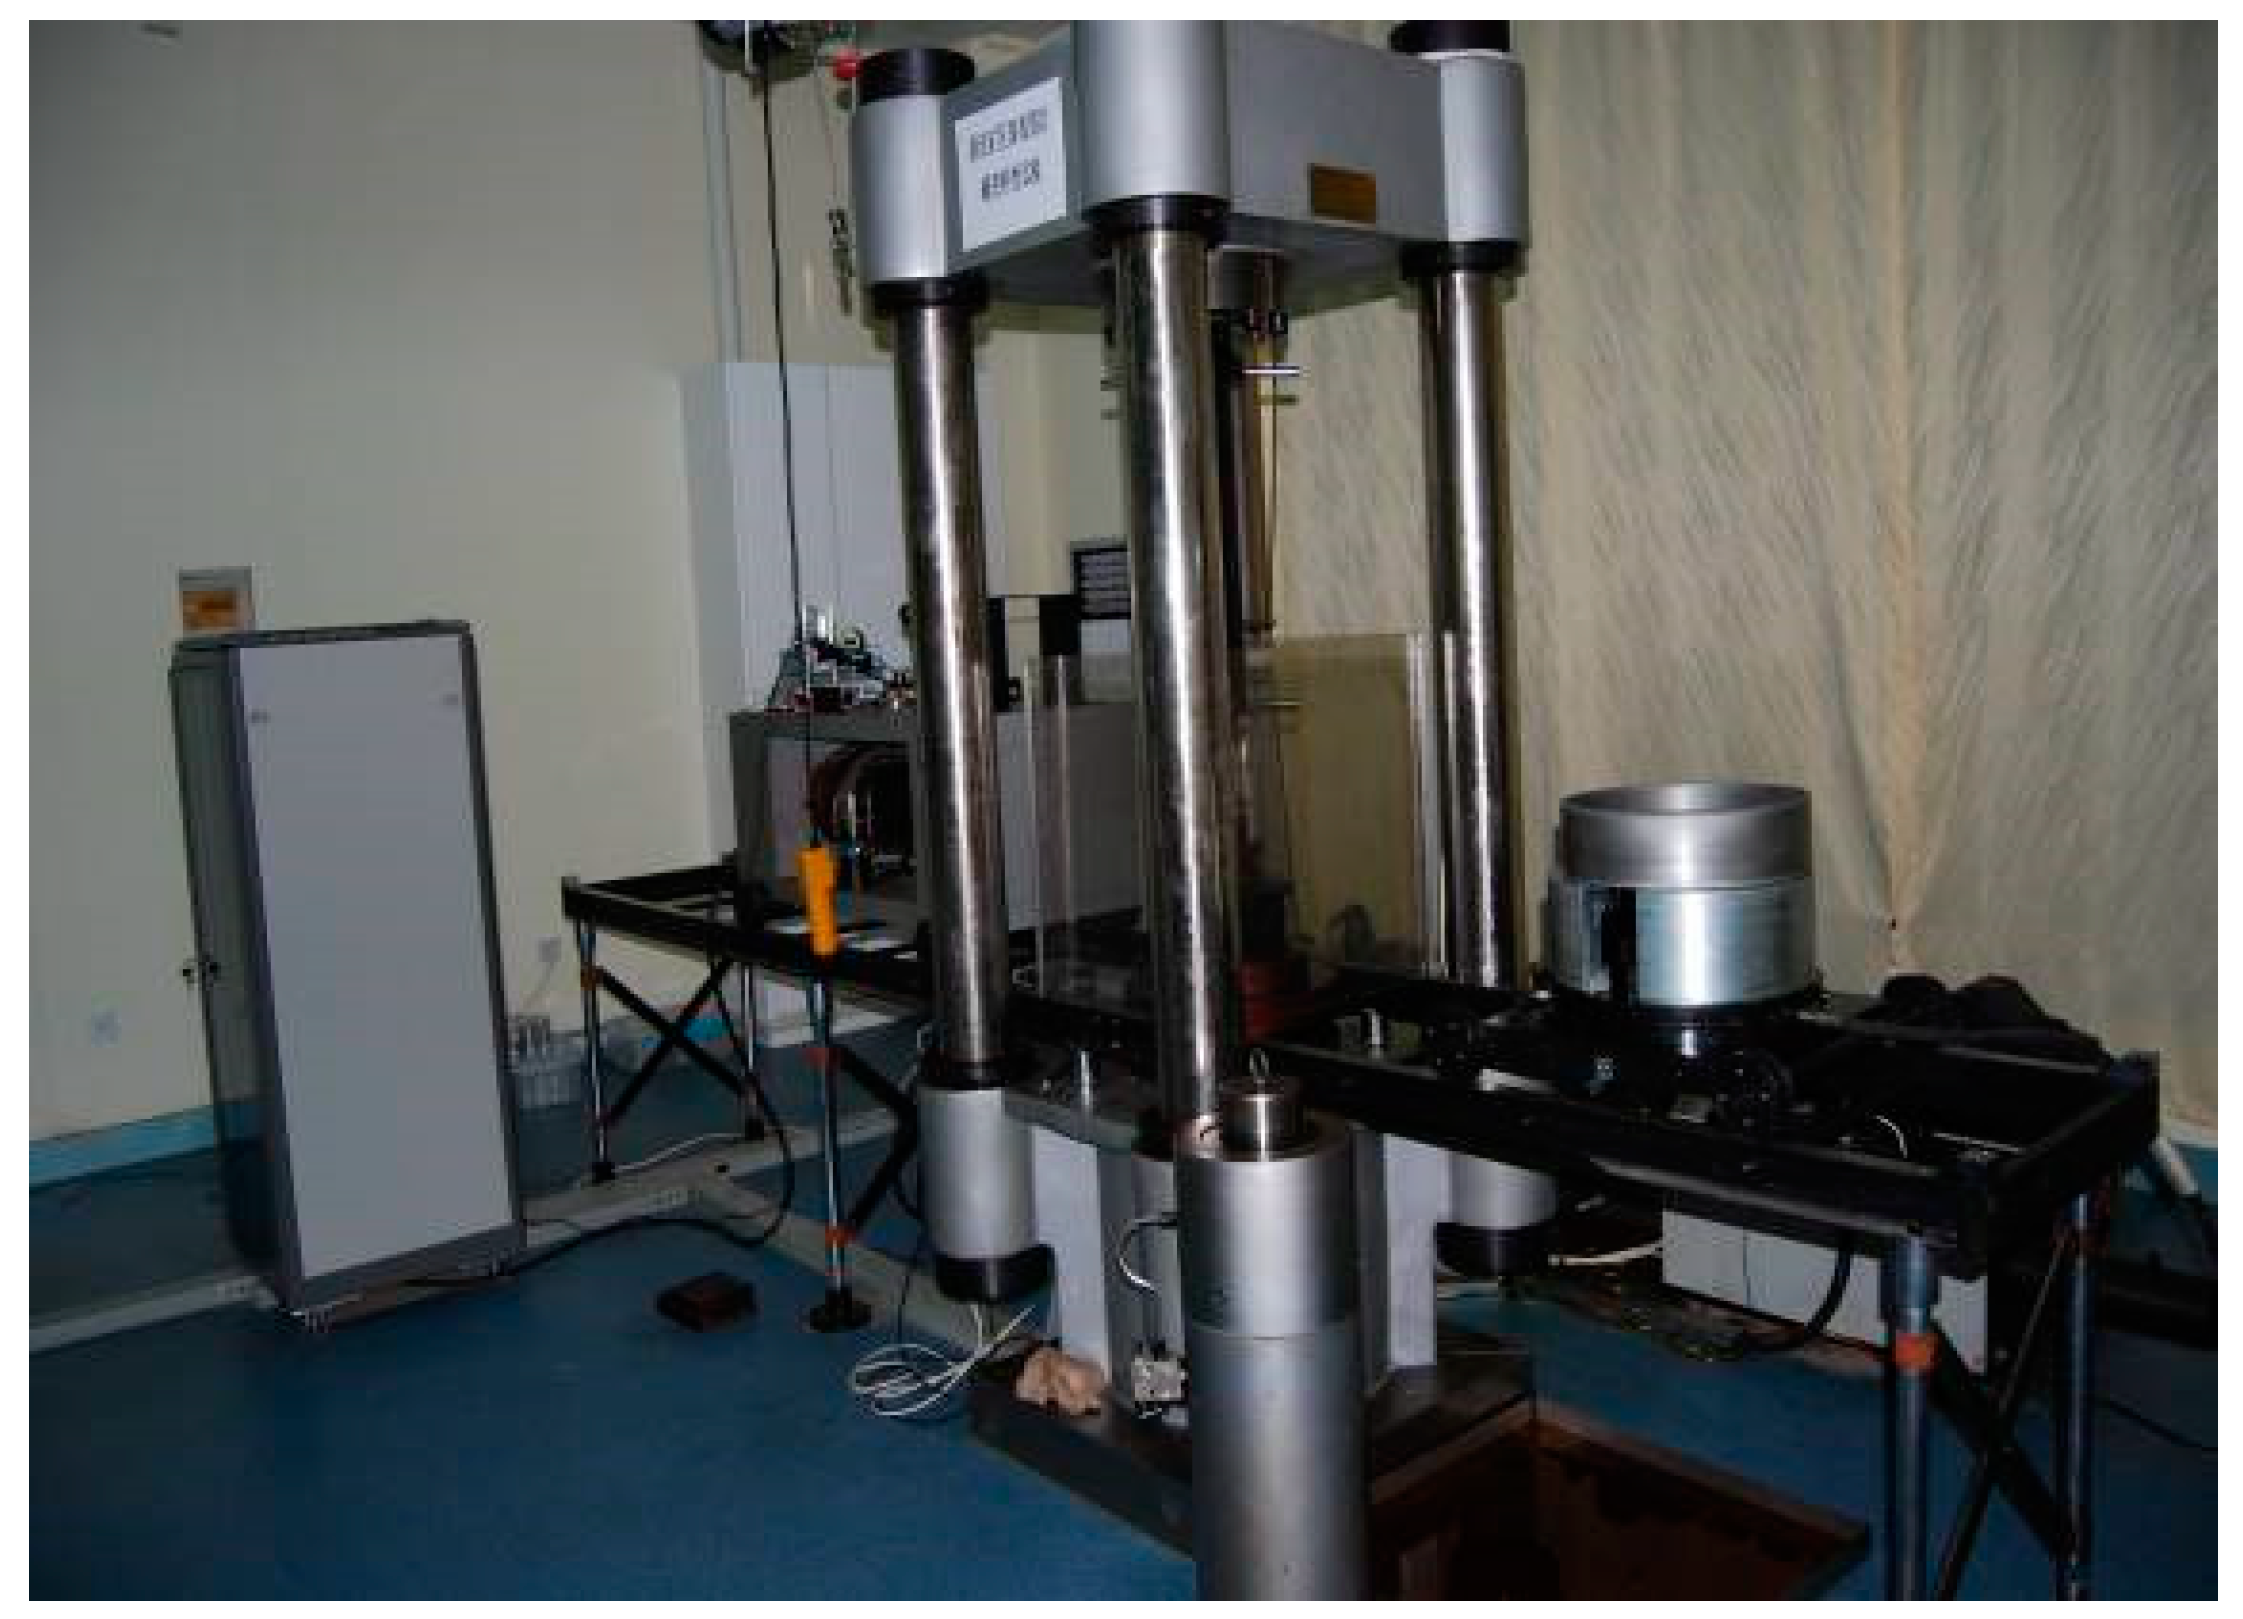
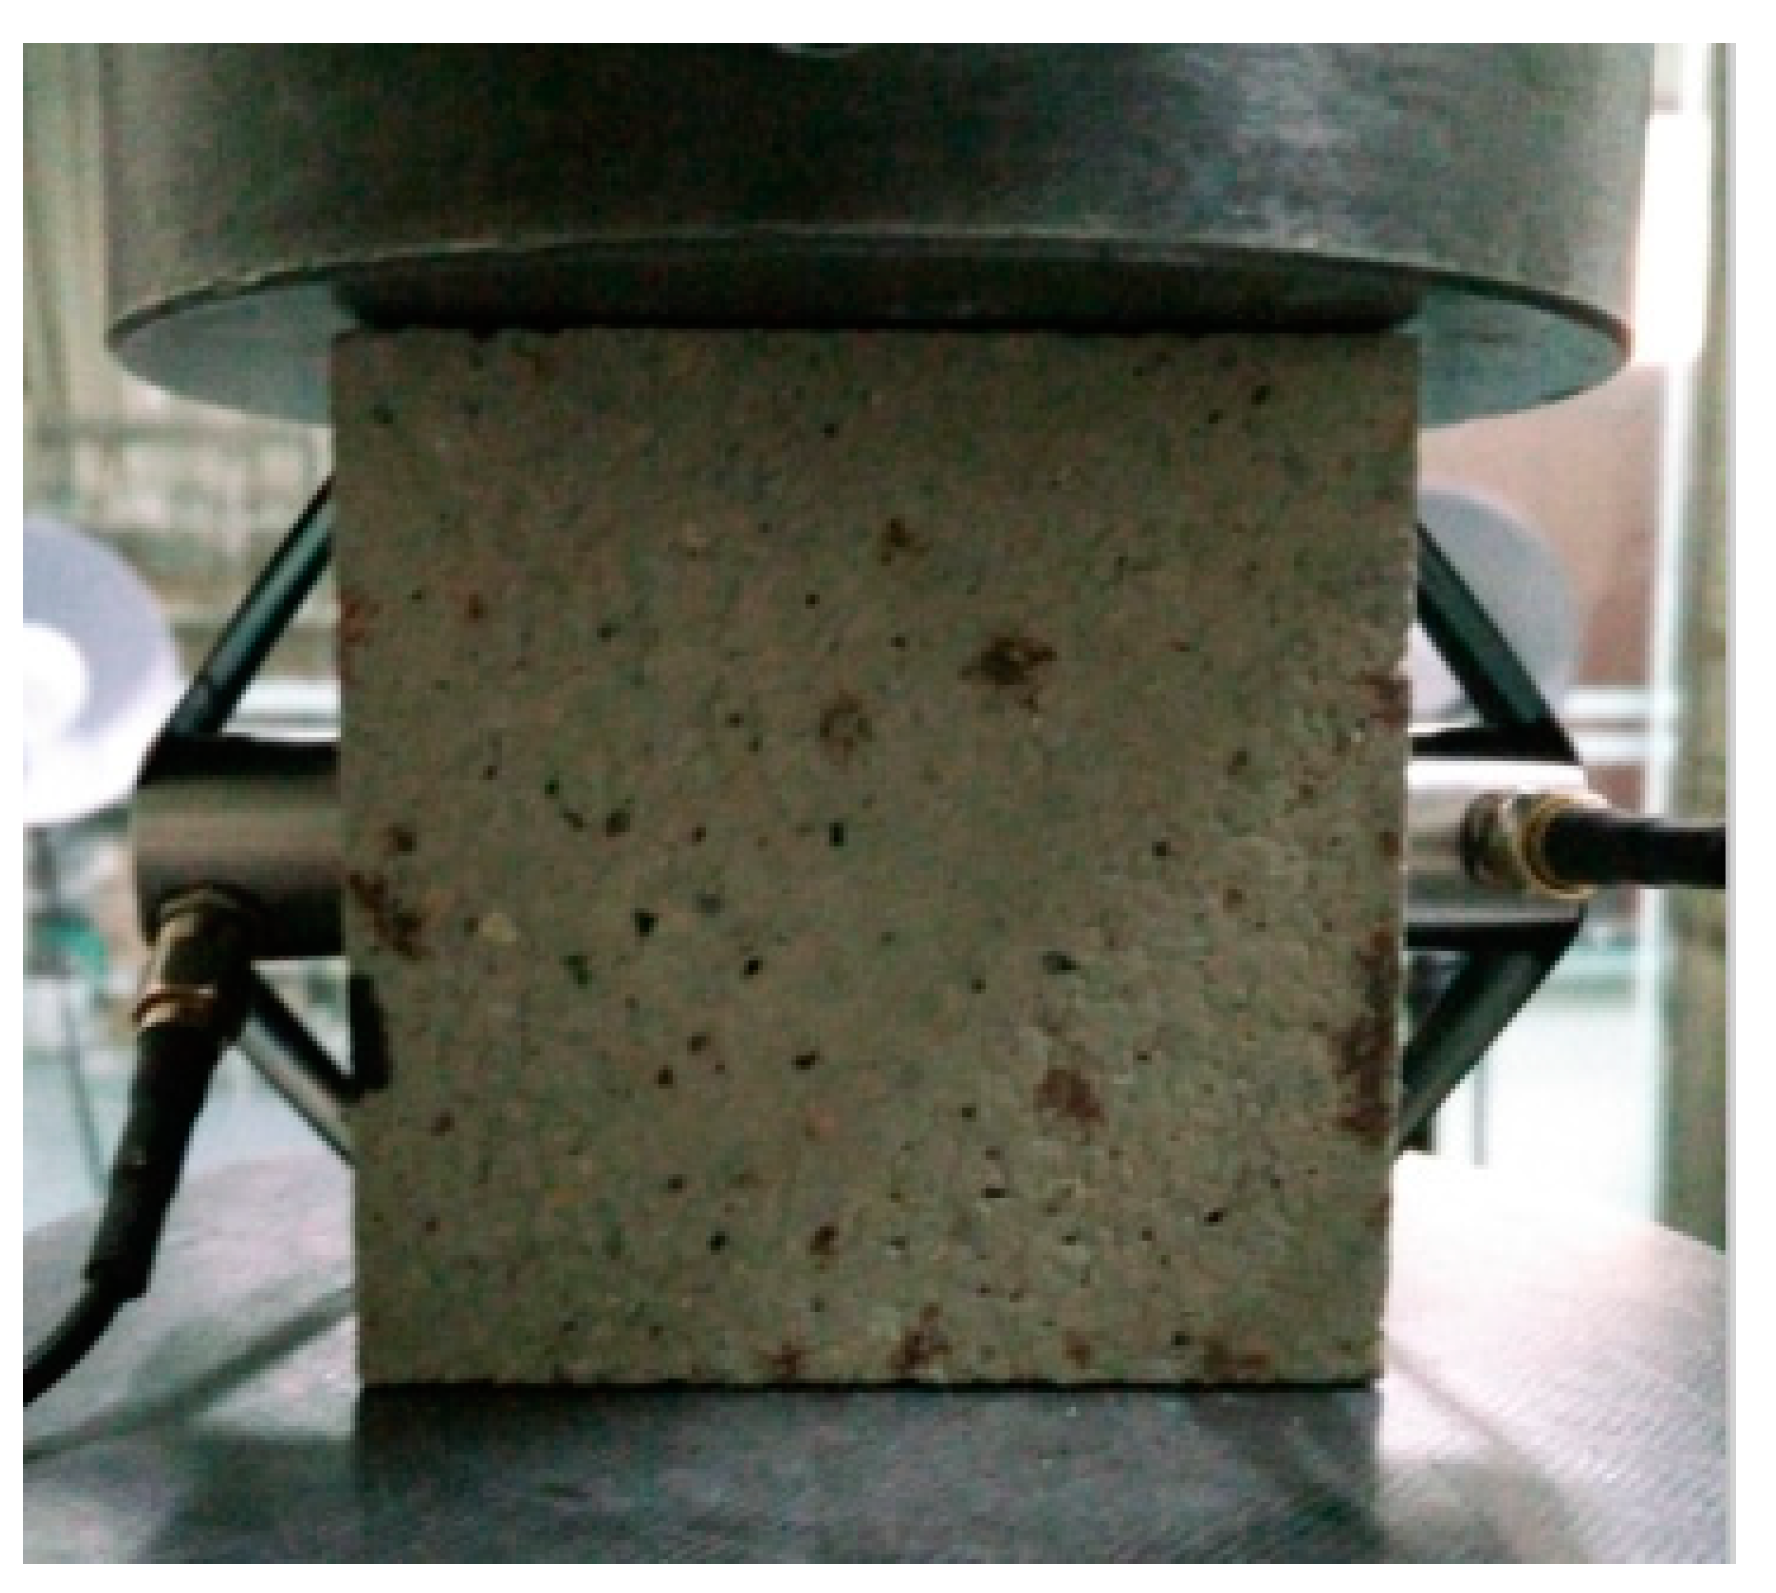
After the prescribed curing period, the unconfined compression strengths (UCS) of the three groups of specimens were measured with the help of a RLJW-2000 servo-controlled testing machine, as shown in Figure 2. The load system was controlled through a displacement control mode, and the loading speed was 0.5 mm/min. The axial deformation of the specimens was obtained by real-time monitoring of the axial displacement of the pressure head. Acoustic emission (AE) signals of the samples were monitored using a PCI-2 AE system. Two sensors, shown in Figure 3, were fixed on the surface of the test piece using tape. Vaseline was smeared between the sensor and the specimen to remove any air gaps and to ensure a coupling effect.
For the uniaxial compression test, specimens were divided into three groups: Group A was the specimen with an iron sandwich, Group B was the specimen with a pine sandwich, and Group C was the specimen without a sandwich material. Three samples of each group were compressed, and the average strength of the three samples was regarded as the UCS of the specimen from each material.
3. Results and Discussion
3.1. Strength and Deformation Behavior
Table 1 lists the strength and deformation characteristics of mortar specimens under uniaxial compression. The UCS and elastic modulus (E) of cement mortar increased as the cement–sand ratio increased. Taking the mortar with sandwich iron as an example, the UCS increased by 39.51% and 75.35%, and the E increased by 9.83% and 110.62%, respectively, as the cement–sand ratio increased from 1:2 to 1:1.5 and from 1:2 to 1:1. This trend repeated for all three groups of test specimens, which showed that the compressive mechanical properties of the specimens were improved with an increase in the cement–sand ratio.
The UCS of the test samples with the same cement–sand ratio decreased in the following order: Mortar with sandwich iron, mortar with sandwich pine, and pure mortar. Compared with the pure mortar with a cement–sand ratio of 1:1.5, the UCS of mortar samples with sandwich pine and sandwich iron increased by 29.91% and 88.49%, respectively. This shows that the strength of mortar specimens was improved more obviously using sandwich materials with high stiffness.
Of the three groups of mortar specimens, the axial strain at the peak point of the specimen with sandwich iron was the largest; this showed that the sandwich material with a high stiffness improved the deformation capacity of specimens. Additionally, for the mortar specimens with varied cement–sand ratios, the axial strain at the peak point of samples with a cement–sand ratio of 1:1.5 was the largest; this showed that a moderate mortar ratio was helpful to improve the deformation ability of the mortar specimen, rather than a higher cement–sand ratio leading to a better deformation ability of the specimen.
3.2. Acoustic Emission Characteristics
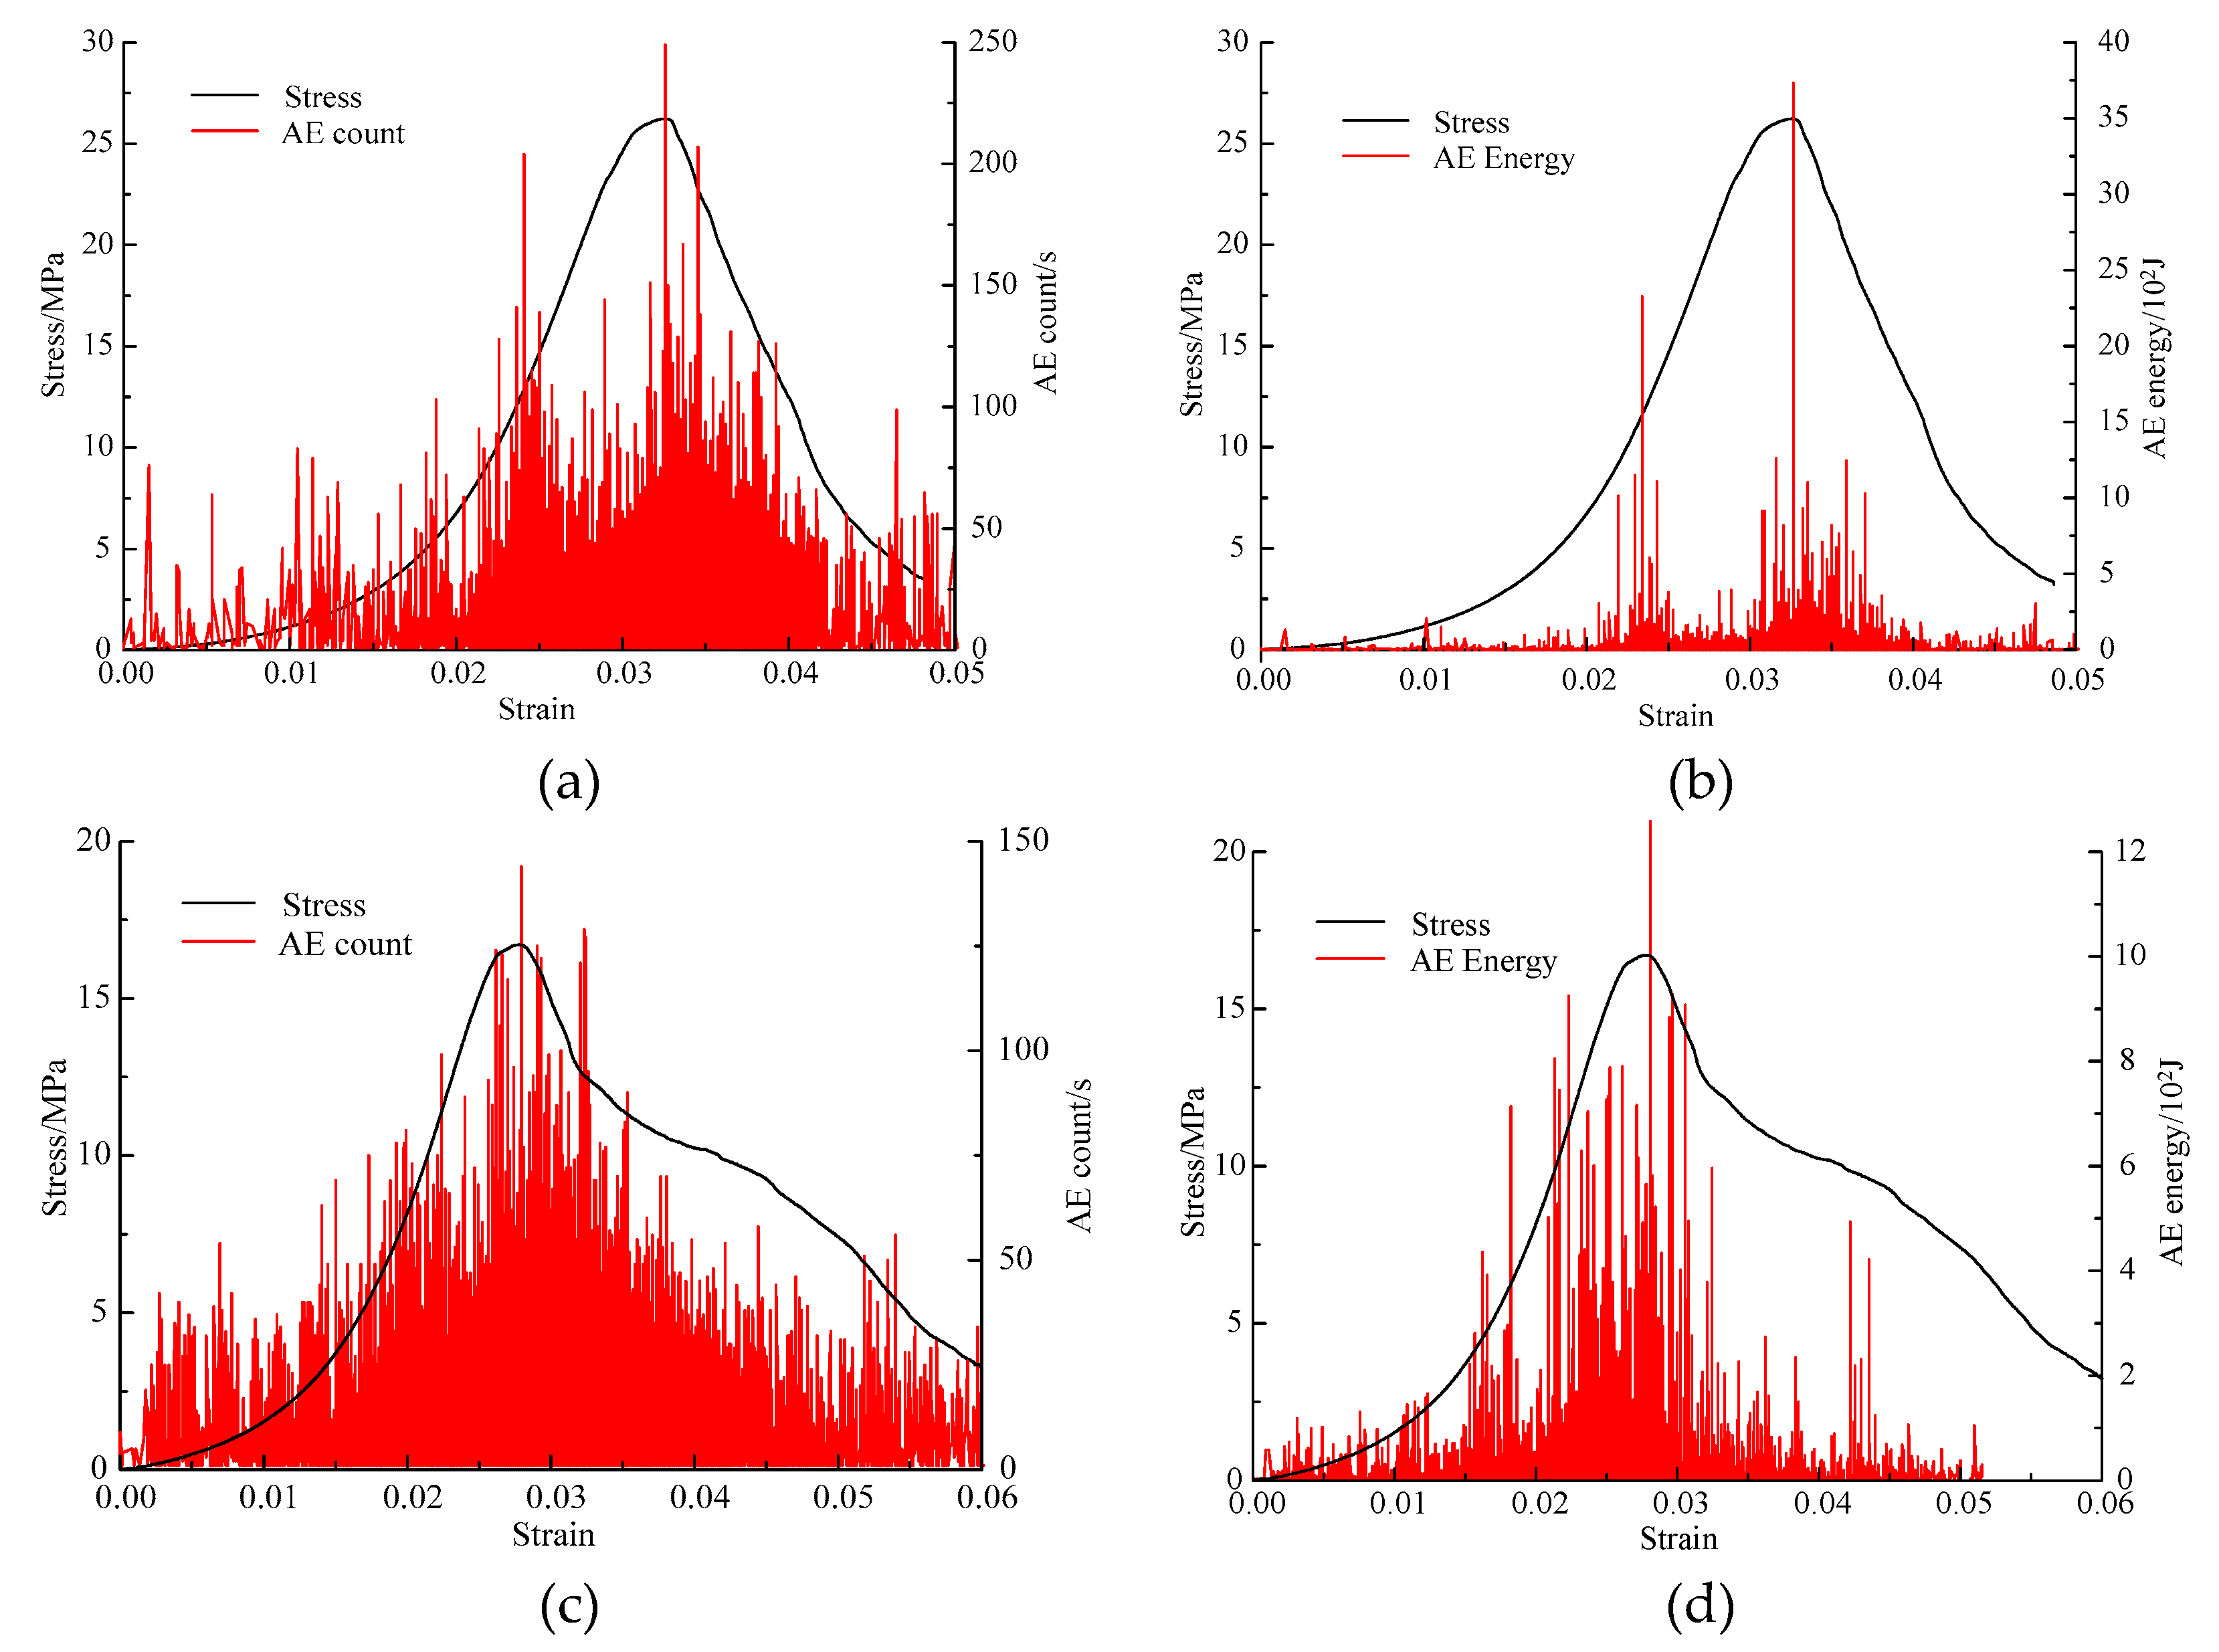
The uniaxial compressive stress–strain curves with AE counts are shown in Figure 4a, and the stress–strain curves with AE energy are shown in Figure 4b for mortar samples with a cement–sand ratio of 1:2. The evolution laws of the AE count and AE energy of mortar samples during compression are consistent for not only the three example groups illustrated in Figure 4 but for all nine groups.
In the early stages of compression, cracks in the mortar sample were compacted and closed, the number of AE events was small, and the AE energy was low. As the loading stress increased, the primary cracks propagated, and new cracks formed and propagated as well. AE events and AE energy increased. Near the peak point, AE events and AE energy increased sharply, and the mortar sample was close to failure. It should be emphasized that the compression stage of cracks in mortar specimens is obvious, and there are many AE events in the whole loading process, which indicates that the micro-defects in mortar specimens are well developed and easily compressed and destroyed.
The maximum values of both the AE count and AE energy produced in mortar specimens under uniaxial compression increased in this order: Mortar with sandwich iron, mortar with sandwich pine, and pure mortar, which was the same as the order of the UCS of mortar specimens. This shows that the failure of a specimen with a high-stiffness sandwich material is more intense than that of a specimen with a low-stiffness sandwich material.
3.3. Failure Observations
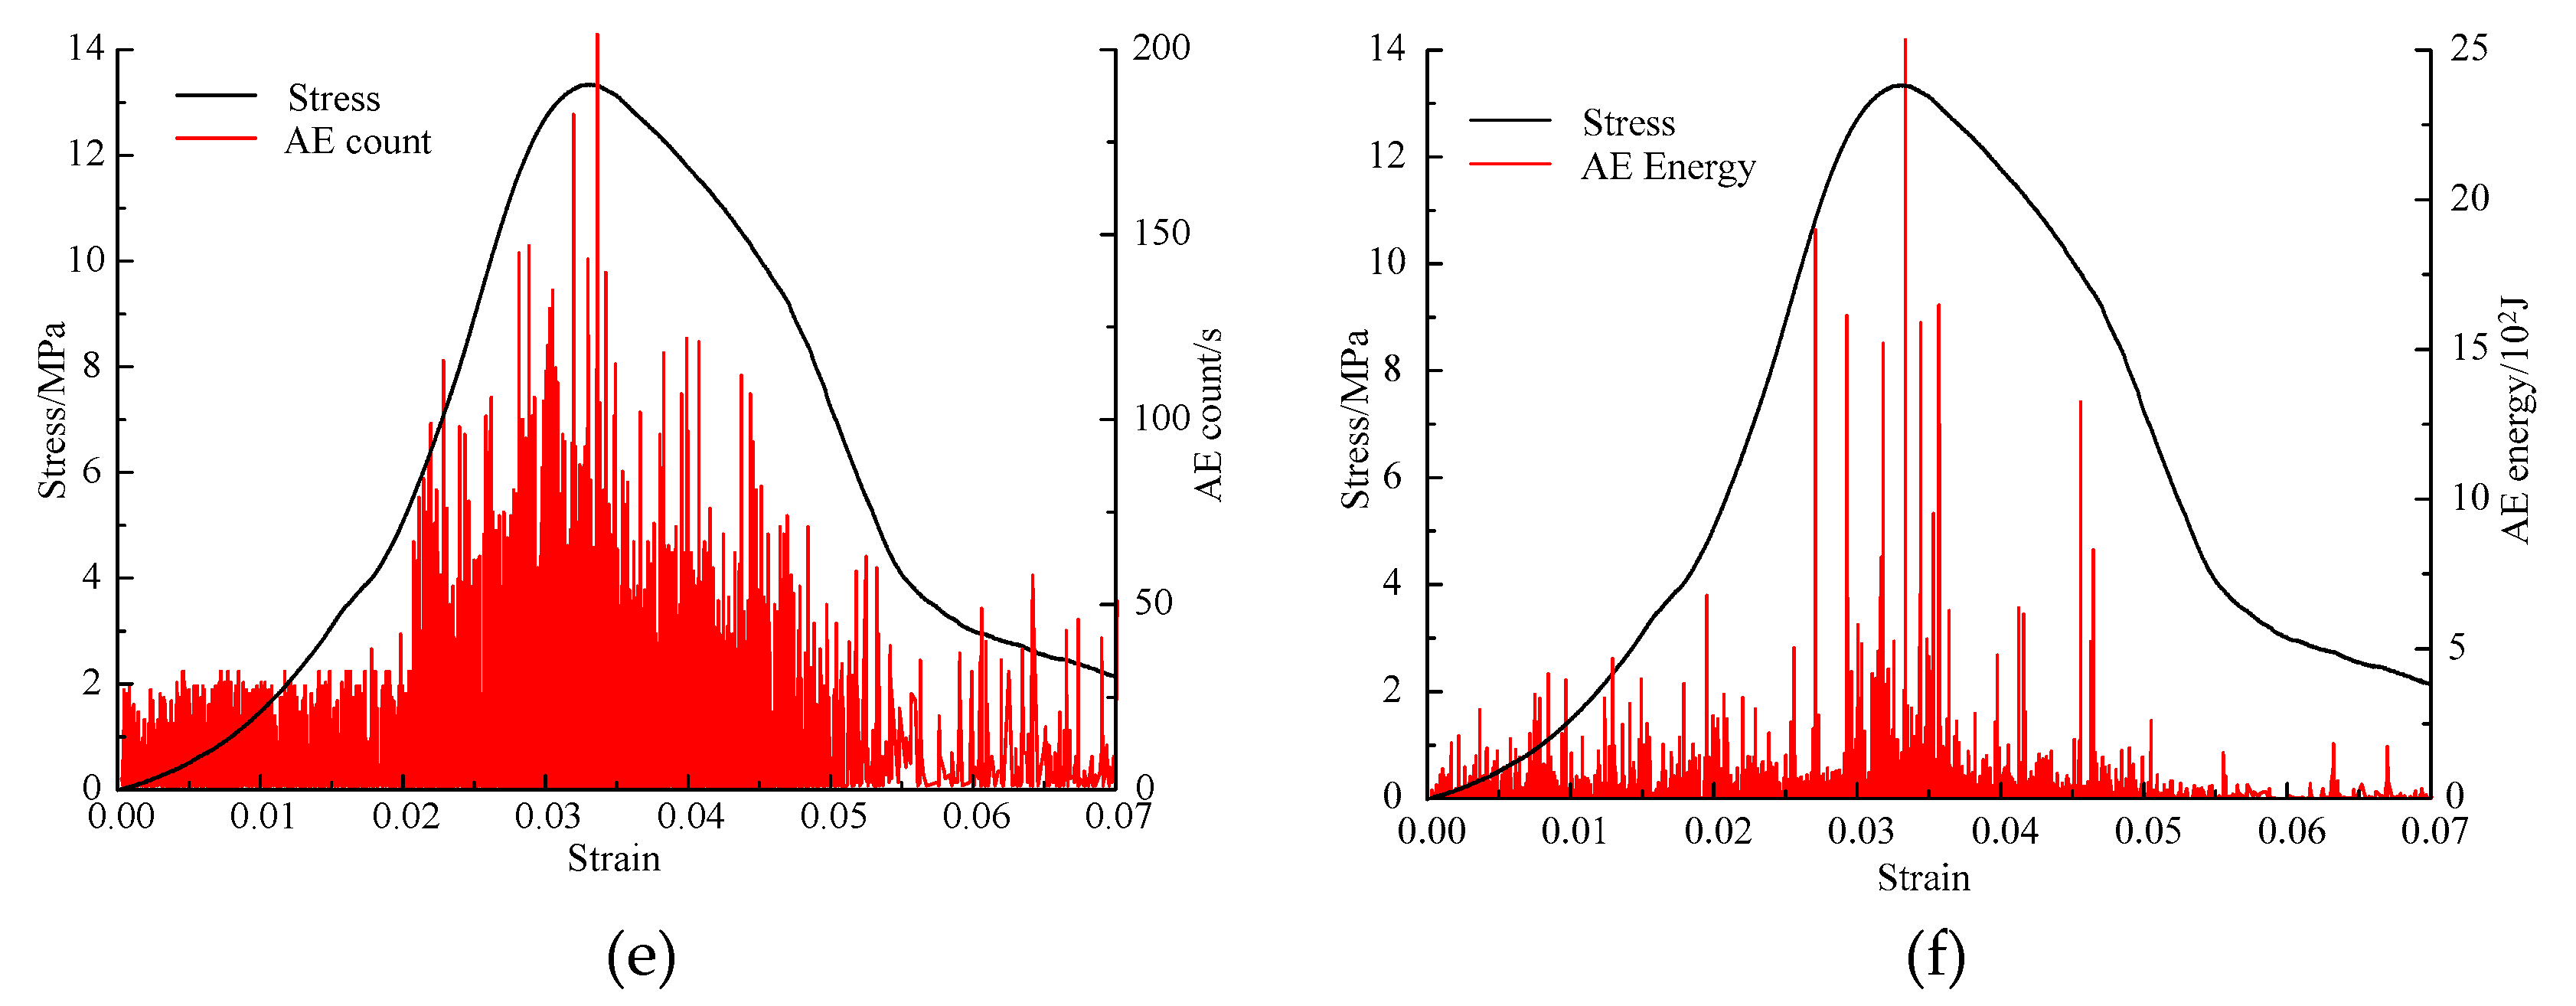
The failure forms of mortar specimens are shown in Figure 5. According to the strength and AE characteristics of mortar specimens, it can be seen that mortar samples with sandwich iron are prone to a splitting failure on all sides of the sandwich when the cement–sand ratio is greater than 1:2, and the energy released is large when such a failure occurs. The sandwich iron and its upper and lower mortar play a major role in resisting the external compressive pressure. Shear failure and splitting failure both occur in mortar samples with sandwich pine, and the failure of mortar beneath the pine center results in a lower strength. The failures of the pure mortar specimens are uniform, which are displayed as a multiple splitting failure. When the cement–sand ratio is 1:2, the cementation of the mortar particles is poor, and the cracks of the specimen with sandwich materials converge to the center of the specimen.
Sandwich materials with a high stiffness can effectively improve the load-bearing capacity of the middle part of the mortar specimen, whereas sandwich materials with a low stiffness can easily lead to instability in the lower part of the mortar specimen. When the sandwich material is the same, a splitting failure of the specimen with a large cement–sand ratio occurs on both sides. Macroscopic cracks in specimens with a small cement–sand ratio tend to converge in the middle of the specimens, i.e., at the sandwich position, which results in a lower compressive strength of the specimens.
3.4. Failure Prediction Based on AE Energy
In a study of seismicity, Gutenberg and Richter [35] discovered a relationship between the magnitude of the earthquake and the number of earthquakes in a given region. The Gutenberg–Richter formula is as follows.
where a and b are constants related to the characteristics of seismicity; more specifically, b is related to the scale of crack propagation. Furthermore, M is the magnitude of the earthquake, and N is the number of earthquakes whose magnitudes are greater than M.
The AE phenomenon in the deformation process of mortar materials is mathematically similar to the earthquake phenomenon [33,36,37]. With this being the case, the b value was used to describe the linear relationship between the energy level ME and the logarithm of the number of the AE energy level NE. First, the AE energy and AE time were divided into equal parts. Next, the number of energy levels NE in each time period was counted, and the logarithm of NE was taken. The b value was obtained by linear fitting the logarithms of NE and ME [38].
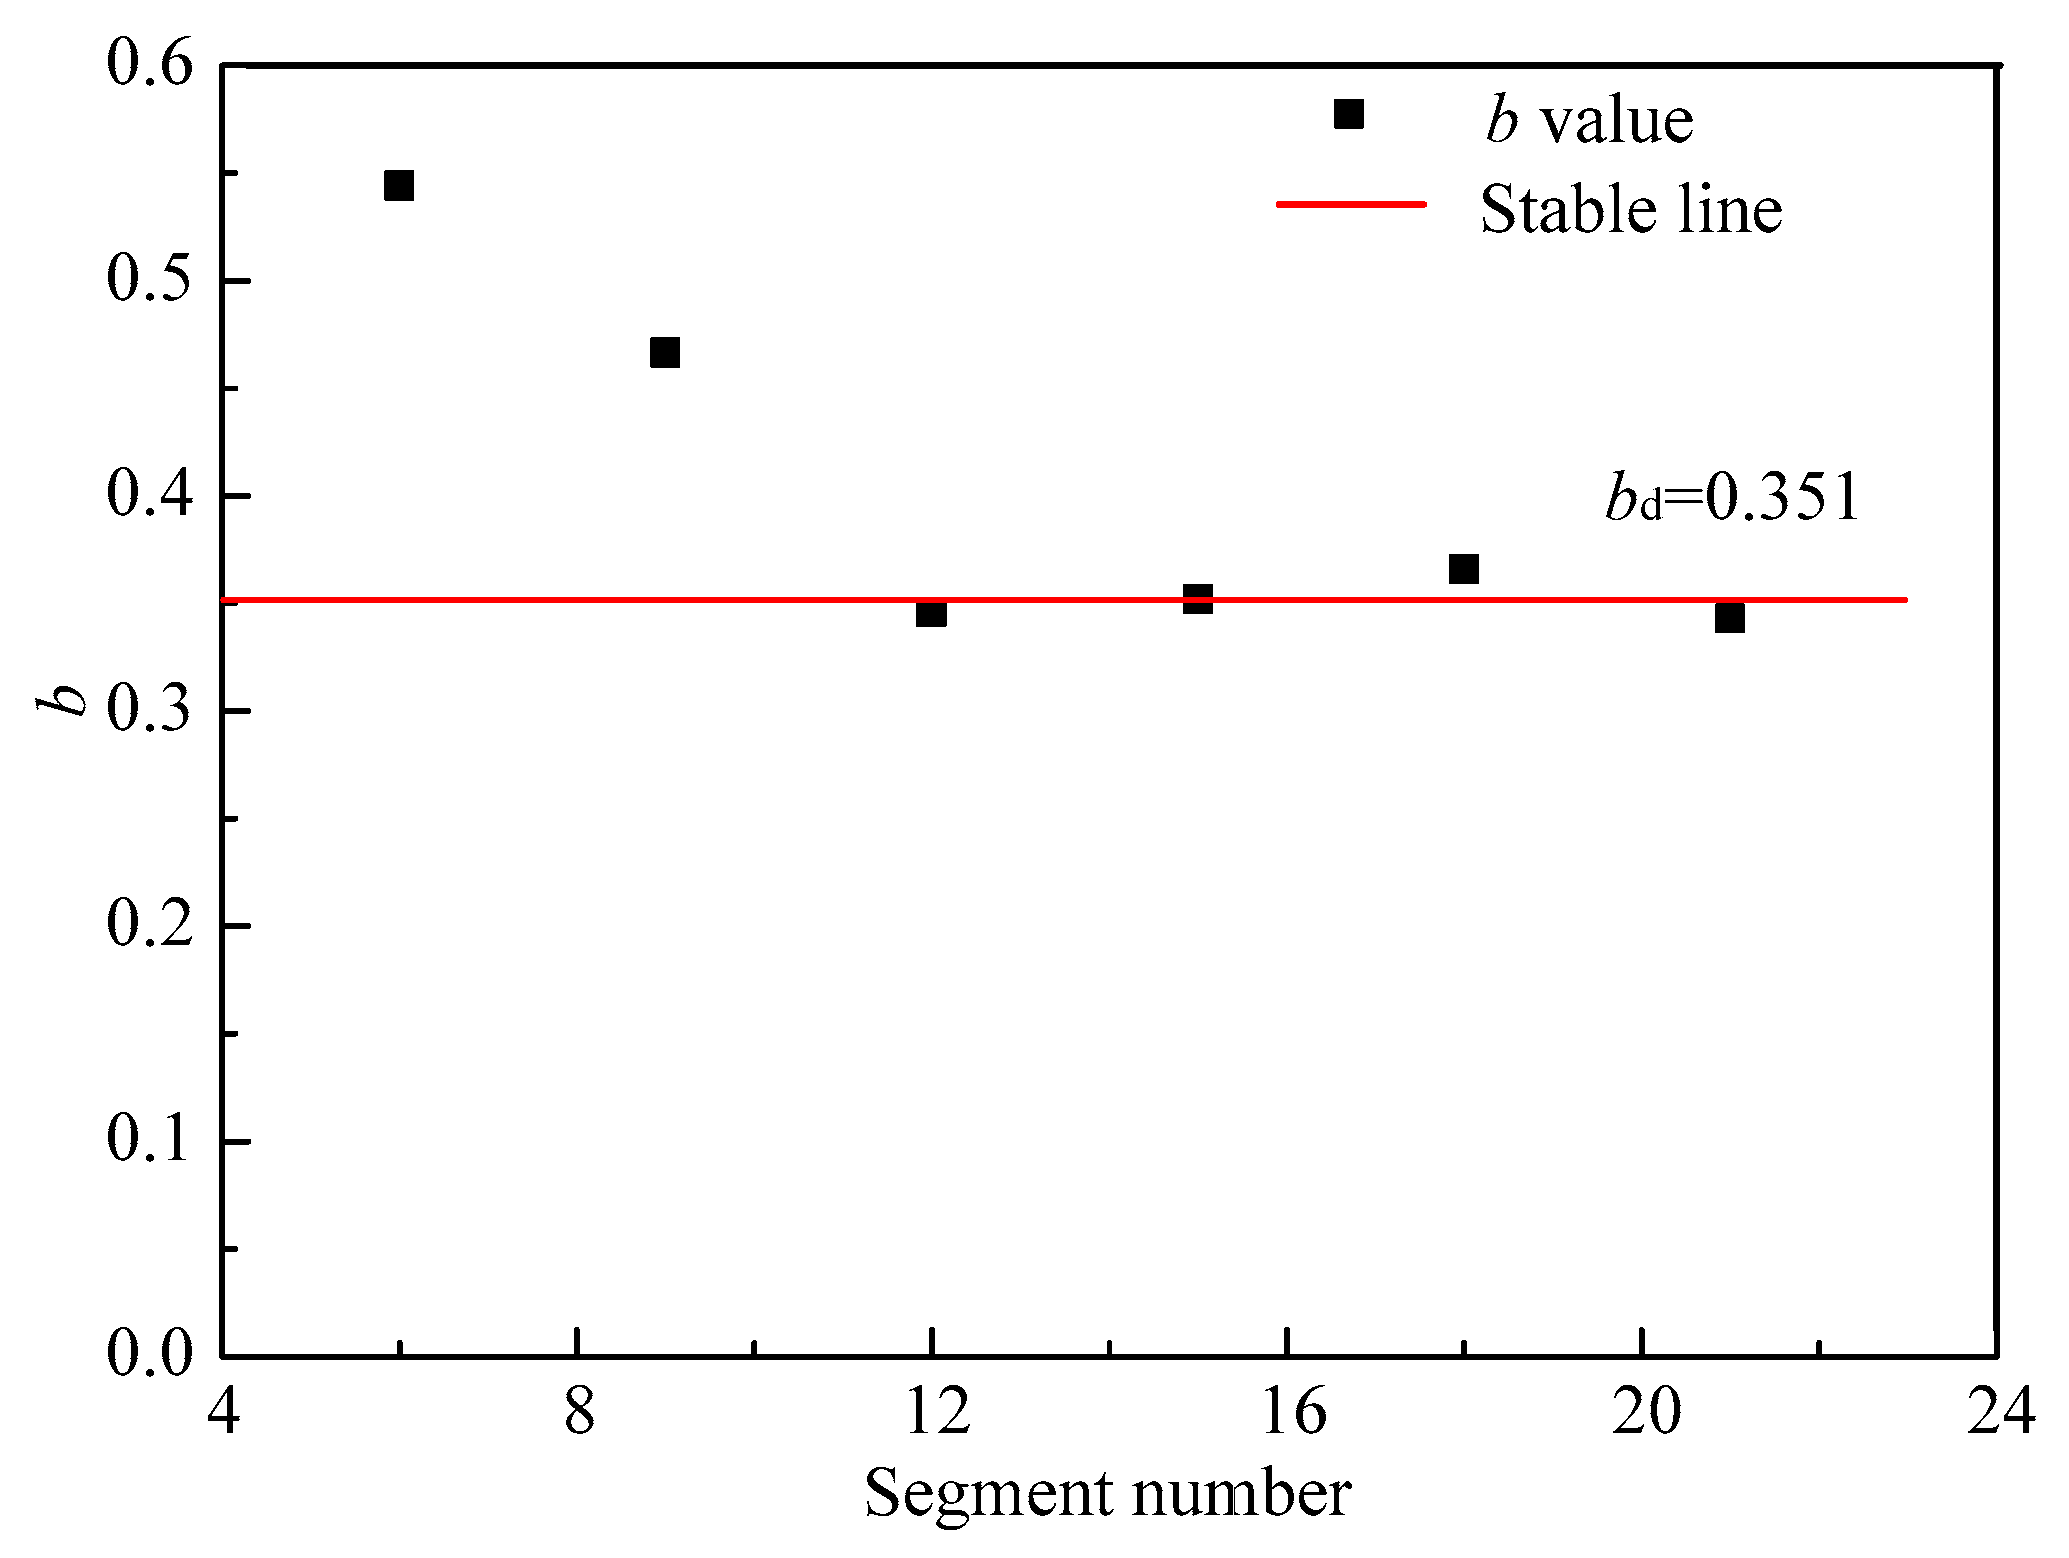
The maximum energy and loading time of the mortar with sandwich iron and cement–sand ratio 1:1.5 was 2796 J and 380 s, respectively, as shown in Figure 6. Taking 12 levels as an example, 1–233 J for the first (ME = 1), 234–466 J for the second (ME = 2), …, 2564–2796 J for the 12th level (ME = 12); 0–32 s for the first, 33–64 s for the second, …, 353–280 s for the 12th level. The statistical results are shown in Table 2.
According to statistical results and Equation (1), 12 (b, strain) points, namely (ε1, b1), (ε2, b2), ..., (ε12, b12), were obtained, as shown in Figure 6. The b value first decreased and then increased with an increase in the strain. The turning point of b value appeared before the peak point of the stress–strain curve. At this time, cracks inside the specimen expanded sharply, and high-energy AE events increased. Consequently, the mortar sample was destroyed quickly. Therefore, the ‘rebound’ phenomenon can be used as an indication that the specimen will be destroyed.
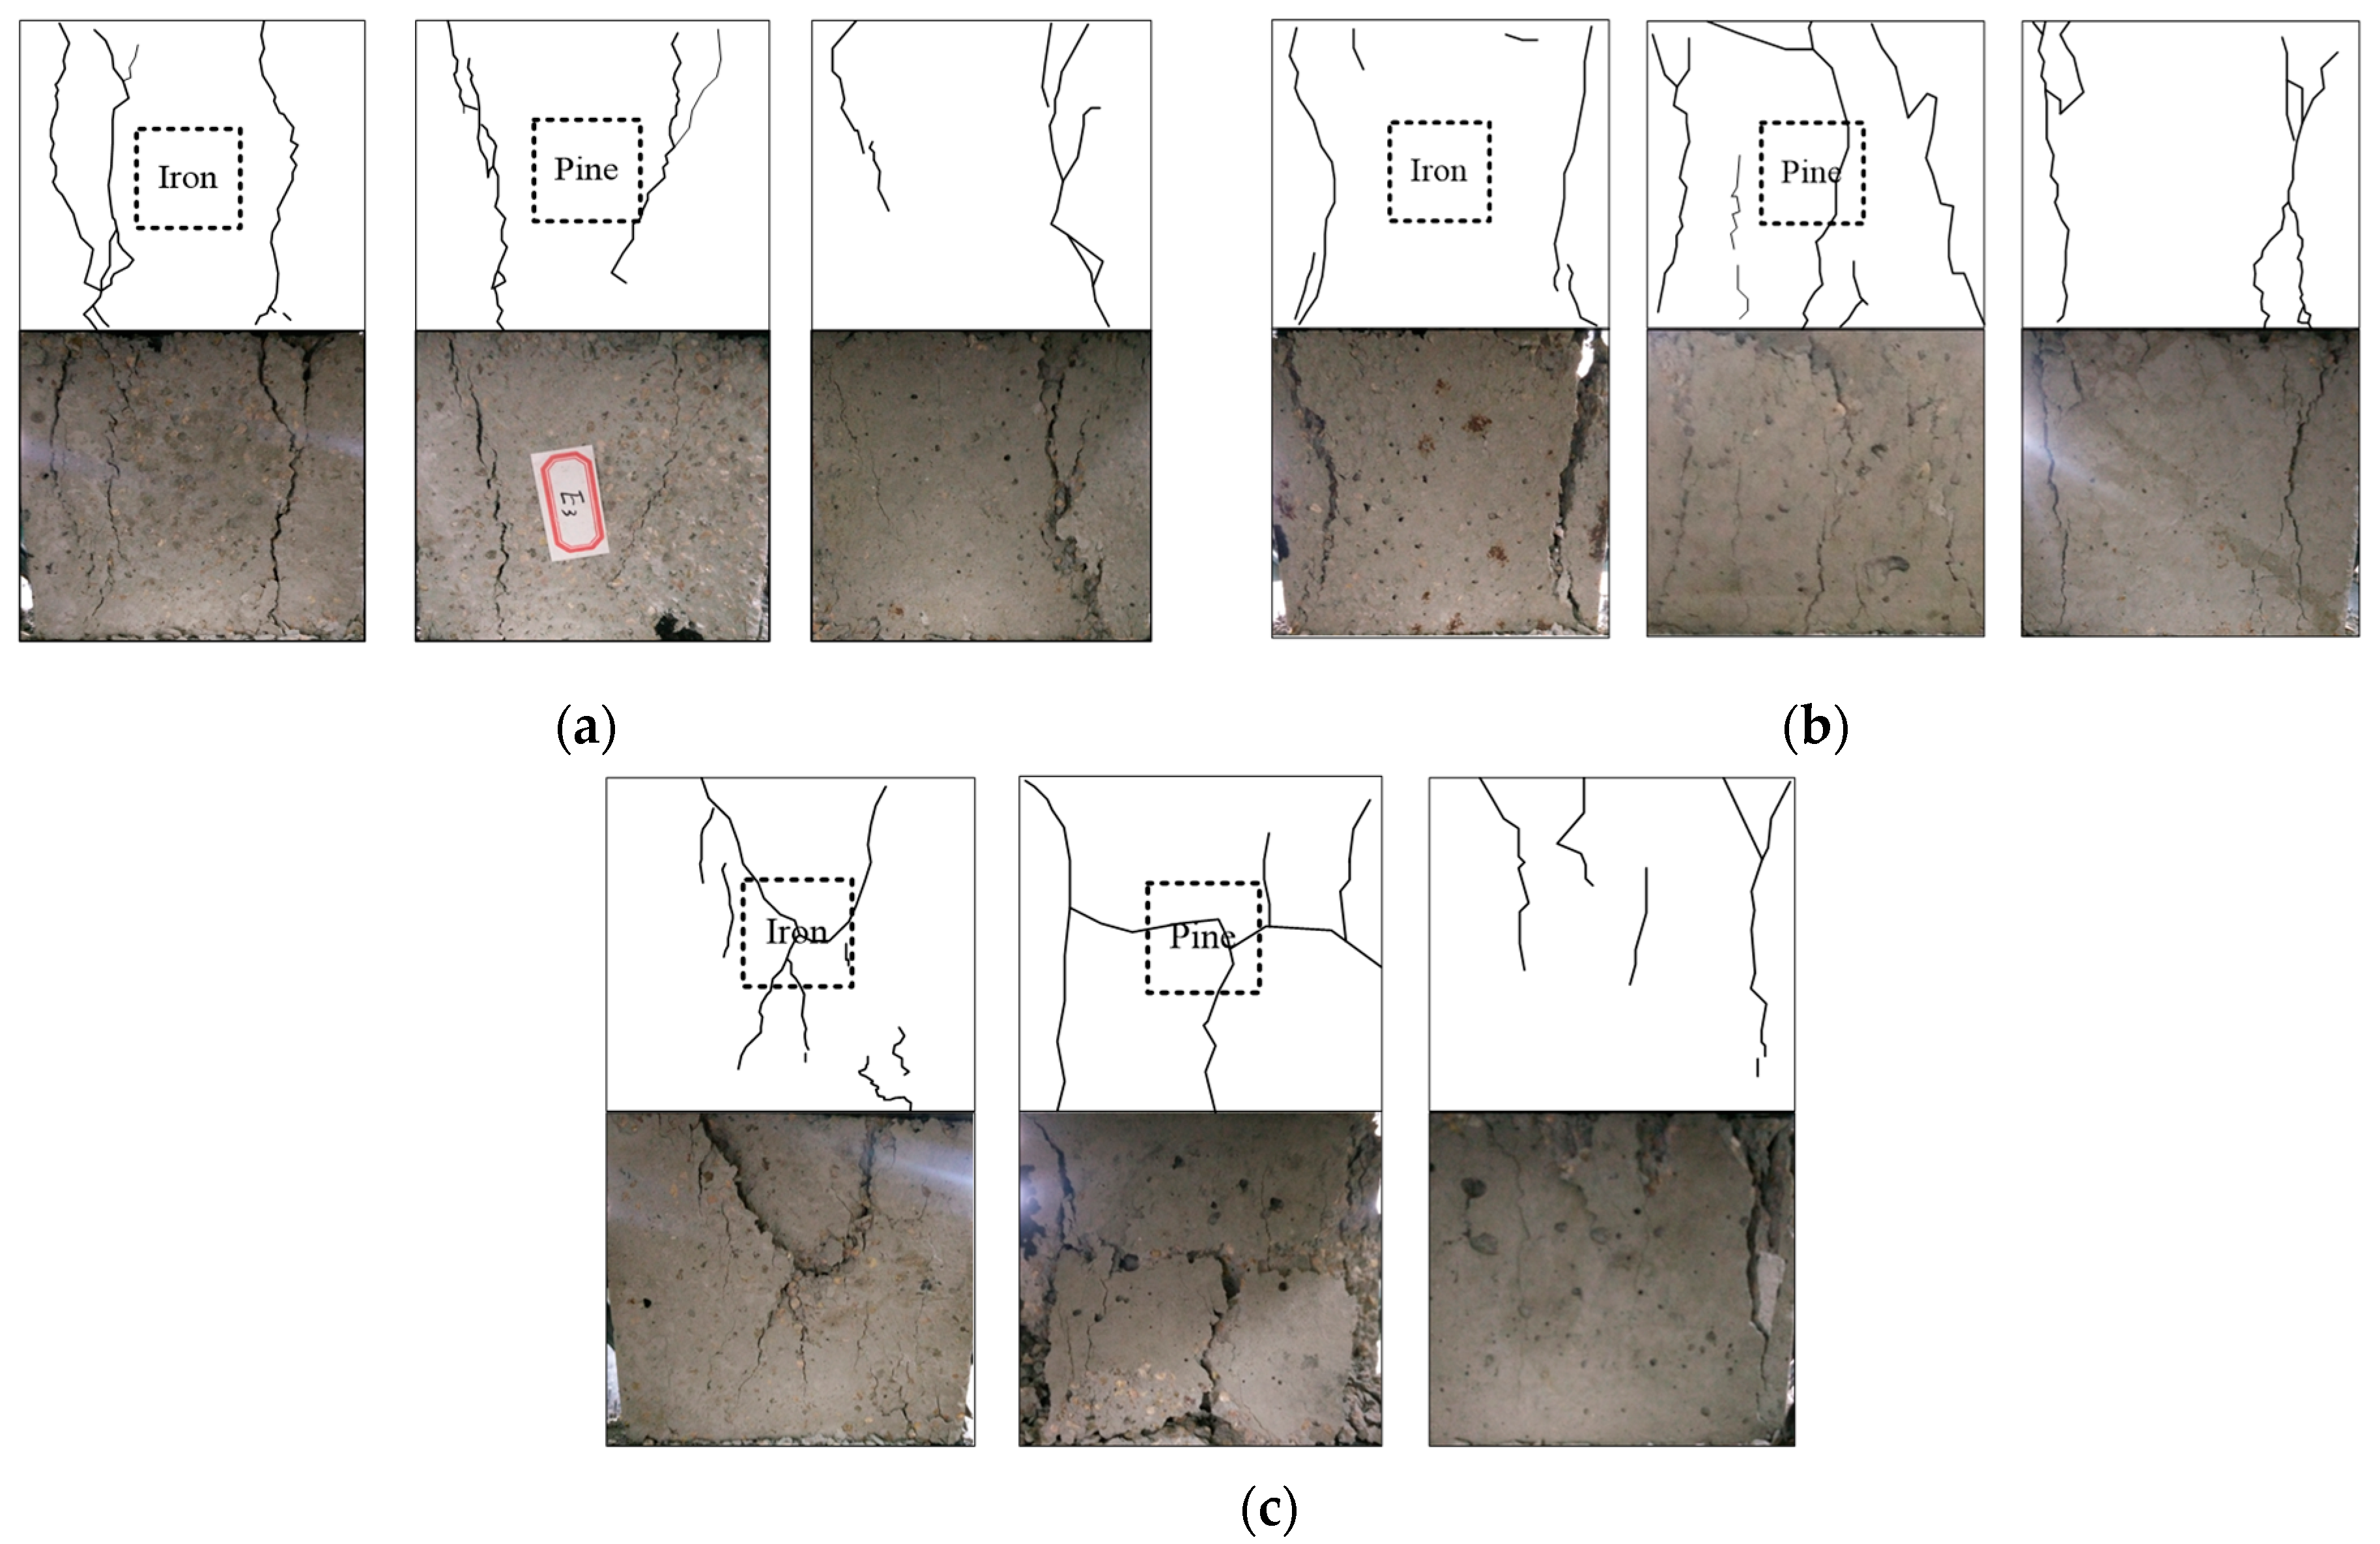
Theoretically, more time series distribution helps to improve the accuracy of the b value at the turning point. However, too much time series distribution results in a limited number of AE events in each time interval, thereby increasing the error in the b value. In this study, the time series was divided into 6, 9, 12, 15, 18, and 21 sections with b values at the turning points of 0.549, 0.453, 0.346, 0.352, 0.366, and 0.343, respectively, as shown in Figure 6. The b values at the turning point were ultimately balanced at 0.351, which was called the intrinsic b value, bd, of the specimen, as shown in Figure 7. Therefore, it can be concluded that the specimen with a sandwich iron will be destroyed when the b value exceeds 0.351.
3.5. Validation of the Prediction Method
Following the same method used in Section 3.4., intrinsic b values of other mortar samples were obtained, as shown in Table 1. The bd of a mortar sample increases with an increase in the cement–sand ratio or the UCS. Therefore, for the same cement–sand ratio, the bd of the mortar sample with sandwich iron is the highest, and the bd of the mortar sample with sandwich pine is the lowest. This shows that the failure of mortar samples with a sandwich structure is directly proportional to the stiffness of the sandwich material. This conclusion is helpful to guide us in choosing suitable filling materials according to the mechanical properties of the rock block in goafs to improve the stability of the cemented complex.
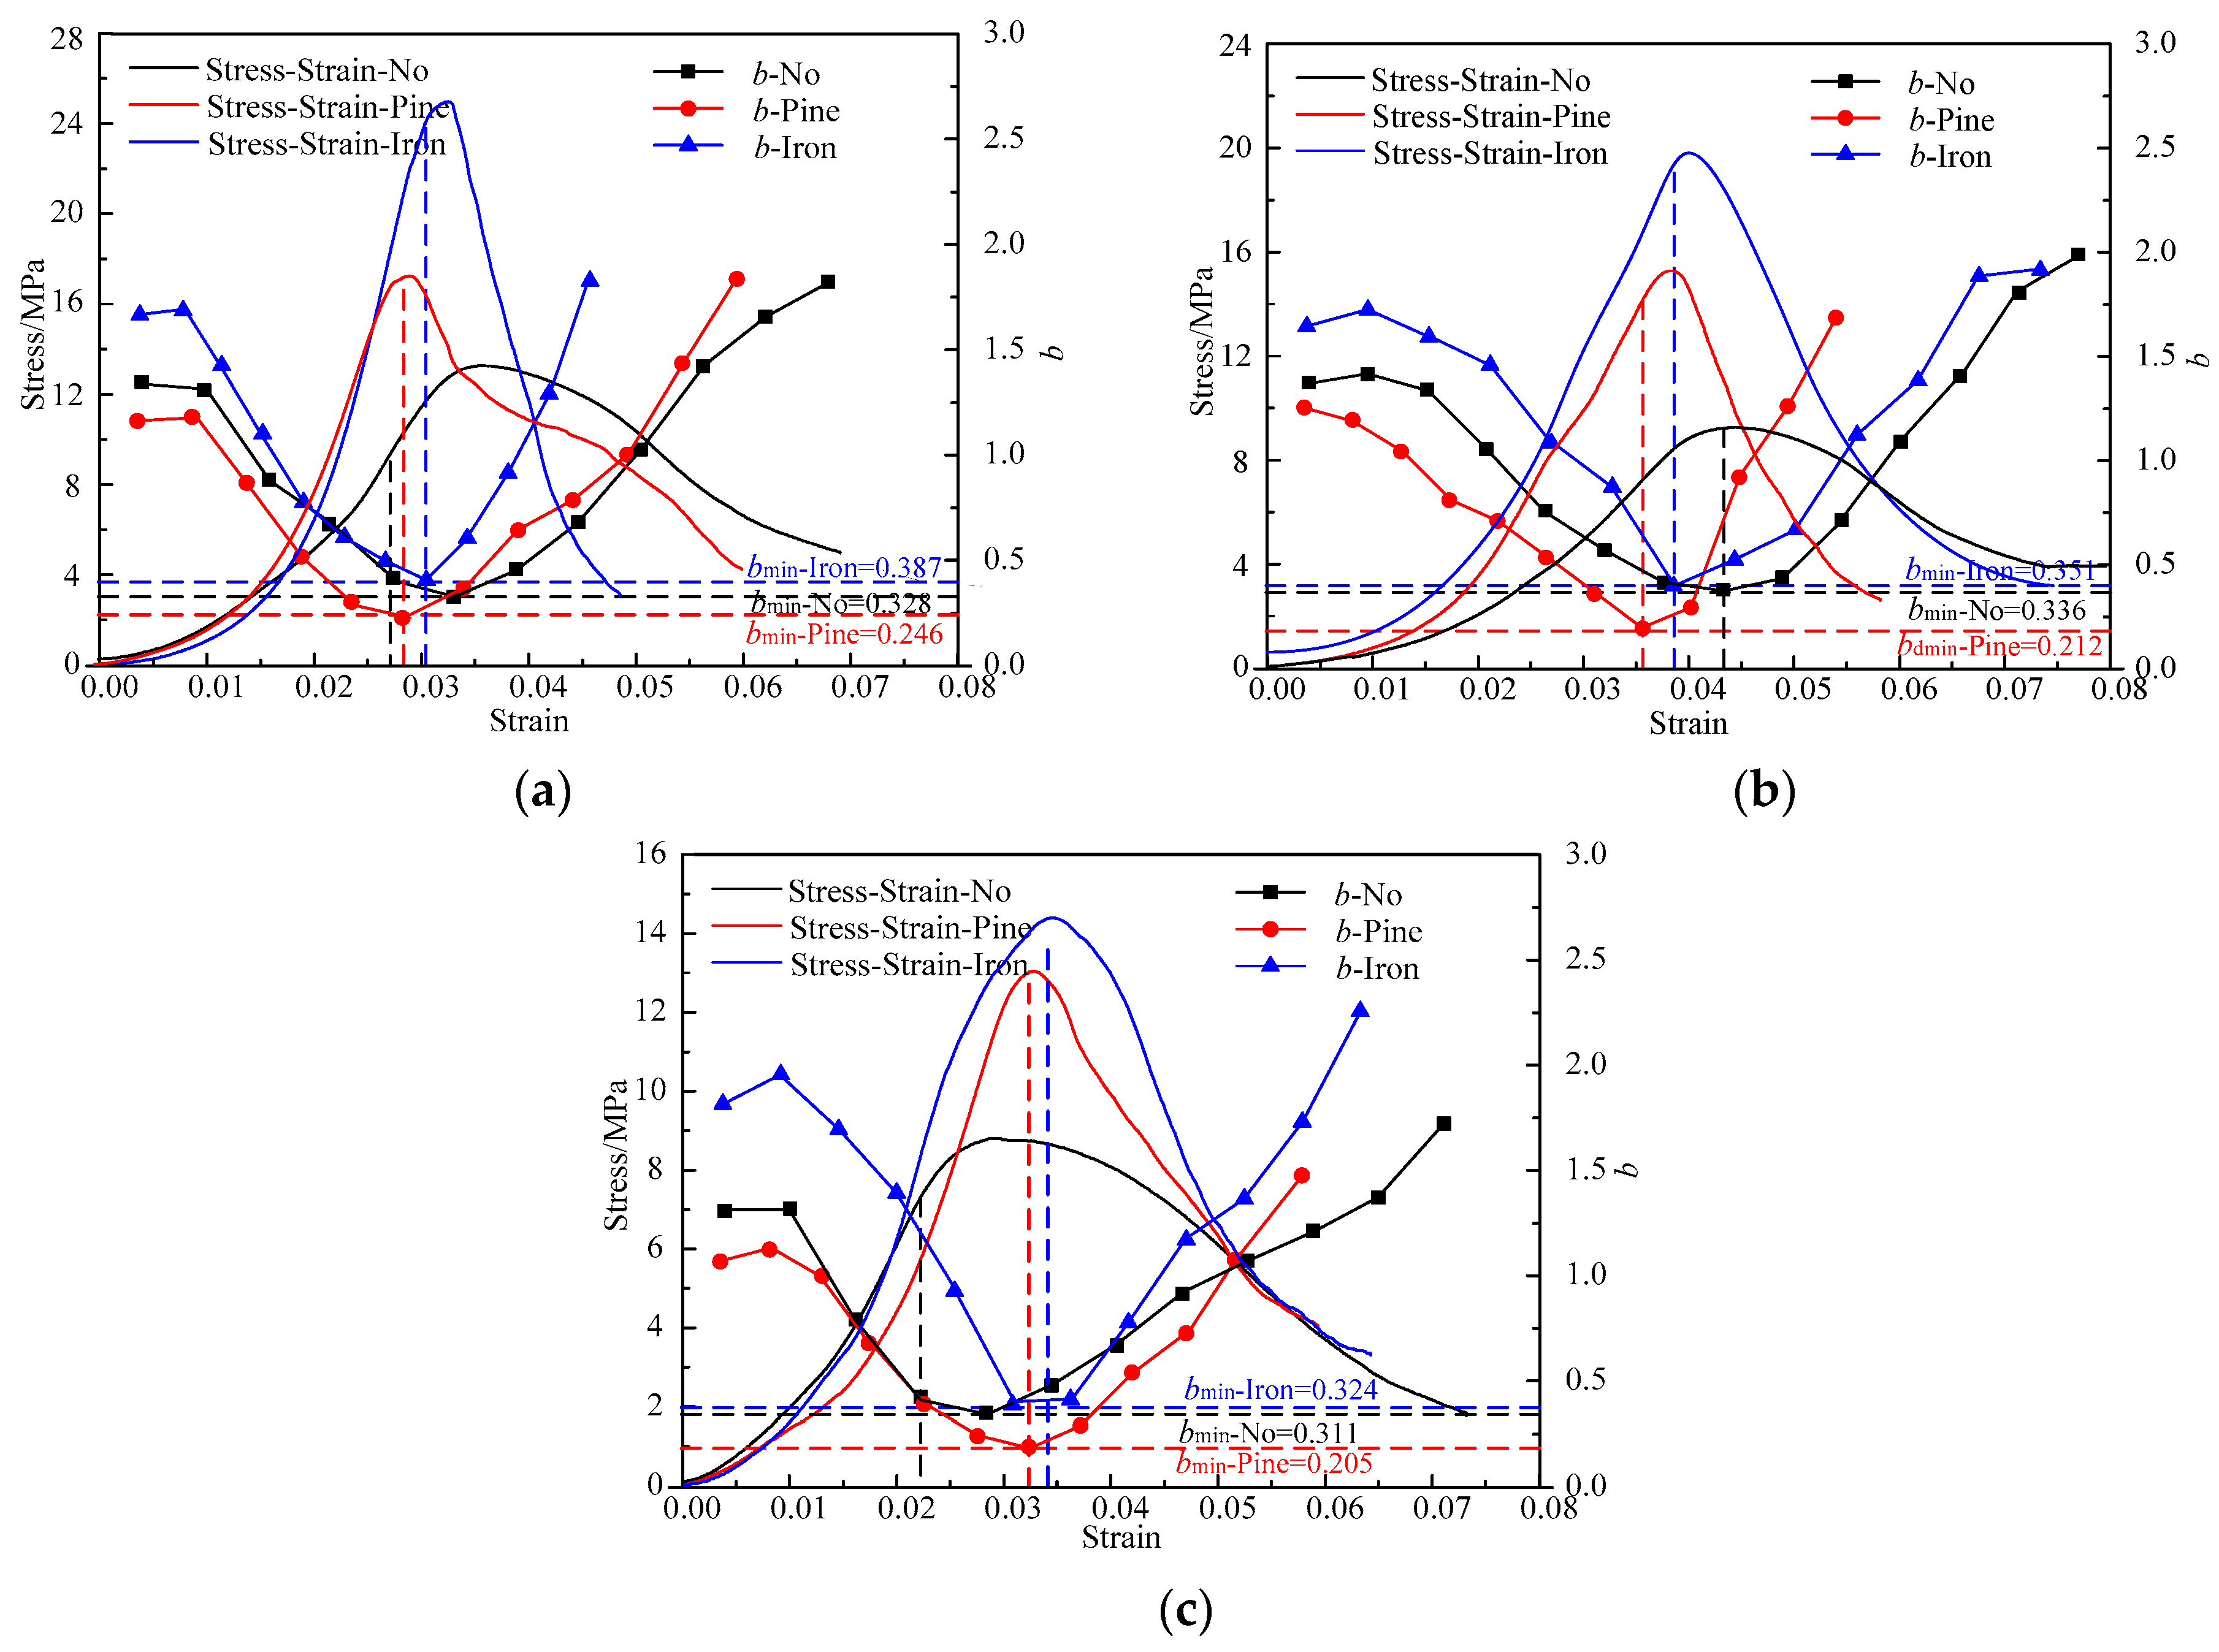
To verify the reliability of the proposed method, simultaneous uniaxial compression and AE tests were carried out on specimens with sandwich iron, specimens with sandwich pine, and pure mortar specimens with cement–sand ratios of 1:2, 1:1.5, and 1:1, which were made in batches with the specimens mentioned in Section 2.2. The experimental steps were also the same as those in the experiment mentioned in Section 2.2. According to the analysis in the previous section, we also divided the AE time into 12 divisions. The evolution of b just before it reaches bd is shown in Figure 8. It can be seen that b decreases gradually with the loading process. The strain-b curves change from decline to rise at the nearest bd, and the ‘rebound’ phenomenon occurs before the peak point of strain–stress curves. Therefore, we can conclude that when the b value reaches or approaches bd, the specimen will be destroyed. What’s more, the initial b value of the mortar with sandwich iron is the largest, and that of the mortar with sandwich pine is the smallest. This indicates that the sandwich stiffness is inversely proportional to the number of high-energy AE events in the initial stage.
4. Conclusions
The UCS and E of a mortar specimen increase with an increase in the cement–sand ratio. The UCS and E of mortar samples with the same ratio increase in the following order: Mortar with sandwich iron, mortar with sandwich pine, and pure mortar. A high-stiffness sandwich material can improve the deformation capacity of mortar specimens.
The evolution laws of the AE count and AE energy during mortar deformation are consistent. The maximum AE count and energy produced by the mortar damage increase in the following order: Mortar with sandwich iron, pure mortar, and mortar with sandwich pine. This shows that the failure of a specimen with a sandwich structure is more intense than that of a pure mortar specimen, even though the strength of the pure mortar is higher than that of mortar with sandwich pine. The failure of a specimen with a high-stiffness sandwich material is the most intense.
The b value of AE decreases first and then increases before reaching the point at which the specimen is destroyed. This turning point of the b value can be used as a warning against the imminent failure of the specimen. The intrinsic b value, bd, of a mortar sample increases with an increase in the cement–sand ratio and the UCS, and it is directly proportional to the stiffness of the sandwich material. Based on these findings, a method for obtaining the bd of mortar samples was proposed and verified.
The sandwich material with a high stiffness can improve the load-bearing capacity of the specimen, if the cement–sand ratio is not too low. This shows that when selecting mortar material to fill goafs, the material with a low stiffness and a not-too-low cement–sand ratio should be selected in accordance with the mechanical characteristics of the rock block in the goaf.
Author Contributions
All the authors contributed to this paper. X.L. and Q.G. prepared and edited the manuscript. Q.G. and Y.T. provided methodological guidance in the research process. J.N. partially participated in the literature search. Z.J. processed the data in this article. X.L. and J.N. participated in revising the manuscript.
Funding
This research was funded by the National Key R&D Program of China [grant number 2018YFC0604703], the National Natural Science Foundation of China [grant number 51874190, 51574154, and 51804181], the Major Program of Shandong Province Natural Science Foundation [grant number ZR2018ZA0603], the Natural Science Foundation of Shandong Province [grant number ZR201709180101 and ZR2018QEE002], and the Tai’shan Scholar Engineering Construction Fund of Shandong Province of China [grant number ts 201511026].
Acknowledgments
We are grateful to Shandong University of Science and Technology for providing us with the experimental platform and all the reviewers for their specific comments and suggestions.
Conflicts of Interest
The authors declare no conflict of interest.
References
- Li, Y.; Wu, H.X.; Shi, Z. Farmland productivity and its application in spatial zoning of agricultural production: A case study in Zhejiang province, China. Environ. Earth Sci. 2016, 75, 1–17. [Google Scholar] [CrossRef]
- Zhang, J.X.; Li, M.; Taheri, A.; Zhang, W.Q.; Wu, Z.Y.; Song, W.J. Properties and Application of Backfill Materials in Coal Mines in China. Minerals 2019, 9, 53. [Google Scholar] [CrossRef]
- Chu, C.F.; Deng, Y.F.; Zhou, A.N.; Feng, Q.; Ye, H.; Zha, F.S. Backfilling performance of mixtures of dredged river sediment and iron tailing slag stabilized by calcium carbide slag in mine goaf. Constr. Build. Mater. 2018, 189, 849–856. [Google Scholar] [CrossRef]
- Ning, J.G.; Liu, X.S.; Tan, J.; Gu, Q.H.; Tan, Y.L.; Wang, J. Control mechanisms and design for a ’col-backfill-gangue’ support system for coal mine gob-side entry retaining. Int. J. Oil Gas Coal Technol. 2018, 18, 444–465. [Google Scholar] [CrossRef]
- Huang, Y.; Yang, Y.; Li, J.L. Numerical simulation of artificial groundwater recharge for controlling land subsidence. KSCE J. Civ. Eng. 2015, 19, 418–426. [Google Scholar] [CrossRef]
- Wu, J.C.; Shi, X.Q.; Xue, Y.Q.; Zhang, Y.; Wei, Z.X.; Yu, J. The development and control of the land subsidence in the Yangtze Delta, China. Environ. Geol. 2008, 55, 1725–1735. [Google Scholar] [CrossRef]
- Zhang, Y.; Wu, J.C.; Xue, Y.Q.; Wang, Z.C.; Yao, Y.G.; Yan, X.X.; Wang, H.M. Land subsidence and uplift due to long-term groundwater extraction and artificial recharge in Shanghai, China. Hydrogeol. J. 2015, 23, 1851–1866. [Google Scholar] [CrossRef]
- Li, L.; Wu, K.; Zhou, D.W. Evaluation theory and application of foundation stability of new buildings over an old goaf using longwall mining technology. Environ. Earth Sci. 2016, 75, 763. [Google Scholar] [CrossRef]
- Feng, X.J.; Zhang, Q.M. The Effect of Backfilling Materials on the Deformation of Coal and Rock Strata Containing Multiple Goaf: A Numerical Study. Minerals 2018, 8, 244. [Google Scholar] [CrossRef]
- Li, H.J.; Liu, S.Y.; Tong, L.Y. Field investigation of the performance of composite foundations reinforced by DCM-bored piles under lateral loads. Constr. Build. Mater. 2018, 170, 690–697. [Google Scholar] [CrossRef]
- Isobe, K.; Kimura, M.; Ohtsuka, S. Design approach to a method for reinforcing existing caisson foundations using steel pipe sheet piles. Soils Found. 2014, 54, 141–154. [Google Scholar] [CrossRef] [Green Version]
- Bouassida, M.; Carter, J.P. Optimization of Design of Column-Reinforced Foundations. Int. J. Geomech. 2014, 14, 04014031. [Google Scholar] [CrossRef]
- Zhao, Y.; Soltani, A.; Taheri, A.; Karakus, M.; Deng, A. Application of slag-cement and fly ash for strength development of cemented paste backfills. Minerals 2019, 9, 22. [Google Scholar] [CrossRef]
- Zhang, J.; Deng, H.; Taheri, A.; Deng, J.; Ke, B. Effects of superplasticizer on the hydration, consistency, and strength development of cemented paste backfill. Minerals 2018, 8, 381. [Google Scholar] [CrossRef]
- Cao, S.; Yilmaz, E.; Song, W.D. Evaluation of Viscosity, Strength and Microstructural Properties of Cemented Tailings Backfill. Minerals 2018, 8, 352. [Google Scholar] [CrossRef]
- Yin, Y.C.; Zhao, T.B.; Zhang, Y.B.; Tan, Y.L.; Qiu, Y.; Taheri, A.; Jing, Y. An Innovative Method for Placement of Gangue Backfilling Material in Steep Underground Coal Mines. Minerals 2019, 9, 107. [Google Scholar] [CrossRef]
- Wang, Y.Y.; Taheri, A.; Xu, X. Application of Coal Mine Roof Rating (CMRR) in Chinese coal mines. Int. J. Min. Sci. Tech. 2018, 28, 491–497. [Google Scholar] [CrossRef]
- Jiang, G.Z.; Wu, A.X.; Wang, Y.M. Low cost and high efficiency utilization of hemihydrate phosphogypsum: Used as binder to prepare filling material. Constr. Build. Mater. 2018, 167, 263–270. [Google Scholar] [CrossRef]
- Li, M.; Zhang, J.X.; Sun, K.; Zhang, S. Influence of Lateral Loading on Compaction Characteristics of Crushed Waste Rock Used for Backfilling. Minerals 2018, 8, 552. [Google Scholar] [CrossRef]
- Weng, L.; Li, X.; Taheri, A.; Wu, Q.; Xie, X. Fracture evolution around a cavity in brittle rock under uniaxial compression and coupled static-dynamic loads. Rock Mech. Rock Eng. 2018, 51, 531–545. [Google Scholar] [CrossRef]
- Akdag, S.; Karakus, M.; Taheri, A.; Nguyen, G.; He, M. Effects of thermal damage on strain burst mechanism for brittle rocks under true-triaxial loading conditions. Rock Mech. Rock Eng. 2018, 51, 1657–1682. [Google Scholar] [CrossRef]
- Liu, X.S.; Tan, Y.L.; Ning, J.G.; Lv, Y.W.; Gu, Q.H. Mechanical properties and damage constitutive model of coal in coal-rock combined body. Int. J. Rock Mech. Min. 2018, 110, 140–150. [Google Scholar] [CrossRef]
- Wang, X.; Wen, Z.J.; Jiang, Y.J.; Huang, H. Experimental study on mechanical and acoustic emission characteristics of rock-like material under non-uniformly distributed loads. Rock Mech. Rock Eng. 2018, 15, 729–745. [Google Scholar] [CrossRef]
- Gu, Q.H.; Ning, J.G.; Tan, Y.L.; Liu, X.S.; Ma, Q.; Xu, Q. Damage constitutive model of brittle rock considering the compaction of crack. Geomech. Eng. 2018, 15, 1081–1089. [Google Scholar]
- Guo, W.Y.; Zhao, T.B.; Tan, Y.L.; Yu, F.H.; Hu, S.C.; Yang, F.Q. Progressive mitigation method of rock bursts under complicated geological conditions. Int. J. Rock Mech. Min. 2017, 96, 11–22. [Google Scholar] [CrossRef]
- Meng, T.; Qiang, Y.J.; Hu, A.F.; Xu, C.T.; Lin, L. Effect of compound nano-CaCO3, addition on strength development and microstructure of cement-stabilized soil in the marine environment. Constr. Build. Mater. 2017, 151, 775–781. [Google Scholar] [CrossRef]
- Tan, Y.L.; Liu, X.S.; Ning, J.G.; Lu, Y.W. In situ investigations on failure evolution of overlying strata induced by mining multiple coal seams. Geotech. Test. J. 2017, 40, 244–257. [Google Scholar] [CrossRef]
- Li, J.M.; Huang, Y.L.; Chen, Z.W.; Li, M.; Qiao, M.; Kizil, M. Particle-Crushing Characteristics and Acoustic-Emission Patterns of Crushing Gangue Backfilling Material under Cyclic Loading. Minerals 2018, 8, 244. [Google Scholar] [CrossRef]
- Karimi, N.Z.; Minak, G.; Kianfar, P. Analysis of damage mechanisms in drilling of composite materials by acoustic emission. Compos. Struct. 2015, 131, 107–114. [Google Scholar] [CrossRef]
- Wasantha, P.L.P.; Ranjith, P.G.; Shao, S.S. Energy monitoring and analysis during deformation of bedded-sandstone: Use of acoustic emission. Ultrasonics 2014, 54, 217–226. [Google Scholar] [CrossRef] [PubMed]
- Chacon, J.L.F.; Kappatos, V.; Balachandran, W.; Gan, T.H. A novel approach for incipient defect detection in rolling bearings using acoustic emission technique. Appl. Acoust. 2015, 89, 88–100. [Google Scholar] [CrossRef]
- Cai, Y.D.; Liu, D.M.; Mathews, J.P.; Pan, Z.J.; Elsworth, D.; Yao, Y.B.; Li, J.Q.; Guo, X.Q. Permeability evolution in fractured coal-Combining triaxial confinement with X-ray computed tomography, acoustic emission and ultrasonic techniques. Int. J. Coal Geol. 2014, 122, 91–104. [Google Scholar] [CrossRef]
- Abdelrahman, M.; Elbatanouny, M.K.; Ziehl, P.H. Acoustic emission based damage assessment method for prestressed concrete structures: Modified index of damage. Eng. Struct. 2014, 60, 258–264. [Google Scholar] [CrossRef]
- Ministry of Construction of China. Standard for Test Method of Performance on Building Mortar (JGJ/T70-2009); State Standard of the People’s Republic of China; China Building Industry Press: Beijing, China, 2009. [Google Scholar]
- Gutenberg, B.; Richter, C.F.; Benioff, H. Earthquake study in southern California, 1948. Trans. Am. Geophy. Union. 1949, 30, 595–597. [Google Scholar] [CrossRef]
- Lei, X.L.; Ma, S.L. Laboratory acoustic emission study for earthquake generation process. Earth. Sci. 2014, 27, 627–646. [Google Scholar] [CrossRef] [Green Version]
- Suzukia, T.; Ohtsub, M. Damage estimation of concrete canal due to earthquake effects by acoustic emission method. Constr. Build. Mater. 2014, 67, 186–191. [Google Scholar] [CrossRef]
- Sagara, R.V.; Raob, M.V.M.S. An experimental study on loading rate effect on acoustic emission based b-values related to reinforced concrete fracture. Constr. Build. Mater. 2014, 70, 460–472. [Google Scholar] [CrossRef]
Figure 1.
Illustration of cement mortar with a sandwich structure.

Figure 2.
RLJW-2000-type test system.

Figure 3.
Arrangement of acoustic sensors.

Figure 4.
Stress–strain–acoustic emission (AE) curves of mortar specimen Groups A3, B3 and C3. (a,c,e) are stress–strain–AE count curves of mortar specimen Groups A3, B3 and C3, respectively; (b,d,f) are stress–strain–AE energy curves of mortar specimen Groups A3, B3 and C3, respectively.
Figure 4.
Stress–strain–acoustic emission (AE) curves of mortar specimen Groups A3, B3 and C3. (a,c,e) are stress–strain–AE count curves of mortar specimen Groups A3, B3 and C3, respectively; (b,d,f) are stress–strain–AE energy curves of mortar specimen Groups A3, B3 and C3, respectively.


Figure 5.
Illustrations (top) and photos (bottom) of cracks in sandwich specimens. (a) Cement–sand ratio 1:1, (b) cement–sand ratio 1:1.5, and (c) cement–sand ratio 1:2.
Figure 5.
Illustrations (top) and photos (bottom) of cracks in sandwich specimens. (a) Cement–sand ratio 1:1, (b) cement–sand ratio 1:1.5, and (c) cement–sand ratio 1:2.

Figure 6.
Stress–strain–AE energy and stress–strain–b curves of mortar with sandwich iron and cement–sand ratio 1:1.5.
Figure 6.
Stress–strain–AE energy and stress–strain–b curves of mortar with sandwich iron and cement–sand ratio 1:1.5.
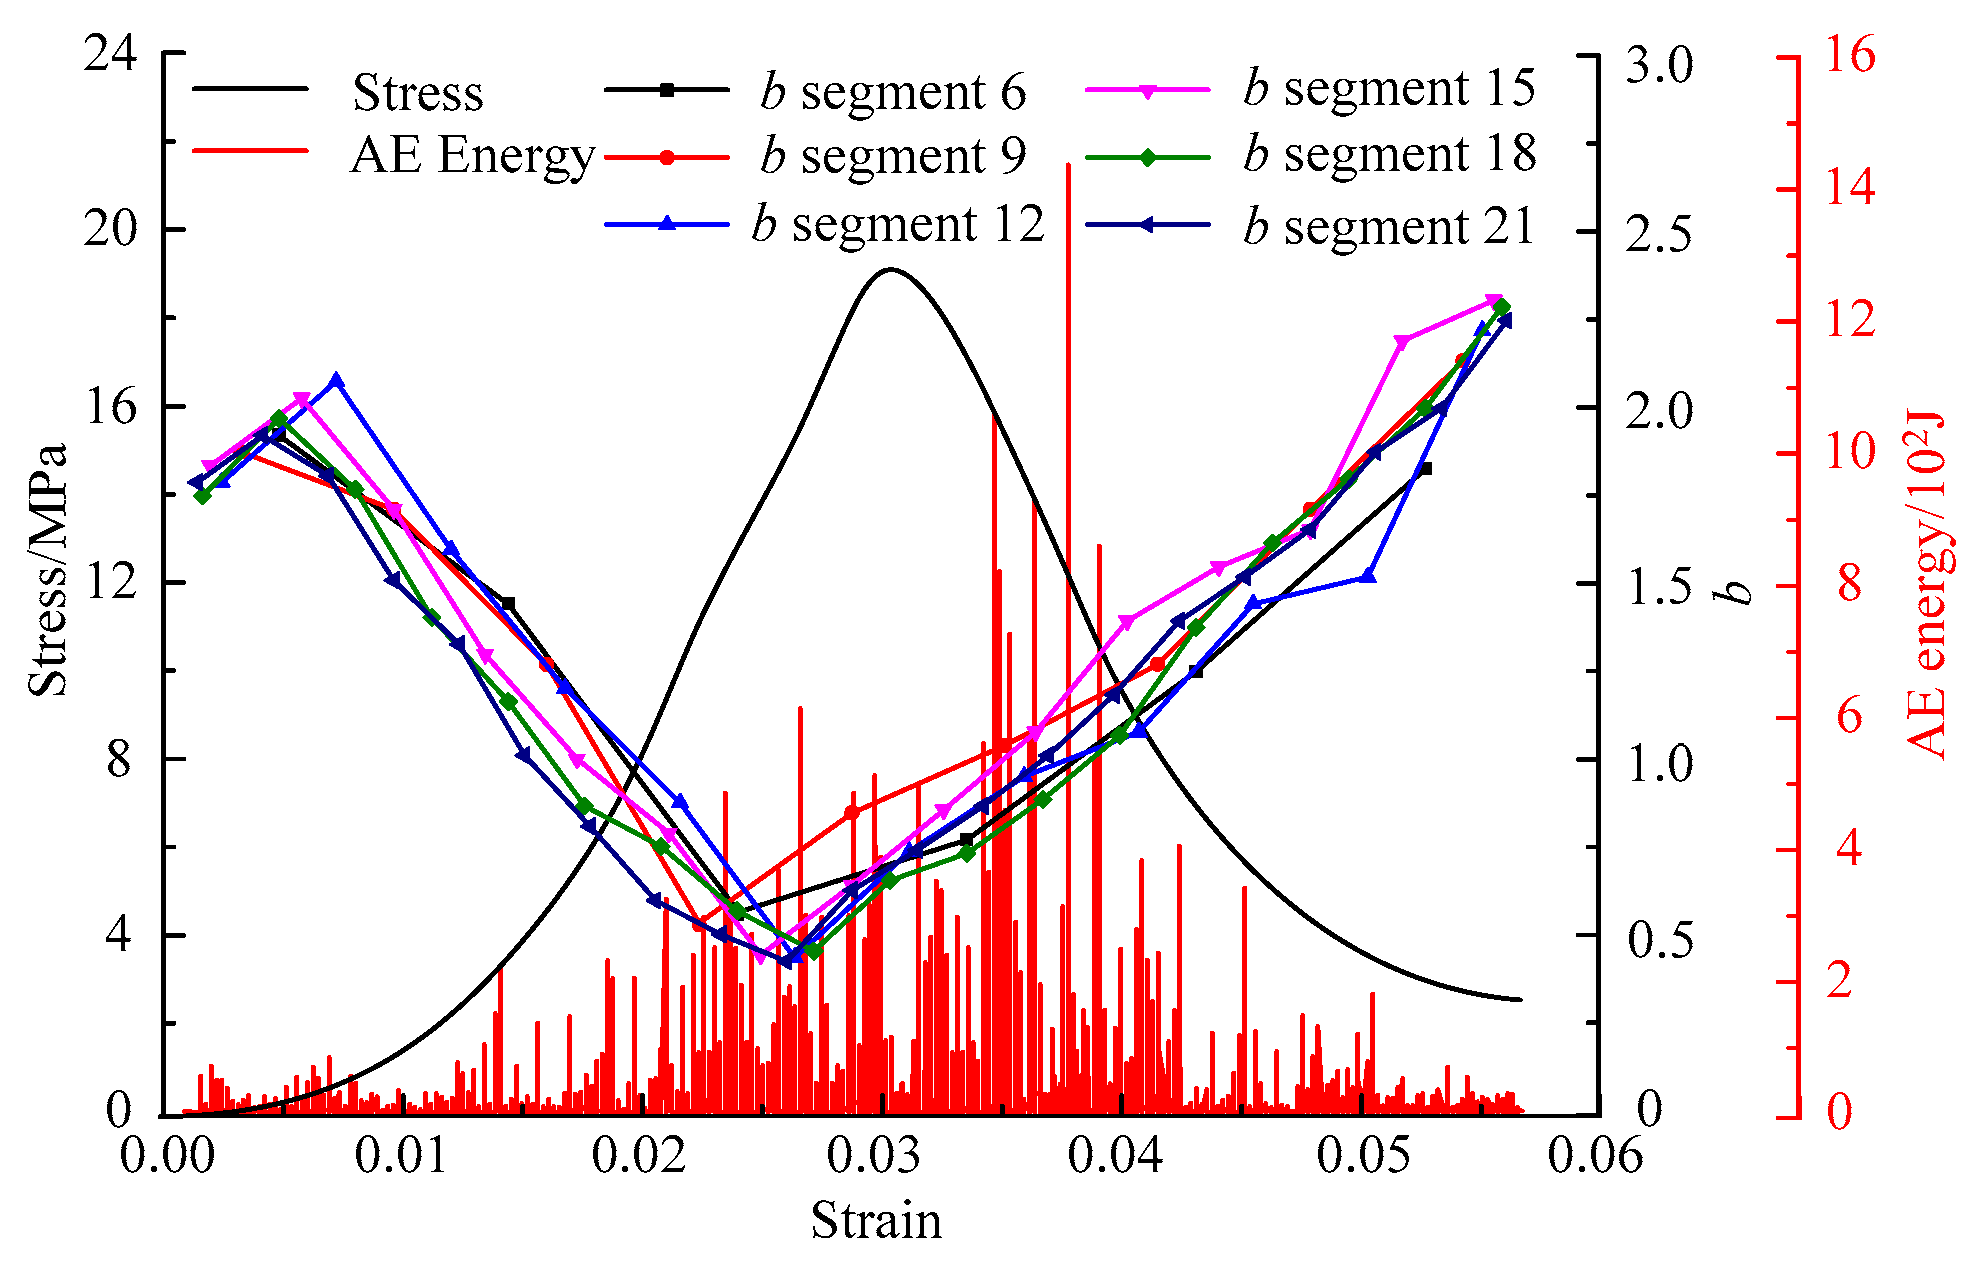
Figure 7.
Determination of the bd value of mortar specimen with sandwich iron.

Figure 8.
Stress–strain–b curves of mortar specimens with different cement–sand ratios: (a) cement–sand ratio 1:1, (b) cement–sand ratio 1:1.5, and (c) cement–sand ratio 1:2.
Figure 8.
Stress–strain–b curves of mortar specimens with different cement–sand ratios: (a) cement–sand ratio 1:1, (b) cement–sand ratio 1:1.5, and (c) cement–sand ratio 1:2.


Table 1.
Strength and deformation characteristics of samples with different materials and cement–sand ratios.
Table 1.
Strength and deformation characteristics of samples with different materials and cement–sand ratios.
| Sandwich Material | Group | Cement–Sand Ratio | E (GPa) | UCS (MPa) | Peak Strain | Intrinsic b Value bd |
|---|---|---|---|---|---|---|
| Iron | A1 | 1:2 | 1.017 | 14.954 | 0.0352 | 0.324 |
| A2 | 1:1.5 | 1.117 | 20.868 | 0.0372 | 0.351 | |
| A3 | 1:1 | 2.142 | 26.222 | 0.0326 | 0.387 | |
| Pine | B1 | 1:2 | 1.047 | 10.036 | 0.0281 | 0.205 |
| B2 | 1:1.5 | 1.071 | 14.382 | 0.0309 | 0.212 | |
| B3 | 1:1 | 1.461 | 16.699 | 0.0278 | 0.246 | |
| Pure mortar | C1 | 1:2 | 0.640 | 8.805 | 0.0259 | 0.311 |
| C2 | 1:1.5 | 0.691 | 11.071 | 0.0336 | 0.336 | |
| C3 | 1:1 | 0.925 | 13.324 | 0.0331 | 0.328 |
Table 2.
Statistical results of NE for each time period.
| Time Period | ME | |||||||||||
|---|---|---|---|---|---|---|---|---|---|---|---|---|
| 1 | 2 | 3 | 4 | 5 | 6 | 7 | 8 | 9 | 10 | 11 | 12 | |
| 1 | 58 | 1 | 0 | 0 | 0 | 0 | 0 | 0 | 0 | 0 | 0 | 0 |
| 2 | 230 | 2 | 0 | 0 | 0 | 0 | 0 | 0 | 0 | 0 | 0 | 0 |
| 3 | 1327 | 4 | 1 | 0 | 0 | 0 | 0 | 0 | 0 | 0 | 0 | 0 |
| 4 | 4133 | 22 | 5 | 1 | 0 | 0 | 1 | 0 | 0 | 0 | 0 | 0 |
| 5 | 5714 | 54 | 13 | 4 | 2 | 0 | 0 | 1 | 0 | 0 | 0 | 0 |
| 6 | 6953 | 37 | 14 | 5 | 0 | 1 | 0 | 0 | 0 | 0 | 0 | 1 |
| 7 | 6347 | 46 | 12 | 1 | 4 | 1 | 0 | 0 | 0 | 0 | 0 | 0 |
| 8 | 5813 | 45 | 12 | 2 | 1 | 0 | 1 | 0 | 0 | 0 | 0 | 0 |
| 9 | 3351 | 27 | 8 | 2 | 0 | 0 | 0 | 0 | 0 | 0 | 0 | 0 |
| 10 | 2684 | 8 | 3 | 0 | 0 | 0 | 0 | 0 | 0 | 0 | 0 | 0 |
| 11 | 906 | 3 | 1 | 0 | 0 | 0 | 0 | 0 | 0 | 0 | 0 | 0 |
| 12 | 164 | 1 | 0 | 0 | 0 | 0 | 0 | 0 | 0 | 0 | 0 | 0 |
© 2019 by the authors. Licensee MDPI, Basel, Switzerland. This article is an open access article distributed under the terms and conditions of the Creative Commons Attribution (CC BY) license (http://creativecommons.org/licenses/by/4.0/).
Share and Cite
MDPI and ACS Style
Liu, X.; Gu, Q.; Tan, Y.; Ning, J.; Jia, Z. Mechanical Characteristics and Failure Prediction of Cement Mortar with a Sandwich Structure. Minerals 2019, 9, 143. https://doi.org/10.3390/min9030143
AMA Style
Liu X, Gu Q, Tan Y, Ning J, Jia Z. Mechanical Characteristics and Failure Prediction of Cement Mortar with a Sandwich Structure. Minerals. 2019; 9(3):143. https://doi.org/10.3390/min9030143
Chicago/Turabian StyleLiu, Xuesheng, Qingheng Gu, Yunliang Tan, Jianguo Ning, and Zhichuang Jia. 2019. "Mechanical Characteristics and Failure Prediction of Cement Mortar with a Sandwich Structure" Minerals 9, no. 3: 143. https://doi.org/10.3390/min9030143
Note that from the first issue of 2016, this journal uses article numbers instead of page numbers. See further details here.