The Effect of Inlet Velocity on the Separation Performance of a Two-Stage Hydrocyclone


College of Mechanical & Electronic Engineering, Shandong University of Science and Technology, Qingdao 266590, China
*
Author to whom correspondence should be addressed.
Minerals 2019, 9(4), 209; https://doi.org/10.3390/min9040209
Submission received: 28 February 2019
/
Revised: 23 March 2019
/
Accepted: 26 March 2019
/
Published: 30 March 2019
(This article belongs to the Special Issue Physical Separation and Enrichment)
Abstract
:The “entrainment of coarse particles in overflow” and the “entrainment of fine particles in underflow” are two inevitable phenomena in the hydrocyclone separation process, which can result in a wide product size distribution that does not meet the requirement of a precise classification. Hence, this study proposed a two-stage (TS) hydrocyclone, and the effects of the inlet velocity on the TS hydrocyclone were investigated using computational fluid dynamics (CFD). More specifically, the influences of the first-stage inlet velocity on the second-stage swirling flow field and the separation performance were studied. In addition, the particle size distribution of the product was analyzed. It was found that the first-stage overflow contained few coarse particles above 40 μm and that the second-stage underflow contained few fine particles. The second-stage underflow was free of particles smaller than 10 μm and almost free of particles smaller than 20 μm. The underflow product contained few fine particles. Moreover, the median particle size of the second-stage overflow product was similar to that of the feed. Inspired by this observation, we propose to recycle the second-stage overflow to the feed for re-classification and to use only the first-stage overflow and the second-stage underflow as products. In this way, fine particle products free of coarse particle entrainment, and coarse particle products free of fine particle entrainment can be obtained, achieving the goal of precise classification.
1. Introduction
A hydrocyclone is an effective device for multiphase separation, utilizing the principle of centrifugal sedimentation. It is widely used in grading, desliming, concentration, clarification, and sorting because of its simple design, convenient operation, high capacity, and high separation efficiency [1,2,3,4,5]. Precise size classification is one of the main means to improve the separation efficiency and sharpness of the beneficiation process. Currently, the hydrocyclone is the main device for particle size classification [6,7,8]. Two products, overflow and underflow, can be obtained via a single separation step in a conventional hydrocyclone. Particles with sizes smaller than the cut size fall into the overflow, and particles with sizes larger than the cut size fall into the underflow. However, the “entrainment of coarse particles in the overflow” and the “entrainment of fine particles in the underflow” are two inevitable phenomena that occur because of the complexity of the hydrocyclone’s internal flow field, and these phenomena can result in a wide product size distribution that does not meet the requirement of precise classification [9,10,11,12]. Connecting multiple hydrocyclones in series is one way to solve the problem of wide product size distribution and obtain a series of products with narrow size distributions. Although this method can produce multiple products with different particle sizes, it requires additional feed pumps and pipelines, which causes problems such as a long process flow, a large equipment investment, and high energy consumption.
Although a hydrocyclone has a simple structure, it has a complicated internal flow field distribution and separation mechanism. It is difficult to design a hydrocyclone structure that can be generally applied to various industrial fields. Hence, it is necessary to develop hydrocyclones with different structures for different separation processes and different applications. For many years, researchers worldwide studied the separation performance of hydrocyclones with different structures. The work of structural improvement of hydrocyclones focused on how to improve the classification efficiency and to achieve multi-functionality [13,14,15,16,17]. Restarick [18,19], Zhang [20], and others designed a two-stage, three-product heavy–medium cyclone that consisted of a primary cylindrical cyclone and a secondary cylindrical/conical cyclone. Three products can be obtained in a single separation step. In the primary cylindrical cyclone, particles were mainly classified by size so that high-ash fine coal can be discharged through the overflow. In the secondary cylindrical/conical cyclone, particles were mainly classified by density, which can effectively separate the clean coal and the gangue. Obeng [21,22] developed a Julius Kruttschnitt (JK) three-product cyclone. In their design, a vortex finder with a smaller inner diameter was inserted coaxially into the conventional vortex finder. This type of hydrocyclone can produce three products in a single separation step: a fine overflow stream, a middling overflow stream, and a coarse underflow stream. This study also investigated the effect of the insertion depth of the second vortex finder on the separation performance of the cyclone. Ahmed [23] designed a three-product, solid–liquid separation hydrocyclone with one overflow and two underflows by adding a tangential output opening in the middle of the conical section on the same side as the feed inlet opening. Krokhina [24], Farghal [25], Golyk [26], and Dueck [27] installed a water-injection system in the conical section of a conventional cylindrical/conical cyclone near the apex so that the material was subjected to a secondary classification process to meet the classification requirements for particles of different sizes. In this way, the fine particle fraction in the underflow can be reduced effectively. The separation efficiency and separation sharpness can both be improved. Although these studies improved the performance of the cyclone to a certain extent, many aspects of the cyclone still need to be explored. Because of the influences of the number of outlets and the cyclone structure, the pressure drop and separation performance of a multi-product cyclone during operation are significantly different from those of a conventional single-stage cyclone. For two-stage series cyclones, especially the underflow-fed series cyclones, the inlet velocity of the first stage has a great influence on the second stage. If the inlet velocity of the first stage is too small, it is difficult to form a sufficiently strong centrifugal force field in the second stage after the energy loss in the first stage. Therefore, it is necessary to study the influence of inlet velocity on the flow field and the separation performance of two-stage series cyclones.
In recent years, with the development of computer technology, computational fluid dynamics (CFD) became an effective technique for fluid research and it is widely used in the study of the flow field and the separation characteristics of cyclones [28,29,30]. Delgadillo and Rajamina [31] designed and simulated six 75-mm hydrocyclones with various cylindrical geometries and cone angles. They studied the variation law of the air core using the Reynolds stress model (RSM) and the large eddy simulation (LES) model coupled with the volume of fluid (VOF) model, and they studied the particle trajectory law with the aid of the discrete phase model (DPM). Compared with the standard hydrocyclone design, their novel designs had smaller cut sizes and better separation efficiencies. Narasimha [32] found that both the RSM and LES models could accurately predict the velocity field in hydrocyclones. Brennan [33] predicted the tangential velocity, axial velocity, and radial pressure profiles in a hydrocyclone and compared the simulation results with the laser Doppler velocimetry (LDV) test results on a 75-mm hydrocyclone. The results showed that the velocity and pressure profiles of the simulation results were consistent with the test results in the upper conical section and the cylindrical section. Slack [34] simulated the turbulence field in a 205-mm hydrocyclone using the RSM and LES models. The obtained axial and tangential velocity profiles were compared with the LDV test data. The RSM turbulence model-generated predictions agreed well with the LDV test data and had lower requirements for computational cost and mesh quality than the LES model. Conversely, the LES model required refined meshes and smaller time steps, making it much more computationally expensive than the RSM model. Therefore, the RSM model is generally preferred for simulations, and its accuracy was successfully proven in recent studies. To study multiphase flow in a hydrocyclone, the VOF model is widely adopted to investigate the air core inside a hydrocyclone. A particle image velocimetry (PIV) test and other flow field tests verified that the VOF model can accurately predict the distribution characteristics of the gas–liquid two-phase flow in the hydrocyclones [35]. Lagrangian particle tracking (LPT) and the two-fluid model (TFM) are widely used to study particle separation. The former traces the motion of a single particle but ignores the influence of inter-particle interactions and the reactions of particles on the fluid [36]. The TFM model, treating both liquid and solid phases as interpenetrating continuous media, incorporates the interaction between particles and between the particles and the fluids. This model is increasingly used to study the effect of concentration on the separation performance of hydrocyclones [37]. In this study, the effects of inlet velocity on the TS hydrocyclone were investigated using CFD. More specifically, the influences of the first-stage inlet velocity on the second-stage swirling flow field and the separation performance were studied.
2. Numerical Methods
2.1. Structure Geometry
An underflow-fed series TS hydrocyclone was designed to study the influence of inlet velocity on flow field and separation performance. The schematic diagram of the TS hydrocyclone is shown in Figure 1, and its specific structural parameters are given in Table 1. When slurry tangentially enters the first stage of the hydrocyclone at a certain speed, the fluid is forced to spiral along the hydrocyclone wall at a high speed, and a centrifugal force field is formed. The centrifugal force that fine particles are subjected to cannot overcome the fluid resistance. Thus, fine particles follow the fluid toward the center of the hydrocyclone and then exit the vortex finder to form a first-stage overflow stream. Coarse particles and some fine particles can overcome the fluid resistance and move outward to the sidewalls, before continuing to spiral downward under the influence of the subsequent fluid flow until they exit the tangential opening of the first stage and enter the second stage for secondary separation. Fluid that enters the second stage of the hydrocyclone is still able to form a centrifugal force field under the residual pressure. When particles enter the second stage, coarse particles are quickly separated and discharged from the underflow to form a second-stage underflow stream. The remaining fine particles are discharged from the vortex finder to form a second-stage overflow. Three grades of products can be obtained by a single TS hydrocyclone separation operation.
2.2. Model Description
(1) RSM Model
The RSM model was used, and its transport equation is as follows:
where is the turbulent energy diffusion, is the molecular viscous diffusion, is the shear stress generation, is the buoyancy generation, is the pressure strain, is the viscous discrete term, and is the system rotation generation. The equations for each are as follows:
In this paper, the internal flow field of the hydrocyclone was numerically simulated using ANSYS Fluent software (ANSYS Inc, Canonsburg, PA, USA), and the turbulent energy diffusion , stress–strain , buoyancy generation , and dissipative tensor used in Fluent are as follows:
In the equations, , , is the slow term, is the fast term, is the wall reflection, and , where is the Mach number.
(2) TFM Model
The mass conservation equation is as follows:
where is the mixed phase density, is the mass transfer, and is the average velocity of the mixed phase.
The average velocity of the mixed phase is as follows:
where is the volume fraction of the kth phase, and is the velocity of the kth phase.
The momentum conservation equation is as follows:
where is the total number of phases, is the viscosity of the mixed phase, is the pressure, is the density of the kth phase, is the volume force, is the relative sliding velocity between the kth phase and the mixed phase, and .
The volume fraction equation for the kth phase is as follows:
2.3. Simulation Conditions
To study the influence of inlet velocity on the flow field and the separation performance of the TS hydrocyclone, a Cartesian coordinate system was constructed, with its origin defined as the center of the second-stage apex. The x-axis points in the feed direction of the first stage of the hydrocyclone. The z-axis points in the vortex finder direction of the second stage of the hydrocyclone. The mathematical model of the hydrocyclone was established and meshed using block-structured hexahedral mesh generation techniques, as shown in Figure 2a; the total number of mesh elements was approximately 353,500. Mesh division is the most important step in the pre-processing of a numerical simulation. The number, quality, and type of mesh have great influence on the accuracy and speed of simulation calculation. Meanwhile, in order to ensure the calculating accuracy and improve the computational efficiency, mesh independence detection was carried out. Tangential velocity is an important performance index of hydrocyclone; thus, the influence of grid on simulation precision was evaluated by the change of tangential velocity, and the results are shown in Figure 2b. When the number of meshes is greater than 300,000, the tangential velocity of the hydrocyclone is basically unchanged with the increase in the number of meshes. The orthogonality of grid lines, the aspect ratio, and the connectivity of grids were auto-checked after the mesh creation.
The RSM and TFM models were employed to simulate the internal flow field and to calculate the particle classification efficiency of the TS hydrocyclone. In all simulations, the “velocity-inlet” boundary condition was applied at the hydrocyclone inlet. The water and solid particles had the same speed, which was in the range of 3–6 m/s. The “pressure-outlet” boundary condition was applied at the outlet. The outlet pressure was set to standard atmospheric pressure. The solid particles used in the TFM model were SiO2 particles with a density of 2650 kg/m3. The particle size distribution is given in Table 2. The total solid volume fraction in the feed was 3.5%. A no-slip boundary condition was applied to the hydrocyclone walls. The SIMPLE algorithm was used for the pressure–velocity coupling. The PRESRO discretization scheme was used for the pressure equations, and the QUICK discretization scheme was used for other control equations. The time-averaged equilibrium of the flow rate of each phase at both the inlet and the outlet was used as the convergence criterion. The simulation time step was set to 1.0 × 10⁻⁴ s.
3. Results and Discussion
3.1. Model Validation
It is critical to firstly validate the mathematical model with accurate test data before it is applied in numerical experiments. In 1998, Hsieh [38] obtained the velocity profile on the cross-section of a Φ75 hydrocyclone using LDV. This test result was used by many researchers to validate their simulation results. Therefore, in this work, we firstly compared the simulation results with Hsieh’s experimental data. As shown in Figure 3, the calculated axial and tangential velocity profiles are in good agreement with the experimental data, which indicates that the selected mathematical model can effectively predict the velocity profiles in the hydrocyclones.
The TFM model was validated based on the experimental work of Delgadillo [3]. The solid content of the feed in Delgadillo’s work was 10.47% by weight. The same particle size distribution of the feed was used in the present study as in Delgadillo’s work. The classification efficiency was characterized by measuring the recoveries of particles with different size classes in the underflow. Figure 3c shows that the measured and simulated partition curves are in good agreement and that the overall trends are similar for the two approaches. Therefore, we conclude that the TFM model used in the present study can accurately predict the separation behavior of the hydrocyclone.
3.2. Flow Pattern
The inlet velocity directly affects the strength of the centrifugal force field in the hydrocyclone and is an important indicator of the hydrocyclone’s performance. If the inlet velocity is too small, a sufficient centrifugal force field that is required for particle separation cannot be formed. If the inlet velocity is too large, the high flow rate shortens the residence time of the particles in the hydrocyclone, which may hinder the complete separation of the particles and unnecessarily increase the energy consumption. Therefore, it is necessary to analyze the influence of the inlet velocity on the separation performance of the hydrocyclone.
3.2.1. Pressure
Figure 4 shows the relationship between the pressure drop and the inlet velocity in the hydrocyclone. As the inlet velocity increases, the pressure drop in the hydrocyclone increases linearly. When the inlet velocity increases from 3 m/s to 6 m/s, the pressure drop of the first stage of the hydrocyclone increases from 27.81 kPa to 116.21 kPa, and the pressure drop of the second stage of the hydrocyclone increases from 26.14 kPa to 111.17 kPa. To ensure the basic separation performance of a hydrocyclone, its pressure drop generally needs to be greater than 50 kPa. For a TS hydrocyclone, sufficient pressure in the first stage of the hydrocyclone must be maintained to ensure the separation performance of the second stage of the hydrocyclone. Therefore, it is necessary to keep the inlet velocity greater than 4 m/s to maintain the performance of the TS hydrocyclone.
The pressure distributions inside the TS hydrocyclone are shown in Figure 5, which shows that the pressure distributions in the first and second stages are essentially the same and are both in accordance with the pressure distributions of the semi-free vortex and the forced vortex. The pressure is axisymmetrically distributed with its highest value at the wall surface, and gradually decreases from the wall toward the axial center with decreasing radius. However, near the center of the hydrocyclone, the first stage is 5.5 mm away from the center (about 0.44 of the diameter of the vortex finder), and the second stage is 2.5 mm away from the center (about 0.33 of the diameter of the vortex finder), the pressure becomes negative, and the pressure at the axial center is also negative. This central negative pressure region is the cause of the air core at the center of the hydrocyclone. Figure 5 also shows that the radial pressure gradient gradually increases as the inlet velocity increases. To further analyze the radial pressure distribution, the radial pressure distributions were simulated at the cros- sections of Z = 300 mm (in the first stage of the hydrocyclone) and Z = 150 mm (in the second stage of the hydrocyclone). The results are shown in Figure 6.
The radial pressure gradient force is the main driving force that governs particle movement in the radial direction.
where is the particle volume, is the radial pressure gradient, and is the radial distance from the center. Figure 6 shows that, as the inlet velocity increases, the absolute value of the negative pressure in the center of the hydrocyclone gradually increases, and the pressure near the walls also gradually increases. This is because the radial pressure in the semi-free vortex is proportional to the square of the tangential velocity at the position. The greater the inlet velocity of the hydrocyclone is, the faster the internal fluid flow velocity will be, and the higher the tangential velocity will be. Therefore, the radial pressure increases with the increase of the inlet velocity. In the forced vortex region, the centrifugal force field becomes stronger as the tangential velocity increases, such that lower negative pressure is generated in the center of the hydrocyclone. With the increase of tangential velocity, the strength of the centrifugal force field increases, and then the radial pressure gradient in the first stage of the hydrocyclone increases gradually with increasing inlet velocity. Equation (17) implies that the larger the radial pressure gradient is, the larger the force applied to the particles in the radial direction is, the easier it is for the particles to settle to the wall surface, and the easier it is for particles of the same size to enter the second stage of the hydrocyclone. The radial pressure gradient distribution law of the second stage of the hydrocyclone is the same as that of the first stage of the hydrocyclone. This is because, when the underflow of the first stage enters the second-stage hydrocyclone, it forms a similar rotational flow field. Meanwhile, as the inlet velocity increases, the velocity of the fluid entering the second stage increases accordingly. Therefore, the pressure distribution rule in the second-stage hydrocyclone is similar to that of the first-stage hydrocyclone. That is, the radial pressure gradient increases gradually with increasing inlet velocity.
3.2.2. Tangential Velocity
For the fluid flow in the hydrocyclone, the tangential velocity directly determines the strength of the centrifugal force field , which is the main driving force for phase separation and is an important factor for evaluating separation performance.
where is the particle density. Equation (18) indicates that the centrifugal force is proportional to the tangential velocity. Analyses of tangential velocity were also performed at the Z = 300 mm cross-section and the Z = 150 mm cross-section, shown in Figure 7. The tangential velocity conforms to the radial symmetric Rankin vortex distribution. From the axial center to the walls, the tangential velocity firstly increases sharply along the radius, which is in accordance with the tangential velocity distribution of the forced vortex with a large velocity gradient. After reaching its maximum value, the tangential velocity begins decreasing with increasing radius and rapidly decreases to zero near the walls, which is in accordance with the tangential velocity distribution of the free vortex.
It can also be found that the inlet velocity has great influence on the tangential velocity. When the inlet velocity increases from 3 m/s to 6 m/s, the maximum tangential velocity of the first stage of the hydrocyclone increases from 4.23 m/s to 8.70 m/s, and the maximum tangential velocity of the second stage of the hydrocyclone increases from 3.49 m/s to 7.07 m/s. This can be attributed to the fact that, as a velocity component, the tangential velocity increases inevitably with the increasing inlet velocity. The maximum tangential velocity in the first stage of the hydrocyclone is approximately 1.43 times the inlet velocity, while the maximum tangential velocity in the second stage of the hydrocyclone is only approximately 0.83 times the first-stage inlet velocity.
Equation (18) shows that the centrifugal force on a particle is proportional to the tangential velocity at the particle’s position. The greater the tangential velocity is, the stronger the centrifugal force field is, and the greater the centrifugal force applied to the particles is. The separation of the particles is mainly affected by the radial centrifugal force. Hence, the larger the tangential velocity is, the easier it is for the particles to overcome the fluid resistance to move toward the walls. In the first stage of the hydrocyclone, the particles are subjected to the strongest centrifugal force. Most of the particles can overcome the centrifugal force and enter the second stage of the hydrocyclone. Only a small subset of the finest particles are contained in the first-stage overflow. After entering the second stage of the hydrocyclone, the particles are separated again. Under the relatively weak centrifugal force, coarse particles directly enter the second-stage underflow, while the remaining middling particles are discharged from the second-stage overflow.
3.2.3. Axial Velocity
The fluid velocity in the hydrocyclone can be divided into axial velocity, tangential velocity, and radial velocity. The radial velocity reflects the motion of the fluid along the radial direction and the tangential velocity reflects the rotation of the fluid, while the axial velocity reflects the motion along the axial direction. The fluid inside the hydrocyclone enters the underflow from top to bottom or enters the overflow from bottom to top. If the structural dimensions of the hydrocyclone are unchanged, the axial velocity will determine the total time from entry to exit of the fluid. In other words, the axial velocity affects the residence time of the fluid and the split ratio, which in turn influences the hydrocyclone’s separation performance.
Axial velocity can also reflect the direction of fluid flow in the hydrocyclone. Figure 8 shows the axial velocity at the Z = 300 mm cross-section and the Z = 150 mm cross-section; it can be found that, in the first stage of the hydrocyclone, the fluid is divided into three regions based on the axial velocities. Near the sidewall, the axial velocity is negative, and the fluid flows downward to the underflow. This region is referred to as the outer vortex region. Near the center of the hydrocyclone, the axial velocity is positive and the fluid flows upward to the overflow. This region is referred to as the inner vortex region. In the central region of the hydrocyclone, the axial velocity is negative. This is because the pressure in the central region is lower than the external atmospheric pressure. Outside air tends to flow into the hydrocyclone since the first-stage vortex finder is open to the atmosphere.
Moreover, as the inlet velocity increases, the axial velocity in the central negative pressure region of the first stage of the hydrocyclone gradually increases, and the negative pressure region gradually extends downward. In the first stage of the hydrocyclone, the axial velocities of the outer vortex and inner vortex both increase as the inlet velocity increases. In the second stage of the hydrocyclone, when the inlet velocity increases, the axial velocity of the outer vortex gradually increases while the axial velocity of the inner vortex remains substantially unchanged. The axial velocity in the central region of the second stage of the hydrocyclone increases significantly with increasing inlet velocity.
3.2.4. Radial Velocity
Compared to the tangential and axial velocities, the radial velocity is relatively small, but its distribution is complex. During the separation process, the radial velocity has a relatively small effect on the centrifugal force field, but it can affect the radial movement of the particles. Figure 9 shows the radial velocity contours at the Z = 300 mm and Z = 150 mm cross-sections of the TS hydrocyclone. The radial velocity gradient increases as the inlet velocity increases, which is beneficial to the radial separation of the particles. The radial velocity in the first stage of the hydrocyclone is distributed with high symmetry. The velocities are all directed from the wall to the axial center. As the radius decreases, the radial velocity first increases gradually, and then decreases rapidly after reaching its maximum value near the axial center, which conforms to the radial velocity distribution of the sink flow. The second stage of the hydrocyclone has the conditions for forming the air core because of the decrease in velocity and the interconnection between the vortex finder and the apex, which results in the radial velocity’s poor symmetry.
3.3. Separation Performance
3.3.1. Classification Efficiency
The classification efficiency is defined as the ratio of particles with a certain size discharged through the underflow to the total particles with that size in the feed, i.e., the separation efficiency for a specific particle grade. The classification efficiency for particles of different sizes was firstly determined. Then, the grade efficiency curves were obtained by plotting the relationship curves between the particle size and the classification efficiency. The classification effect of the hydrocyclone can be directly reflected by the grade efficiency curves. Figure 10 shows the influence of the inlet velocity on the grade efficiency curves of the TS hydrocyclone. The grade efficiency curves all gradually shift to the left as the inlet velocity increases. This is because the first-stage tangential velocity increases and the centrifugal force field strengthens as the inlet velocity increases. Under the influence of the high-intensity centrifugal force field, more particles move toward the sidewall and enter the second stage of the hydrocyclone. The tangential velocity in the second stage of the hydrocyclone also increases with the increasing inlet velocity. The centrifugal force in the second stage of the hydrocyclone also becomes stronger, which causes particle recoveries to increase.
Figure 10 also shows that the classification efficiency of particles smaller than 10 μm is not affected by the inlet velocity within the scope of this study. This is because particles smaller than 10 μm are affected less by the centrifugal force field. It is difficult for these particles to overcome the fluid resistance. Therefore, the separation efficiency of fine particles that smaller than 10 μm does not change significantly with increases in inlet velocity. Further analysis shows that the first-stage hydrocyclone has little separation effect for fine particles, and only 50% of particles smaller than 10 μm can be separated to the underflow. However, it has obvious separation efficiency for coarse particles, and almost all the particles larger than 50 μm can be separated to the underflow. It can be concluded that the main function of the first-stage hydrocyclone is to separate most coarse particles to the second-stage hydrocyclone and guarantee that no coarse particles mixed in the overflow product of the first stage. From Figure 10b, the second-stage hydrocyclone has obvious separation effect for fine particles. Only 2% of particles smaller than 10 μm enter the underflow of the second-stage hydrocyclone. However, it cannot completely recover coarse particles larger than 50 μm. Therefore, the main function of the second-stage hydrocyclone is to separate most fine particles to the overflow and guarantee that no fine particles mixed in the underflow product.
The separation performance of the TS hydrocyclone can be visually evaluated by analyzing the efficiency curves. The cut size d50, the overall separation efficiency, the split ratio, and the possible deviation Ep of the TS hydrocyclone are shown in Figure 11. As the inlet velocity increases from 3 m/s to 6 m/s, the cut size d50 is reduced linearly from 39.5 μm to 30.5 μm, and the overall separation efficiencies of the first- and second-stage overflows are both reduced as the inlet velocity increases. This is because, as the velocity increases, the centrifugal force field becomes stronger and more particles can overcome the fluid resistance and enter the underflow. As shown in Figure 11b, the overall separation efficiency of the particles is reduced by 39.99% for the first-stage overflow and by 18.56% for the second-stage overflow. In contrast, the overall recovery efficiency of the second-stage underflow is increased by 56.54%. The results are consistent with those obtained from the efficiency curve analysis. Figure 11c presents the relationship between the inlet velocity and the liquid flow at each outlet of the TS hydrocyclone. As the inlet velocity increases, the first-stage and second-stage overflows are both reduced slightly, while the second-stage underflow is slightly increased; however, the magnitudes of the changes are all small. This is because, when the inlet velocity increases, the axial velocity of the external swirl of the first-stage cyclone and the second-stage cyclone both increase slightly. Therefore, the inflow into the underflow increases and the overflow flow decreases. However, since the axial velocity is less affected by the inlet velocity, the change is not obvious. Figure 11d reflects the change of the possible deviation Ep of the TS hydrocyclone after the inlet velocity is increased. Within the scope of this study, the larger the inlet velocity is, the smaller the possible deviation Ep is, and the higher the separation sharpness is.
3.3.2. Particle Size
The particle size distribution of the classified product is a direct indicator for evaluating the hydrocyclone’s separation performance. Therefore, the particle size of each product was analyzed, and the results are shown in Figure 12. The particle size of the first-stage overflow product is significantly different from that of the feed. Particles larger than 40 μm in the feed are all discharged to the second stage. The first-stage overflow is substantially free of coarse particles, which indicates an obvious classification effect. After the two-stage hydrocyclone separation, the second-stage underflow is free of particles smaller than 10 μm and almost free of particles smaller than 20 μm. The second-stage underflow contains few fine particles. The second-stage overflow product consists of middling particles, but still includes some fine particles and a small number of coarse particles. The particle sizes in the second-stage overflow product are similar to those in the feed.
As the inlet velocity increases, the particle size of each product becomes smaller gradually. The reason is that the centrifugal force field is strengthened with the increasing tangential velocity of the fluid inside both stage hydrocyclones. As a result, some 20–40-μm particles which stay in the overflow of the first stage originally can overcome resistance and enter the second-stage hydrocyclone. Therefore, the particle size of the overflow product of the first stage becomes smaller due to loss of these particles. Then, these particles enter the second-stage hydrocyclone and discharge into the underflow. Compared to most particles inside the underflow product, these particles can be regarded as fine particles; therefore, the overall particle size of the underflow also becomes smaller.
In addition to the particle size distribution, a representative particle size can also be used to characterize the particle size in each product. One of the commonly used indicators is the median particle size, which is the particle size at the point corresponding to 50% on the cumulative particle size distribution curve of each product. The median particle size of each product is shown in Figure 13. As the inlet velocity increases from 3 m/s to 6 m/s, the median particle size in the first-stage overflow decreases from 11 μm to 6.5 μm, with a reduction of 40.91%. The median particle size in the second-stage overflow decreases from 21.5 μm to 16.5 μm, with a reduction of 23.26%. The median particle size in the second-stage overflow decreases from 44.75 μm to 39.5 μm, with a reduction of 11.73%. Moreover, the median particle size of the second-stage overflow product is close to that of the feed (26 μm). Inspired by this observation, we propose recycling the second-stage overflow to the feed for re-classification and using only the first-stage overflow and the second-stage underflow as products. In this way, products free of particle entrainments can be obtained, and the goal of precise classification can be achieved.
4. Conclusions
In this study, a two-stage series double efficiency hydrocyclone was designed. The effects of inlet velocity on the internal flow field and on the separation characteristics of the TS hydrocyclone were investigated by CFD. The major conclusions are summarized as follows:
(1) The pressure drop of the TS hydrocyclone increases linearly as the inlet velocity increases. When the inlet velocity increases from 3 m/s to 6 m/s, the pressure drop of the first stage of the hydrocyclone increases from 27.81 kPa to 116.21 kPa, and the pressure drop of the second stage of the hydrocyclone increases from 26.14 kPa to 111.17 kPa.
(2) When the inlet velocity increases from 3 m/s to 6 m/s, the maximum tangential velocity of the first stage of the hydrocyclone increases from 4.23 m/s to 8.7 m/s, and the maximum tangential velocity of the second stage of the hydrocyclone increases from 3.49 m/s to 7.07 m/s. The maximum tangential velocity in the first stage of the hydrocyclone is approximately 1.43 times the inlet velocity, while the maximum tangential velocity in the second stage of the hydrocyclone is only approximately 0.83 times the first-stage inlet velocity.
(3) The overall separation efficiencies of the first- and second-stage overflows both decrease as the inlet velocity increases. The overall separation efficiency of the particles is reduced by 39.99% for the first-stage overflow and by 18.56% for the second-stage overflow. In contrast, the overall recovery efficiency of the second-stage underflow increases by 56.54%.
(4) In the scope of this study, the larger the inlet velocity is, the smaller the cut size d50 is, the smaller the possible deviation Ep is, and the higher the separation sharpness of the TS hydrocyclone is.
(5) After the two-stage separation, the first-stage overflow contains few coarse particles above 40 μm and the second-stage underflow contains few fine particles. The second-stage underflow is free of particles smaller than 10 μm and almost free of particles smaller than 20 μm. The underflow product contains few fine particles.
Author Contributions
Conceptualization, P.L.; data curation, Y.Z. and H.W.; formal analysis, Y.Z.; investigation, X.Y.; methodology, L.J.; resources, P.L.; software, L.J.; validation, X.Y.; visualization, H.W.; writing—original draft, L.J.; writing—review and editing, L.J., P.L., and X.Y.
Funding
This work was supported by the National Key R&D Program of China (2018YFC0604702), and the Shandong Provincial Key Research and Development Program, China (2017GSF216004).
Conflicts of Interest
The authors declare no conflicts of interest.
References
- Ghodrat, M.; Qi, Z.; Kuang, S.B.; Ji, L.; Yu, A.B. Computational investigation of the effect of particle density on the multiphase flows and performance of hydrocyclone. Miner. Eng. 2016, 90, 55–69. [Google Scholar] [CrossRef]
- Hwang, K.J.; Hwang, Y.W.; Yoshida, H.; Shigemori, K. Improvement of particle separation efficiency by installing conical top-plate in hydrocyclone. Powder Technol. 2012, 232, 41–48. [Google Scholar] [CrossRef]
- Delgadillo, J.A. Modelling of 75- and 250-mm Hydrocyclones and Exploration of Novel Designs Using Computational Fluid Dynamics. Ph.D. Thesis, Department of Metallurgical Engineering, University of Utah, Salt Lake City, UT, USA, 2006. [Google Scholar]
- Slack, M.D.; Porte, S.D.; Engelman, M.S. Designing automated computational fluid dynamics modelling tools for hydrocyclone design. Miner. Eng. 2004, 17, 705–711. [Google Scholar] [CrossRef]
- Olson, T.J.; Ommen, R.V. Optimizing hydrocyclone design using advanced CFD model. Miner. Eng. 2004, 17, 713–720. [Google Scholar] [CrossRef]
- Motin, A.; Tarabara, V.V.; Petty, C.A.; Bénard, A. Hydrodynamics within flooded hydrocyclones during excursion in the feed rate: Understanding of turndown ratio. Sep. Purif. Technol. 2017, 185, 41–53. [Google Scholar] [CrossRef]
- Ni, L.; Tian, J.Y.; Zhao, J.N. Experimental study of the effect of underflow pipe diameter on separation performance of a novel de-foulant hydrocyclone with continuous underflow and reflux function. Sep. Purif. Technol. 2016, 171, 270–279. [Google Scholar] [CrossRef]
- Wang, J.G.; Bai, Z.S.; Yang, Q.; Fan, Y.; Wang, H.L. Investigation of the simultaneous volumetric 3-component flow field inside a hydrocyclone. Sep. Purif. Technol. 2016, 163, 120–127. [Google Scholar] [CrossRef]
- Ji, L.; Kuang, S.; Qi, Z.; Wang, Y.; Chen, J.; Yu, A.B. Computational analysis and optimization of hydrocyclone size to mitigate adverse effect of particle density. Sep. Purif. Technol. 2017, 174, 251–263. [Google Scholar] [CrossRef]
- Hwang, K.J.; Chou, S.P. Designing vortex finder structure for improving the particle separation efficiency of a hydrocyclone. Sep. Purif. Technol. 2017, 172, 76–84. [Google Scholar] [CrossRef]
- Cui, B.Y.; Wei, D.Z.; Gao, S.L.; Liu, W.G.; Feng, Y.Q. Numerical and experimental studies of flow field in hydrocyclone with air core. Trans. Nonferrous Met. Soc. China 2014, 24, 2642–2649. [Google Scholar] [CrossRef]
- Wang, B.; Yu, A.B. Numerical study of the gas-liquid-solid flow in hydrocyclones with different configuration of vortex finder. Chem. Eng. J. 2008, 135, 33–42. [Google Scholar] [CrossRef]
- Jiang, L.Y.; Liu, P.K.; Zhang, Y.K.; Yang, X.H.; Wang, H.; Gui, X.H. Design boundary layer structure for improving the particle separation performance of a hydrocyclone. Powder Technol. 2019, 350, 1–14. [Google Scholar] [CrossRef]
- Pei, B.B.; Yang, L.; Dong, K.J.; Jiang, Y.C.; Du, X.S.; Wang, B. The effect of cross-shaped vortex finder on the performance of cyclone separator. Powder Technol. 2017, 313, 135–144. [Google Scholar] [CrossRef]
- Ghodrat, M.; Kuang, S.B.; Yu, A.B.; Vince, A.; Barnett, G.D.; Barnett, P.J. Numerical analysis of hydrocyclones with different conical section designs. Miner. Eng. 2014, 62, 74–84. [Google Scholar] [CrossRef]
- Vieira, L.G.; Damasceno, J.J.; Barrozo, M.A. Improvement of hydrocyclone separation performance by incorporating a conical filtering wall. Chem. Eng. Process. 2010, 49, 460–467. [Google Scholar] [CrossRef]
- Silva, N.K.; Silva, D.O.; Vieira, L.G.; Barrozo, M.A. Effects of underflow diameter and vortex finder length on the performance of a newly designed filtering hydrocyclone. Powder Technol. 2015, 286, 305–310. [Google Scholar] [CrossRef]
- Restarick, C.J. Classification with two-stage cylinder-cyclones in small-scale grinding and flotation circuits. Int. J. Miner. Process. 1989, 26, 165–179. [Google Scholar] [CrossRef]
- Restarick, C.J. Adjustable onstream classification using a two-stage cylinder-cyclone. Miner. Eng. 1991, 4, 279–288. [Google Scholar] [CrossRef]
- Zhang, X.M.; Guo, D. Determination of design parameter for three-product heavy-medium cyclone. J. Coal Sci. Eng. 2011, 17, 96–99. [Google Scholar] [CrossRef]
- Obeng, D.P.; Morrell, S. The JK three-product cyclone-performance and potential applications. Int. J. Miner. Process. 2003, 69, 129–142. [Google Scholar] [CrossRef]
- Obeng, D.P.; Morrell, S.; Napier-Munn, T.J. Application of central composite rotatable design to modelling the effect of some operating variables on the performance of the three-product cyclone. Int. J. Miner. Process. 2005, 76, 181–192. [Google Scholar] [CrossRef]
- Ahmed, M.M.; Ibrahim, G.A.; Farghaly, M.G. Performance of a three-product hydrocyclone. Int. J. Miner. Process. 2009, 91, 34–40. [Google Scholar] [CrossRef]
- Krokhina, A.V.; Dueck, J.; Neesse, T.; Min’kov, L.L.; Pavlikhin, G.I. An Investigation into Hydrodynamics of a Hydrocyclone with an Additional Double Jet Injector. Theor. Found. Chem. Eng. 2011, 45, 213–220. [Google Scholar] [CrossRef]
- Farghaly, M.G.; Golyk, V.; Ibrahim, G.A.; Ahmed, M.M.; Neesse, T. Controlled wash water injection to the hydrocyclone underflow. Miner. Eng. 2010, 23, 321–325. [Google Scholar] [CrossRef]
- Golyk, V.; Huber, S.; Farghaly, M.G.; Prölss, G.; Endres, E.; Neesse, T.; Hararah, M.A. Higher kaolin recovery with a water-injection cyclone. Miner. Eng. 2011, 24, 98–101. [Google Scholar] [CrossRef]
- Dueck, J.; Pikushchak, E.; Minkov, L.; Farghaly, M.; Neesse, T. Mechanism of hydrocyclone separation with water injection. Miner. Eng. 2010, 23, 289–294. [Google Scholar] [CrossRef]
- Wang, C.C.; Wu, R.M. Experimental and simulation of a novel hydrocyclone-tubular membrane as overflow pipe. Sep. Purif. Technol. 2018, 198, 60–67. [Google Scholar] [CrossRef]
- Garcia, D.V.; Parada, P.R.B.; Cilliers, J.J. Optimising small hydrocyclone design using 3D printing and CFD simulations. Chem. Eng. J. 2018, 350, 653–659. [Google Scholar] [CrossRef]
- Chiné, B.; Concha, F. Flow patterns in conical and cylindrical hydrocyclones. Chem. Eng. J. 2000, 80, 267–273. [Google Scholar] [CrossRef]
- Delgadillo, J.A.; Rajamani, R.K. Exploration of hydrocyclone designs using computational fluid dynamics. Int. J. Miner. Process. 2007, 84, 252–261. [Google Scholar] [CrossRef]
- Narasimha, M.; Brennan, M.S.; Holtham, P.N. CFD modeling of hydrocyclones: Prediction of particle size segregation. Miner. Eng. 2012, 39, 173–183. [Google Scholar] [CrossRef]
- Brennan, M. CFD simulations of hydrocyclones with an air core: Comparison between large eddy simulations and a second moment closure. Chem. Eng. Res. Des. 2006, 84, 495–505. [Google Scholar] [CrossRef]
- Slack, M.D.; Prasad, R.O.; Bakker, A.; Boysan, F. Advances in cyclone modeling using unstructured grids. Chem. Eng. Res. Des. 2000, 78, 1098–1104. [Google Scholar] [CrossRef]
- Vakamalla, T.R.; Mangadoddy, N. Numerical simulation of industrial hydrocyclones performance: Role of turbulence modelling. Sep. Purif. Technol. 2017, 176, 23–39. [Google Scholar] [CrossRef]
- Chu, K.W.; Wang, B.; Yu, A.B.; Vince, A. CFD-DEM modelling of multiphase flow in dense medium cyclones. Powder Technol. 2009, 193, 235–247. [Google Scholar] [CrossRef]
- Kyriakidis, Y.N.; Silva, D.O.; Barrozo, M.A.; Vieira, L.G. Effect of variables related to the separation performance of a hydrocyclone with unprecedented geometric relationships. Powder Technol. 2018, 338, 645–653. [Google Scholar] [CrossRef]
- Hsieh, K.T.; Rajamani, K. Phenomenological model of hydrocyclone: Model development and verification for single-phase flow. Int. J. Miner. Process. 1988, 22, 223–237. [Google Scholar] [CrossRef]
Figure 1.
Two-stage (TS) hydrocyclone.

Figure 2.
The mesh of TS hydrocyclone: (a) mesh; (b) mesh independence detection.

Figure 3.
Comparisons between the simulation and the classic experiment: (a) tangential velocity (with Hsieh’s results [38]); (b) axial velocity (with Hsieh’s results); (c) comparison of separation behaviours (with Delgadillo’s results [3]).

Figure 4.
Relationship between pressure drop and inlet velocity.

Figure 5.
Pressure distribution contours.

Figure 6.
Radial pressure distributions: (a) Z = 300 mm (first stage); (b) Z = 150 mm (second stage).
Figure 6.
Radial pressure distributions: (a) Z = 300 mm (first stage); (b) Z = 150 mm (second stage).
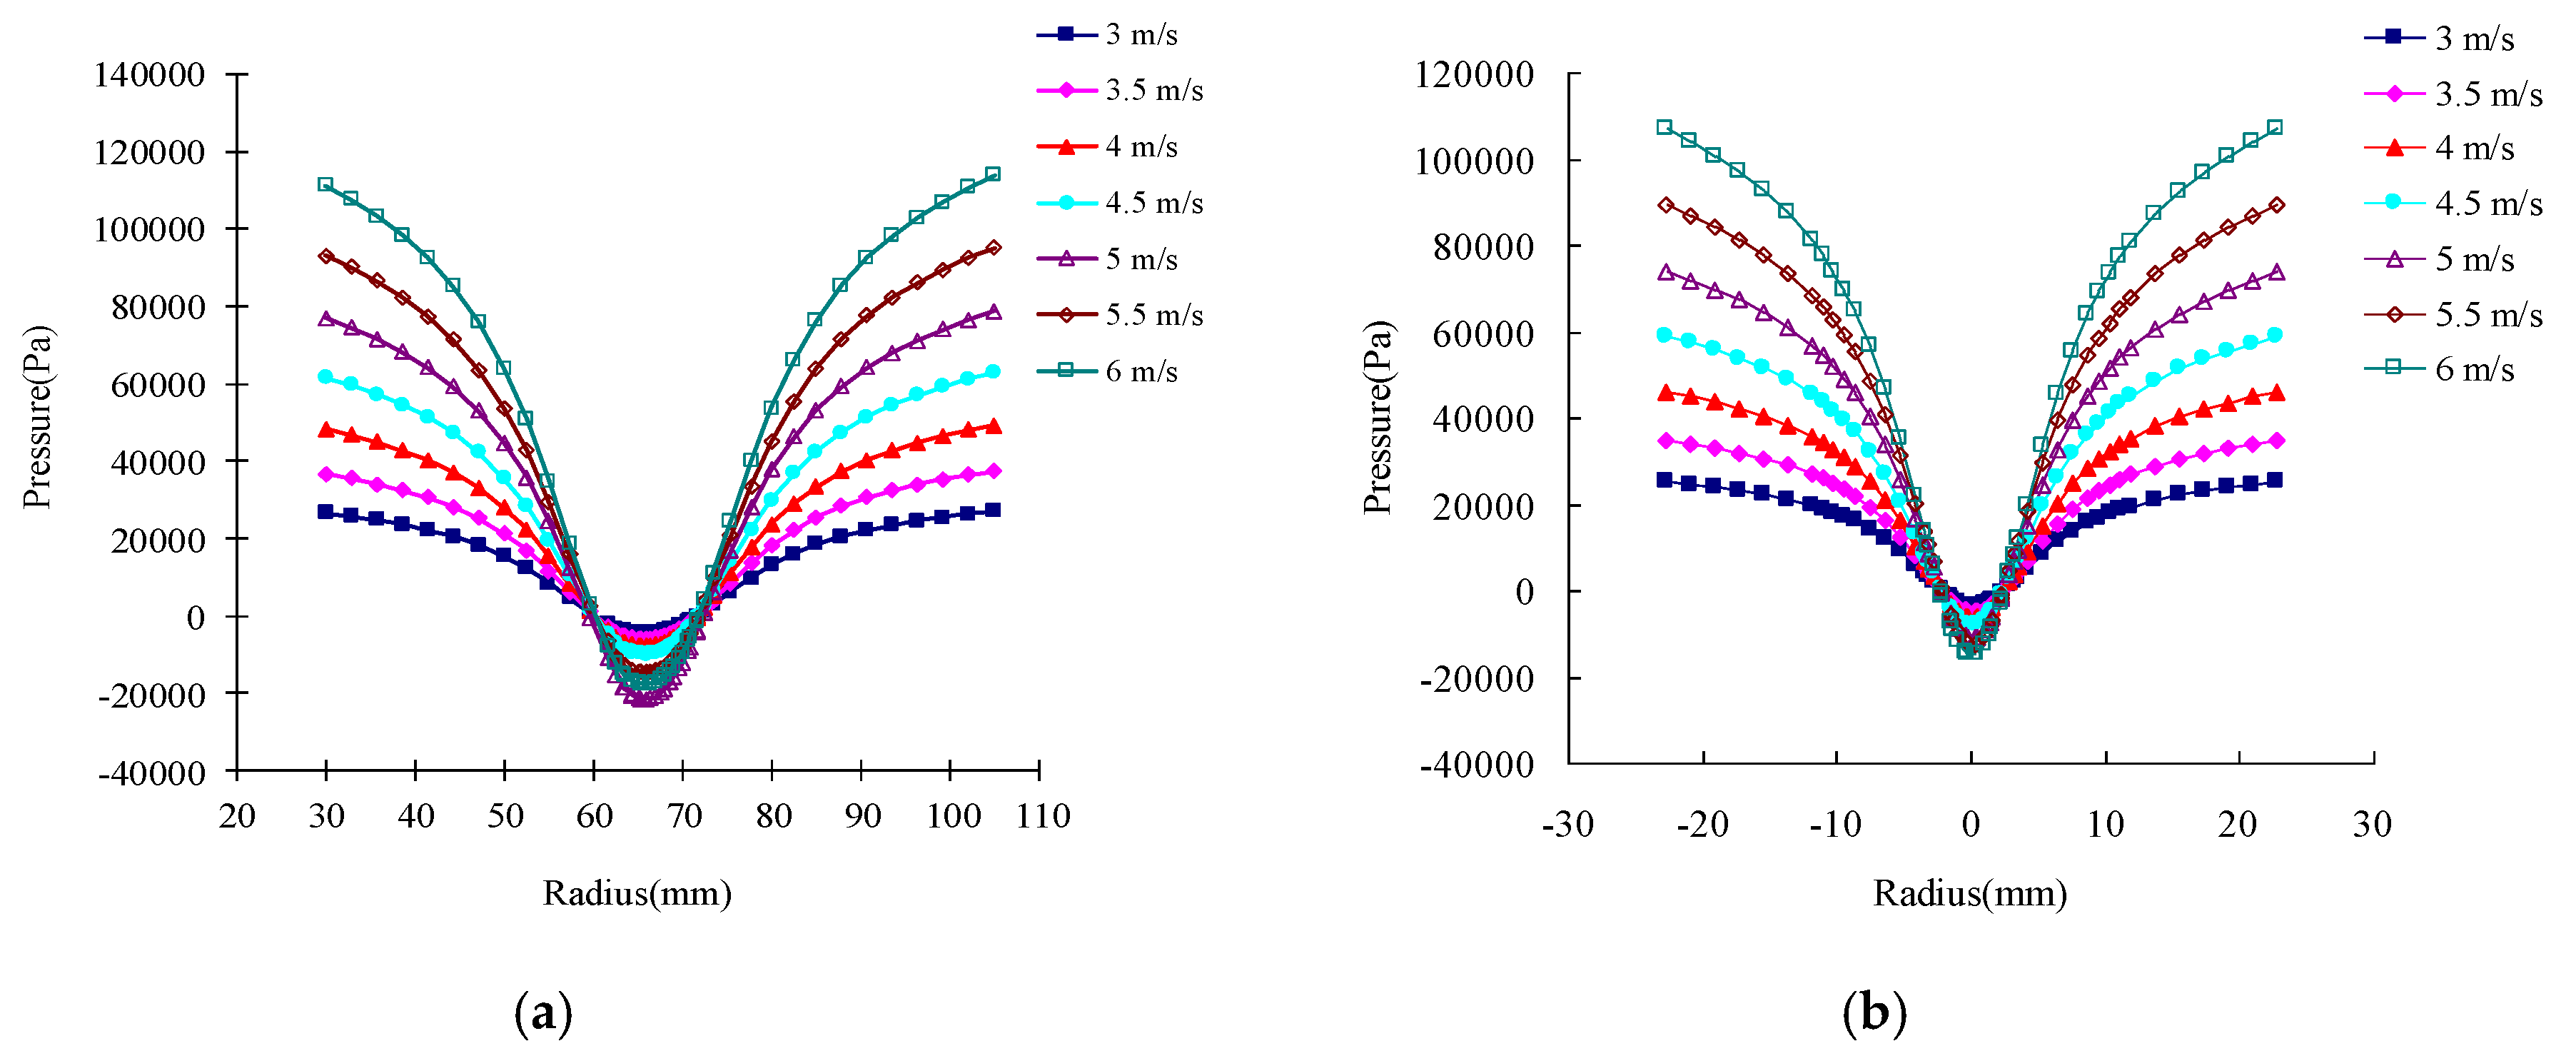
Figure 7.
Comparison of tangential velocities: (a) Z = 300 mm (first stage); (b) Z = 150 mm (second stage).
Figure 7.
Comparison of tangential velocities: (a) Z = 300 mm (first stage); (b) Z = 150 mm (second stage).

Figure 8.
Axial velocity profiles: (a) Z = 300 mm (first stage); (b) Z = 150 mm (second stage).

Figure 9.
Radial velocity profiles: (a) Z = 300 mm (first stage); (b) Z = 150 mm (second stage).

Figure 10.
Separation efficiency: (a) first stage; (b) second stage; (c) TS hydrocyclone.

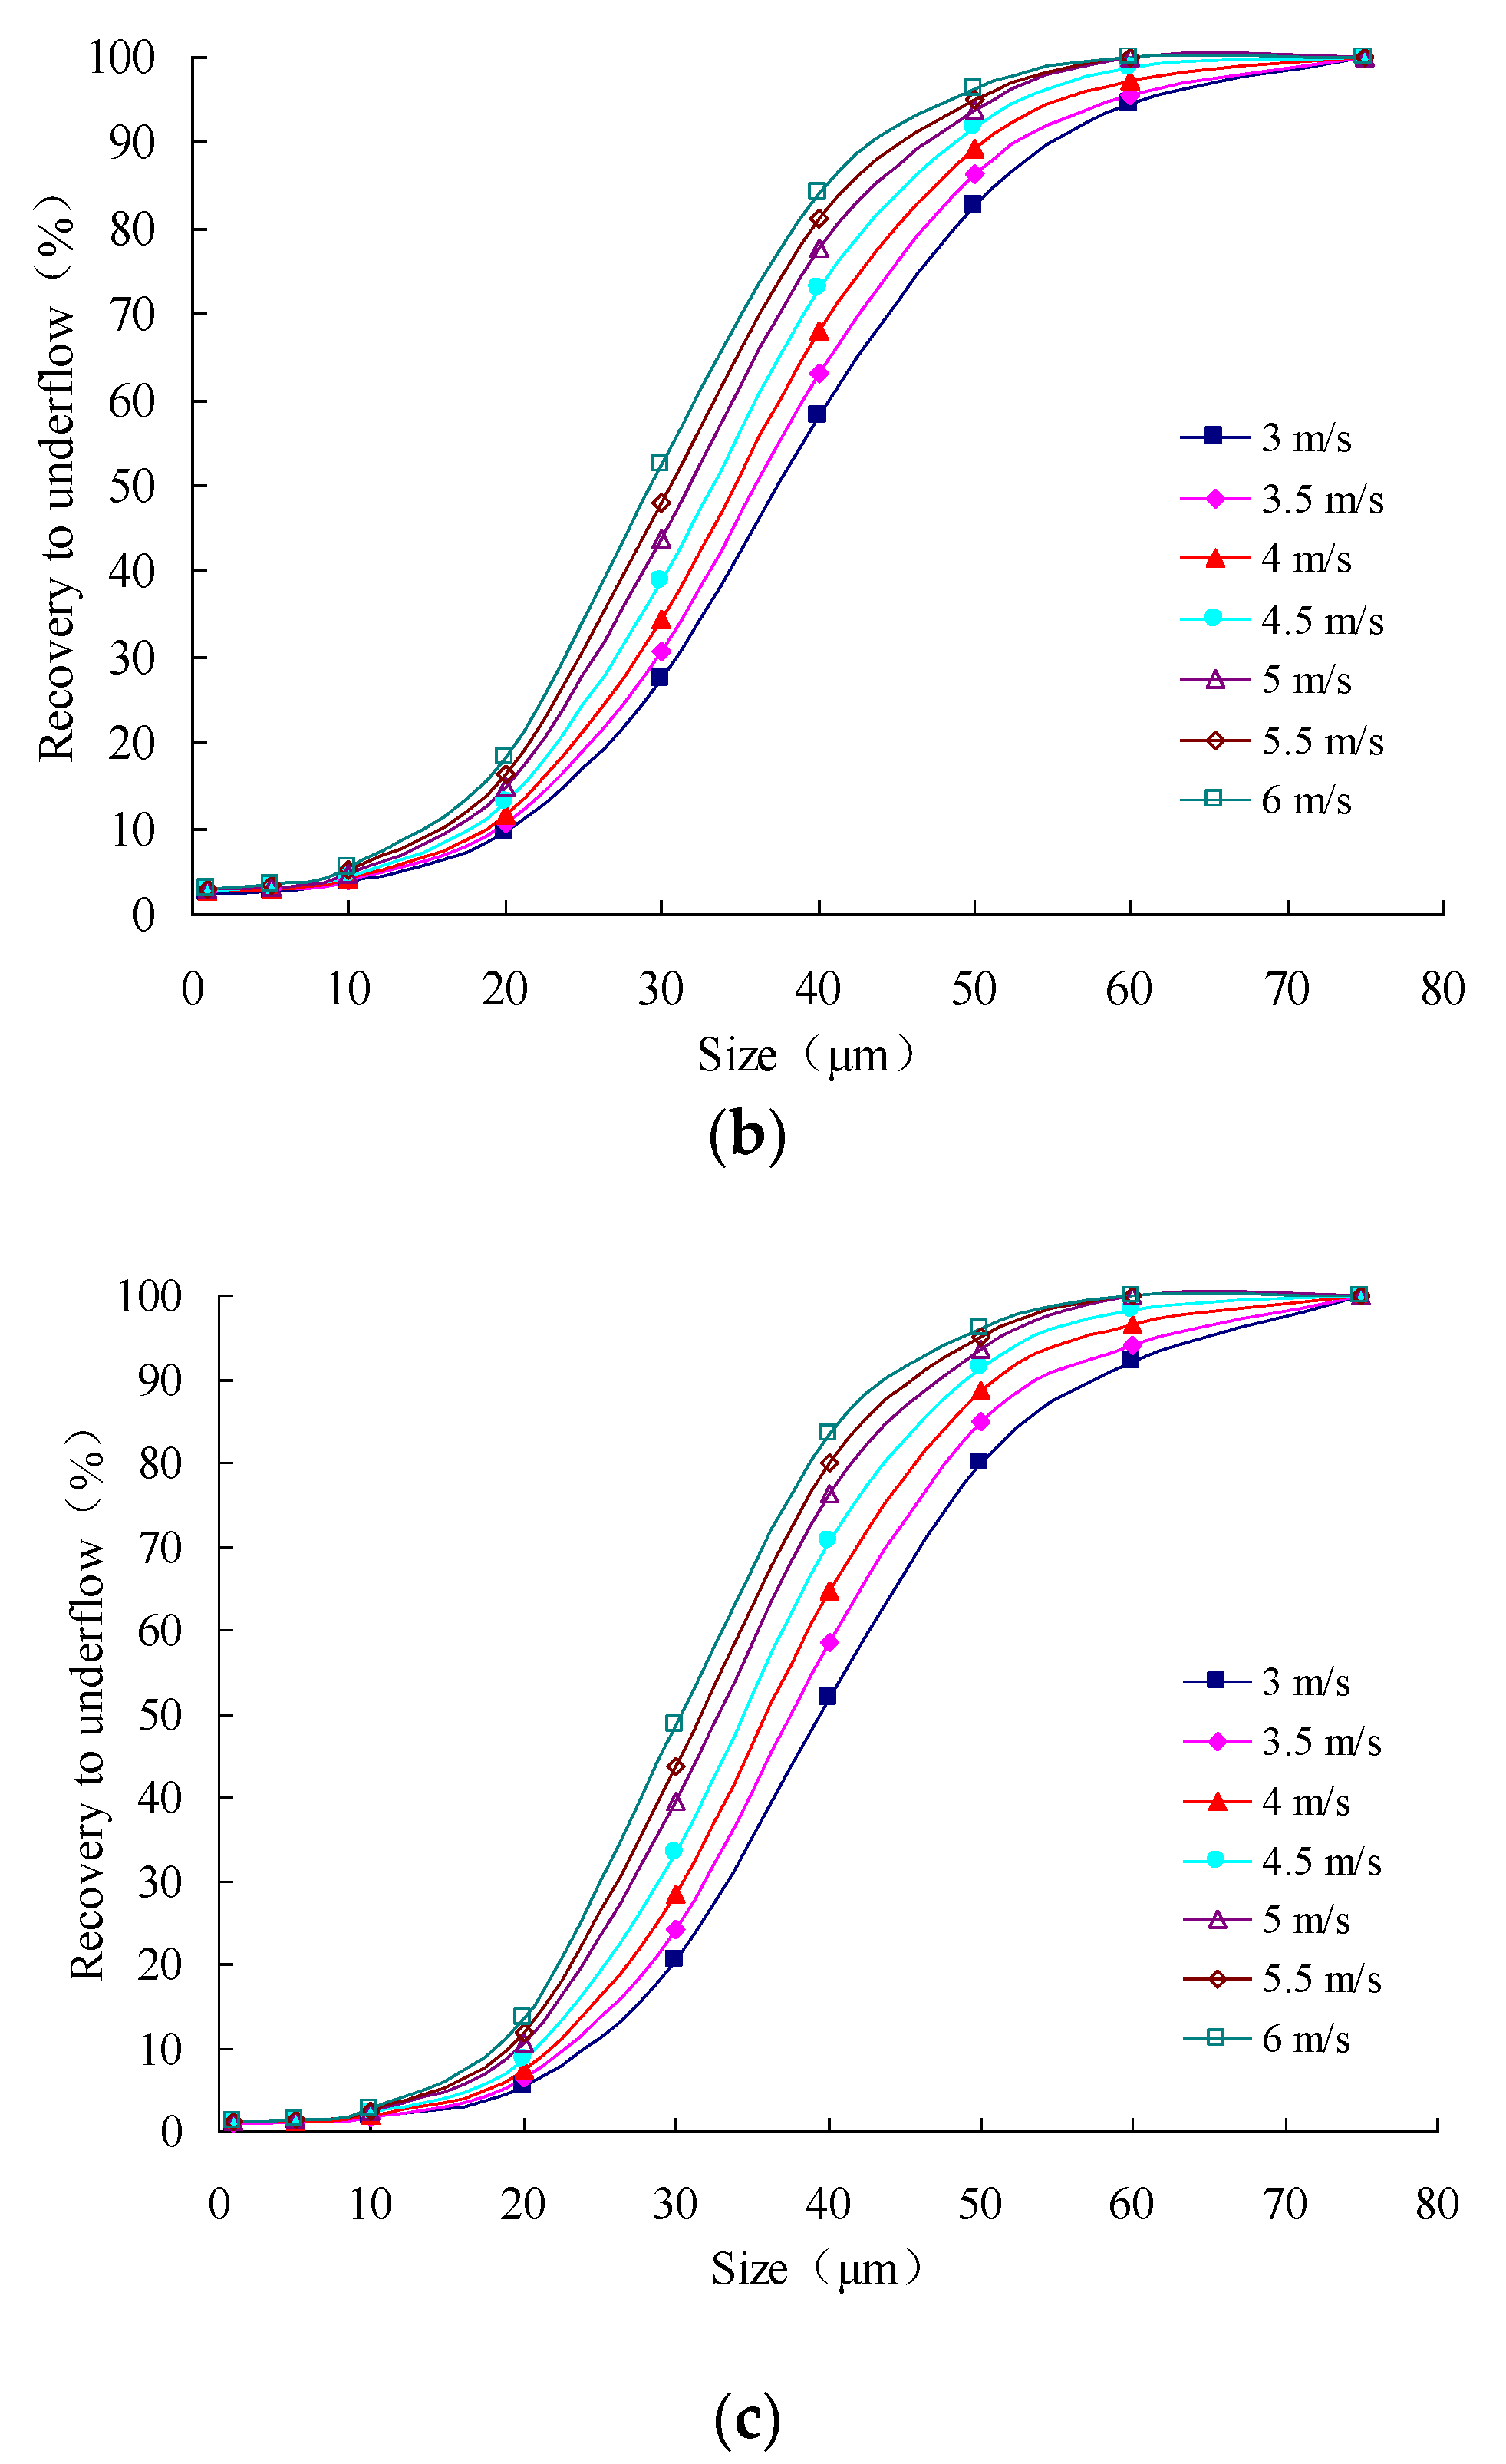
Figure 11.
Comparison of separation performance: (a) cut size d50; (b) total separation efficiency; (c) split ratio; (d) Ep.
Figure 11.
Comparison of separation performance: (a) cut size d50; (b) total separation efficiency; (c) split ratio; (d) Ep.

Figure 12.
Particle size distribution of the product: (a) the overflow of first stage; (b) the overflow of second stage; (c) the underflow of second stage.
Figure 12.
Particle size distribution of the product: (a) the overflow of first stage; (b) the overflow of second stage; (c) the underflow of second stage.

Figure 13.
Variation of the medium particle size of the product.


Table 1.
Structural parameters of hydrocyclones.
| Structural Parameters | Size |
|---|---|
| Diameter of first cylinder section D1 (mm) | 75 |
| Diameter of second cylinder section D2 (mm) | 50 |
| Height of first-stage cylinder section H1 (mm) | 150 |
| Height of first-stage body H2 (mm) | 180 |
| Height of first-stage vortex finder Ho1 (mm) | 50 |
| Diameter of inlet a × b (mm) | 15 × 20 |
| Height of second stage body H3 (mm) | 281 |
| Height of second-stage cylinder section H4 (mm) | 85 |
| Height of second-stage cone section H5 (mm) | 150 |
| Height of second-stage outer vortex finder H6 (mm) | 30 |
| Height of second-stage inner vortex finder Ho2 (mm) | 50 |
| Diameter of apex Du2 (mm) | 7 |
| Diameter of second vortex finder Do2 (mm) | 15 |
| Diameter of first vortex finder Do1 (mm) | 25 |
Table 2.
The size distribution of particles in the feed.
| Size Interval (μm) | Mean Size (μm) | Yield (%) | Volume Fraction (%) |
|---|---|---|---|
| 0–2.5 | 1 | 4.88 | 0.1708 |
| 2.5–7.5 | 5 | 7.21 | 0.2524 |
| 7.5–15 | 10 | 9.55 | 0.3343 |
| 15–25 | 20 | 15.33 | 0.5366 |
| 25–35 | 30 | 20.88 | 0.7308 |
| 35–45 | 40 | 16.59 | 0.5807 |
| 45–55 | 50 | 11.38 | 0.3983 |
| 55–65 | 60 | 8.31 | 0.2909 |
| 65–80 | 75 | 5.87 | 0.2055 |
© 2019 by the authors. Licensee MDPI, Basel, Switzerland. This article is an open access article distributed under the terms and conditions of the Creative Commons Attribution (CC BY) license (http://creativecommons.org/licenses/by/4.0/).
Share and Cite
MDPI and ACS Style
Jiang, L.; Liu, P.; Zhang, Y.; Yang, X.; Wang, H. The Effect of Inlet Velocity on the Separation Performance of a Two-Stage Hydrocyclone. Minerals 2019, 9, 209. https://doi.org/10.3390/min9040209
AMA Style
Jiang L, Liu P, Zhang Y, Yang X, Wang H. The Effect of Inlet Velocity on the Separation Performance of a Two-Stage Hydrocyclone. Minerals. 2019; 9(4):209. https://doi.org/10.3390/min9040209
Chicago/Turabian StyleJiang, Lanyue, Peikun Liu, Yuekan Zhang, Xinghua Yang, and Hui Wang. 2019. "The Effect of Inlet Velocity on the Separation Performance of a Two-Stage Hydrocyclone" Minerals 9, no. 4: 209. https://doi.org/10.3390/min9040209
Note that from the first issue of 2016, this journal uses article numbers instead of page numbers. See further details here.