Volcanic-Derived Placers as a Potential Resource of Rare Earth Elements: The Aksu Diamas Case Study, Turkey
by
 and
and
Eimear Deady
1,*, 
Alicja Lacinska
2,
Kathryn M. Goodenough
1,
Richard A. Shaw
2 and
Nick M. W. Roberts
3 1
The Lyell Centre, British Geological Survey, Research Avenue South, Edinburgh EH14 4AP, UK
2
Environmental Science Centre, British Geological Survey, Nicker Hill, Keyworth NG12 5GG, UK
3
Environmental Science Centre, NERC Isotope Geosciences Laboratory, Nicker Hill, Keyworth NG12 5GG, UK
*
Author to whom correspondence should be addressed.
Minerals 2019, 9(4), 208; https://doi.org/10.3390/min9040208
Submission received: 15 February 2019
/
Revised: 22 March 2019
/
Accepted: 26 March 2019
/
Published: 30 March 2019
(This article belongs to the Special Issue Rare Earth Deposits and Challenges of World REE Demand for High-Tech and Green-Tech at the Beginning of the 3rd Millennium)
Abstract
:Rare earth elements (REE) are essential raw materials used in modern technology. Current production of REE is dominated by hard-rock mining, particularly in China, which typically requires high energy input. In order to expand the resource base of the REE, it is important to determine what alternative sources exist. REE placers have been known for many years, and require less energy than mining of hard rock, but the REE ore minerals are typically derived from eroded granitic rocks and are commonly radioactive. Other types of REE placers, such as those derived from volcanic activity, are rare. The Aksu Diamas heavy mineral placer in Turkey has been assessed for potential REE extraction as a by-product of magnetite production, but its genesis was not previously well understood. REE at Aksu Diamas are hosted in an array of mineral phases, including apatite, chevkinite group minerals (CGM), monazite, allanite and britholite, which are concentrated in lenses and channels in unconsolidated Quaternary sands. Fingerprinting of pyroxene, CGM, magnetite and zircon have identified the source of the placer as the nearby Gölcük alkaline volcanic complex, which has a history of eruption throughout the Plio-Quaternary. Heavy minerals were eroded from tephra and reworked into basinal sediments. This type of deposit may represent a potential resource of REE in other areas of alkaline volcanism.

1. Introduction
Rare earth elements (REE) are considered as critical metals, due to their widespread use in many “green” technologies. Primary global resources of the REE [1] are dominantly hosted in carbonatite [2] and alkaline igneous intrusions [3]. Worldwide, the main deposits currently producing REE are carbonatite-hosted, including Bayan Obo in China [4,5], Maoniuping in China [6,7] and Mount Weld in Australia [2]. From the 1980s, China became the world’s largest producer of REE, and by 2010 about 95% of the global supply originated from China [8]. However, in recent years, the supply base for rare earth elements is noticeably broadening [9]. Between the years 2011 and 2015, a five-fold increase in delineated global REE resources was identified—with almost 40% of these in Europe (Greenland, Sweden, Germany and Turkey) [10]. Although the majority of these discoveries are in carbonatites and alkaline rocks, there is an ongoing emphasis on research into alternative sources and the genesis of other types of REE deposits [11,12]. Examples of alternative REE sources include ion adsorption clays [13], alumina production waste [14], off-shore heavy mineral sands [15], deep ocean sediments [16], highly fractionated rhyolites [17], deep ocean sediments [18], and as a by-product of phosphate production [19].
Another area of interest, which has seen relatively little research as a resource for REE, is placer deposits. Historically, alluvial and beach deposits of monazite and xenotime sand in India, Malaysia, Thailand, and Brazil were the main global sources of REE until the 1960s [20,21]. Current production of REE from placers, predominantly in the form of monazite, occurs at several sites along the Indian coast in the states of Kerala, Tamil Nadu, and Odisha [20,22] (Table 1).
Placers are defined as “mineral deposits formed by the concentration of dense minerals of adequate chemical and physical stability during weathering and redeposition with or without hydraulic action” [23]. Placers are detrital sedimentary deposits, often with economic concentrations of valuable minerals with a specific gravity greater than 2.65 g·cm−3 [24]. They are a globally important source of several industrial minerals, including garnet, zircon and diamond, and a range of metallic commodities that include gold, iron, chromium, titanium and tin [25]. Placer deposits are complex and their genesis is not always well understood. However, five broad categories of placers have been identified based on their environment of formation: (1) aeolian (e.g., dunes); (2) residual (colluvial, eluvial); (3) river (fluvial, alluvial); (4) glacial and glaciofluvial and; (5) littoral (beach) [24,25]. Placer deposits can be formed by in situ weathering, but the majority of placer deposits contain minerals that have been derived from a source rock and transported [26]. It is important to note that minerals that form placer deposits tend to have a high resistance to weathering, ensuring their preservation as economic deposits.
There are significant properties that increase the economic potential of placer deposits as REE resources, including the relatively simple beneficiation of the REE ore due to the unconsolidated nature of these deposits [27,28]. This results in lower energy requirements for production. Well-established processing pathways are already in place for the two main minerals that form REE placers, monazite and xenotime. Where monazite is the target mineral for exploitation in a placer deposit, Th contents are typically high, and concerns about radioactivity can arise throughout the life of the project [29]. However, where monazite is not the target mineral, there can be significantly lower radioactivity, which reduces the hazard, when dealing with ore and treating waste.
Most REE placer deposits have formed by the erosion of crystalline rocks, and contain ore minerals such as monazite, xenotime, allanite, and titanite [20]. However, a small number of examples are also known from extrusive volcanic sources, e.g., Nettuno in Italy. Here, the REE silicate chevkinite ((Ce,La,Ca,Th)4(Fe2+,Mg)(Fe2+,Ti,Fe3+)2(Ti,Fe3+)2(Si2O7)2O8) is found amongst titaniferous magnetite, ilmenite, haematite, rutile, zircon, monazite and pyroxene [30]. These heavy minerals are derived from volcanic tuffs, from the nearby Latium volcano, Alban Hills, that have been reworked into beach sand deposits [30,31]. This paper describes another example of a placer that we propose is derived from extrusive volcanic sources, the Aksu Diamas deposit at Çanakli in the Burdur Province of Turkey.
The heavy mineral placer deposit at Aksu Diamas was first recognised in 2006 though regional exploration for kimberlite indicator minerals. The area was further explored for uranium, thorium, REE and other heavy minerals by AMR Mineral and Metal, Inc. (AMR) (Vancouver, Canada), who identified a resource of significant tonnage (454 Mt) of magnetite + zircon + titanite + ilmenite and REE-bearing phases (allanite, chevkinite, bastnäsite and minor monazite) with an average grade of 0.07% total rare earth oxide (TREO) [32]. The deposit is hosted in a tectono-karstic basin in Mesozoic limestone. The deposit itself has been described as both a weathered tuff and unconsolidated pyroclastic materials [32]. Early work by consultants AMEC [33] for AMR, hypothesised that the REE and other heavy minerals were sourced from volcanic activity at a nearby dormant volcanic centre named Gölcük. However, preliminary field mapping and structural interpretation was subsequently used to suggest that the Aksu Diamas deposit was formed prior to eruptions at Gölcük [32], although the evidence for this was not detailed. In this paper, we describe the field relationships, mineralogy and mineral chemistry of the Aksu Diamas deposit, and compare it with material from the Gölcük volcano, to test the hypothesis that the Aksu Diamas deposit was formed by reworking of volcaniclastic material derived from the Gölcük volcano.
2. Geological Setting
The Eastern Mediterranean has a complicated and prolonged geological history. The geology of the region records the closure of the Tethys ocean, which extended from modern day Greece to the Middle East [34]. The Mesozoic to Early-Cenozoic Neotethys ocean was located in what is now southern Turkey [35]. The southern margin of the Neotethys was the northern margin of the Gondwanan supercontinent and comprised of an array of smaller crustal fragments or microcontinents. Northward subduction beneath the Eurasian plate resulted in continent-continent collision during the middle-late Miocene, forming the Tauride Mountains [35,36,37]. Subsequently, in the area of interest, the development of an extensional regime led to the formation of sedimentary basins that overlie the Tauride basement [38].
The widespread alkaline magmatism in the Circum-Mediterranean Anorogenic Cenozoic Igneous (CiMACI) province, which extends from the Canary Islands to the Middle East, is linked to extensional tectonics, subsequent to continental collision [39]. The Eastern Mediterranean region is considered to be a back-arc setting, with active northwards subduction in the South Aegean and post-collisional alkaline magmatism in Western Anatolia [40]. Modelling of teleseismic P-wave traveltime tomography data from the Mediterranean region has identified that there are extensive slab interruptions in the form of tears [41], allowing interaction of magmas derived from the asthenosphere and the enriched lithospheric mantle [40,42,43,44,45].
In south west Turkey, the CiMACI province is expressed by potassic to ultra potassic volcanism in the Isparta-Gölcük region (Figure 1A). The bedrock geology of this area comprises of authochtonous Mesozoic platform carbonates from multiple palaeogeographic domains, and allochtonous nappes that are highly deformed [46] (Figure 1B). These nappes include platform and basinal sedimentary sequences, together with ophiolitic material, that were thrust onto the platform in Late Cretaceous–Palaeocene times. The Isparta-Gölcük region lies within the Lycian nappe [46].
2.1. Gölcük Volcano
The Gölcük volcano lies to the north of the Western Taurus Mountains that are formed of Mesozoic limestone and ophiolitic lithologies of the Lycian Nappe [50]. The marine successions comprise shelf and slope deposits and are several hundred metres thick in some areas [48]. Mt. Akdağ is the highest point at 2240 m. The range in this area has a lateral extent >20 km and a width of approximately 4 km at the widest point. These mountains form a drainage barrier between the volcano located on the north side of the range and the Quaternary basin to the south that hosts the Aksu Diamas deposit (Figure 2).
The dormant Gölcük volcano [51] is located close to the city of Isparta (Figure 1A), and is a part of the potassic volcanism of the CiMACI province. The volcano lies in the Isparta Angle, the intersection of the NE-trending Burdur Fault and the NW-treading Aksehir-Simav Fault [52]. The volcanic edifice is approximately 2.5 km across and is filled with a maar lake, surrounded by a topographic rim comprising mainly pyroclastic rocks with minor lavas and dykes (Figure 1C) [53,54]. This volcanic edifice developed from multiple volcanic eruptions and its products cover an area of up to 100 km2 [49,51,53,55,56,57,58]. A recent geophysical survey over the volcano has identified the presence of a trachytic dome beneath the peak of Pilav Tepe (Figure 1C) that is >850 m deep and 1.2 km in horizontal extent [59]. The Gölcük magmas are generally more potassic than other post-collisional volcanic provinces in the vicinity of Tethyan suture zones [51,60,61].
Multiple major episodes of volcanic activity, most recently phreatoplinian type eruptions, have been recognised at Gölcük and are well described in overviews by Kumral et al. [54], Platevoet et al. [58] and Kalyoncuoglu [62]. The oldest igneous activity at Gölcük comprises potassic lavas and domes was dated at 4.7 Ma and 2.77 ± 0.06 Ma [49,55,56]. The location of the igneous activity at Gölcük is controlled by the intersection of NE- and NW-trending faults that were active during the Quaternary [52,63].
The current Gölcük volcanic edifice is the final result of long-lived volcanic activity which began at around 2.77 ± 0.06 Ma [49]. Three eruptive cycles, termed eruptive Cycles I, II, and III, have been recognised by Platevoet et al. [49].
Cycle I comprises of a ca. 200 m-thick pile of pyroclastic flow deposits [49] formed between 2.18 Ma and 0.148 Ma in a series of major explosive events [58]. Cycle II consists of volumetrically minor tephriphonolitic lava flow-domes and dykes, which were emplaced not long after the end of Cycle I, between 0.115 Ma and 0.062 Ma [49,55,56]. Cycle III created a significant tuff ring, centered on the maar crater, which covered previous eruptive material and extends over the flanks of the volcano (Figure 3a–c). The tuff cone was developed between 0.0723 Ma, and 0.024 Ma (age of the last trachyte dome) [49]. Dates for trachytic intra-caldera lava domes (Pilav Tepe and Küçükçeşme Tepe), which are the most recent igneous activity at Gölcük, indicate that the minimum age for recent volcanic activity is ~0.013 Ma [51].
The petrology of the Gölcük pyroclastic rocks has been described in detail by Platevoet et al. [58]. The dominant material in both Cycles I and III is trachyandesitic pumice, with phenocrysts of green clinopyroxene, brown amphibole, magnetite, titanite, apatite, mica and a range of accessory minerals. Sanidine is abundant in Cycle III pumices. The pyroclastic rocks are strongly alkaline (ultrapotassic) in composition and are enriched in Ba, Sr, Th, U, Rb and light rare earth elements (LREE) [55,58].
2.2. Aksu Diamas
Approximately 25 km southwest of the Gölcük volcano are Quaternary basins of unconsolidated alluvium and possible lacustrine deposits (Figure 1B and Figure 2). These basins are surrounded by Cretaceous Bey Dağlari limestone. The Aksu Diamas deposit is located at the margins of such a basin, adjacent to moderately rugged limestone slopes. There has been very little previous research in this area and the following description is based on our fieldwork at the deposit, carried out in 2014.
The uppermost ca. 8 m of the weakly consolidated sedimentary succession is exposed in an exploration pit at Aksu Diamas, which is on the edge of the basin (Figure 3d). The upper part of the exposed sequence (4 m) comprises of a fine-grained, laminated, clay-rich muddy sand that contains organic material (Figure 3d). This upper part of the sequence is interpreted as having formed in an overbank setting. The lower part of the exposed succession comprises of a 5-m thick sequence of overlapping, lens-shaped gravel bodies that range in size from 90 cm to 4.5 m wide and 15–60 cm thick. The gravel is poorly sorted, varying from matrix-supported to clast-supported, and contains angular clasts that are predominantly limestone with subordinate volcanic material. The clasts range in size from <0.5–5 cm with occasional boulders up to 40 cm. The matrix is a light brown-coloured, fine to medium-grained, sub-angular, unconsolidated sand. The limestone clasts are likely locally sourced from the Cretaceous bedrock. The gravel bodies are interpreted as a series of high-energy channelised mass flow deposits, and the surrounding fine-grained sand is interpreted as a low-energy overbank setting. The sedimentary relationships at the base of the pit are obscured by washed and redistributed sediments, resulting from previous exploration work (Figure 3d). Heavy minerals are concentrated in the matrix of the lenses and are also disseminated in the loosely consolidated fine-grained sand that hosts the gravel lenses. These concentrations represent the placer deposit that was the subject of exploration by AMR Mineral and Metal, Inc. Samples were collected to investigate the heavy mineral composition of the Aksu Diamas placer and compare it with the most recent pyroclastic deposits of Gölcük.
3. Materials and Methods
3.1. Materials
Three samples of pyroclastic material (Table 2) were collected from sub-layers within the accessible exposures of Eruptive Cycle III (after Platevoet et al. [58]) (Figure 3a–c) at the Gölcük alkaline complex (Figure 1). Samples were collected from cleaned faces over an area of approximately 50 × 30 cm. Each of the localities comprises of unconsolidated tuffs, with matrix- supported lithic clasts in a medium- to fine-grained matrix. The clasts are angular, predominantly pumice, with minor trachytic clasts. The deposit as a whole is bedded and generally poorly sorted, with some clast-rich layers. Clast size varies between the three sites, with the modal clast size being smaller (ca. 2 cm) in deposits on the inner wall of the crater, and larger (ca. 10 cm) on the outer margin.
Three bulk samples of unconsolidated, poorly-sorted gravel hosting heavy minerals (Aksu Diamas placers, Table 2) were collected from multiple channels in the lower levels of the test pit at Aksu Diamas (Figure 3d). The faces at the sampling locations were scraped clean before sampling to avoid any recent weathering features. Representative samples from multiple channels were taken. A sample of heavy mineral concentrate (MPLV 054) was obtained from the pilot plant facility adjacent to the exploration pit.
3.2. Methods
Initially, the samples were dried at 40 °C for a minimum of 12 h and then split into two at the sample preparation facility at the British Geological Survey (BGS), Keyworth, UK, with half of each sample retained for archiving at the BGS. Samples were sieved to collect the 125–250 µm fraction, removing both the larger lithic clasts and the finer fractions. After manual removal of the magnetite using a handheld magnet, the heavy minerals were separated using a Frantz isodynamic magnetic separator at the Natural Environment Research Council (NERC) Isotope Geosciences Laboratory (NIGL), Keyworth, UK. Both the magnetic and non-magnetic fractions were sampled. The separated heavy minerals were mounted in resin blocks and prepared as polished thin sections at the BGS. Separate polished blocks were prepared for zircon analysis.
Qualitative and quantitative chemical analyses of pyroxene and chevkinite group minerals (CGMs) were performed using an FEI Quanta 600 scanning electron microscope (SEM) with Oxford Instruments energy (EDS) and wavelength dispersive X-ray spectrometer (WDS), the latter for selected samples only. Samples were analyzed in the form of carbon sputter coated (≈25 nm thick) polished thin sections (Table 3). The SEM was operated under high vacuum (<1 × 10⁻⁵ torr) at 20 kV accelerating voltage, with the optimal analytical working distance of 10 mm and an X-ray detector take-off angle of 45°. Modal analysis of the heavy mineral separates was based on SEM X-ray mapping of three representative fields of view, but may not include all the trace phases present in the sample. For the quantitative EDS analyses, 1 nA beam current and 120 s acquisition time were used, giving ≈ 1 × 10⁶ total X-ray counts. EDS process time of 4 resulted in deadtime <45%. The beam stability was monitored by the analysis of a cobalt (Co) reference standard at the beginning of each analytical session and after every ten analyses of the unknown. The instrument performance on the day was also assessed using a well-characterised in-house standard Frisch pyroxene (augite) prior to the analysis of unknown pyroxene. End members of pyroxene from this study, and those from Alıcı et al. [55] and Platevoet et al. [58], were calculated following the same method [64].
The chevkinite group minerals (CGMs) exhibit a “problematic spectral region” between 4.4–4.9 keV with overlapping X-ray energies of Ce, La, Ba and Ti (Ce Lα1 4.84 keV, La Lα1 4.65 keV, Ti Kα1 4.51 keV, Ti Kβ 4.931 keV and Ba Lα1 4.465 keV). WDS, with superior spectral resolution to EDS, was used to resolve these overlaps. The WDS analysis was conducted using the same FEI 600 Quanta SEM with a Wave 500 spectrometer, running with Oxford Instruments INCA (Version 4) software. The SEM was operated at 20 kV accelerating voltage, 10 nA beam current. Only one WDS spectrometer was available and to minimize the risk of beam drift, the analysis was limited to nine elements per analytical spot only. The counting times varied per element between 20/10 s (peak/background) and 40/20 s for major and trace elements, respectively, resulting in a total acquisition time of approximately 30 min per analysis. The following reference materials and WDS crystals were used for calibration of the selected nine element X-ray lines: (LaLα)–LaB6 & LIF; (CeLα)–CeO2 & LIF; (PrLβ)–PrAlO3 & LIF; (NdLβ)–NdAlO3 & LIF; (SmLβ)–SmAlO3 & LIF; (TiKα, SrLα)–SrTiO3 & PET; (BaLα)–BaSO4& PET; and (VKα)–V metal & LIF. The calibration was performed every 24 h. This protocol was used for two representative samples, one from the Gölcük pyroclastic rocks and one from the Aksu Diamas pit with approximately ten EDS-WDS analyses per sample. All other samples of chevkinite group minerals were analyzed by EDS only. A detailed evaluation of the EDS and WDS results taken from the same analytical spot gave us confidence to use the EDS data for plotting of element ratios. One common disadvantage of the EDS analysis is the possible misidentification of Ba when either or both Ti and La are also present in the material. In our case, this X-ray energy overlap resulted in an overestimation of Ba in all crystals analyzed of about 1 wt.%. Although Ba can be present in the CGMs, this was not the case in the samples investigated here, where only a trace amount was found by WDS in a couple of crystals. The presence or absence of Ba strongly affects the reported amount of Ti and La in the analysis, thus all analyses here were recalculated without Ba. The effects of X-ray energy overlaps on the results of chevkinite microanalysis using SEM EDS-WDS are further explained by Lacinska and Rushton (2018) [65].
Collectively, approx. 30 analyses were obtained with EDS only and approx. 20 with a combination of EDS-WDS, with the majority summing up to 100 ± 2 wt. % and largely corresponding to the expected mineral stoichiometry. The limited compositional range and good agreement with published data gave us confidence in the quality of the results presented here. It must be noted that trace levels of other REE might be present in the CGMs but are below the detection limit of the SEM-EDS system, i.e., 0.1 wt. %. Several check analyses by WDS confirmed the presence of Eu and Gd in trace amounts.
The CGMs are Ti-REE silicates with general unit cell formulae calculated based on the idealized A4BC2D2Si4O22, where A = REE, Ca, Sr, Th; B = Fe2+; C = Fe3+, Fe2+, Mn, Mg, Zr, Nb; and D = Ti [66]; using 22 oxygens, and the ideal cation sum of 13. In this study, the cation sum ranges from 13–13.4, the higher values possibly reflecting elements that might be present at different valence states, e.g., Ce presented here, as Ce3+ might also be present as Ce4+. The cations have been allocated to sites following recommendations in Parodi et al. [67] and Macdonald and Belkin [68]. Two chevkinite group minerals were identified in the samples studied: chevkinite and perrierite. These minerals differ in crystal structure, with the most robust discriminant being the β angle of ca. 100° for chevkinite and ca. 113° for perrierite [69]. The different crystal structures allow variable amounts of cations into the different structural sites. The two minerals can also be distinguished based on their chemistry [68], typically, chevkinite is richer in FeO and poorer in CaO than perrierite [68].
Trace element concentrations in zircons from both Gölcük (MPLV057) and Aksu Diamas (MPLV051) were measured in polished blocks at NIGL using a New Wave Research 193UC laser ablation system equipped with a TV2 cell coupled to a Nu Instruments Attom single collector inductively coupled plasma mass spectrometer (SC-ICP-MS). Ablation conditions were a 25 μm static beam, 5 Hz repetition rate, 3 J/cm2 fluence and a 20 second dwell. The Attom was run in linkscan mode, which measures two sweeps of the total mass range (both up and down) every 2 ms, with dwell times automatically split across the measured isotopes. These were 29Si, 49Ti, 89Y, 93Nb, 139La, 140Ce, 141Pr, 146Nd, 149Sm, 153Eu, 157Gd, 163Dy, 166Er, 172Yb, 175Lu, 177Hf, 181Ta, 206Pb, 232Th, 238U. Normalisation was achieved using sample standard bracketing using 29Si as an internal standard and 91500 zircon [70] as the reference material. Zircon GJ-1 [71] was measured as an unknown as a check on reproducibility and accuracy, and is within 10% of in-house values for all elements. Data handling and reduction were performed using Iolite software (Version 2.5) [72].
Magnetite trace elements were measured at BGS using a New Wave Research UP193FX excimer laser ablation system coupled to an Agilent 7500 series quadrupole ICP-MS, calibrated using a trace element glass standard (NIST SRM-610 [73]). Ablation conditions were a 70 µm spot size, 10 Hz repetition rate, a 3 J/cm2 fluence, and a dwell time of 40 s. The relative standard deviation for the repeat analysis of a secondary trace element standard (NIST SRM-612 [73]) is typically better than 5% for the following elements of interest: Ca, Al, Nb, V, Mg, Co, Cr, Mn, Zr, Ni, Y, Pb, Cu, and better than 10% for Sn and Zn, and better than 15% Ti. The relative standard deviation for P is slightly higher, being just outside 20%. Data handling and reduction were performed using Iolite software (Version 2.5) [72].
4. Results
4.1. Mineralogy
The heavy mineral-rich separate (125–250 µm size fraction) from the Gölcük samples comprises, in decreasing amounts, clinopyroxene (diopside) and amphibole (dominantly Ti-rich), magnetite-ulvospinel, biotite, apatite, volcanic glass and traces of lithic fragments, K-feldspar, fluorite, titanite, garnet (andraditic composition), plagioclase, chevkinite group minerals (CGMs), zircon, chlorite, Fe sulphide, rutile, monazite, allanite, britholite, thorite, and Ce oxide (possibly cerianite). An example of a modal analysis of one sample from each locality is presented in Table 4.
The particle morphology varies from angular, commonly euhedral to subhedral (particularly in the case of the pyroxene grains), to sub-rounded. The volcanic glass is typically vesicular and occurs as either separate particles or surrounding the pyroclasts, e.g., pyroxene (Figure 4a). The mineral composition of the samples analyzed is consistent with the composition of volcanic rocks from Gölcük, as described by Alıcı et al. [55].
The heavy minerals separate from the Aksu Diamas deposit includes in decreasing amount, magnetite-ulvospinel, clinopyroxene and Ti-rich amphibole, titanite (some grains contain TiO2 inclusions), apatite (locally as inclusions in clinopyroxene), lithic fragments, zircon and traces of chevkinite, garnet (andraditic composition), allanite, magnesiochromite, biotite, K feldspar, chlorite, Fe sulphide (usually as <5 µm inclusions in magnetite), rutile and thorite. An example modal analysis of one sample is presented in Table 4. The REE-bearing minerals include REE-bearing apatite, CGMs, allanite, bastnäsite, and monazite. Cerianite and possible britholite were also detected. Volcanic glass was rarely observed in the Aksu Diamas samples. The morphology of the particles in the 125–250 µm size fraction varies but most particles fall into an angular to sub-angular group, some grains being subhedral to euhedral (Figure 4b).
In order to test the hypothesis that the REE-bearing minerals at Aksu Diamas are derived from the Gölcük volcano, we carried out mineralogical and geochemical fingerprinting of minerals that are present in abundance in both sample groups. The study includes the crystal chemistry of the two main groups, pyroxene and CGMs, as well as trace element data for magnetite and zircon.
4.2. Mineral Chemistry Comparison
4.2.1. Pyroxene
Gölcük Heavy Mineral Separate (HMS)
The pyroxene from the Gölcük HMS belongs to the clinopyroxene group and the majority of crystals studied are diopside, with a few lower-Ca crystals plotting in the augite compositional field (Figure 5).
Collectively, the pyroxenes exhibit a chemical variation of: En 20.9–51.7, Fs 5.1–37.1 and Wo 39.0–49.2. In the enstatite-aegirine-ferrosilite ternary diagram, the Gölcük pyroxenes show a clear trend of increasing Fe with slight increase in Na (Figure 6).
The Al2O3 content ranges from 0.4–7.8 wt. % with approximately 80% falling below 4.5 wt. %, giving Al ⇋ Si tetrahedral site substitution of ≤10%, common for the diopside-hedenbergite series. Most of the crystals exhibit low contents of Cr2O3 (0.1–0.3 wt. %) and notably variable amounts of MnO and TiO2, ranging from 0.1–0.9 (with a couple of higher exceptions) and 0.1–1.2, respectively. Plotting of minor elements Cr2O3 + TiO2 against Al2O3 in pyroxene from both localities shows a clear positive correlation (Figure 7).
Some of the pyroxene crystals are chemically zoned. The zonation is controlled chiefly by the amount of Mg, Fe, Al, and to lesser extent Ca, Ti and Na; and manifests itself by Backscattered Electron (BSE) contrast differences within a single crystal (Figure 8). Notably, a large number of crystals displayed an Fe-enriched core overgrown with multiple Mg- or Fe-rich bands (Figure 8). Both the MgO and the FeO vary by ca. 2 wt. % between the corresponding bands. The thickness of bands as well as their distribution varies greatly from crystal to crystal and ranges from fine 1–5 µm oscillatory parallel lamellae mimicking the orientation of crystal faces, to up to 100 µm wide banding with orientation that is difficult to discern. The latter feature is typically present in broken fragments of larger crystals. This type of zonation is typical of phenocrysts from volcanic rocks.
Aksu Diamas HMS
The pyroxenes from the Aksu Diamas HMS also belong to the clinopyroxene group with diopside being the most common end-member. The chemical variation of pyroxene in the En-Fs-Wo ternary system has the following ranges, En 33.6–55.7, Fs 5.6–19.5 and Wo 38.8–48.9 (Figure 5). In the enstatite-aegirine-ferrosilite ternary diagram, the Aksu Diamas pyroxene data overlap with those from Gölcük and show a similar trend of increasing Fe with a slight increase in Na (Figure 6). The amount of Al2O3 ranges from 0.4–6.4 wt. % with nearly 90% of crystals having contents below 4.5 wt. %, giving an Al ⇋ Si tetrahedral site substitution of ≤10% similar to that observed in the Gölcük HMS. In the crystals analyzed, Cr2O3 varies from 0.1–0.4 wt. %, MnO 0.1–0.8 wt. % and TiO2 0.1–0.2 wt. %. The pyroxenes show a clear positive correlation between Cr2O3 + TiO2 and Al2O3 (Figure 7) and overlap with the Gölcük data.
Some crystals exhibit well-defined chemical zones (Figure 9), largely controlled by variation in Fe, Mg, and Al content. Many of the crystals analyzed displayed an Fe-enriched core surrounded by more or less well-defined Mg or Fe-enriched bands, with the FeO and MgO contents varying by <2 wt. % between the corresponding zones. The zonation is commonly oscillatory with bands of varying thickness, from a few microns to a few tens of microns. The distribution of compositional zones in crystals varies from sharply defined, mimicking crystal growth zones to embayed and generally uneven. The pattern of zonation is similar to that observed in pyroxene from the Gölcük HMS.
4.2.2. Chevkinite Group Minerals (CGMs)
Gölcük HMS
Ten quantitative EDS-WDS analyses were obtained for CGMs from the Gölcük HMS (Table 5, sample MPLV 059). The major element composition of the CGMs from Gölcük varies slightly from crystal to crystal with TiO2, FeO, La2O3 and ThO2 showing the greatest differences: 14.5–18.8 wt. %, 8.5–10.5 wt. %, 13.9–19.3 and <0.1 (b.d. EDS)–4.5 wt. %, respectively (based on the combined EDS-WDS analyses, Table 5).
The REE content of the minerals is dominated by light rare earth elements (LREE) with La and Ce being major components. Traces of Eu, Gd and Dy were detected by the WDS system in some crystals. Most crystals display complex chemical zonation resulting from the % variation in several elements, but are mostly associated with the FeO and ThO2 contents. All crystals analyzed contain vanadium, with values generally ≤0.44 wt. % with one high value of 0.94 wt. % V2O5. A plot of ∑REE against ∑(Ca, Ti, Zr) (Figure 10) shows a negative correlation, reflecting the common element substitution [67] in the chevkinite mineral group: CaA2+ + TiC4+ + ZrC4+ = REEA3+.
As no crystallographic data on the CGMs was obtained in this study, a plot of CaO wt.% vs. FeO wt. % was used to distinguish between chevkinite and perrierite [68]. It is noted that only two data points from the Gölcük area samples are plotted in the perrierite field; thus, their definite presence in this location should be verified with a larger number of samples (Figure 11).
Aksu Diamas HMS
Ten quantitative EDS-WDS analyses were obtained for the minerals belonging to the CGM from the Aksu Diamas HMS sample MPLV 049 (Table 6). The major oxides decrease in abundance from Ce2O3 (19.5–22.2 wt. %) > SiO2 (19.4–20.9 wt. %) > TiO2 (12.9–18.2 wt. %) ≈ La2O3 (10.7–18.1 wt. %) > FeO (6.4–12.5 wt. %).
The minerals are dominated by LREE content, with traces of Gd, Eu and Dy detected in some crystals. Similar to the CGM in the Gölcük samples, a complex chemical zonation was observed in the CGM from the Aksu Diamas HMS. Although it is difficult to confirm the main elements contributing to the differences in backscatter electron contrast, it is likely that both FeO and ThO2 are the major source of those differences (Figure 12). All crystals analyzed contain V2O5, ranging from 0.1–0.48 wt.%. On the ∑REE against ∑(Ca, Ti, Zr) plot (Figure 9), the Aksu Diamas samples show the same negative correlation as those from Gölcük.
As shown in Figure 11, >70% of crystals analyzed from the Aksu Diamas HMS sample plot within the chevkinite compositional range, with FeO and CaO content > 8 wt. % and < 5 wt. %, respectively. A few crystals have CaO > 5 wt. % and plot in the perrierite field.
4.2.3. Zircon
Gölcük HMS
The average content of REE in zircon from Gölcük is approx. 7000 mg/kg (Table 7). The range of chondrite-normalized [74] trace element abundances for zircons from both Gölcük and Aksu Diamas show patterns typical of magmatic zircon [75,76], with a steep rise in the middle (Sm) to heavy (Lu) REE (Figure 13), a strong positive Ce anomaly, and a weak negative Eu anomaly. The Lan/Lun ratio for zircon from Gölcük ranges from 0.00004 to 0.00128 with an average of 0.00024.
Aksu Diamas HMS
The average content of REE in zircon from Aksu Diamas is ca. 6000 mg/kg (Table 8). The Lan/Lun ratio for zircon from Aksu Diamas ranges from 0.00002 to 0.00214 with an average of 0.00022. The REE pattern for Aksu Diamas zircons is almost indistinguishable from that for Gölcük (Figure 13). This shows a strong positive Ce anomaly, a weak negative Eu anomaly, and a steep rise in REE content from Sm to Lu; features all typical of magmatic zircon [75,76].
4.2.4. Magnetite
Gölcük HMS
The composition of magnetite from Gölcük is dominated by Ti (2.57–2.73 wt. %), Al (0.523–2.08 wt. %), Mg (0.369–1.20 wt. %), V (0.185–0.218 wt. %) and Mn (0.257–0.618 wt. %), with lower concentrations of Zn (505–1099 mg/kg), P (53–1550 mg/kg) and Co (73.9–174 mg/kg) (Table 9). All other elements of interest (i.e., Ni, Cu, Y, Zr, Nb, Sn and Pb) are typically present at concentrations of less than 100 mg/kg. The majority of magnetite grains analyzed from Gölcük have Ni/Cr ratios of <1, which are very similar to published data for magnetite from andesitic rocks [77], although there are several grains from Gölcük with much higher ratios (i.e., between 1.39 and 4.04) (Figure 14).
Aksu Diamas HMS
Magnetite from the Aksu Diamas placer contains relatively higher concentrations of Ti (1.14–3.12 wt. %), Al (0.364–1.30 wt. %), Mg (0.174–2.18 wt. %), Mn (0.413–0.929 wt. %), and V (0.084–0.200 wt. %) than Gölcük magnetite. Co (52.0–214 mg/kg) concentrations in magnetite from Aksu Diamas are on average lower than those found in Gölcük magnetite (Table 9). Zn (696–1286 mg/kg) and P (76–1350 mg/kg) concentrations are overall higher in magnetite from Aksu Diamas. On average, the concentration of other elements of interest (i.e., Cr, Ni, Cu, Y, Zr, Nb and Sn) is below 100 mg/kg in magnetite from Aksu Diamas. The Ni/Cr ratio for Aksu Diamas magnetite grains ranges between 0.227 and 1.88, although the majority of grains have a Ni/Cr ratio of <1 (Figure 14). This range of Ni/Cr ratio values is consistent with published data for magnetite from intermediate volcanic rocks [77].
5. Discussion
The clearly overlapping composition of the fingerprinting minerals, pyroxene, chevkinite group minerals, zircon and magnetite, both in major and trace element chemistry from the two localities is consistent with the hypothesis that the heavy minerals at Aksu Diamas are sourced from the Gölcük volcano.
5.1. Mineral Chemistry Comparison
5.1.1. Pyroxene
Pyroxene, due to its abundance and resistance to supergene processes, is one of the most important mineral phases for provenance studies and comparison between the Gölcük and Aksu Diamas sites. The Ens-Wol-Fs ternary diagram (Figure 5) shows a clear match between the two sampling sites, with the majority of the analyses plotting within the diopside compositional field. These results are also compared to published data from the Gölcük igneous province (Platevoet et al. [58] and Alıcı et al. [55]) and again a strong agreement is observed, in particular with the Alıcı et al. data [55]. The Gölcük and Aksu Diamas pyroxenes clearly overlap in the enstatite-aegirine-ferrosilite ternary diagram (Figure 6) and also overlap with the data for some of the youngest volcanic rocks from Gölcük [55]. Both data sets show a clear positive correlation between Cr2O3 + TiO2 and Al2O3 (Figure 7). The variability in pyroxene composition across all the samples suggests that each eruption sampled material from different levels in the magma chamber that recorded varying stages of magmatic evolution. Overall, pyroxene from Aksu Diamas records the same compositional variation as those from Gölcük. Furthermore, the chemical zonation of crystals from both localities follows the same pattern of chemical alternation between Fe- or Mg-enriched zones, normally with an Fe-enriched core (Figure 8 and Figure 9).
5.1.2. Chevkinite
The analysis of both sets of samples has revealed the presence of a Ti-REE silicate, belonging to the chevkinite group minerals (CGM). These minerals are a widespread, but very rare, mineral in igneous and metamorphic parageneses [68,78] and exhibit complex chemistry with a wide range of possible element substitutions. The minerals are difficult to identify by optical petrography and it is rare that they occur in sufficient amounts to be listed and described as a significant component of the rocks. CGMs are unlikely to be sourced from the bedrock that surrounds the Aksu Diamas deposit, as these are dominated by sedimentary and ophiolitic lithologies, particularly limestone (Figure 1B). The CGM fractionate the LREE [78], the ΣREE2O3 content of up to 49 wt. %, in some crystals analyzed here, demonstrates their high capacity to concentrate rare earth elements. Although CGM are the most abundant REE-bearing minerals present in the samples, they have not previously been described in detail from the Gölcük volcanic rocks. However, they appear to be resistant to weathering and therefore represent an excellent fingerprinting phase.
Importantly, the set of CGMs analyzed here from the two localities display a very similar compositional range (Figure 10), implying that they originate from the same source. To unambiguously distinguish between different CGMs, crystallographic data is required; however, chevkinite and perrierite can also be differentiated based on their chemistry [68]. Figure 11 presents data points from both localities, with a clear distinction between the two minerals. The stability of perrierite and its relationship to chevkinite are not well known, especially in natural systems [67]. It is however, generally uncommon to find chevkinite and perrierite in the same lithology, with the latter being more common in subalkaline suites, whilst chevkinite is found in alkaline and peralkaline rocks [79]. The origin of the perrierite found both at Gölcük and Aksu Diamas remains unclear; however, its presence in both sample sets is further evidence for a shared source. The CGMs from both Gölcük and Aksu Diamas display a complex and uneven chemical zoning (Figure 12). The origin of the zoning could be related to magma mixing, hydrothermal alteration [79], or grain boundary diffusion of elements and recrystallisation facilitated by metamictisation related to the presence of Th and U [80].
Notably, all crystals analyzed contain vanadium in amounts varying from 0.1–0.94 wt. % V2O5 (Table 5 and Table 6). This element is considered trace, ≤1 wt. % [68] and generally not included in the literature data, being either absent, below the detection limits, or omitted in reporting. Its presence in comparable quantities in both data sets provides another line of evidence for a common source for the CGMs in this study.
5.1.3. Zircon and Magnetite
Geochemical fingerprinting was also performed using trace element concentrations in zircon and magnetite, and there is an excellent match between the data from Aksu Diamas and Gölcük. Notably, the REE pattern of zircon from the two localities (Figure 13) are nearly identical. Other potential sources of zircon in the area are limited to detrital zircon in Miocene–Eocene sediments and zircon in igneous rocks present in the ophiolitic sequences of the Lycian and Antalya nappes. There is no evidence from the geological map for other magmatic sources of zircon in the Isparta region, other than those associated with the Gölcük volcanic complex [81].
Magnetite from Gölcük and Aksu Diamas have overlapping compositions that are dominated by Ti, Mg, Al, V and Mn. The relatively high concentration of Al (up to 2 wt. %) and Ti (up to 3 wt. %) (Table 9) in magnetite from Gölcük and Aksu Diamas indicates a magmatic rather than hydrothermal origin, since hydrothermal magnetite typically contains <1 wt. % Al and <2 wt. % Ti [77]. The concentration of other elements of interest (i.e., Zn, Co, Cr, Ni, Cu, Nb and Sn) are remarkably consistent between the two localities, which indicates that Gölcük is the likely source of the magnetite found in the Aksu Diamas placer. The Ni/Cr ratio of magnetite from both localities is also very consistent, mostly being <1. The Ni/Cr ratios, when plotted against Ti, can also be used to discriminate between magnetite from mafic, intermediate, and felsic magmas. When plotted, magnetite from both localities cluster in the intermediate magma field, which would fit with their derivation from a trachyandesitic volcanic system [77] (Figure 14).
5.2. Formation of the Aksu Diamas Placer Deposit
Although AMR Mineral and Metal, Inc. interpreted the Aksu Diamas deposit as being formed between 7 Ma and 8 Ma using field mapping and structural interpretation, evidence for this interpretation was not detailed in the NI 43-101 report [32]. Volcanic activity at Gölcük began at 4.07 ± 0.20 to 4.7 ± 0.50 Ma [55,56], younger than the age proposed for the Aksu Diamas deposit by AMR. Recent work, however, indicates that the youngest activity at Gölcük occurred at ca. 0.013 Ma [51]. The unconsolidated nature of the sediments at Aksu Diamas is consistent with their being Quaternary in age (i.e., post-dating Pliocene deformation in the Isparta region [46,82]) and thus potentially sourced from the more recent eruptive cycles at Gölcük.
The mineralogical and geochemical evidence presented here strongly support the hypothesis that volcanic activity at Gölcük was the source of the heavy minerals at Aksu Diamas. However, no connected fluvial systems occur between the two localities, as they are separated by the western end of the Taurus Mountain range (Figure 2). We, therefore, consider that the heavy minerals must originally have been transported as airborne particles, before being deposited onto the palaeo-topography (Figure 15).
The intense H2O variations in the magma were responsible for the explosive nature of the eruptions at Gölcük [58], and consequently the extensive development of ash clouds, from which REE-bearing minerals and magnetite were deposited. Volcanic material from Eruptive Cycle III, which formed late tuff-ring deposits at Gölcük [49], was found to form 30–100 cm thick pumice falls in the Isparta and Eğirdir grabens [49]. Evidence from Lake Eğirdir, 35 km northeast of Gölcük, shows that explosive eruptions resulted in the deposition of turbulent pyroclastic surges with large lithic clasts up to 3 cm in diameter [53]. This indicates that eruptions at Gölcük would have had sufficient energy to transport material up to 125 µm diameter over the top of the mountain watershed to basins only 23 km to the south east where Aksu Diamas is located.
Air-borne particles of ash that resulted from the explosive eruptions of Gölcük would have landed as multiple layers of tephra on the surrounding area, including the basin that now hosts the Aksu Diamas deposit and the slopes of the surrounding limestone mountains. The heavy minerals have been preserved in the matrix of lens-shaped channels with angular limestone clasts in a muddy sand matrix in the basin at the foot of the hills. Transport of the heavy minerals is evident from their redistribution into the matrix of the channels (Figure 3d), forming the placer deposits.
The sequence observed at Aksu Diamas is interpreted as a series of episodic mass-flow events. The limestone clasts are interpreted as being locally sourced from the Bey Dağlari limestone (Figure 1B). In contrast, the heavy minerals have been shown to come from the Gölcük volcano, over 23 km away. The poorly-sorted nature and angularity of both the limestone clasts and the heavy mineral grains suggests that the mass-flows deposits have travelled short distances. This fits with a two-phase process for the formation of the Aksu Diamas deposit. Firstly, the airborne transport and deposition of tephra from the Gölcük eruptions, and secondly, local reworking as part of series of mass-flow events. The sequence exposed in the pit is likely part of a larger alluvial fan system, draining locally to the north. Similar Quaternary-aged alluvial fan-systems are typically seen in the Mediterranean [83], the formation of which is attributed to climatic change driven by glacial-interglacial cyclicity [83,84,85].
5.3. Implications for Exploration
In the region around Gölcük and the Aksu Diamas deposit, AMR Minerals, Metals, Inc. identified exploration targets with a strong magnetic geophysical anomaly, similar to the anomaly at Aksu Diamas [32]. Some of these targets were located to the north and east of Gölcük, and others to the south of Aksu Diamas. This implies that tephra may have been widely distributed during past eruptive cycles, and that placer deposition was controlled by the presence of basins and sub-basins where tephra was reworked by alluvial processes.
The identification of this deposit type has implications for other areas in Europe, particularly in the circum-Mediterranean region, where certain factors make it particularly prospective for these types of low-grade REE deposits. Alkaline volcanism acts as the source of the REE-bearing phases, and this type of volcanism generally occurs due to extension following closure of the various strands of the Tethys [39]. Localised sedimentary basins could then act as traps for the heavy minerals. Therefore, tephra from other similar provinces, such as the Italian Roman Volcanic province and southern Italy [86], where there is the potential for these to have been reworked and redeposited, may be considered as prospective targets for low-grade REE mineralization.
The formation of these deposit types is highly dependent on the presence of an explosively erupting alkaline volcano and appropriate geomorphological and climatic conditions. Certain aspects of these deposit types underpin their future potential as REE resources. At Aksu Diamas, the deposit is very low-grade, but considered to be a significant size (454 Mt) and relatively easy to beneficiate. The weakly consolidated nature of the mineralization results in easier mining with water monitors, easy slurry formation, and great potential for water reuse. Gravity separation of the heavy minerals is a relatively low-cost, low-energy technology, which can easily separate out the individual phases. This was demonstrated at the pilot processing plant operated by AMR Minerals and Metals, Inc. at the Aksu Diamas site. In this particular case, the REE are a by-product of iron production, due to the abundance of magnetite in the deposit. This has a further benefit, as the strong magnetic geophysical signature of magnetite allows for relatively easy exploration for similar deposits.
6. Conclusions
The Aksu Diamas iron-REE deposit is an atypical placer deposit containing magnetite and a range of REE minerals, such as chevkinite, perrierite, apatite, allanite, and britholite. Our work shows that the most likely source for the Aksu Diamas deposit is the Gölcük alkaline volcano, some 23 km to the north. A comparative mineralogical and geochemical study of fingerprinting minerals provides compelling evidence for the volcanic provenance of the Aksu Diamas deposit. The deposit was formed when tephra material from Gölcük was reworked into a basin by alluvial processes, concentrating the heavy minerals.
Similar volcanic-derived placer deposits have rarely been described elsewhere, but may represent an important potential resource of the REE. This deposit type may be more common than previously described in the literature and therefore deserves further study. We suggest that such deposits may occur in association with many of the alkaline volcanic provinces in the circum-Mediterranean region.
Supplementary Materials
The following are available online at https://www.mdpi.com/2075-163X/9/4/208/s1, Table S1: Supplementary data_quantitative SEM EDS analysis of pyroxene. Table S2: Supplementary data_LA-ICP-MS magnetite geochemistry.
Author Contributions
Conceptualization, E.D. and K.M.G.; methodology, A.L.; formal analysis, A.L., R.A.S., N.M.W.R; writing—original draft preparation, E.D., A.L.; writing—review and editing, E.D., A.L., K.M.G., R.A.S., N.M.W.R.
Funding
The research leading to these results has received funding from the EURARE project, funded by the European Community’s Seventh Framework Programme ([FP7/2007–2013]) under Grant Agreement No. 309373. This publication reflects only the author’s views, exempting the Community from any liability.
Acknowledgments
The authors would like to thank AMR Minerals and Metals, Inc. for allowing access to the Aksu Diamas exploration site. The authors would like to thank B. Platevoet for discussions regarding Gölcük. The authors would like to thank Simon Chenery for facilitating LA-ICP-MS analysis. The authors would like to thank Mike Styles and Romesh Palamakumbura whose comments strengthened the manuscript and the three anonymous reviewers for their constructive comments. All authors publish with the permission of the Executive Director of the British Geological Survey [UKRI 2019].
Conflicts of Interest
The authors declare no conflict of interest.
References
- Weng, Z.; Jowitt, S.M.; Mudd, G.M.; Haque, N. A detailed assessment of global rare earth element resources: Opportunities and challenges. Econ. Geol. 2015, 110, 1925–1952. [Google Scholar] [CrossRef]
- Verplanck, P.L.; Mariano, A.N.; Mariano, A., Jr. Rare earth element ore geology of carbonatites. Rev. Econ. Geol. 2016, 18, 5–32. [Google Scholar]
- Dostal, J. Rare metal deposits associated with alkaline/peralkaline igneous rocks. Rev. Econ. Geol. 2016, 18, 33–54. [Google Scholar]
- Song, W.; Xu, C.; Smith, M.P.; Chakhmouradian, A.R.; Brenna, M.; Kynický, J.; Chen, W.; Yang, Y.; Deng, M.; Tang, H. Genesis of the world’s largest rare earth element deposit, Bayan Obo, China: Protracted mineralization evolution over∼1 b.y. Geology 2018, 46, 323–326. [Google Scholar] [CrossRef]
- Liu, Y.-L.; Ling, M.-X.; Williams, I.S.; Yang, X.-Y.; Wang, C.Y.; Sun, W. The formation of the giant Bayan Obo REE-Nb-Fe deposit, North China, Mesoproterozoic carbonatite and overprinted Paleozoic dolomitization. Ore Geol. Rev. 2018, 92, 73–83. [Google Scholar] [CrossRef]
- Xie, Y.; Hou, Z.; Goldfarb, R.J.; Guo, X.; Wang, L. Rare earth element deposits in China. Rev. Econ. Geol. 2016, 18, 115–136. [Google Scholar]
- Xie, Y.; Li, Y.; Hou, Z.; Cooke, D.R.; Danyushevsky, L.; Dominy, S.C. Ore Genesis and Deposit Model of Carbonatite-host REE Deposits: The Mianning-Dechang REE Belt, Western Sichuan Province, China. Acta Geol. Sin.-Engl. Ed. 2014, 88, 475–477. [Google Scholar] [CrossRef]
- Hatch, G.P. Dynamics in the global market for rare earths. Elements 2012, 8, 341–346. [Google Scholar] [CrossRef]
- USGS. Mineral Commodity Summary Rare Earths; USGS: Reston, VA, USA, 2018.
- Paulick, H.; Machacek, E. The global rare earth element exploration boom: An analysis of resources outside of China and discussion of development perspectives. Resour. Policy 2017, 52, 134–153. [Google Scholar] [CrossRef]
- Charles, N.; Tuduri, J.; Guyonnet, D.; Melleton, J.; Pourret, O. Rare earth elements in Europe and Greenland: A geological potential? An overview. In Proceedings of the 12th meeting of the Society of Geology Applied to Mineral Deposits (SGA), Uppsala, Sweden, 12–15 August 2013; pp. 12–15. [Google Scholar]
- Goodenough, K.; Schilling, J.; Jonsson, E.; Kalvig, P.; Charles, N.; Tuduri, J.; Deady, E.; Sadeghi, M.; Schiellerup, H.; Müller, A. Europe’s rare earth element resource potential: An overview of REE metallogenetic provinces and their geodynamic setting. Ore Geol. Rev. 2016, 72, 838–856. [Google Scholar] [CrossRef]
- Sanematsu, K.; Watanabe, Y. Characteristics and genesis of ion adsorption-type rare earth element deposits. Rev. Econ. Geol. 2016, 18, 55–79. [Google Scholar]
- Deady, É.A.; Mouchos, E.; Goodenough, K.; Williamson, B.J.; Wall, F. A review of the potential for rare-earth element resources from European red muds: Examples from Seydişehir, Turkey and Parnassus-Giona, Greece. Mineral. Mag. 2016, 80, 43–61. [Google Scholar] [CrossRef]
- Mikulski, S.Z.; Kramarska, R.; Zieliński, G. Rare earth elements pilot studies of the baltic marine sands enriched in heavy minerals. Gospod. Surowcami Miner. 2016, 32, 5–28. [Google Scholar] [CrossRef] [Green Version]
- Kato, Y.; Fujinaga, K.; Nakamura, K.; Takaya, Y.; Kitamura, K.; Ohta, J.; Toda, R.; Nakashima, T.; Iwamori, H. Deep-sea mud in the Pacific Ocean as a potential resource for rare-earth elements. Nat. Geosci. 2011, 4, 535. [Google Scholar] [CrossRef]
- Jowitt, S.M.; Medlin, C.C.; Cas, R.A.F. The rare earth element (REE) mineralization potential of highly fractionated rhyolites: A potential low-grade, bulk tonnage source of critical metals. Ore Geol. Rev. 2017, 86, 548–562. [Google Scholar] [CrossRef]
- Menendez, A.; James, R.H.; Roberts, S.; Peel, K.; Connelly, D. Controls on the distribution of rare earth elements in deep-sea sediments in the North Atlantic Ocean. Ore Geol. Rev. 2017, 87, 100–113. [Google Scholar] [CrossRef]
- Emsbo, P.; McLaughlin, P.I.; du Bray, E.A.; Anderson, E.D.; Vandenbroucke, T.; Zielinski, R.A. Rare earth elements in sedimentary phosphorite deposits: A global assessment. In Rare Earth and Critical Elements in Ore Deposits; Society of Economic Geologists: Littleton, CO, USA, 2016; Volume 18, pp. 101–113. [Google Scholar]
- Sengupta, D.; Van Gosen, B.S. Placer-type rare earth element deposits. Rev. Econ. Geol. 2016, 18, 81–100. [Google Scholar]
- Rose, E.R. Rare Earths of the Grenville Sub-Province, Ontario and Quebec; Department of Mines and Technical Surveys: Ottawa, ON, Canada, 1960.
- Jaireth, S.; Hoatson, D.M.; Miezitis, Y. Geological setting and resources of the major rare-earth-element deposits in Australia. Ore Geol. Rev. 2014, 62, 72–128. [Google Scholar] [CrossRef]
- Schwartz, M.O.; Rajah, S.S.; Askury, A.K.; Putthapiban, P.; Djaswadi, S. The southeast Asian tin belt. Earth-Sci. Rev. 1995, 38, 95–293. [Google Scholar] [CrossRef]
- Stanaway, K.J. Ten placer deposit models from five sedimentary environments. Appl. Earth Sci. 2012, 121, 43–51. [Google Scholar] [CrossRef]
- Elsner, H. Heavy Minerals of Economic Importance; Bundesanstalt für Geowissenschaften und Rohstoffe (BGR): Hannover, Germany, 2009. [Google Scholar]
- Dill, H.G. Heavy minerals from ore guide to the deposit. Appl. Earth Sci. 2016, 125, 80–81. [Google Scholar] [CrossRef]
- Wall, F.; Rollat, A.; Pell, R.S. Responsible Sourcing of Critical Metals. Elements 2017, 13, 313–318. [Google Scholar] [CrossRef] [Green Version]
- Goodenough, K.M.; Wall, F.; Merriman, D. The Rare Earth Elements: Demand, Global Resources, and Challenges for Resourcing Future Generations. Nat. Resour. Res. 2017. [Google Scholar] [CrossRef]
- Sulekha Rao, N.; Sengupta, D.; Guin, R.; Saha, S.K. Natural radioactivity measurements in beach sand along southern coast of Orissa, eastern India. Environ. Earth Sci. 2009, 59, 593–601. [Google Scholar] [CrossRef]
- Bonatti, S.A.G. Perrierite, nuovo minerale ritrovato nella sabbia di Nettuno (Roma). Atti Rendconti Accad. Lincei 1950, 9, 361–368. [Google Scholar]
- Clerici, C.; Morandini, A.F. Aspects of marine placer minerals: Economic potential of coastal deposits in Italy, testing procedures and market conditions. In Marine Minerals; Springer: Berlin/Heidelberg, Germany, 1987; pp. 515–532. [Google Scholar]
- RPA. Technical Report on the Aksu Diamas Rare Earth Elements and Minor Metals, Isparta District, Southwest Turkey, NI 43-101 Report. 2013. Available online: http://amrmineral.com/download/corporate/AMR_Aksu_Diamas_REE_NI43-101_PEA_May_6_2013_FINAL.pdf (accessed on 6 May 2013).
- AMEC. NI 43-101 Technical Report on the Aksu Diamas Rare Earth Element Project, Isparta District, Turkey. 2011. Available online: http://eurare.brgm-rec.fr/node/46505 (accessed on 1 January 2011).
- Robertson, A.H.F.; Parlak, O.; Ustaömer, T. Overview of the Palaeozoic–Neogene evolution of Neotethys in the Eastern Mediterranean region (southern Turkey, Cyprus, Syria). Pet. Geosci. 2012, 18, 381–404. [Google Scholar] [CrossRef]
- Robertson, A.H.F. Overview of tectonic settings related to the rifting and opening of Mesozoic ocean basins in the Eastern Tethys: Oman, Himalayas and Eastern Mediterranean regions. Geol. Soc. Lond. Spec. Publ. 2007, 282, 325–388. [Google Scholar] [CrossRef]
- Yilmaz, Y. New evidence and model on the evolution of the southeast Anatolian orogen. Geol. Soc. Am. Bull. 1993, 105, 251–271. [Google Scholar] [CrossRef]
- Yürür, M.T.; Chorowicz, J. Recent volcanism, tectonics and plate kinematics near the junction of the African, Arabian and Anatolian plates in the eastern Mediterranean. J. Volcanol. Geotherm. Res. 1998, 85, 1–15. [Google Scholar] [CrossRef] [Green Version]
- Koç, A.; Kaymakci, N.; van Hinsbergen, D.J.J.; Vissers, R.L.M. A Miocene onset of the modern extensional regime in the Isparta Angle: Constraints from the Yalvaç Basin (southwest Turkey). Int. J. Earth Sci. 2016, 105, 369–398. [Google Scholar] [CrossRef]
- Lustrino, M.; Wilson, M. The circum-Mediterranean anorogenic Cenozoic igneous province. Earth-Sci. Rev. 2007, 81, 1–65. [Google Scholar] [CrossRef]
- Prelević, D.; Akal, C.; Romer, R.L.; Mertz-Kraus, R.; Helvacı, C. Magmatic Response to Slab Tearing: Constraints from the Afyon Alkaline Volcanic Complex, Western Turkey. J. Petrol. 2015, 56, 527–562. [Google Scholar] [CrossRef] [Green Version]
- Berk Biryol, C.; Beck, S.L.; Zandt, G.; Özacar, A.A. Segmented African lithosphere beneath the Anatolian region inferred from teleseismic P-wave tomography. Geophys. J. Int. 2011, 184, 1037–1057. [Google Scholar] [CrossRef] [Green Version]
- Özacar, A.; Biryol, C.B.; Beck, S.; Zandt, G.; Kaymakci, N.; Dilek, Y.; Bozkurt, E. Crust and upper mantle dynamics of Turkey inferred from passive seismology: Implications of segmented slab geometry. In Tectonic Crossroads: Evolving Orogens of Eurasia–Africa–Arabia, BTH23; Middle East Technical University: Ankara, Turkey, 2010; pp. 20–23. [Google Scholar]
- Karaoğlu, Ö.; Helvacı, C. Isotopic evidence for a transition from subduction to slab-tear related volcanism in western Anatolia, Turkey. Lithos 2014, 192–195, 226–239. [Google Scholar] [CrossRef]
- Francalanci, L.; Innocenti, F.; Manetti, P.; Savasçin, M. Neogene alkaline volcanism of the Afyon-Isparta area, Turkey: Petrogenesis and geodynamic implications. Mineral. Petrol. 2000, 70, 285–312. [Google Scholar] [CrossRef]
- Dilek, Y.; Altunkaynak, Ş. Geochemistry of Neogene–Quaternary alkaline volcanism in western Anatolia, Turkey, and implications for the Aegean mantle. Int. Geol. Rev. 2010, 52, 631–655. [Google Scholar] [CrossRef]
- Poisson, A.; Yağmurlu, F.; Bozcu, M.; Şentürk, M. New insights on the tectonic setting and evolution around the apex of the Isparta Angle (SW Turkey). Geol. J. 2003, 38, 257–282. [Google Scholar] [CrossRef]
- Şenel, M. Geological Map of Turkey in 1/500.000 Scale: Konya Sheet; Publication of Mineral Research and Exploration Directorate of Turkey (MTA): Ankara, Turkey, 2002. [Google Scholar]
- Nielsen, J.K.; Görmüş, M.; Uysal, K.; Kanbur, S. First records of trace fossils from the Lake District, southwestern Turkey. Bull. Geosci. 2010, 85, 691–708. [Google Scholar] [CrossRef]
- Platevoet, B.; Scaillet, S.; Guillou, H.; Blamart, D.; Nomade, S.; Massault, M.; Poisson, A.; Elitok, Ö.; Özgür, N.; Yagmurlu, F. Pleistocene eruptive chronology of the Gölcük volcano, Isparta Angle, Turkey. Quat. Rev. De L’association Française Pour L’étude Du Quat. 2008, 19, 147–156. [Google Scholar] [CrossRef]
- Collins, A.S.; Robertson, A.H.F. Lycian melange, southwestern Turkey: An emplaced Late Cretaceous accretionary complex. Geology 1997, 25, 255–258. [Google Scholar] [CrossRef]
- Schmitt, A.K.; Danišík, M.; Siebel, W.; Elitok, Ö.; Chang, Y.W.; Shen, C.C. Late Pleistocene zircon ages for intracaldera domes at Gölcük (Isparta, Turkey). J. Volcanol. Geotherm. Res. 2014, 286, 24–29. [Google Scholar] [CrossRef]
- Cengiz, O.; Sener, E.; Yagmurlu, F. A satellite image approach to the study of lineaments, circular structures and regional geology in the Golcuk Crater district and its environs (Isparta, SW Turkey). J. Asian Earth Sci. 2006, 27, 155–163. [Google Scholar] [CrossRef]
- Nemec, W.; Kazanici, N.; Mitchell, J.G. Pleistocene explosions and pyroclastic currents in west-central Anatolia. Boreas 1998, 27, 311–332. [Google Scholar] [CrossRef]
- Kumral, M.; Çoban, H.; Caran, Ş. Th-, U-and LREE-bearing grossular, chromian ferriallanite-(Ce) and chromian cerite-(Ce) in skarn xenoliths ejected from the Gölcük Maar Crater, Isparta, Anatolia, Turkey. Can. Mineral. 2007, 45, 1115–1129. [Google Scholar] [CrossRef]
- Alıcı, P.; Temel, A.; Gourgaud, A.; Kieffer, G.; Gundogdu, M.N. Petrology and geochemistry of potassic rocks in the Gölcük area (Isparta, SW Turkey): Genesis of enriched alkaline magmas. J. Volcanol. Geotherm. Res. 1998, 85, 423–446. [Google Scholar] [CrossRef]
- Lefevre, C.; Bellon, H.; Poisson, A. Présence de leucitites dans le volcanisme Pliocene de la region d’Isparta (Taurides occidentales, Turquie). C. R. Des Séances De L’académie Des Sciences. Série 2mécanique-Phys. Chim. Sci. De L’universsciences De La Terre 1983, 297, 367–372. [Google Scholar]
- Özgür, N.; Pekdeger, A.; Schneider, H.; Bilgin, A. Pliocene volcanism in the Gölçük area, Isparta/western Taurides. In Proceedings of the IESCA, 1990 Proceedings, Izmir, Turkey, 1–6 October 1990; pp. 411–419. [Google Scholar]
- Platevoet, B.; Elitok, Ö.; Guillou, H.; Bardintzeff, J.M.; Yagmurlu, F.; Nomade, S.; Poisson, A.; Deniel, C.; Özgür, N. Petrology of Quaternary volcanic rocks and related plutonic xenoliths from Gölcük volcano, Isparta Angle, Turkey: Origin and evolution of the high-K alkaline series. J. Asian Earth Sci. 2014, 92, 53–76. [Google Scholar] [CrossRef]
- Dolmaz, M.; Oksum, E.; Erbek, E.; Tutunsatar, H.; Elitok, O. The nature and origin of magnetic anomalies over the Gölcük caldera; Isparta; South-Western Turkey. Geofiz. Zhurnal 2018, 40, 145–156. [Google Scholar] [CrossRef]
- Elitok, Ö.; Özgür, N.; Drüppel, K.; Dilek, Y.; Platevoet, B.; Guillou, H.; Poisson, A.; Scaillet, S.; Satır, M.; Siebel, W. Origin and geodynamic evolution of late Cenozoic potassium-rich volcanism in the Isparta area, southwestern Turkey. Int. Geol. Rev. 2010, 52, 454–504. [Google Scholar] [CrossRef]
- Dilek, Y.; Imamverdiyev, N.; Altunkaynak, Ş. Geochemistry and tectonics of Cenozoic volcanism in the Lesser Caucasus (Azerbaijan) and the peri-Arabian region: Collision-induced mantle dynamics and its magmatic fingerprint. Int. Geol. Rev. 2010, 52, 536–578. [Google Scholar] [CrossRef]
- Kalyoncuoglu, U.Y. In situ gamma source radioactivity measurement in Isparta plain, Turkey. Environ. Earth Sci. 2015, 73, 3159–3175. [Google Scholar] [CrossRef]
- Alçiçek, M.C.; Brogi, A.; Capezzuoli, E.; Liotta, D.; Meccheri, M. Superimposed basin formation during Neogene–Quaternary extensional tectonics in SW-Anatolia (Turkey): Insights from the kinematics of the Dinar Fault Zone. Tectonophysics 2013, 608, 713–727. [Google Scholar] [CrossRef]
- Deer, W.A.; Howie, R.A.; Zussman, J. An Introduction to The Rock-Forming Minerals, 2nd ed.; Pearson: London, UK, 1992. [Google Scholar]
- Lacinska, A.M.; Rushton, J.C. The effect of X-ray energy overlaps on the results of chevkinite (Ce,La,Ca,Th)4(Fe2+, Mg)2(Ti, Fe3+)3Si4O22 microanalysis using SEM EDS-WDS. In Proceedings of the EMAS 2018, Microbeam Analysis in Earth Sciences, Bristol, UK, 4–7 September 2018. [Google Scholar]
- Gottardi, G. The crystal structure of perrierite. Am. Mineral. 1960, 45, 1–14. [Google Scholar]
- Parodi, G.; Ventura, G.; Mottana, A.; Raudsepp, M. Zr-rich non metamict perrierite-(Ce) from holocrystalline ejecta in the Sabatini volcanic complex (Latium, Italy). Mineral. Mag. 1994, 58, 607–614. [Google Scholar] [CrossRef]
- MacDonald, R.; Belkin, H. Compositional variation in minerals of the chevkinite group. Mineral. Mag. 2002, 66, 1075–1098. [Google Scholar] [CrossRef]
- Haggerty, S.E.; Mariano, A.N. Strontian-loparite and strontio-chevkinite: Two new minerals in rheomorphic fenites from the Paraná Basin carbonatites, South America. Contrib. Mineral. Petrol. 1983, 84, 365–381. [Google Scholar] [CrossRef]
- Wiedenbeck, M.; Hanchar, J.M.; Peck, W.H.; Sylvester, P.; Valley, J.; Whitehouse, M.; Kronz, A.; Morishita, Y.; Nasdala, L.; Fiebig, J.; et al. Further Characterisation of the 91500 Zircon Crystal. Geostand. Geoanalytical Res. 2004, 28, 9–39. [Google Scholar] [CrossRef]
- Jackson, S.E.; Pearson, N.J.; Griffin, W.L.; Belousova, E.A. The application of laser ablation-inductively coupled plasma-mass spectrometry to in situ U–Pb zircon geochronology. Chem. Geol. 2004, 211, 47–69. [Google Scholar] [CrossRef]
- Paton, C.; Hellstrom, J.; Paul, B.; Woodhead, J.; Hergt, J. Iolite: Freeware for the visualisation and processing of mass spectrometric data. J. Anal. At. Spectrom. 2011, 26, 2508–2518. [Google Scholar] [CrossRef]
- Jochum, K.P.; Weis, U.; Stoll, B.; Kuzmin, D.; Yang, Q.; Raczek, I.; Jacob, D.E.; Stracke, A.; Birbaum, K.; Frick, D.A. Determination of reference values for NIST SRM 610–617 glasses following ISO guidelines. Geostand. Geoanal. Res. 2011, 35, 397–429. [Google Scholar] [CrossRef]
- Sun, S.-S.; McDonough, W.-S. Chemical and isotopic systematics of oceanic basalts: Implications for mantle composition and processes. Geol. Soc. Lond. Spec. Publ. 1989, 42, 313–345. [Google Scholar] [CrossRef]
- Belousova, E.; Griffin, W.L.; O’Reilly, S.Y.; Fisher, N. Igneous zircon: Trace element composition as an indicator of source rock type. Contrib. Mineral. Petrol. 2002, 143, 602–622. [Google Scholar] [CrossRef]
- Rubatto, D. Zircon: The metamorphic mineral. Rev. Mineral. Geochem. 2017, 83, 261–295. [Google Scholar] [CrossRef]
- Dare, S.A.; Barnes, S.-J.; Beaudoin, G.; Méric, J.; Boutroy, E.; Potvin-Doucet, C. Trace elements in magnetite as petrogenetic indicators. Miner. Depos. 2014, 49, 785–796. [Google Scholar] [CrossRef]
- Bagiński, B.; Macdonald, R. The chevkinite group: Underestimated accessory phases from a wide range of parageneses. Mineralogia 2013, 44, 99–114. [Google Scholar] [CrossRef]
- Macdonald, R.; Bagiñski, B.; Dzierżanowski, P.; Fettes, D.J.; Upton, B.G. Chevkinite-group minerals in UK Palaeogene granites: Underestimated REE-bearing accessory phases. Can. Mineral. 2013, 51, 333–347. [Google Scholar] [CrossRef]
- Sokolova, E.; Hawthorne, F.C.; Della Ventura, G.; Kartashov, P.M. Chevkinite-(Ce): Crystal structure and the effect of moderate radiation-induced damage on site-occupancy refinement. Can. Mineral. 2004, 42, 1013–1025. [Google Scholar] [CrossRef]
- Şenel, M. 1:250 000 Ölçekli Türkiye Jeoloji Haritaları No: 4 Isparta Paftası; Maden Tetkik ve Arama Genel Müdürlüğü: Istanbul, Turkey, 1997.
- Poisson, A.; Wernli, R.; Saǧular, E.K.; Temi̇ż, H. New data concerning the age of the Aksu Thrust in the south of the Aksu valley, Isparta Angle (SW Turkey): Consequences for the Antalya Basin and the Eastern Mediterranean. Geol. J. 2003, 38, 311–327. [Google Scholar] [CrossRef]
- Harvey, A.M. The relationships between alluvial fans and fan channels within Mediterranean mountain fluvial systems. In Dryland Rivers: Hydrology and Geomorphology of Semi-Arid Channels; John Wiley & Sons, Inc.: Hoboken, NJ, USA, 2002; pp. 205–226. [Google Scholar]
- Macklin, M.; Fuller, I.; Lewin, J.; Maas, G.; Passmore, D.; Rose, J.; Woodward, J.; Black, S.; Hamlin, R.; Rowan, J. Correlation of fluvial sequences in the Mediterranean basin over the last 200 ka and their relationship to climate change. Quat. Sci. Rev. 2002, 21, 1633–1641. [Google Scholar] [CrossRef]
- Siddall, M.; Chappell, J.; Potter, E.-K. 7. Eustatic sea level during past interglacials. In Developments in Quaternary Sciences; Elsevier: Amsterdam, The Netherlands, 2007; Volume 7, pp. 75–92. [Google Scholar]
- Stoppa, F.; Pirajno, F.; Schiazza, M.; Vladykin, N.V. State of the art: Italian carbonatites and their potential for critical-metal deposits. Gondwana Res. 2016, 37, 152–171. [Google Scholar] [CrossRef]
Figure 1.
(A) Regional map of Turkey showing the location of Gölcük and Aksu Diamas. (B) Simplified geological map of the region from Şenel et al. [47], Poisson et al. [46] and Nielsen et al. [48] and references therein. Base map data SRTM 1 Arc-Second Global available from the U.S. Geological Survey Earth Explorer. (C) Geological map of the Gölcük igneous province from Platevoet et al. [49].

Figure 2.
3D image of the Gölcük maar crater, mountain range and the basin that hosts the Aksu Diamas deposit to the south. Vertical exaggeration of 2 © Google Earth. [Image Landsat, Copernicus/mage © 2018 Digital Globe/Image ©2018 CNES, Airbus/Data SIO, NOOA, U.S. Navy, GEBCO].
Figure 2.
3D image of the Gölcük maar crater, mountain range and the basin that hosts the Aksu Diamas deposit to the south. Vertical exaggeration of 2 © Google Earth. [Image Landsat, Copernicus/mage © 2018 Digital Globe/Image ©2018 CNES, Airbus/Data SIO, NOOA, U.S. Navy, GEBCO].

Figure 3.
(a) Exposure of pumice-rich layers of unconsolidated tuff of Eruptive Cycle III at Gölcük (after [58]). (b) Finer-grained unconsolidated tuff layers of Eruptive Cycle III (after [58]). (c) Graded layering in unconsolidated tuff with pumice-rich layers of Eruptive Cycle III (after [58]). (d) Exposure of the Aksu Diamas exploration pit wall, with outlines of gravel lenses highlighted with black dashed lines.

Figure 4.
(a) A SEM BSE image of a typical heavy mineral separate from Gölcük volcanic ash (MPLV059). (b) A SEM BSE image of a typical heavy mineral separate from the Aksu Diamas pit (MPLV049). Mag—magnetite, Ap—apatite, Cpx—clinopyroxene, Amp—amphibole, V Gls—volcanic glass, Ttn—titanite, Adr—andradite, Chvt—chevkinite, Zrn—zircon.

Figure 5.
Ternary enstatite-wollastonite-ferrosilite diagram for all pyroxene. Quantitative SEM-EDS results (Table S1; Supplementary Materials), along with literature data [55,58], shows a clear agreement between the Aksu Diamas Pit and the Gölcük Volcano sampling sites.
Figure 5.
Ternary enstatite-wollastonite-ferrosilite diagram for all pyroxene. Quantitative SEM-EDS results (Table S1; Supplementary Materials), along with literature data [55,58], shows a clear agreement between the Aksu Diamas Pit and the Gölcük Volcano sampling sites.

Figure 6.
Clinopyroxene data from the Gölcük and the Aksu Diamas HMS plotted in the enstatite-ferrosilite-aegirine triangle and compared against pyroxene data from the volcanic rocks reported in Platevoet et al. [58] and Alici et al. [55].

Figure 7.
Comparison of minor element content for pyroxene crystals from the Gölcük Volcano and Aksu Diamas deposit, with literature data from [58].
Figure 7.
Comparison of minor element content for pyroxene crystals from the Gölcük Volcano and Aksu Diamas deposit, with literature data from [58].

Figure 8.
X-ray element maps for a crystal of pyroxene from the Gölcük sample of MPLV059. The pyroxene is surrounded by volcanic glass, indicated by higher Si, Al and alkalis, shown in spectrum 1. The two inclusions present in the pyroxene are magnetite (brighter under BSE) and a Ti-rich amphibole (darker under BSE).

Figure 9.
X-ray element maps for a crystal of pyroxene from the Aksu Diamas HMS. The <5 µm BSE bright inclusion in the bottom right of the pyroxene crystal is apatite.
Figure 9.
X-ray element maps for a crystal of pyroxene from the Aksu Diamas HMS. The <5 µm BSE bright inclusion in the bottom right of the pyroxene crystal is apatite.

Figure 10.
Comparison of the ΣREE vs. Σ(Ca, Ti, Zr) for the chevkinite group minerals from the Gölcük Volcano and Aksu Diamas deposit (EDS data, excluding Ba).
Figure 10.
Comparison of the ΣREE vs. Σ(Ca, Ti, Zr) for the chevkinite group minerals from the Gölcük Volcano and Aksu Diamas deposit (EDS data, excluding Ba).

Figure 11.
A chemical discrimination between chevkinite and perrierite based on CaO and FeO content, with samples from both Gölcük and Aksu Diamas plotted. Chevkinite plots in the left-hand side of the graph with significantly more FeO and less CaO than perrierite. The dashed line separating the chevkinite from perrierite is based on data presented in MacDonald and Belkin, 2002 [68].

Figure 12.
Zoned crystals of CGMs from (A) CGM from Gölcük Volcano, the bright BSE inclusions are uranium oxide. (B) CGM from Aksu Diamas Pit. The EDS spectrum shows the general crystal chemistry of a CGM. The chemical zoning is chiefly related to variable amounts of FeO and ThO2.
Figure 12.
Zoned crystals of CGMs from (A) CGM from Gölcük Volcano, the bright BSE inclusions are uranium oxide. (B) CGM from Aksu Diamas Pit. The EDS spectrum shows the general crystal chemistry of a CGM. The chemical zoning is chiefly related to variable amounts of FeO and ThO2.

Figure 13.
Chondrite normalized [74] REE data for zircon in samples from Gölcük (blue) and Aksu Diamas (red). Chondrite normalized [74] REE (median values) in typical alkaline syenite and larvikite zircons plotted for comparison [75].

Figure 14.
Plot of Ti (mg/kg) versus Ni/Cr in magnetite confirming that the magmatic source of magnetite from Gölcük and Aksu are magmatic in origin [77].
Figure 14.
Plot of Ti (mg/kg) versus Ni/Cr in magnetite confirming that the magmatic source of magnetite from Gölcük and Aksu are magmatic in origin [77].

Figure 15.
Formation of the Aksu Diamas deposit, post Plio-Quaternary eruption of the Gölcük volcano, shown schematically.
Figure 15.
Formation of the Aksu Diamas deposit, post Plio-Quaternary eruption of the Gölcük volcano, shown schematically.


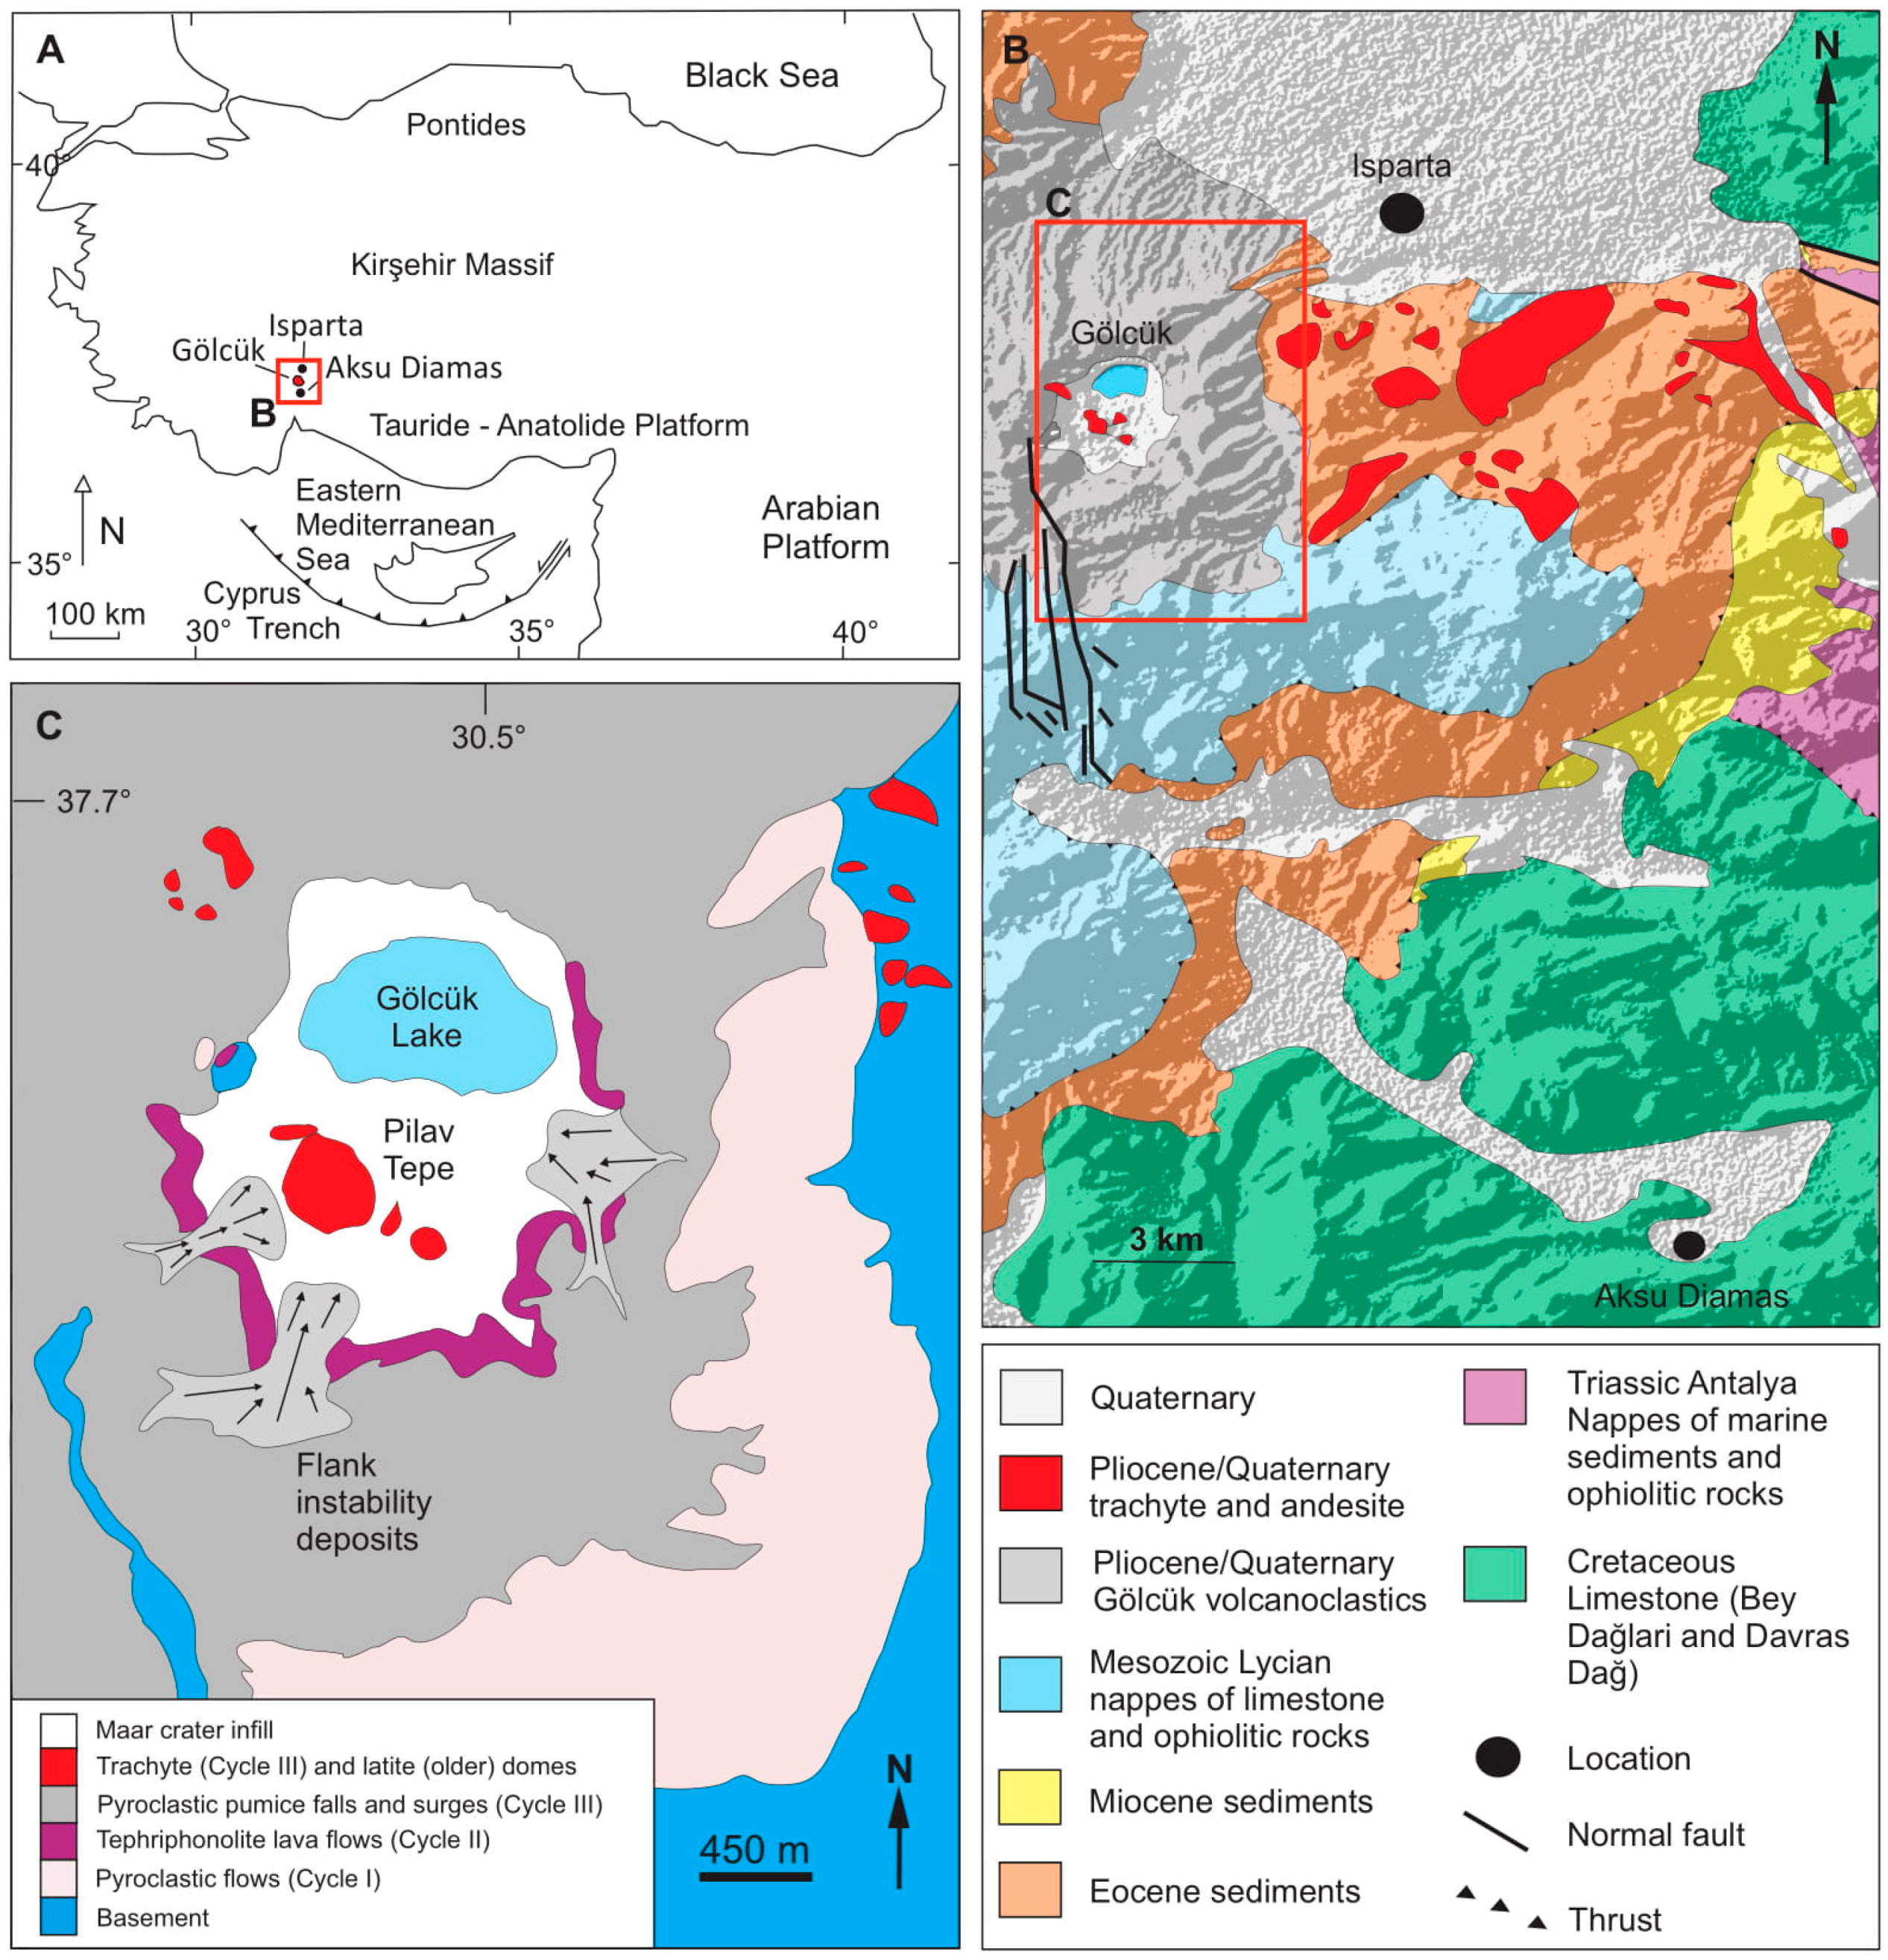
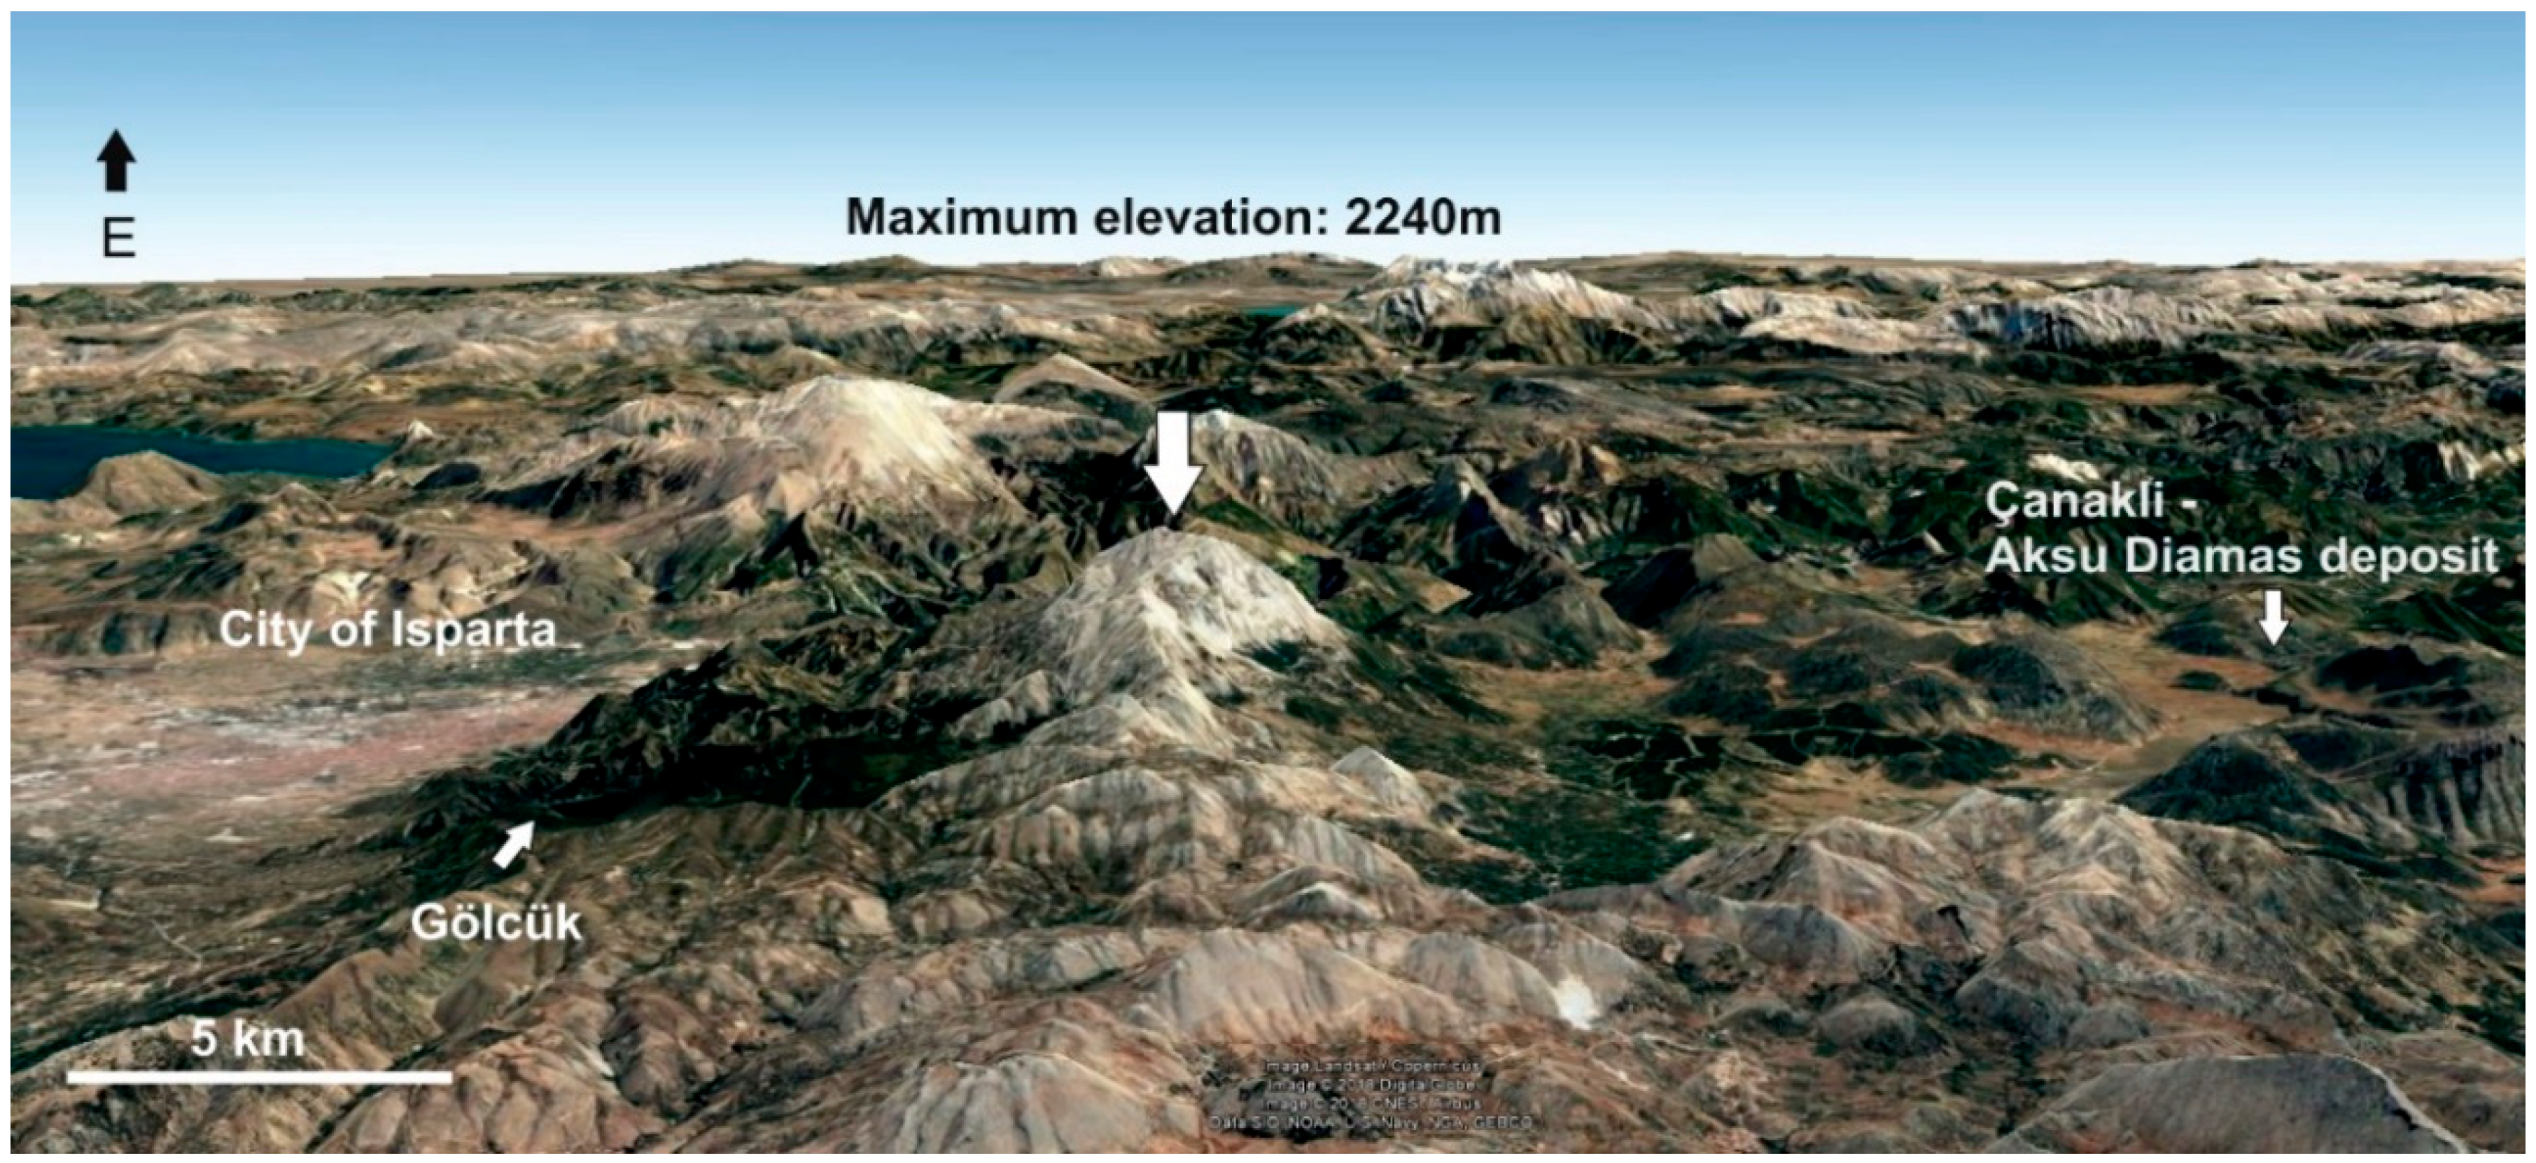
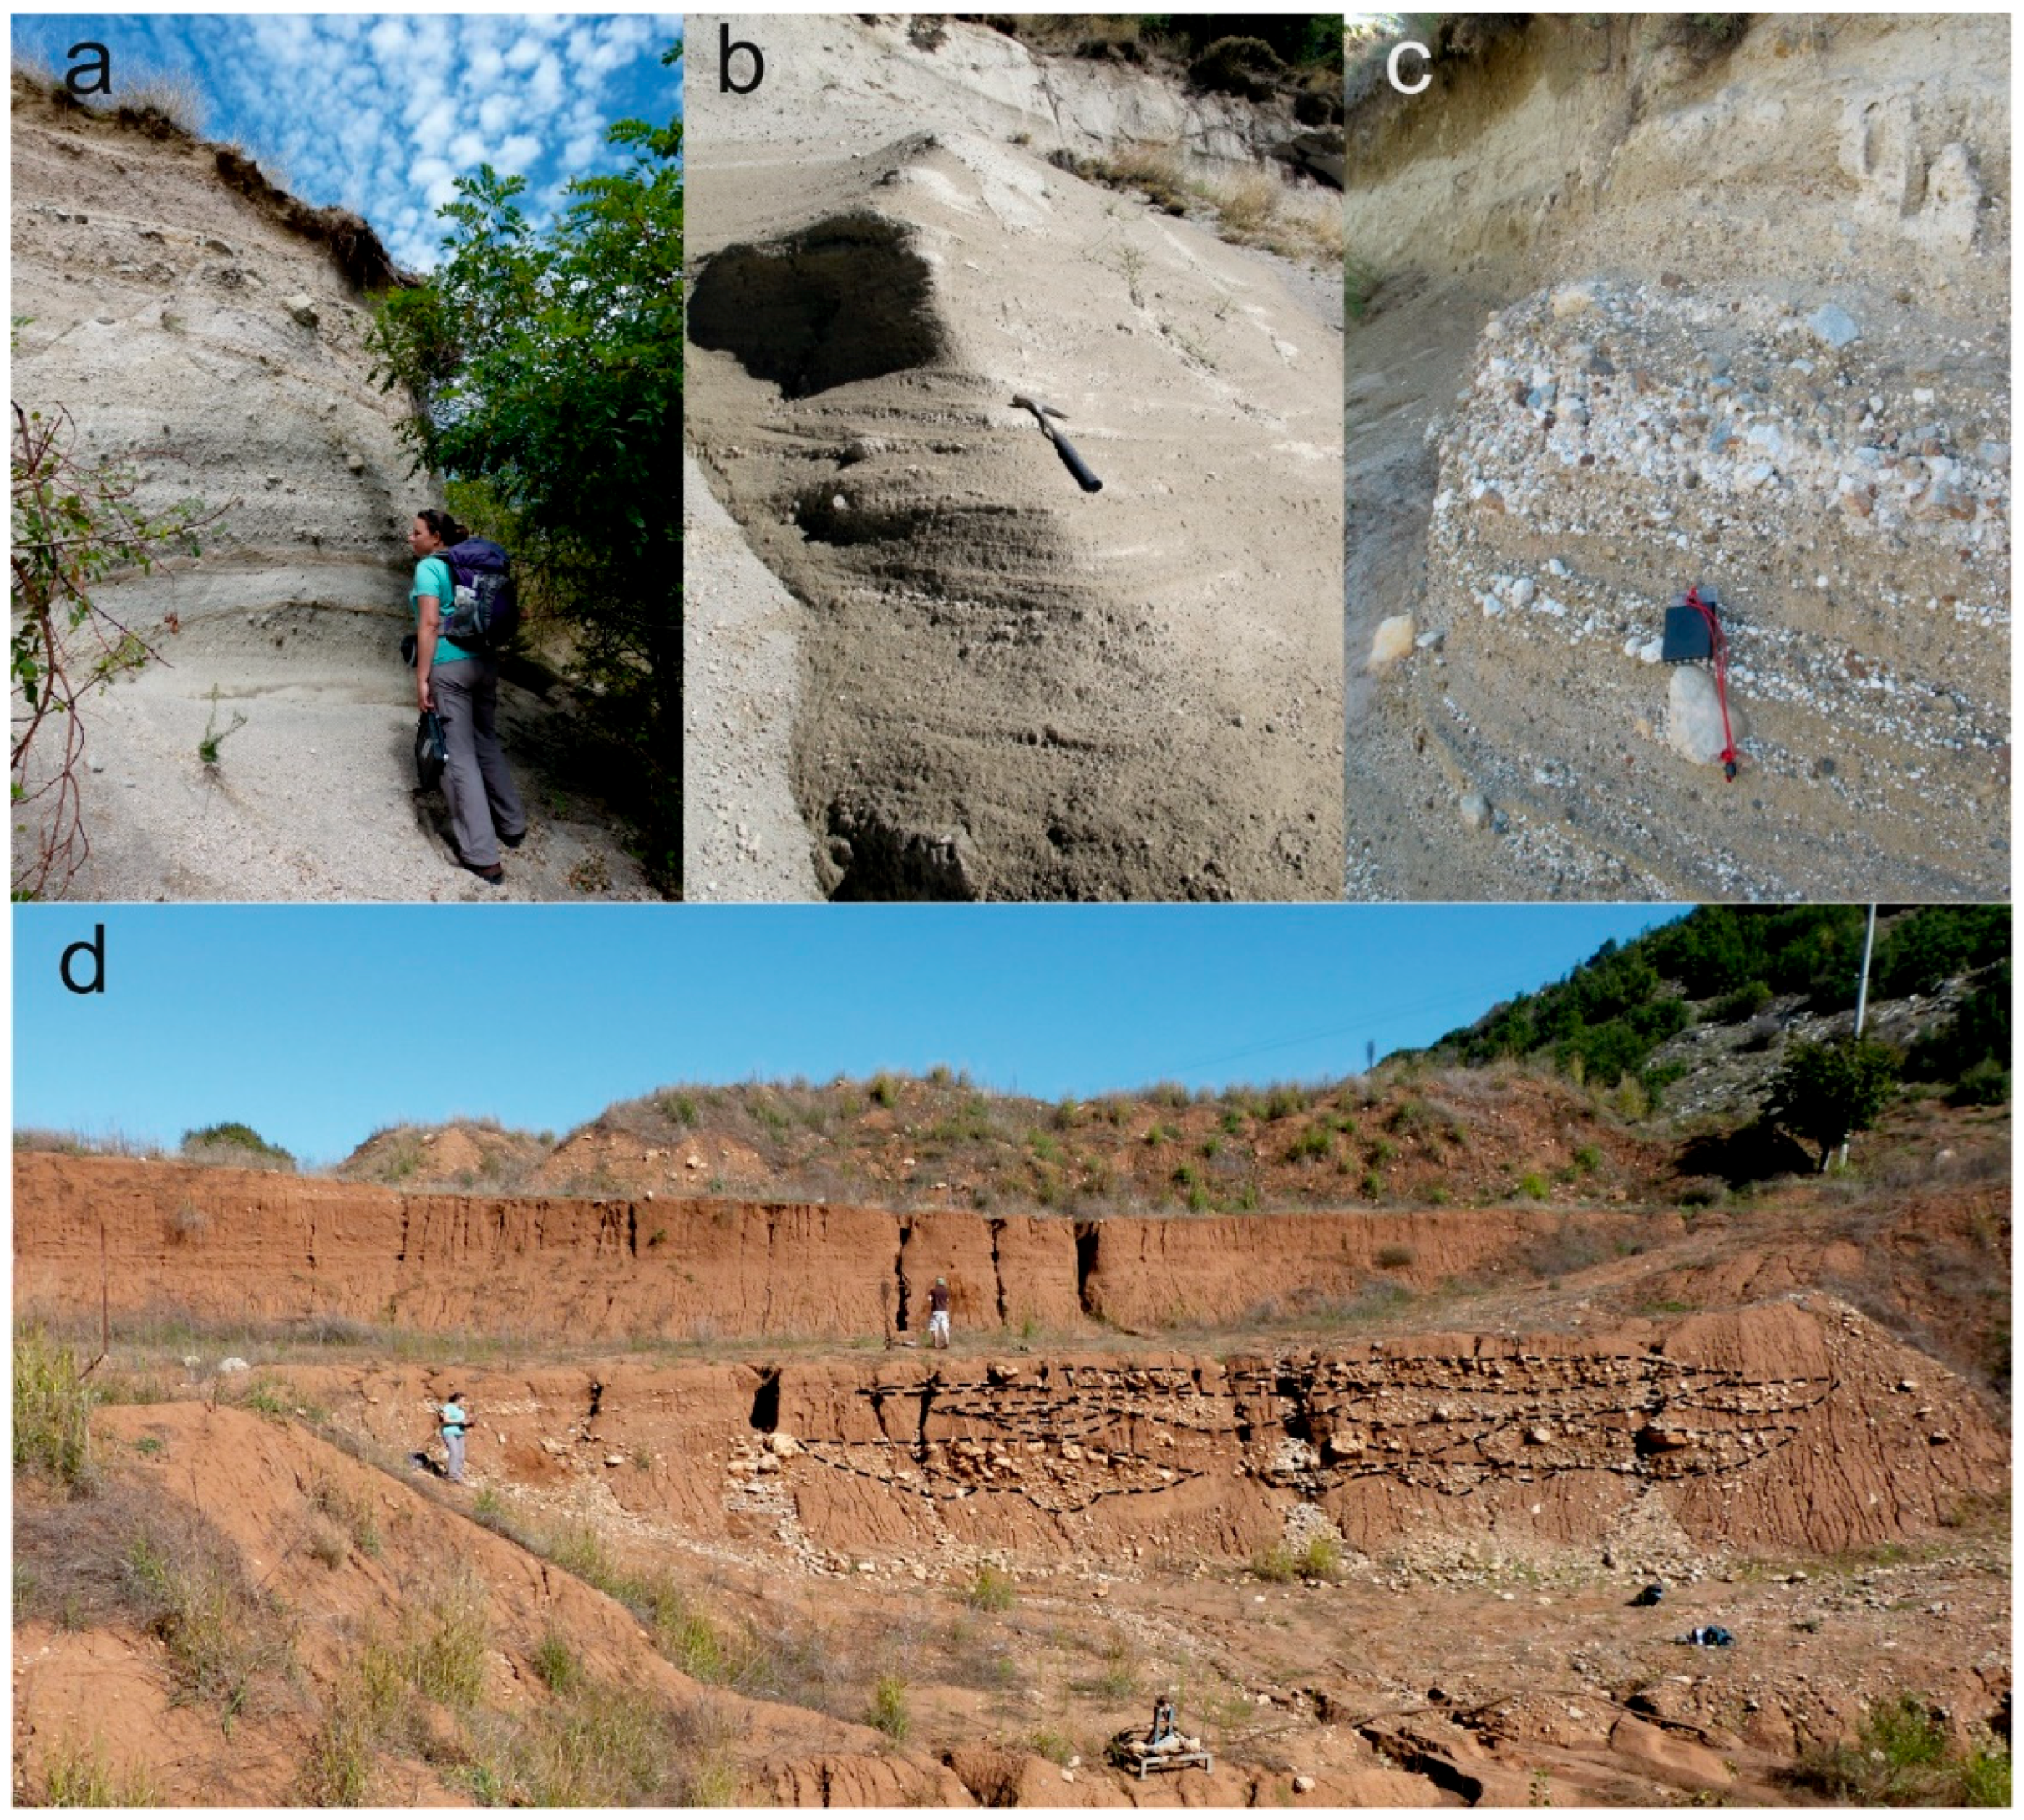
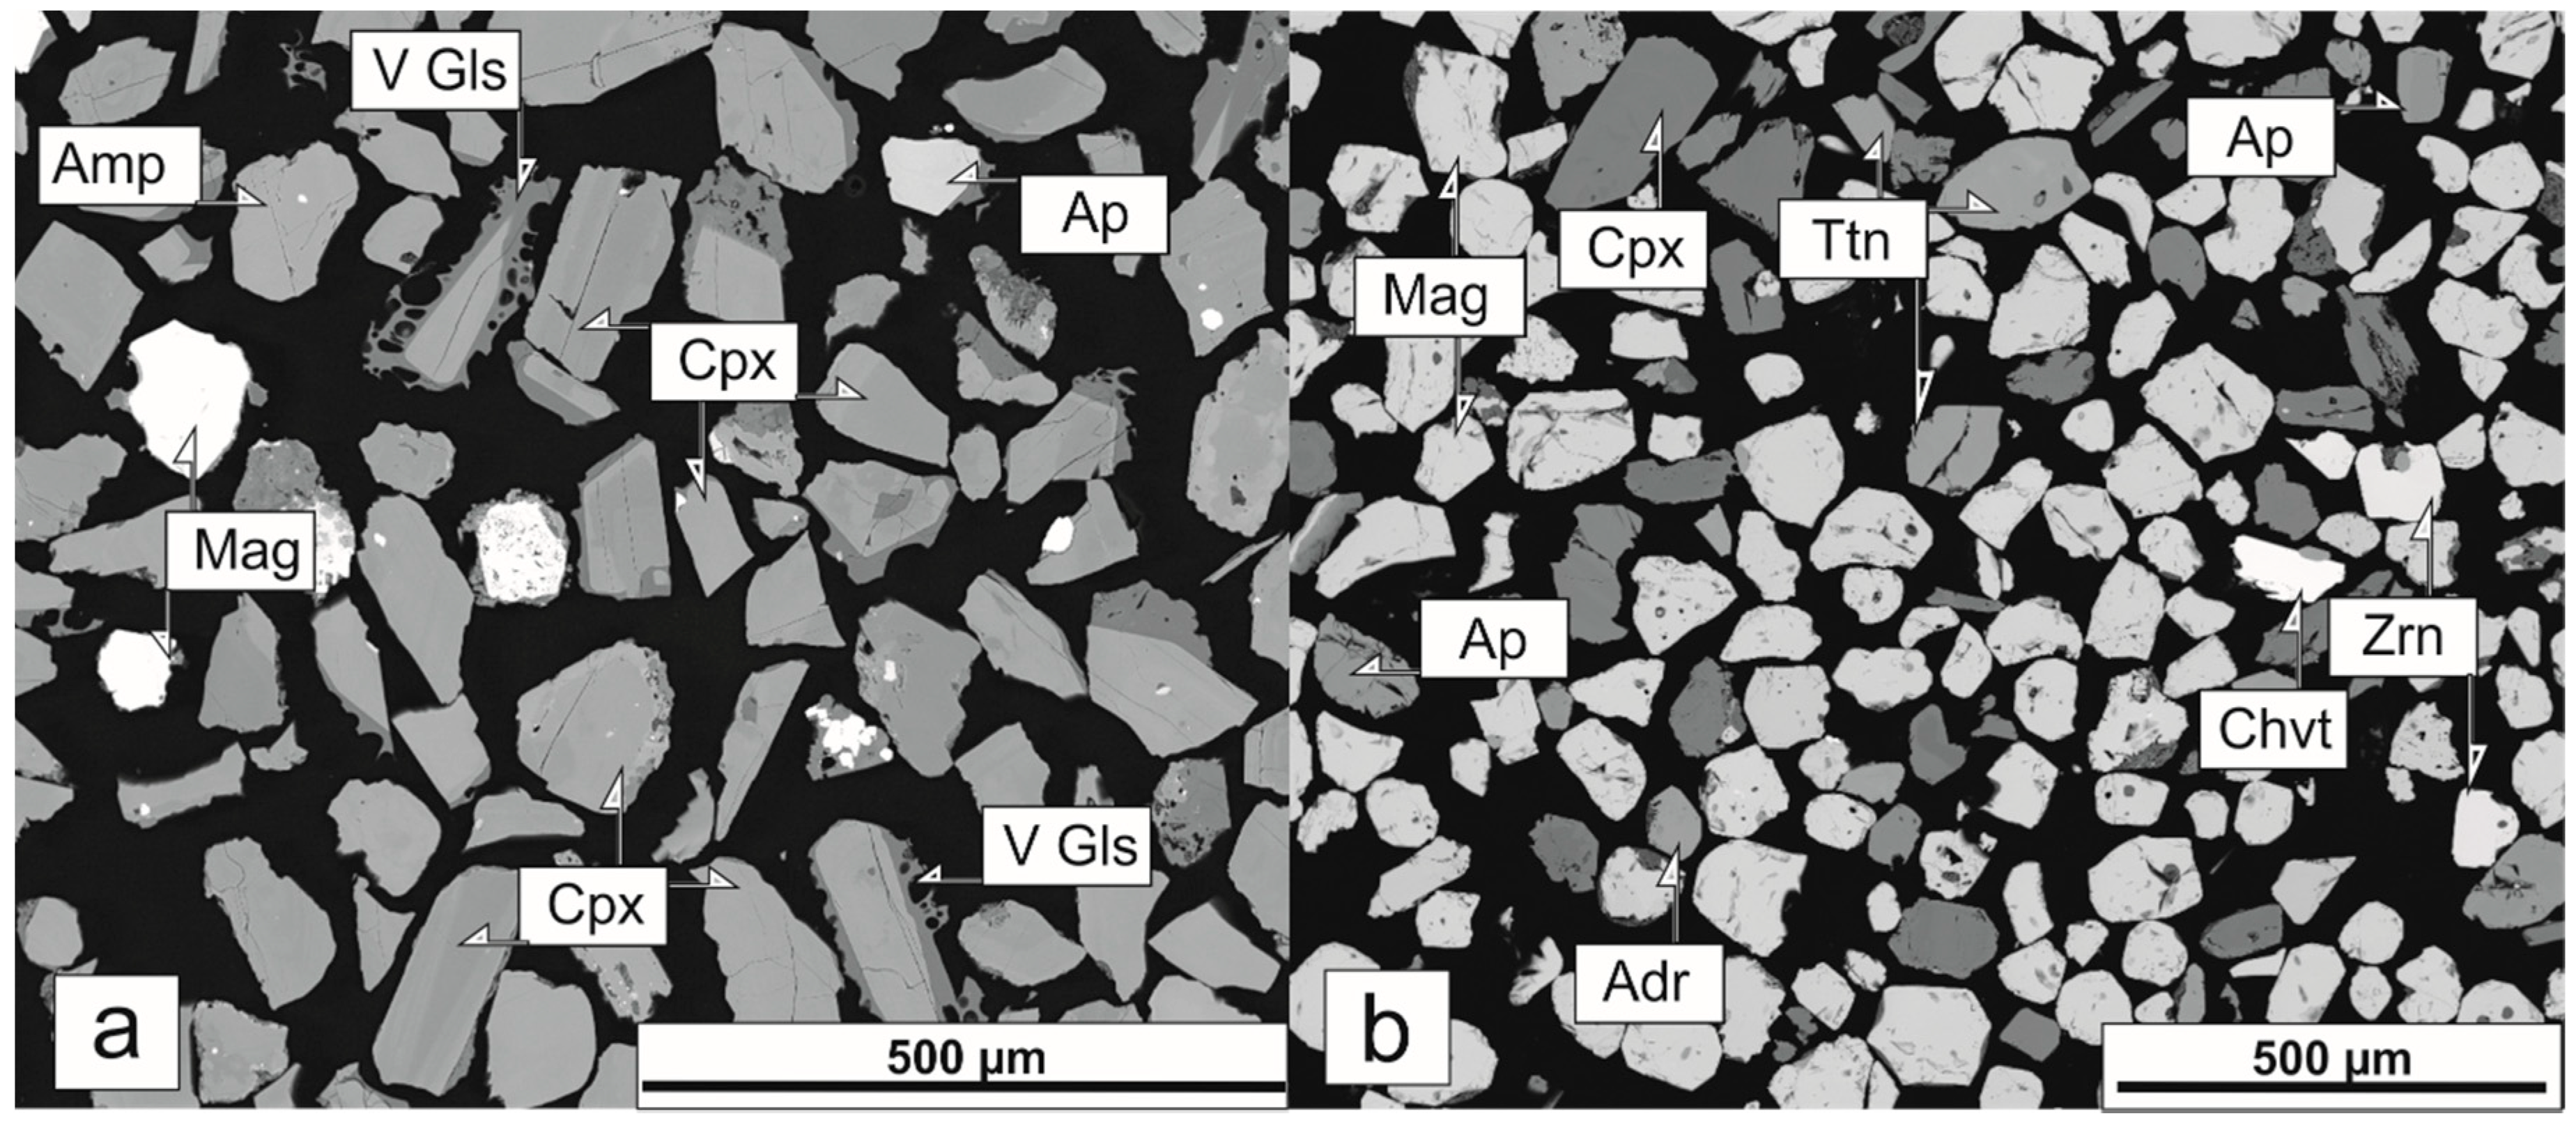
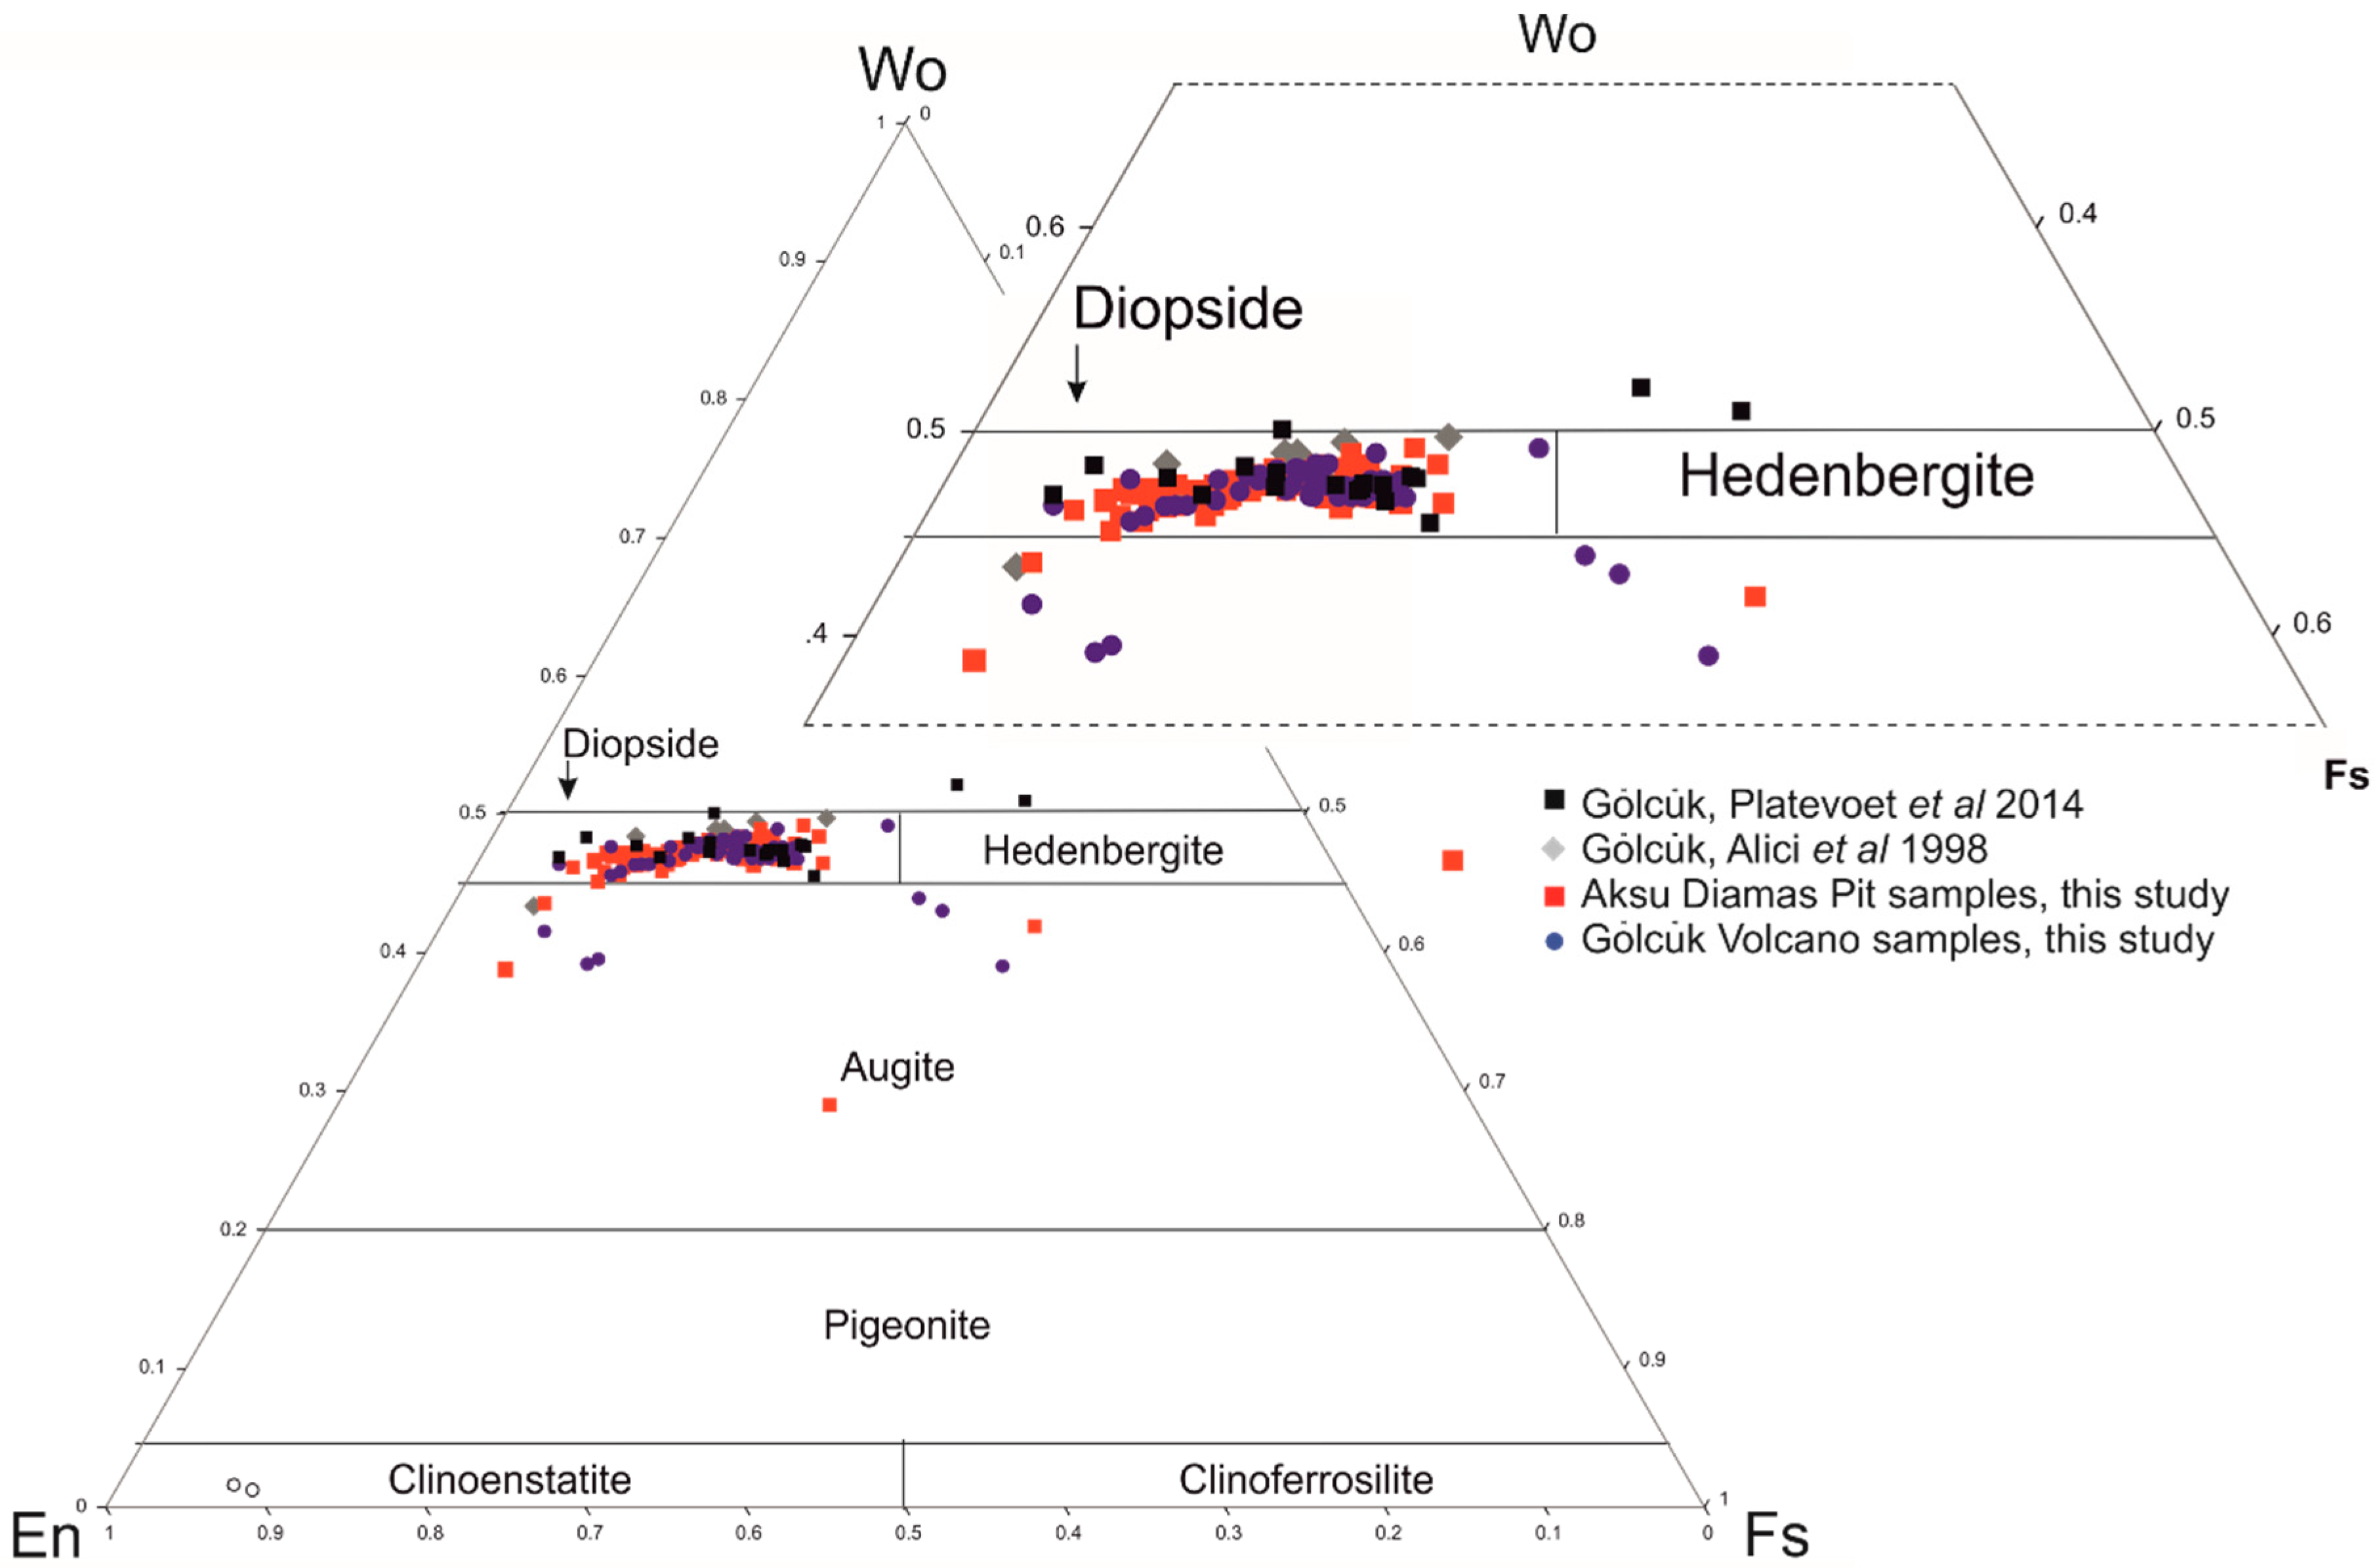
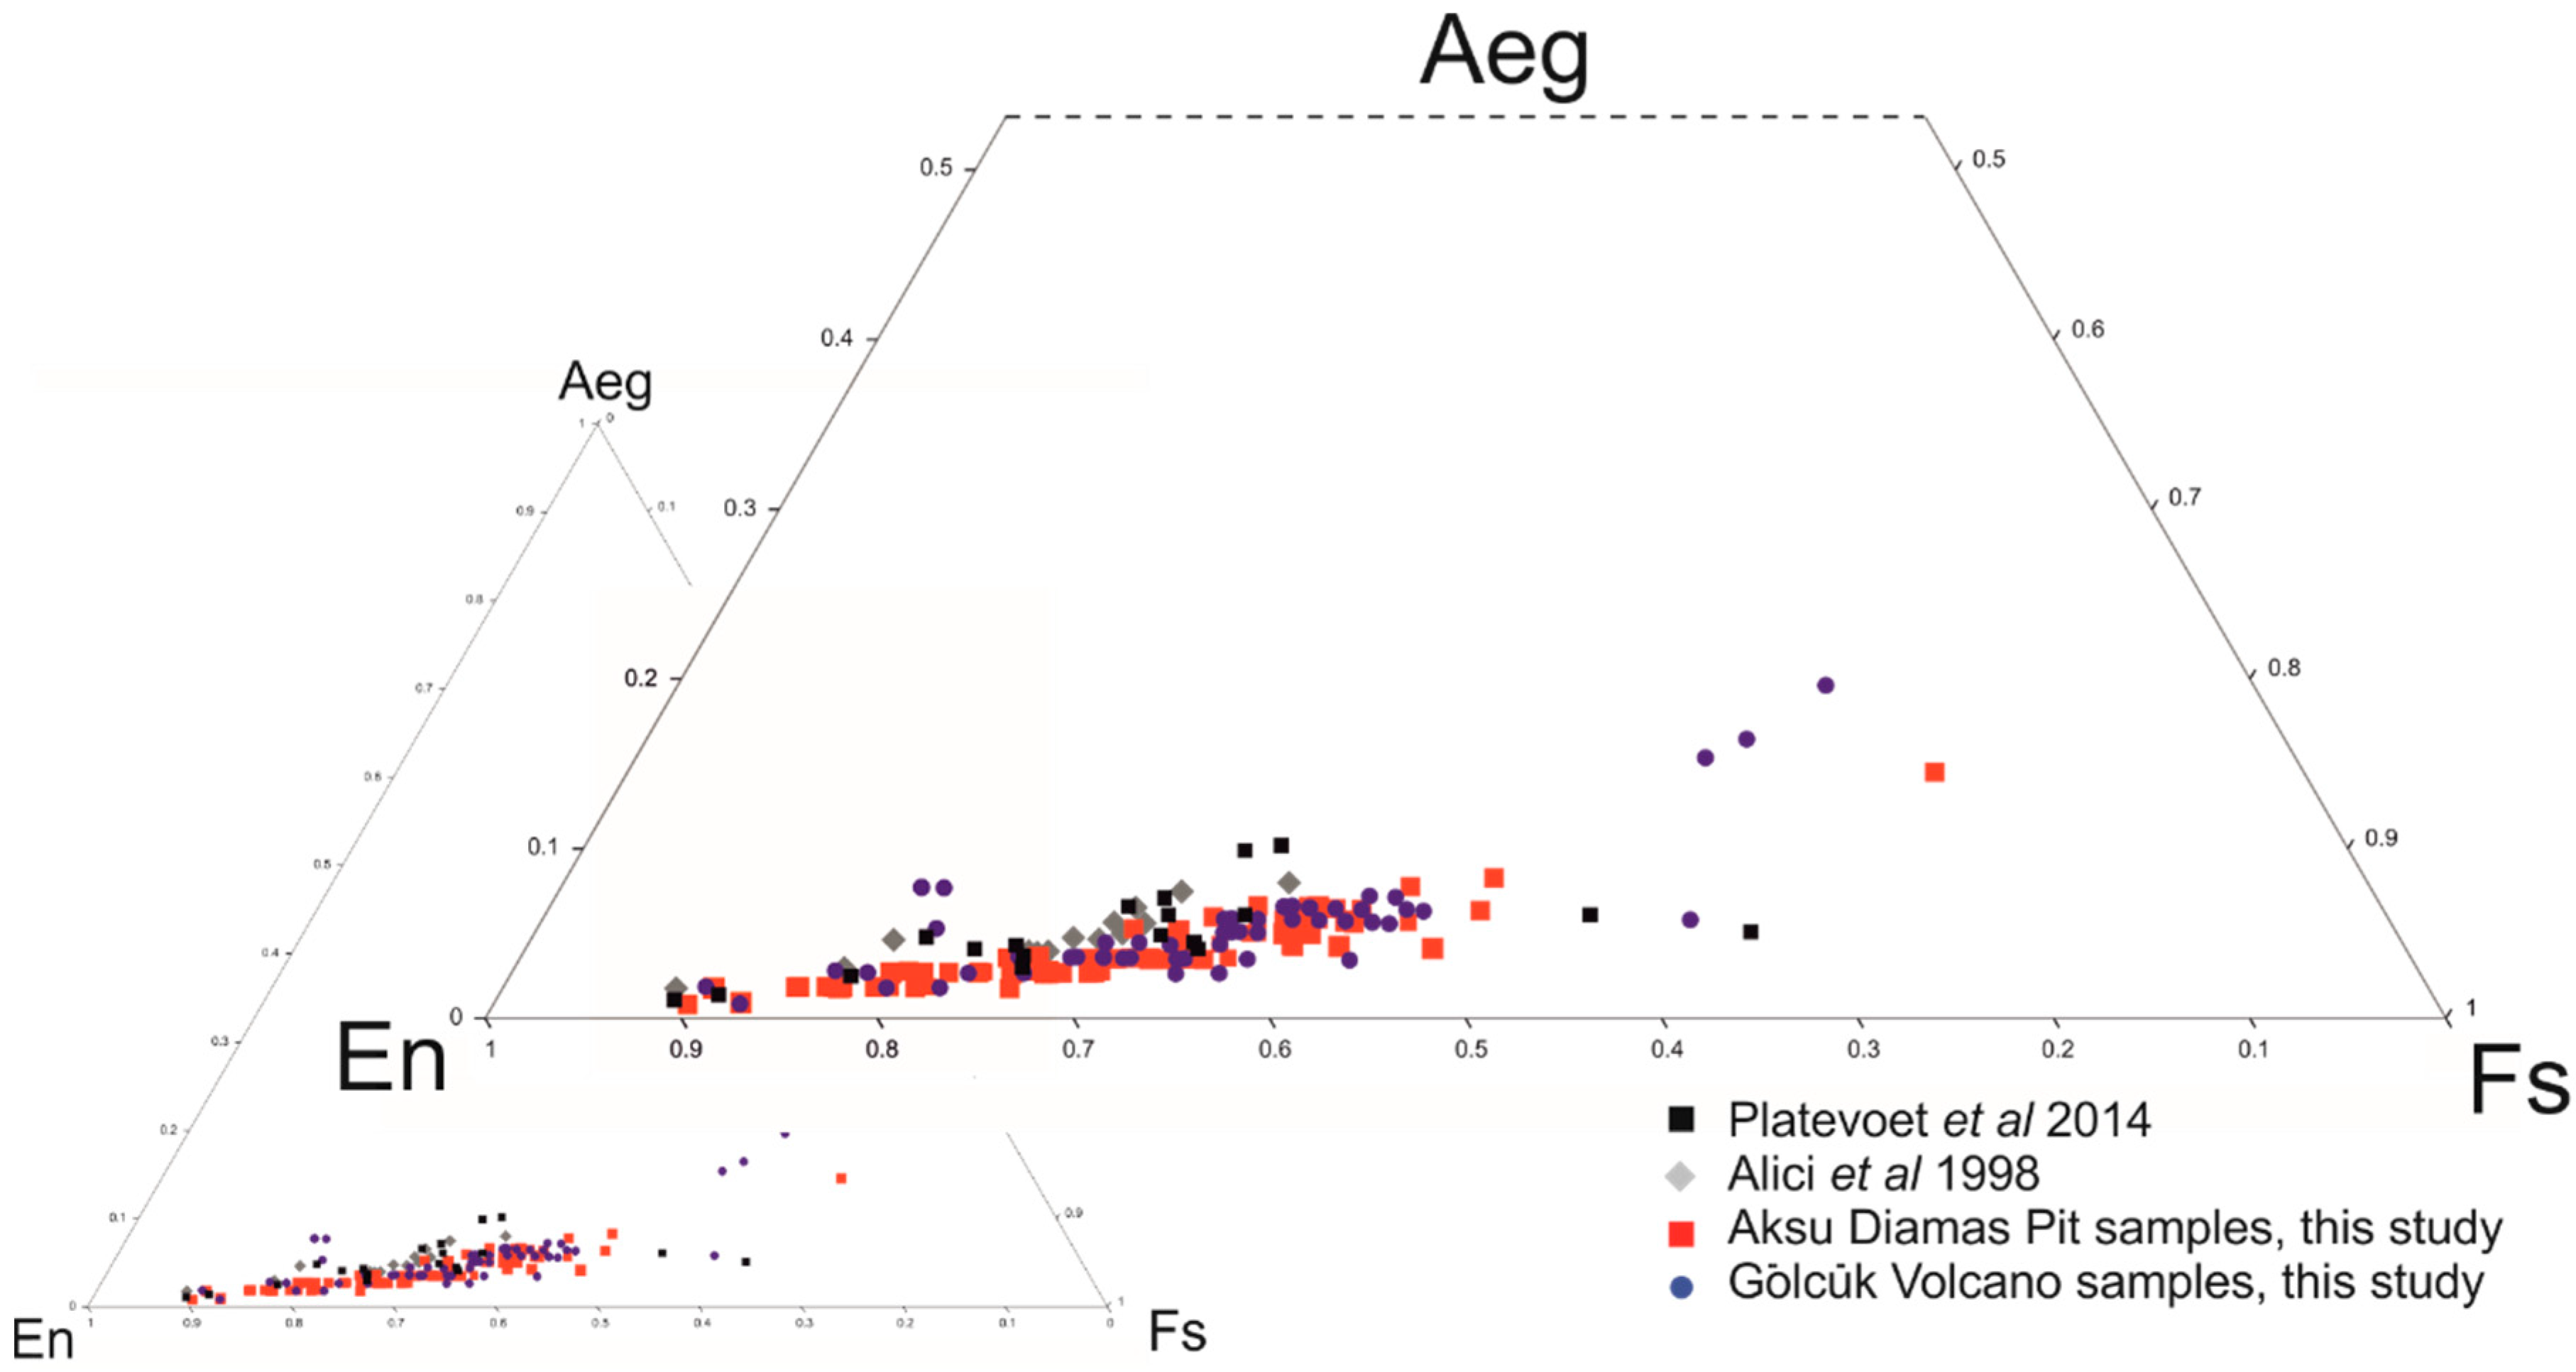
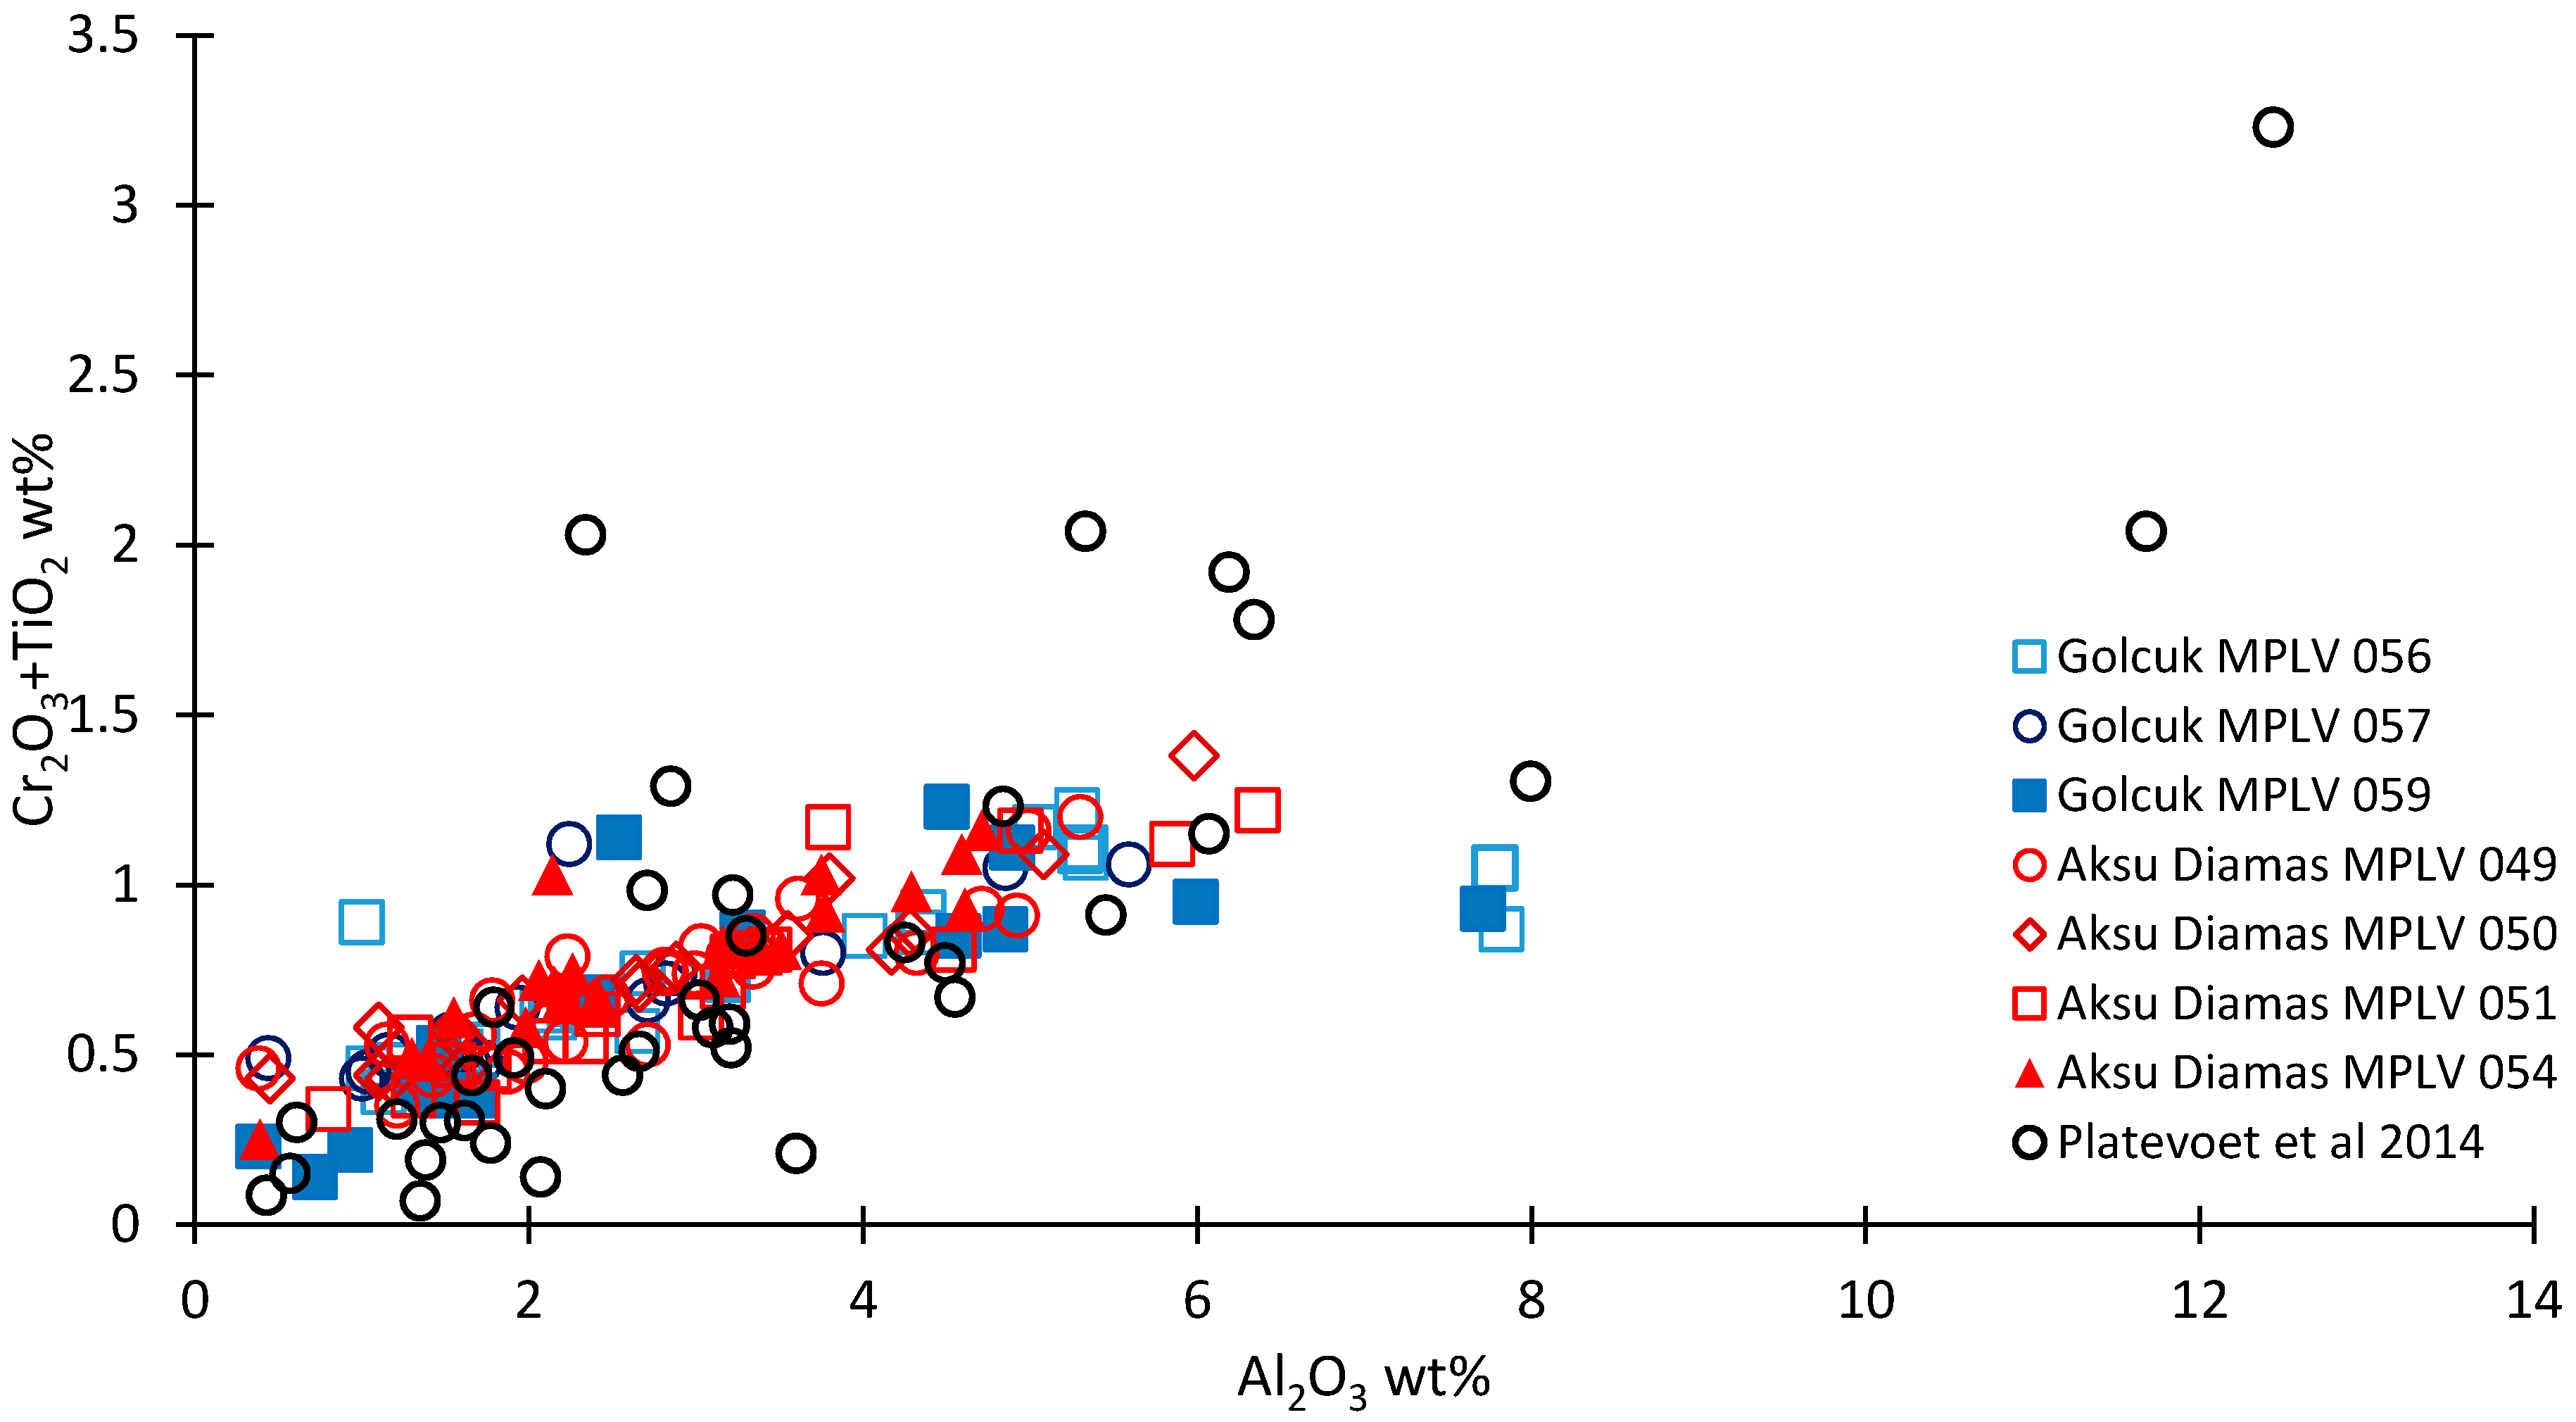
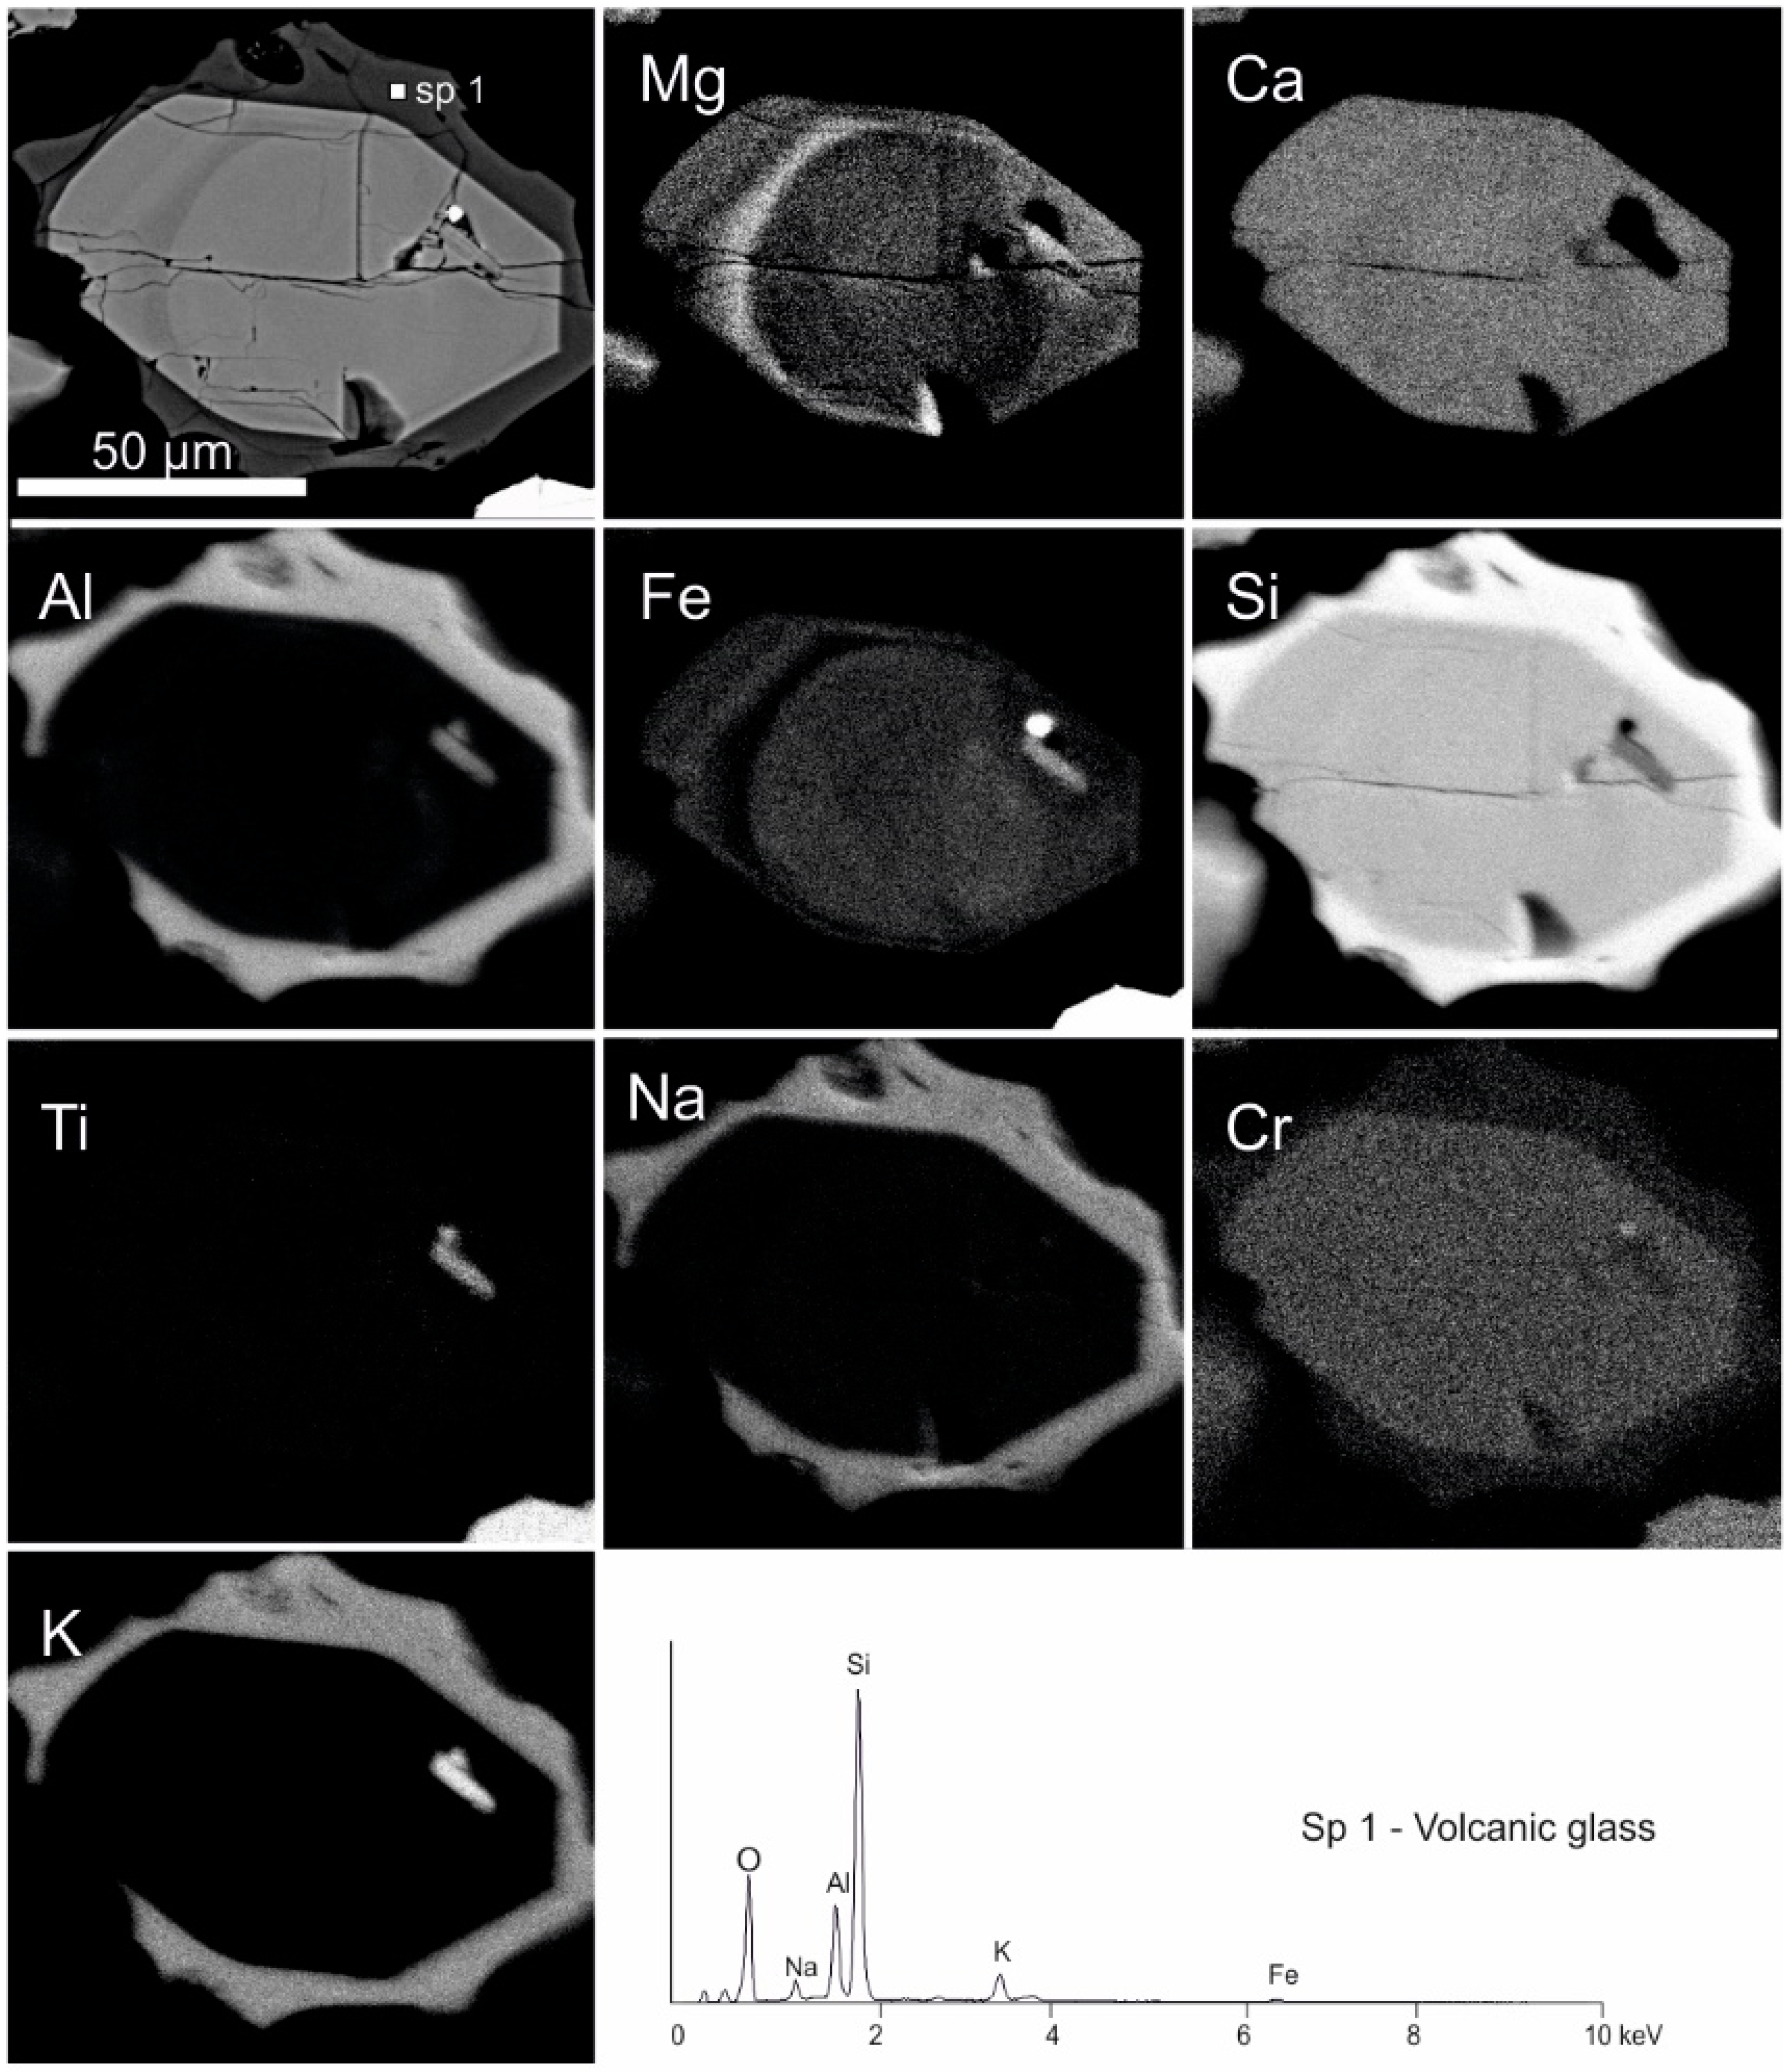
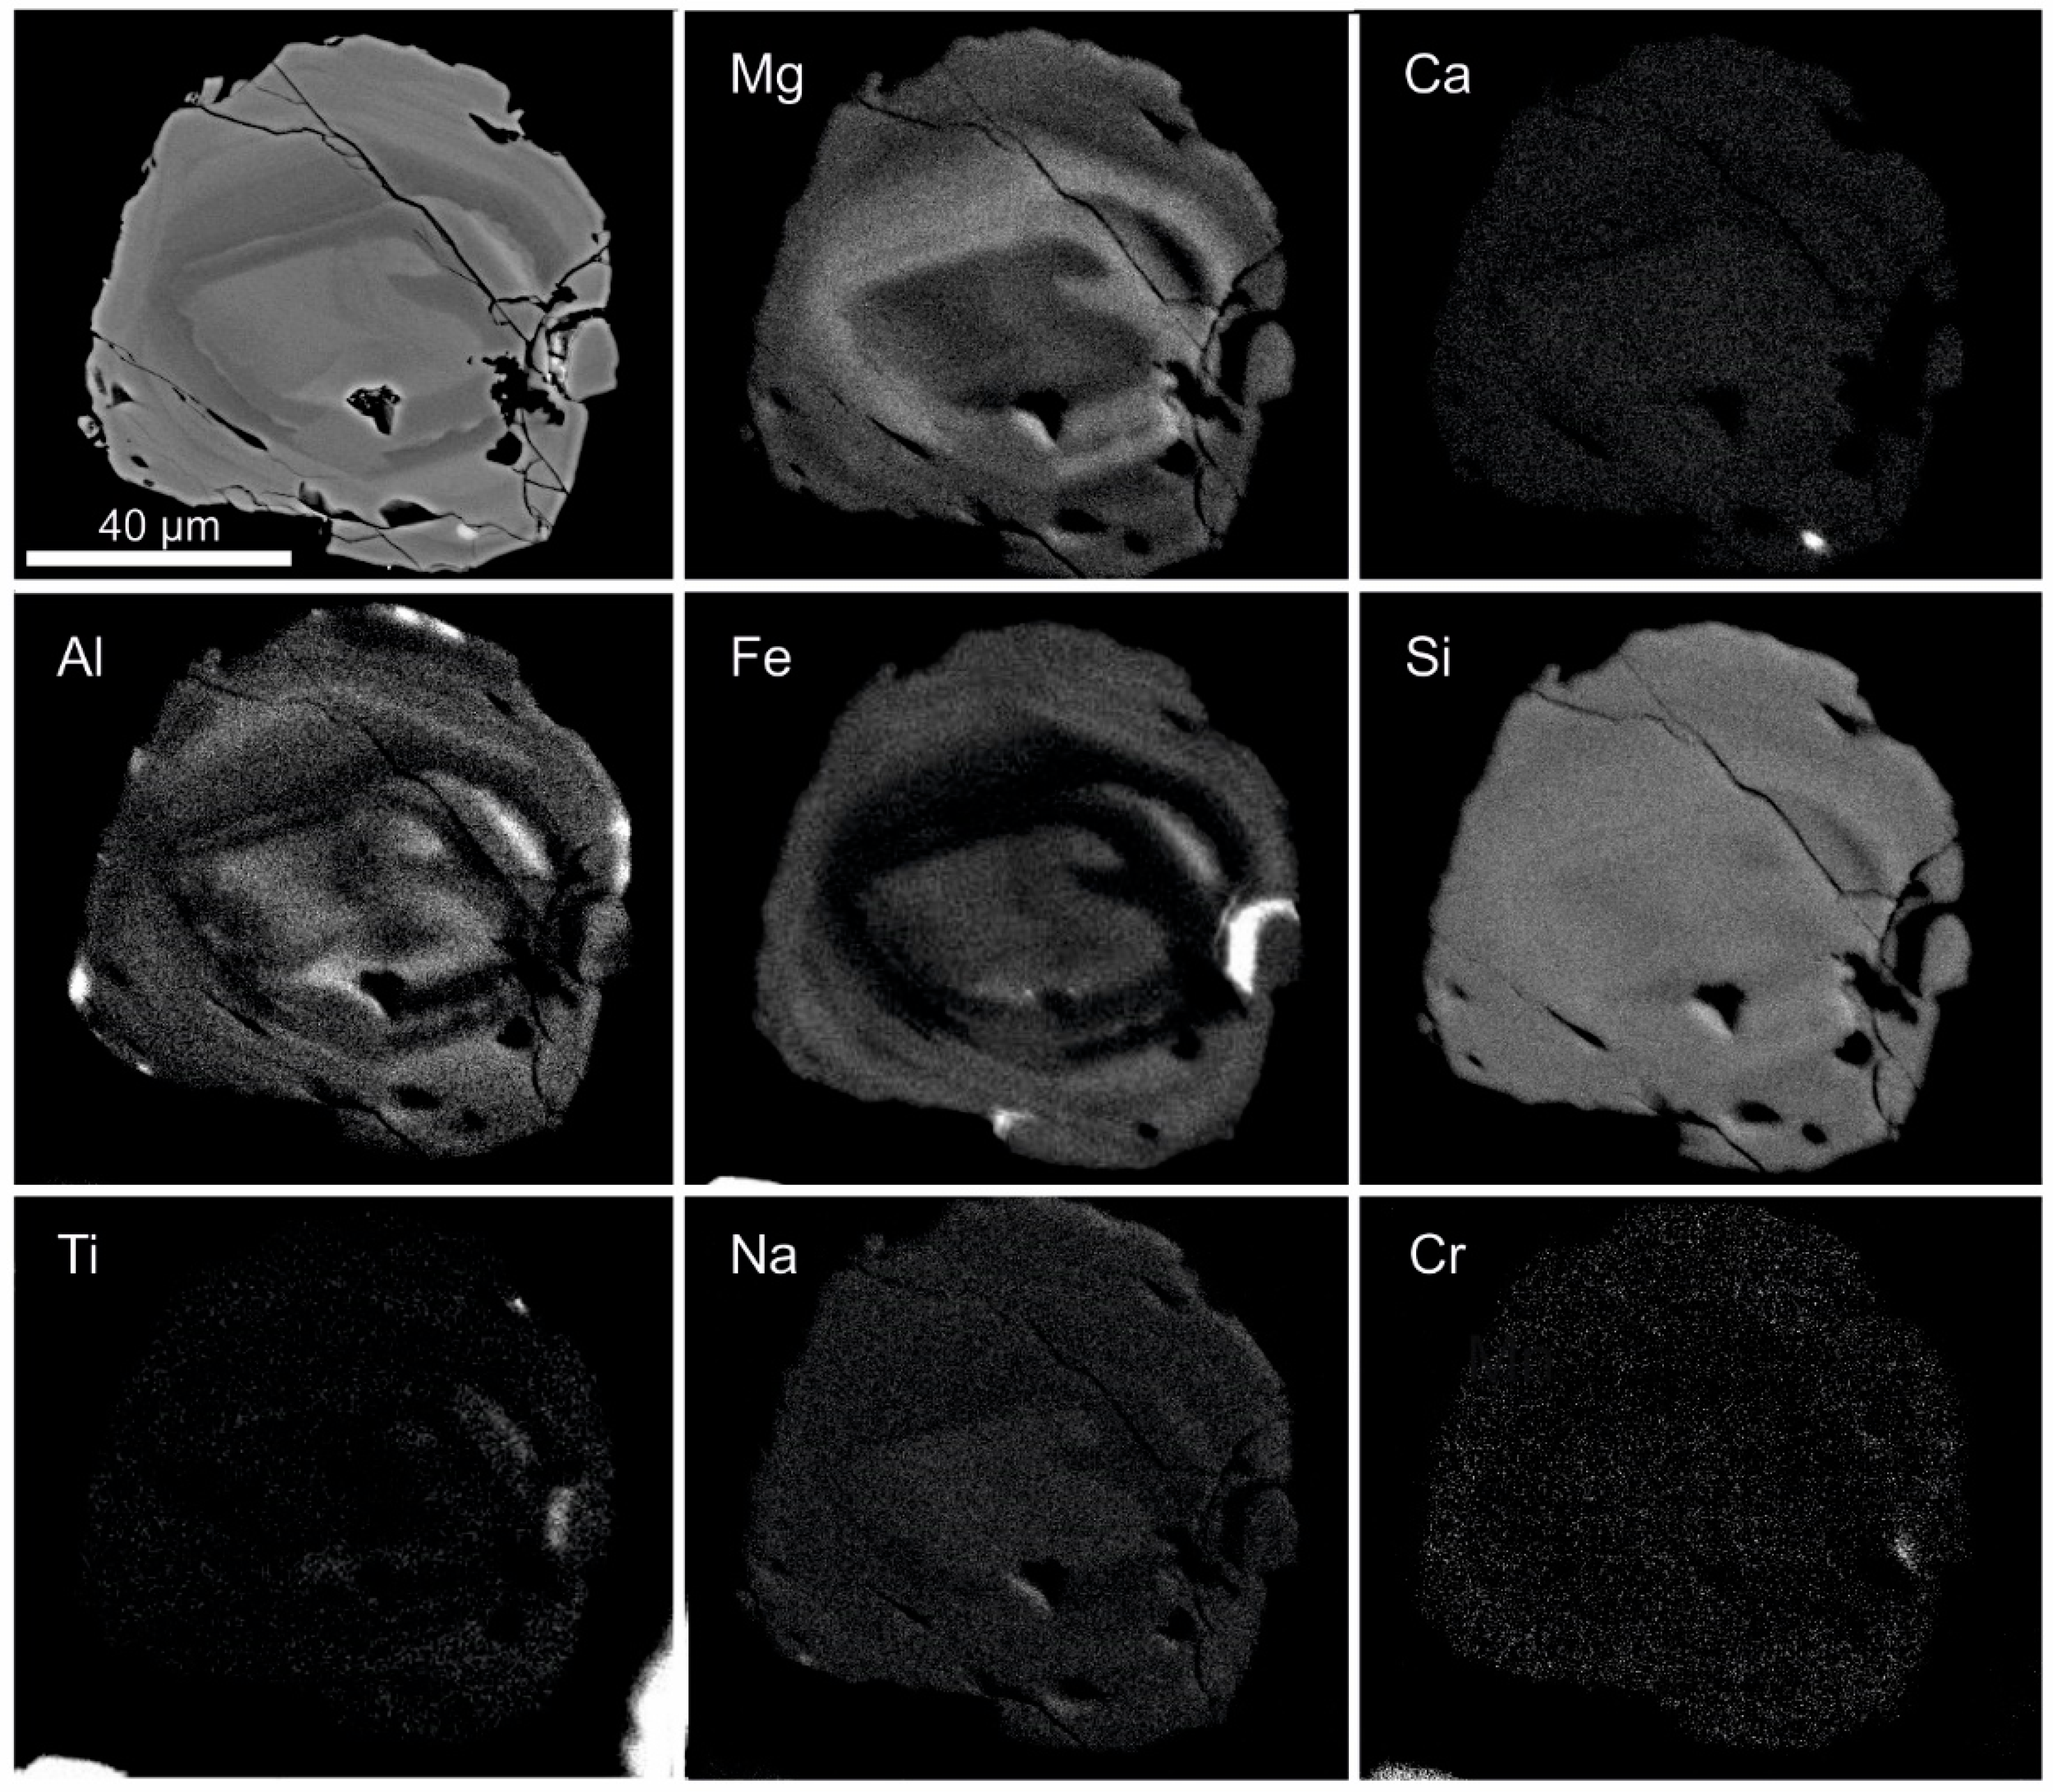
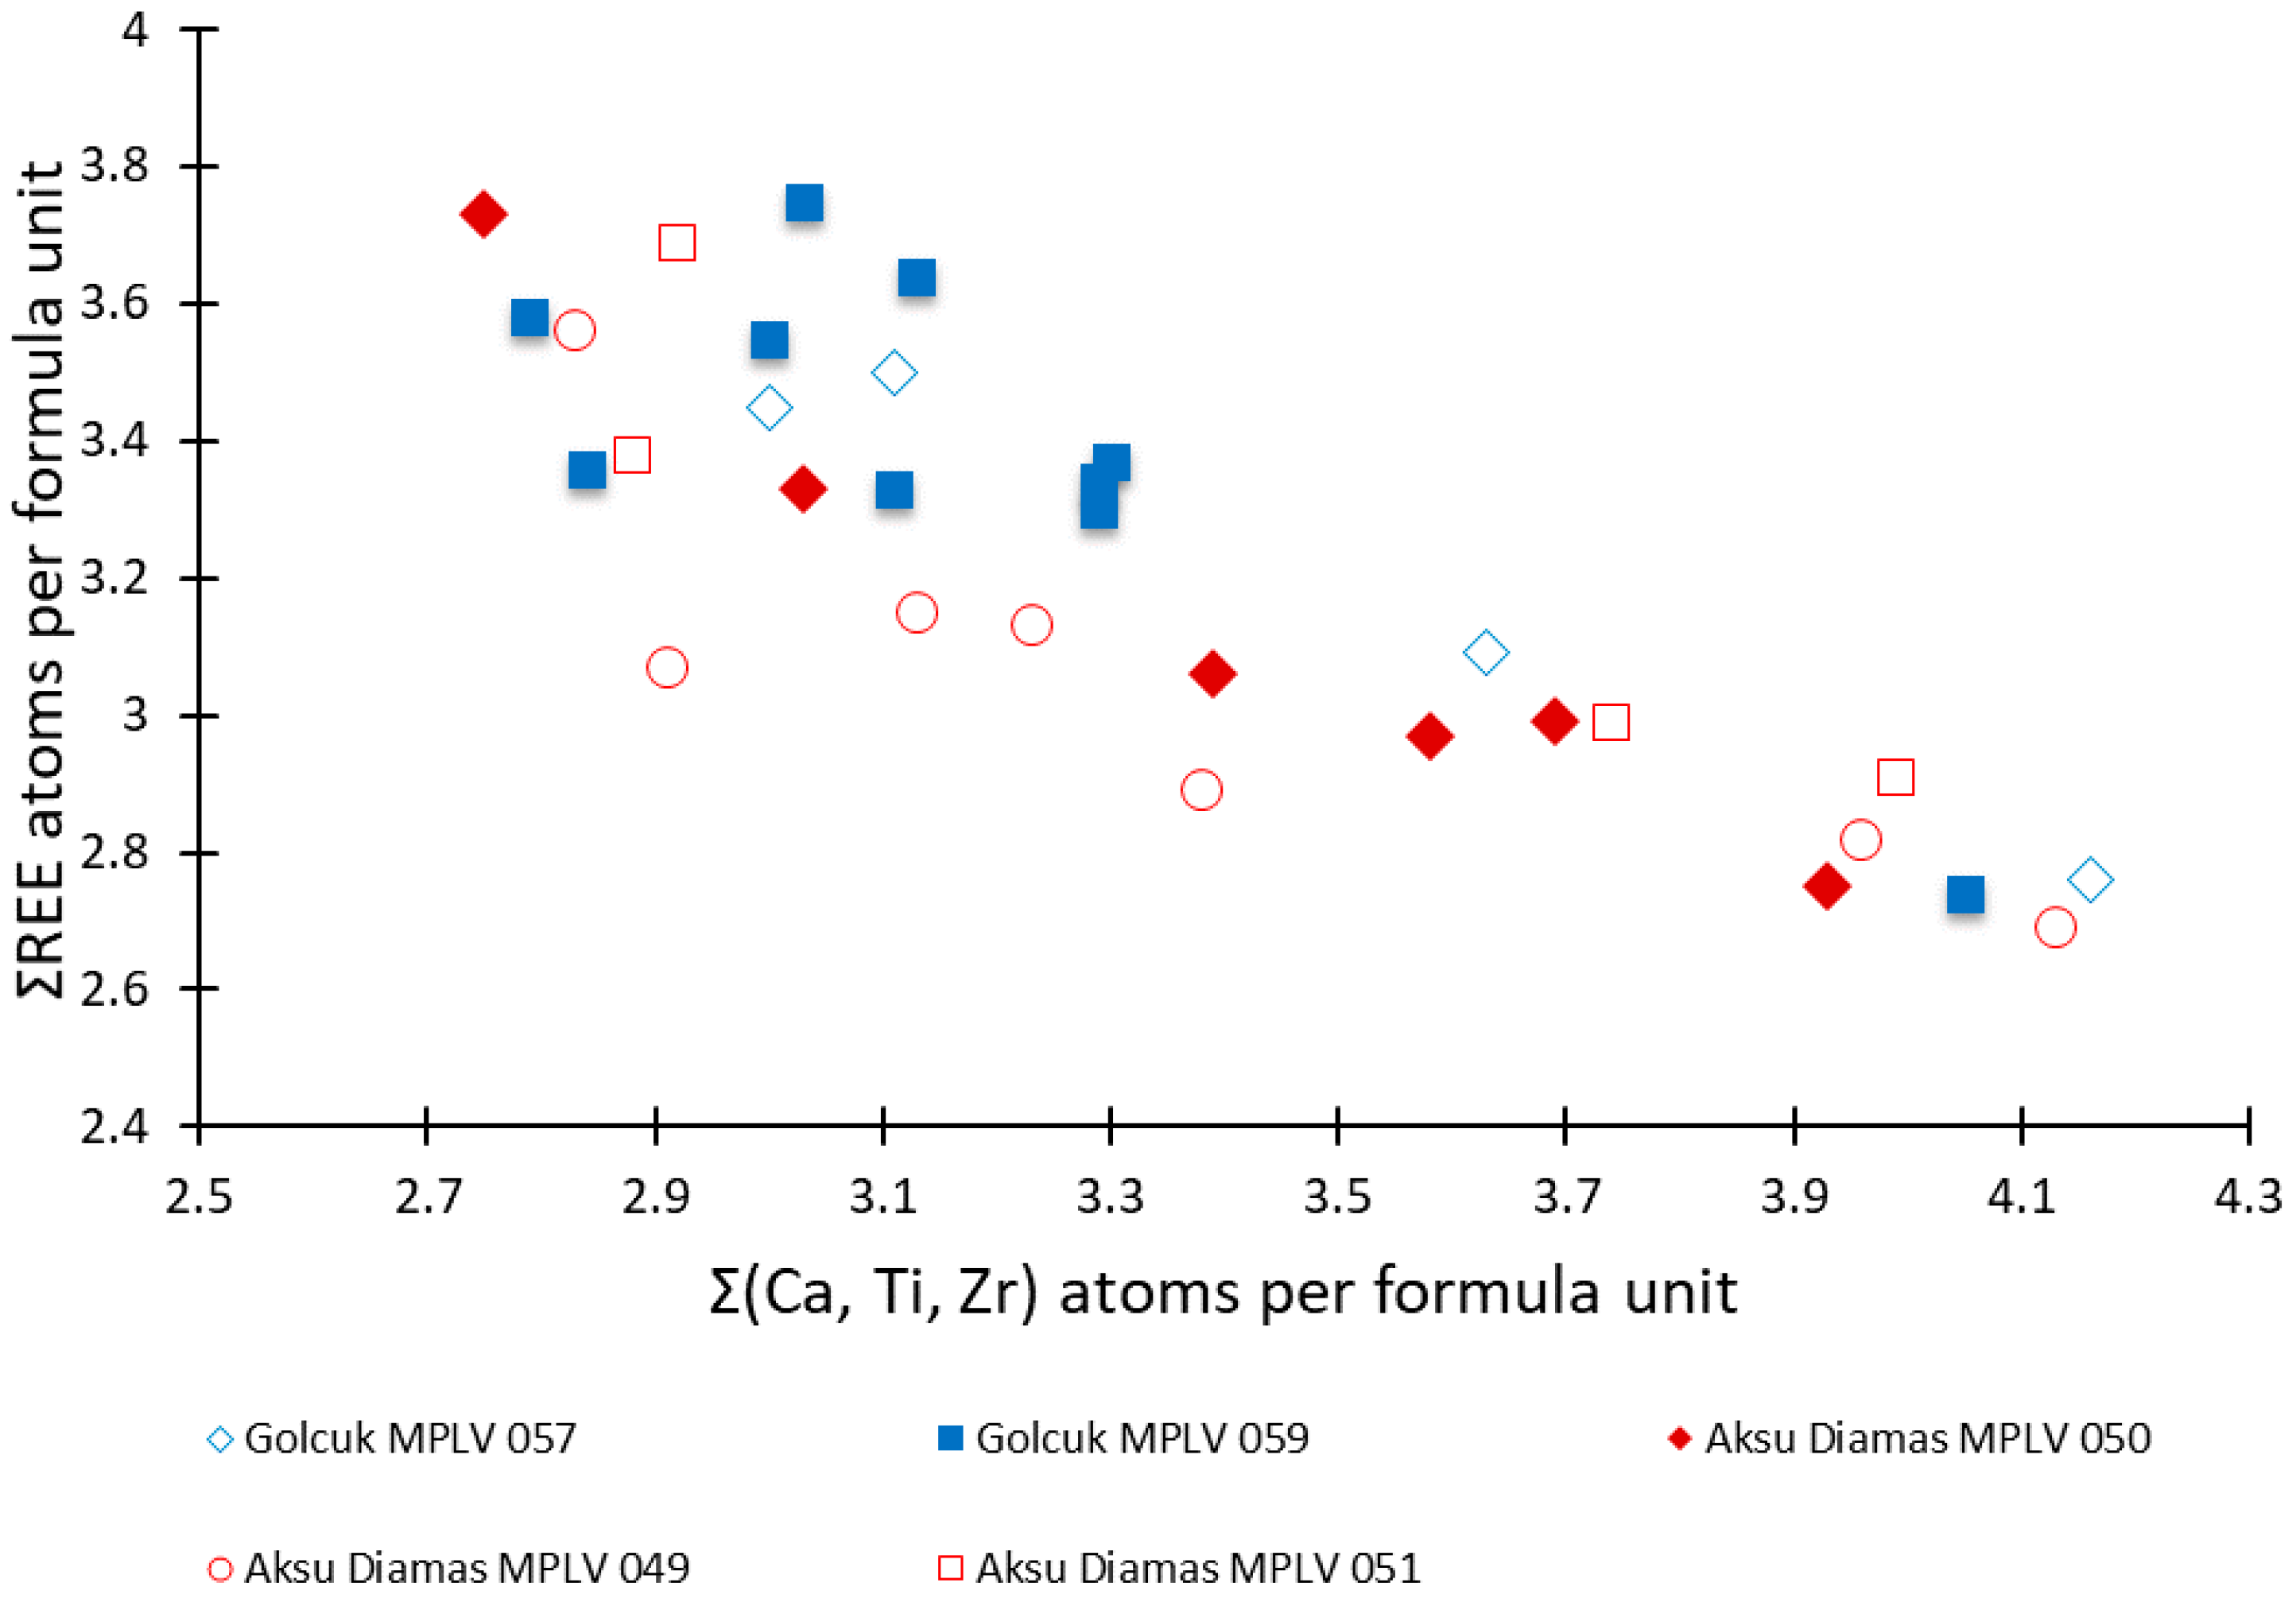
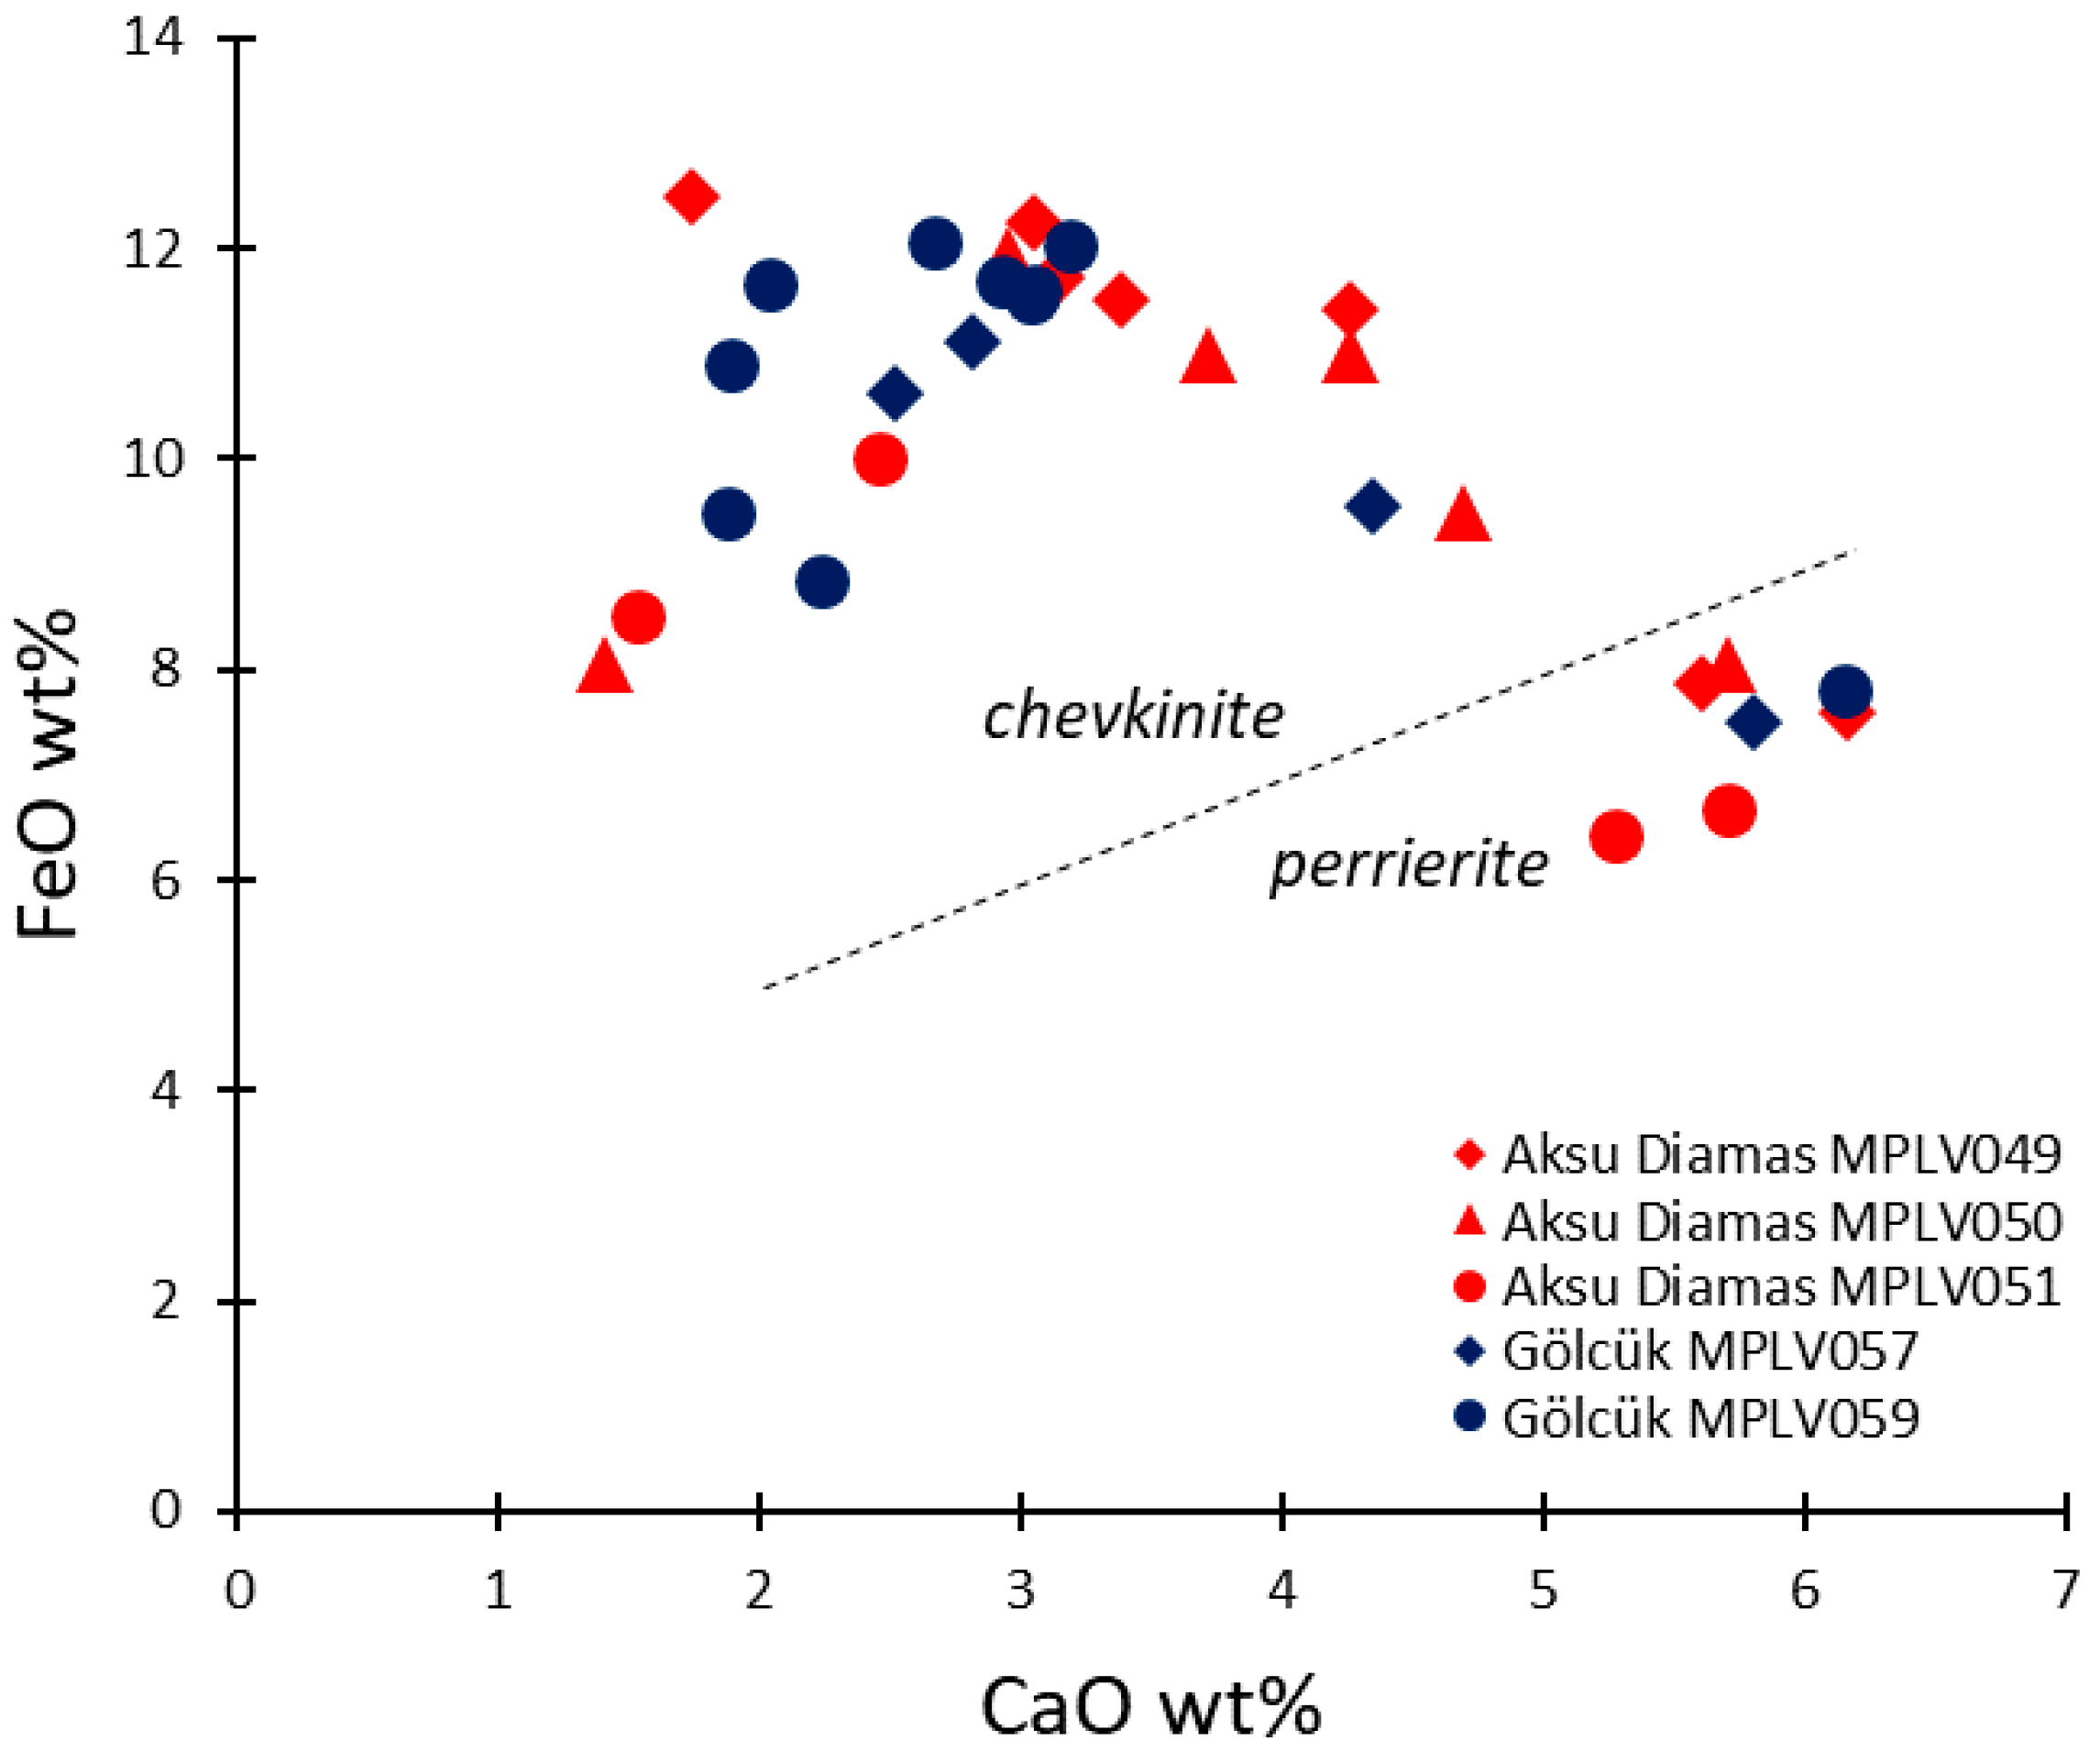
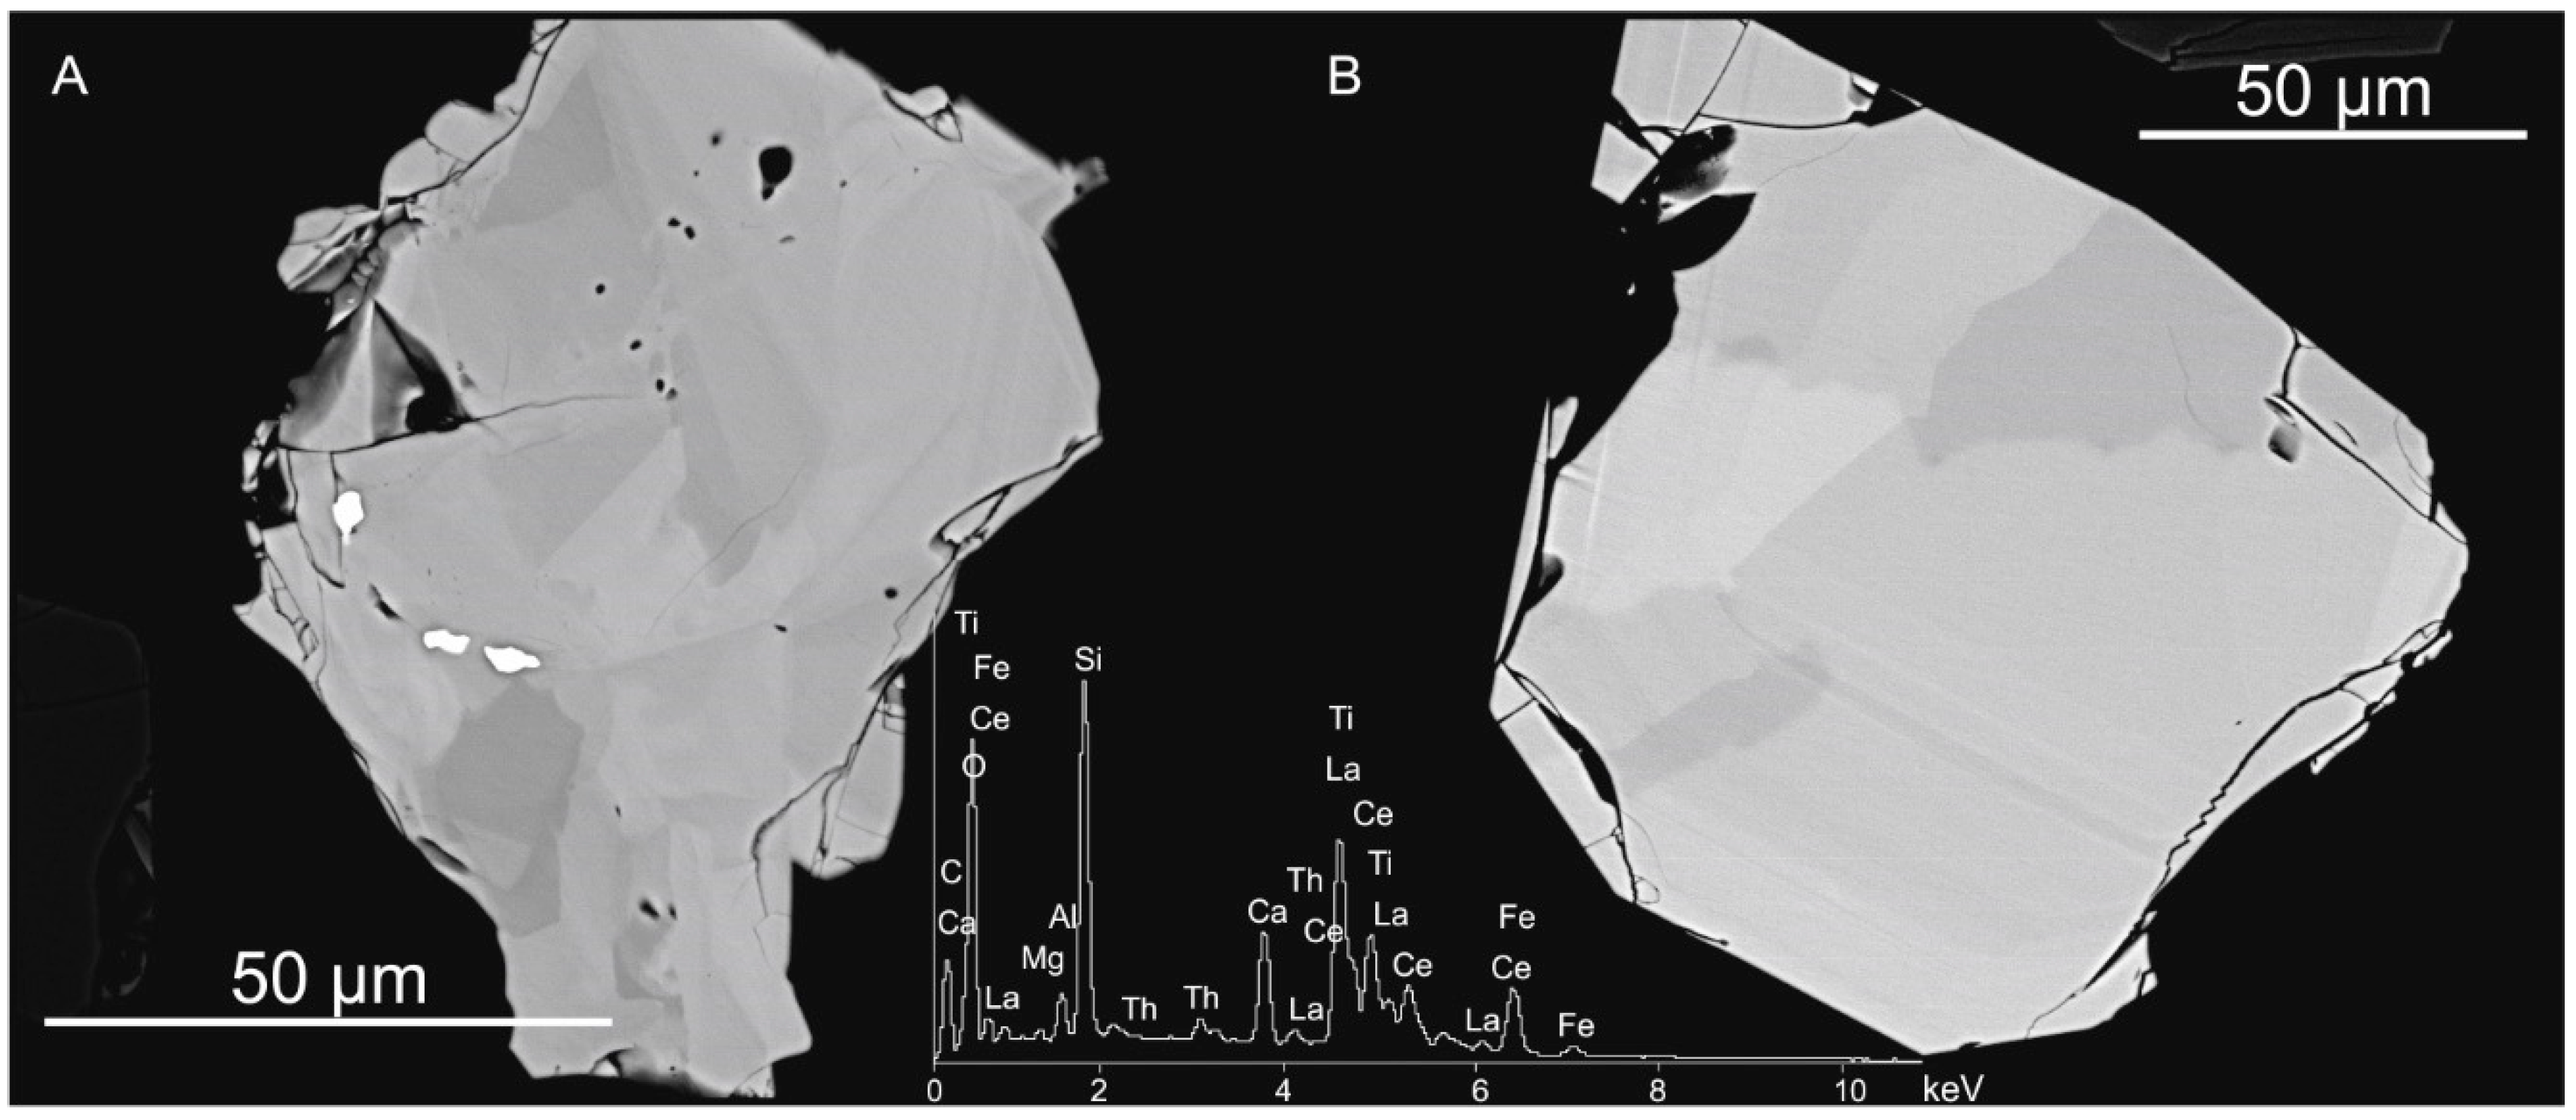
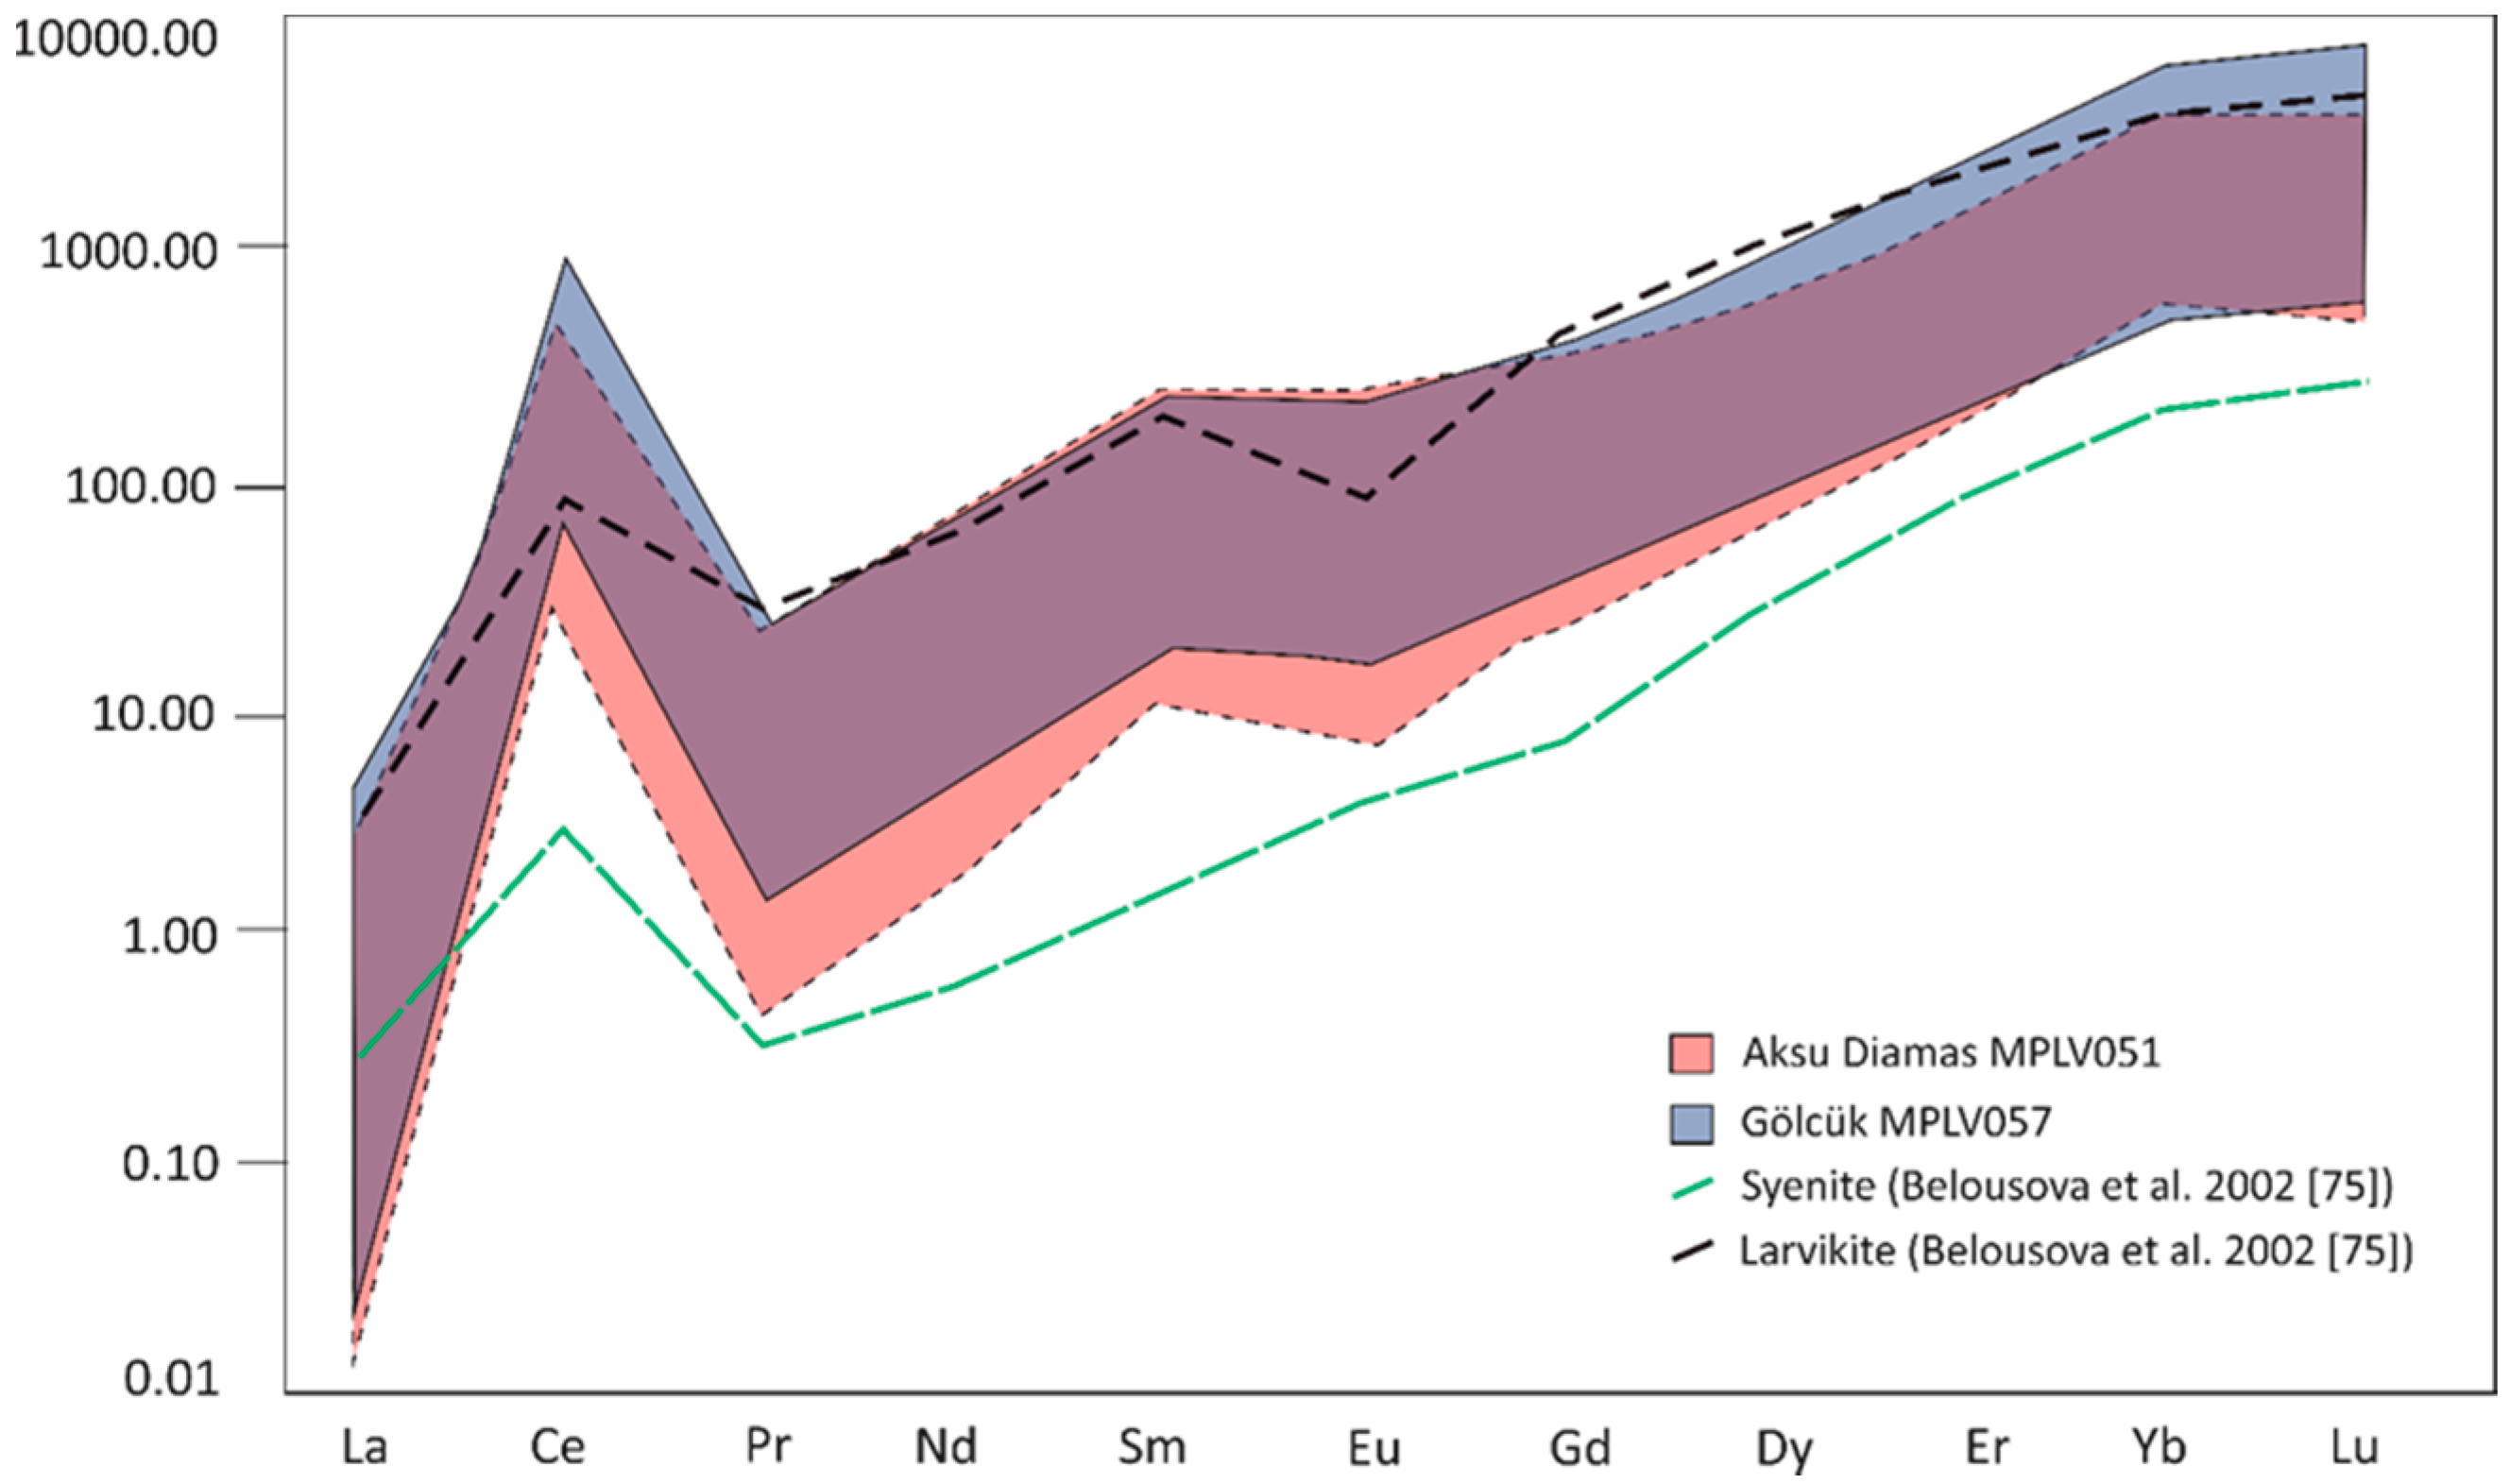
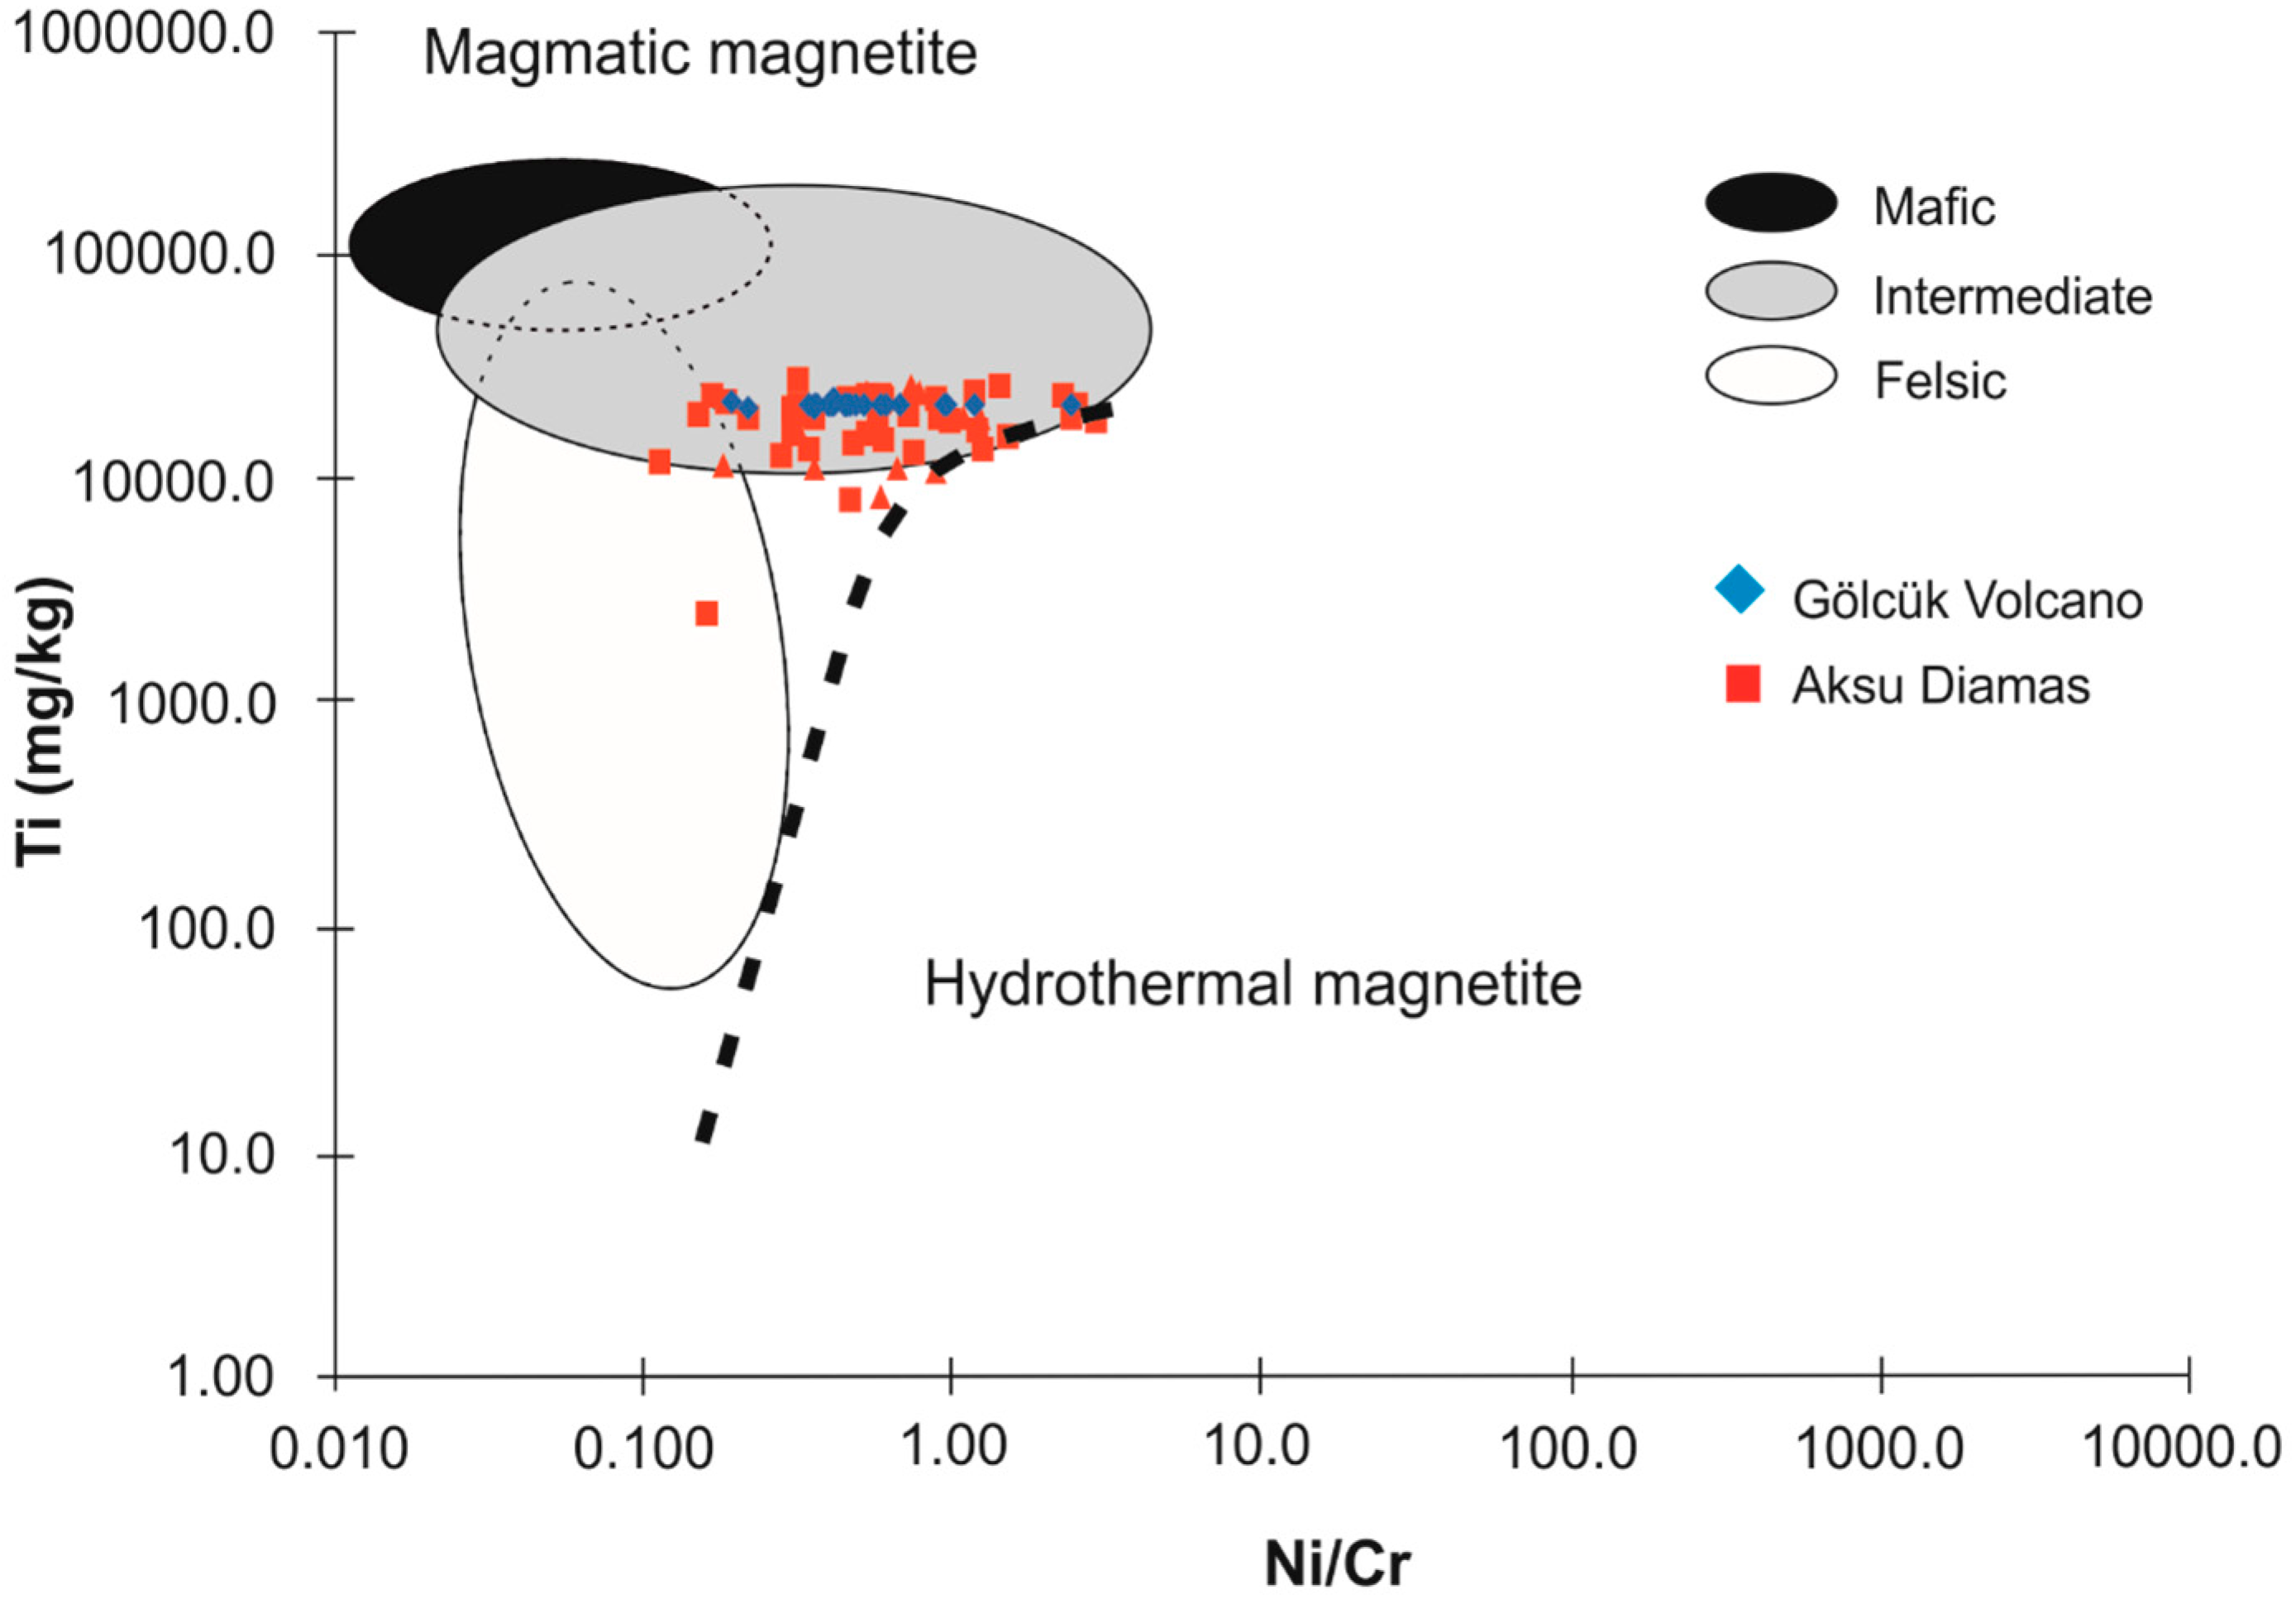
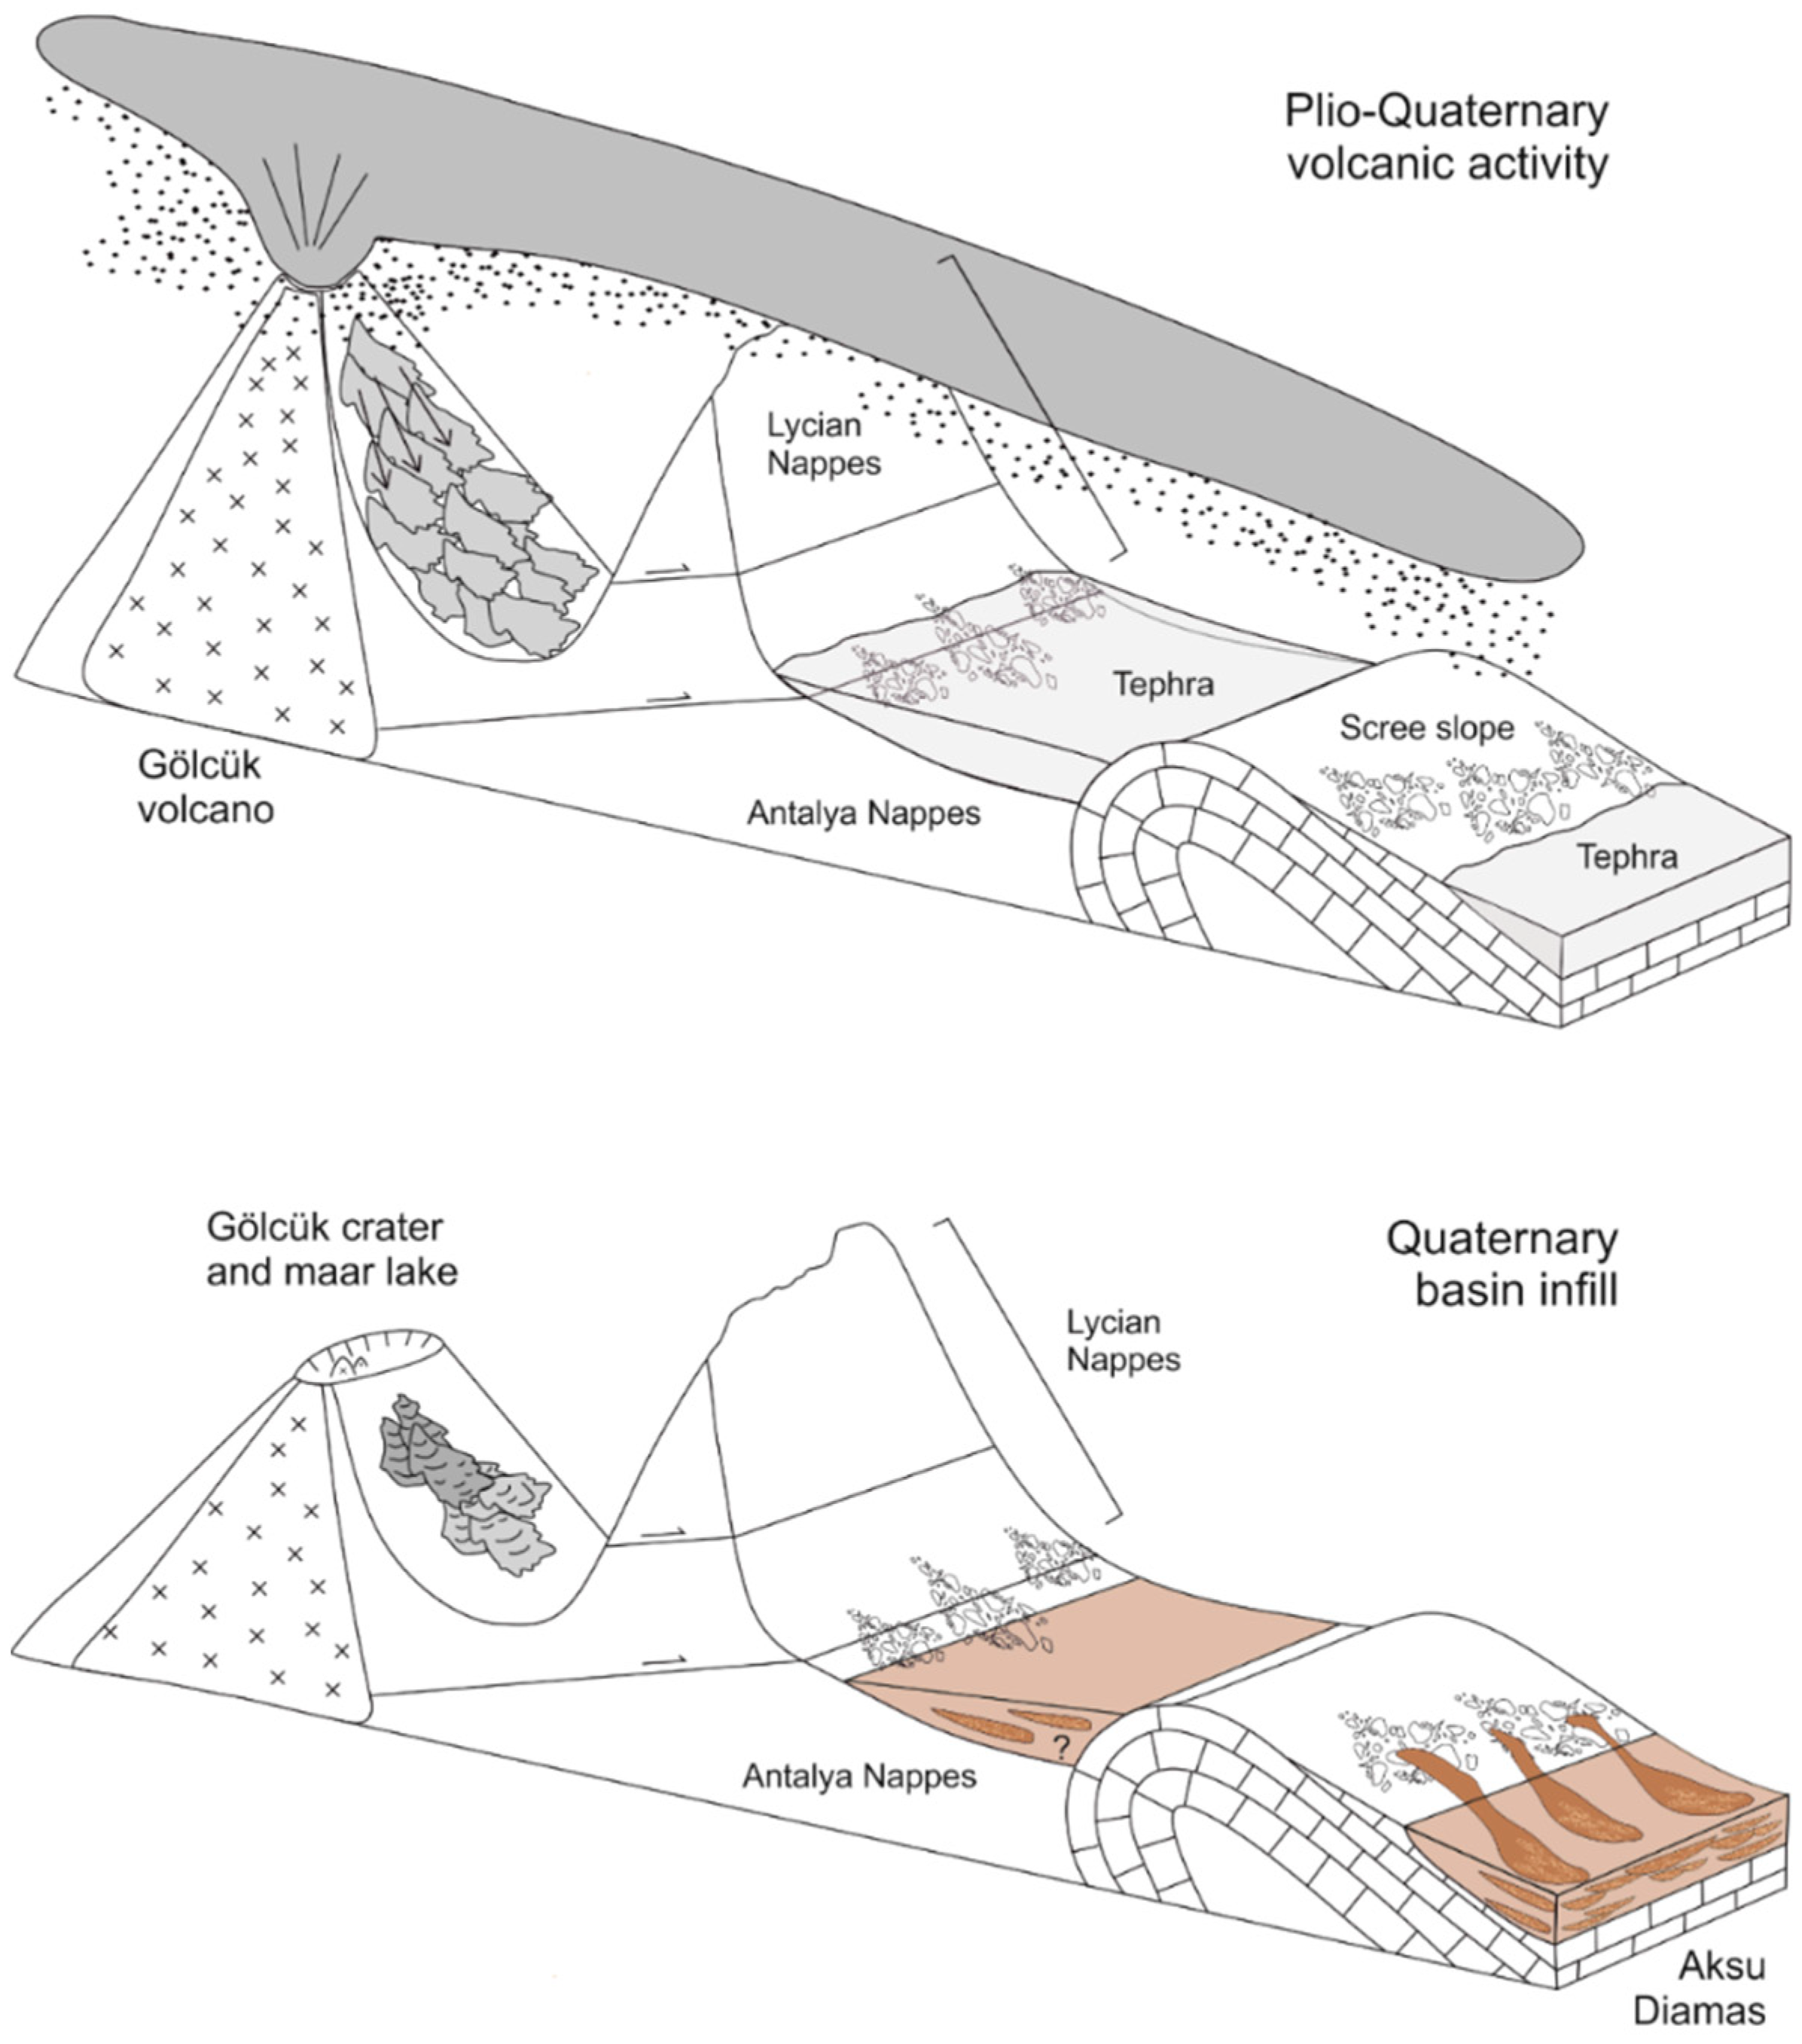
Table 1.
Summary of selected major placer types showing their primary commodities, average tonnage, and average grade. A Based on producing deposits; B Monazite content; HM = heavy mineral MF = magnetic fraction; NMF = non-magnetic fraction.
Table 1.
Summary of selected major placer types showing their primary commodities, average tonnage, and average grade. A Based on producing deposits; B Monazite content; HM = heavy mineral MF = magnetic fraction; NMF = non-magnetic fraction.
| Commodity | Typical Mineralogy | Placer Types | Tonnage A | Grade—Proportion of HM in Concentrate (% by Mass) | Examples |
|---|---|---|---|---|---|
| Mixed (Fe, Zr, Ti, REE) | Magnetite; zircon; titanite; ilmenite; chevkinite; allanite | Ash-fall | 454 Mt | unpub % magnetite (MF) ca. 5% ilmenite (MF) ca. 8% zircon (NMF) ca. 15% titanite (NMF) ca. 0.6% allanite (MF) ca. 0.3% chevkinite (MF) | Aksu Diamas (Çanakli I and Çanakli II), Turkey |
| Titanium | Ilmenite; leucoxene; rutile | Fluvial; beach; aeolian (dune) | <1 Mt–>50 Mt ilmenite <0.5 Mt–>6 Mt rutile | 37–82% ilmenite 1–15% rutile | Capel and Cooljarloo, Australia; OSCOM, India; Richards Bay, South Africa; Trail Ridge, USA |
| Zirconium | Zircon | Beach; aeolian (dune) | <0.5 Mt–>8 Mt | 3–17% zircon | Capel and Cooljarloo, Australia; OSCOM, India; Richards Bay, South Africa; Trail Ridge, USA |
| REE | Monazite; xenotime | Beach; aeolian (dune) | 0.7 Mt–1.9 Mt B | 1–5% monazite | OSCOM and Chavara, India |
| Iron | Magnetite | Beach; aeolian (dune) | 0.1 Mt–>5 Mt | 4–55% magnetite | Natashquan River, Canada; Duna Choapa Norte, Chile; Waikato North Head, New Zealand; Ciaos and Cadman, Indonesia |
Table 2.
List and description of samples used in this study. HM = heavy mineral.
| Sample | Gölcük | Aksu Diamas | Description |
|---|---|---|---|
| MPLV 049 | x | The base of the Aksu Diamas pit | |
| MPLV 050 | x | Approx. 1 m above base of Aksu Diamas pit | |
| MPLV 051 | x | Approx. 3 m above base of Aksu Diamas pit | |
| MPLV 053 | x | HM concentrate from Aksu Diamas pilot plant | |
| MPLV 054 | x | HM concentrate from Aksu Diamas pilot plant | |
| MPLV 056 | x | Gölcük Tuff | |
| MPLV 057 | x | Gölcük Tuff | |
| MPLV 059 | x | Gölcük Tuff |
Table 3.
Analyses performed on the mineral phases used to fingerprint the heavy minerals. HMS = heavy mineral separate.
Table 3.
Analyses performed on the mineral phases used to fingerprint the heavy minerals. HMS = heavy mineral separate.
| Sample | Type | SEM EDS | LA-ICP-MS | |||
|---|---|---|---|---|---|---|
| Mineral Phase | Pyroxene | Chevkinite | Apatite | Magnetite | Zircon | |
| MPLV 049 | Aksu.Diamas HMS | x | x | x | ||
| MPLV 050 | x | x | ||||
| MPLV 051 | x | x | x | |||
| MPLV 053 | x | |||||
| MPLV 054 | x | x | ||||
| MPLV 056 | Gölcük HMS | x | ||||
| MPLV 057 | x | x | x | |||
| MPLV 058 | x | |||||
| MPLV 059 | x | x | ||||
Table 4.
Modal analysis (%) of representative samples from the Gölcük HMS and Aksu Diamas HMS as an example of mineral distribution. The analysis was based on SEM X-ray mapping of three representative fields of view in each of the samples listed and may not include all the trace phases present in the sample. For ease mineral classification, the pyroxene and amphibole were grouped into one column. n.d.—not detected.
| % Content | |||||||||||||||
|---|---|---|---|---|---|---|---|---|---|---|---|---|---|---|---|
| Sample | Pyroxene + Amphibole | Magnetite-Ulvospinel | Biotite | Apatite | Volcanic Glass | Zircon | K-Feldspar | Fluorine | Lithics | Titanite | Garnet | Plagioclase | Chevkinite | Allanite | Magnesio-Chromite |
| Gölcük volcanics MPLV059 | 67.7 | 9.7 | 8.8 | 7.4 | 3.2 | n.d. | 0.9 | 0.6 | 0.6 | 0.5 | 0.3 | 0.2 | 0.1 | n.d. | n.d. |
| Aksu Diamas pit MPLV049 | 20.3 | 61.3 | 0.3 | 5.2 | n.d. | 2.2 | 0.3 | n.d. | 2.8 | 5.4 | 0.7 | n.d. | 0.9 | 0.3 | 0.3 |
Table 5.
Chemical analyses (SEM EDS-WDS) and structural formulae of chevkinite group minerals from the Gölcük tuff (Sample MPLV 059). b.d.—below detection.
Table 5.
Chemical analyses (SEM EDS-WDS) and structural formulae of chevkinite group minerals from the Gölcük tuff (Sample MPLV 059). b.d.—below detection.
| Analysis No. | 1 | 2 | 3 | 4 | 5 | 6 | 7 | 8 | 9 | 10 | |
|---|---|---|---|---|---|---|---|---|---|---|---|
| wt. % oxide | |||||||||||
| WDS | TiO2 | 14.56 | 17.31 | 16.37 | 16.48 | 18.81 | 17.07 | 15.75 | 16.57 | 13.91 | 16.48 |
| V2O5 | 0.44 | 0.44 | 0.94 | 0.20 | 0.26 | 0.21 | 0.25 | 0.24 | 0.37 | 0.20 | |
| SrO | 0.17 | 0.27 | 0.24 | 0.28 | 0.31 | 0.32 | b.d. | 0.13 | b.d. | 0.28 | |
| BaO | b.d. | b.d. | b.d. | b.d. | b.d. | b.d. | b.d. | 0.11 | b.d. | b.d. | |
| La2O3 | 16.89 | 16.51 | 15.17 | 16.14 | 13.95 | 14.03 | 16.40 | 19.33 | 17.16 | 16.14 | |
| Ce2O3 | 24.41 | 22.14 | 22.86 | 22.00 | 20.30 | 20.50 | 21.31 | 24.03 | 24.49 | 22.00 | |
| Pr2O3 | 1.61 | 1.48 | 1.41 | 1.45 | 1.86 | 1.34 | 1.33 | 1.63 | 1.69 | 1.45 | |
| Nd2O3 | 3.90 | 3.53 | 4.19 | 3.67 | 4.19 | 4.08 | 2.90 | 3.90 | 3.96 | 3.67 | |
| Sm2O3 | b.d. | b.d. | b.d. | b.d. | 0.32 | 0.39 | b.d. | 0.26 | 0.26 | b.d. | |
| EDS | MgO | 0.23 | 0.55 | 0.59 | 0.62 | 0.75 | 0.87 | 0.81 | b.d. | b.d. | 0.62 |
| Al2O3 | 0.31 | 1.76 | 0.19 | 1.66 | 0.32 | 0.36 | 2.03 | 0.15 | 0.35 | 1.66 | |
| SiO2 | 19.27 | 20.11 | 19.34 | 19.70 | 20.13 | 19.76 | 19.82 | 19.07 | 19.61 | 19.70 | |
| CaO | 1.45 | 3.76 | 2.56 | 3.44 | 4.77 | 3.92 | 4.01 | 1.12 | 1.43 | 3.44 | |
| MnO | 1.90 | 0.91 | 0.88 | 0.50 | 0.19 | 0.30 | 0.36 | 3.66 | 1.89 | 0.50 | |
| FeO | 10.40 | 8.57 | 10.11 | 9.93 | 9.97 | 10.28 | 9.20 | 8.55 | 10.52 | 9.93 | |
| ZrO2 | b.d. | 0.53 | b.d. | 0.35 | 0.58 | 0.54 | 0.80 | b.d. | b.d. | 0.35 | |
| Nb2O5 | 1.96 | b.d. | 0.78 | 0.45 | 0.39 | 0.52 | 0.31 | 0.26 | 1.95 | 0.45 | |
| ThO2 | 1.50 | b.d. | 4.05 | 1.44 | 2.41 | 4.55 | 3.52 | b.d. | 1.53 | 1.44 | |
| Total | 99.0 | 97.9 | 99.7 | 98.3 | 99.5 | 99.0 | 98.8 | 99.0 | 99.1 | 98.3 | |
| Formula based on 22 oxygens | |||||||||||
| A | La | 1.33 | 1.24 | 1.17 | 1.23 | 1.04 | 1.07 | 1.25 | 1.53 | 1.36 | 1.23 |
| Ce | 1.91 | 1.66 | 1.75 | 1.67 | 1.50 | 1.56 | 1.61 | 1.88 | 1.93 | 1.67 | |
| Pr | 0.13 | 0.11 | 0.11 | 0.11 | 0.14 | 0.10 | 0.10 | 0.13 | 0.13 | 0.11 | |
| Nd | 0.30 | 0.26 | 0.31 | 0.27 | 0.30 | 0.30 | 0.21 | 0.30 | 0.30 | 0.27 | |
| Sm | 0.00 | 0.00 | 0.00 | 0.00 | 0.02 | 0.03 | 0.00 | 0.02 | 0.02 | 0.00 | |
| Ca | 0.33 | 0.82 | 0.58 | 0.76 | 1.03 | 0.87 | 0.89 | 0.26 | 0.33 | 0.76 | |
| Ba | 0.00 | 0.00 | 0.00 | 0.00 | 0.00 | 0.00 | 0.00 | 0.01 | 0.00 | 0.00 | |
| Sr | 0.02 | 0.03 | 0.03 | 0.03 | 0.04 | 0.04 | 0.00 | 0.02 | 0.00 | 0.03 | |
| Th | 0.07 | 0.00 | 0.19 | 0.07 | 0.11 | 0.21 | 0.17 | 0.00 | 0.08 | 0.07 | |
| ΣA | 4.1 | 4.1 | 4.1 | 4.1 | 4.2 | 4.2 | 4.2 | 4.1 | 4.1 | 4.1 | |
| ΣREE | 3.7 | 3.3 | 3.3 | 3.3 | 3.0 | 3.1 | 3.2 | 3.9 | 3.7 | 3.3 | |
| B | Fe2+ Total | 1.863 | 1.465 | 1.772 | 1.719 | 1.683 | 1.782 | 1.586 | 1.532 | 1.889 | 1.719 |
| Fe2+ (B) | 1.0 | 1.0 | 1.0 | 1.0 | 1.0 | 1.0 | 1.0 | 1.0 | 1.0 | 1.0 | |
| C | Fe2+ (C) | 0.86 | 0.47 | 0.77 | 0.72 | 0.68 | 0.78 | 0.59 | 0.53 | 0.89 | 0.72 |
| Mg | 0.08 | 0.17 | 0.18 | 0.19 | 0.23 | 0.27 | 0.25 | 0.00 | 0.00 | 0.19 | |
| Zr | 0.00 | 0.05 | 0.00 | 0.04 | 0.06 | 0.06 | 0.08 | 0.00 | 0.00 | 0.04 | |
| V | 0.06 | 0.06 | 0.13 | 0.03 | 0.04 | 0.03 | 0.03 | 0.03 | 0.05 | 0.03 | |
| Mn | 0.34 | 0.16 | 0.16 | 0.09 | 0.03 | 0.05 | 0.06 | 0.66 | 0.34 | 0.09 | |
| Nb | 0.19 | 0.00 | 0.07 | 0.04 | 0.04 | 0.05 | 0.03 | 0.03 | 0.19 | 0.04 | |
| Al | 0.08 | 0.42 | 0.05 | 0.41 | 0.08 | 0.09 | 0.49 | 0.04 | 0.09 | 0.41 | |
| Ti (total-D) | 0.35 | 0.66 | 0.58 | 0.57 | 0.86 | 0.66 | 0.44 | 0.67 | 0.25 | 0.57 | |
| ΣC | 2.0 | 2.0 | 1.9 | 2.1 | 2.0 | 2.0 | 2.0 | 2.0 | 1.8 | 2.1 | |
| D | Ti total | 2.35 | 2.66 | 2.58 | 2.57 | 2.86 | 2.66 | 2.44 | 2.67 | 2.25 | 2.57 |
| Ti in D | 2.0 | 2.0 | 2.0 | 2.0 | 2.0 | 2.0 | 2.0 | 2.0 | 2.0 | 2.0 | |
| Si | 4.13 | 4.11 | 4.05 | 4.08 | 4.07 | 4.10 | 4.09 | 4.08 | 4.21 | 4.08 | |
| Σcation | 13.2 | 13.2 | 13.1 | 13.3 | 13.2 | 13.3 | 13.3 | 13.2 | 13.2 | 13.3 | |
Table 6.
Chemical analyses (quantitative SEM EDS-WDS) and structural formulae of chevkinite group minerals from the Aksu Diamas heavy mineral separate (sample MPLV 049).
Table 6.
Chemical analyses (quantitative SEM EDS-WDS) and structural formulae of chevkinite group minerals from the Aksu Diamas heavy mineral separate (sample MPLV 049).
| Analysis No. | 1 | 2 | 3 | 4 | 5 | 6 | 7 | 8 | 9 | 10 | |
|---|---|---|---|---|---|---|---|---|---|---|---|
| wt. % oxide | |||||||||||
| WDS | TiO2 | 18.94 | 15.34 | 16.94 | 17.88 | 18.16 | 17.78 | 17.51 | 17.75 | 17.69 | 18.97 |
| V2O5 | 0.27 | 0.24 | 0.26 | 0.19 | 0.27 | 0.20 | 0.47 | 0.48 | 0.22 | 0.22 | |
| SrO | 0.25 | 0.14 | 0.17 | 0.13 | 0.21 | 0.19 | 0.40 | 0.31 | 0.26 | 0.21 | |
| BaO | b.d. | b.d. | b.d. | 0.08 | b.d. | b.d. | b.d. | b.d. | b.d. | b.d. | |
| La2O3 | 12.30 | 14.39 | 16.87 | 14.76 | 15.29 | 14.14 | 18.35 | 17.52 | 15.39 | 13.87 | |
| Ce2O3 | 20.67 | 21.33 | 22.13 | 21.54 | 21.18 | 19.51 | 22.25 | 21.44 | 19.57 | 19.69 | |
| Pr2O3 | 1.54 | 1.41 | 1.27 | 1.42 | 1.13 | 1.33 | 1.14 | 1.15 | 1.14 | 1.39 | |
| Nd2O3 | 4.94 | 3.33 | 3.12 | 3.67 | 3.11 | 3.32 | 2.99 | 2.71 | 2.98 | 3.45 | |
| Sm2O3 | 0.27 | b.d. | 0.24 | b.d. | b.d. | b.d. | b.d. | 0.31 | 0.25 | b.d. | |
| EDS | MgO | 0.82 | 0.42 | 0.30 | 0.33 | 0.36 | 0.66 | 0.30 | 0.39 | 0.49 | 0.67 |
| Al2O3 | 2.65 | 0.24 | 0.24 | 0.52 | 1.51 | 2.27 | 0.50 | 0.50 | 1.77 | 2.58 | |
| SiO2 | 20.90 | 19.47 | 19.57 | 20.08 | 20.61 | 20.48 | 19.72 | 19.84 | 20.40 | 20.72 | |
| CaO | 5.87 | 3.61 | 3.05 | 4.54 | 5.15 | 5.68 | 3.10 | 3.66 | 5.33 | 6.24 | |
| MnO | b.d. | 0.56 | 0.56 | 0.41 | 0.33 | 0.32 | 0.68 | 0.53 | 0.27 | 0.22 | |
| FeO | 7.78 | 11.69 | 11.84 | 11.27 | 9.95 | 8.72 | 11.60 | 11.13 | 9.28 | 7.79 | |
| ZrO2 | 1.03 | 0.55 | b.d. | 0.61 | 0.67 | 1.49 | b.d. | 0.50 | 1.25 | 1.62 | |
| Nb2O5 | b.d. | 1.49 | 0.44 | 0.68 | 0.34 | 0.42 | 0.29 | 0.37 | b.d. | 0.28 | |
| ThO2 | 1.87 | 6.94 | 3.67 | 2.33 | 1.31 | 3.79 | 1.14 | 0.86 | 3.44 | 2.95 | |
| Total | 100.1 | 101.1 | 100.7 | 100.4 | 99.6 | 100.3 | 100.4 | 99.5 | 99.7 | 100.9 | |
| Formula based on 22 oxygens | |||||||||||
| A | La | 0.88 | 1.11 | 1.29 | 1.10 | 1.12 | 1.03 | 1.39 | 1.32 | 1.14 | 0.99 |
| Ce | 1.47 | 1.63 | 1.69 | 1.60 | 1.55 | 1.41 | 1.67 | 1.61 | 1.43 | 1.40 | |
| Pr | 0.11 | 0.11 | 0.10 | 0.11 | 0.08 | 0.10 | 0.09 | 0.09 | 0.08 | 0.10 | |
| Nd | 0.34 | 0.25 | 0.23 | 0.27 | 0.22 | 0.23 | 0.22 | 0.20 | 0.21 | 0.24 | |
| Sm | 0.02 | 0.00 | 0.02 | 0.00 | 0.00 | 0.00 | 0.00 | 0.02 | 0.02 | 0.00 | |
| Ca | 1.22 | 0.81 | 0.68 | 0.98 | 1.10 | 1.20 | 0.68 | 0.80 | 1.14 | 1.29 | |
| Ba | 0.00 | 0.00 | 0.00 | 0.01 | 0.00 | 0.00 | 0.00 | 0.00 | 0.00 | 0.00 | |
| Sr | 0.03 | 0.02 | 0.02 | 0.02 | 0.02 | 0.02 | 0.05 | 0.04 | 0.03 | 0.02 | |
| Th | 0.08 | 0.33 | 0.17 | 0.11 | 0.06 | 0.17 | 0.05 | 0.04 | 0.16 | 0.13 | |
| ΣA | 4.2 | 4.3 | 4.2 | 4.2 | 4.2 | 4.2 | 4.1 | 4.1 | 4.2 | 4.2 | |
| ΣREE | 2.8 | 3.1 | 3.3 | 3.1 | 3.0 | 2.8 | 3.4 | 3.2 | 2.9 | 2.7 | |
| B | Fe2+ Total | 1.26 | 2.04 | 2.06 | 1.91 | 1.66 | 1.44 | 1.99 | 1.91 | 1.55 | 1.26 |
| Fe2+ (B) | 1.0 | 1.0 | 1.0 | 1.0 | 1.0 | 1.0 | 1.0 | 1.0 | 1.0 | 1.0 | |
| C | Fe2+ (C) | 0.26 | 1.04 | 1.06 | 0.91 | 0.66 | 0.44 | 0.99 | 0.91 | 0.55 | 0.26 |
| Mg | 0.24 | 0.13 | 0.09 | 0.10 | 0.11 | 0.20 | 0.09 | 0.12 | 0.15 | 0.19 | |
| Zr | 0.10 | 0.06 | 0.00 | 0.06 | 0.07 | 0.14 | 0.00 | 0.05 | 0.12 | 0.15 | |
| V | 0.03 | 0.03 | 0.04 | 0.03 | 0.04 | 0.03 | 0.06 | 0.07 | 0.03 | 0.03 | |
| Mn | 0.00 | 0.10 | 0.10 | 0.07 | 0.06 | 0.05 | 0.12 | 0.09 | 0.05 | 0.04 | |
| Nb | 0.00 | 0.14 | 0.04 | 0.06 | 0.03 | 0.04 | 0.03 | 0.03 | 0.00 | 0.02 | |
| Al | 0.61 | 0.06 | 0.06 | 0.12 | 0.36 | 0.53 | 0.12 | 0.12 | 0.42 | 0.59 | |
| Ti (total-D) | 0.77 | 0.41 | 0.65 | 0.72 | 0.72 | 0.64 | 0.70 | 0.73 | 0.66 | 0.76 | |
| ΣC | 2.0 | 2.0 | 2.0 | 2.1 | 2.0 | 2.1 | 2.1 | 2.1 | 2.0 | 2.0 | |
| D | Ti total | 2.77 | 2.41 | 2.65 | 2.72 | 2.72 | 2.64 | 2.70 | 2.73 | 2.66 | 2.76 |
| Ti in D | 2.0 | 2.0 | 2.0 | 2.0 | 2.0 | 2.0 | 2.0 | 2.0 | 2.0 | 2.0 | |
| Si | 4.06 | 4.07 | 4.07 | 4.06 | 4.11 | 4.04 | 4.05 | 4.06 | 4.09 | 4.01 | |
| ΣCation | 13.2 | 13.3 | 13.3 | 13.3 | 13.3 | 13.3 | 13.3 | 13.3 | 13.3 | 13.2 | |
Table 7.
Trace element analysis of zircon (mg/kg) from Gölcük heavy mineral separates. Lan/Lun = normalized to chondrite after Sun and McDonough (1989) [74].
Table 7.
Trace element analysis of zircon (mg/kg) from Gölcük heavy mineral separates. Lan/Lun = normalized to chondrite after Sun and McDonough (1989) [74].
| Sample | Ti | Y | Nb | Ta | La | Ce | Pr | Nd | Sm | Eu | Gd | Dy | Er | Yb | Lu | Lan/Lun |
|---|---|---|---|---|---|---|---|---|---|---|---|---|---|---|---|---|
| Gölcük MPLV057 | 7.7 | 1073 | 4.7 | 1.2 | 0.06 | 162.2 | 0.34 | 7.1 | 9.3 | 3.8 | 31 | 92 | 150 | 391 | 69 | 0.00010 |
| 6.0 | 1165 | 4.0 | 1.1 | 0.04 | 178.7 | 0.55 | 8.4 | 12.3 | 3.7 | 31 | 99 | 149 | 398 | 68 | 0.00006 | |
| 9.4 | 745 | 3.1 | 1.2 | 0.02 | 117.3 | 0.34 | 5.6 | 6.8 | 2.3 | 24 | 63 | 96 | 242 | 42 | 0.00004 | |
| 10.9 | 2209 | 9.7 | 2.2 | 0.19 | 443.0 | 1.85 | 31.4 | 31.7 | 10.5 | 73 | 203 | 271 | 617 | 105 | 0.00019 | |
| 13.3 | 2290 | 5.1 | 1.0 | 0.40 | 267.3 | 1.55 | 28.8 | 31.6 | 11.2 | 75 | 206 | 277 | 668 | 118 | 0.00036 | |
| 2.8 | 1446 | 3.3 | 0.8 | 0.26 | 112.3 | 0.66 | 8.8 | 13.4 | 5.4 | 38 | 117 | 196 | 551 | 105 | 0.00026 | |
| 8.1 | 819 | 2.9 | 1.0 | 0.02 | 129.0 | 0.34 | 6.1 | 7.5 | 2.7 | 23 | 65 | 112 | 291 | 52 | 0.00004 | |
| 7.5 | 979 | 4.7 | 1.3 | 0.00 | 118.1 | 0.23 | 4.4 | 5.8 | 2.0 | 20 | 72 | 136 | 369 | 68 | 0.00000 | |
| 5.1 | 1326 | 4.6 | 1.4 | 0.07 | 192.4 | 0.51 | 10.0 | 12.4 | 3.7 | 33 | 103 | 168 | 425 | 72 | 0.00010 | |
| 5.9 | 1597 | 4.9 | 1.3 | 0.12 | 186.2 | 0.90 | 15.2 | 17.5 | 6.0 | 48 | 139 | 212 | 526 | 92 | 0.00014 | |
| 5.6 | 1215 | 3.1 | 0.8 | 0.07 | 117.5 | 0.54 | 9.4 | 11.0 | 3.1 | 30 | 102 | 171 | 431 | 76 | 0.00010 | |
| 7.7 | 1215 | 4.1 | 1.0 | 0.07 | 141.4 | 0.53 | 9.3 | 11.5 | 3.8 | 33 | 102 | 168 | 435 | 72 | 0.00010 | |
| 6.8 | 1205 | 5.8 | 1.3 | 0.05 | 162.2 | 0.37 | 6.8 | 8.2 | 2.6 | 25 | 95 | 164 | 418 | 75 | 0.00007 | |
| 11.7 | 1818 | 6.5 | 1.7 | 0.26 | 210.1 | 0.85 | 17.3 | 21.9 | 5.8 | 54 | 161 | 255 | 578 | 97 | 0.00029 | |
| 7.8 | 863 | 2.0 | 0.4 | 0.35 | 118.2 | 0.56 | 8.4 | 8.6 | 2.5 | 24 | 70 | 116 | 292 | 54 | 0.00069 | |
| 14.8 | 1115 | 3.6 | 1.0 | 0.69 | 167.4 | 0.52 | 8.5 | 10.3 | 3.5 | 31 | 99 | 160 | 392 | 69 | 0.00107 | |
| 12.6 | 241 | 1.1 | 0.4 | 0.01 | 41.9 | 0.13 | 2.1 | 2.7 | 0.9 | 7 | 23 | 35 | 81 | 14 | 0.00004 | |
| 8.3 | 1697 | 2.2 | 0.9 | 0.11 | 97.8 | 0.96 | 15.8 | 20.7 | 6.2 | 53 | 156 | 223 | 494 | 84 | 0.00014 | |
| 5.4 | 1476 | 8.9 | 2.2 | 0.04 | 181.0 | 0.21 | 4.4 | 5.8 | 2.0 | 21 | 108 | 216 | 602 | 99 | 0.00004 | |
| 9.8 | 910 | 2.5 | 0.9 | 0.02 | 84.2 | 0.45 | 7.8 | 8.3 | 2.7 | 26 | 81 | 128 | 314 | 57 | 0.00004 | |
| 9.1 | 604 | 2.3 | 0.6 | 0.46 | 86.8 | 0.30 | 3.8 | 5.6 | 1.8 | 15 | 52 | 86 | 216 | 39 | 0.00128 | |
| 6.3 | 660 | 2.7 | 0.8 | 0.06 | 103.9 | 0.27 | 4.8 | 5.8 | 1.7 | 19 | 57 | 96 | 237 | 42 | 0.00014 | |
| 7.5 | 1115 | 5.0 | 0.9 | 0.05 | 125.8 | 0.31 | 6.2 | 6.2 | 2.0 | 24 | 80 | 151 | 382 | 71 | 0.00007 | |
| 8.2 | 699 | 2.9 | 1.0 | 0.22 | 103.0 | 0.39 | 5.7 | 6.5 | 2.1 | 20 | 65 | 102 | 246 | 44 | 0.00054 | |
| 5.7 | 833 | 2.3 | 0.6 | 0.04 | 80.1 | 0.23 | 4.1 | 5.9 | 1.8 | 18 | 65 | 115 | 298 | 54 | 0.00007 | |
| 3.4 | 424 | 1.9 | 0.5 | 0.03 | 71.8 | 0.15 | 3.1 | 3.1 | 0.9 | 8 | 29 | 59 | 158 | 28 | 0.00009 | |
| 9.4 | 3093 | 16.8 | 3.5 | 0.06 | 379.6 | 0.90 | 18.8 | 22.5 | 8.1 | 68 | 227 | 400 | 1019 | 176 | 0.00004 | |
| 10.7 | 983 | 4.5 | 1.4 | 0.04 | 147.8 | 0.41 | 7.4 | 10.1 | 2.9 | 29 | 85 | 133 | 336 | 59 | 0.00008 | |
| 7.5 | 1155 | 2.1 | 0.6 | 0.04 | 85.3 | 0.48 | 7.8 | 8.6 | 3.0 | 28 | 91 | 155 | 410 | 74 | 0.00005 | |
| 10.7 | 393 | 0.9 | 0.4 | 0.00 | 58.8 | 0.21 | 3.6 | 4.9 | 1.8 | 13 | 37 | 55 | 132 | 24 | 0.00000 | |
| 10.6 | 1597 | 2.4 | 0.7 | 0.89 | 109.0 | 0.99 | 17.3 | 17.9 | 5.3 | 46 | 142 | 224 | 529 | 90 | 0.00105 |
Table 8.
Trace element analysis of zircon (mg/kg) from Aksu Diamas heavy mineral separates. Lan/Lun = normalized to chondrite after Sun and McDonough (1989) [74].
Table 8.
Trace element analysis of zircon (mg/kg) from Aksu Diamas heavy mineral separates. Lan/Lun = normalized to chondrite after Sun and McDonough (1989) [74].
| Sample | Ti | Y | Nb | Ta | La | Ce | Pr | Nd | Sm | Eu | Gd | Dy | Er | Yb | Lu | Lan/Lun |
|---|---|---|---|---|---|---|---|---|---|---|---|---|---|---|---|---|
| Aksu Diamas MPLV051 | 10.3 | 869 | 1.6 | 0.5 | 0.13 | 68.4 | 1.01 | 17.1 | 18.9 | 6.7 | 37 | 90 | 119 | 343 | 45 | 0.00031 |
| 10.5 | 736 | 2.5 | 0.7 | 0.07 | 130.5 | 0.51 | 8.5 | 11.1 | 4.0 | 25 | 66 | 107 | 293 | 42 | 0.00017 | |
| 7.1 | 1012 | 1.6 | 0.5 | 0.10 | 83.2 | 1.03 | 19.0 | 18.1 | 6.5 | 40 | 106 | 141 | 385 | 47 | 0.00023 | |
| 7.5 | 1126 | 2.5 | 0.8 | 0.10 | 97.4 | 1.05 | 15.0 | 17.7 | 5.5 | 40 | 109 | 156 | 467 | 60 | 0.00018 | |
| 7.3 | 435 | 1.0 | 0.4 | 0.02 | 40.2 | 0.27 | 4.3 | 6.7 | 2.7 | 18 | 49 | 66 | 173 | 22 | 0.00010 | |
| 8.6 | 556 | 3.5 | 1.1 | 0.03 | 90.2 | 0.19 | 4.6 | 5.6 | 2.0 | 16 | 51 | 77 | 248 | 33 | 0.00010 | |
| 5.2 | 431 | 1.6 | 0.4 | 0.05 | 102.0 | 0.27 | 4.5 | 6.4 | 1.9 | 15 | 40 | 62 | 185 | 24 | 0.00020 | |
| 9.9 | 288 | 0.9 | 0.2 | 0.02 | 57.3 | 0.19 | 3.6 | 3.9 | 1.8 | 12 | 29 | 42 | 123 | 15 | 0.00012 | |
| 6.3 | 1145 | 2.2 | 1.0 | 0.17 | 83.2 | 0.95 | 16.6 | 20.2 | 6.0 | 42 | 108 | 157 | 457 | 58 | 0.00031 | |
| 4.8 | 1828 | 4.2 | 0.9 | 0.20 | 182.0 | 1.35 | 23.4 | 26.5 | 8.2 | 63 | 176 | 244 | 677 | 82 | 0.00026 | |
| 7.9 | 312 | 1.4 | 0.5 | 0.00 | 69.4 | 0.21 | 3.7 | 3.7 | 1.3 | 10 | 30 | 47 | 139 | 19 | 0.00002 | |
| 11.1 | 1441 | 6.7 | 1.8 | 0.26 | 300.6 | 0.97 | 19.8 | 24.6 | 8.4 | 53 | 146 | 200 | 558 | 72 | 0.00038 | |
| 7.3 | 1079 | 8.7 | 2.5 | 0.04 | 174.7 | 0.40 | 7.7 | 9.8 | 3.7 | 27 | 91 | 156 | 495 | 71 | 0.00005 | |
| 9.7 | 521 | 1.5 | 0.3 | 0.03 | 63.5 | 0.22 | 4.4 | 4.6 | 2.2 | 14 | 42 | 71 | 238 | 34 | 0.00008 | |
| 6.4 | 244 | 0.8 | 0.2 | 0.00 | 33.3 | 0.06 | 1.3 | 2.2 | 0.9 | 6 | 19 | 37 | 124 | 17 | 0.00000 | |
| 8.1 | 602 | 3.4 | 0.9 | 0.05 | 129.4 | 0.35 | 6.7 | 8.5 | 2.9 | 19 | 58 | 85 | 254 | 33 | 0.00016 | |
| 6.8 | 471 | 2.2 | 1.5 | 0.00 | 20.6 | 0.05 | 1.0 | 1.9 | 0.5 | 7 | 36 | 86 | 306 | 51 | 0.00000 | |
| 14.0 | 668 | 1.4 | 0.6 | 0.03 | 63.5 | 0.57 | 10.0 | 11.2 | 4.2 | 28 | 75 | 99 | 245 | 34 | 0.00008 | |
| 9.1 | 617 | 3.1 | 0.9 | 0.03 | 113.3 | 0.36 | 5.8 | 7.2 | 2.4 | 16 | 56 | 90 | 262 | 38 | 0.00008 | |
| 4.6 | 1707 | 5.8 | 1.5 | 0.50 | 148.7 | 1.29 | 18.1 | 21.4 | 6.7 | 50 | 153 | 244 | 720 | 93 | 0.00058 | |
| 13.8 | 790 | 5.5 | 1.6 | 0.71 | 170.6 | 0.62 | 13.1 | 15.9 | 5.7 | 32 | 82 | 108 | 285 | 36 | 0.00214 | |
| 9.3 | 981 | 5.5 | 1.1 | 0.03 | 162.2 | 0.29 | 7.0 | 8.6 | 2.5 | 25 | 82 | 137 | 404 | 62 | 0.00006 | |
| 16.6 | 1467 | 4.7 | 1.4 | 0.23 | 312.0 | 2.24 | 40.8 | 42.4 | 15.8 | 81 | 166 | 192 | 399 | 51 | 0.00049 | |
| 9.0 | 1004 | 1.5 | 0.7 | 0.08 | 77.0 | 0.76 | 13.7 | 15.1 | 4.4 | 35 | 101 | 145 | 369 | 50 | 0.00017 | |
| 10.9 | 349 | 1.4 | 0.5 | 0.03 | 55.3 | 0.15 | 3.2 | 4.4 | 1.5 | 11 | 32 | 51 | 150 | 22 | 0.00013 | |
| 5.5 | 1102 | 2.3 | 0.7 | 0.08 | 86.6 | 0.76 | 13.3 | 14.8 | 5.0 | 36 | 104 | 154 | 424 | 64 | 0.00014 | |
| 13.0 | 1577 | 3.7 | 1.0 | 0.19 | 189.3 | 1.29 | 24.8 | 29.3 | 9.9 | 65 | 161 | 230 | 548 | 81 | 0.00024 | |
| 11.7 | 864 | 5.3 | 1.8 | 0.06 | 133.1 | 0.43 | 6.9 | 10.9 | 4.2 | 32 | 93 | 129 | 349 | 46 | 0.00014 | |
| 8.4 | 1018 | 4.0 | 1.2 | 0.08 | 113.3 | 0.69 | 11.6 | 13.8 | 5.4 | 33 | 97 | 156 | 467 | 64 | 0.00014 | |
| 4.0 | 1897 | 4.4 | 0.9 | 0.19 | 175.8 | 1.29 | 21.6 | 20.9 | 7.1 | 51 | 154 | 266 | 768 | 113 | 0.00018 | |
| 12.4 | 927 | 6.3 | 2.6 | 0.03 | 88.6 | 0.20 | 6.0 | 9.5 | 2.6 | 26 | 83 | 143 | 352 | 56 | 0.00006 | |
| 7.0 | 1544 | 8.6 | 1.6 | 0.14 | 287.0 | 0.59 | 12.0 | 12.0 | 3.9 | 35 | 113 | 210 | 587 | 98 | 0.00015 | |
| 9.8 | 1574 | 3.3 | 0.9 | 0.19 | 130.1 | 1.09 | 18.5 | 22.6 | 6.2 | 53 | 144 | 221 | 581 | 87 | 0.00023 | |
| 8.6 | 1386 | 2.0 | 0.8 | 0.11 | 78.7 | 0.92 | 15.1 | 19.3 | 6.4 | 47 | 127 | 189 | 487 | 75 | 0.00016 | |
| 5.6 | 1390 | 3.1 | 0.9 | 0.11 | 94.5 | 0.83 | 13.4 | 14.4 | 4.7 | 41 | 121 | 199 | 520 | 85 | 0.00013 | |
| 8.6 | 996 | 4.4 | 1.3 | 0.12 | 150.8 | 0.36 | 6.0 | 7.6 | 2.5 | 24 | 79 | 145 | 382 | 63 | 0.00020 | |
| 10.2 | 1426 | 5.0 | 0.8 | 0.08 | 193.4 | 0.42 | 8.2 | 12.0 | 4.2 | 37 | 119 | 195 | 473 | 78 | 0.00011 | |
| 15.6 | 912 | 3.6 | 1.3 | 0.08 | 145.5 | 0.51 | 9.1 | 13.2 | 4.4 | 31 | 86 | 131 | 319 | 55 | 0.00016 | |
| 7.5 | 640 | 2.8 | 0.7 | 0.04 | 100.2 | 0.22 | 5.3 | 6.4 | 2.4 | 18 | 56 | 90 | 232 | 42 | 0.00011 |
Table 9.
Summary table of LA-ICP-MS magnetite data for elements of interest in samples MPLV058 (Gölcük) and MPLV050 (Aksu Diamas). Ni/Cr ratios were calculated based on maximum, minimum, and average values per sample (not presented). Full data are presented in Table S2.
Table 9.
Summary table of LA-ICP-MS magnetite data for elements of interest in samples MPLV058 (Gölcük) and MPLV050 (Aksu Diamas). Ni/Cr ratios were calculated based on maximum, minimum, and average values per sample (not presented). Full data are presented in Table S2.
| Sample | Gölcük MPLV058 | Aksu Diamas MPLV050 | ||||
|---|---|---|---|---|---|---|
| N = 25 | N = 13 | |||||
| Min | Max | Mean | Min | Max | Mean | |
| Ti (wt. %) | 2.57 | 2.73 | 2.61 | 1.14 | 3.12 | 2.17 |
| Al (wt. %) | 0.523 | 2.08 | 1.22 | 0.364 | 1.30 | 0.770 |
| Mg (wt. %) | 0.369 | 1.20 | 0.658 | 0.174 | 1.45 | 0.567 |
| V (wt. %) | 0.185 | 0.218 | 0.209 | 0.084 | 0.200 | 0.166 |
| Mn (wt. %) | 0.257 | 0.618 | 0.393 | 0.413 | 0.929 | 0.542 |
| Co (mg/kg) | 73.9 | 174 | 122 | 52.0 | 214 | 115 |
| Zn (mg/kg) | 505 | 1099 | 730 | 696 | 1286 | 893 |
| Cr (mg/kg) | 8.30 | 127 | 64.9 | 13.9 | 312 | 85.8 |
| P (mg/kg) | 53.0 | 1550 | 186 | 76.0 | 1350 | 432 |
| Ni (mg/kg) | 26.2 | 117 | 41.5 | 10.8 | 186 | 73.5 |
| Cu (mg/kg) | 3.18 | 810 | 44.9 | 0.550 | 114 | 19.7 |
| Y (mg/kg) | 0.029 | 7.40 | 0.628 | 0.041 | 9.00 | 2.53 |
| Zr (mg/kg) | 26.8 | 52.8 | 34.5 | 0.830 | 49.2 | 22.4 |
| Nb (mg/kg) | 5.72 | 16.4 | 11.4 | 0.026 | 19.5 | 11.7 |
| Sn (mg/kg) | 5.90 | 20.6 | 14.5 | 6.90 | 16.3 | 10.7 |
| Pb (mg/kg) | 0.032 | 8.39 | 1.40 | 0.052 | 2.54 | 0.707 |
| Ni/Cr | 0.239 | 4.04 | 0.839 | 0.277 | 1.88 | 1.02 |
© 2019 by the authors. Licensee MDPI, Basel, Switzerland. This article is an open access article distributed under the terms and conditions of the Creative Commons Attribution (CC BY) license (http://creativecommons.org/licenses/by/4.0/).
Share and Cite
MDPI and ACS Style
Deady, E.; Lacinska, A.; Goodenough, K.M.; Shaw, R.A.; Roberts, N.M.W. Volcanic-Derived Placers as a Potential Resource of Rare Earth Elements: The Aksu Diamas Case Study, Turkey. Minerals 2019, 9, 208. https://doi.org/10.3390/min9040208
AMA Style
Deady E, Lacinska A, Goodenough KM, Shaw RA, Roberts NMW. Volcanic-Derived Placers as a Potential Resource of Rare Earth Elements: The Aksu Diamas Case Study, Turkey. Minerals. 2019; 9(4):208. https://doi.org/10.3390/min9040208
Chicago/Turabian StyleDeady, Eimear, Alicja Lacinska, Kathryn M. Goodenough, Richard A. Shaw, and Nick M. W. Roberts. 2019. "Volcanic-Derived Placers as a Potential Resource of Rare Earth Elements: The Aksu Diamas Case Study, Turkey" Minerals 9, no. 4: 208. https://doi.org/10.3390/min9040208
Note that from the first issue of 2016, this journal uses article numbers instead of page numbers. See further details here.