Integrating the Theory of Sampling into Underground Mine Grade Control Strategies: Case Studies from Gold Operations

 , , , and
Abstract
:1. Introduction
1.1. Rationale for this Contribution
1.2. Importance of Sampling
1.3. Theory of Sampling
1.3.1. Overview of Theory of Sampling
1.3.2. FSE Equation and its Application
1.4. Determining Sampling Variability-Duplicate Pair Analysis
1.5. Sampling Programme Risk Review
2. Case Study 1: Ballarat Mine, Australia
2.1. Introduction
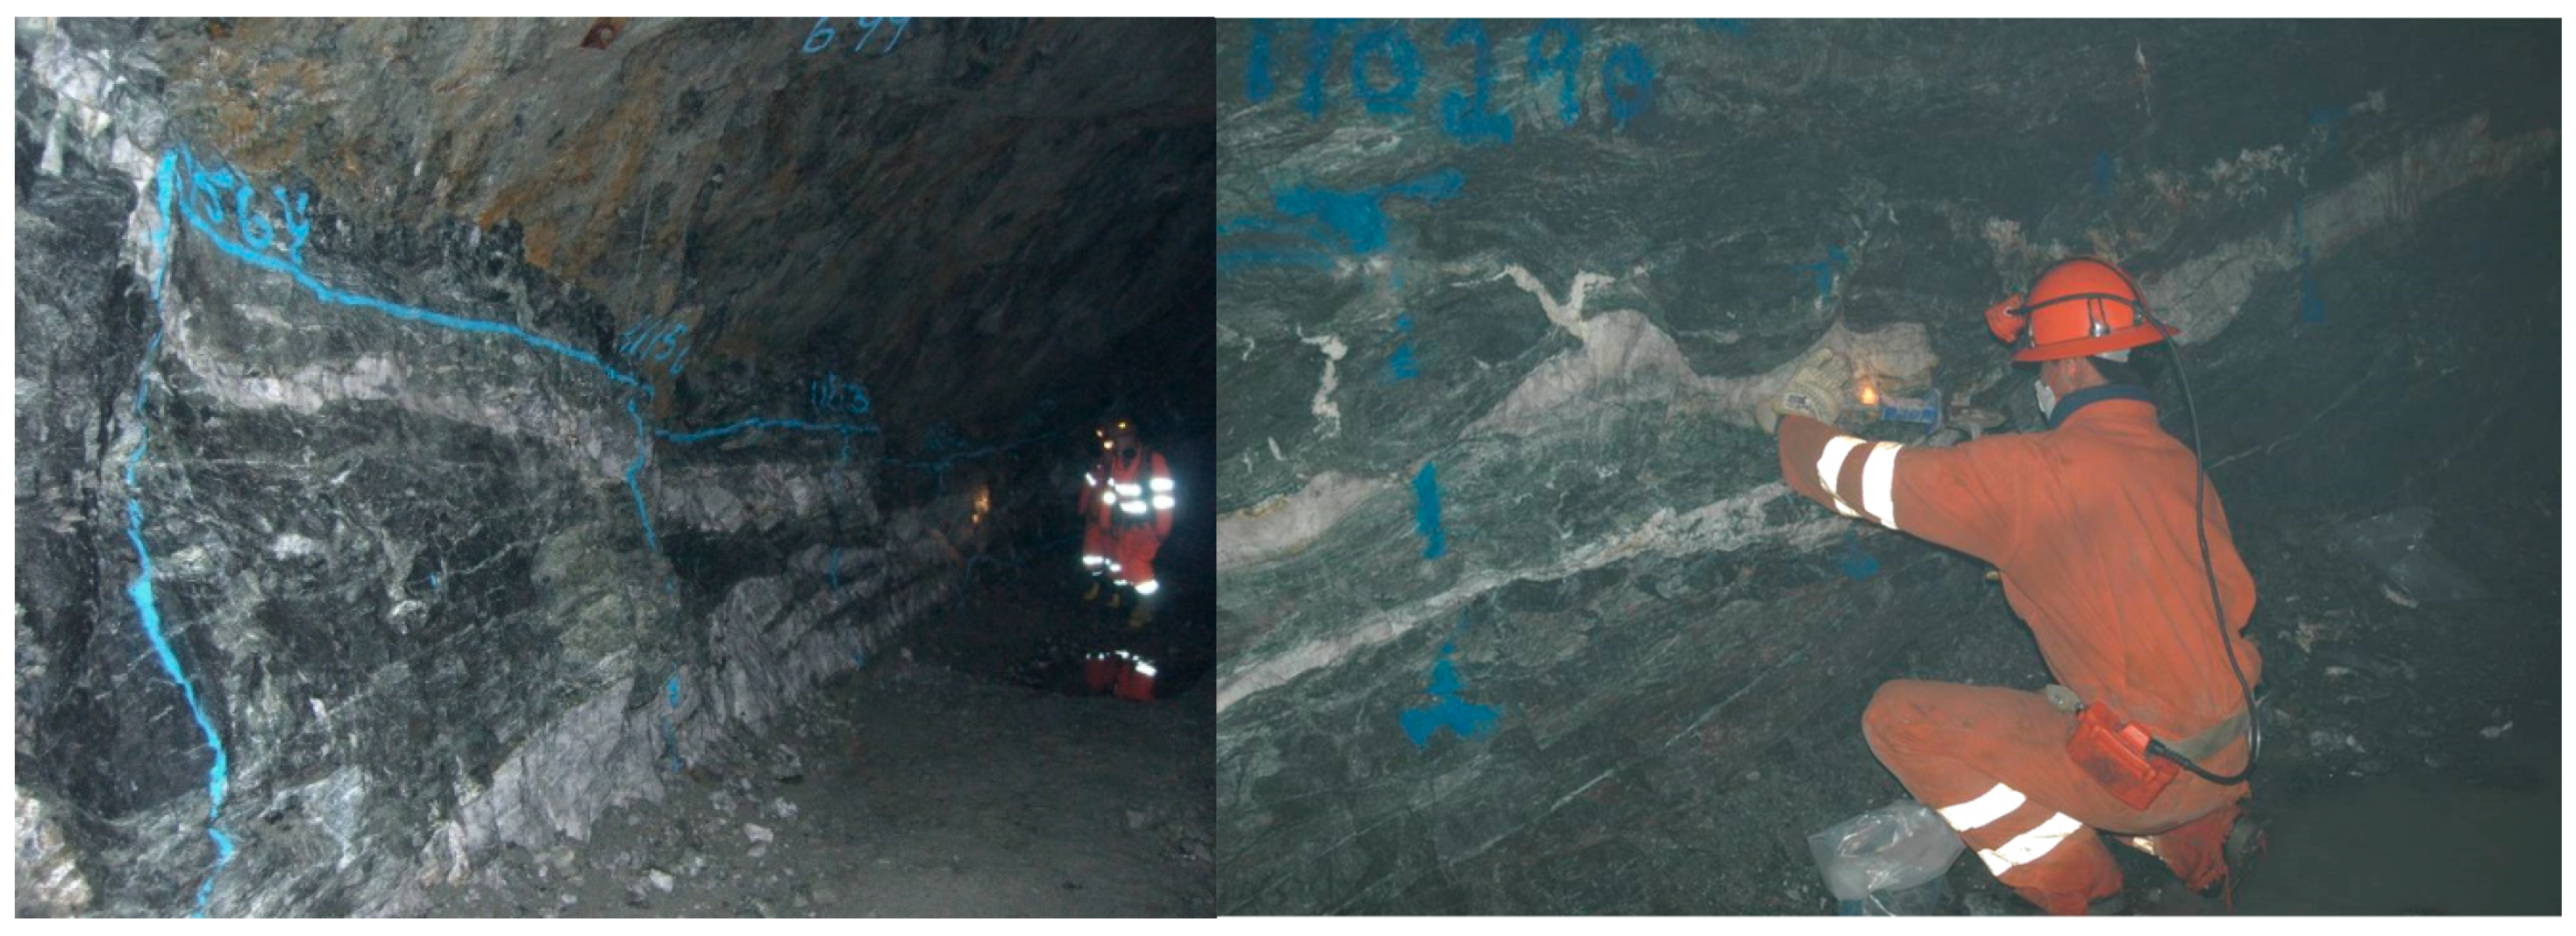
2.2. Geology and Mineralisation
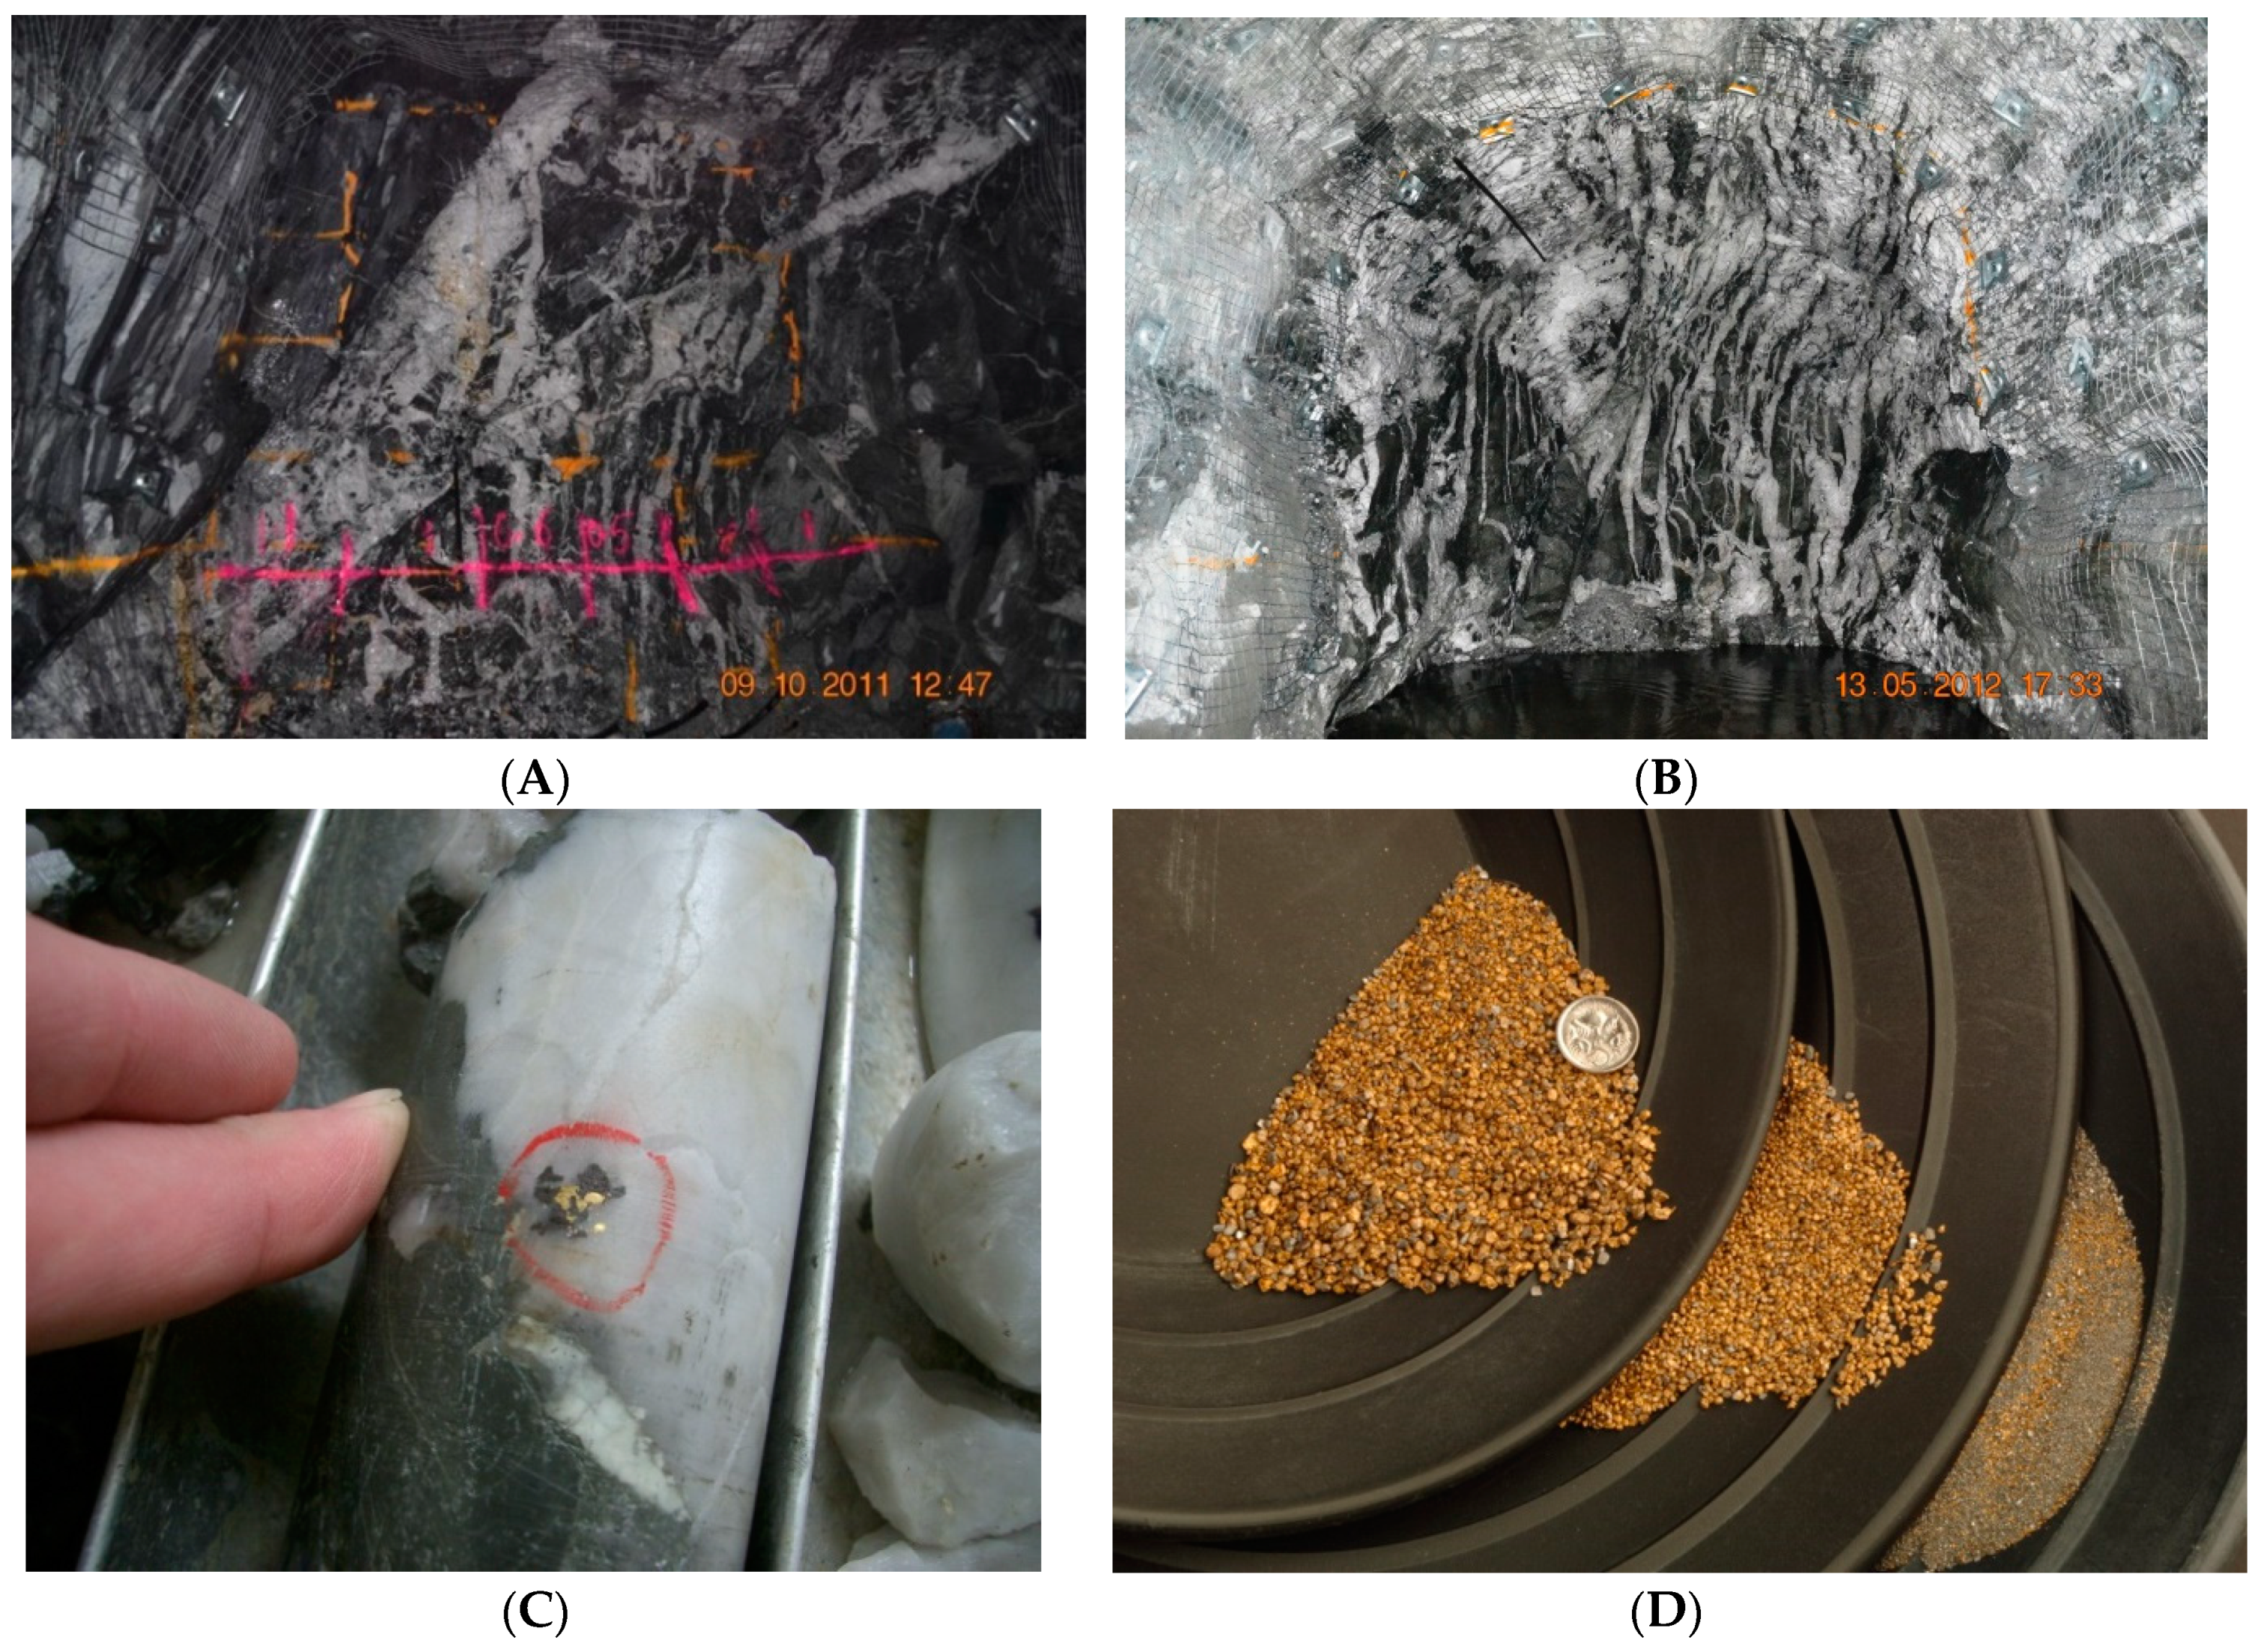
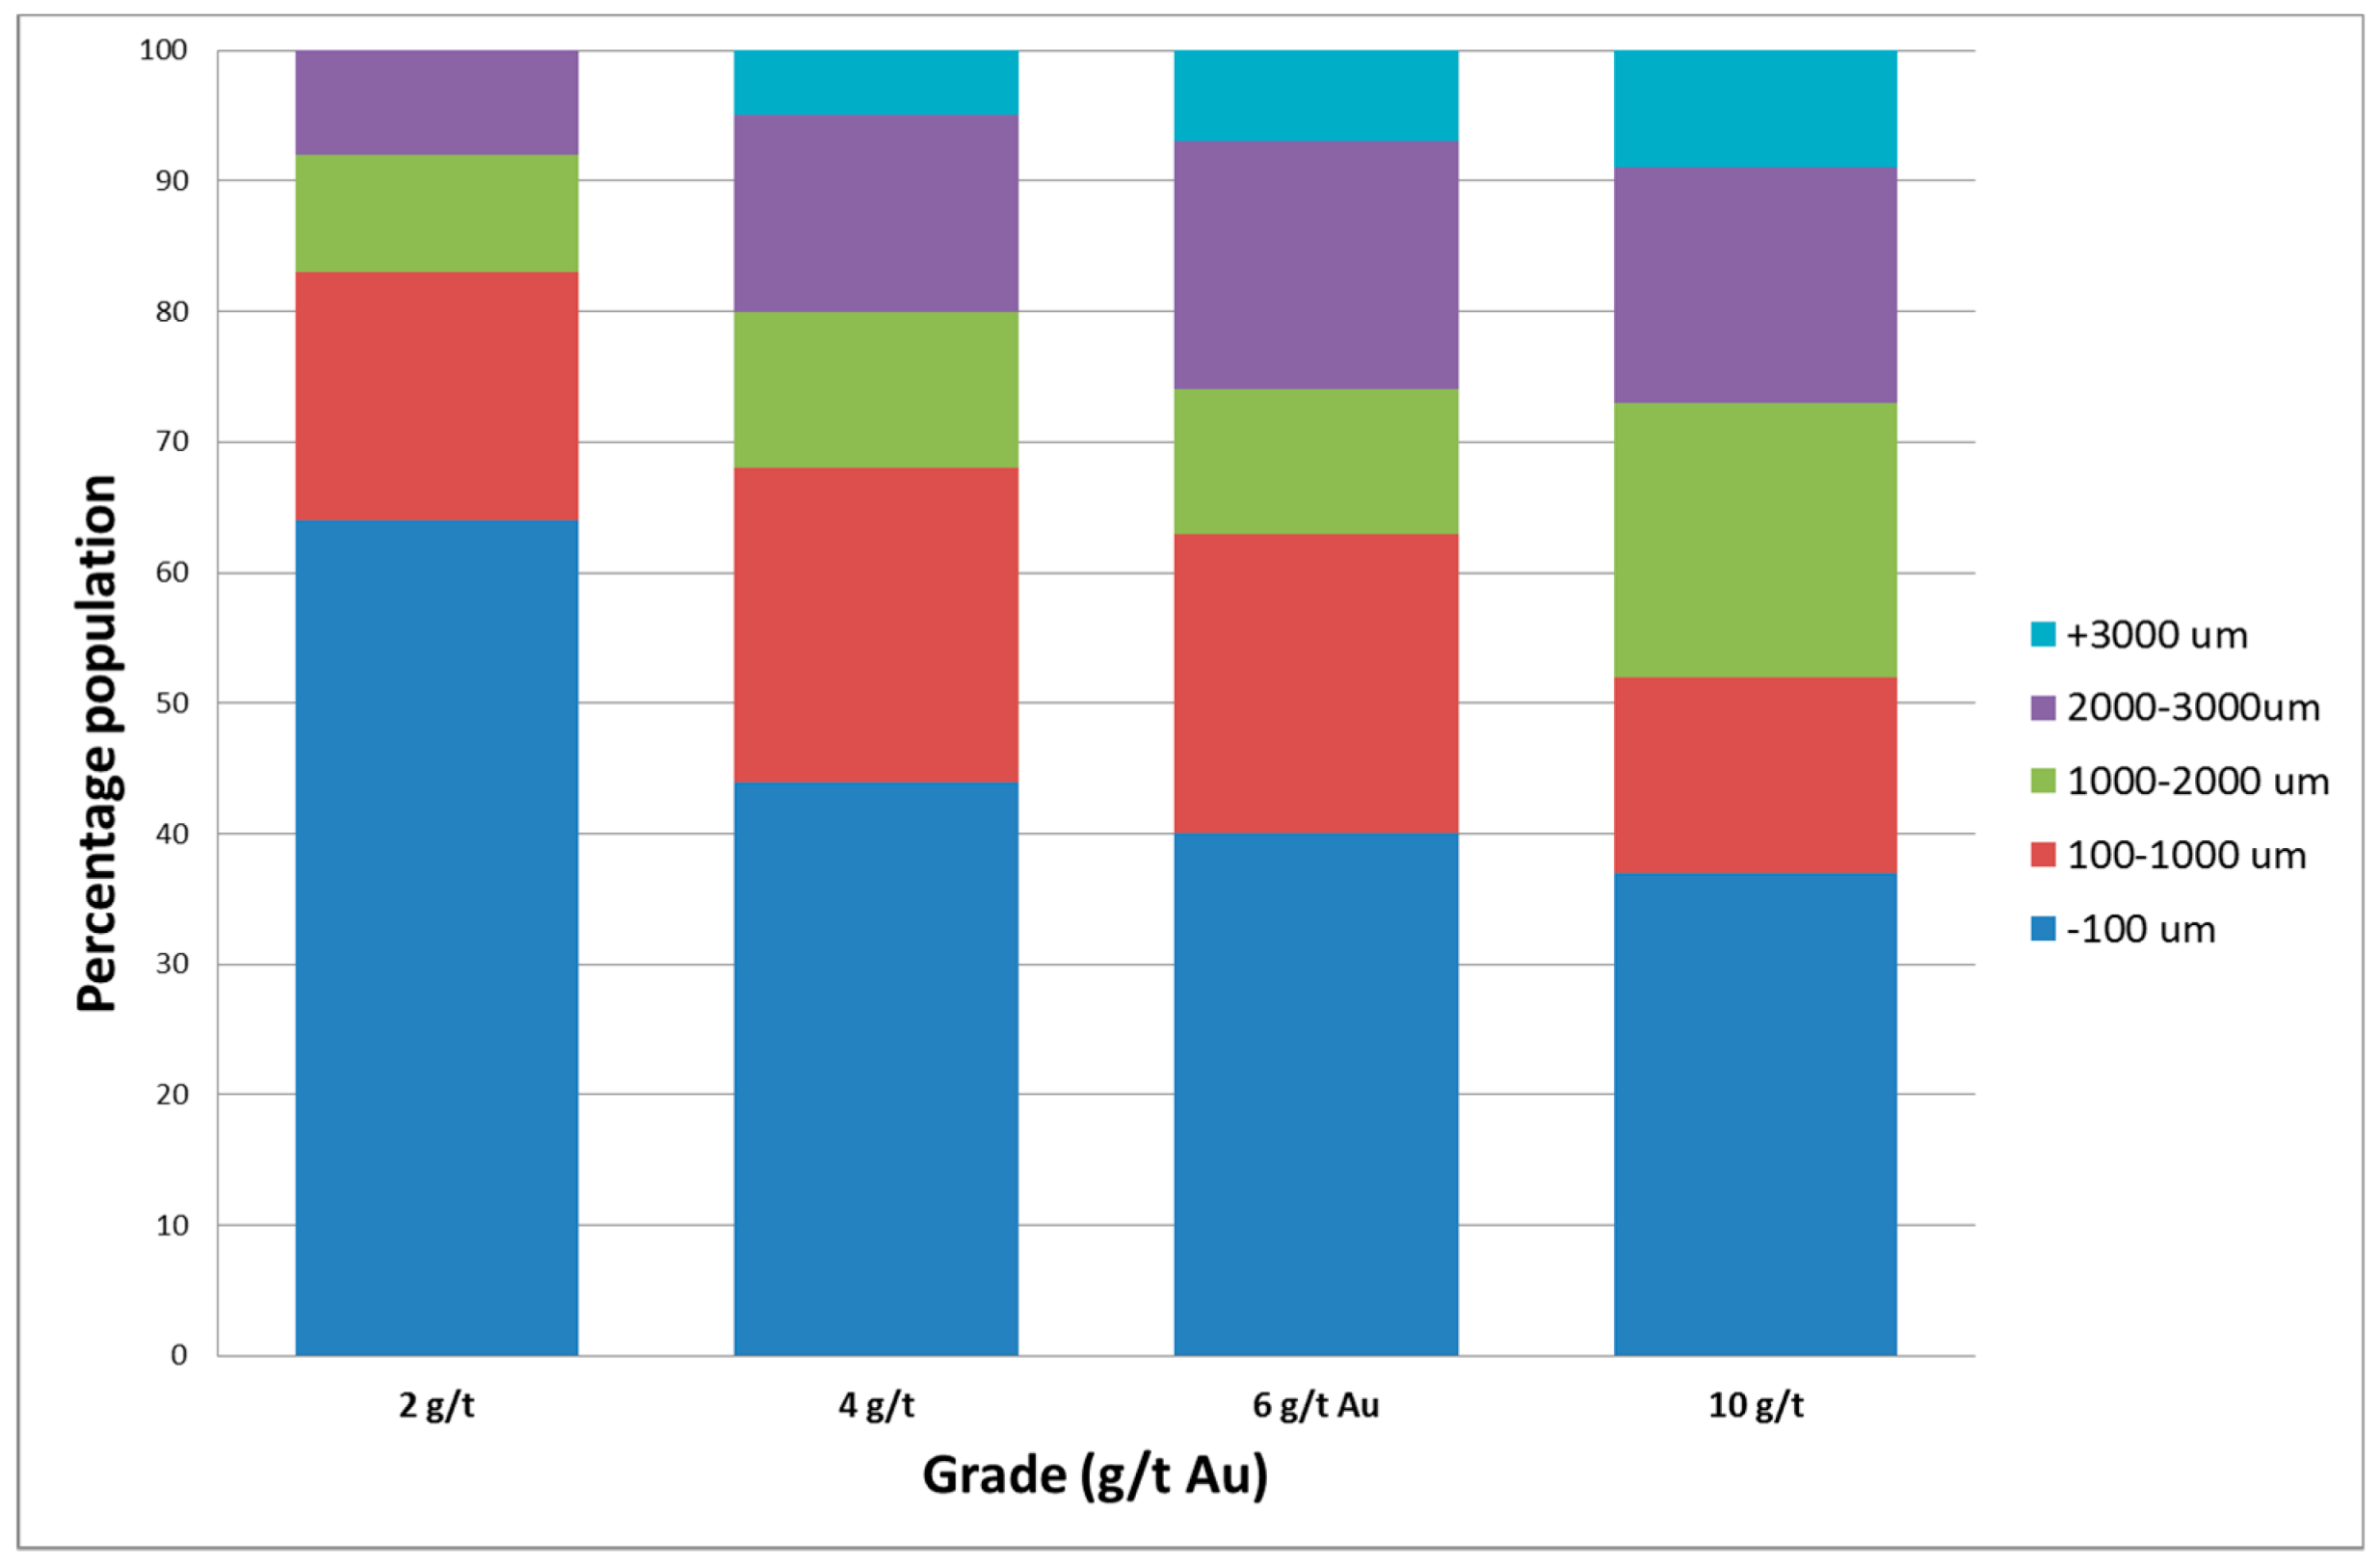
2.3. Gold Particle Size and Liberation Diameter
2.3.1. Process Plant Batch Analysis
2.3.2. Pulp Heterogeneity Testwork
2.4. Theoretical Sample Mass
2.5. Sampling Protocol Development
2.5.1. Project History
2.5.2. BGF (1983–2006)
2.5.3. LGL (2007–2010)
2.5.4. CGT (2010-present time)–Resource Drill Core Sampling
2.5.5. CGT (2010-present time)—Grade Control Sampling
2.6. Quality Assurance/Quality Control
2.7. Duplicate Pair Analysis
2.8. Discussion
3. Case Study 2: San Christina Mine, South America
3.1. Introduction
3.2. Geology and Mineralisation
3.3. Gold Particle Size and Liberation Diameter: Characterisation via Bulk Sampling
3.4. Theoretical Sample Mass
3.5. Sampling Protocol Development
3.5.1. Channel Sampling and Assay Methodology
3.5.2. Diamond Drilling Programme
3.5.3. Duplicate Pair Analysis—Channel and Core Samples
3.6. Bulk Sample Trials
3.6.1. Bulk Sample Strategy
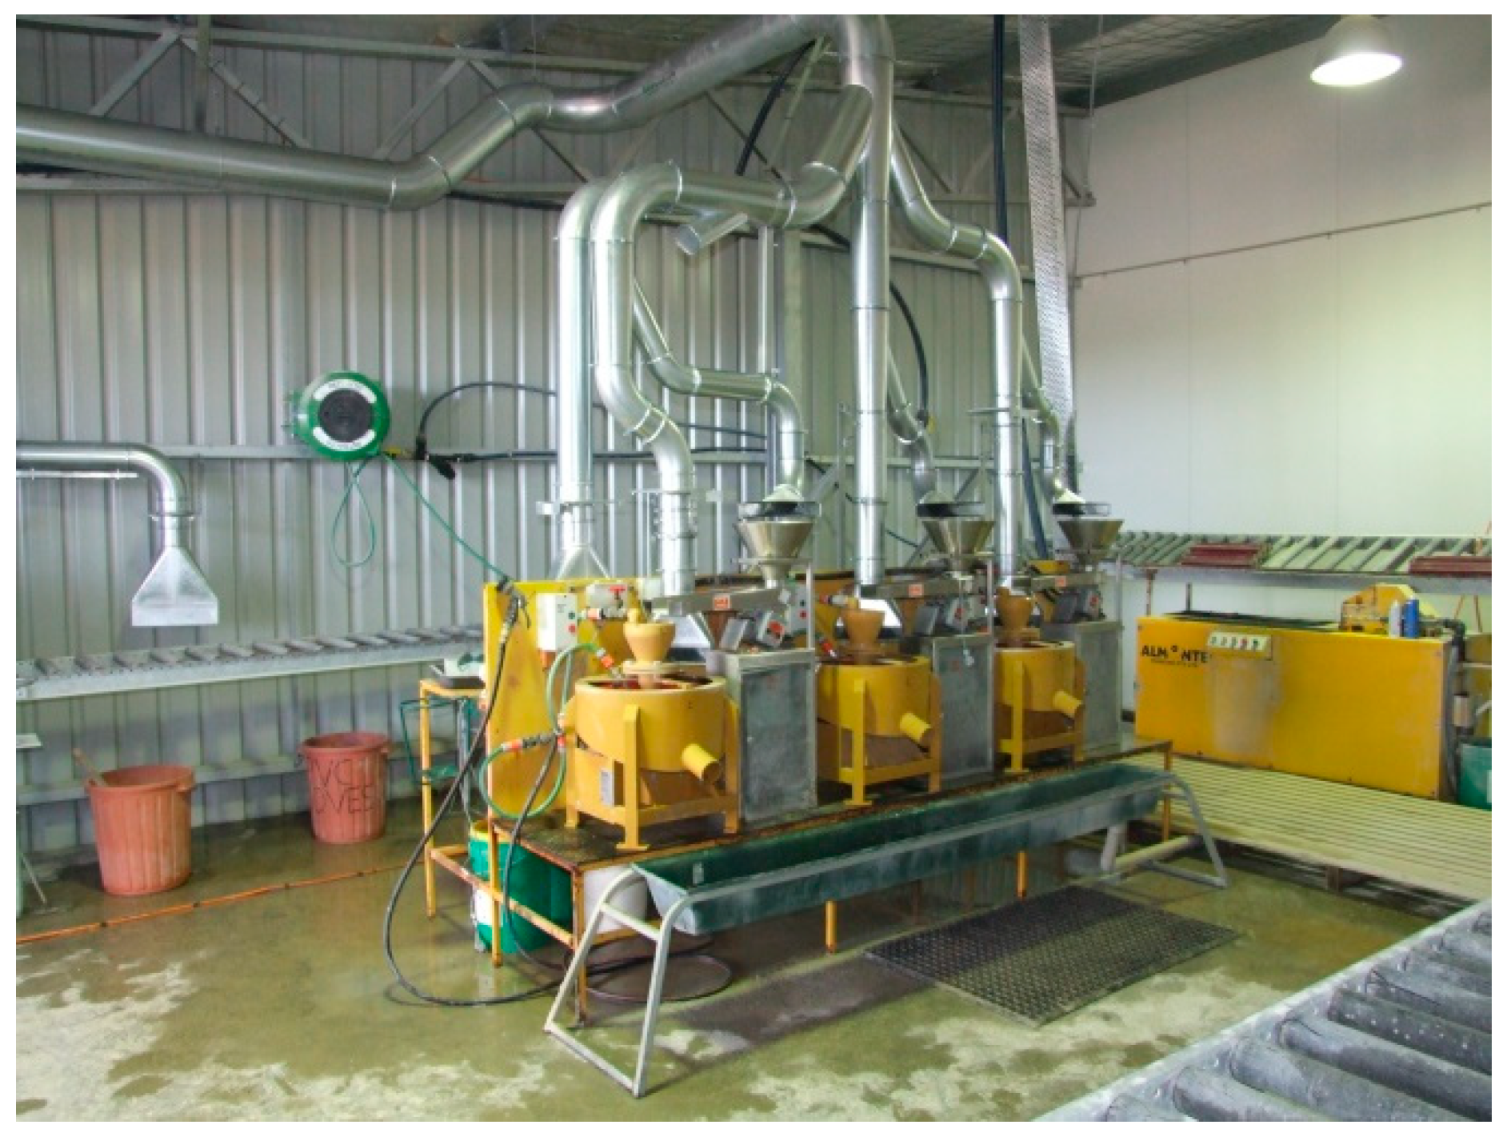
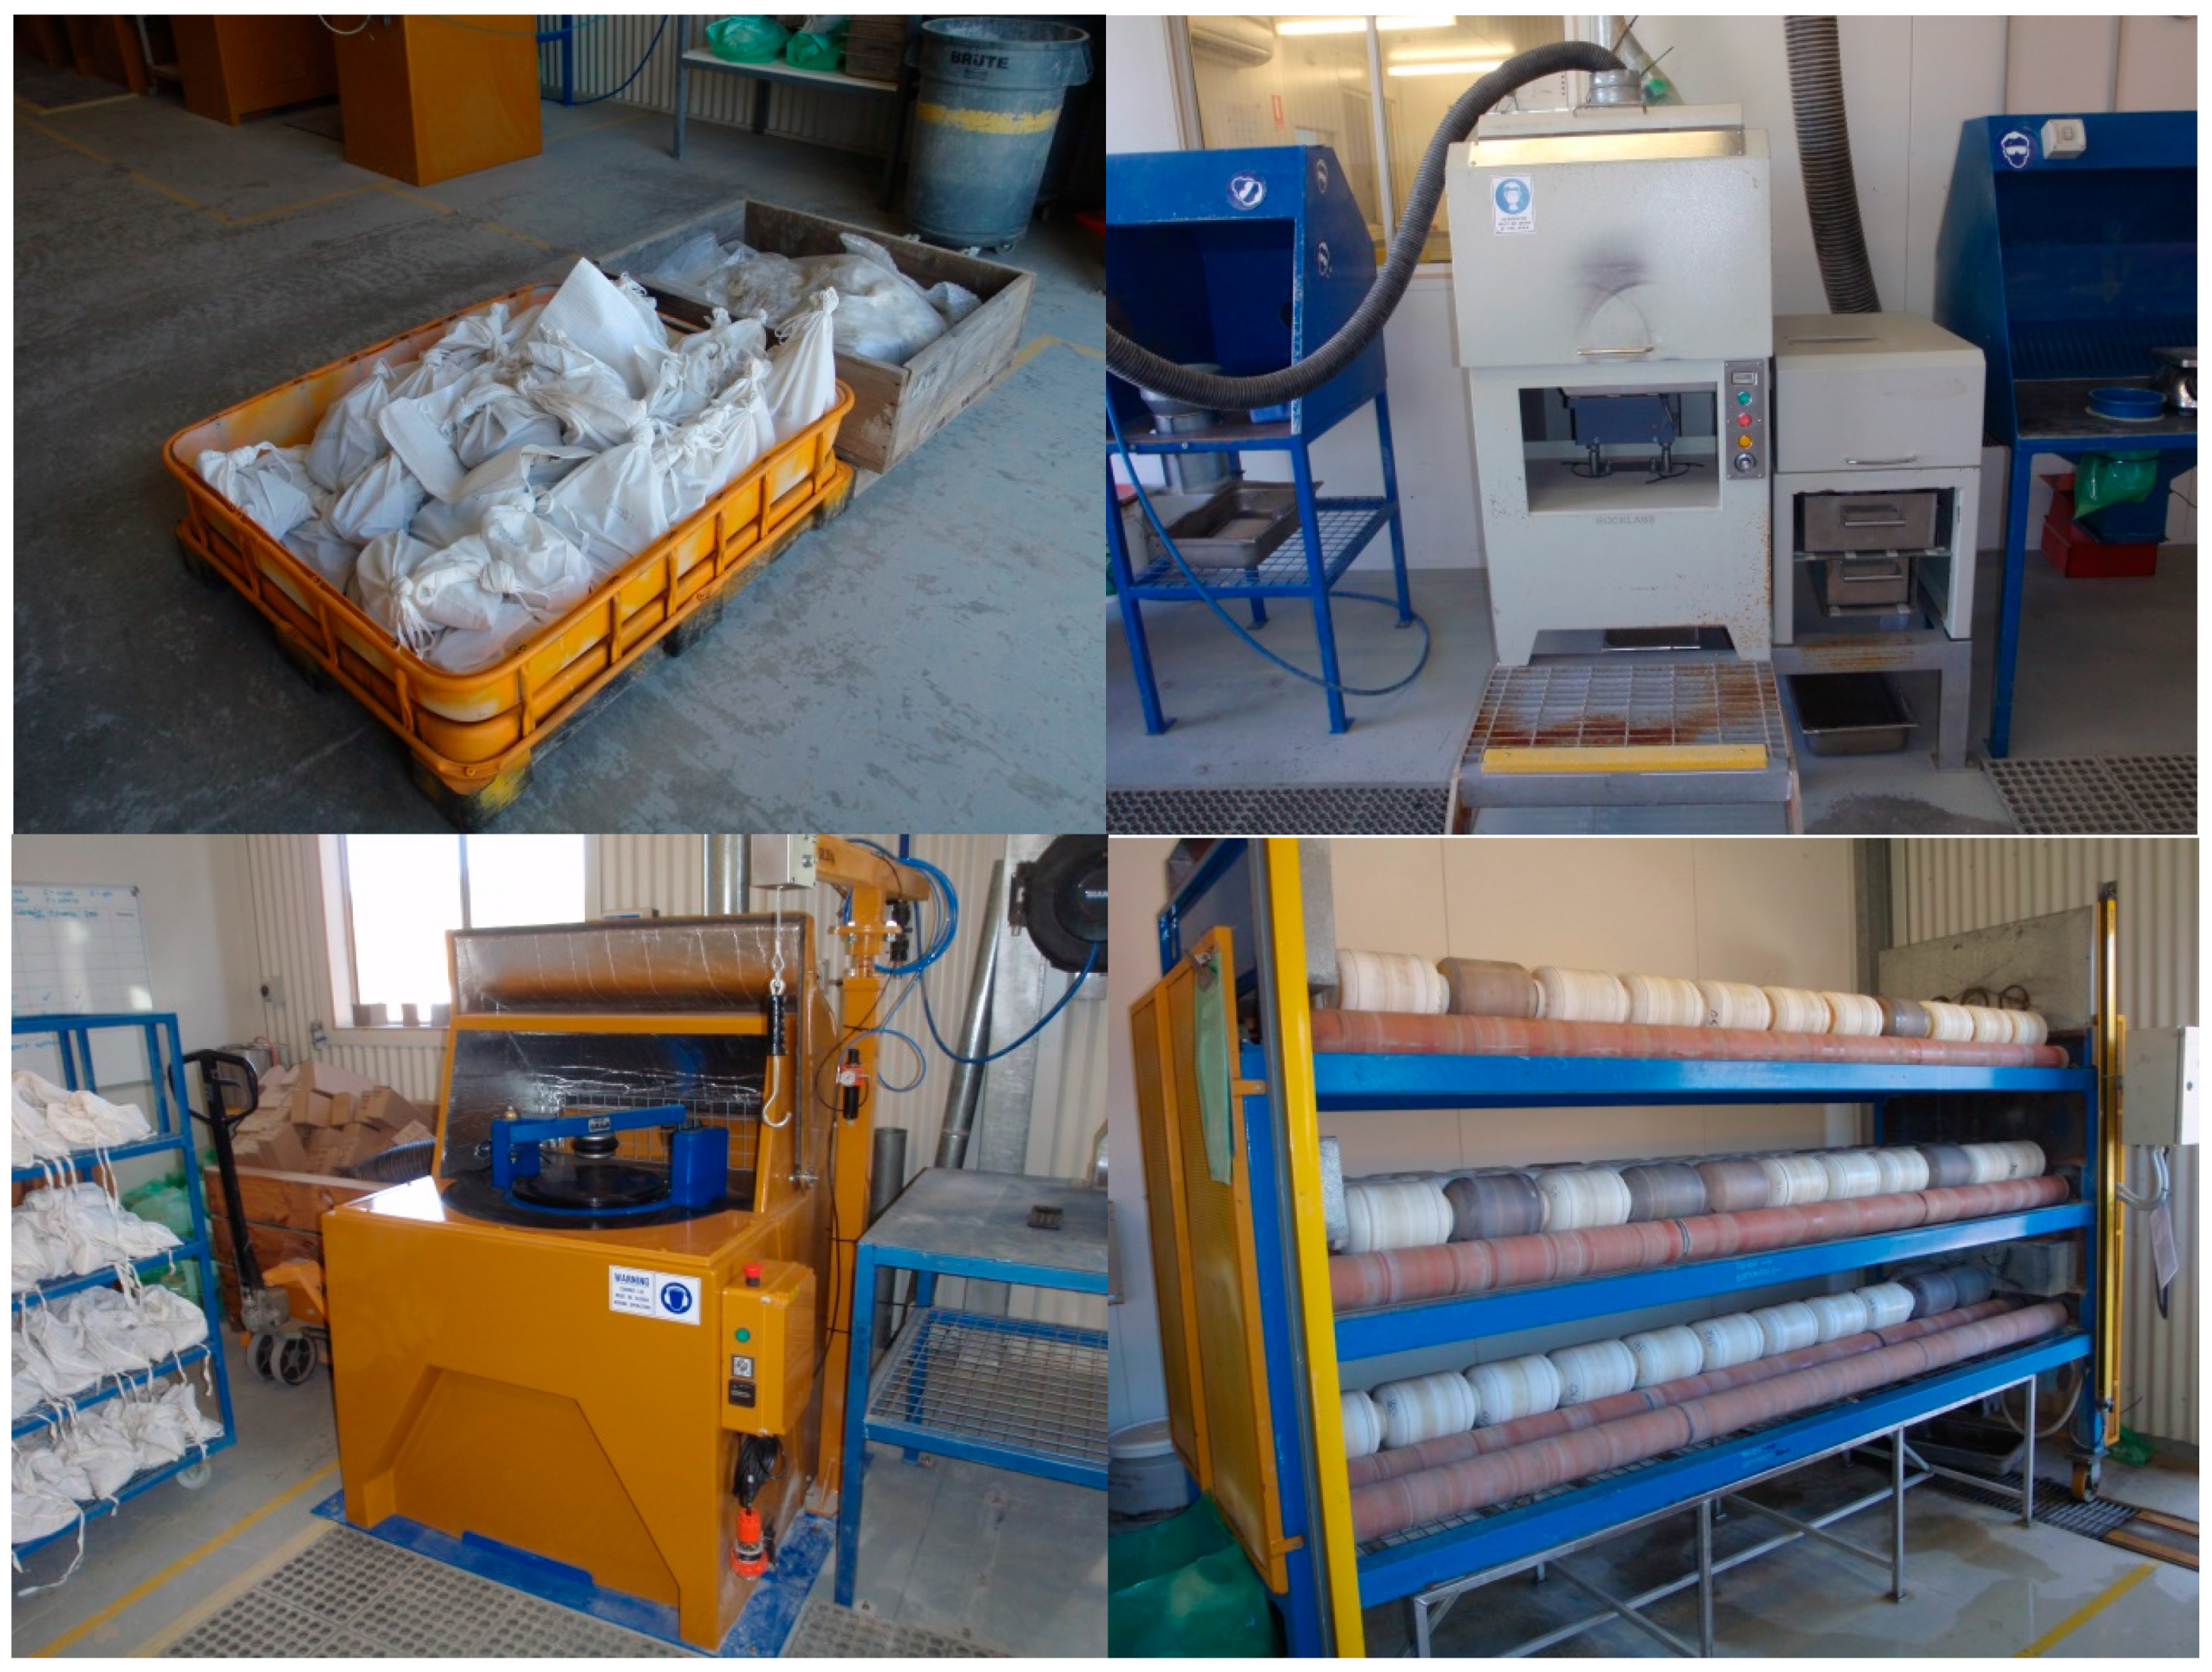
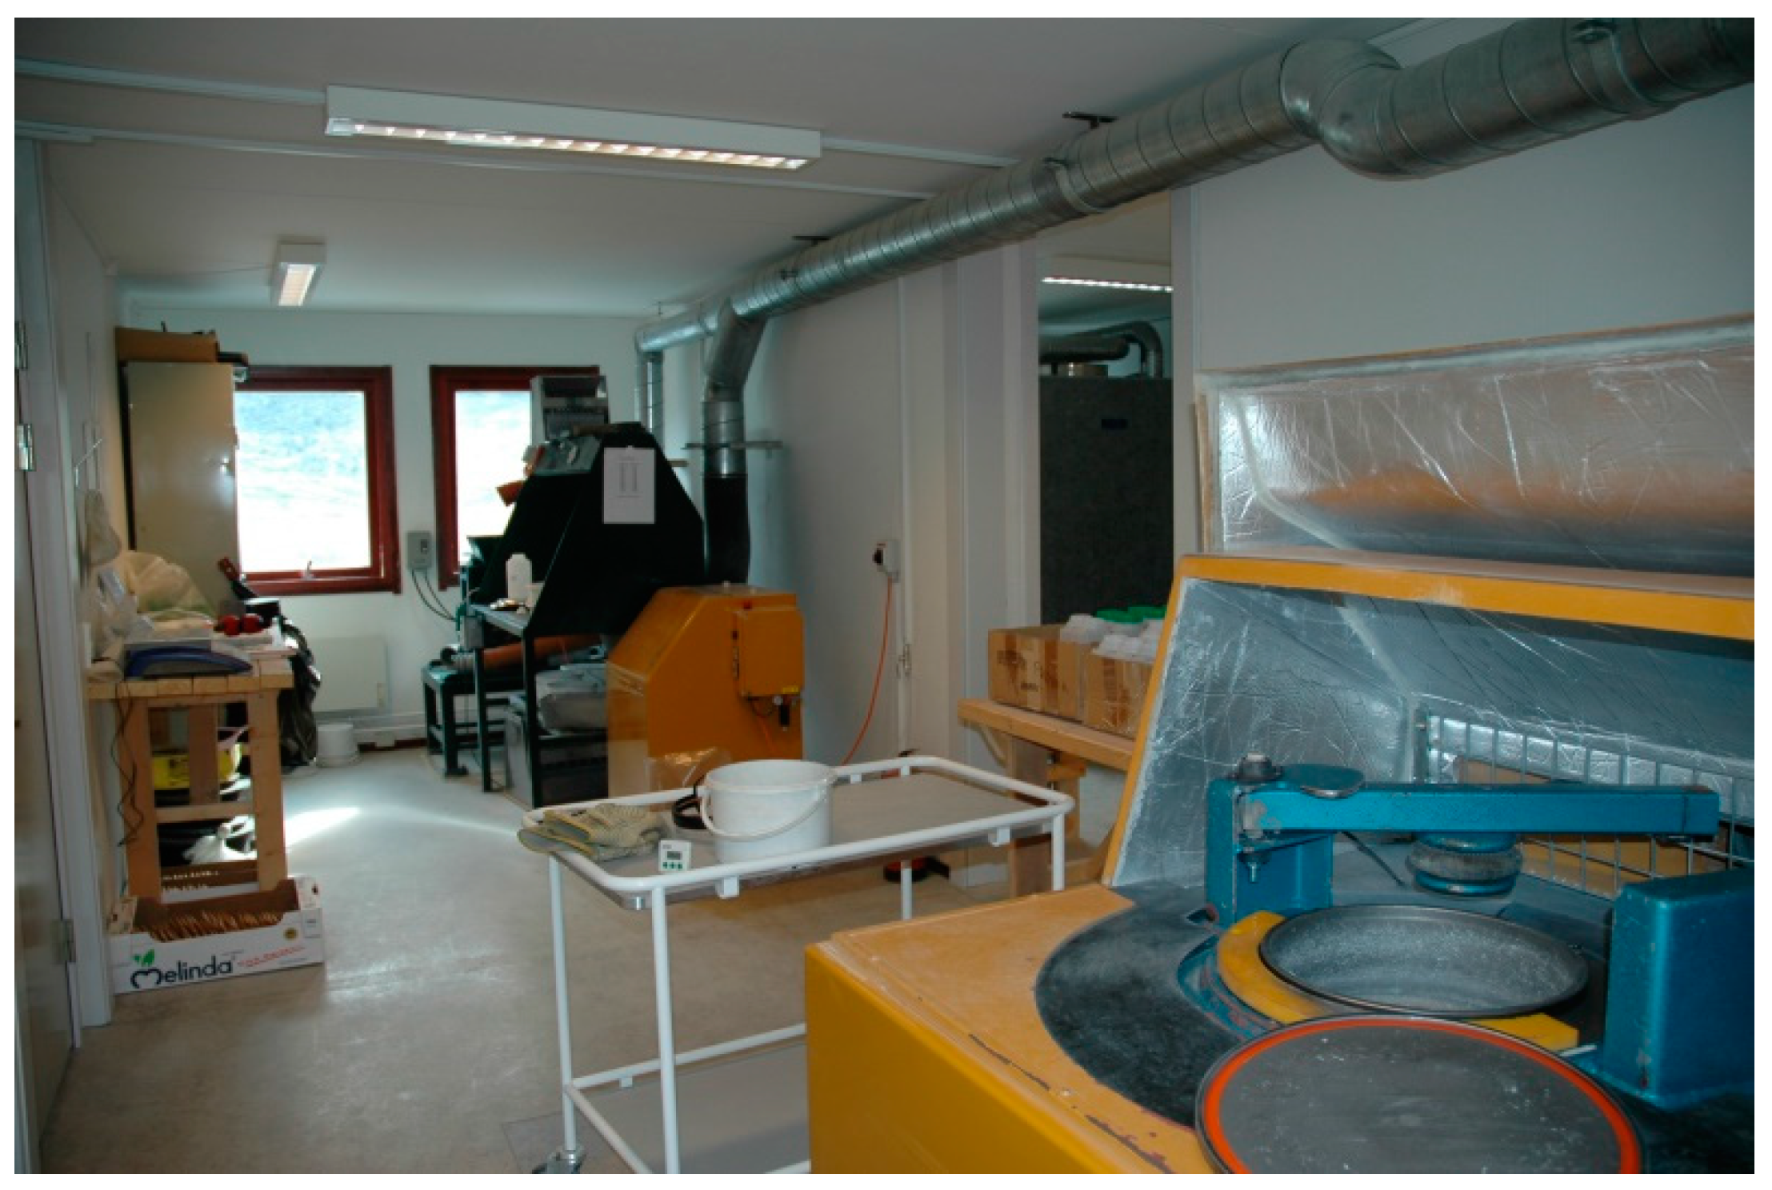
3.6.2. Bulk Sample Processing
3.6.3. Bulk Sampling of 2 Level Veta Christina South Reef
3.6.4. Head Split Bulk Sample Grade Determination
3.7. Quality Assurance/Quality Control
3.8. FSE Analysis of Sample Protocols
3.9. Reconciliation between Grade Control Sampling and Production
3.10. Sample Application and Resource Estimation
3.10.1. Sampling Strategy
3.10.2. Resource Estimation based on Diamond Drilling
3.10.3. Bulk Sampling of 4 Level Veta Christina South Reef
3.11. Discussion
4. Case Study 3: Nalunaq Mine, Greenland
4.1. Introduction
4.2. Geology and Mineralisation
4.3. Gold Particle Distribution and Liberation Diameter
4.4. Theoretical Sample Mass
4.5. Sampling Protocol Development
4.5.1. Exploration Phase Development Sampling
4.5.2. Exploration Drill Core Sampling
4.5.3. Grade Control Sampling
4.5.4. Sample Preparation and Assay
4.6. Face Sample Variability
4.7. Determining Sampling Variability
4.8. Discussion
5. Overview
6. Conclusions
- At Ballarat core drilling is undertaken to define resources ahead of mining in orebodies that display both geometric and grade variability. The coarse gold nature of the ore, drives the whole core and assay approach. The sampling and resource risk is recognised, where development and stoping commence on Inferred Mineral Resources.
- At San Christina, small-sample based assays understate grade in geometrically simple, coarse gold-dominated veins. Drilling with whole core sampling and assaying is applied to estimate Inferred Mineral Resources that are accepted to understate grade. Dominant gold particle clustering drives the application of bulk sampling. Development drives are sampled round by round and processed via an on-site plant. Upper and lower development drive grades are assigned to stope blocks and reported in the Indicated Mineral Resource category.
- At Nalunaq sidewall chip samples were used to define resources in geometrically-simple coarse gold-dominated vein. Chip sampling generally imparted a positive bias that contributed to poor reconciliation. Samples were used to inform a resource estimate, which was reported in the Indicated Mineral Resource category. Such a classification was inappropriate given poor reconciliation.
- A range of sampling methods are available for underground grade control, all of which require evaluation before routine application. The highest error is generally introduced during sample collection. A reduction in the need for chip or channel samples will only come from the use of more pre-development drilling at a spacing to allow local estimation.
- Application of TOS enables sampling programme design and practice to be optimised. All errors along the sampling value chain are additive and impart variability making local estimation less reliable. Estimation must take into account the sampling strategy, with sample quality reflected in the resource classification.
- There is a greater need towards the quantification of sampling errors to better communicate resource/reserve uncertainty and risk. Sampling relative error can be estimated using duplicate pairs. The error components reflect the ore characteristics, sample type, and collection, preparation and analysis. The COV calculated from paired data produces an estimate of sampling relative error that can be used as a basis for risk evaluation within the framework of the JORC or other international reporting codes.
- QA/QC cannot be divorced from the TOS and is a mandatory step for fit-for-purpose sample evaluation.
Author Contributions
Funding
Acknowledgments
Conflicts of Interest
Abbreviations
| AE | Analytical error |
| BCOG | Breakeven cut-off grade |
| CRM | Certified reference material |
| DE | Delimitation error |
| d95Au/dAuclus | Liberation diameter for sampling purposes, individual particle vs. clustered value |
| EE | Extraction error |
| FA | Fire assay (assay charge size 30 g; FA30) |
| FSE | Fundamental sampling error |
| GNE | Geological (or in-situ) nugget effect |
| GSE | Grouping and Segregation error |
| LM5 | Ring pulverising unit with approx. 2.5 kg capacity |
| LW | LeachWELL assay (assay charge size 500 g; LW500) |
| P80 or P90 | Percent passing (e.g., P90; 90% passing a given screen size) |
| PAL | Pulverise and leach (assay charge size 500 g; PAL500) |
| PE | Preparation error |
| ROM | Run of mine grade |
| RSD | Rotary sample divider |
| RSV | Relative sampling variability |
| SFA | Screen fire assay (assay charge size 500 g; SFA500) |
| TOS | Theory of Sampling |
| QA/QC | Quality assurance/quality control |
| WE | Weighting error |
References
- Dominy, S.C.; Platten, I.M.; Xie, Y.; Minnitt, R.C.A. Underground grade control protocol design: Case study from the Liphichi gold project, Larecaja, Bolivia. Appl. Earth Sci. 2011, 119, 205–219. [Google Scholar] [CrossRef]
- Dominy, S.C.; Glass, H.J.; Lam, C.K.; O’Connor, L.; Purevgerel, S.; Minnitt, R.C.A. Integrating the Theory of Sampling into underground grade control strategies. Minerals 2018, 8, 232. [Google Scholar] [CrossRef]
- Pitard, F.F. Theory of Sampling and Sampling Practice; CRC Press: Boca Raton, FL, USA, 2019; p. 694. [Google Scholar]
- Dominy, S.C.; O’Connor, L.; Glass, H.J.; Purevgerel, S.; Xie, Y. Towards representative metallurgical sampling and recovery testwork programmes. Minerals 2018, 8, 193. [Google Scholar] [CrossRef]
- Dominy, S.C.; Glass, H.J.; O’Connor, L.; Purevgerel, P. Importance of representative metallurgical sampling and testwork programmes to reduce project risk—A gold case study. Min. Technol. 2019. submitted-in review. [Google Scholar]
- Carrasco, P.C.; Carrasco, P.; Jara, E. The economic impact of incorrect sampling and analysis practices in the copper mining industry. Chemom. Intell. Lab. Sys. 2004, 74, 209–214. [Google Scholar] [CrossRef]
- Gy, P.M. Sampling of Particulate Materials: Theory and Practice; Elsevier: Amsterdam, The Netherlands, 1982; p. 431. [Google Scholar]
- Minnitt, R.C.A. Sampling: The impact on costs and decision making. J. South. Afr. Inst. Min. Metall. 2007, 107, 451–462. [Google Scholar]
- Dominy, S.C. Importance of good sampling practice throughout the gold mine value chain. Min. Technol. 2016, 125, 129–141. [Google Scholar] [CrossRef]
- Lyman, G.J.; Bourgeois, F.S. Sampling, corporate governance and risk analysis. In We are Metallurgists not Magicians: Landmark Papers by Practicing Metallurgists; The Australasian Institute of Mining and Metallurgy: Melbourne, Australia, 2017; pp. 349–354. [Google Scholar]
- Dominy, S.C.; Platten, I.M. Clustering of gold particles and implications for sampling. Appl. Earth Sci. 2007, 116, 130–142. [Google Scholar] [CrossRef]
- Dominy, S.C. Predicting the unpredictable–evaluating high-nugget effect gold deposits. In Mineral Resource and Ore Reserve Estimation; Australasian Institute of Mining and Metallurgy: Melbourne, Australia, 2014; pp. 659–678. [Google Scholar]
- Dominy, S.C.; Petersen, J.S. Sampling coarse gold-bearing mineralisation-developing effective protocols and a case study from the Nalunaq mine, Southern Greenland. In Proceedings of the World Conference on Sampling and Blending, Sunshine Coast, Australia, 10–12 May 2005; Australasian Institute of Mining and Metallurgy: Melbourne, Australia, 2005; pp. 151–165. [Google Scholar]
- Dominy, S.C.; O’Connor, L.; Glass, H.J.; Xie, Y. Geometallurgical study of a gravity recoverable gold orebody. Minerals 2018, 8, 186. [Google Scholar] [CrossRef]
- Stanley, C.R.; Lawrie, D. Average relative error in geochemical determinations: Clarification, calculation and a plea for consistency. Explor. Min. Geol. 2007, 3–4, 267–275. [Google Scholar] [CrossRef]
- Stanley, C.R.; Smee, B.W. Strategies for reducing sampling errors in exploration and resource definition drilling programmes for gold deposits. Geochem. Explor. Environ. Anal. 2007, 7, 329–340. [Google Scholar] [CrossRef]
- Abzalov, M.Z. Quality control of assay data: A review of procedures for measuring and monitoring precision and accuracy. Explor. Min. Geol. 2008, 3–4, 131–144. [Google Scholar] [CrossRef]
- Morley, C.M. Guide to creating a mine site reconciliation code of practice. In Mineral Resource and Ore Reserve Estimation; Australasian Institute of Mining and Metallurgy: Melbourne, Australia, 2014; pp. 755–764. [Google Scholar]
- François-Bongarçon, D.M. Theory of sampling and geostatistics: An intimate link. Chemom. Intell. Lab. Syst. 2004, 74, 143–148. [Google Scholar] [CrossRef]
- François-Bongarçon, D.M.; Gy, P.M. The most common error in applying Gy’s formula in the theory of mineral sampling and the history of the Liberation factor. J. South. Afr. Inst. Min. Metall. 2002, 102, 475–479. [Google Scholar]
- Minnitt, R.C.A.; Rice, P.M.; Spangenberg, C. Experimental calibration of sampling parameters K and alpha for Gy’s formula by the sampling tree method. J. South. Afr. Inst. Min. Metall. 2007, 107, 513–518. [Google Scholar]
- Gy, P.M. Sampling of discrete materials—A new introduction to the theory of sampling I. Qualitative approach. Chemom. Intell. Lab. Syst. 2004, 74, 7–24. [Google Scholar] [CrossRef]
- Dominy, S.C.; Xie, Y. Optimising sampling protocols via the heterogeneity test: Challenges in coarse gold mineralisation. Min. Technol. 2016, 125, 103–113. [Google Scholar] [CrossRef]
- DS3077. Representative Sampling–Horizontal Standard; Danish Standards Foundation: Copenhagen, Denmark, 2013; p. 41. [Google Scholar]
- Joint Ore Reserves Committee (JORC). Australasian Code for Reporting of Exploration Results, Mineral Resources and Ore Reserves—The JORC Code; Joint Ore Reserves Committee of the Australasian Institute of Mining and Metallurgy, Australian Institute of Geoscientists and Minerals Council of Australia: Melbourne, Australia, 2012; p. 44. [Google Scholar]
- Pitard, F.F. Guidelines for acceptable allotted sampling uncertainty. In Proceedings of the World Conference on Sampling and Blending, Santiago, Chile, 10–12 July 2013; pp. 89–98. [Google Scholar]
- Dominy, S.C.; Edgar, W.B. Approaches to reporting grade uncertainty in high nugget gold veins. App. Earth Sci. 2012, 121, 29–42. [Google Scholar] [CrossRef]
- LionGold. Annual Qualified Persons Report for the Ballarat Gold Mine, Australia for the Year Ended 31 March 2018. Internal report by LionGold Corporation Ltd. subsidiary Castlemaine Goldfields Pty Ltd., 2018. p. 112. Available online: www.liongoldcorp.com/ (accessed on 22 April 2019).
- Fairmaid, A.M.; Phillips, D.; Wilson, C.J.L. Episodic gold mineralisation correlated with discrete structural events at Ballarat East, southeast Australia. Ore Geol. Rev. 2017, 91, 541–558. [Google Scholar] [CrossRef]
- Pitard, F.F.; Lyman, G.J. Single and multi-stage Poisson processes: A case study for gold exploration. In Proceedings of the World Conference on Sampling and Blending, Lima, Peru, 19–22 November 2013; GECAMIN: Santiago, Chile, 2013; pp. 371–385. [Google Scholar]
- Dominy, S.C.; Platten, I.M.; Xie, Y. Determining gold particle size in gravity ores for sampling and metallurgical characterisation: Discussion and test protocol. In Proceedings of the Gravity Gold Conference, Ballarat, Australia, 21–22 September 2010; Australasian Institute of Mining and Metallurgy: Melbourne, Australia, 2010; pp. 83–95. [Google Scholar]
- Royle, A.G. Splitting gold assay pulps containing coarse gold. J. Leeds Univ. Min. Assoc. 1989, 89, 63–68. [Google Scholar]
- Bell, R.-M.; Kolb, J.; Waight, T.E. Assessment of lithological, geochemical and structural controls on gold distribution in the Nalunaq gold deposit, south Greenland using three-dimensional implicit modelling. Geol. Soc. Lond Spcl Pub. 2017, 453, 385–405. [Google Scholar] [CrossRef]
- Snowden. Grade Control and Resource Sampling Optimisation at the Nalunaq Gold Mine, Greenland; Unpublished report for Nalunaq Gold Mine A/S by Snowden Mining Industry Consultants (UK) Ltd.: London, UK, 2007; p. 17. [Google Scholar]


| Stage | Planning | Collection | Transport | Laboratory Preparation | Assaying |
|---|---|---|---|---|---|
| 1 | 2 | 3 | 4 | 5 | |
| Activity | Scope Develop Execute | Observe Collect Bag and tag QAQC Integrity/security Chain of custody | Integrity/security Chain of custody | Equipment operation Equipment clean QAQC Integrity/security | Equipment operation Equipment clean QAQC Integrity/security |
| Sampling errors | GNE, FSE, GSE DE, EE, WE | PE | FSE, GSE DE, EE, WE, PE | PE AE | |
| Dominant effect on results | Precision Bias | Bias | Precision (if splitting) Bias | Bias | |
| Sample Type/Error (Preparation Route) | Sampling (%) | Preparation (%) | Analytical (%) | Total (%) |
|---|---|---|---|---|
| Fine-gold disseminated | Half core | Split at −2 mm | Split at −75 µm (FA30) | - |
| NQ core | 17 | 11 | 5 | 21 |
| Number of pairs | 245 | 175 | 150 | - |
| Coarse-gold vein | Half core | Split at −1.5 mm | Split at −75 µm (FA30) | - |
| NQ core | 70 | 38 | 32 | 86 |
| Number of pairs | 125 | 125 | 155 | - |
| Expected error range for gold mineralisation | 20–90 | 5–40 | 1–25 | 20–100 |
| Key Parameter | Comment | 1 Component Error | TOS Error | 2 Error Rating | |
|---|---|---|---|---|---|
| 1 | Spatial distribution and number of samples | Samples collected at approx. 1.8 m intervals along drives and raises Each stope block informed by around 25–35 samples | 32% | GNE | Low-mod. |
| 2 | Sample mass (representativity) | Each face composite sample approx. 2–4 kg; total sample mass collected approx. 75–100 kg; indicated optimum mass around 120 kg to achieve 90% ±20% | Low-mod. | ||
| 3 | Collection and handling | Samples collected by chip-channel Reasonably consistent sample mass collected All samples placed into calico bags and tied | EE | Low-mod. | |
| 4 | Transport and security | Chain of custody recorded between mine and off-site laboratory | - | Low | |
| 5 | Preparation | Entire sample lot crushed and pulverised and 1 kg riffle split for screen fire assay | 12% | - | Low |
| 6 | Assay | Fire assay process undertaken correctly | 11% | - | Low |
| 7 | QAQC | Four CRMs used from low to high grade CRMs and blanks inserted at 1 to 25 rate; performance within expectation Full written protocols for the sampling-assaying process | - | - | Low |
| 8 | Validation/variability indicators | Sample population RSV: 155% Total nugget effect: 40% Grade reconciles to ±15% quarterly based on Indicated Mineral Resources | Total 36% | Mod. | |
| Summary | |||||
| Representativity (1)–(3) | Low-mod. | ||||
| Preparation and assay (4)–(7) | Low | ||||
| Fit-for-purpose | Yes | ||||
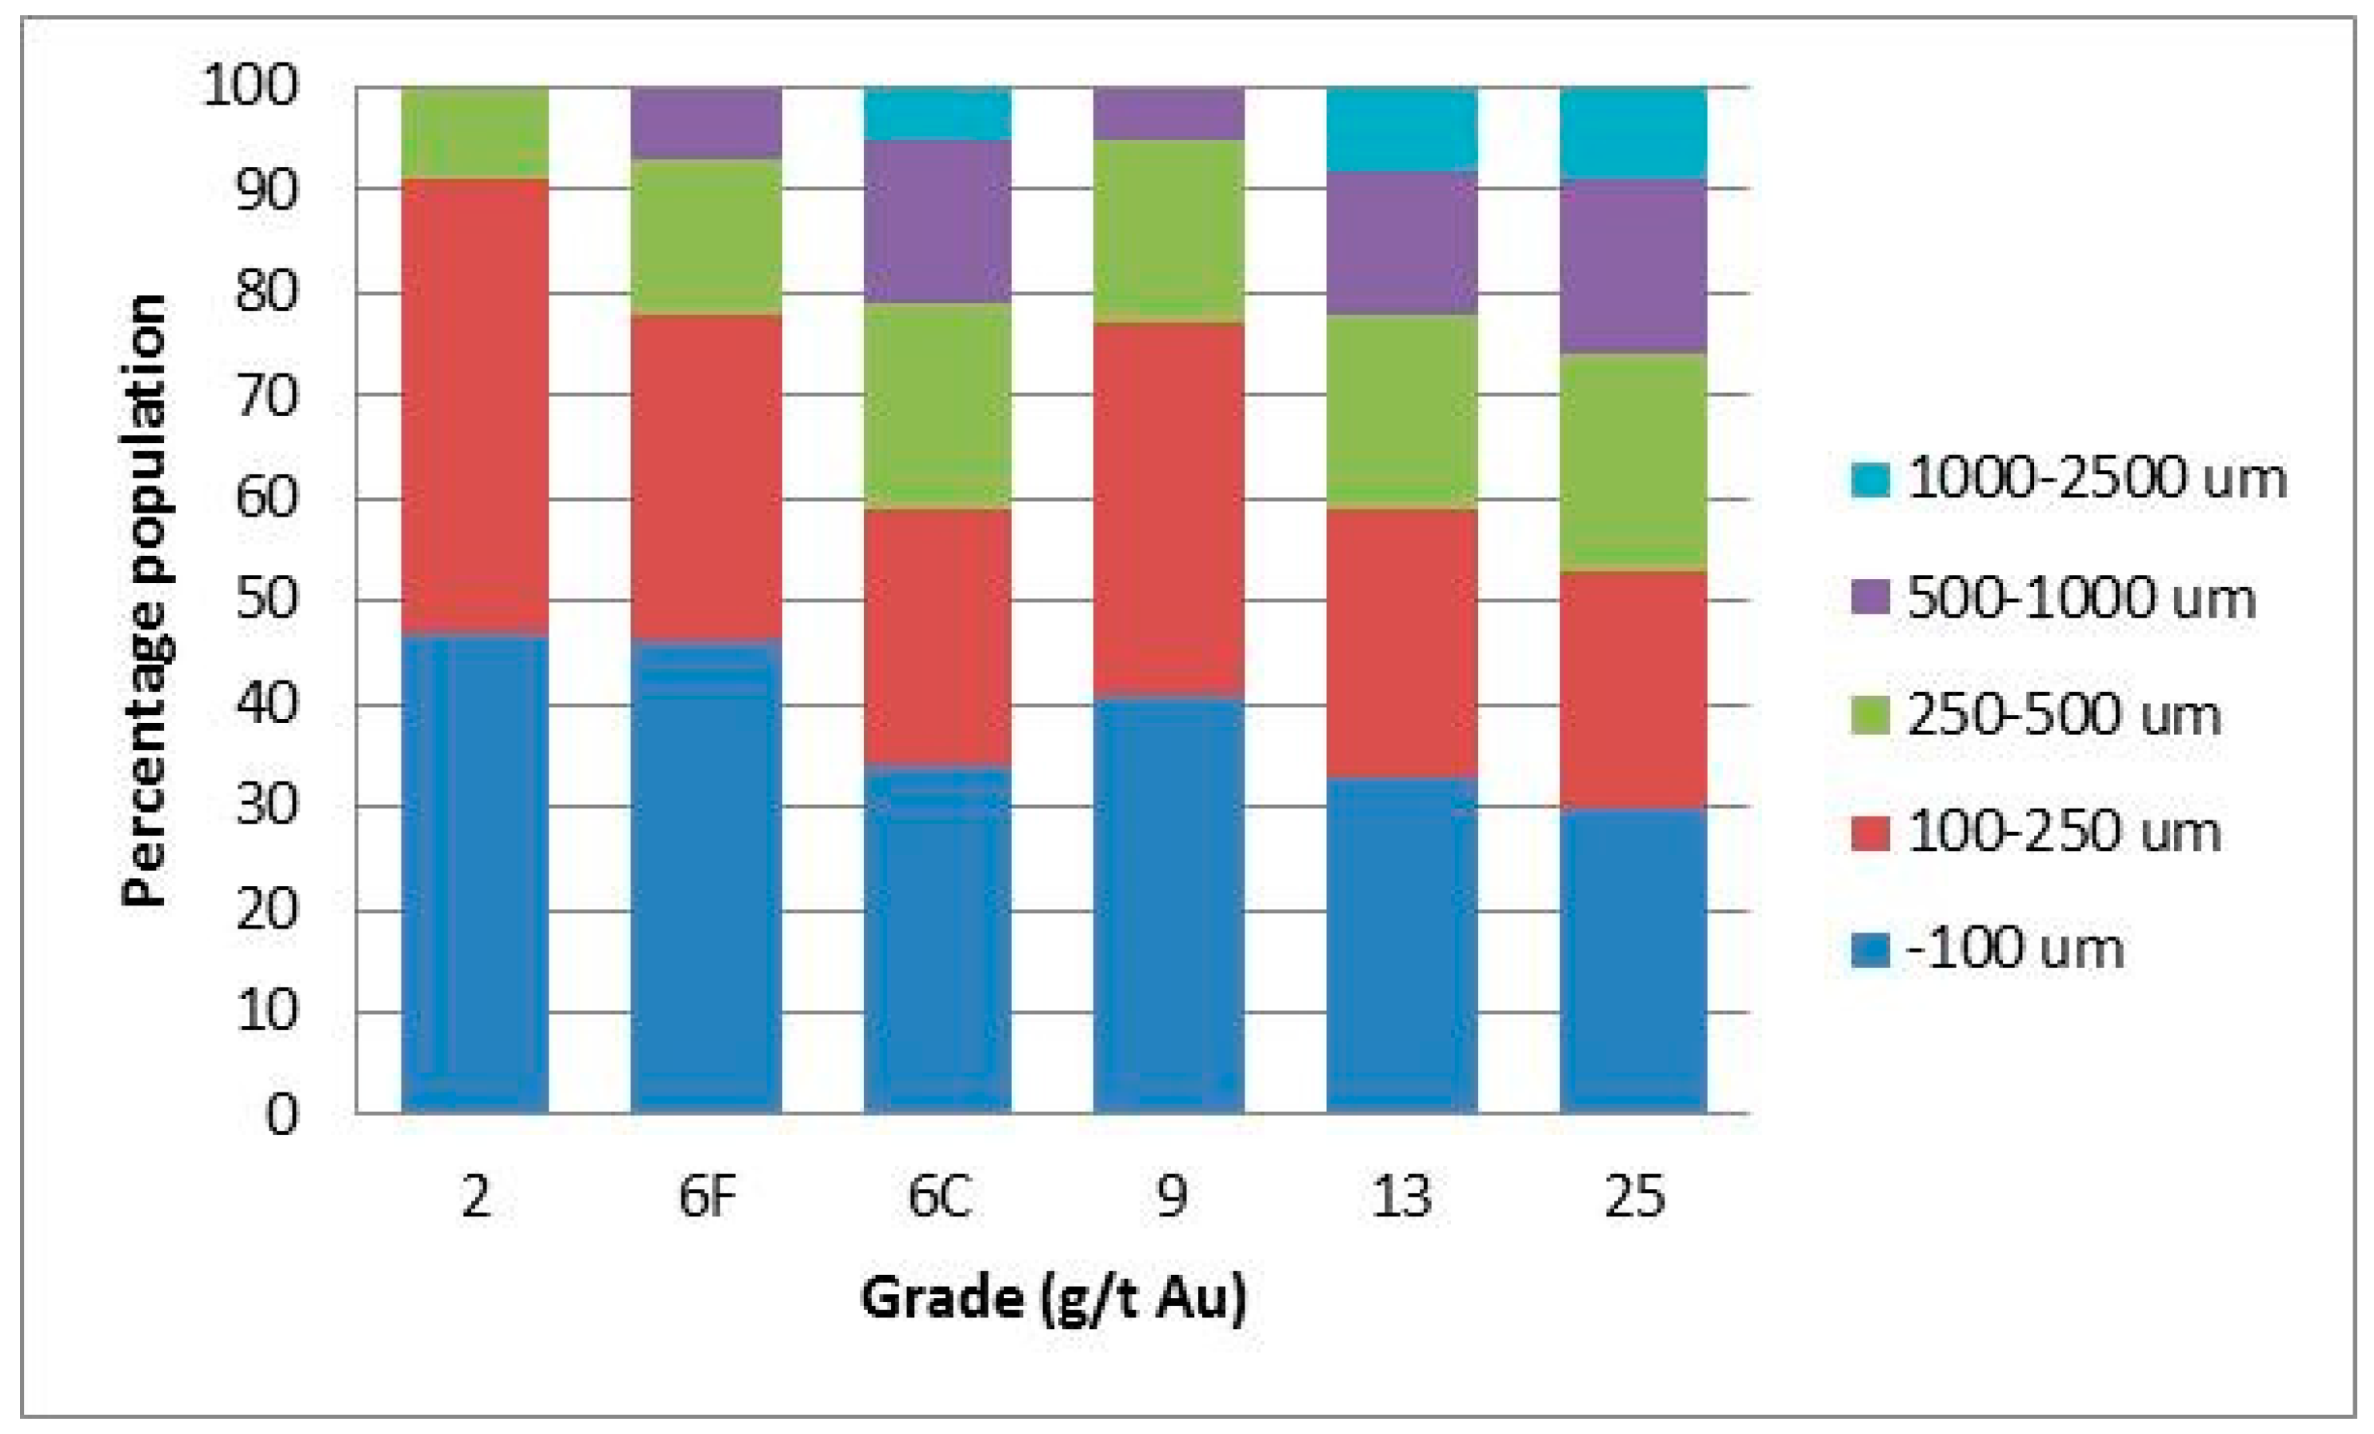
| Grade (g/t Au) | <100 µm | 100–2000 µm | +2000 µm | >100 µm | d95Au (µm) |
|---|---|---|---|---|---|
| 2 | 64% | 28% | 8% | 36% | 1800 |
| 4 (BCOG) | 44% | 36% | 20% | 56% | 2500 |
| 6 (ROM) | 40% | 34% | 26% | 60% | 3500 |
| 10 | 37% | 36% | 27% | 63% | 4000 |
| Test Type | Mass of Lot | Grade (g/t Au) | d95Au (µm) | K | Comment |
|---|---|---|---|---|---|
| Laboratory | 204 kg | 6.3 | 700 | 5700 | Face sample composite put through a gravity process |
| Heterogeneity test | 500 kg | 9.9 | 900 | 5700 | 330 × 1.5 kg rock fragments from mill feed belt [23] |
| Heterogeneity test | 1 t | 13.0 | 150 | 355 | 500 × 2 kg drill core pieces [23] |
| d95Au (µm) | Comment |
|---|---|
| 500 | Individual particles |
| 1000 | Individual particles |
| 2500 | Individual or clustered particles |
| 3000 | Individual or clustered particles |
| Sample | Number of Assays | Range (g/t Au) | Mean (g/t Au) | RSV |
|---|---|---|---|---|
| FA30 | 163 | 0.01–364 | 5.13 | 602% |
| Composites | 16 | 0.76-38.1 | 5.13 | 169% |
| d95Au (µm) | Sampling Constant (K) | Optimum Mass |
|---|---|---|
| 500 | 5400 | 50 kg |
| 1000 | 15,200 | 350 kg |
| 2500 | 60,300 | 5 t |
| 3000 | 79,300 | 9 t |
| Stage | Type | Protocol | 1 FSE | Comment |
|---|---|---|---|---|
| Exploration/resource development (1983–2006) | Half core (2.5 kg) | Jaw crush all to P90 −6 mm Pulverise in LM5 to P90 −75 Riffle split FA50 | ±30% | FA for non-visible gold bearing core |
| ±50% | ||||
| ±100% | ||||
| ±115% | ||||
| Exploration/resource development (2003–2006) | Half core (2.5 kg) | Jaw crush all to P90 −6 mm Pulverise in LM5 to P90 −75 SFA2500 or riffle split for LW2000 | ±5% | SFA or LW for visible gold bearing core |
| ±5% | ||||
| ±5% | ||||
| ±5% |
| Stage | Type | Aim | Spacing |
|---|---|---|---|
| L1: Exploration | Diamond core (NQ or HQ) | Exploration targeting | 500 m by 100 m |
| L2: Exploration | Diamond core (NQ or HQ) | Resource growth | 100 m by 20 m 50 m by 15 m |
| L3: Resource | Diamond core (NQ, NQ2 or HQ) | Resource shape definition | 33 m by 10 m |
| L4: Resource | Diamond core (NQ, NQ2 or HQ) RC and sludge | Stope design | 20 m by 5 m |
| L5: Production | Face and grab samples | Development control | Development face or blast lot |
| Stage | Type | 2 Protocol | 1 FSE | Comment |
|---|---|---|---|---|
| L1/L2 | Half NQ/NQ2 core (2.5 kg) | Jaw crush all (P80 −10 mm) Pulverise all in LM5 to P90 −75 µm Scoop 2 kg for LW2000 | ±2% | Noted that assay pulp (2 kg from 2.5 kg) scooped from LM5; problematic from a GSE, DE and EE perspective |
| ±3% | ||||
| ±6% | ||||
| ±7% | ||||
| L1/L2 | Half HQ core (4 kg) | Jaw crush all (P80 −1 mm) Riffle split 2 × 2 kg, retain one Pulverise all in LM5 to P90 −75 µm Scoop 2 kg for LW2000 | ±20% | Substantial FSE at post-crusher split. Noted that assay pulp scooped from LM5; problematic from a GSE, DE and EE perspective |
| ±35% | ||||
| ±70% | ||||
| ±80% | ||||
| L3/L4 | Whole HQ core (4 kg) | Jaw crush all (P80 −10 mm) Crush all to P90 −3 mm RSD split 2 kg Pulverise 1 × 2 kg sub-sample in LM5 to P90 −75 µm Scoop 2 kg for LW2000 | ±40% | Substantial FSE at Boyd crusher split. Noted that assay pulp scooped from LM5; problematic from a GSE, DE and EE perspective |
| ±70% | ||||
| ±140% | ||||
| ±160% | ||||
| L3/L4 | Sludge (6 kg) | Sludge chippings (3–6 kg) Crush to P90 −3 mm RSD split 2 kg Pulverise in LM5 to P90 −75 µm LW2000 | ±55% | Substantial FSE at Boyd crusher split |
| ±90% | ||||
| ±180% | ||||
| ±210% | ||||
| L5 | Face (2–4 kg) | Face chippings (2–4 kg) Crush to P90 −3 mm RSD split 2 kg Pulverise in LM5 to P90 −75 µm LW2000 | ±38% | Substantial FSE at Boyd crusher split |
| ±65% | ||||
| ±128% | ||||
| ±147% | ||||
| L5 | Grab (10 kg) | Grab 2 × 10 kg at sub-10 cm size Crush all in LM5 to P90 −3 mm RSD split into 2 kg lots Pulverise to P90 −75 µm LW2000 | ±170% | Sub-10 cm material collected from 120 to 150 t rock pile. Substantial FSE at Boyd crusher split |
| ±290% | ||||
| ±580% | ||||
| ±665% | ||||
| L5 | HQ core, sludge or grab (5–10 kg) | Crush all to P80 −1 mm Pass through gravity concentrator Gravity concentrate assay by 2–3 × PAL500 RSD split 1.5 kg tails for 3 × PAL500 | ±20–40% | FSE calculations assume most coarse gold above 500 µm is recovered but some 200–500 µm remains |
| ±20–40% | ||||
| ±20–40% | ||||
| ±20–40% |
| Stage | Type | Protocol | 1 FSE | Comment |
|---|---|---|---|---|
| Exploration/resource development | Whole core (1.4–3.4 kg) | Jaw crush all to P90 −6 mm Pulverise in LM5 P90 −75 RSD split to 2.3 kg for LW2300 | ±3% | FSE relates to splitting the pulp to achieve a target 2.3 kg for LW when pulp is >2.3 kg |
| ±5% | ||||
| ±9% | ||||
| ±10% |
| Sample Type/Error (Protocol) | Sampling (%) | Preparation (%) | Analytical (%) | Total (%) |
|---|---|---|---|---|
| GF half NQ/NQ2 core (Table 9) | Half drill core | - | Split at −75 µm (FA50) | - |
| Diamond drill core | 74 | - | 49 | 89 |
| Number of pairs | 89 | - | 134 | - |
| LGC/CGT (L1/L2) half HQ core (Table 11) | Half drill core | Split at −1 mm | Split at −75 µm (LW2000) | - |
| Diamond drill core | 70 | 37 | 20 | 79 |
| Number of pairs | 167 | 125 | 125 | - |
| Key Parameter | Comment | 1 Component Error | TOS Error | 2 Error Rating | |
|---|---|---|---|---|---|
| 1 | Spatial distribution and number of samples | Approx. 25–50 m by 5–15 m drill grid A mineralised zone may be informed by 50–200 holes yielding 3000–13,800 samples | 3 ND. | GNE | Mod. |
| 2 | Sample mass (representa-tivity) | Each NQ core sample approx. 0.3–0.7 m for 1.4–3.4 kg; total sample for a mineralised zone can theoretically range 5–30 t Indicated optimum mass around 50 kg to 9 t to achieve 90% ±15% | High | ||
| 3 | Collection and handling | Core recovery generally good, though some localised areas of poor total core recovery Core trays delivered directly from the mine to site core shed | EE | Low | |
| 4 | Transport and security | All samples placed into plastic bags and sealed All samples delivered directly to the site laboratory | - | Low | |
| 5 | Preparation | Entire sample of 1.4–3.4 kg crushed and pulverised to P85 −75 µm, with 1.4–2.3 kg RSD split for assay Equipment cleaned between samples Error from splitting, where pulp duplicate analysis indicates an analytical component which will dominantly comprise splitting error | GSE, FSE, DE, EE, PE | Low | |
| 6 | Assay | LW2300 process undertaken correctly | 4 20% | - | Low |
| 7 | QAQC | CRMs (1 in 20) and Blanks (1 in 20) within expectation Written protocols for the sampling-assaying process | - | - | Low |
| 8 | Validation/variability indicators | Duplicate analysis indicates a high total sampling error, supporting the need for whole core sampling Nugget effect of 65–85% and RSV 240–610% Monthly grade reconciliations variable, with annual reconciliations within expectation for Inferred Mineral Resources | 3 ND. | GNE, GSE, DE, EE, WE | Mod. |
| Summary | |||||
| Sample representativity (1)–(3) | Mod. | ||||
| Sample preparation and assay (4)–(7) | Low | ||||
| Fit-for-purpose | Yes | ||||
| Grade (g/t Au) | +100 µm | +500 µm | +1000 µm | d95Au (µm) | dmaxAu (µm) |
|---|---|---|---|---|---|
| 2 | 53 | 0 | 0 | 300 | 400 |
| 1 6F (BCOG) | 54 | 7 | 0 | 500 | 700 |
| 2 6C (BCOG) | 66 | 21 | 5 | 1000 | 1500 |
| 9 | 59 | 5 | 0 | 600 | 725 |
| 13 | 67 | 22 | 8 | 1100 | 1500 |
| 25 (ROM) | 70 | 27 | 9 | 1500 | 2000 |
| Grade (g/t Au) | d95Au (µm)/ [dAuclus (µm)] | Clustering Effect | Sampling Constant (K) | Optimum Mass |
|---|---|---|---|---|
| 2 | 300 | None | 5000 | 10 kg |
| 6 (BCOG) | 500 | None | 2700 | 30 kg |
| 1000 | 10,000 | 150 kg | ||
| 9 | 600 | Potentially | 2400 | 35 kg |
| 13 | 1100 | High | 6200 | 120 kg |
| [5000] | 52,500 | 8 t | ||
| 24 (ROM) | 1500 | Very high | 28,500 | 120 kg |
| [10,000] | 80,500 | 35 t |
| Sample Type/Error (Preparation Route) | Sampling (%) | Preparation (%) | Analytical (%) | Total (%) |
|---|---|---|---|---|
| Duplicate face | −3 mm split | −75 um split | - | |
| Face channel | 79 | 32 | 18 | 87 |
| Number of pairs | 75 | 150 | 150 |
| Sample Type/Error (Preparation Route) | Sampling (%) | Preparation (%) | Analytical (%) | Total (%) |
|---|---|---|---|---|
| Half drill core | No split | −75 um split | - | |
| Diamond drill core | 93 | - | 21 | 95 |
| Number of pairs | 100 | - | 200 | - |
| Sample Type | Bulk | Grab | Channel |
|---|---|---|---|
| Sample mass/Total mass | 18 t 432 t | 5 × 5 kg (25 kg) 1 t | 13.5 kg/m 472 kg |
| No. of samples | 24 | 120 | 24 |
| 1 Mean grade (g/t Au) | 27.3 | 38.4 | 14.7 |
| Min. grade (g/t Au) | 4.1 | 1.54 | 0.01 |
| Max. grade (g/t Au) | 69.6 | 452.3 | 225.5 |
| RSV | 73% | 297% | 306% |
| Nugget effect | 48% | ND | 90% |
| Difference with respect to bulk sample grade | - | +28% | −46% |
| Sample Type/Error (Preparation Route) | Sampling (%) | Preparation (%) | Analytical (%) | Total (%) |
|---|---|---|---|---|
| Rounds | - | −500 µm split | - | |
| Bulk samples | 40 | - | 18 | 44 |
| Number of pairs | 128 | - | 65 | - |
| Sample Type/Error (Preparation Route) | Sampling (%) | Preparation (%) | Analytical (%) | Total (%) |
|---|---|---|---|---|
| Rounds | −4 mm split | −500 µm split | - | |
| Bulk samples | 50 | 21 | 19 | 57 |
| Number of pairs | 30 | 30 | 30 | - |
| Stage | Type | Protocol | 1 FSE | Comment |
|---|---|---|---|---|
| Resource evaluation | Core (half core) | Half NQ core (1.9–2.4 kg) crush to P90 −3 mm Pulverise to P95 −75 µm and riffle split in half 2x SFA1200 | ±0% | No FSE as entire sample prepared and assayed |
| ±0% | ||||
| Resource evaluation | Core (whole core) | Whole NQ core (2.8−4.8 kg) crush to P90 −3 mm Pulverise to P95 −75 µm and riffle split in half 2x LW2500 | ±0% | No FSE as entire sample prepared and assayed |
| ±0% | ||||
| Mine development | Face channel | 5.4−6.7 kg crush to P90 −3 mm, then RSD split off one third Pulverise to P95 −75 µm and RSD split into thirds 2−3 × SFA1000 | ±49% | Substantial FSE at post-crusher split |
| ±34% | ||||
| Mine development | Bulk (full sample pilot plant) | 15−30 t crushed, pulverised and fed through gravity concentrator 22 kg of tails incrementally linear split at P90 −500 µm 8 kg RSD split and pulverised to P95 −75 µm 8 × SFA1000 | ±5% | Entire sample processed through plant FSE relates to tails sample splitting |
| ±5% | ||||
| Mine development | Bulk (head coarse split) | 15–30 t primary and secondary crushed 200 kg incrementally linear split from the 30 t bulk sample at P85 −4 mm200 kg crushed, pulverised and fed through gravity concentrator 10 kg of tails incrementally collected at P90 −500 µm 10 kg RSD split and pulverised to P95 −75 µm, 2 × 1 kg sub-samples taken for SFA1000 | ±15% | Most FSE relates to the primary split Recoverable gold grade determined from gravity concentrate FSE relates to tails sample splitting |
| ±25% | ||||
| Mine development | Grab | 5 kg crush to P90 −3 mm, then RSD split 2.5 kg Pulverise to P95 −75 µm and riffle split in half 2x SFA1250 | ±305% | Sample collected at 5 × 5 kg of sub-8 cm material Large FSE on collection of 25 kg from 30 t lot FSE given for entire process |
| ±205% |
| Sample Type | No. Samples | Total Assayed/Processed | Estimated Stope Grade (g/t Au) | Difference with Reconciled Grade |
|---|---|---|---|---|
| Diamond drill | 5 | 39 kg | 6.1 | −77% |
| Face channel samples | 44 | 891 kg | 10.0 | −63% |
| Bulk sample (full) | 44 | 792 t | 23.6 | −12% |
| Reconciled head | - | 2692 t | 26.7 | - |
| Year | Tonnes Processed (t) | Reconciled Head Grade (g/t Au) | Predicted Grade (g/t Au) | |
|---|---|---|---|---|
| Drilling | 1 Bulk | |||
| 2005–2006 | 6,460 | 19.6 | 4.0 | 18.4 |
| 2007 | 9,510 | 24.5 | 6.8 | 20.1 |
| 2008 | 10,740 | 19.2 | 4.5 | 18.2 |
| 2009 | 12,630 | 26.7 | 14.3 | 21.9 |
| 2010 | 12,980 | 23.6 | 9.2 | 21.2 |
| 2011 | 11,950 | 28.1 | - | 25.7 |
| 2012 | 11,570 | 18.3 | - | 15.3 |
| Total | 75,840 | 23.2 | 8.4 | 20.3 |
| Difference to reconciled grade | - | - | −64% | −13% |
| Sample Type | No. Faces | Total Assayed/Processed | Grade (g/t Au) | Difference with Bulk Sample Reconciled Grade |
|---|---|---|---|---|
| Face channel samples | 31 | 633 kg | 15.6 | −36% |
| Bulk sample | 30 | 982 t | 24.5 | - |
| Drill-only block model | - | - | 9.4 | −62% |
| Local simulated block model (core and channel samples) | - | - | 14.9 | −39% |
| Type | Stage | Period | Comment |
|---|---|---|---|
| Core (half) | Evaluation | 2005–2011 | Discontinued |
| Core (whole) | Evaluation | 2011–2012 2019 | Targeting and preliminary resource estimate Continued in 2019 for resource estimation |
| Channel | Evaluation | 2005–2006 2019 | Discontinued in 2006 Applied in 2019 for comparison, not used routinely during mining |
| Grab | Production | 2005–2006 | Discontinued |
| Bulk (full) | Evaluation | 2005–2012 2019 | Replaced by bulk (split) option in 2011 Continued in 2019 |
| Bulk (head split) | Evaluation | 2010–2012 | Introduced to speed up development grade determination Maybe applied as required for fact grade determination |
| Key Parameter | Comment | 1 Component Error | TOS Error | 2 Error Rating | |
|---|---|---|---|---|---|
| 1 | Spatial distribution and number of samples | Samples collected at approx. 1.8 m intervals along drives and some raises. Vertical drive separation approx. 15 m. Each stope block (~1600–3200 t) informed by between 40 and 80 bulk samples (upper and lower drives) | 40% | GNE | Low-mod. |
| 2 | Sample mass (representativity) | Each sample 20–30 t; total sample mass collected around a stope block ranges between approx. 1200–2400 t Indicated optimum mass around 35 t to achieve 90% ±15% at ROM for clustered gold | Mod. | ||
| 3 | Collection and handling | Sample extracted by blasting Sample collection by small mechanised mucking unit. Floors cleaned as required by hand All samples transported to surface and kept separate prior to crushing and splitting | - | Low | |
| 4 | Transport and security | Samples delivered directly from the mine to the on-site plant | - | Low | |
| 5 | Preparation | Entire sample crushed and pulverised Plant cleaned and flushed between samples | 18% | - | Low |
| 6 | Assay | Entire sample passed through gravity circuit Gold concentrates weighed and sent for fire assay to extinction Preparation and analytical error relate to tails sample split and assay | - | Low | |
| 7 | QAQC | Duplicates and blanks within expectation CRMs within expectation Written protocols for the sampling-assaying process | - | - | Low |
| 8 | Validation/variability indicators | Bulk sample RSV 65% Nugget effect 49% Quarterly grade reconciliation ±20% Stope grade reconciliation ±25% Inferred and Indicated Mineral Resources defined | Total 44% | - | Low |
| Summary | |||||
| Sample representativity (1)–(3) | Mod. | ||||
| Preparation and assay (4)–(7) | Low | ||||
| Fit-for-purpose | Yes | ||||
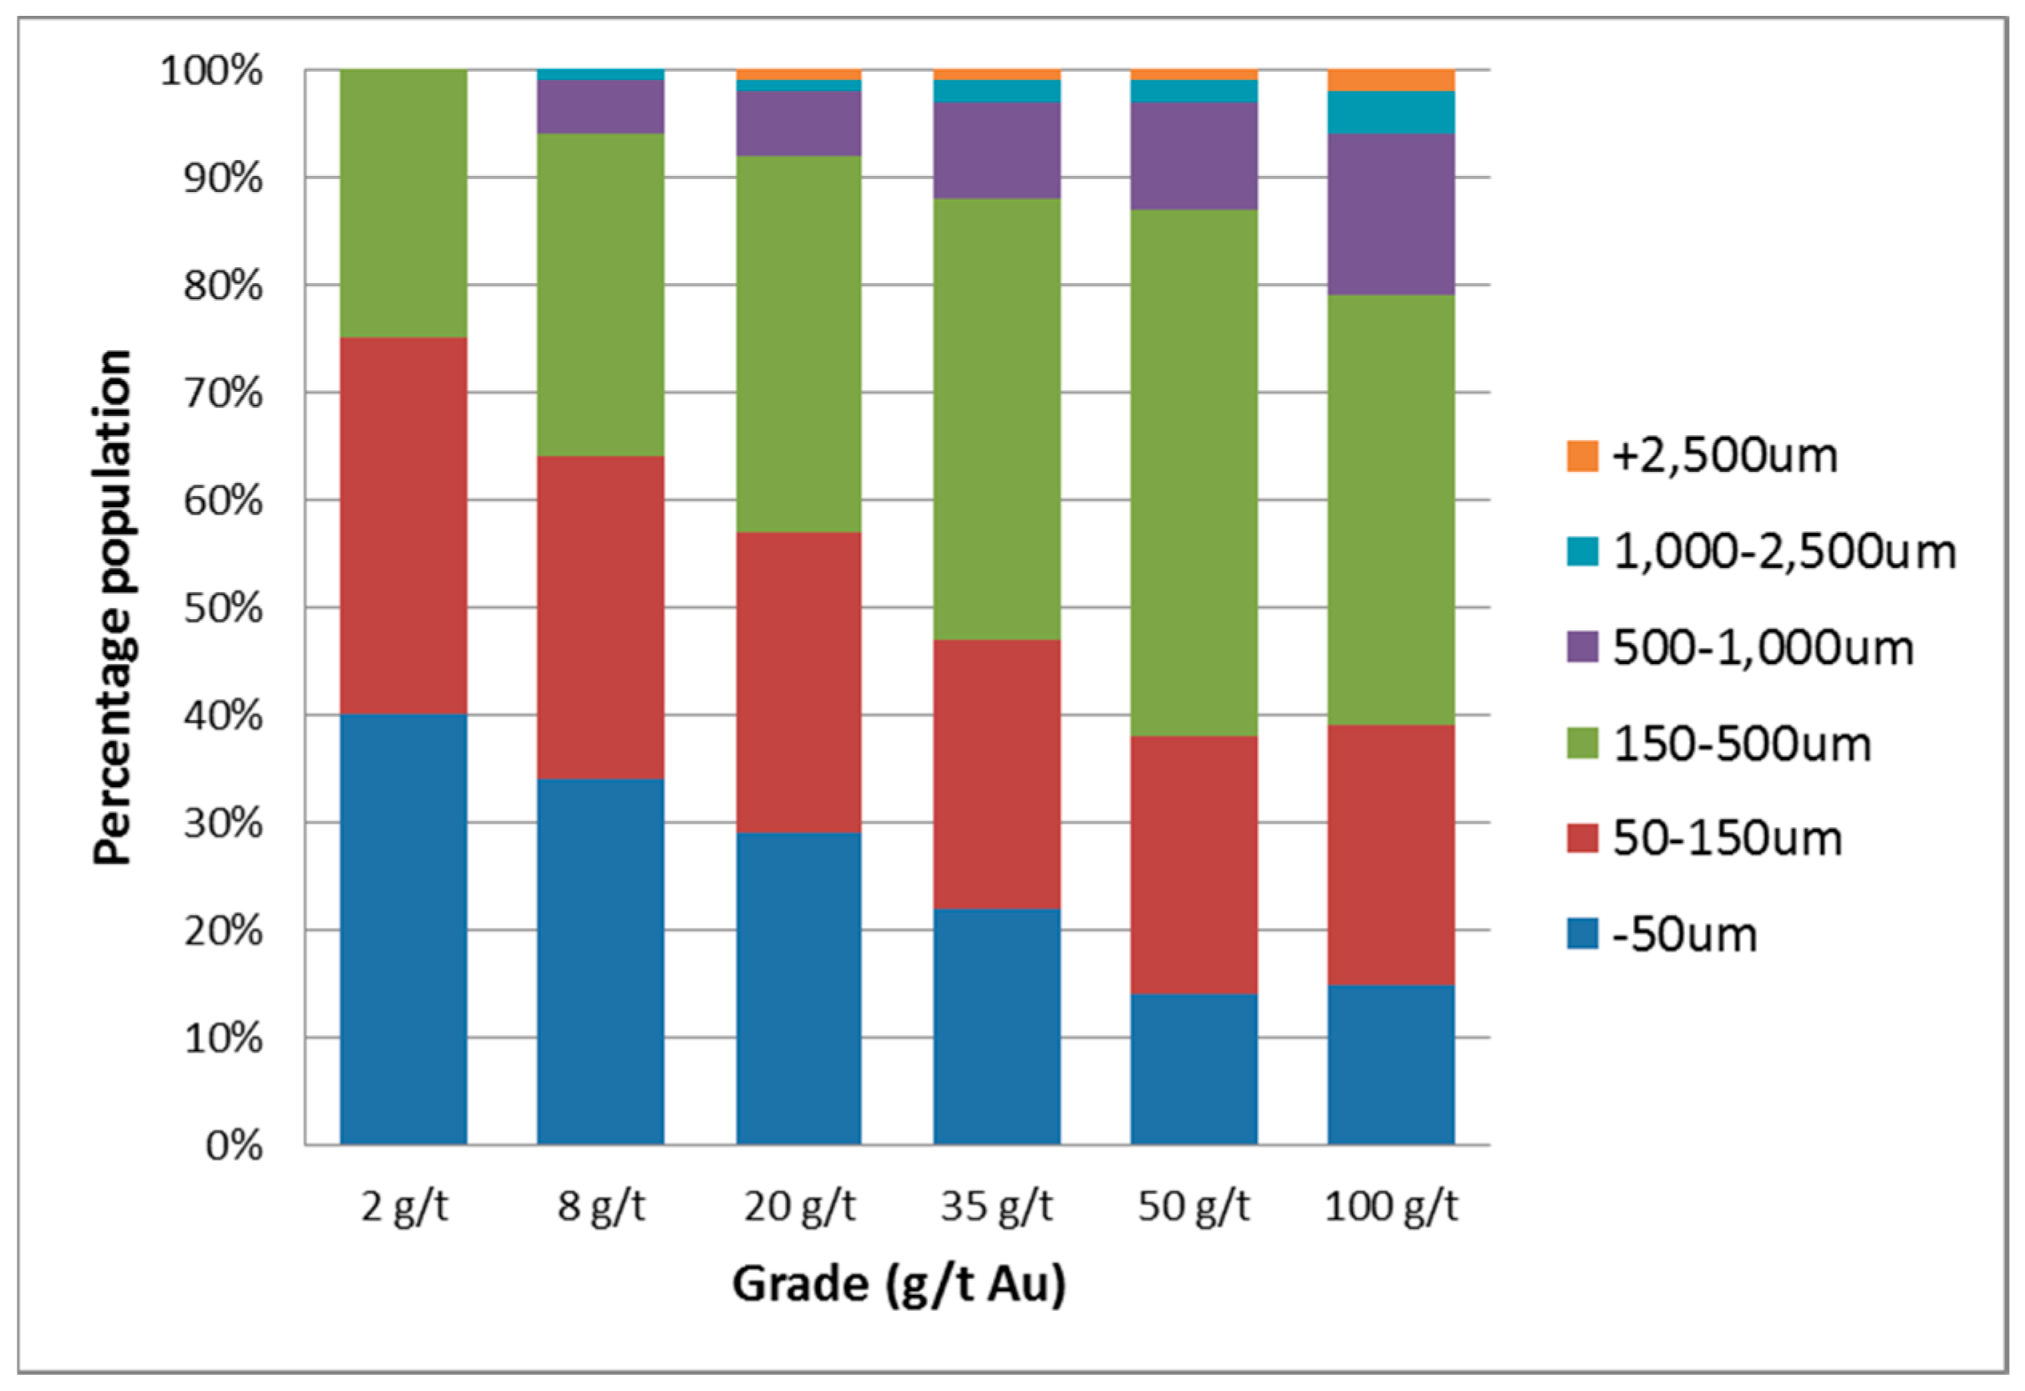
| Grade (g/t Au) | d95Au (µm) [dAuclus (µm)] | Sampling Constant (K) | Optimum Mass |
|---|---|---|---|
| 8 (BCOG) | 400 | 2400 | 15 kg |
| 20 (ROM) | 850 | 2700 | 30 kg |
| 20 (ROM) | [3000–5000] | 13,600–38,700 | 1–5 t |
| 30 (VHG) | [5000–10,000] | 25,800–73,000 | 3–25 t |
| Stage | Type | Protocol | 1 FSE | Comment |
|---|---|---|---|---|
| Exploration | Face chip | 4 kg crush to −3 mm Riffle split 1 kg Pulverise in LM5 to P90 −75 µm SFA1000 | ±55% | Substantial FSE at post-crusher split |
| ±55% | ||||
| Exploration | Face channel | 4 kg crush to −3 mm Riffle split 1 kg Pulverise in LM5 to P90 −75 µm SFA1000 | ±55% | Substantial FSE at post-crusher split |
| ±55% | ||||
| Exploration | Core | 2–2.5 kg crush to −3 mm Riffle split 1 kg Pulverise in LM5 to P90 −75 µm SFA1000 | ±50% | Substantial FSE at post-crusher split |
| ±50% | ||||
| Production | Sidewall chip | 5 kg crush to −8 mm Pulverise in LM5 to P90 −75 µm Riffle split 0.5 kg LW500 | ±5% | The 0.5 kg assay charge was scooped from the pulp, which is likely to yield high GSE, DE and EE |
| ±5% | ||||
| Production | Core | 2–2.5 kg crush to −8 mm Pulverise in LM5 to P90 −75 µm Riffle split 0.5 kg LW500 | ±5% | The 0.5 kg assay charge was scooped from the pulp, which is likely to yield high GSE, DE and EE |
| ±5% | ||||
| Production | Grab | Collect 4 × 5 kg −8 cm development or stope material 4 × 5 kg crush to −8 mm Pulverise in LM5 to P90 −75 µm Riffle split 4 × 0.5 kg 4 × LW500 | ±140% | The 0.5 kg assay charge was scooped from the pulp, which is likely to yield high GSE, DE and EE |
| ±165% |
| Sample Type | No. of Samples | Mean Grade (g/t Au) | Maximum Grade (g/t Au) | RSV | Field Sample Mass (kg) | Assay Type and Mass | Nugget Effect |
|---|---|---|---|---|---|---|---|
| Exploration face chip | 856 | 62.1 | 2268 | 250% | 3–5 | SFA1000 | 81% |
| Exploration face channel | 721 | 56.3 | 2831 | 270% | 3–5 | SFA1000 | 69% |
| Production sidewall chip | 1321 | 50.7 | 1361 | 195% | 4–6 | LW500 | 93% |
| All samples | 2898 | 55.5 | - | 230% | - | - | 75% |
| Sample Type/Error (Preparation Route) | Sampling (%) | Preparation (%) | Analytical (%) | Total (%) |
|---|---|---|---|---|
| Duplicate 4 kg face | Split at −3 mm | 1 SFA500 | - | |
| Exploration saw-cut channel | 48 | 33 | 21 | 62 |
| Number of pairs | 50 | 50 | 50 | - |
| Sample Type/Error (Preparation Route) | Sampling (%) | Preparation (%) | Analytical (%) | Total (%) |
|---|---|---|---|---|
| Duplicate 5 kg Face | No Split | Split at −75 µm LW500 | - | |
| Production sidewall chip | 84 | - | 25 | 88 |
| Number of pairs | 65 | - | 65 | - |
| Key Parameter | Comment | 1 Component Error | TOS Error | 2 Error Rating | |
|---|---|---|---|---|---|
| 1 | Spatial distribution and number of samples | Samples collected at approx. 3 m intervals along drives and raises Each stope block informed by around 15–20 samples | 84% | GNE | Mod. |
| 2 | Sample mass (representa-tivity) | Each composite sample approx. 3–6 kg; total sample mass collected around a stope block approx. 85–110 kg Indicated optimum mass around 120 kg to 1 t to achieve 90% ±15% | Mod. | ||
| 3 | Collection and handling | Samples collected by hammer chipping All samples placed into plastic bags and sealed | DE, EE, WE | High | |
| 4 | Transport and security | Samples delivered directly from the mine to site laboratory | - | Low | |
| 5 | Preparation | Entire sample lot crushed and pulverised to P85 −75 µm, with 0.5 kg split for assay Error from pulp splitting Equipment cleaned between sample | 25% | GSE, DE, EE, PE | Mod. |
| 6 | Assay | LW500 process undertaken correctly | - | Low | |
| 7 | QAQC | Duplicates, CRM and blanks within expectation Written protocols for the sampling-assaying process | - | - | Low |
| 8 | Validation/variability indicators | Nugget effect 93% RSV 195% Process parcel (±32 kt) grade reconciliation generally under-called grade | Total 88% | GNE, GSE, DE, EE, WE | High |
| Summary | |||||
| Representativity (1)–(3) | High | ||||
| Preparation and assaying (4)–(7) | Low | ||||
| Fit-for-purpose | Marginal | ||||
| Key Factors | Case Study | #1 | #2 | #3 |
|---|---|---|---|---|
| Mine | Ballarat | San Christina | Nalunaq | |
| Project status | Operating | Operating | Evaluation | |
| Mining | Method | Longhole | Shrinkage | Longhole |
| Annual production | 270,000 t | 15,000 t | 160,000 t | |
| Geology | Host rocks | Black shales | Volcanics | Metavolcanics |
| Mineralisation style | Vein and stockworks | Vein | Vein | |
| Dip | >45° | 75–90° | 35–50° | |
| Width | 1–5 m to <20 m | 0.5–1.5 m | 0.2–1.5 m | |
| Current resource base | 415,000 at 10.2 g/t Au | 55,000 at 9.5 g/t Au [16,500 at 25.7 g/t Au] | 445,000 t at 18.7 g/t Au | |
| Inferred | Inferred/[Indicated] | Inferred | ||
| Ore/sampling characteristics | ROM (g/t Au) | 6 | 23 | 20 |
| 1 BCOG (g/t Au) | 4 | 6 | 8 | |
| Coarse gold (at mine grade) | 60% >100 µm | 70% >100 µm | 50% >100 µm | |
| 35% >1000 µm | 9% >1000 µm | 5% >1000 µm | ||
| 20% >2000 µm | <1% >2000 µm | <1% >2000 µm | ||
| Cluster effects | Minor | Major | Minor | |
| d95Au | 500–3000 | 1500 | 400 | |
| dmaxAu | 5000 | 2500 | 4000 | |
| dAuclus | 2500–3000 | 5000–10,000 | 1000–2000 | |
| Sampling constant (K) | 15,000–60,000 | 28,000-81,000 | 7000–22,000 | |
| Opt. field mass | 350 kg–5 t | 30 kg–35 t | 120 kg–1 t | |
| Sampling and assaying | Sample type | NQ whole core | Bulk | Chip |
| Field sample mass | 1.4–3.4 kg | 30 t | 3–6 kg | |
| Assay mass | 2.3 kg | 30 t | 0.5 kg | |
| Assay method | LW2300 | Pilot plant | LW500 | |
| TOS errors | Predicted FSE | ±10% | ±5% | ±5% |
| Other TOS errors | DE, EE, GSE | DE, EE | DE, EE, GSE | |
| Nugget effect | Total nugget effect | 65–85% | 49% | 75% |
| Sampling errors (duplicate pair analysis) | Sampling error | N.D. | 40% | 84% |
| Prep/anal error | 20% | 18% | 25% | |
| Total error | N.D. | 44% | 88% | |
| Reconciliation | Annual | 3 ±45% 4 ±20% | ±20% | ±30% |
| 2 Quarterly | 3 ±70% 4 ±45% | ±20% | ±40% | |
| Monthly | 3 ±90% 4 ±60% | ±20% | N.D. | |
| Stope-by-stope | N.D. | ±25% | N.D. | |
| 1 Resource class | Inferred | Indicated | Indicated | |
| Risk rating | Representativity | Moderate | Moderate | High |
| Preparation and assay | Low | Low | Low | |
| Fit-for-purpose | Yes | Yes | Marginal | |
| Stage | New Programme | Existing Programme |
|---|---|---|
| Example | Case study 2: San Christina | Case Study 1 and 3: Ballarat and Nalunaq |
| 1: Overview | Set programme goals and data quality objectives | Review programme goals and data quality objectives Review resource/reserve reconciliation |
| 2: Characterise | Review existing characterisation data and determine grade-liberation diameter relationships and critical optimisation grade Plan and undertake addition testwork if required | Review existing characterisation data and determine grade-liberation diameter relationships and critical optimisation grade Plan and undertake addition testwork if required |
| 3: Design or review | Apply Stage (2) data to design protocols, including TOS-FSE analysis Undertake duplicate pair analysis (if possible) | Apply Stage (2) data to review protocols, including TOS-FSE analysis Undertake duplicate pair analysis |
| 4: Implement | Set-up systems and written codes of practice Training of mine geology and production staff | Alter or set-up systems and written codes of practice Training of mine geology and production staff |
| 5: Monitor | On-going QAQC programme with timely review and action as required Annual internal and/or external peer review Review resource/reserve reconciliation Risk analysis | On-going QAQC programme with timely review and action as required Annual internal and/or external peer review Review resource/reserve reconciliation Risk analysis |
| 6: Update | On-going training Revision of protocols if required, return to Stage 2 or 3 as required | On-going training Revision of protocols if required, return to Stage 2 or 3 as required |
© 2019 by the authors. Licensee MDPI, Basel, Switzerland. This article is an open access article distributed under the terms and conditions of the Creative Commons Attribution (CC BY) license (http://creativecommons.org/licenses/by/4.0/).
Share and Cite
Dominy, S.C.; Glass, H.J.; O’Connor, L.; Lam, C.K.; Purevgerel, S. Integrating the Theory of Sampling into Underground Mine Grade Control Strategies: Case Studies from Gold Operations. Minerals 2019, 9, 238. https://doi.org/10.3390/min9040238
Dominy SC, Glass HJ, O’Connor L, Lam CK, Purevgerel S. Integrating the Theory of Sampling into Underground Mine Grade Control Strategies: Case Studies from Gold Operations. Minerals. 2019; 9(4):238. https://doi.org/10.3390/min9040238
Chicago/Turabian StyleDominy, Simon C., Hylke J. Glass, Louisa O’Connor, Chloe K. Lam, and Saranchimeg Purevgerel. 2019. "Integrating the Theory of Sampling into Underground Mine Grade Control Strategies: Case Studies from Gold Operations" Minerals 9, no. 4: 238. https://doi.org/10.3390/min9040238