Fractal Characteristics and Heterogeneity of the Nanopore Structure of Marine Shale in Southern North China


Key Laboratory of Computational Geodynamics, College of Earth and Planetary Sciences, University of Chinese Academy of Sciences, Beijing 100049, China
*
Authors to whom correspondence should be addressed.
Minerals 2019, 9(4), 242; https://doi.org/10.3390/min9040242
Submission received: 11 March 2019
/
Revised: 10 April 2019
/
Accepted: 17 April 2019
/
Published: 19 April 2019
(This article belongs to the Special Issue Nanomineralogy)
Abstract
:The characteristics of the nanopore structure in shale play a crucial role in methane adsorption and in determining the occurrence and migration of shale gas. In this study, using an integrated approach of X-ray diffraction (XRD), N2 adsorption, and field emission scanning electron microscopy (FE-SEM), we systematically focused on eight drilling samples of marine Taiyuan shale from well ZK1 in southern North China to study the characteristics and heterogeneity of their nanopore structure. The results indicated that different sedimentary environments may control the precipitation of clay and quartz between transitional shale and marine shale, leading to different organic matter (OM)–clay relationships and different correlations between total organic carbon (TOC) and mineral content. The shale with high TOC content tended to have more heterogeneous micropores, leading to a higher fractal dimension and a more complex nanopore structure. With the increase of TOC content and thermal evolution of OM, the heterogeneity of the pore structure became more significant. Quartz from marine shale possessed abundant macropores, resulting in a decrease of the Brunauere–Emmette–Teller (BET) surface area (SA) and an increase of the average pore size (APS), while clay minerals developed a large number of micropores which worked together with OM to influence the nanopore structure of shale, leading to the increase of the SA and the decrease of the APS. The spatial order of interlayer pores increased with the increase of mixed-layer illite–smectite (MLIS) content, which naturally reduced the fractal dimensions. In contrast, kaolinite, chlorite, and illite have a small number of nanopores, which might enhance the complexity and reduce the connectivity of the nanopore system by mean of pore-blocking. Taiyuan shale with higher heterogeneity is highly fractal, and its fractal dimensions are principally related to the micropores. The fractal dimensions correlate positively with the SA and total pore volume, suggesting that marine shale with higher heterogeneity may possess a larger SA and a higher total pore volume.
1. Introduction
Minerals and organic matter (OM) are the two most basic units of shale, which together determine the structural characteristics and heterogeneity of nanopores [1,2,3]. Because shale is a complicated porous material which contains a complex and heterogeneous pore structure with both matrix pores and fracture networks [4,5], the nanopore structure parameters of shale are very vital to understand methane adsorption and desorption [2,6,7]. Thus, the evaluation of the nanopore structure of shale is a key issue in shale gas exploration.
Many qualitative and quantitative experimental methods have been applied to investigate shale pores, such as field emission scanning electron microscopy (FE-SEM) [8,9], small-angle neutron scattering [6], mercury intrusion [10,11], gas adsorption [12,13,14,15,16], and nuclear magnetic resonance (NMR) [11,17]. Among them, low-pressure liquid nitrogen physical adsorption analysis is an effective approach to study the nanopore structure of shale [18,19]. On the basis of N2 adsorption–desorption, most of the pore structure parameters of shale, including pore geometry, pore volume, specific surface area (SA), and average pore size, can be characterized [20,21,22]. In order to investigate the complexity and heterogeneity of pore structure, the fractal theory, which is a widely used model to be applied on the basis of N2 physisorption experiments, should be necessarily introduced. There are four common methods to research the fractal characteristics of the nanopore structure of shale, including the mercury porosity method, gas adsorption method, dispersion method, and scattering method [23,24,25]. In terms of gas adsorption methods, Brunauere–Emmette–Teller (BET) surface area analysis and Frenkele–Halseye–Hill (FHH) theory are usually adopted to calculate fractal dimensions [26,27]. These adsorption theories provide a simple calculation method and an excellent theoretical basis for the investigation of nanopore structure characteristics and heterogeneity of shale. Khalili et al. [28] firstly used the gas–liquid adsorption isotherm to determine the fractal dimension of solid carbon; Fu et al. [29] investigated the fractal dimension and classification of nanopores of coal based on coalbed methane migration; Yao et al. [11] investigated the fractal characterization of coals from North China with different thermal maturity; Zhang et al. [30] studied the pore structure of coals by using the FHH model and suggested the degree of coal metamorphism is a key factor to control the fractal dimension; Bu et al. [31] studied the fractal dimension of nanopores in non-marine shales based on the FHH model; Yang et al. [32] studied the characteristics of the nanopore structure of the transitional shale and indicated significant differences between marine shale and continental shale with respect to the major control factors of heterogeneity; Liu et al. [33] investigated the differences of fractal dimension of nanopores between marine shale and terrestrial shale. Although a lot of related research works have been conducted, very few studies have examined the fractal dimension and heterogeneity of the nanopore structure of marine shale in southern North China. These fractal researches of shales and coals are conducive to the study the fractal dimension of nanopore structure and the investigation of the key issues regarding the heterogeneity of nanopore structure in marine shale.
In this study, we systematically collected eight marine shale drilling samples from the Carboniferous-Permian Taiyuan Formation in Huainan coalfield, southern North China. The major aims of this study were to: (1) characterize the pore structure parameters to estimate whether marine Taiyuan shales are fractal; (2) study the relationships between fractal dimensions and total organic content (TOC), maturity of organic matter, clay minerals, quartz; (3) identify the heterogeneity of the nanopore structure of marine shale.
2. Geological Setting
Adjacent to the northern margin of the Qinling–Dabie orogenic belt, southern North China, especially the Huainan coalfield, is rich in coal and coalbed methane resources (Figure 1a) [31,34]. The Huainan coalfield is an important Carboniferous-Permian coal accumulation basin in southern North China (Figure 1a) [35]. The ZK1 well is situated in Xinji coal mine in the western part of the Huainan coalfield (Figure 1a,b) and was drilled through the Carboniferous-Permian Taiyuan Formation (Figure 1b,c) to collect geological information about the marine Taiyuan shale reservoir and further research the fractal characteristics and heterogeneity of the nanopore structure of marine shale.
Southern North China experienced long-term erosion, resulting in the loss of a large number of sedimentary strata in the Early Ordovician [36,37]. In the Early Carboniferous, the crust of the study area began to subside slowly, resulting in prevailing transgression and the development of marine-continental transitional coal-bearing sediments. In the Late Carboniferous, Taiyuan Formation was deposited in the carbonate tidal flat and lagoon facies, forming thick layers of limestone and shale. The Carboniferous-Permian Taiyuan shale is the main marine shale in southern North China, with a shallow burial depth (1000–1200 m) and a thickness ranging from 60 to 100 m (Figure 1c).
3. Samples and Experiments
3.1. Samples
For the purpose of this study, we selected representative shale samples from well ZK1 that were primely preserved and without weathering. The selected shale samples contained abundant organic matter and fine-dispersed pyrite with extremely thin bedding. In addition, we tried to select samples that were not damaged by drilling. The ZK1 well was drilled at a depth of 1174.3 m in Huainan coalfield, corresponding to the Carboniferous-Permian Taiyuan Formation between 1009 m and 1144 m (Figure 1a,b), and eight shale samples from the marine Taiyuan Formation were obtained from this well (Figure 1c). All shale samples were analyzed for vitrinite reflectance, TOC, composition, and nanopore structure.
3.2. Methods
The shale samples were analyzed on a Leco CS-230 analyzer to obtain the TOC content, following the Chinese Oil and Gas Industry Standard (COGIS) (GB/T4762008) [38]. The vitrinite reflectance experiment was randomly performed on an AXIO Imager Mlm microphotometer produced by ZEISS company, Oberkochen, Germany, following COGIS (SY/T5124-1995) [39]. Quantitative XRD analysis was carried out for the mineralogy of the shale, following COGIS (SY/T5163-2010) [40].
The FE-SEM experiment of the shale samples was carried out in the Analysis and Test Center of Suzhou University, China, using s-4700 cold field emission scanning electron microscopy. Firstly, the sample was broken into blocks of about 10 × 10 × 5 mm3 in size, and the shale surface was guaranteed to be fresh and pollution-free during the crushing process. In order to increase the sample conductivity and improve imaging quality, it is necessary to spray gold on the sample. This instrument is a secondary electronic imaging system with a super-resolution of 1.2 nm under a high vacuum of 15 KV, which is better than that of the ordinary scanning electron microscope, allowing the observation of nano-scale pores in the shale samples and facilitating the clear observation of nanopore morphology and of the shale samples [9,19].
Low-pressure N2 adsorption was performed by the Autosorb iQ Station 1 Specific Surface Area Analyzer produced by Quantachrome Ins. Firstly, we crushed the selected shale samples through a 40–60 mesh. In order to remove the residual gas in the sample, the shale sample needed to be vacuum-degassed at 105 °C Celsius for 10 h. The test tubes containing the samples were placed in a Dewar bottle containing liquid nitrogen and connected to the analysis system. Then, high-purity nitrogen was applied for physical adsorption–desorption determination at a test temperature of −195.8 °C. The surface area of the shale samples was obtained by linear regression with the multi-point BET model, and the pore size distribution and pore volume of the shale samples were calculated by using the capillary condensation model Barrett–Joyner–Halenda (BJH) method [41].
4. Results
4.1. Organic Petrology and Mineralogy
The TOC content of the shale samples ranged from 1.24% to 3.38%, with an average value of 2.21% (Table 1). The kerogen of the shale samples was mainly of humic type (Type III), in agreement with the results of a previous works [35]. The mean random reflectance of vitrinite (Ro) of the samples varied from 0.65% to 1.94%, with an average value of 1.33%, indicating a late mature stage of hydrocarbon development. Clay minerals were the main minerals composing the shale samples, whose content ranged from 42.4% to 57.5%, with an average of 47.1%. The content of quartz ranged from 31.9% to 49%, with an average value of 40.3%, and the content of other minerals including carbonate minerals and pyrite were lower (Table 2). Within the clay minerals, the mixed-layer illite–smectite (MLIS) was the main component, with an average value of 28.6%.
4.2. N2 Adsorption–Desorption Isotherm Characteristics
At present, liquid nitrogen adsorption analysis is an effective way to study the nanopore structure characteristics of materials [42,43]. According to the adsorption isotherm types classified by the International Union of Pure and Applied Chemistry [44], all of the shale samples here studied correspond to the Type IV isotherm with a hysteresis loop (Figure 2), which is the result of capillary condensation occurring in the mesopore [41], indicating that a large number of mesopores developed in the shale samples. As a whole, the adsorption curve presented an inverse s-shape. At the low-pressure stage of P/P0 < 0.4, the adsorption curve was nearly horizontal, slightly curving upward and rising very slowly, indicating that this stage corresponded to the transition from adsorption monolayer to multilayer. When 0.4 < P/P0 < 0.8, the adsorption curve began to rise slowly, and this stage corresponded to the multi-layer adsorption stage. In the P/P0 > 0.8 segment, the adsorption curve rose sharply with the increase of pressure, but when the relative pressure was close to the saturated vapor pressure, the gas adsorption did not reach the saturation state, because capillary condensation occurred in the macropores.
4.3. Pore Structure Parameter Characteristics
The N2 adsorption results for the determination of the nanopore structure parameters of the shale samples are presented in Table 3. On the basis of these results, the shale samples exhibited high values of SA, ranging from 8.175 m2/g to 13.138 m2/g, with an average value of 10.62 m2/g. The total pore volumes ranged from 14.341 cm3/g to 19.508 cm3/g, with an average value of 16.961cm3/g.
The pore size distribution (PSD) calculated by the model is shown in Figure 3, showing the pore size of the shale samples ranged from 1 to 100 nm, and the average pore size (APS) was 6.696 nm to 11.014 nm. About the PSD curve (Figure 3a), we observed three different patterns, including micropore, mesopore, and macropore portions. The micropore portion appeared unimodal, with the main peak at 1.4–1.6 nm (Figure 3a). The mesopore portion exhibited multiple peaks, with one major peak in the range of 16–20 nm, and several other peaks (Figure 3a). The macropore portion also appeared unimodal, with a major peak in the range from 60 to 80 nm (Figure 3a). According to the pore SA distribution curve (Figure 3b), there were two peaks in the pore-size range. The micropore and mesopore portions presented a significant peak in the ranges from 1.4 to 1.6 nm and from 2 to 3 nm, respectively.
4.4. Fractal Characteristics of the Pore Structure
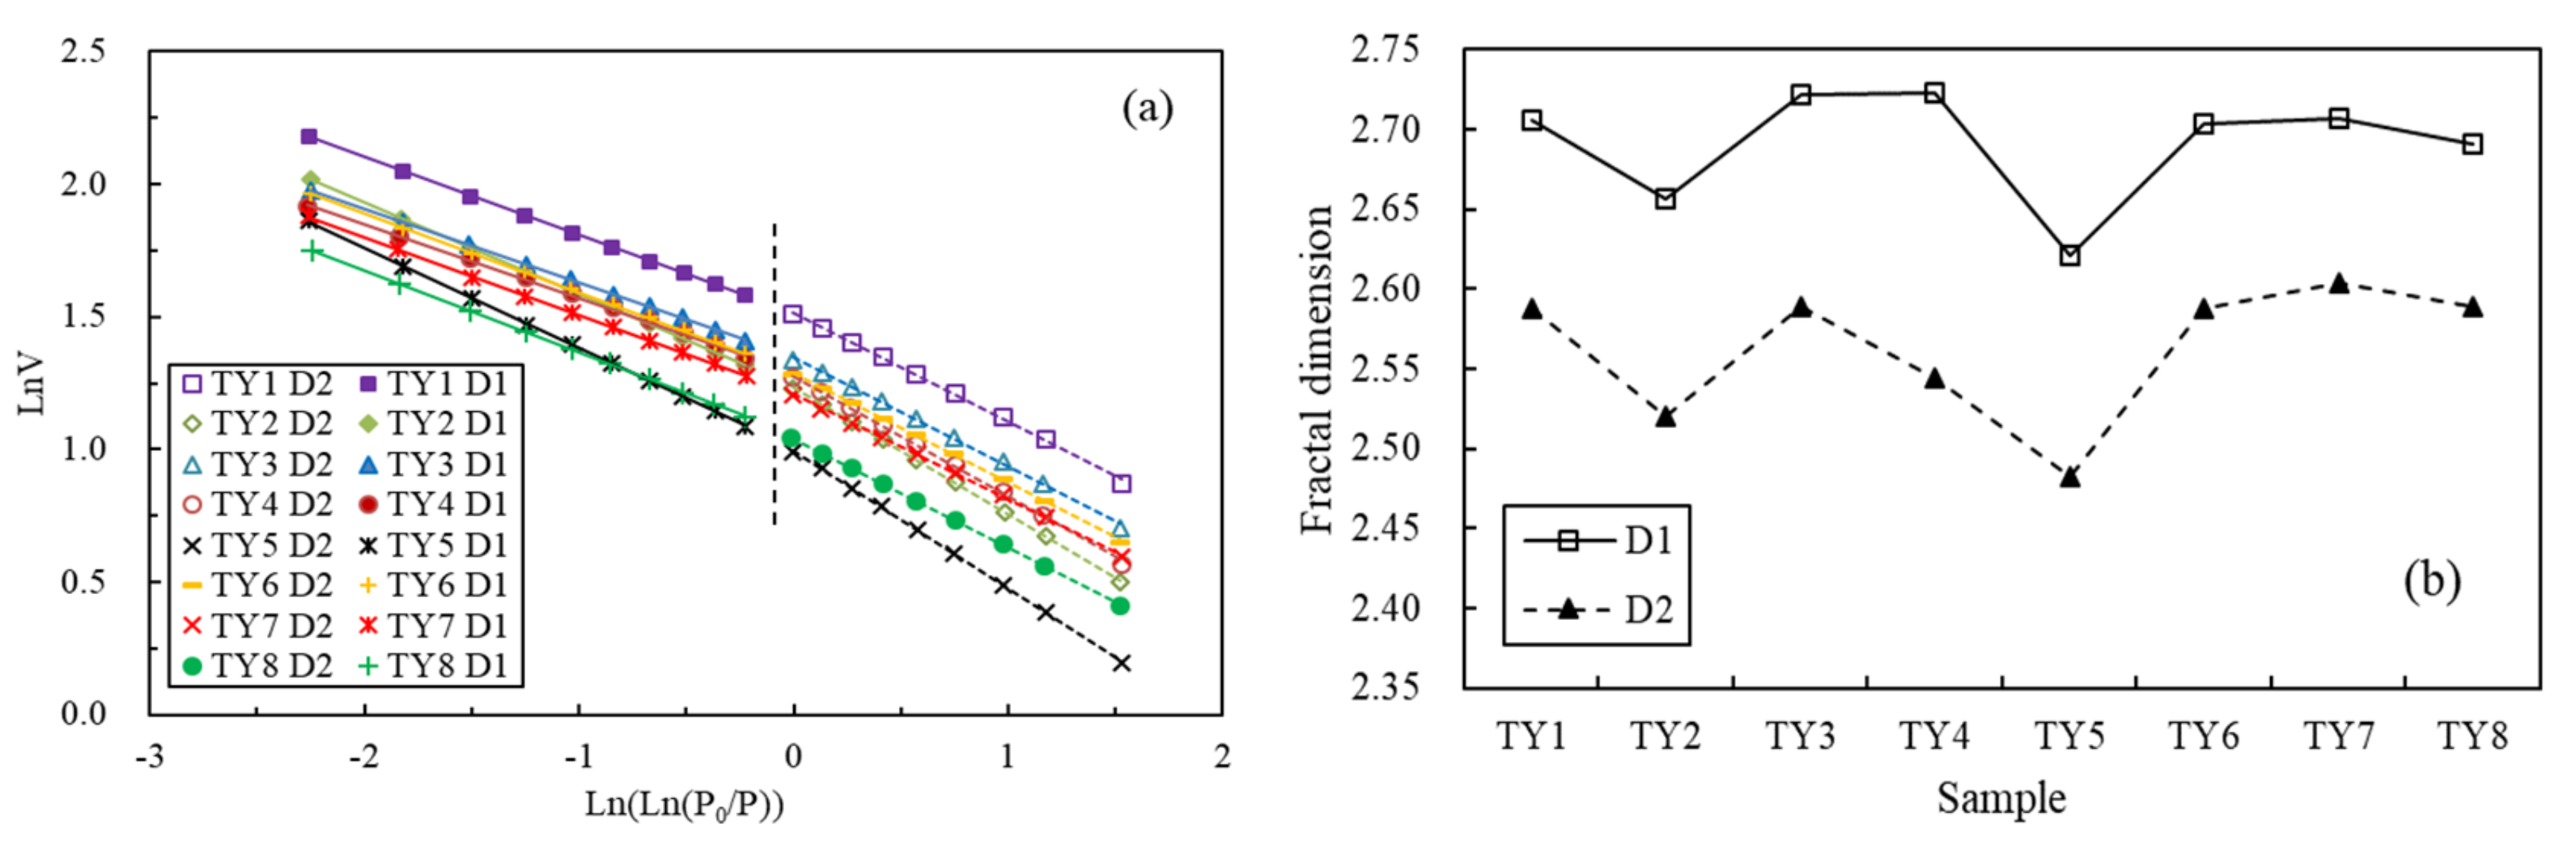
Fractal geometry is widely used to describe some fractal systems with no characteristic length scales [45]. Fractal dimension calculated by the gas adsorption method is an effective and reliable petrophysical parameter for describing and quantifying irregular pore structures and complicated surfaces [46]. The calculation method of the FHH model is described as follows: ln (V/V0) = Constant + K[ln(ln(P0/P))]. where V is the adsorbed gas volume, V0 represents the monolayer coverage volume, P0 refers to the saturation pressure, P is the equilibrium pressure, and K is a constant dependent on the fractal dimension (D) and the adsorption mechanism, which can be obtained by the slope of the plot of lnV versus ln(ln(P/P0)). Then, D can be calculated through the equation used for shales: D = K + 3. The value of D ranges from 2 to 3, and a D value close to 3 indicates that the pore structure is complex and irregular [47].
The plots of lnV versus ln(ln(P/P0)) and the results of fractal dimensions estimated according to this fractal model are presented in Figure 4 and Table 4. Figure 4a shows that two linear segments (D1 and D2) with different gradients were obvious, which suggested two obvious phases of the N2 adsorption process, containing monolayer–multilayer adsorption (D2) and pore infilling (D1). The two sections showed a significant linear relationship, with correlation coefficients of more than 0.95, indicating that the marine Taiyuan shales are fractal [47].
The fractal dimension D1 of marine Taiyuan shales varied from 2.6212 to 2.723,1 with an average value of 2.691 (Table 4), which is equal to that of continental shales (2.680, on average), indicating the heterogeneity of nanopores in marine shale is similar to that in continental shale. The fractal dimension D2 from Taiyuan shale showed a wider distribution range from 2.4825 to 2.6042, with an average value of 2.563 (Table 4). In addition, D1 represents the roughness of the pore surface, and D2 refers to the complexity of the pore volume. Figure 4b shows that the variation trend of D1 was similar to that of D2, indicating that the roughness of the pore surface was related to the complexity of the pore volume to some extent. These higher average fractal dimensions suggested that the pore structure of the Taiyuan shale is complex and heterogeneous. Overall, these complex pores make it more difficult for gas to adsorb, diffuse, and flow in marine Taiyuan shale.
5. Discussion
5.1. Relationships between Abundance of Organic Matter and Main Mineral Content
The mineral composition mainly indicates the sedimentary environment of shale in the sedimentary process. The correlations between the abundance of organic matter (TOC content) and quartz and clay content of the Taiyuan marine shale are shown in Figure 5. The results showed that the TOC content was negatively correlated to the clay content (Figure 5a) and positively correlated to the quartz content (Figure 5b), which is consistent with the characteristics of the Wufeng–Longmaxi and Niutitang marine shale in South China and Devonian Horn River shale in Canada [48,49,50,51,52,53]. However, this result differs from the one obtained for the transitional Permian Shanxi and Xiashihezi shales deposited in North China, which show an opposite correlation [31]. The marine Taiyuan shale was deposited in a carbonate tidal flat facies, a favorable environment for the accumulation of organic matter, which is far away from the land and relatively unfavorable to the enrichment of terrigenous clay minerals, whereas the transitional shale was deposited in a shallow water environment, which is conducive to both sedimentation of terrigenous OM from higher plants and enrichment of terrigenous clay minerals. Therefore, different sedimentary environments result in different OM–clay relationships in transitional shale and marine shale. Basins, depressions, and lagoons are favorable areas for the formation of organic-rich marine shale, because their sedimentary systems are relatively stable. In addition, they are unfavorable for the preservation of terrigenous clay, because the terrigenous material has been transported for a long distance. Shale rich in organic matter and clay minerals possibly develops only in swamps or inland lake basins. In marine sedimentary systems, quartz is mainly derived from the hard bodies of siliceous organisms [13,49,52]. Therefore, there is a positive correlation between TOC content and quartz content in marine shales (Figure 5b). Overall, different sedimentary environments control the precipitation of clay and quartz, leading to different correlations between TOC content and mineral content.
5.2. Relationships among Nanopore Structure Parameters
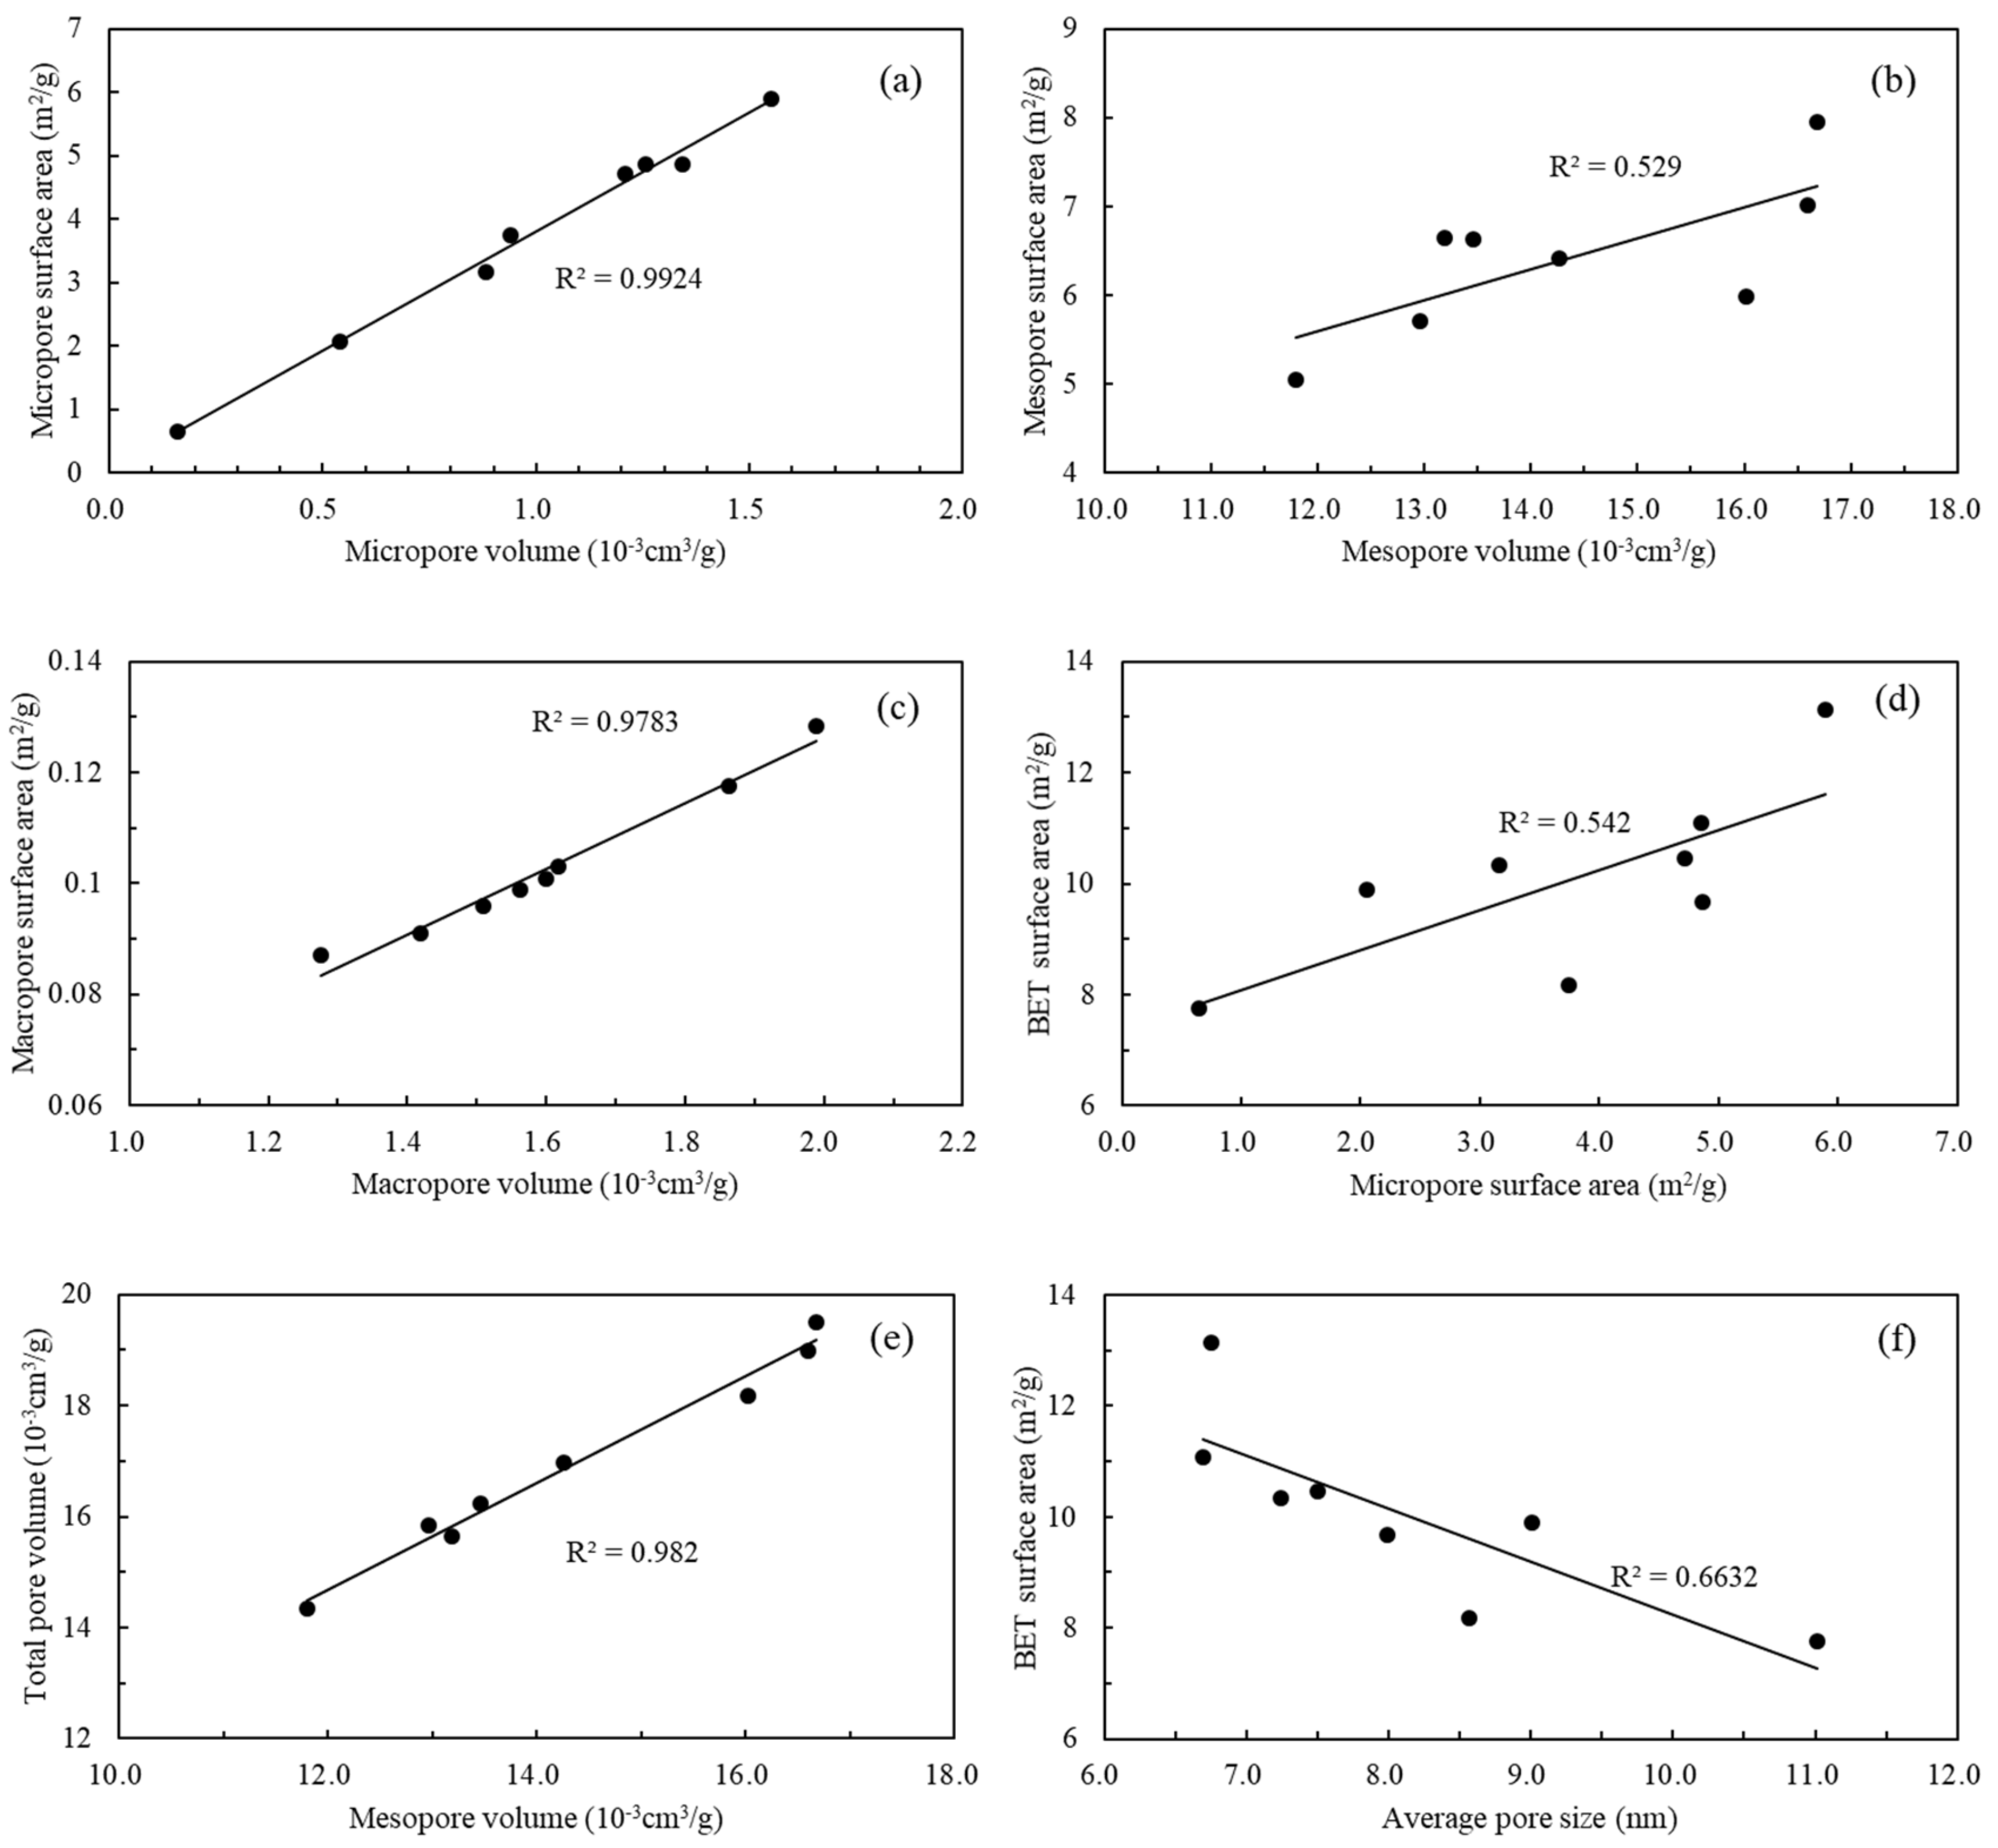
To investigate the relationship among nanopore structure parameters in marine shale, the related plots are given in Figure 6. Significant positive relationships are presented between SA and total pore volume (PV) (Figure 6a–c), which were also demonstrated in the study of over-mature marine shale [51]. This positive relationship was more significant between the SA and the volume of the micropores (R2 = 0.9924, Figure 6a) and macropores (R2 = 0.9783, Figure 6c). Furthermore, the micropore SA presented a positive correlation to the total surface area (R2 = 0.8428, Figure 6d), which indicated that the SA of micropores was dominant among the nanopores of marine shale. Figure 6e exhibits an apparent positive relationship between the mesopore volume and the total pore volume, showing that the mesopore volume dominated the total pore volume in shale, which is consistent with previous studies in marine shale [2,52,54]. The APS showed a negative relationship with the BET SA (R2 = 0.6632, Figure 6f), indicating that the APS presented a significant negative correlation with SA and PV. Therefore, the negative correlations between APS and SA and PV indicated that shales with smaller APS possess more abundant micropores and mesopores.
5.3. Relationships between Shale Compositions and Nanopore Structure Parameters
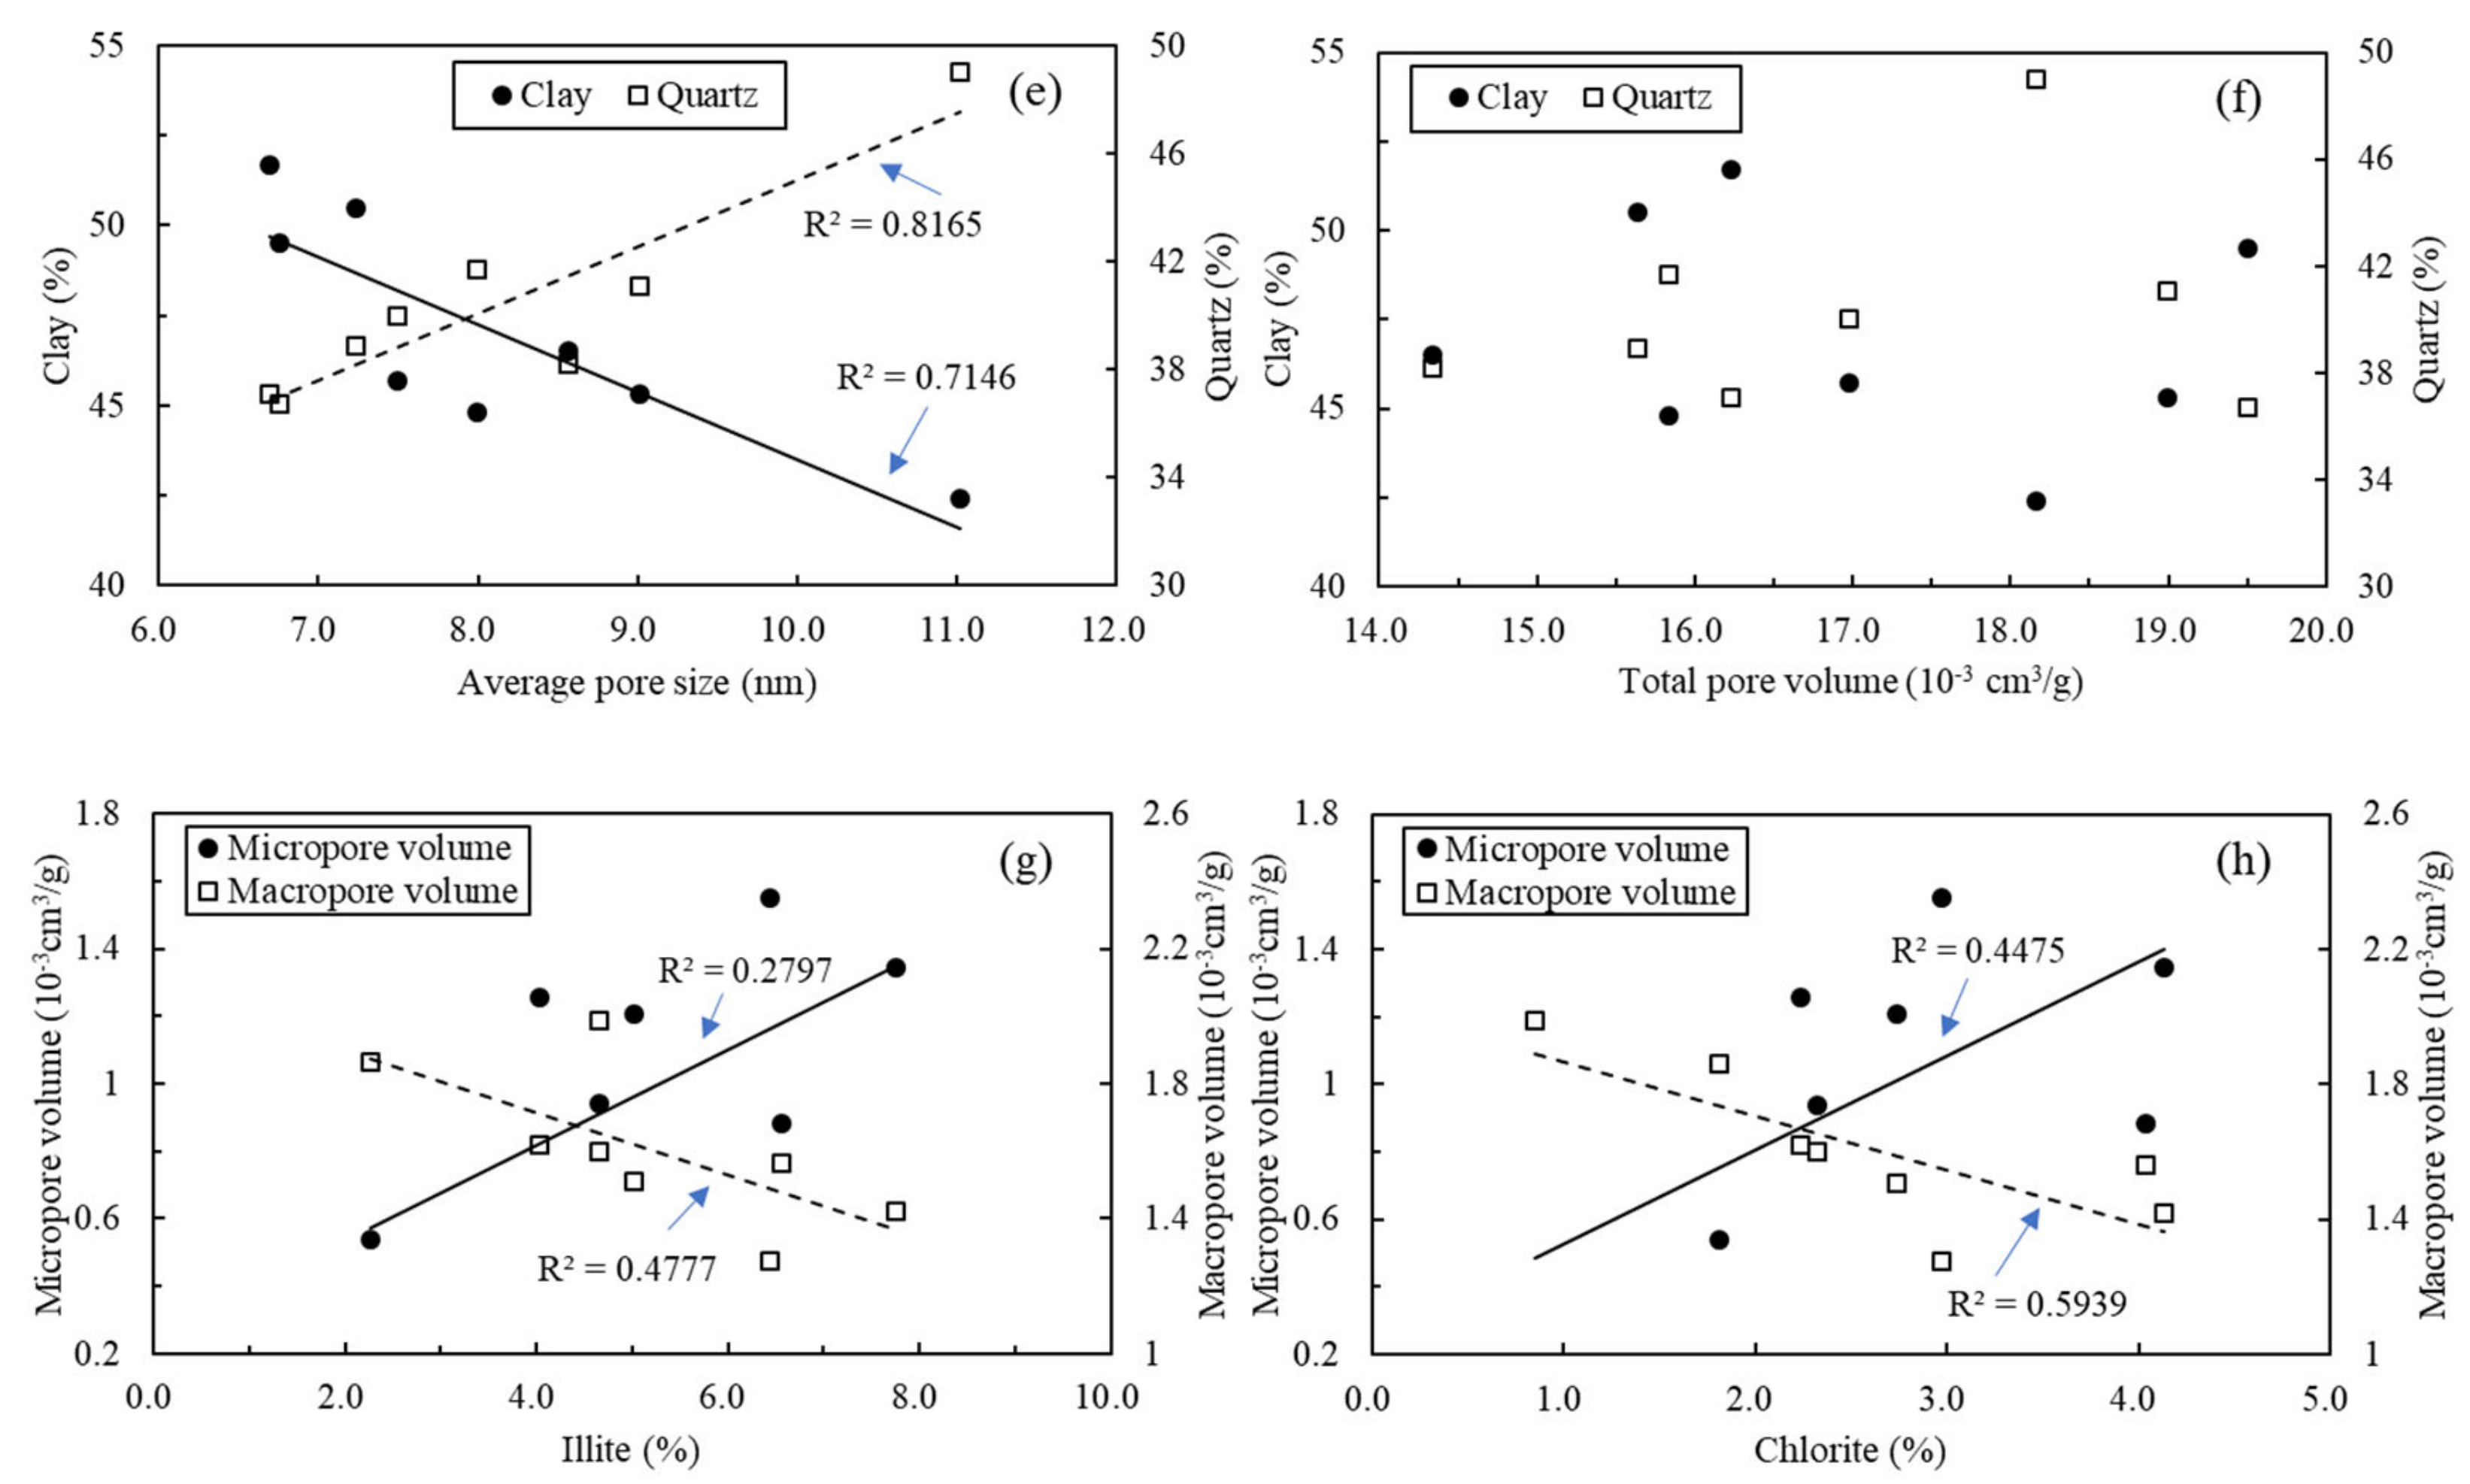
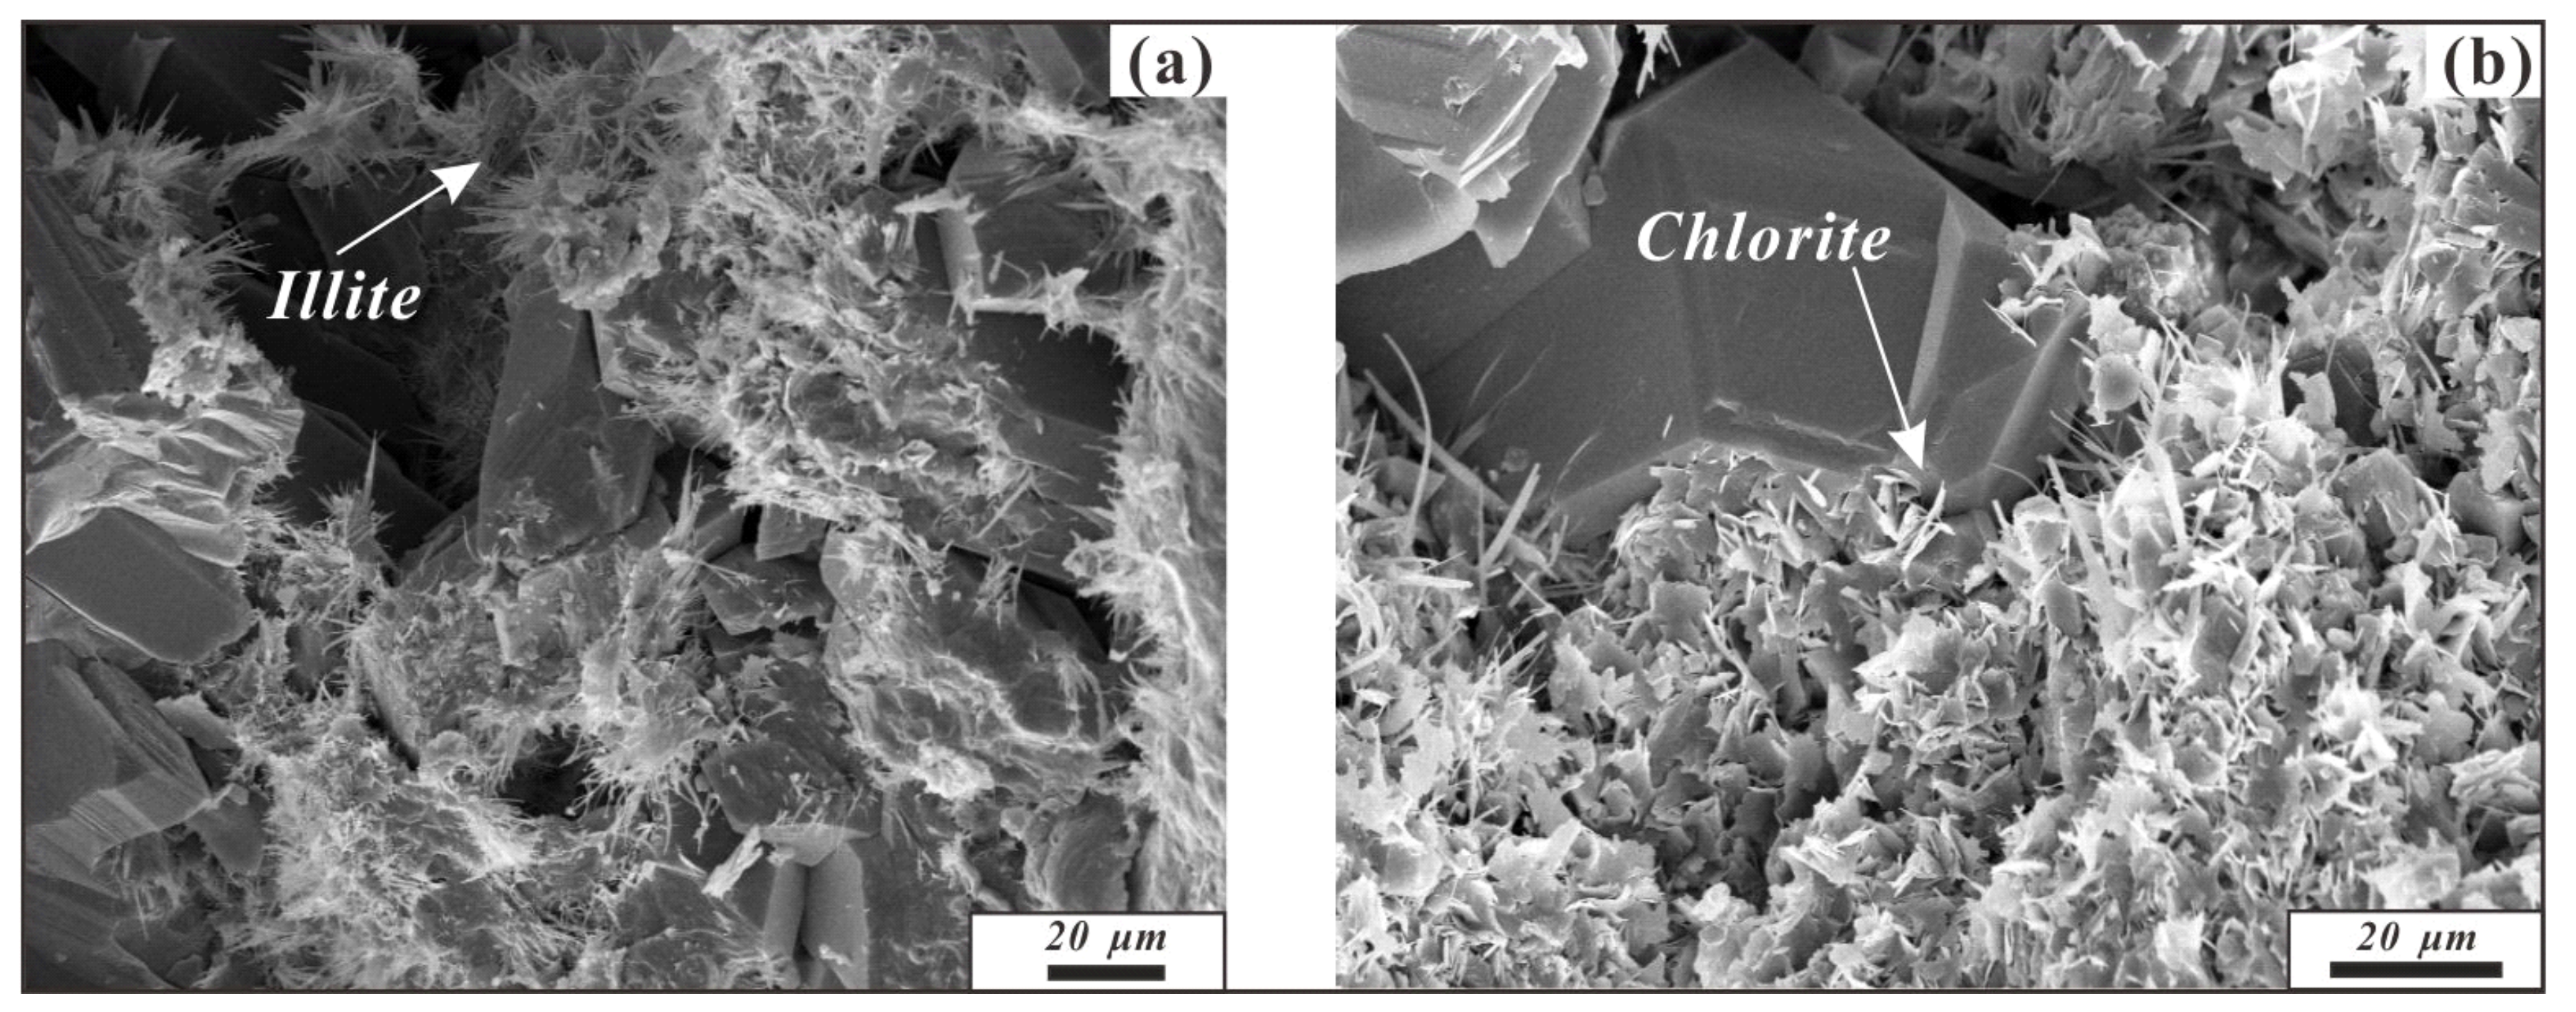
The organic-rich shale mainly contains organic matter and minerals, the minerals being clay minerals and quartz. To study the relationships between the main shale composition and nanopore structure parameters in marine shale, the relevant plots are presented in Figure 7. TOC content presented a positive correlation with APS and a negative correlation with SA (Figure 7a), indicating that the studied shale with higher TOC content might possess more macropores and smaller SA and micropore volume. However, the relationships between TOC content and APS and BET SA were not apparent, having correlation coefficients of 0.5584 and 0.4257, respectively, suggesting that the shale with a higher TOC content developed a more complex pore structure, resulting in a stronger heterogeneity of the shale reservoir. According to the results of the FHH fractal dimensions, the studied shale samples are fractal with a high fractal dimensions (2.6212 < D1 < 2.7231; 2.4825 < D2 < 2.6042), which further illustrates that marine shale with high TOC content may develop more heterogeneous micropores, leading to a higher fractal dimension and more complex nanopore structure. Furthermore, the relationships between total pore volume and TOC and Ro were also complex (Figure 7b,c), exhibiting parabolic patterns, which suggests that, with the increase of TOC content and thermal evolution of OM, the variation of the pore structure is more complex. XRD results suggested that quartz and clay were primary minerals in the shale samples (Table 2). We observed moderately positive relationships between BET SA and clay and quartz (Figure 7d), while APS showed opposite correlations with clay and quartz (Figure 7e). Quartz from marine facies possesses a larger number of macropores, resulting in a decrease of the BET SA and an increase of the APS, while clay minerals develop substantial micropores and work together with OM to influence the nanopore system of shale, leading to an increase of the BET SA and a decrease of the APS. However, there was no apparent relationship between total pore volume and clay or quartz (Figure 7f), which indicated that a single mineral cannot determine the total pore volume and may only control the development of a certain type of pore in shale. As for clay minerals, slight relationships are observed in Figure 7g,h, indicating that illite and chlorite had positive relationships with micropore volume and negative relationships with macropore volume. This result suggested that illite and chlorite contain more micropores and fewer macropores, which was also proved by the SEM images presented in Figure 8a,b. Illite is generally leaf-shaped or filamentous, resulting in the development of micro-intergranular pores (Figure 8a); chlorite, originated from biotite diagenetic transformation, usually shows schistose or planar schistose and presents very narrow slit pores among schistose layers (Figure 8b) [55]. Overall, the complicated relationships between pore parameters and OM and the obvious correlation of pore parameters with quart and, clay suggested that OM pores were poorly developed and the complex of OM and minerals might be of great significance in the study of shale pore structure.
5.4. Relationships between Mineral Composition and Fractal Dimensions
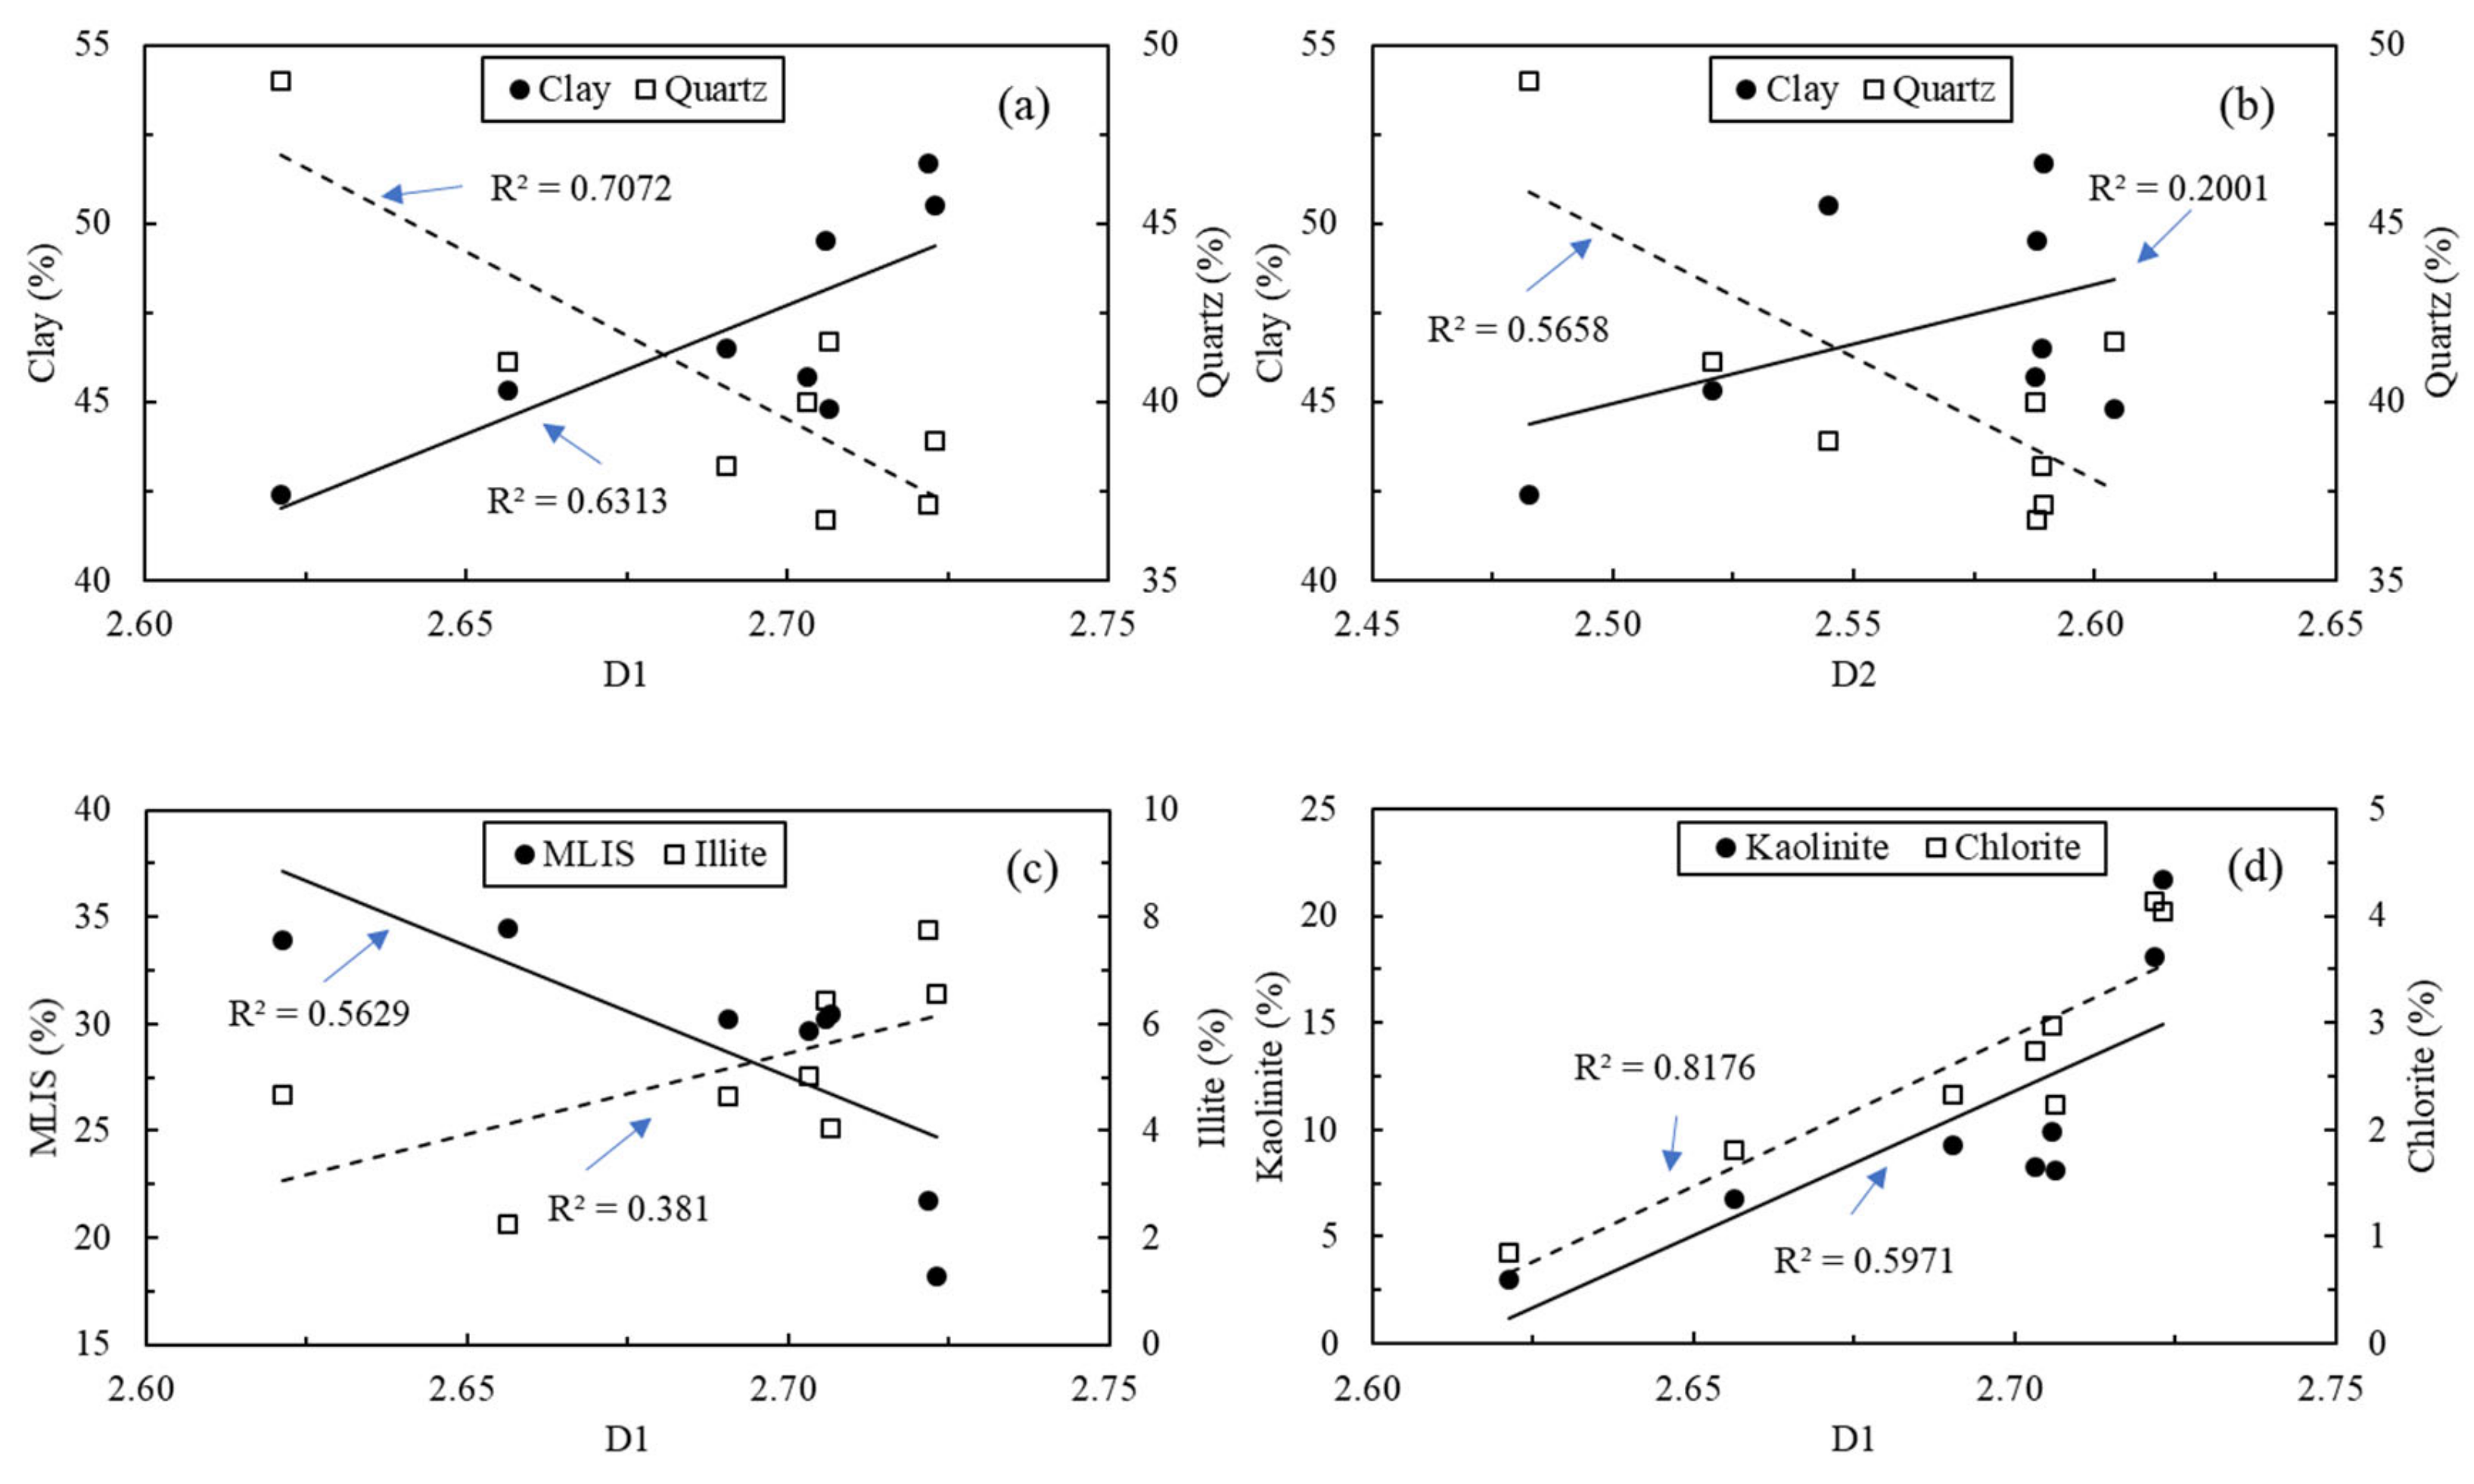
To study the correlations between minerals and fractal dimensions in marine shale, all linear diagrams between fractal dimensions and quartz and clay minerals are shown in Figure 9. The result showed that the fractal dimensions (D1 and D2) had slight positive correlations with the clay content, whereas a negative relationship existed between the fractal dimensions and the quartz content (Figure 9a,b), which is consistent with the results obtained for the Longmaxi marine shale and Niutitang marine shale [51,54]. These relationships indicated that, with the increase of clay mineral content, the heterogeneity of shale became stronger, and clay minerals possessed a more irregular surface leading to a higher SA compared to quartz (Figure 10). Therefore, the fractal dimension substantially represents the roughness of the surface and is correlated with the SA of minerals. Thus, the greater the value of the fractal dimension, the higher the SA. As for the clay minerals, the fractal dimension showed positive relationships with illite, kaolinite, and chlorite. In contrast, the fractal dimension was negatively correlated to MLIS (Figure 9c,d). For MLIS, the spatial order of interlayer pores increased with the increase of pore content, which naturally reduced the fractal dimension [56]. In contrast, kaolinite, chlorite, and illite have few pores and were more likely to inhibit pore development in the pore system. Therefore, the increase of their content might increase the heterogeneity and complexity of the pore system, thus increasing the value of the fractal dimension of the pore structure, which is consistent with materials with a small number of pores [54,57].
5.5. Relationships between Fractal Dimension and Nanopore Structure Parameters
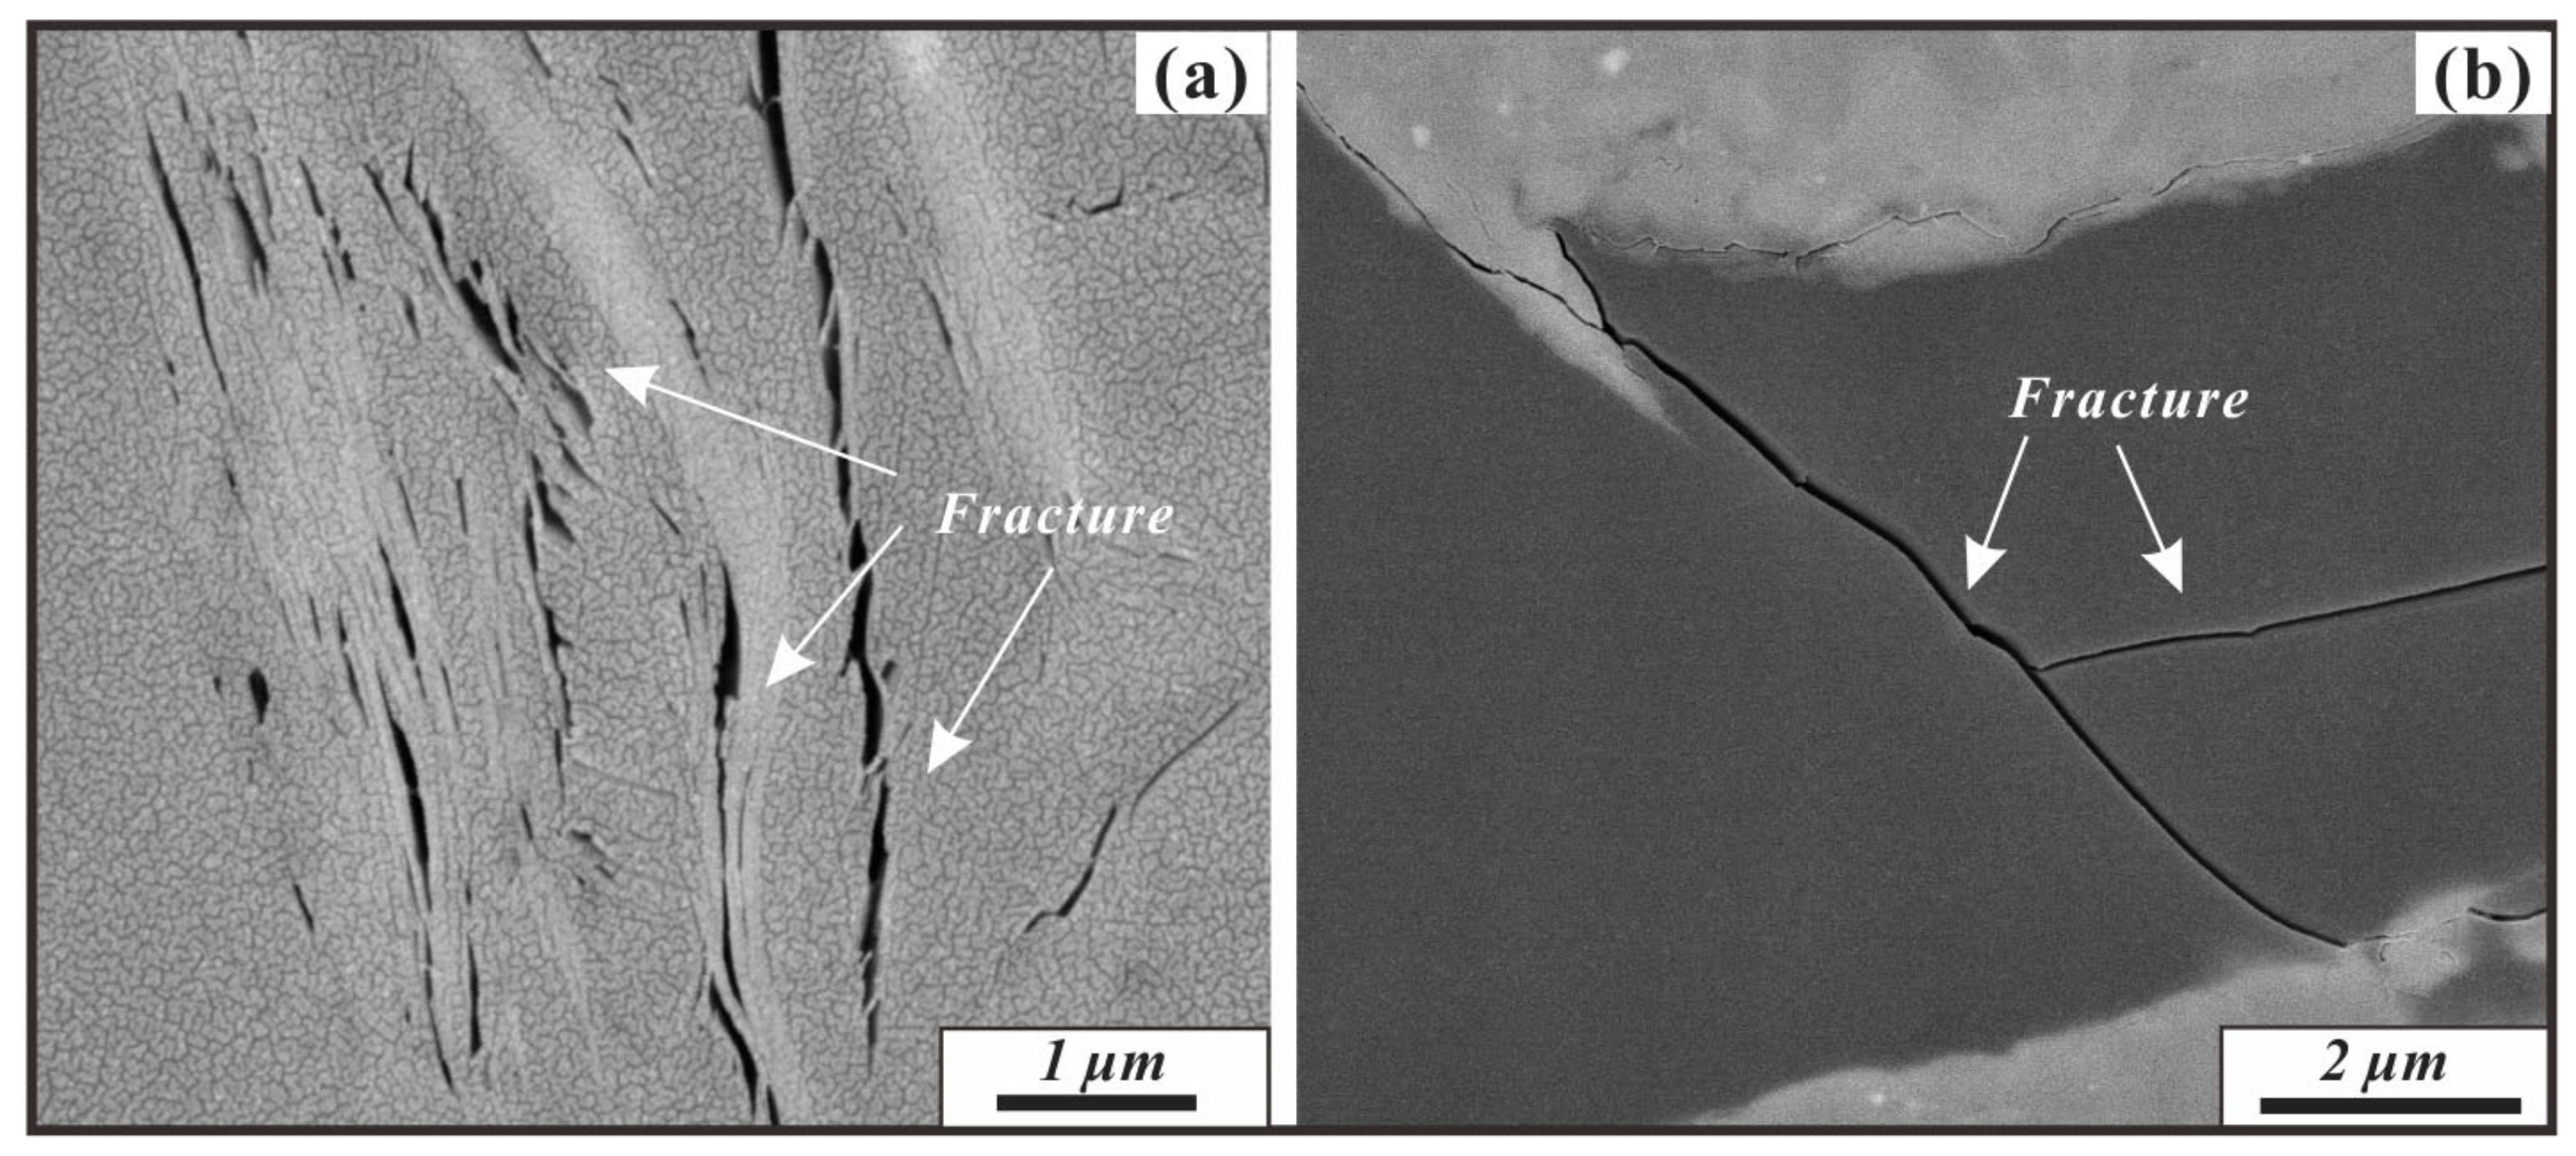
As shown in Figure 11, the fractal dimension correlated positively with the BET SA and total pore volume, with correlation coefficients of 0.3724 and 0.5357, respectively (Figure 11a,b), which indicated that marine shale with higher fractal dimensions may have larger BET SA and higher total pore volume. The fractal dimension showed a negative correlation with the APS (Figure 11a), suggesting that shales with complicated pore structures have relatively small APS. Moreover, the fractal dimension exhibited a positive correlation with the micropore surface area and micropore volume (Figure 11c), suggesting that marine shale with higher fractal dimension tend to possess a greater micropore SA and micropore volume. This finding also indicated an irregular and complicated micropore structure in marine shale, while the fractal dimension had no apparent relationship with the mesopore surface area and mesopore volume (Figure 11c), suggesting that the development of micro-fractures of clay minerals (Figure 12a) and organic matter (Figure 12b) might affect or lead to this relationship. In contrast, Figure 11e exhibits a significant negative relationship between the fractal dimension and macropore SA and macropore volume, suggesting that the increase of macropores led to the decrease of heterogeneity of shale. Therefore, the combination of micro-fractures with different dimensions and nanopores with different shapes and sizes led to a complicated pore–fracture system.
6. Conclusions
Fractal characteristics and heterogeneity of the nanopore structure of marine shale in southern North China were studied using multiple analysis and testing methods. Compared with continental shale, the marine shale possessed a larger number of SA and PV, with an N2 adsorption amount of 7.752–13.138 m2/g and 14.341–19.508 cm3/g, respectively. The PSD curves of marine shale mainly appeared unimodal, with a major peak corresponding to the pore size ranging from 1.4 nm to 1.6 nm in the microporous range, which is different from what observed for continental shales that possess a wide pore-size interval and pores that are primarily larger than 10 nm. The TOC content showed a negative relationship with the clay content and positively correlated with the quartz content, indicating that different sedimentary facies may control the precipitation of clay and quartz between transitional shale and marine shale, leading to different OM–clay relationships and different correlations between TOC content and mineral content. The shale with high TOC content tended to have more heterogeneous and complex micropores, leading to a higher fractal dimension and more complex nanopore system. With the increase of TOC content and thermal evolution of OM, the heterogeneity of the pore structure became more significant. The quartz from marine facies develops more macropores, resulting in a decrease of the BET SA and an increase of the APS, while clay minerals have abundant micropores and work together with OM to affect the nanopore system of shale, leading to an increase of the BET SA and a decrease of the APS. The spatial order of interlayer pores increased with the increase of MLIS content, which naturally reduced the fractal dimension. In contrast, kaolinite, chlorite, and illite have few pores and are more likely to inhibit pore development in the pore system, significantly increasing the complexity and heterogeneity of the pore–fracture system by mean of pore-blocking. Taiyuan shale with higher heterogeneity is highly fractal, and the fractal dimensions are principally related to micropores. The fractal dimension correlates positively with the BET SA and total pore volume, suggesting that marine shale with higher fractal dimensions may have larger BET SA and higher total pore volume. The combination of micro-fractures with different dimensions and nanopores with different shapes and sizes leads to a complicated pore–fracture system in marine shale.
Author Contributions
K.Y. and Y.J. designed the study and modified the manuscript; K.Y., Y.Q., P.Q. and C.H. contributed to the analysis, data interpretation, diagrams and manuscript preparation; K.Y., H.Z. and H.F. collected and prepared the shale samples; P.Q, Y.J. and K.Y. designed the experiments.
Funding
This research was financially supported by the National Natural Science Foundation of China (Grant Nos. 41530315, 41872160, 41372213), the “Climate Change: Carbon Budget and Related Issues” Strategic Priority Research Program of the Chinese Academy of Sciences (Grant No. XDA05030100), the National Science and Technology Major Project of China (Grant Nos. 2016ZX05066, 2017ZX05064), and Science and Technology Support Program of Sichuan Province, China (Grant No. 2016JZ0037).
Acknowledgments
Our deepest gratitude goes to the anonymous reviewers for their careful work and thoughtful suggestions that have helped improve this paper substantially.
Conflicts of Interest
The authors declare no conflict of interest.
References
- Curtis, J.B. Fractured shale-gas systems. AAPG Bull. 2002, 86, 1921–1938. [Google Scholar]
- Chen, S.; Zhu, Y.; Wang, H.; Liu, H.; Wei, W.; Fang, J. Shale gas reservoir characterization: A typical case in the southern Sichuan basin of China. Energy 2011, 36, 6609–6616. [Google Scholar] [CrossRef]
- Gasparik, M.; Bertier, P.; Gensterblum, Y.; Ghanizadeh, A.; Krooss, B.M.; Littke, R. Geological controls on the methane storage capacity in organic-rich shales. Int. J. Coal Geol. 2014, 123, 34–51. [Google Scholar] [CrossRef]
- Clarkson, C.R.; Bustin, R.M. The effect of pore structure and gas pressure upon the transport properties of coal: A laboratory and modeling study. 2. adsorption rate modeling. Fuel 1999, 78, 1345–1362. [Google Scholar] [CrossRef]
- Clarkson, C.R.; Bustin, R.M. Binary gas adsorption/desorption isotherms: Effect of moisture and coal composition upon carbon dioxide selectivity over methane. Int. J. Coal Geol. 2000, 42, 241–271. [Google Scholar] [CrossRef]
- Bustin, R.M.; Bustin, A.M.M.; Cui, A.; Ross, D.; Pathi, V.M. Impact of shale properties on pore structure and storage characteristics. In Proceedings of the SPE Paper 119892 Society of Petroleum Engineers Shale Gas Production Conference, Fort Worth, TX, USA, 16–18 November 2008. [Google Scholar]
- Ross, D.J.K.; Bustin, R.M. Characterizing the shale gas resource potential of Devonian–Mississippian strata in the Western Canada Sedimentary Basin: Application of an integrated formation evaluation. AAPG Bull. 2008, 92, 87–125. [Google Scholar] [CrossRef]
- Loucks, R.G.; Reed, R.M.; Ruppel, S.C.; Hammes, U. Spectrum of pore types and networks in mudrocks and a descriptive classification for matrixerelatedmudrock pores. AAPG Bull. 2012, 96, 1071–1098. [Google Scholar] [CrossRef]
- Loucks, R.G.; Reed, R.M.; Ruppel, S.C.; Jarvie, D.M. Morphology, genesis, and distribution of nanometerescale pores in siliceous mudstones of the Mississippian Barnett Shale. J. Sediment. Res. 2009, 79, 848–861. [Google Scholar] [CrossRef]
- Lapierre, C.; Leroueil, S.; Locat, J. Mercury intrusion and permeability of louiseville clay. Can. Geotech. J. 1990, 27, 761–773. [Google Scholar] [CrossRef]
- Yao, Y.; Liu, D. Comparison of low-field NMR and mercury intrusion porosimetry in characterizing pore size distributions of coals. Fuel 2012, 95, 152–158. [Google Scholar] [CrossRef]
- Branch, A. Methane and CO2, sorption and desorption measurements on dry argonnepremium coals: Pure components and mixtures. Int. J. Coal Geol. 2003, 55, 205–224. [Google Scholar]
- Chalmers, G.R.; Bustin, R.M.; Power, I.M. Characterization of gas shale pore systems by porosimetry, pycnometry, surface area, and field emission scanning electron microscopy/transmission electron microscopy image analyses: Examples from the Barnett, Woodford, Haynesville, Marcellus, and Doig units. AAPG Bull. 2012, 96, 1099–1119. [Google Scholar]
- Wang, G.; Ju, Y.; Yan, Z.; Li, Q. Pore structure characteristics of coal-bearing shale using fluid invasion methods: A case study in the Huainan-Huaibei coalfield in China. Mar. Pet. Geol. 2015, 62, 1–13. [Google Scholar] [CrossRef]
- Zhu, H.; Ju, Y.; Qi, Y.; Huang, C.; Zhang, L. Impact of tectonism on pore type and pore structure evolution in organic-rich shale: Implications for gas storage and migration pathways in naturally deformed rocks. Fuel 2018, 228, 272–289. [Google Scholar] [CrossRef]
- Lyu, Q.; Long Xi Ranjith, P.G.; Tan, J.; Kang, Y.; Wang, Z. Experimental investigation on the mechanical properties of a low-clay shale with different adsorption times in sub-/super-critical CO2. Energy 2018, 147, 1288–1298. [Google Scholar] [CrossRef]
- Clarkson, C.R.; Freeman, M.; He, L.; Agamalian, M.; Melnichenko, Y.B.; Mastalerz, M.; Bustin, R.M.; Radlinski, A.P.; Blach, T.P. Characterization of tight gas reservoir pore structure using USANS/SANS and gas adsorption analysis. Fuel 2012, 95, 371–385. [Google Scholar] [CrossRef]
- Ross, D.J.K.; Bustin, R.M. The importance of shale composition and pore structure upon gas storage potential of shale gas reservoirs. Mar. Pet. Geol. 2009, 26, 916–927. [Google Scholar] [CrossRef]
- Milliken, K.L.; Rudnicki, M.; Awwiller, D.N.; Zhang, T. Organic matter–hosted pore system, Marcellus formation (Devonian), Pennsylvania. AAPG Bull. 2013, 97, 177–200. [Google Scholar] [CrossRef]
- Ge, X.M.; Fan, Y.R.; Li, J.T.; Zahid, M.A. Pore structure characterization and classification using multifractal theory- an application in tight reservoir of Santanghu basin in Western China. J. Pet. Sci. Eng. 2015, 127, 297–304. [Google Scholar] [CrossRef]
- Pan, J.; Peng, C.; Wan, X.; Zheng, D.; Lv, R.; Wang, K. Pore structure characteristics of coal-bearing organic shale in Yuzhou coalfield, China using low pressure N2 adsorption and FE-SEM methods. J. Pet. Sci. Eng. 2017, 153, 234–243. [Google Scholar] [CrossRef]
- Ju, Y.; Huang, C.; Sun, Y.; Wan, Q.; Lu, X.; Lu, S.; He, H.; Wang, X.; Zou, C.; Wu, J.; et al. Nanogeosciences: Research History, Current Status, and Development Trends. J. Nanosci. Nanotechnol. 2017, 17, 5930–5965. [Google Scholar] [CrossRef]
- Schlueter, E.M.; Zimmerman, R.W.; Witherspoon, P.A.; Cook, N.G.W. The fractal dimension of pores in sedimentary rocks and its influence on permeability. Eng. Geol. 1997, 48, 199–215. [Google Scholar] [CrossRef]
- Qi, Y.; Ju, Y.; Huang, C.; Zhu, H.; Bao, Y.; Wu, J.; Meng, S.; Chen, W. Influences of organic matter and kaolinite on pore structures of transitional organic-rich mudstone with an emphasis on S2 controlling specific surface area. Fuel 2019, 237, 860–873. [Google Scholar] [CrossRef]
- Pérez Bernal, J.L.; Bello, M.A. Fractal geometry and mercury porosimetry: Comparison and application of proposed models on building stones. Appl. Surf. Sci. 2001, 185, 99–107. [Google Scholar] [CrossRef]
- Watt-Smith, M.J.; Edler, K.J.; Rigby, S.P. An experimental study of gas adsorption on fractal surfaces. Langmuir 2005, 21, 2281–2292. [Google Scholar] [CrossRef]
- Ahmad, A.L.; Idrus, N.F.; AbdShukor, S.R. Surface fractal dimension of Perovskite-doped alumina membrane: Influence of calcining temperature. J. Am. Ceram. Soc. 2006, 89, 1694–1698. [Google Scholar] [CrossRef]
- Khalili, N.R.; Pan, M.; Sandí, G. Determination of fractal dimensions of solid carbons from gas and liquid phase adsorption isotherms. Carbon 2000, 38, 573–588. [Google Scholar] [CrossRef]
- Fu, X.; Qin, Y.; Zhang, W.; Wei, Z.; Zhou, R. Pore fractal classification and natural classification based on the coal bed methane migration. Chin. Sci. Bull. 2005, 50, 51–55. [Google Scholar] [CrossRef]
- Zhang, S.; Tang, S.; Tang, D.; Huang, W.; Pan, Z. Determining fractal dimensions of coal pores by FHH model: Problems and effects. J. Nat. Gas Sci. Eng. 2014, 21, 929–939. [Google Scholar] [CrossRef]
- Bu, H.; Ju, Y.; Tan, J.; Wang, G.; Li, X. Fractal characteristics of pores in non-marine shales from the Huainan coalfield, eastern China. J. Nat. Gas Sci. Eng. 2015, 24, 166–177. [Google Scholar] [CrossRef]
- Yang, R.; He, S.; Yi, J.; Hu, Q. Nano-scale pore structure and fractal dimension of organic-rich Wufeng-Longmaxi shale from Jiaoshiba area, Sichuan Basin: Investigations using FE-SEM, gas adsorption and helium pycnometry. Mar. Pet. Geol. 2016, 70, 27–45. [Google Scholar] [CrossRef]
- Liu, J.; Yao, Y.; Liu, D.; Cai, Y.; Cai, J. Comparison of pore fractal characteristics between marine and continental shales. Fractals 2018, 26, 1840016. [Google Scholar] [CrossRef]
- Yu, K.; Shao, C.; Ju, Y.; Qu, Z. The genesis and controlling factors of micropore volume in transitional coal-bearing shale reservoirs under different sedimentary environments. Mar. Pet. Geol. 2019, 102, 426–438. [Google Scholar] [CrossRef]
- Yu, K.; Ju, Y.; Qian, J.; Qu, Z.; Shao, C.; Yu, K.; Shi, Y. Burial and thermal evolution of coal-bearing strata and its mechanisms in the southern North China Basin since the late Paleozoic. Int. J. Coal Geol. 20198, 198, 110–115. [Google Scholar] [CrossRef]
- Zaslow, J.; Orloff, T. Zircon U–Pb age and Lu–Hf isotope constraints on Precambrian evolution of continental crust in the Songshan area, the south-central North China Craton. Precambrian Res. 2013, 226, 1–20. [Google Scholar]
- Ju, Y.; Sun, Y.; Tan, J.; Bu, H.; Han, K.; Li, X. The composition, pore structure characterization and deformation mechanism of coal-bearing shales from tectonically altered coalfields in eastern China. Fuel 2018, 234, 626–642. [Google Scholar] [CrossRef]
- Determination of Carbon and Hydrogen in Coal; General Administration of Quality Supervision; Inspection and Quarantine of China: Beijing, China, 2008; No. GB/T4762008.
- Method of Determining Microscopically the Reflectance of Vitrinite in Sedimentary; National Energy Administration: Beijing, China, 1995; No. SY/T5124-1995.
- Analysis Method for Clay Minerals and Ordinary Ono-Clay Minerals in Sedimentary Rocks by the X-ray Diffraction; National Energy Administration: Beijing, China, 2010; No. SY/T5163-2010.
- Gregg, S.J.; Sing, K.S.W. Adsorption, Surface Area and Porosity, 2nd ed.; Academic Press: London, UK, 1982. [Google Scholar]
- Lastoskie, C.; Gubbins, K.E.; Quirke, N. Pore size distribution analysis of microporous carbons: A density functional theory approach. J. Phys. Chem. 1993, 97, 1012–1016. [Google Scholar] [CrossRef]
- Seaton, N.A.; Walton JP, R.B.; Quirke, N. A new analysis method for the determination of the pore size distribution of porous carbons from nitrogen adsorption measurements. Carbon 1989, 27, 853–861. [Google Scholar] [CrossRef]
- Rouquerol, J.; Avnir, D.; Fairbridge, C.W.; Everett, D.H.; Haynes, J.M.; Pernicone, N.; Ramsay, J.D.F.; Sing, K.S.W.; Unger, K.K. Recommendations for the characterization of porous solids. Int. Union Pure Appl. Chem. 1994, 66, 1739–1758. [Google Scholar] [CrossRef]
- Mandelbrot, B.B. The Fractal Geometry of Nature; Freeman: New York, NY, USA, 1983. [Google Scholar]
- Mahamud, M.M.; Novo, M.F. The use of fractal analysis in the textural characterization of coals. Fuel 2008, 87, 222–231. [Google Scholar] [CrossRef]
- Jaroniec, M. Evaluation of the fractal dimension from a single adsorption isotherm. Langmuir 1995, 11, 2316–2317. [Google Scholar] [CrossRef]
- Dong, T.; Harris, N.B.; Ayranci, K.; Twemlow, C.E.; Nassichuk, B.R. Porosity characteristics of the Devonian Horn River shale, Canada: Insights from lithofacies classification and shale composition. Int. J. Coal Geol. 2015, 141, 74–90. [Google Scholar] [CrossRef]
- Tian, H.; Pan, L.; Xiao, X.; Wilkins RW, T.; Meng, Z.; Huang, B. A preliminary study on the pore characterization of lower Silurian black shales in the Chuandong thrust fold belt, southwestern China using low pressure N2 adsorption and FE-SEM methods. Mar. Pet. Geol. 2013, 48, 8–19. [Google Scholar] [CrossRef]
- Liang, C.; Jiang, Z.; Zhang, C.; Guo, L.; Yang, Y.; Li, J. The shale characteristics and shale gas exploration prospects of the lower Silurian Longmaxi shale, Sichuan basin, south China. J. Nat. Gas Sci. Eng. 2014, 21, 636–648. [Google Scholar] [CrossRef]
- Xi, Z.; Tang, S.; Wang, J.; Yi, J.; Guo, Y.; Wang, K. Pore structure and fractal characteristics of Niutitang shale from China. Minerals 2018, 8, 163. [Google Scholar] [CrossRef]
- Yang, F.; Ning, Z.; Liu, H. Fractal characteristics of shales from a shale gas reservoir in the Sichuan basin, China. Fuel 2014, 115, 378–384. [Google Scholar] [CrossRef]
- Liang, Q.; Zhang, X.; Tian, J.; Sun, X.; Chang, H. Geological and geochemical characteristics of marine-continental transitional shale from the Lower Permian Taiyuan Formation, Taikang Uplift, southern North China Basin. Mar. Pet. Geol. 2018, 98, 229–242. [Google Scholar] [CrossRef]
- Wang, P.; Jiang, Z.; Ji, W.; Zhang, C.; Yuan, Y.; Chen, L. Heterogeneity of intergranular, intraparticle and organic pores in Longmaxi shale in Sichuan basin, south China: Evidence from SEM digital images and fractal and multifractal geometries. Mar. Pet. Geol. 2016, 72, 122–138. [Google Scholar] [CrossRef]
- Chen, S.; Han, Y.; Fu, C.; Zhang, H.; Zhu, Y.; Zuo, Z. Micro and nano-size pores of clay minerals in shale reservoirs: Implication for the accumulation of shale gas. Sediment. Geol. 2016, 342, 180–190. [Google Scholar] [CrossRef]
- Malekani, K. Comparison of techniques for determining the fractal dimensions of clay minerals. Clays Clay Miner. 1996, 44, 677–685. [Google Scholar] [CrossRef]
- Yao, Y.; Liu, D.; Tang, D.; Tang, S.; Huang, W. Fractal characterization of adsorption-pores of coals from North China: An investigation on CH4 adsorption capacity of coals. Int. J. Coal Geol. 2008, 73, 27–42. [Google Scholar] [CrossRef]
Figure 1.
Tectonic map of North China (a) [35], sampling well location, detailed structural subdivisions of folds and faults (b) [37], and general lithostratigraphic column of the Taiyuan Formation and sampling position of ZK1 well (c) [34].

Figure 2.
Low-pressure N2 adsorption–desorption isotherms of the shale samples from Taiyuan Formation.
Figure 2.
Low-pressure N2 adsorption–desorption isotherms of the shale samples from Taiyuan Formation.


Figure 3.
Pore volume (a) and pore surface area (b) distribution vs pore width.

Figure 4.
Fractal dimension results calculated from N2 adsorption isotherms (a) and variation trend of fractal dimensions (b).
Figure 4.
Fractal dimension results calculated from N2 adsorption isotherms (a) and variation trend of fractal dimensions (b).

Figure 5.
Plots of TOC content versus clay content (a) and quartz content (b) in the Taiyuan marine shale. The data were obtained from the ZK1 well and from Liang et al. (2018) [53].
Figure 5.
Plots of TOC content versus clay content (a) and quartz content (b) in the Taiyuan marine shale. The data were obtained from the ZK1 well and from Liang et al. (2018) [53].

Figure 6.
Relationships between SA and PV ((a), micropore; (b), mesopore; (c), macropore), relationship between micropore SA and BET SA (d), relationship between mesopore volume and total pore volume (e), and relationship between APS and SA (f).
Figure 6.
Relationships between SA and PV ((a), micropore; (b), mesopore; (c), macropore), relationship between micropore SA and BET SA (d), relationship between mesopore volume and total pore volume (e), and relationship between APS and SA (f).

Figure 7.
Plots of shale compositions versus nanopore structure parameters in the studied shale. (a) BET SA and APS versus TOC content, (b) PV versus TOC content, (c) PV versus Ro, (d) BET SA versus clay and quartz content, (e) APS versus clay and quartz content, (f) PV versus clay and quartz content, (g) micropore volume and macropore volume versus illite content, (h) micropore volume and macropore volume versus Chlorite content.


Figure 8.
SEM images of illite-associated micro-intergranular pores (a) and slit pores among schistose layers of acicular chlorite (b).
Figure 8.
SEM images of illite-associated micro-intergranular pores (a) and slit pores among schistose layers of acicular chlorite (b).

Figure 9.
Relationships between shale component and fractal dimensions: (a) clay and quartz contents versus D1, (b) clay and quartz contents versus D2, (c) MLIS and illite contents versus D1, (d) kaolinite and chlorite contents versus D1.
Figure 9.
Relationships between shale component and fractal dimensions: (a) clay and quartz contents versus D1, (b) clay and quartz contents versus D2, (c) MLIS and illite contents versus D1, (d) kaolinite and chlorite contents versus D1.

Figure 10.
SEM images of quartz and clay minerals in marine Taiyuan shale samples: (a) quartz has fewer pores with a smooth surface, (b) irregular surfaces and a larger number of pores in clay minerals can be observed.
Figure 10.
SEM images of quartz and clay minerals in marine Taiyuan shale samples: (a) quartz has fewer pores with a smooth surface, (b) irregular surfaces and a larger number of pores in clay minerals can be observed.

Figure 11.
Plots of fractal dimensions versus nanopore structure parameters for the studied shale samples. (a) BET SA and APS versus D1, (b) PV versus D1, (c) micropore surface and volume versus D1, (d) mesopore surface and volume versus D1, (e) macropore surface and volume versus D1.
Figure 11.
Plots of fractal dimensions versus nanopore structure parameters for the studied shale samples. (a) BET SA and APS versus D1, (b) PV versus D1, (c) micropore surface and volume versus D1, (d) mesopore surface and volume versus D1, (e) macropore surface and volume versus D1.

Figure 12.
SEM images of micro-fractures in clay minerals (a) and organic matter (b) of the marine Taiyuan shale.
Figure 12.
SEM images of micro-fractures in clay minerals (a) and organic matter (b) of the marine Taiyuan shale.


Table 1.
Partial geological parameters of the Taiyuan marine shale samples. TOC: total organic content.
Table 1.
Partial geological parameters of the Taiyuan marine shale samples. TOC: total organic content.
| Sample | Depth (m) | TOC (%) | Ro (%) | Kerogen Type |
|---|---|---|---|---|
| TY8 | 1013.1 | 2.18 | 0.71 | III |
| TY7 | 1023.3 | 1.56 | 0.65 | III |
| TY6 | 1034.5 | 1.91 | 1.94 | III |
| TY5 | 1045.7 | 3.38 | 1.66 | III |
| TY4 | 1076.5 | 2.40 | 1.7 | III |
| TY3 | 1083.2 | 2.32 | 1.08 | III |
| TY2 | 1107.3 | 2.78 | 1.61 | III |
| TY1 | 1113.7 | 1.24 | 1.31 | III |
Table 2.
Mineral compositions determined by XRD of the Taiyuan marine shale samples. The mineral contents are expressed in weight percentage (wt %). MLIS: mixed-layer illite–smectite.
Table 2.
Mineral compositions determined by XRD of the Taiyuan marine shale samples. The mineral contents are expressed in weight percentage (wt %). MLIS: mixed-layer illite–smectite.
| Sample | Quartz | K-Feldspar | Plagioclase | Calcite | Dolomite | Siderite | Pyrite | Clay | MLIS | Illite | Kaolinite | Chlorite |
|---|---|---|---|---|---|---|---|---|---|---|---|---|
| TY8 | 39.3 | 1.1 | 3.5 | 0 | 0 | 8.2 | 1.5 | 45.5 | 31.7 | 4.4 | 8.9 | 2.5 |
| TY7 | 41.7 | 4.4 | 3.8 | 0 | 0 | 3.3 | 2.1 | 44.7 | 32.5 | 3.0 | 9.1 | 2.4 |
| TY6 | 40.6 | 1.6 | 3.2 | 0 | 0 | 7.5 | 1.5 | 45.6 | 28.5 | 3.8 | 8.6 | 2.3 |
| TY5 | 49 | 0 | 0 | 0 | 0 | 0 | 8.6 | 42.4 | 33.9 | 4.7 | 3.0 | 0.8 |
| TY4 | 31.9 | 0.9 | 1.1 | 0 | 0 | 4.5 | 4.1 | 57.5 | 20.7 | 7.5 | 24.7 | 4.6 |
| TY2 | 37.1 | 1.6 | 0 | 0 | 0 | 8.6 | 1 | 51.7 | 21.7 | 7.8 | 18.1 | 4.1 |
| TY2 | 41.1 | 1.2 | 3.7 | 0 | 1.3 | 0 | 7.4 | 45.3 | 34.4 | 2.3 | 6.8 | 1.8 |
| TY1 | 36.7 | 0 | 0 | 3.7 | 2.9 | 0 | 7.2 | 49.5 | 30.2 | 6.4 | 9.9 | 3.0 |
Table 3.
Pore structure parameters of the shale samples from N2 adsorption isotherms. SA: Brunauere–Emmette–Teller (BET) surface area; APS: average pore size; PV: total pore volume; V1: micropore volume; V2: mesopore volume; V3: macropore volume.
Table 3.
Pore structure parameters of the shale samples from N2 adsorption isotherms. SA: Brunauere–Emmette–Teller (BET) surface area; APS: average pore size; PV: total pore volume; V1: micropore volume; V2: mesopore volume; V3: macropore volume.
| Sample | SA (m2/g) | APS (nm) | PV (10−3 cm3/g) | V1 (10−3 cm3/g) | V2 (10−3 cm3/g) | V3 (10−3 cm3/g) |
|---|---|---|---|---|---|---|
| TY1 | 13.138 | 6.754 | 19.508 | 1.551 | 16.681 | 1.276 |
| TY2 | 9.891 | 9.012 | 18.994 | 0.539 | 16.592 | 1.863 |
| TY3 | 11.086 | 6.696 | 16.225 | 1.344 | 13.461 | 1.420 |
| TY4 | 10.331 | 7.239 | 15.638 | 0.883 | 13.193 | 1.562 |
| TY5 | 7.752 | 11.014 | 18.166 | 0.161 | 16.017 | 1.988 |
| TY6 | 10.390 | 7.372 | 16.723 | 1.212 | 14.271 | 1.512 |
| TY7 | 9.728 | 7.883 | 15.901 | 1.266 | 12.972 | 1.609 |
| TY8 | 8.263 | 8.497 | 14.298 | 0.952 | 11.806 | 1.603 |
Table 4.
Fractal dimensions of marine shale samples calculated from the Frenkele–Halseye–Hill (FHH) model. R2: correlation coefficient.
Table 4.
Fractal dimensions of marine shale samples calculated from the Frenkele–Halseye–Hill (FHH) model. R2: correlation coefficient.
| Sample | Equation (1) | R2 | K1 | D1 | Equation (2) | R2 | K2 | D2 |
|---|---|---|---|---|---|---|---|---|
| TY1 | y = −0.2941x + 1.5134 | 0.9999 | −0.2941 | 2.7059 | y = −0.4119x + 1.5149 | 0.9987 | −0.4119 | 2.5881 |
| TY2 | y = −0.3436x + 1.2421 | 0.9999 | −0.3436 | 2.6564 | y = −0.4793x + 1.2333 | 0.9996 | −0.4793 | 2.5207 |
| TY3 | y = −0.2781x + 1.3496 | 0.9999 | −0.2781 | 2.7219 | y = −0.4107x + 1.3456 | 0.9981 | −0.4107 | 2.5893 |
| TY4 | y = −0.2769x + 1.2954 | 0.9987 | −0.2769 | 2.7231 | y = −0.4552x + 1.2775 | 0.9988 | −0.4552 | 2.5448 |
| TY5 | y = −0.3788x + 1.0028 | 0.9998 | −0.3788 | 2.6212 | y = −0.5175x + 0.9936 | 0.9998 | −0.5175 | 2.4825 |
| TY6 | y = −0.2968x + 1.2963 | 0.9999 | −0.2968 | 2.7032 | y = −0.4124x + 1.2883 | 0.9995 | −0.4124 | 2.5876 |
| TY7 | y = −0.2935x + 1.2129 | 0.9998 | −0.2935 | 2.7065 | y = −0.3958x + 1.2069 | 0.9995 | −0.3958 | 2.6042 |
| TY8 | y = −0.3095x + 1.0558 | 0.9998 | −0.3095 | 2.6905 | y = −0.4111x + 1.0416 | 0.9999 | −0.4111 | 2.5889 |
© 2019 by the authors. Licensee MDPI, Basel, Switzerland. This article is an open access article distributed under the terms and conditions of the Creative Commons Attribution (CC BY) license (http://creativecommons.org/licenses/by/4.0/).
Share and Cite
MDPI and ACS Style
Yu, K.; Ju, Y.; Qi, Y.; Qiao, P.; Huang, C.; Zhu, H.; Feng, H. Fractal Characteristics and Heterogeneity of the Nanopore Structure of Marine Shale in Southern North China. Minerals 2019, 9, 242. https://doi.org/10.3390/min9040242
AMA Style
Yu K, Ju Y, Qi Y, Qiao P, Huang C, Zhu H, Feng H. Fractal Characteristics and Heterogeneity of the Nanopore Structure of Marine Shale in Southern North China. Minerals. 2019; 9(4):242. https://doi.org/10.3390/min9040242
Chicago/Turabian StyleYu, Kun, Yiwen Ju, Yu Qi, Peng Qiao, Cheng Huang, Hongjian Zhu, and Hongye Feng. 2019. "Fractal Characteristics and Heterogeneity of the Nanopore Structure of Marine Shale in Southern North China" Minerals 9, no. 4: 242. https://doi.org/10.3390/min9040242
Note that from the first issue of 2016, this journal uses article numbers instead of page numbers. See further details here.