Mathematical Modelling of Fault Reactivation Induced by Water Injection


1
Canadian Nuclear Safety Commission (CNSC), Ottawa, ON K1P 5S9, Canada
2
Lawrence Berkeley National Laboratory (LBNL), Berkeley, CA 94720, USA
3
Swiss Federal Nuclear Safety Inspectorate (ENSI), 5200 Brugg, Switzerland
*
Author to whom correspondence should be addressed.
Minerals 2019, 9(5), 282; https://doi.org/10.3390/min9050282
Submission received: 4 April 2019
/
Revised: 3 May 2019
/
Accepted: 5 May 2019
/
Published: 8 May 2019
(This article belongs to the Special Issue Nuclear Waste Disposal)
Abstract
:Faults in the host rock that might exist in the vicinity of deep geological repositories for radioactive waste, constitute potential enhanced pathways for radionuclide migration. Several processes might trigger pore pressure increases in the faults leading to fault failure and induced seismicity, and increase the faults’ permeability. In this research, we developed a mathematical model to simulate fault activation during an experiment of controlled water injection in a fault at the Mont-Terri Underground Research Laboratory in Switzerland. The effects of in-situ stress, fault shear strength parameters and heterogeneity are assessed. It was shown that the above factors are critical and need to be adequately characterized in order to predict the faults’ hydro-mechanical behaviour.
1. Introduction
Subsurface fluid injection is an operational practice associated with many industrial activities, such as; (i) disposal of wastewater by injection into deep formations; (ii) injection of water or CO2 into depleted reservoirs for enhanced oil recovery; (iii) hydraulic fracturing (fracking) to enable production of oil and gas from low-permeability reservoirs; (iv) injection of supercritical CO2 into deep formations for permanent carbon capture and storage; and (v) injection into geothermal reservoirs to replenish water lost to steam production or to develop enhanced geothermal systems. In addition to the potential for the injected fluid to migrate and contaminate existing groundwater resources, there seems to be a correlation between fluid injection and increased seismicity in and around the areas where the fluid is injected. As an example, it was reported [1] that some large areas of the United States that in the past were considered geologically stable have recently become seismically active. In Oklahoma, the rate of occurrence of events with magnitudes (M) larger than 3, with some larger than 5, has become greater than in California. Factors such as the rate, duration, pressure and aerial extent of the injection as well as the geological setting contribute to the potential of fault reactivation around the injection area leading to increased seismicity [2].
Another area of activity where mechanical and fluid transport processes in faults need to be assessed is the geological disposal of high-level waste (HLW). Geological disposal of HLW being implemented and considered in a number of countries [3,4,5] relies on a system of multiple engineered and natural barriers to contain and isolate the waste for hundreds of thousands to millions of years in the future. The natural barriers are the host rock formations. Faults that might exist in the vicinity of a deep geological repository (DGR) for HLW, are potentially enhanced pathways for radionuclide migration. Their hydro-mechanical characteristics need to be understood, and be taken into account in the safety assessment and design of the DGR. In the very long time frame associated with the DGR, several processes can trigger a pore pressure increase in the fault, such as the heat generated from the waste and glacial meltwater recharge after a future glaciation cycle. The excess pore pressure generated from the above processes can potentially augment the risk of fault reactivation and induced seismicity, and also increase the fault permeability.
The response of rock formations and the faults to pore fluid pressure variations are governed by the classical laws of poromechanics. When pore fluid pressure increases, the normal effective stress across the fault decreases, leading to a loss of shear resistance according to Coulomb’s law. The fault is then reactivated, potentially triggering earthquakes. Fault re-activation can either trigger seismic events (seismic situation) or not (aseismic situation), depending on such factors as the “seismic efficiency” [6], i.e. the fraction of energy stored in the fault released as seismic waves, and the friction properties of the fault [7,8,9,10,11,12] Mathematical modelling of induced seismicity has been proposed [13] based on the basic theory of poromechanics and the consideration of Coulomb’s friction as the threshold for fault failure. Although the above theoretical framework is well established, its application to the prediction of fault behaviour is a complex endeavour, and is the subject of many current research activities [14,15]. The structure of the fault, the initial stress field and the permeability evolution of the fault with the changing stress-field and the loss of shear resistance are complex and not easily characterized. Therefore, the risk assessment for fault reactivation is not an easy task and necessitates a thorough characterization of the fault structure, its hydro-mechanical properties and the determination of the initial in-situ stress field. In order to better understand the complex relationship between the above factors, controlled induced fault slip in-situ experiments were performed [16,17,18,19]. In this paper, we focus on an experiment performed in a natural fault in Opalinus Clay, at the Mont-Terri Underground Research Laboratory (URL), Switzerland. The objectives of the experiment are to further understand the conditions for fault reactivation and to evaluate the relationship between the conditions for fault movement, the magnitude of the pore pressure changes, and the permeability of the fault. Seismicity induced by fault reactivation will be the subject of future research. In this paper, we provide a summary description of the geological setting, the experimental setup and discuss the development of a mathematical model to interpret the experiment.
2. Geological and Experimental Setting
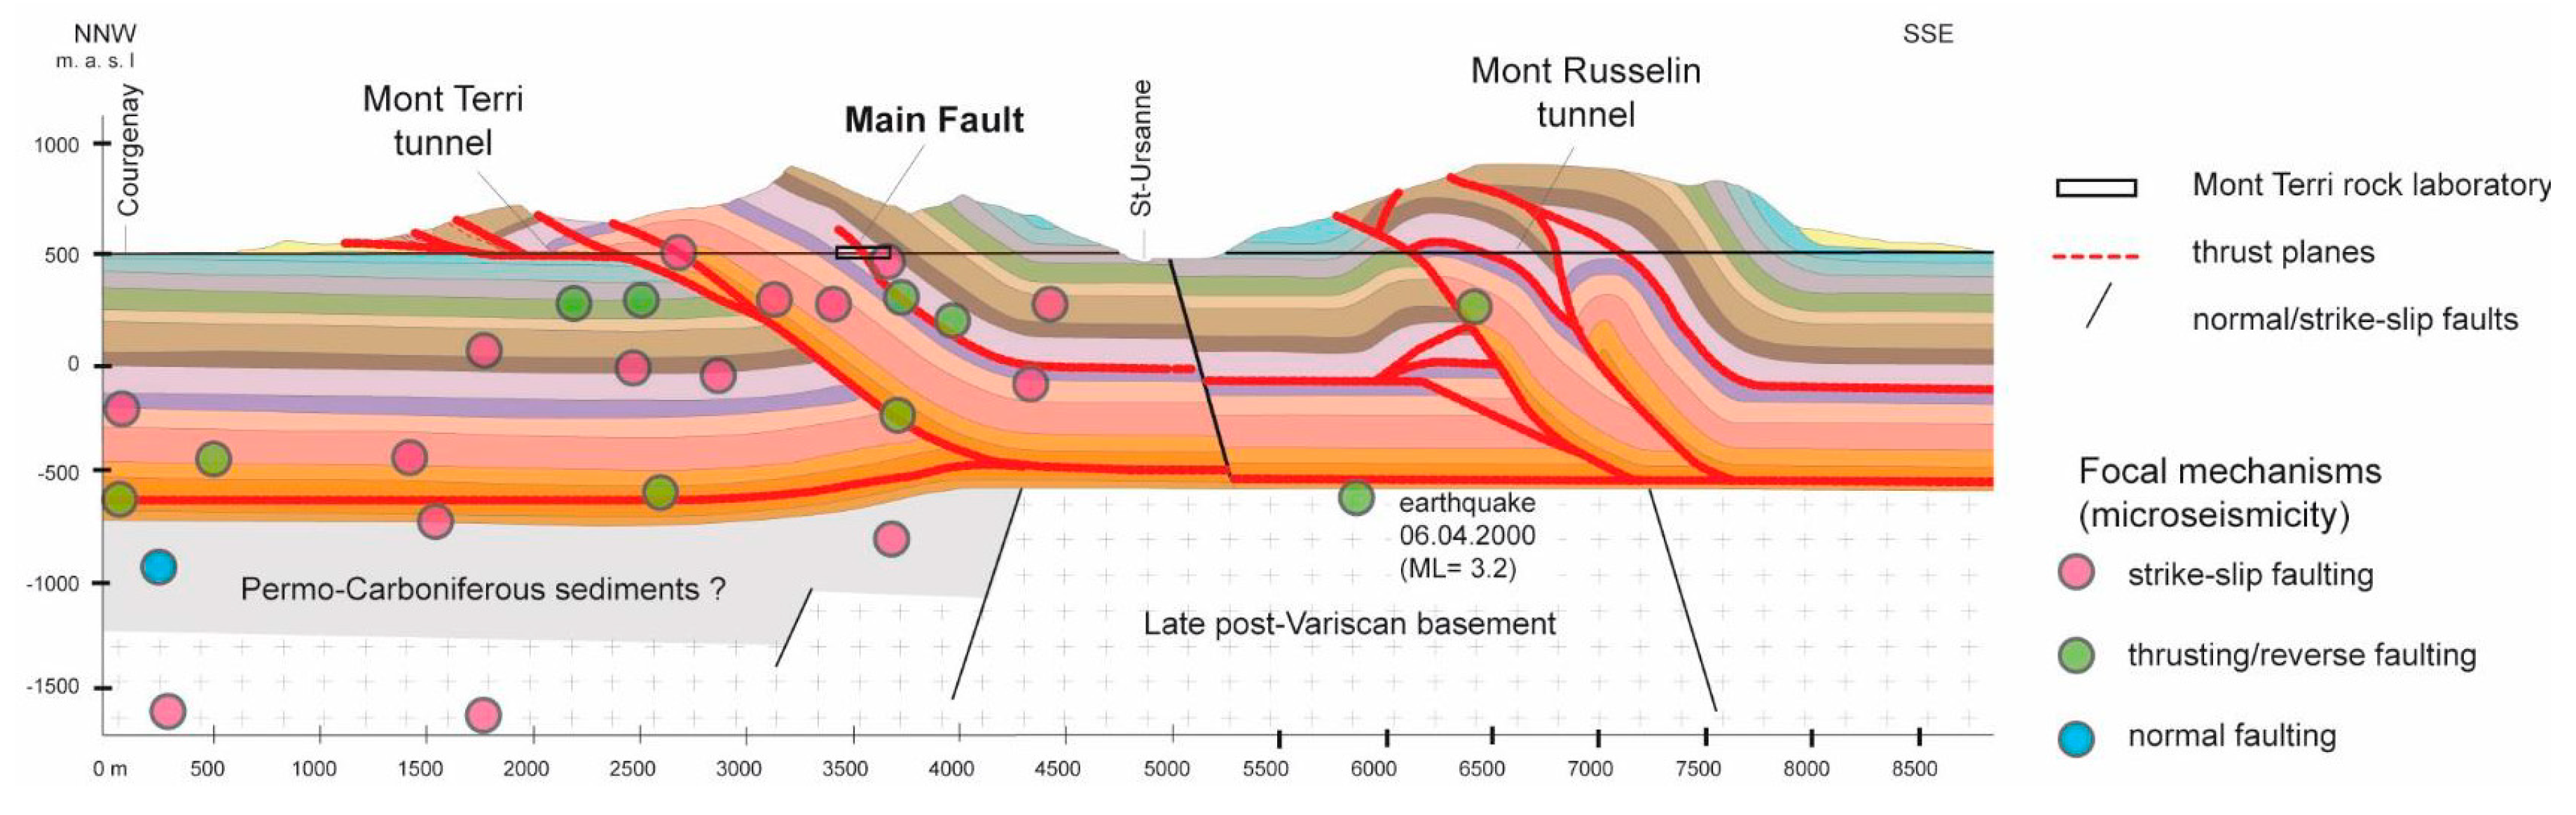
The Mont Terri URL [20,21] is situated north of St-Ursanne, Switzerland, at a depth of approximately 300 m below surface in an Opalinus Clay formation, and is accessible via the safety gallery of the St-Ursanne motorway tunnel. The URL is located in the southern limb of the SW-NE trending Mont Terri anticline (Figure 1). Opalinus Clay is an argillaceous rock formation being considered as a potential host formation for the deep geological disposal of radioactive waste in Switzerland. Similar types of rocks are also being considered in geological disposal programs in other countries, such as in France and Canada. Research programs are funded by different international partners; among them are ANDRA (Agence Nationale de gestion des Déchets RAdioactifs) and NWMO (Nuclear Waste Management Organization), who are the waste management organizations in France and Canada, respectively. The research programs cover the characterization of geochemical, hydrogeological and geotechnical properties and processes in Opalinus Clay, in order to further understand their performance as barriers against radionuclide migration.
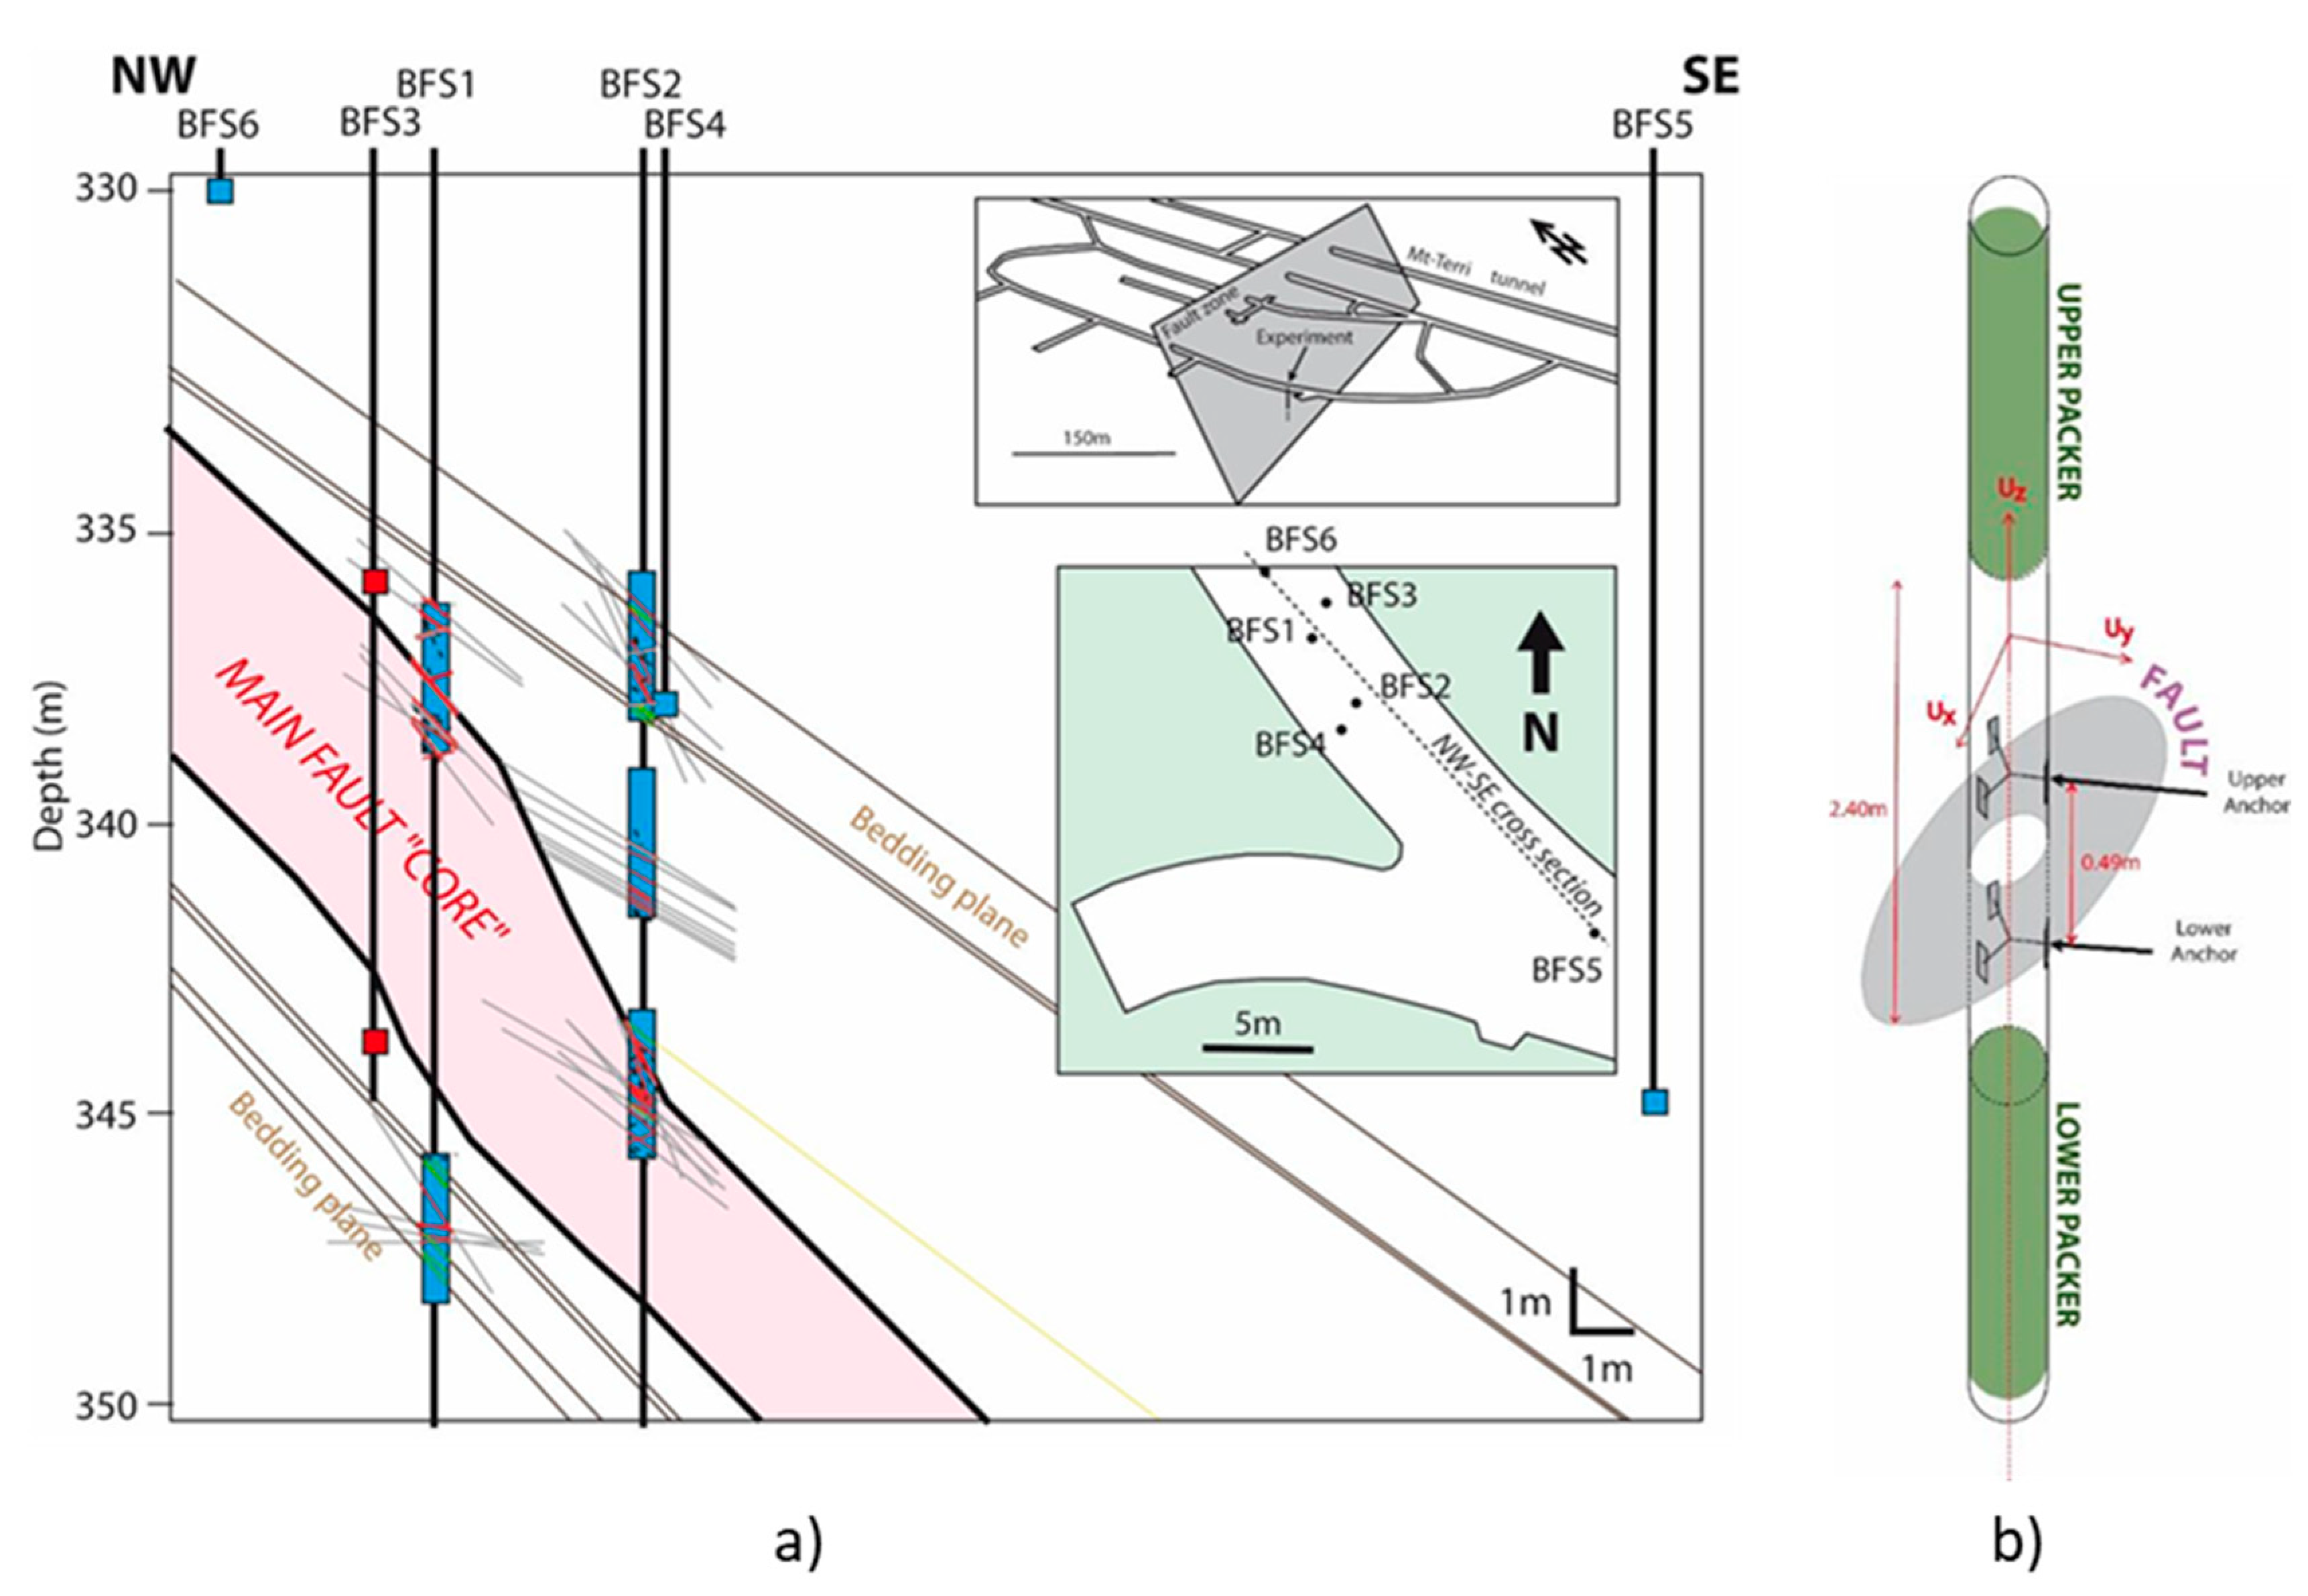
The geology and structural geology of Mont Terri are described in detail in several recent publications [22,23,24,25,26]. The main geological characteristics that are important to the present work are briefly summarized as follows. The bedding direction of the Opalinus Clay is between N055° to N065°, while the bedding dip is between 50° to 55°SE (Figure 2a). The Main Fault where the injection experiments are being performed is in fact a minor splay. The Main Fault core is a thrust zone, 0.8 to 3 m wide, bounded by two major fault planes, the upper plane trending N066°, dipping SE45° and the lower plane trending N075°, dipping SE40°. Therefore, in some areas, the fault is almost parallel to the bedding, while in others, there is an angle of 10° to 15° between them. A damage zone of variable thickness and other secondary fault zones exist in the vicinity of the Main Fault.
Several injection tests were performed in packed-off intervals of vertical boreholes that intersect the fault core and the secondary faults [27]. The equipment used for the tests consists of surface equipment for conducting the tests and acquire the data, and a unique high-pressure pulse probe (HPPP) borehole deformation tool (Figure 2b). The packed-off interval is pressurized (by water) and the probe measures deformation in both normal and shear displacement modes at high sampling rate (~500 Hz). Nano-seismic monitoring arrays were also installed proximal to the experiment to determine source locations of slip events. A total of five injection tests were conducted beneath, within and above the Main Fault during the two measurement campaigns of June and October/November 2015. During all tests, pore pressure was monitored at three locations around the Main Fault (boreholes BFS4, 5 and 6) and induced seismicity was monitored at borehole BFS3 at two depths; 43.9 m (Main Fault footwall) and 35.9 m (Main Fault hanging wall damage zone). All measurements were synchronized. In this paper we will focus on the injection test performed at the packed-off section at 37.2 m depth of borehole BSF2 that crosses a secondary fault. The test was performed using the SIMFIP (Step-Rate Injection Method for Fracture In-Situ Properties) probe straddle packer interval set across a secondary fault zone in the Main Fault hanging wall. The displacement sensor is centered at 37.2 m depth below the Mont Terri gallery 2008 floor. The fault zone contains twelve striated planes, most of them oriented N030°-to-N060° dipping 50°-to-70°SE. During the test, the injection pressure is increased step-by-step in the chamber with an engine pump. Flow-rate, injection chamber pressure and borehole displacement variations are monitored at a 500 Hz sampling frequency.
3. Mathematical Modelling of Injection Test in Secondary Fault
3.1. Governing Equations
The governing equations of the model are derived from the theory of poromechanics:
In the above equations, p is the pore fluid pressure, is the effective stress tensor, is the permeability tensor, α is the Biot’s coefficient, Kf and Ks are the bulk moduli of the pore fluid and the solid phase, respectively, μ is the viscosity of the pore fluid, I is the identity tensor, is the acceleration of gravity and t is time.
The stress-strain relationship for the solid skeleton is given by:
In Equation (3), ε is the total strain tensor, is the plastic strain tensor and D is the elastic stiffness tensor. In this work, the authors adopted the Drucker Prager yield criterion with a non-associated flow rule in order to define the onset of plastic deformation and its magnitude. The Drucker-Prager yield criterion requires a friction angle (φ) and a cohesion (c) as parameters, similarly to the Mohr-Coulomb criterion, but is numerically more stable.
3.2. Hydro-Mechanical Characteristics of Rock Mass and Fault
The rock mass is assumed to be isotropic and elastic. The fault on the other hand, is assumed to be elasto-plastic. In the elastic domain, the fault is assumed to be transversely isotropic, with two principal directions in the plane of the fault, and one principal direction perpendicular to the strike. In the plastic domain, an isotropic Drucker-Prager yield criterion is used to indicate the onset of fault slip and irreversible deformations.
The fault is conceptualized as a zone of finite thickness, with a series of parallel fracture planes oriented in the strike direction, separated at a distance s. The equivalent permeability of the fault in the strike direction is then given by the cubic law [28]:
where bh is the hydraulic aperture of each individual fracture and s is the separation distance between the fractures.
It is assumed that the permeability of the fault in the perpendicular direction to the fault plane, remains constant and equal to the one of the rock mass. Due to effective stress change, it is assumed that the hydraulic aperture of each fracture would change according to:
In the above equation, bhi is the initial hydraulic aperture, is the elastic increment in hydraulic aperture, is the plastic increment in the hydraulic aperture and A is a damage enhancement factor, a hypothetical parameter introduced by the authors. The damage enhancement factor is based on the consideration that damage following fault slip can enhance the interconnectivity between the individual fractures, resulting in a more drastic increase of the fault permeability. The normal strain to the fault plane is calculated from Equation (2) of quasi-static equilibrium combined with the stress-strain relationship shown in Equation (3), which are coupled to Equation (1) of pore fluid flow. The elastic and plastic increment of the hydraulic aperture of an individual fracture are respectively given by
where , are respectively the elastic and plastic strain normal to the fault plane.
The increment of aperture is triggered by the change of normal effective stress across the fault, induced by the change in pore fluid pressure triggered by fluid injection. In this model, when the stress state in the fault has not reached the Drucker-Prager criterion, the deformation is elastic and induces an elastic aperture increment . When the Drucker-Prager criterion is reached, permanent deformation occurs, inducing a plastic aperture increment . Therefore, mechanical deformation results in changes in the permeability according to Equations (4) and (5).
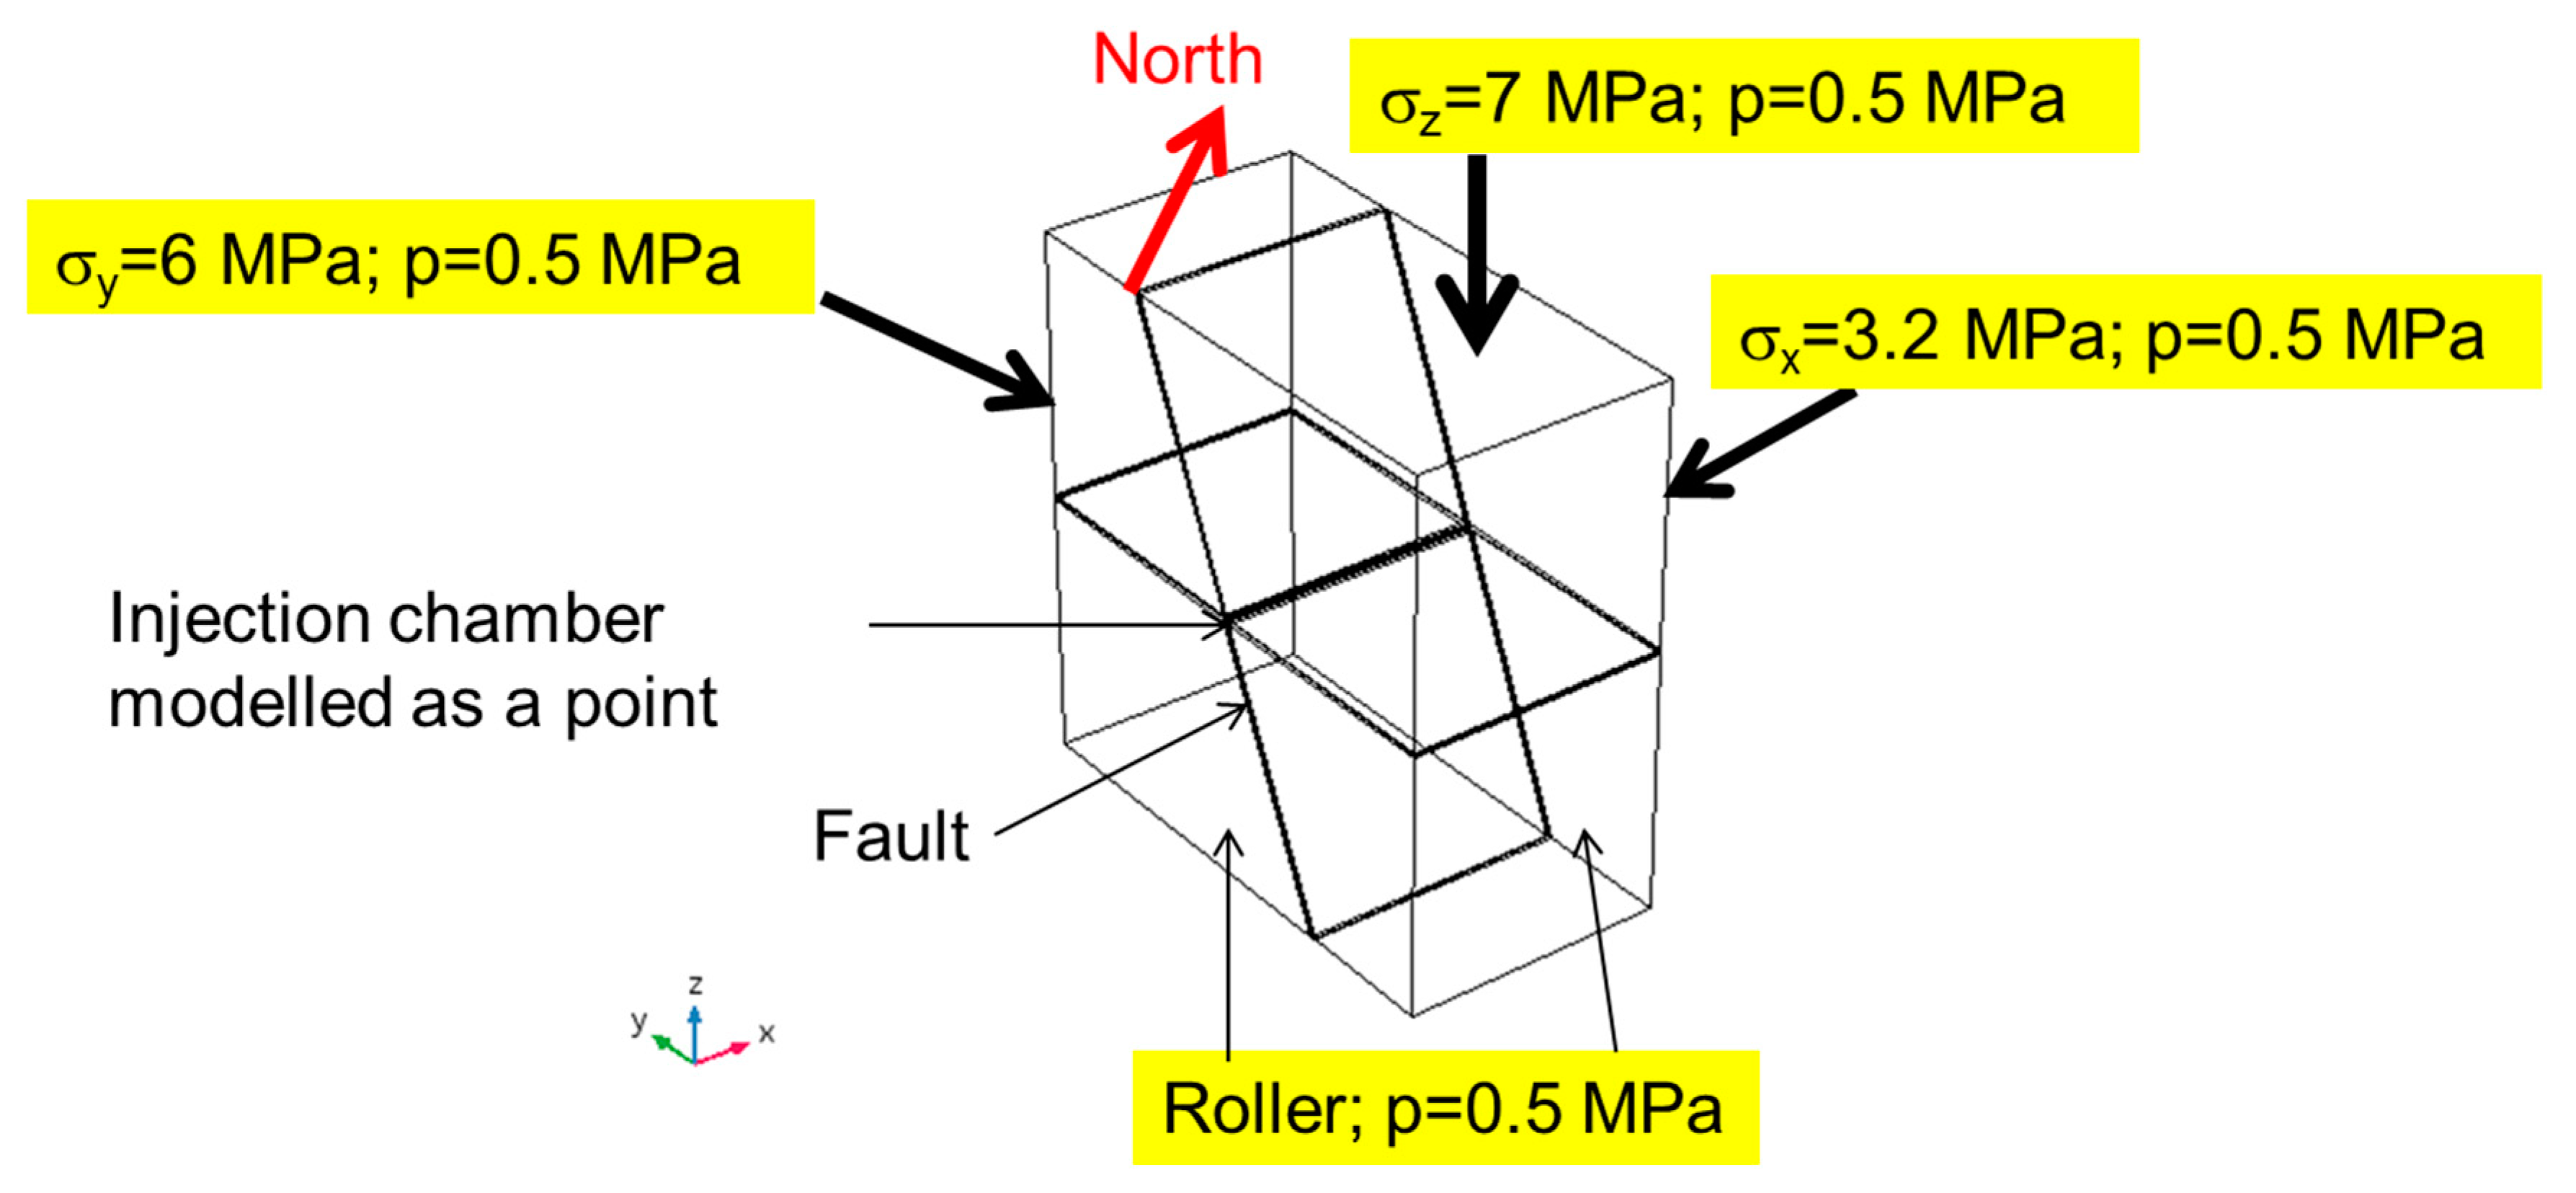
The above model was implemented in the commercial software COMSOL Multiphysics, version 5.4. The software is a general-purpose numerical solver for partial differential equations, using the finite element method. The users can derive their own governing partial differential equations (e.g., Equations (1) and (2)), and define and develop their own constitutive relationships (e.g., transversely isotropic elasticity; Drucker-Prager criterion with non-associated flow rule; permeability functions such as in Equations (3) and (4). The geometry of the finite element model and the boundary conditions are shown in Figure 3. We considered a block of 20 m × 10 m × 20 m, where the yz plane is a plane of symmetry with the injection point at its centre. The secondary fault is included as a finite thickness feature, striking N045° and dipping at 65°SE. The in-situ major principal stress is assumed to be vertical; the intermediate principal stress is horizontal and oriented at N045°, and the minor principal stress is horizontal and oriented at N315°.
Table 1 shows the assumed input properties of the intact rock mass, which are within the range of published data [29]. The input properties for the fault are derived by a calibration procedure, and the values for the base case simulation are shown in Table 1. The in-situ state of stress from field estimates [30,31] is reproduced in Table 2. The orientation of the in-situ state of stress used as boundary conditions for the base case of the numerical model (Figure 3) is in the range of the field estimates. However, the magnitudes are higher than the measured ones; this choice of higher magnitudes proved to be necessary in order to ensure fault stability in the initial conditions. The effects of lower magnitudes of the in-situ stress will be discussed in a later section.
3.3. Base Case Results for Simulation of Secondary Fault Injection Test
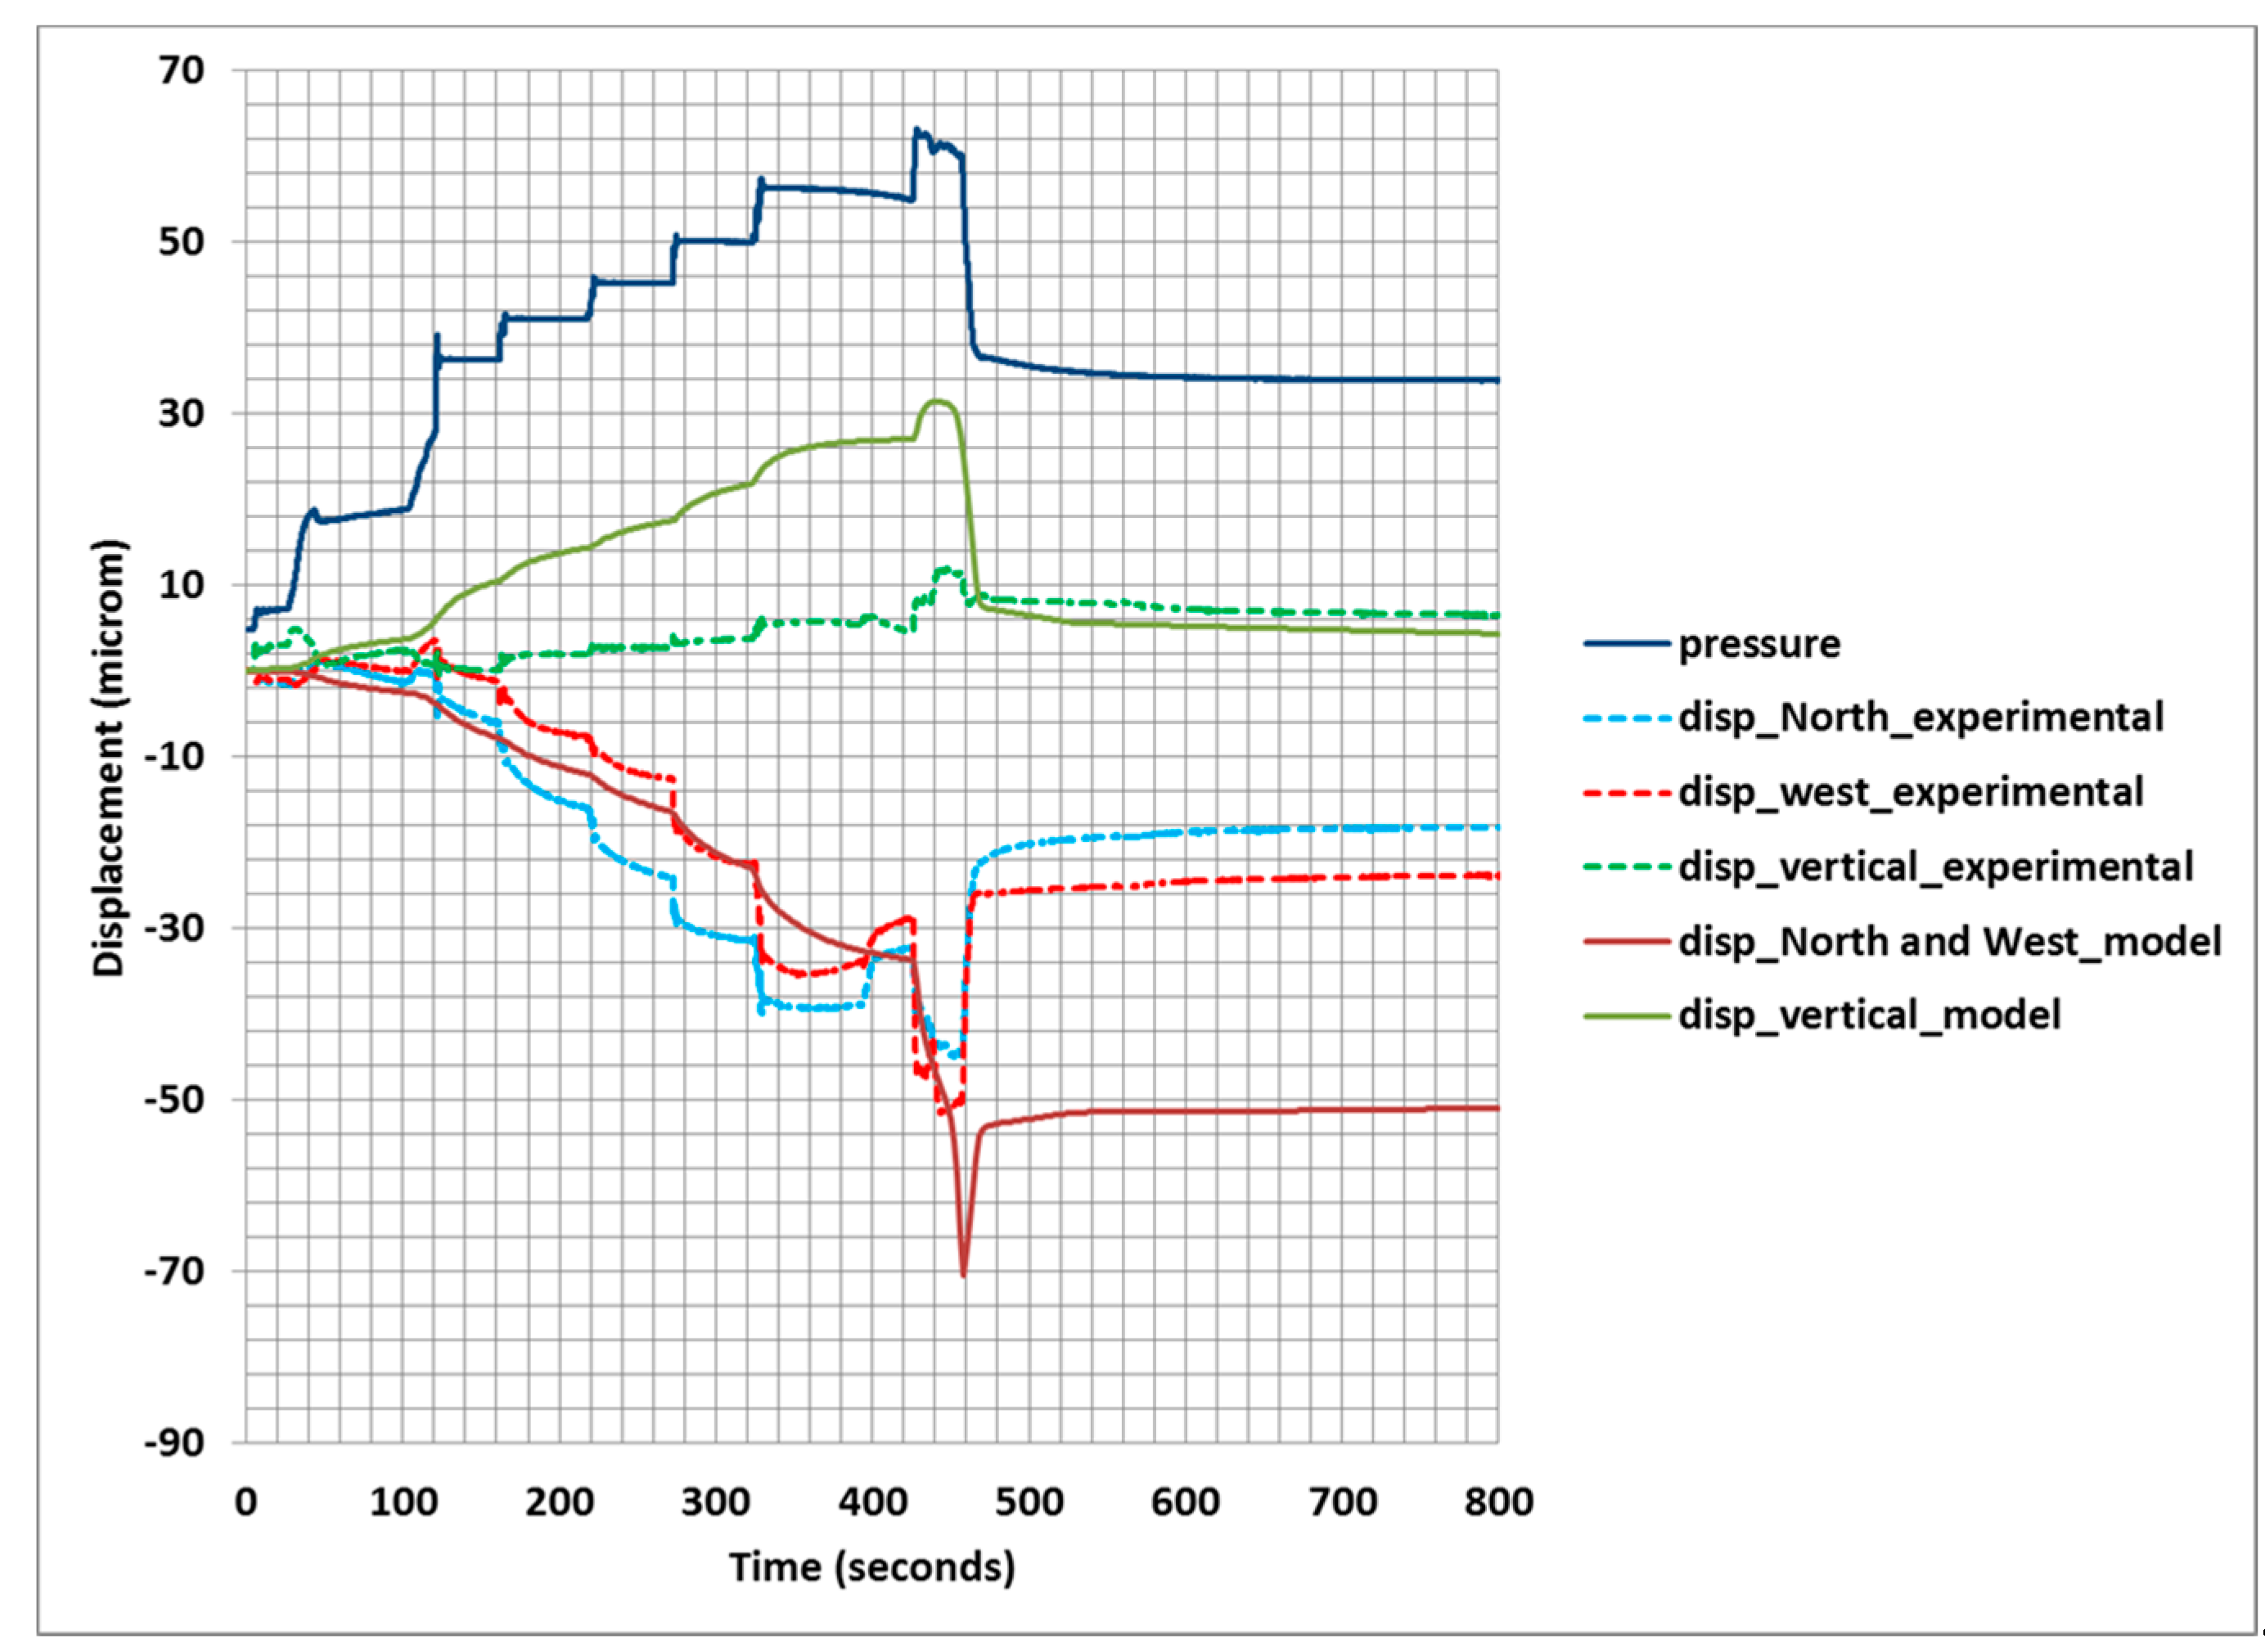
In the injection chamber, the pressure is increased in a stepwise manner as shown in Figure 4. Because of the pressure increase, the fault opens resulting in displacement in the vertical direction, and in the east and west direction. The simulated results compare in trends and reasonably well in absolute values with the relative displacements recorded by the anchors. The fault movement also increases in a stepwise manner, reflecting the increase in injected water pressure. The horizontal relative displacements are larger than the vertical one. The model correctly predicts that finding, albeit with an overprediction of the vertical displacement as compared to the experimental results. A plausible explanation for this overprediction would be that the dip angle of the fault at the location of the injection is higher than the one assumed in the model (65°). The model also correctly predicts a sharp increase in both vertical and horizontal displacement at the highest injection pressure (approximately 6.5 MPa), resulting in fault failure. In the last step of the injection sequence, the pressure is decreased to approximately 3.2 MPa. The model correctly shows that permanent deformation remains, albeit with an overestimation as compared to the measured values.
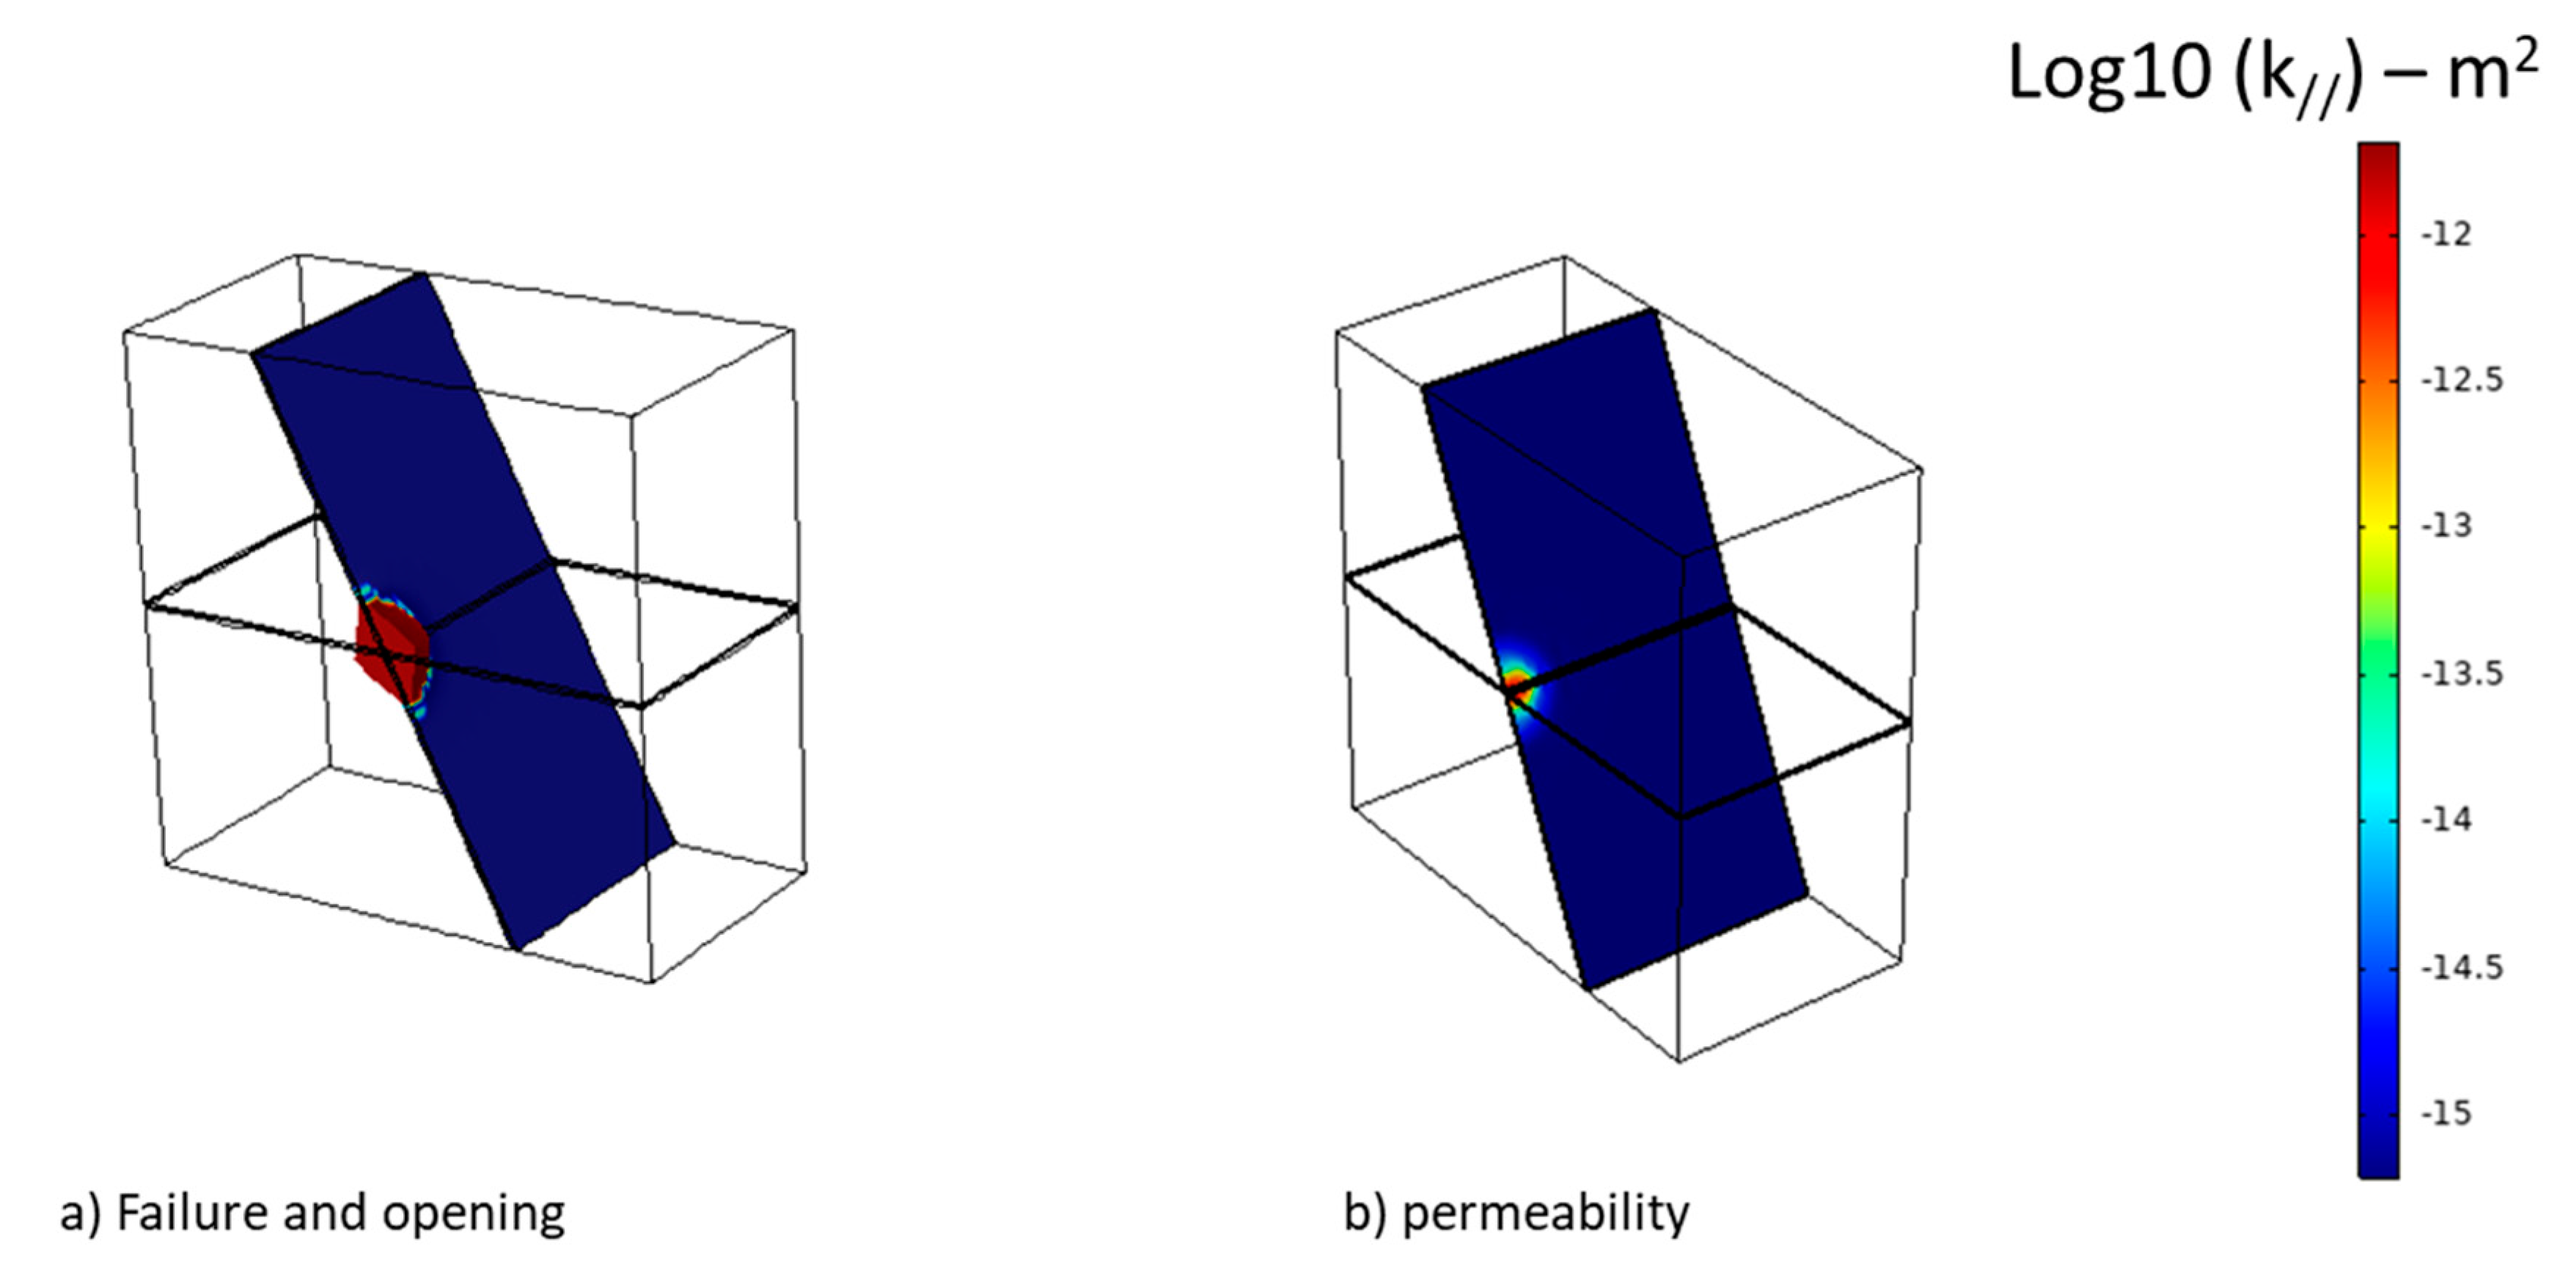
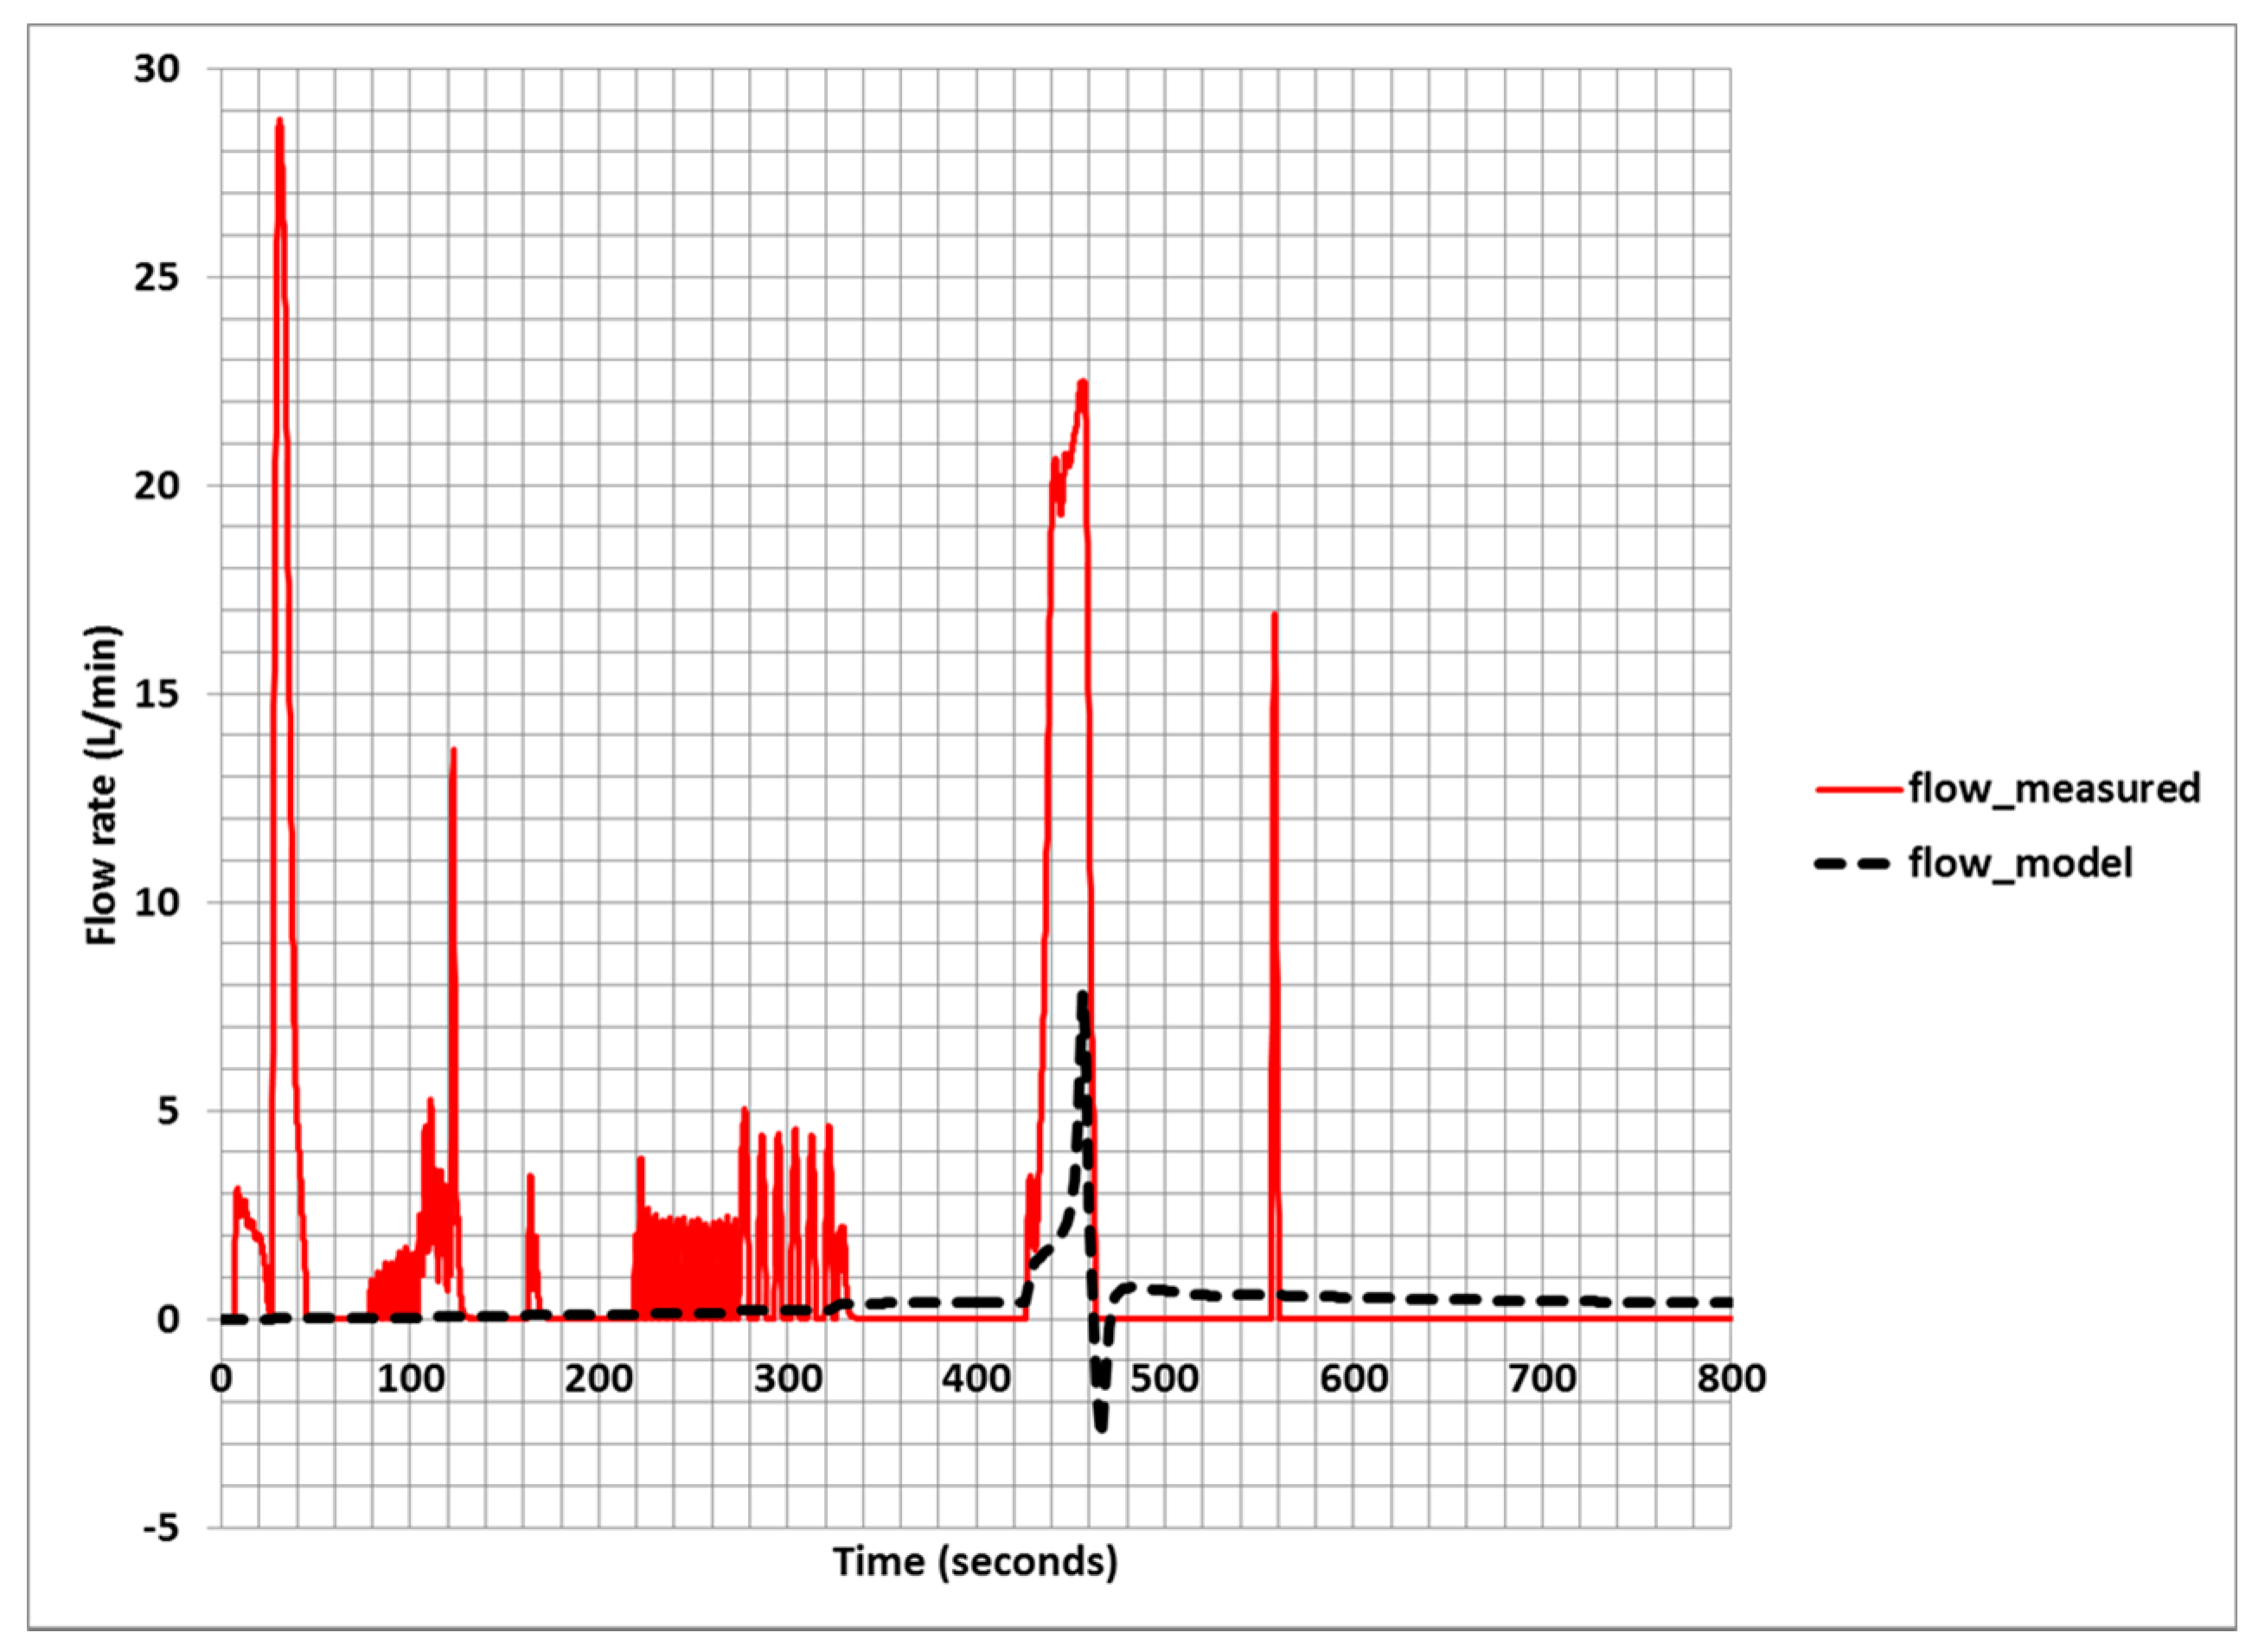
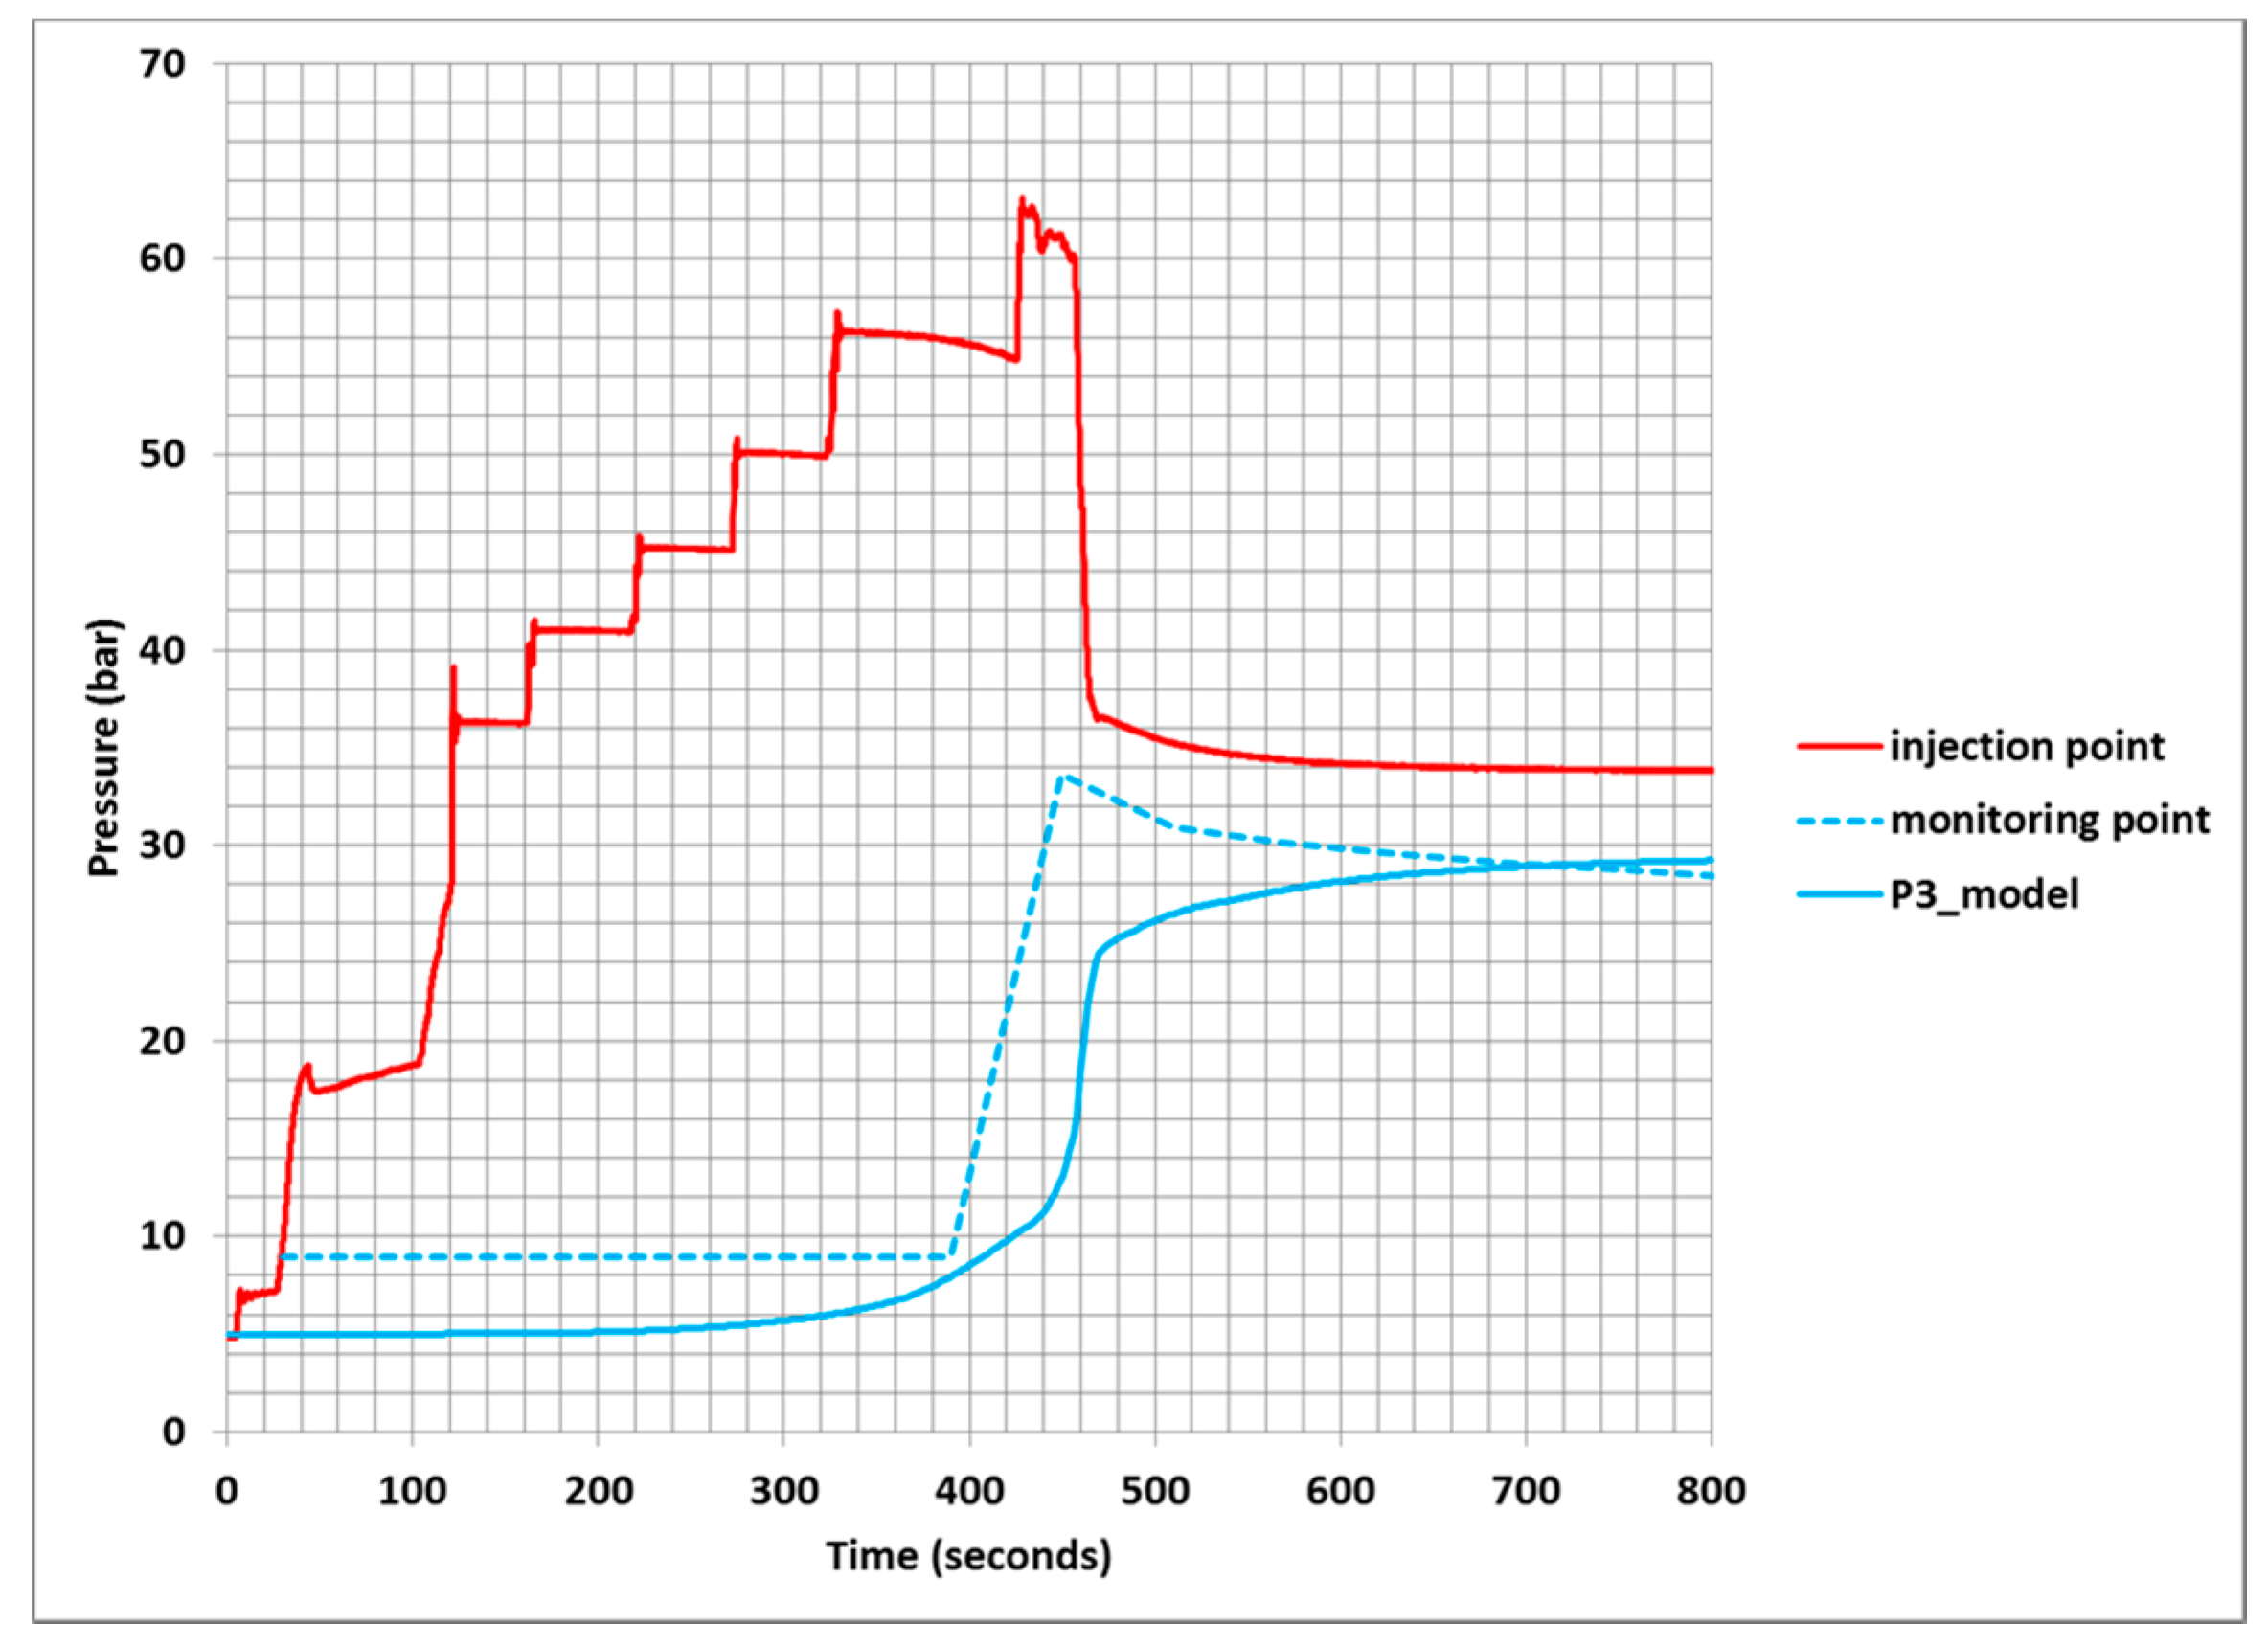
The simulated extent of fault failure and opening at the time of highest injection pressure is shown in Figure 5a, while the permeability distribution at the same time is shown in Figure 5b. It could be seen that fault failure occurs in a quasi-circular zone around the injection point, with a radius of approximately 1.5 m. The highest fault displacement is found in this failure zone and occurs mainly in the normal direction, with minimal shear. The latter result is verified by the data measured from the displacement anchors. Due to fault failure and opening, the permeability of the fault drastically increases by up to three orders of magnitude in the vicinity of the injection point, leading to a sudden spike in injection flow rate. Figure 6 compares the modelling results with the experimental data for injection rate. In Figure 6, the spikes that occur before 400 s are due to the elastic deformation of the test chamber and do not reflect actual water ingress into the fault. Consistently with the experimental results, the model shows that flow into the fault is insignificant until approximately 400 s when the injected pressure increases to over 6 MPa. The model correctly shows this behaviour, albeit with an underprediction of the flow rate. As shown in Figure 7, the model predictions are consistent with the experimental data, in that the pressure at a point 1.5 m down-dip of the fault remains practically unchanged from the initial value, until the same instant in time when fault failure leads to a sharp increase in the local permeability, resulting in a sharp pressure front reaching that point.
4. Parametric Study
4.1. Effects of Fault Shear Strength Parameters
It is apparent from the previous discussion that, for a given initial state of in-situ stress, the most important factors that determine fault failure and the ensuing increase in permeability are shear strength parameters and the relationship between permeability increase and fault deformation and shear failure. In the Drucker-Prager formulation, the shear strength parameters are the cohesion, friction angle, and the dilation angle. The damage enhancement factor A in Equation (4) is the other parameter that significantly influences the post-failure hydro-mechanical response of the fault. The shear strength parameters are the key parameters that determine the onset of fault failure, while the damage enhancement parameter determines the magnitude of the permeability increase in the post-failure phase. The friction angle is directly related to the friction coefficient, which has been shown to be highly variable [8,9,12]. Therefore, we performed a sensitivity study in this section, and also consider it spatial variability in the heterogeneous case described in a subsequent section. In order to evaluate the influence of the above parameters, we considered alternative situations to the base case previously reported:
- (1)
- a damage enhancement factor of 20 instead of 28
- (2)
- a dilation angle of 10° as compared to 17°
- (3)
- a friction angle of 20° instead of 22°
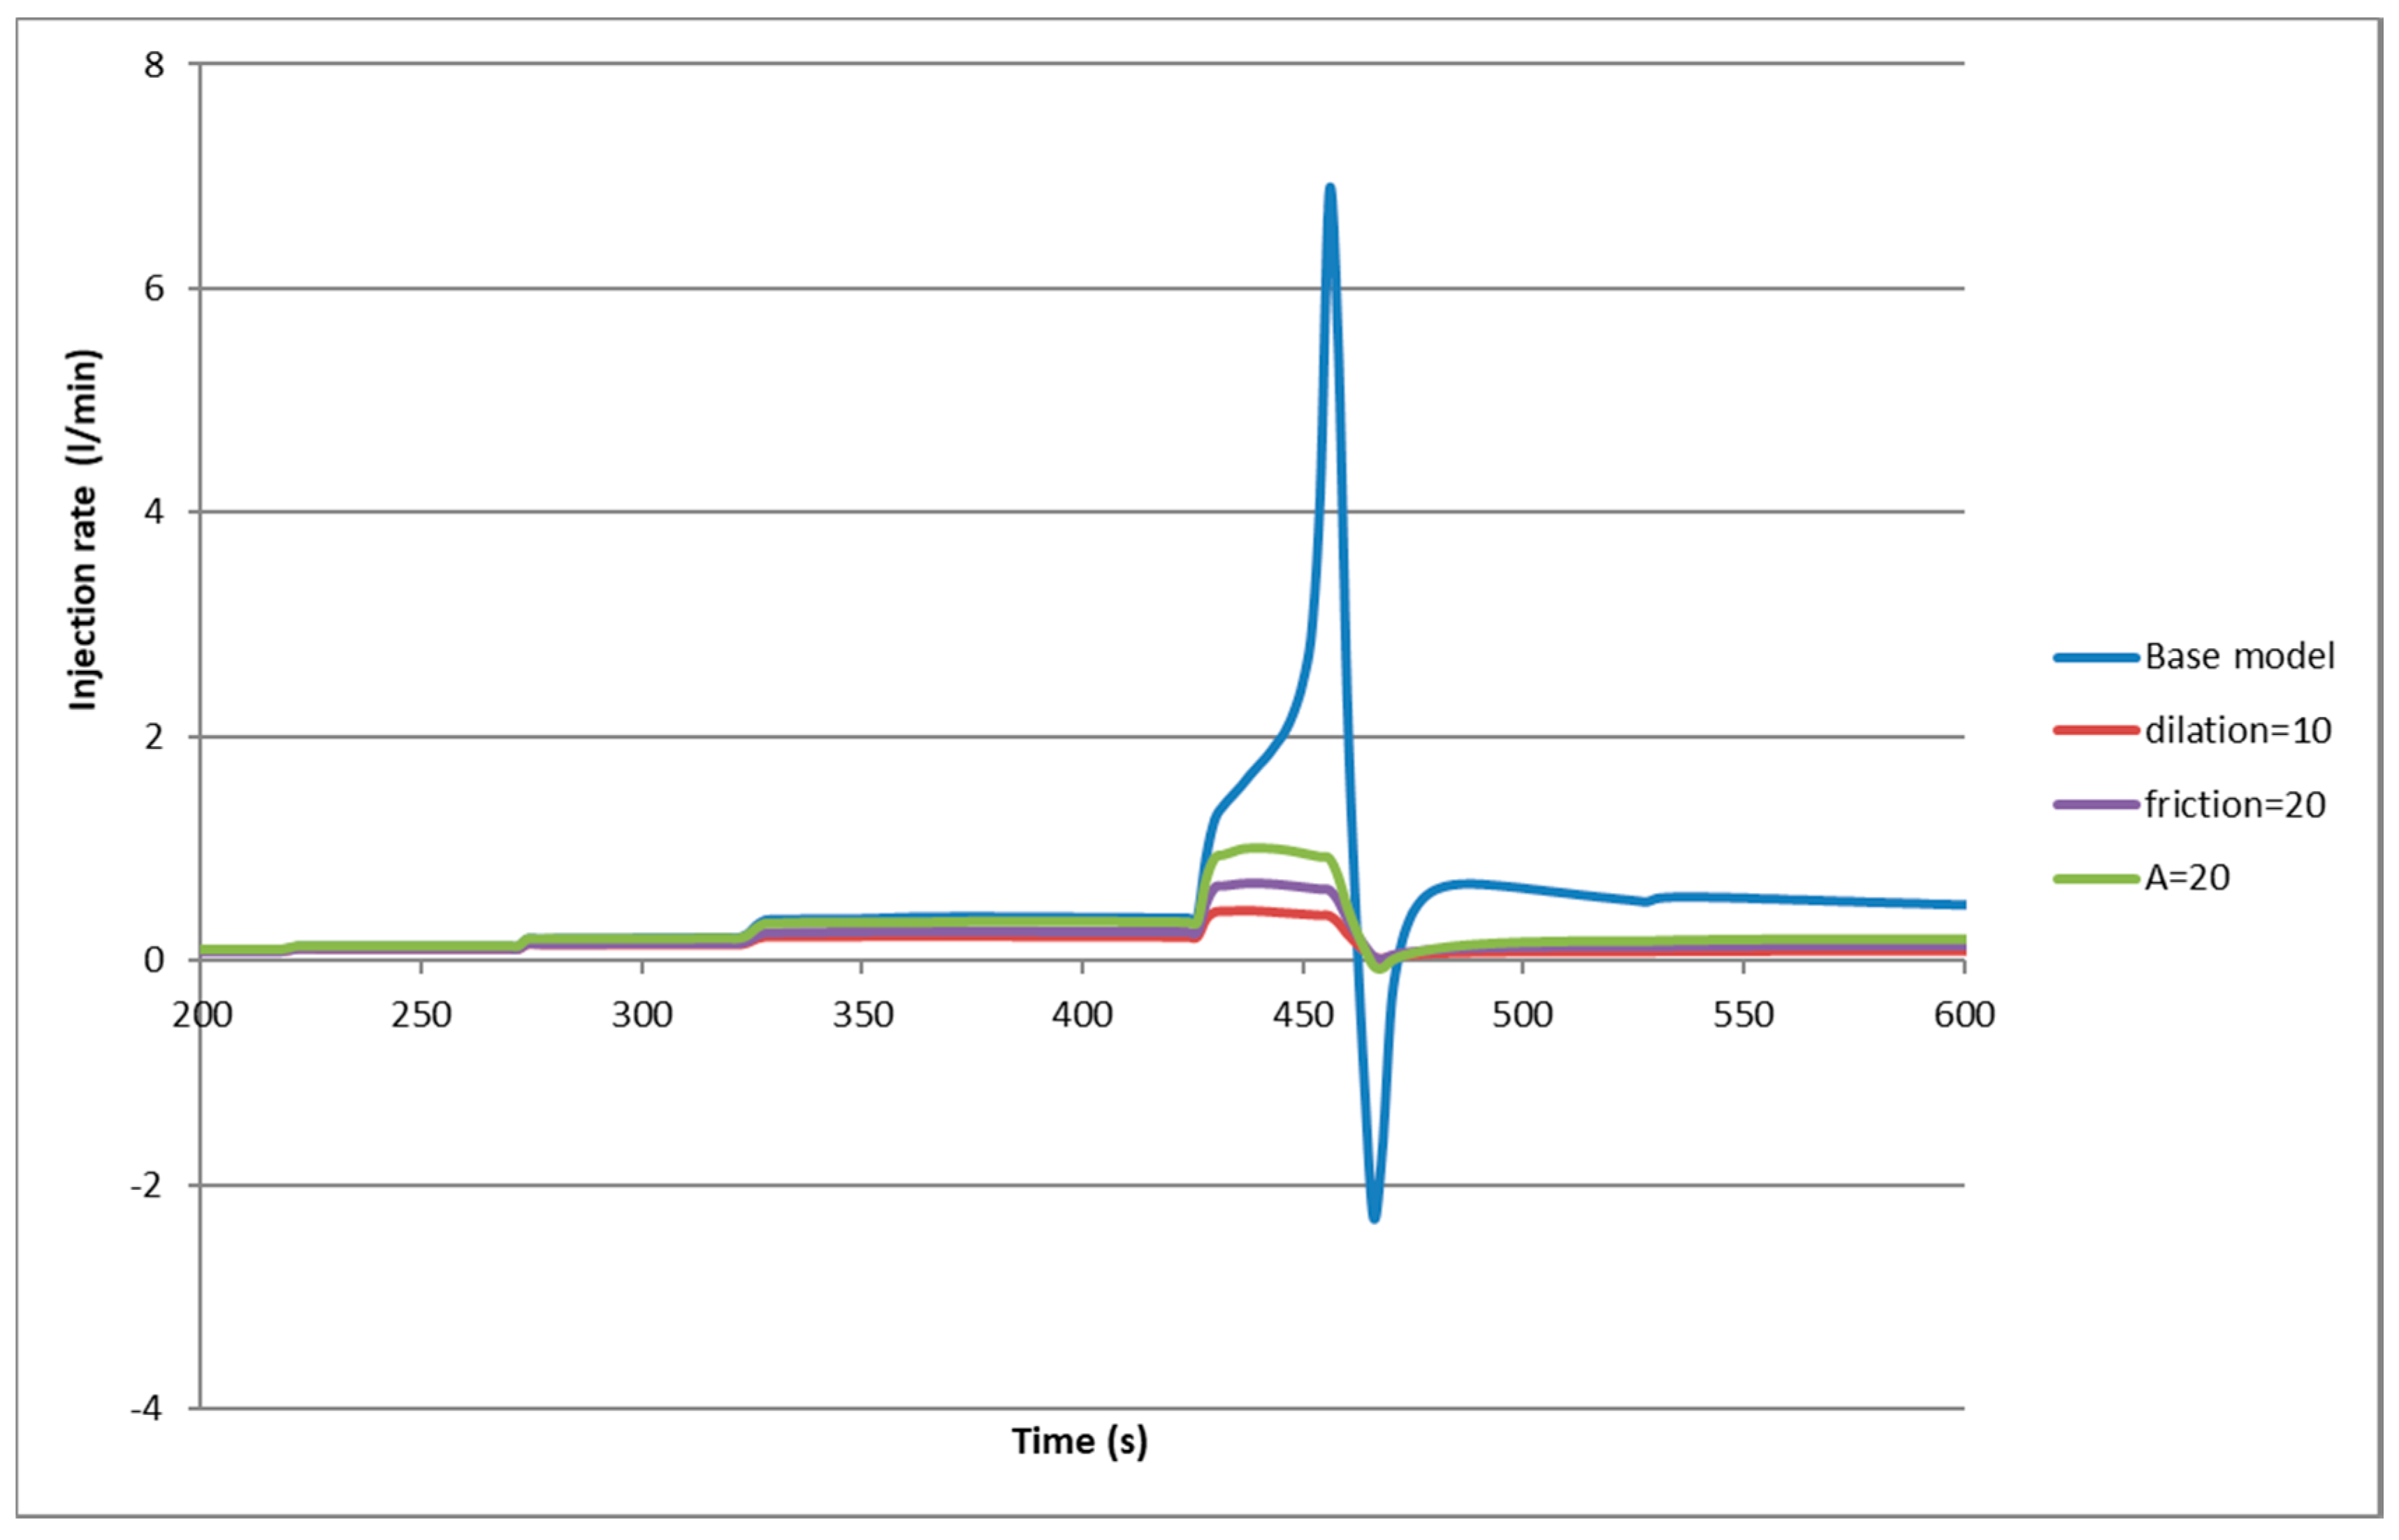
Figure 8 compares the injection rate for the above cases. For the case of lower dilation angle, the fault opening will be lower as compared to the base case. For a lower damage enhancement factor of A = 20, the post-failure increase in permeability would be lower after local failure. Therefore for the above two cases, the maximum injection rate is lower as compared to the base case.
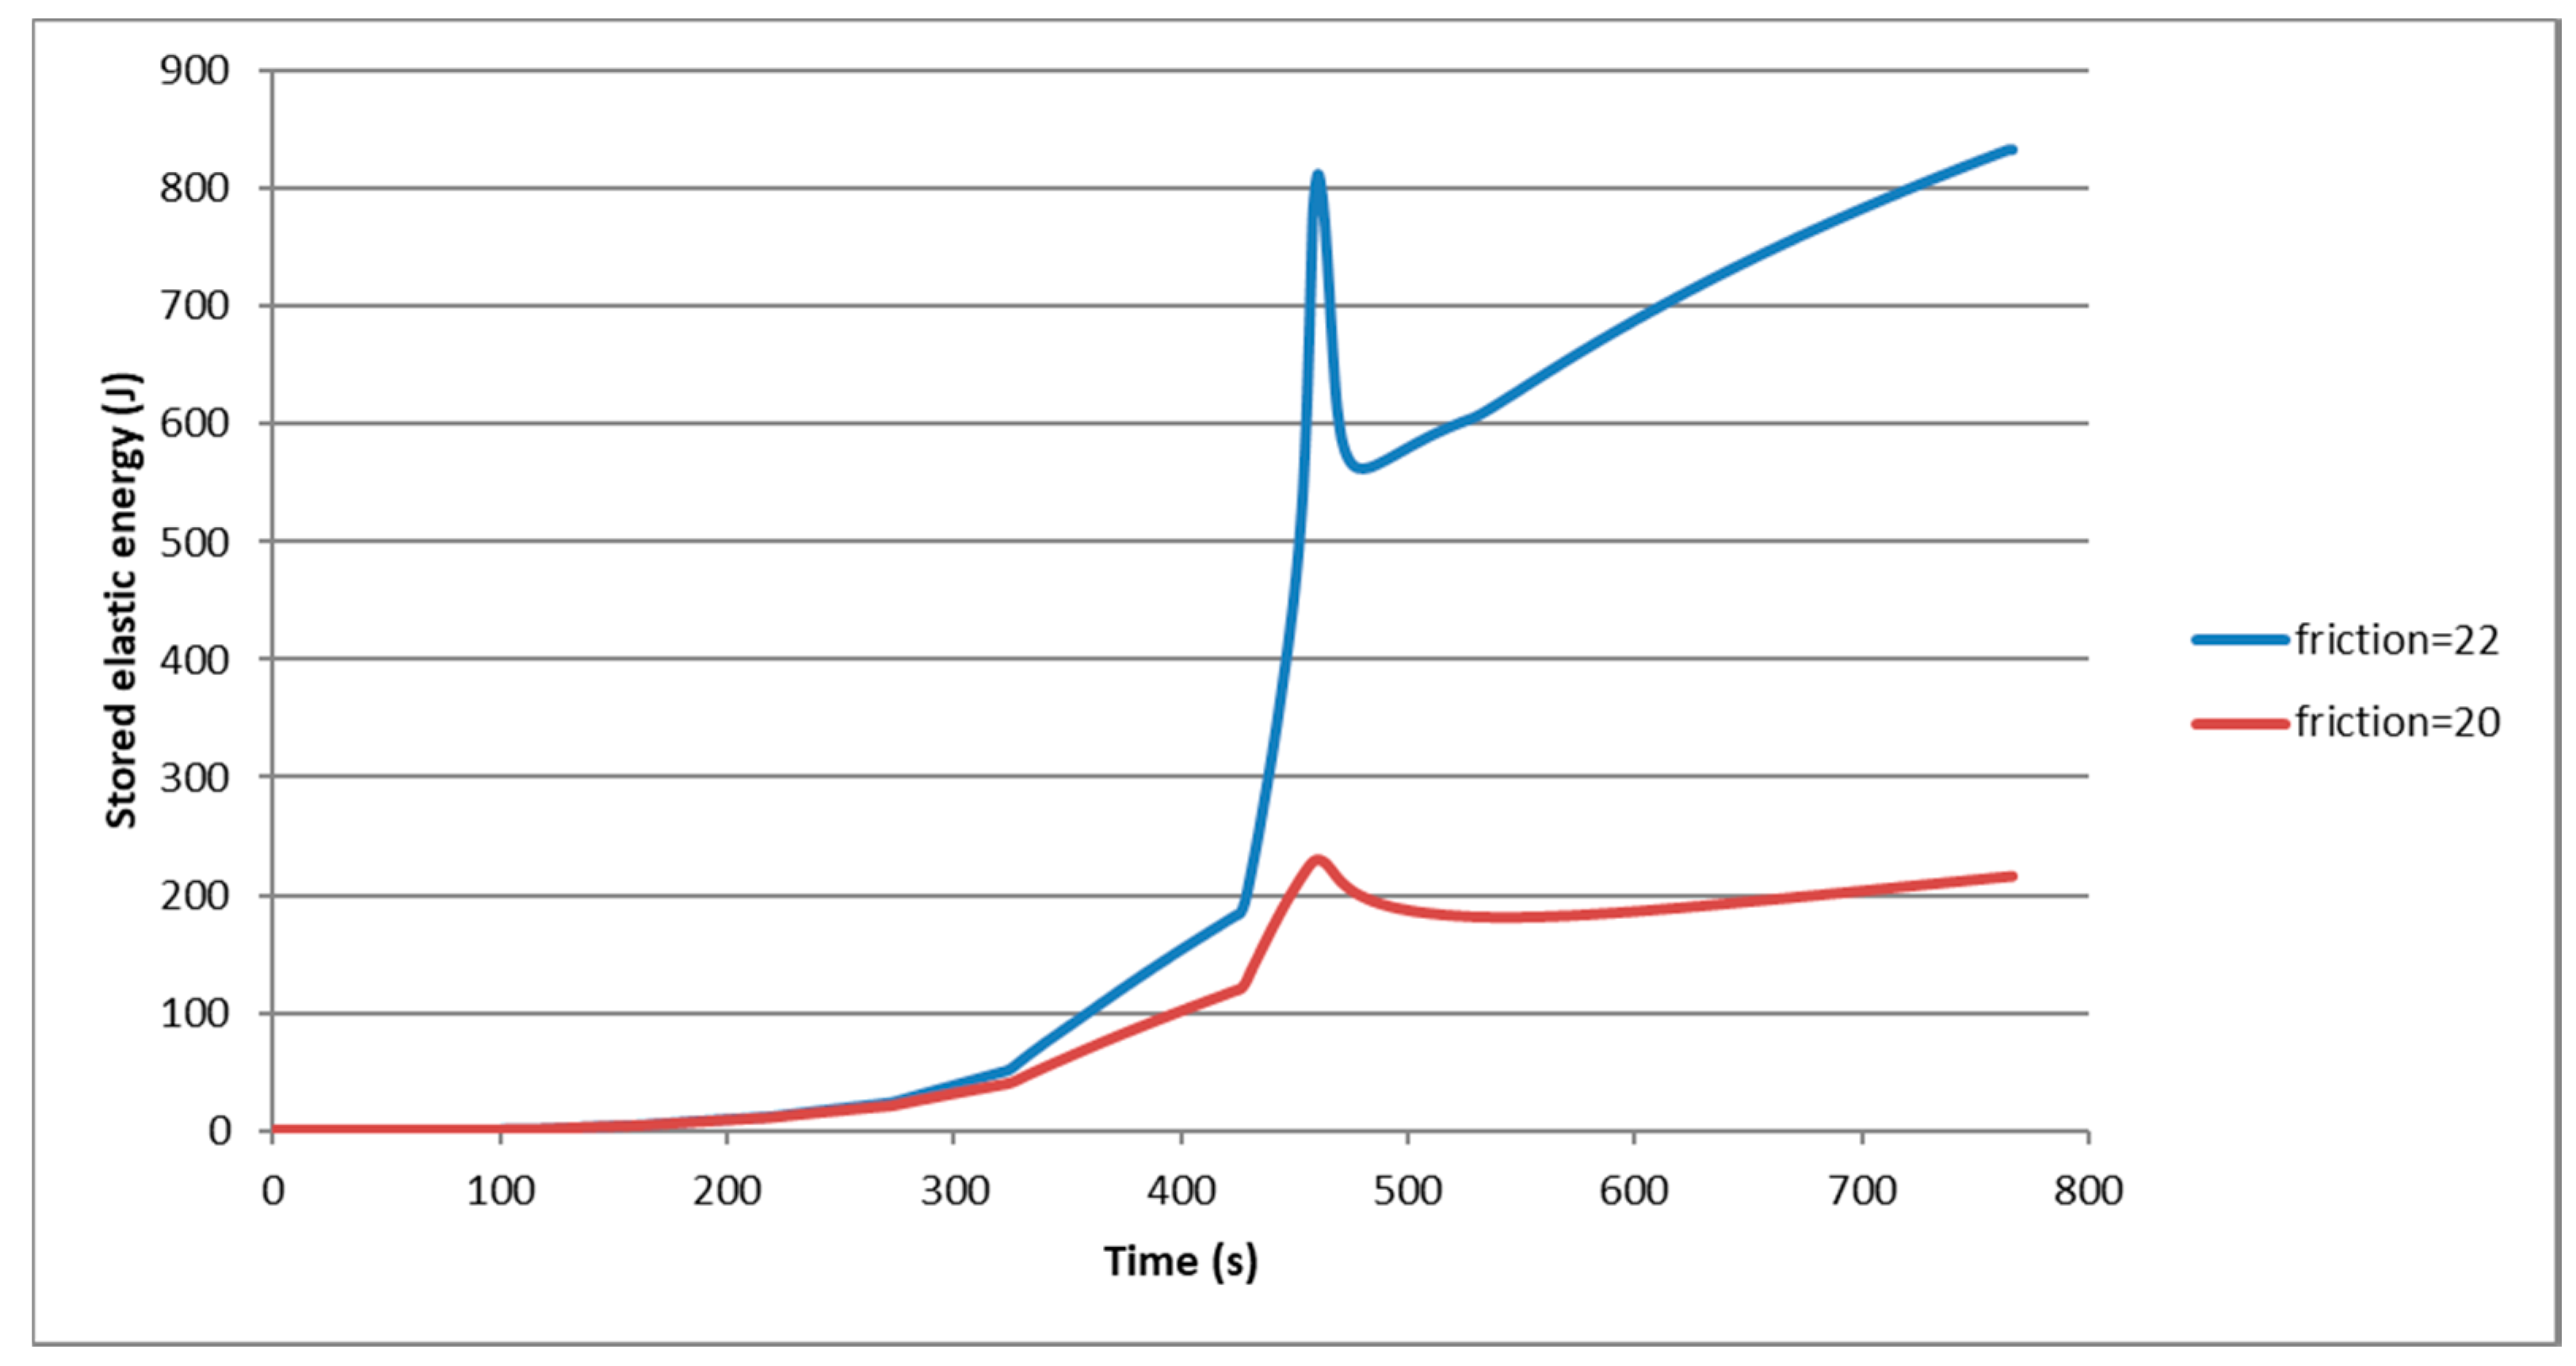
When the friction angle is 20°, the maximum injection rate occurs at the same time as for the base case with a friction angle of 22°. However, the injection rate is lower for the φ = 20° case compared to the base case and no sharp peak was found. As shown in Figure 9, the extent of fault failure is more pronounced for the φ = 20° case, with an elongated shape instead of a quasi-circular one found in the base case. The fact that the maximum injection rate is lower could be explained by the more progressive failure of the fault that occurs earlier as compared to the base case, where a later but more brittle type of failure is experienced. In order to verify that phenomenon, the variation of elastic energy stored in the fault for the two cases are plotted in Figure 10. The stored elastic energy is defined as
where We(t) is the elastic energy stored in the fault at any time t, and V is the fault volume.
The elastic energy that was stored in the fault is higher for the higher friction angle. At failure, that energy is also released in a more abrupt manner, suggesting a more brittle type of failure.
4.2. Effects of Fault Heterogeneity
Fractures and fault are heterogeneous in nature. The shear strength of the fault depends largely on the asperities and contact conditions of the surfaces of the individual fractures that are present in the fault. Therefore, a shear strength parameter such as the friction angle would be spatially variable [7,8,9,12], and its spatial distribution is a reflection of the topology of the fracture wall asperities, contacts and degree of wetness and the characteristics of gouge material that might be present. In practice, if measured data on such parameter as the friction angle are available at different fault locations, the fault friction angle can be approximated as a function of position, using a finite Fourier series of the form:
In Equation (10), m, n are spatial frequencies; N, M are the cutoff frequencies for the finite series; x, y are coordinates in the fracture plane; a(m,n) and are respectively the amplitudes and the phase angles associated with the frequencies.
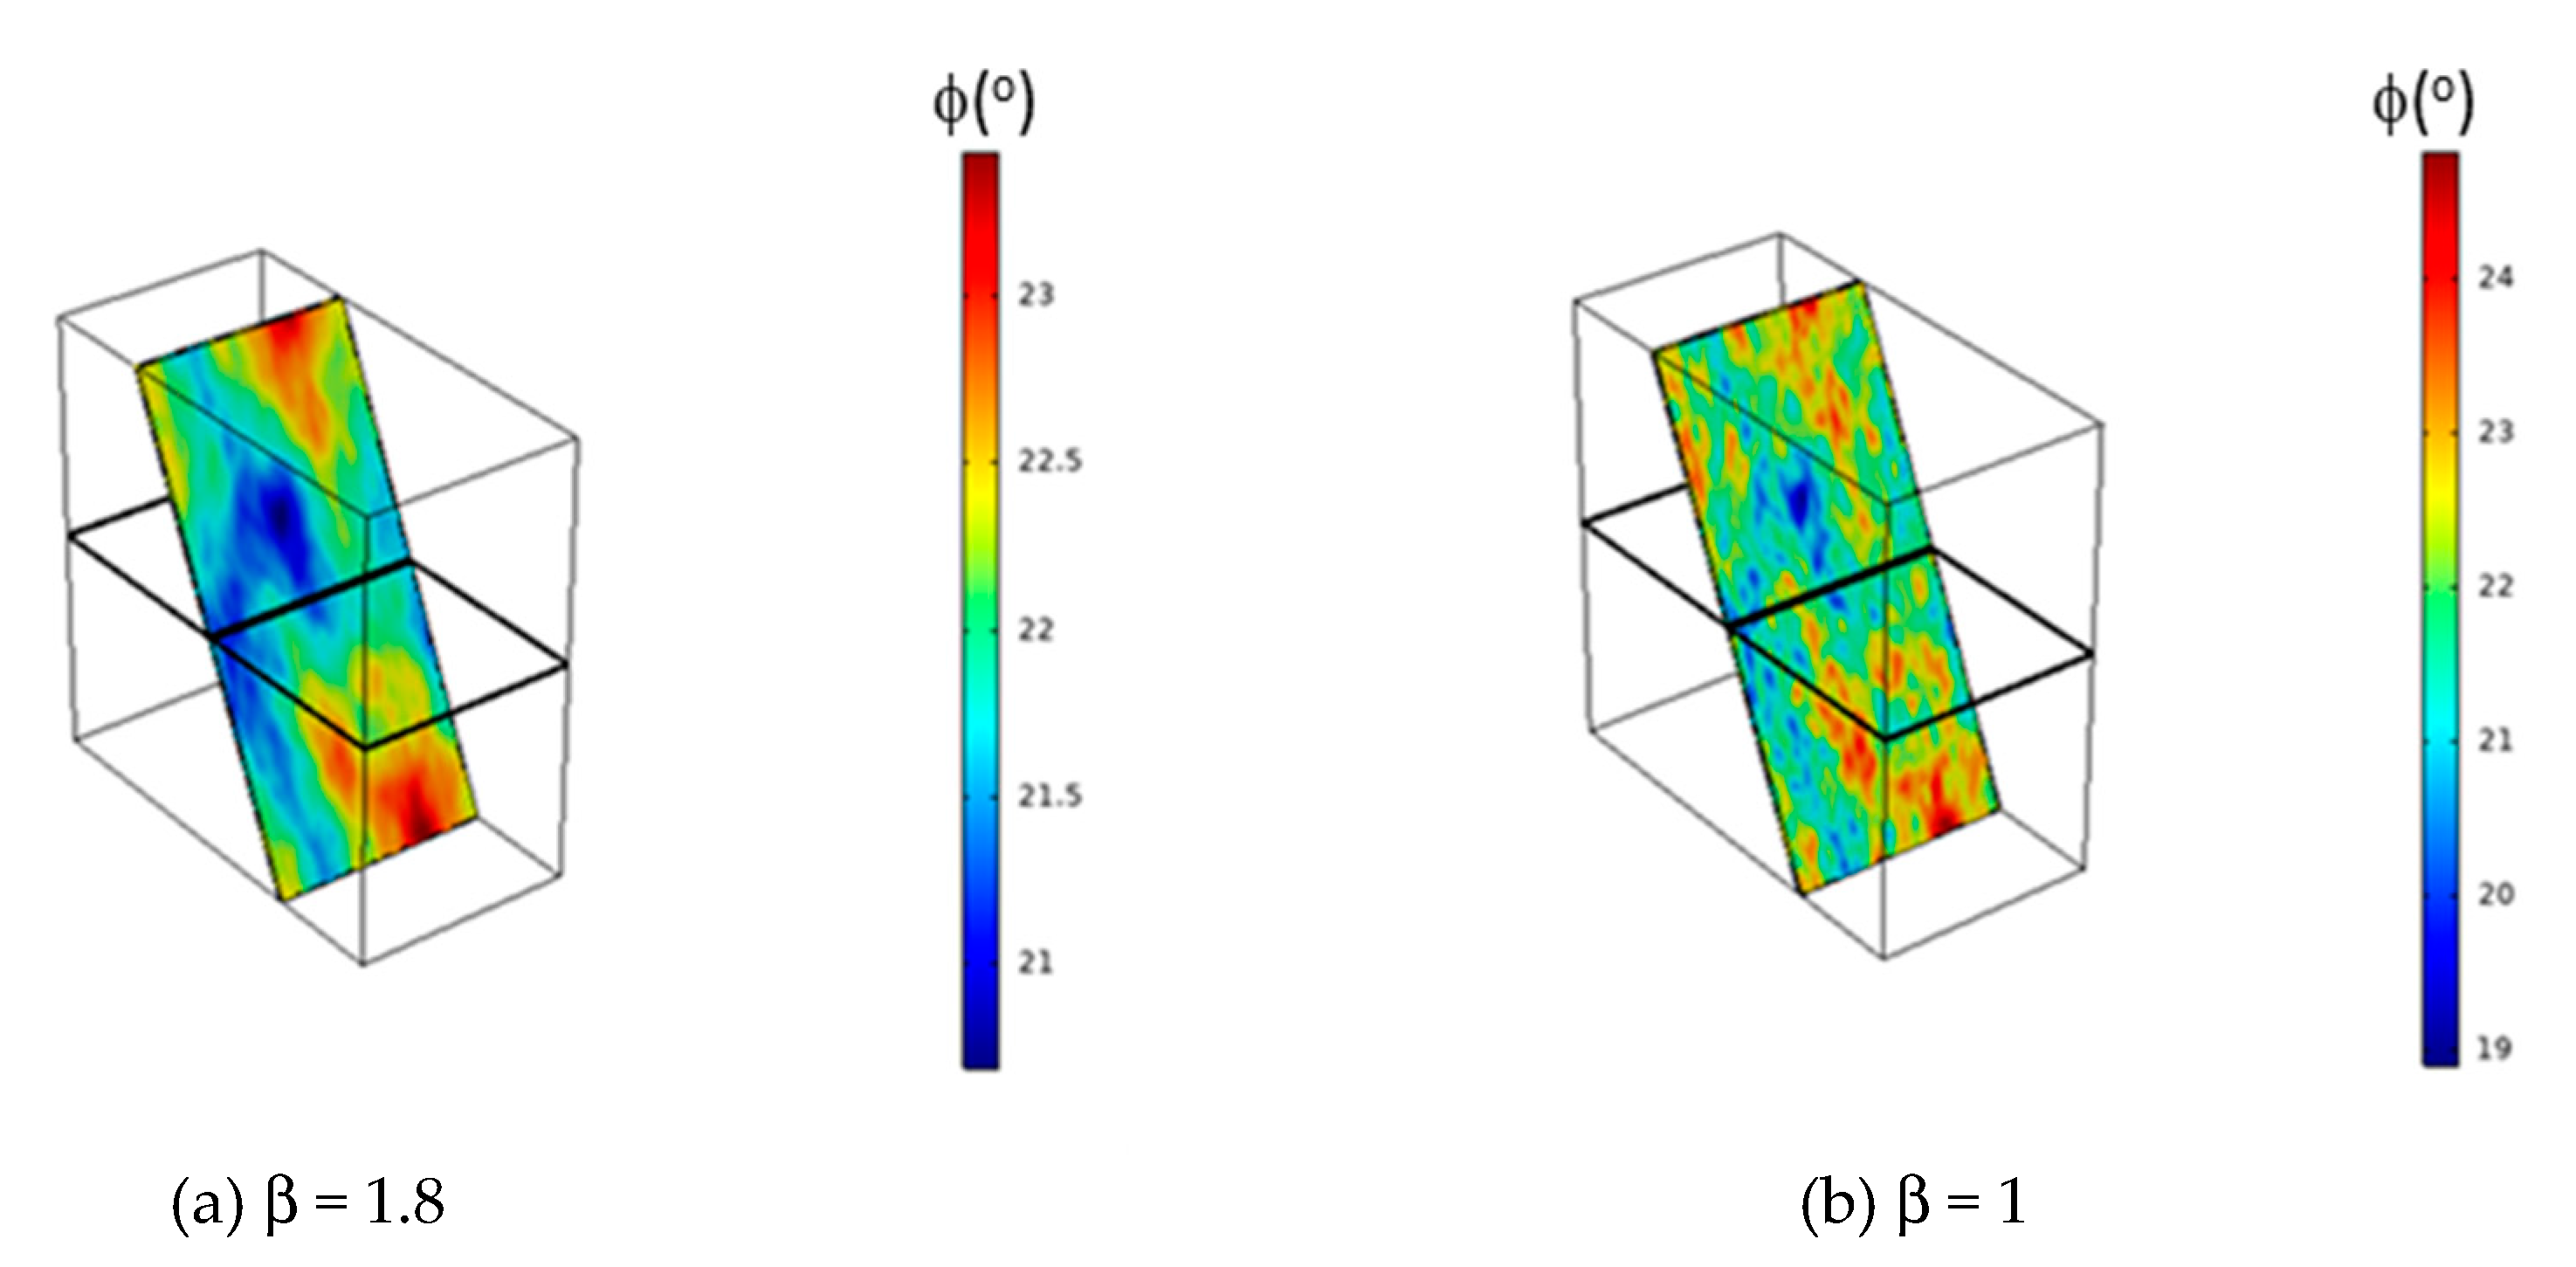
In the absence of real data, one can also randomly generate data to mimic heterogeneity by using Equation (10), and assuming that the amplitude and the phase angle follow some random distributions [32,33]. In this work, we assumed that a(m,n) follows a random Gaussian distribution and follows a uniform Random distribution. Furthermore, a factor β to dampen the amplitudes of higher frequencies is introduced as follows [32]:
In Equation (11), g(m,n) follows a random Gaussian distribution function, and β is the spectral exponent. In this study, we artificially generated two sets of friction angle for the fault, as shown in Figure 11. It could be seen that with the higher spectral exponent, the generated data will be smoother since the influence of the higher frequencies will be more attenuated.
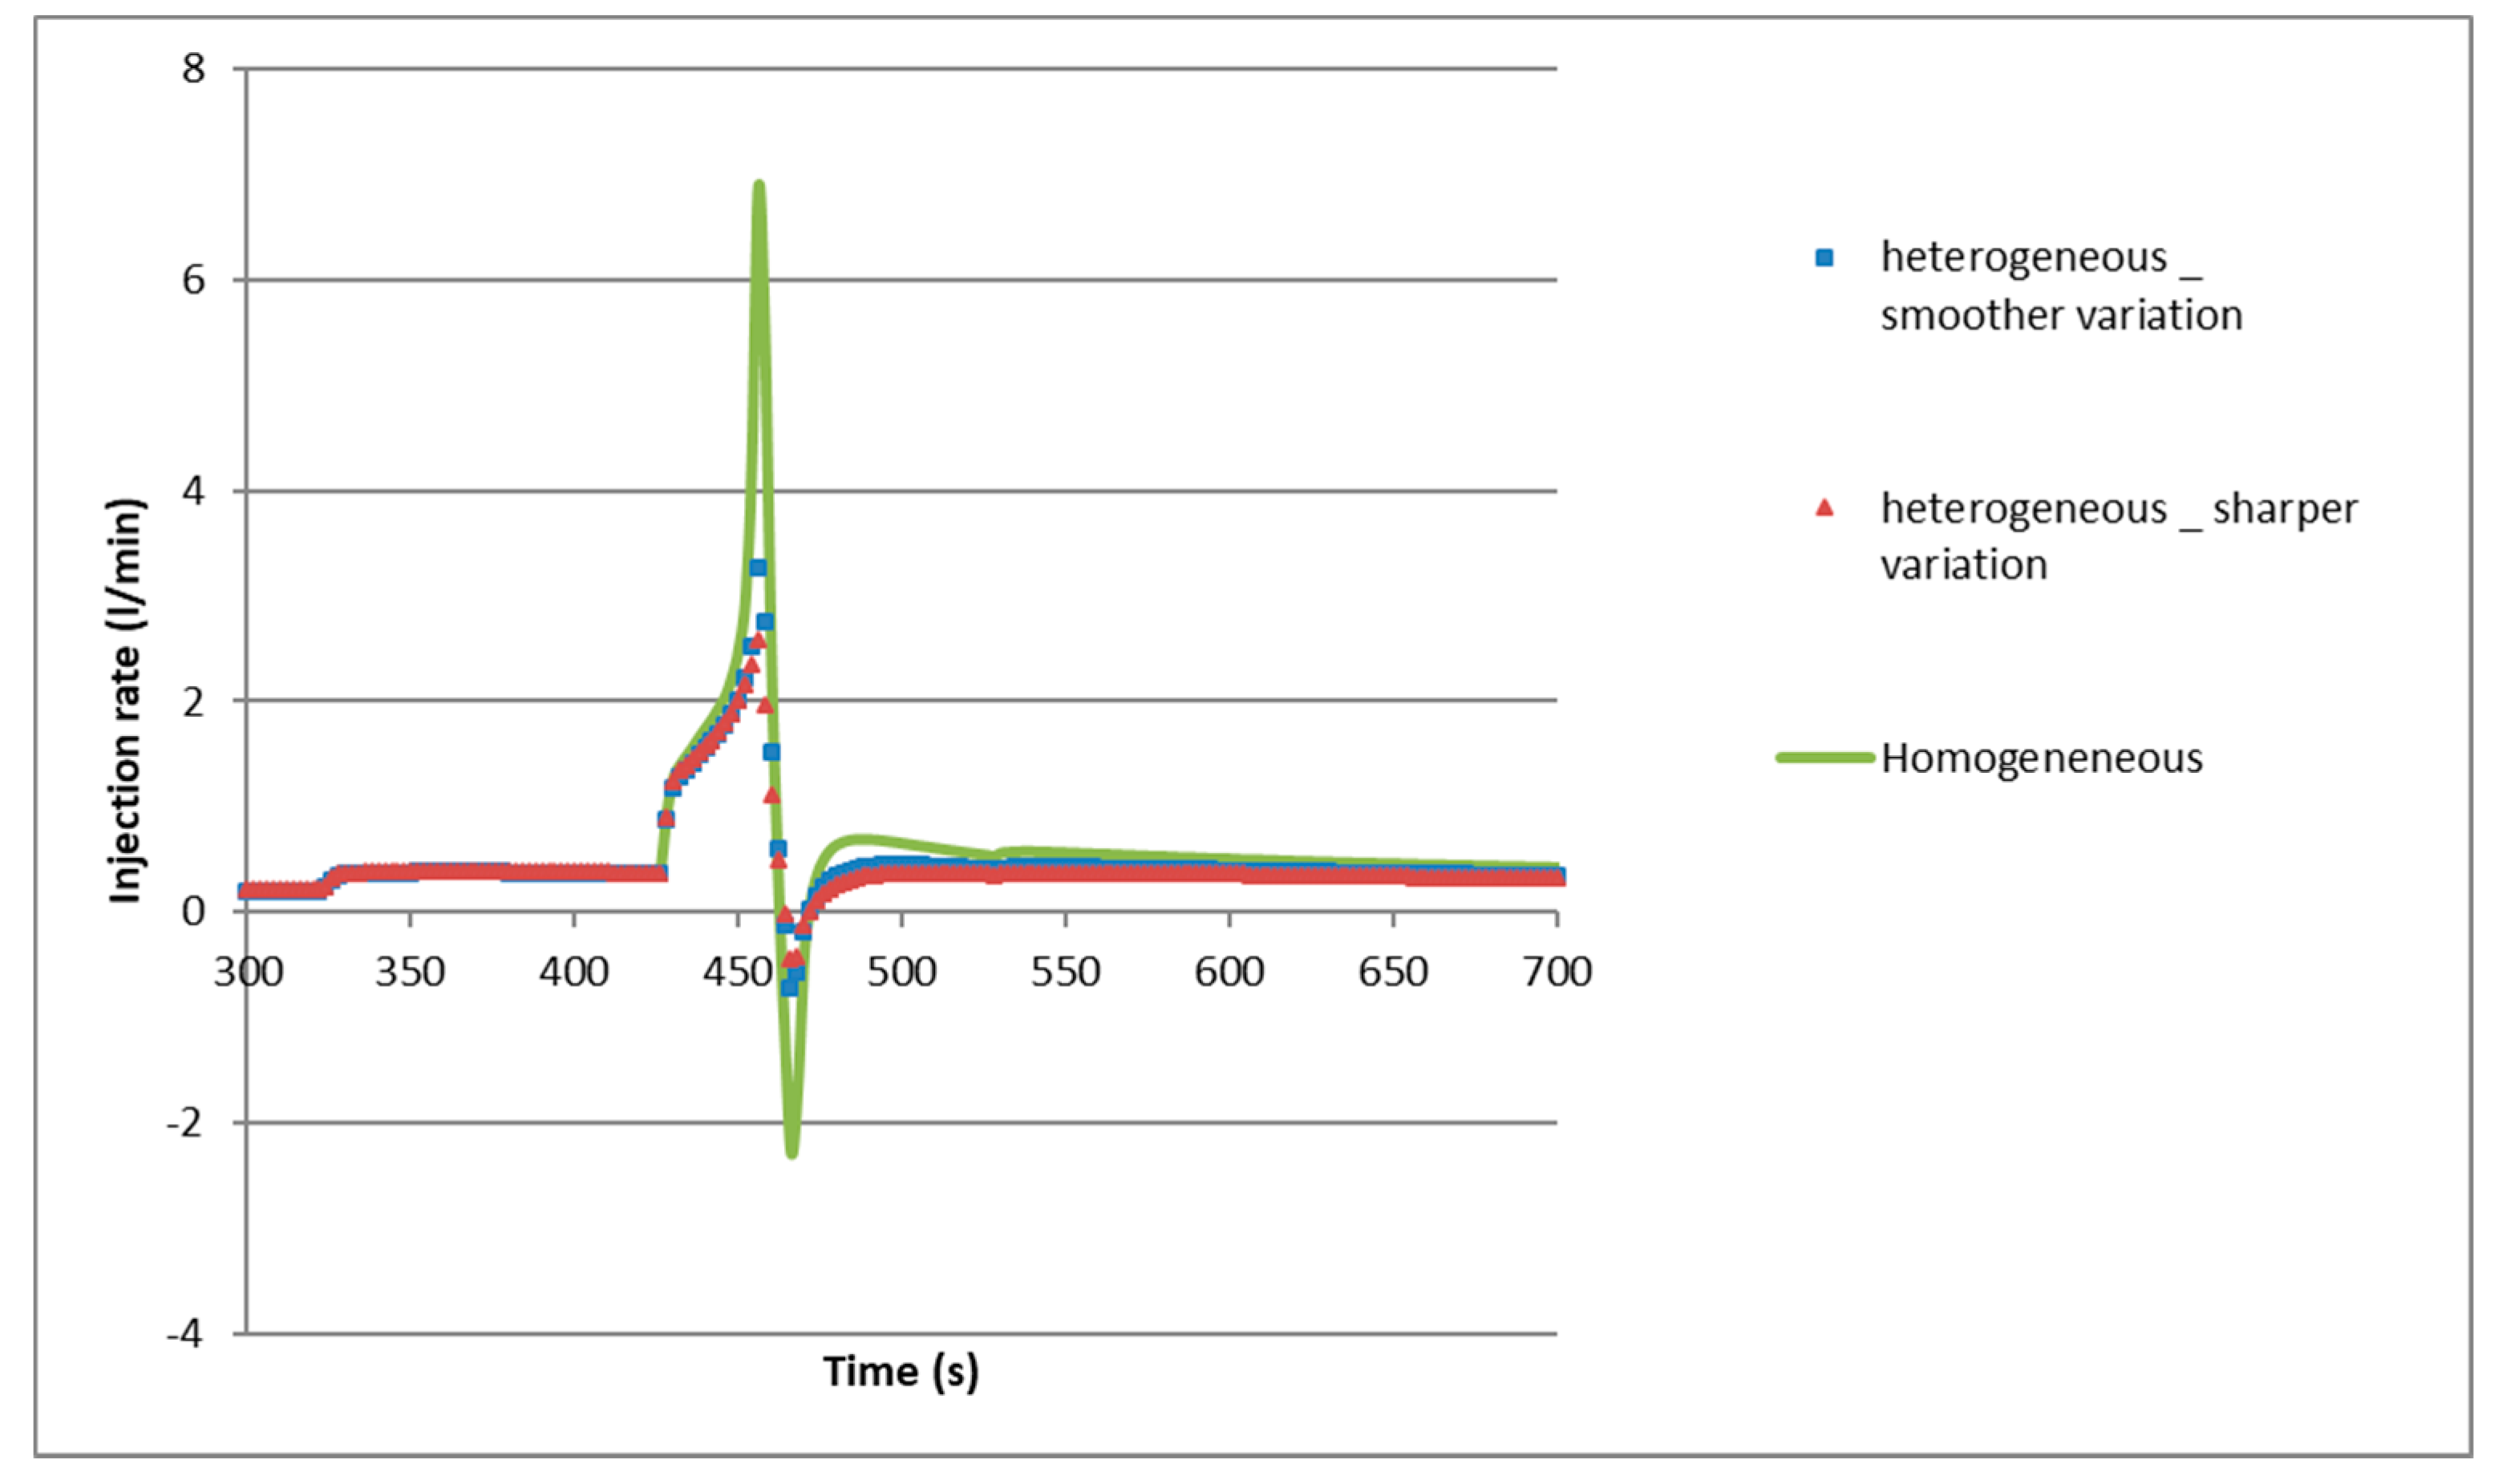
Figure 12 compares the injection rate for the three cases. Except for a lower predicted injection rate for the heterogeneous cases, the injected rate is comparable in terms of trends and timing between the heterogeneous and homogeneous cases.
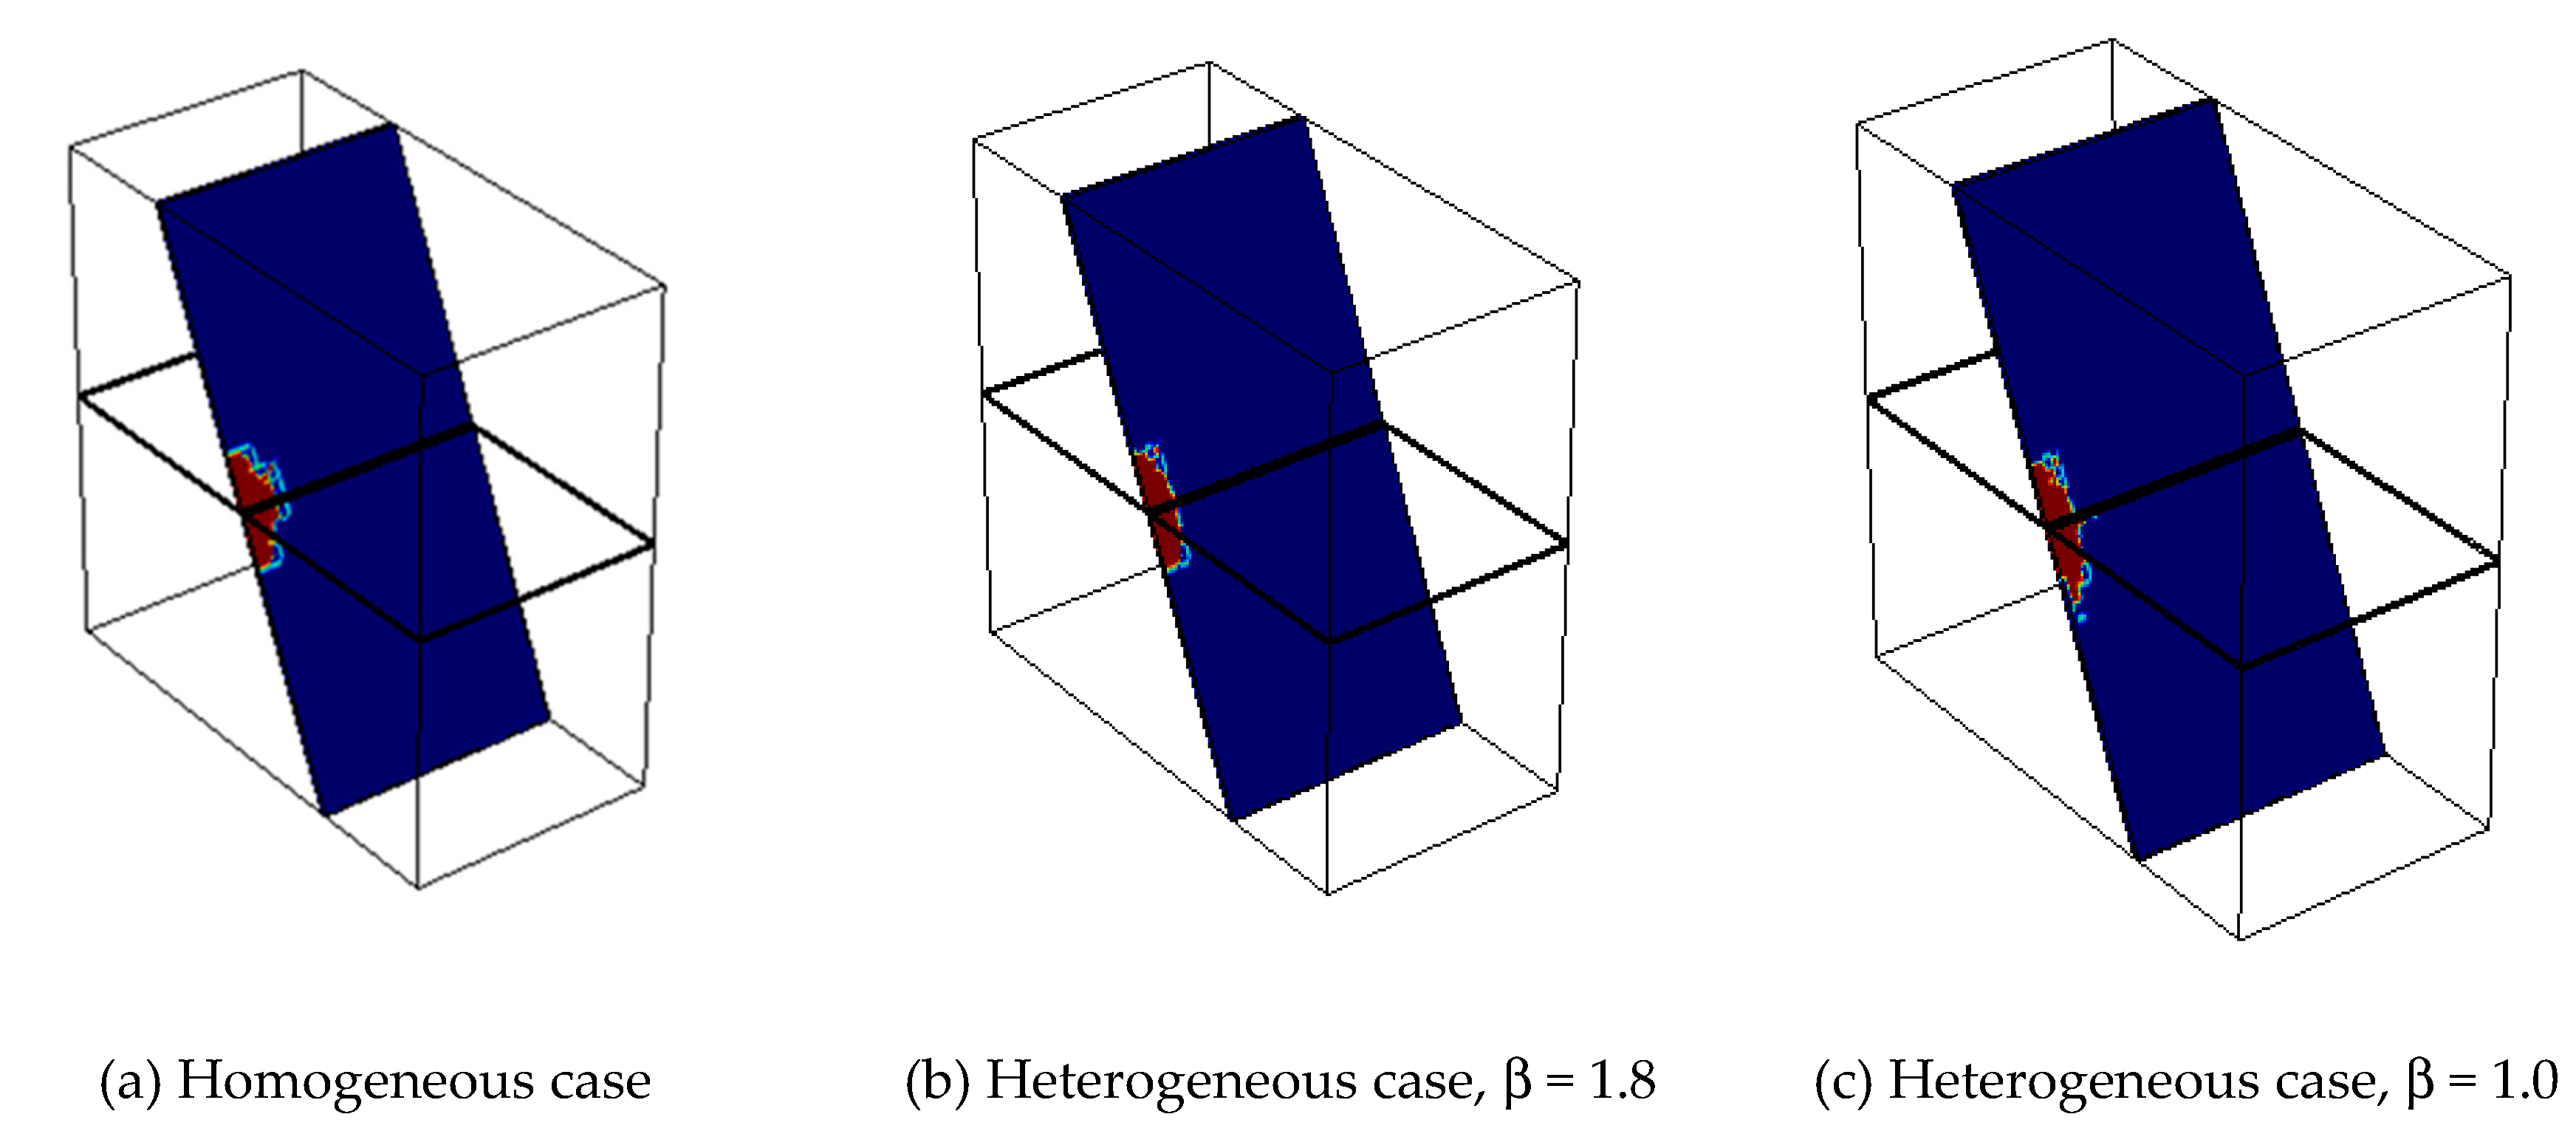
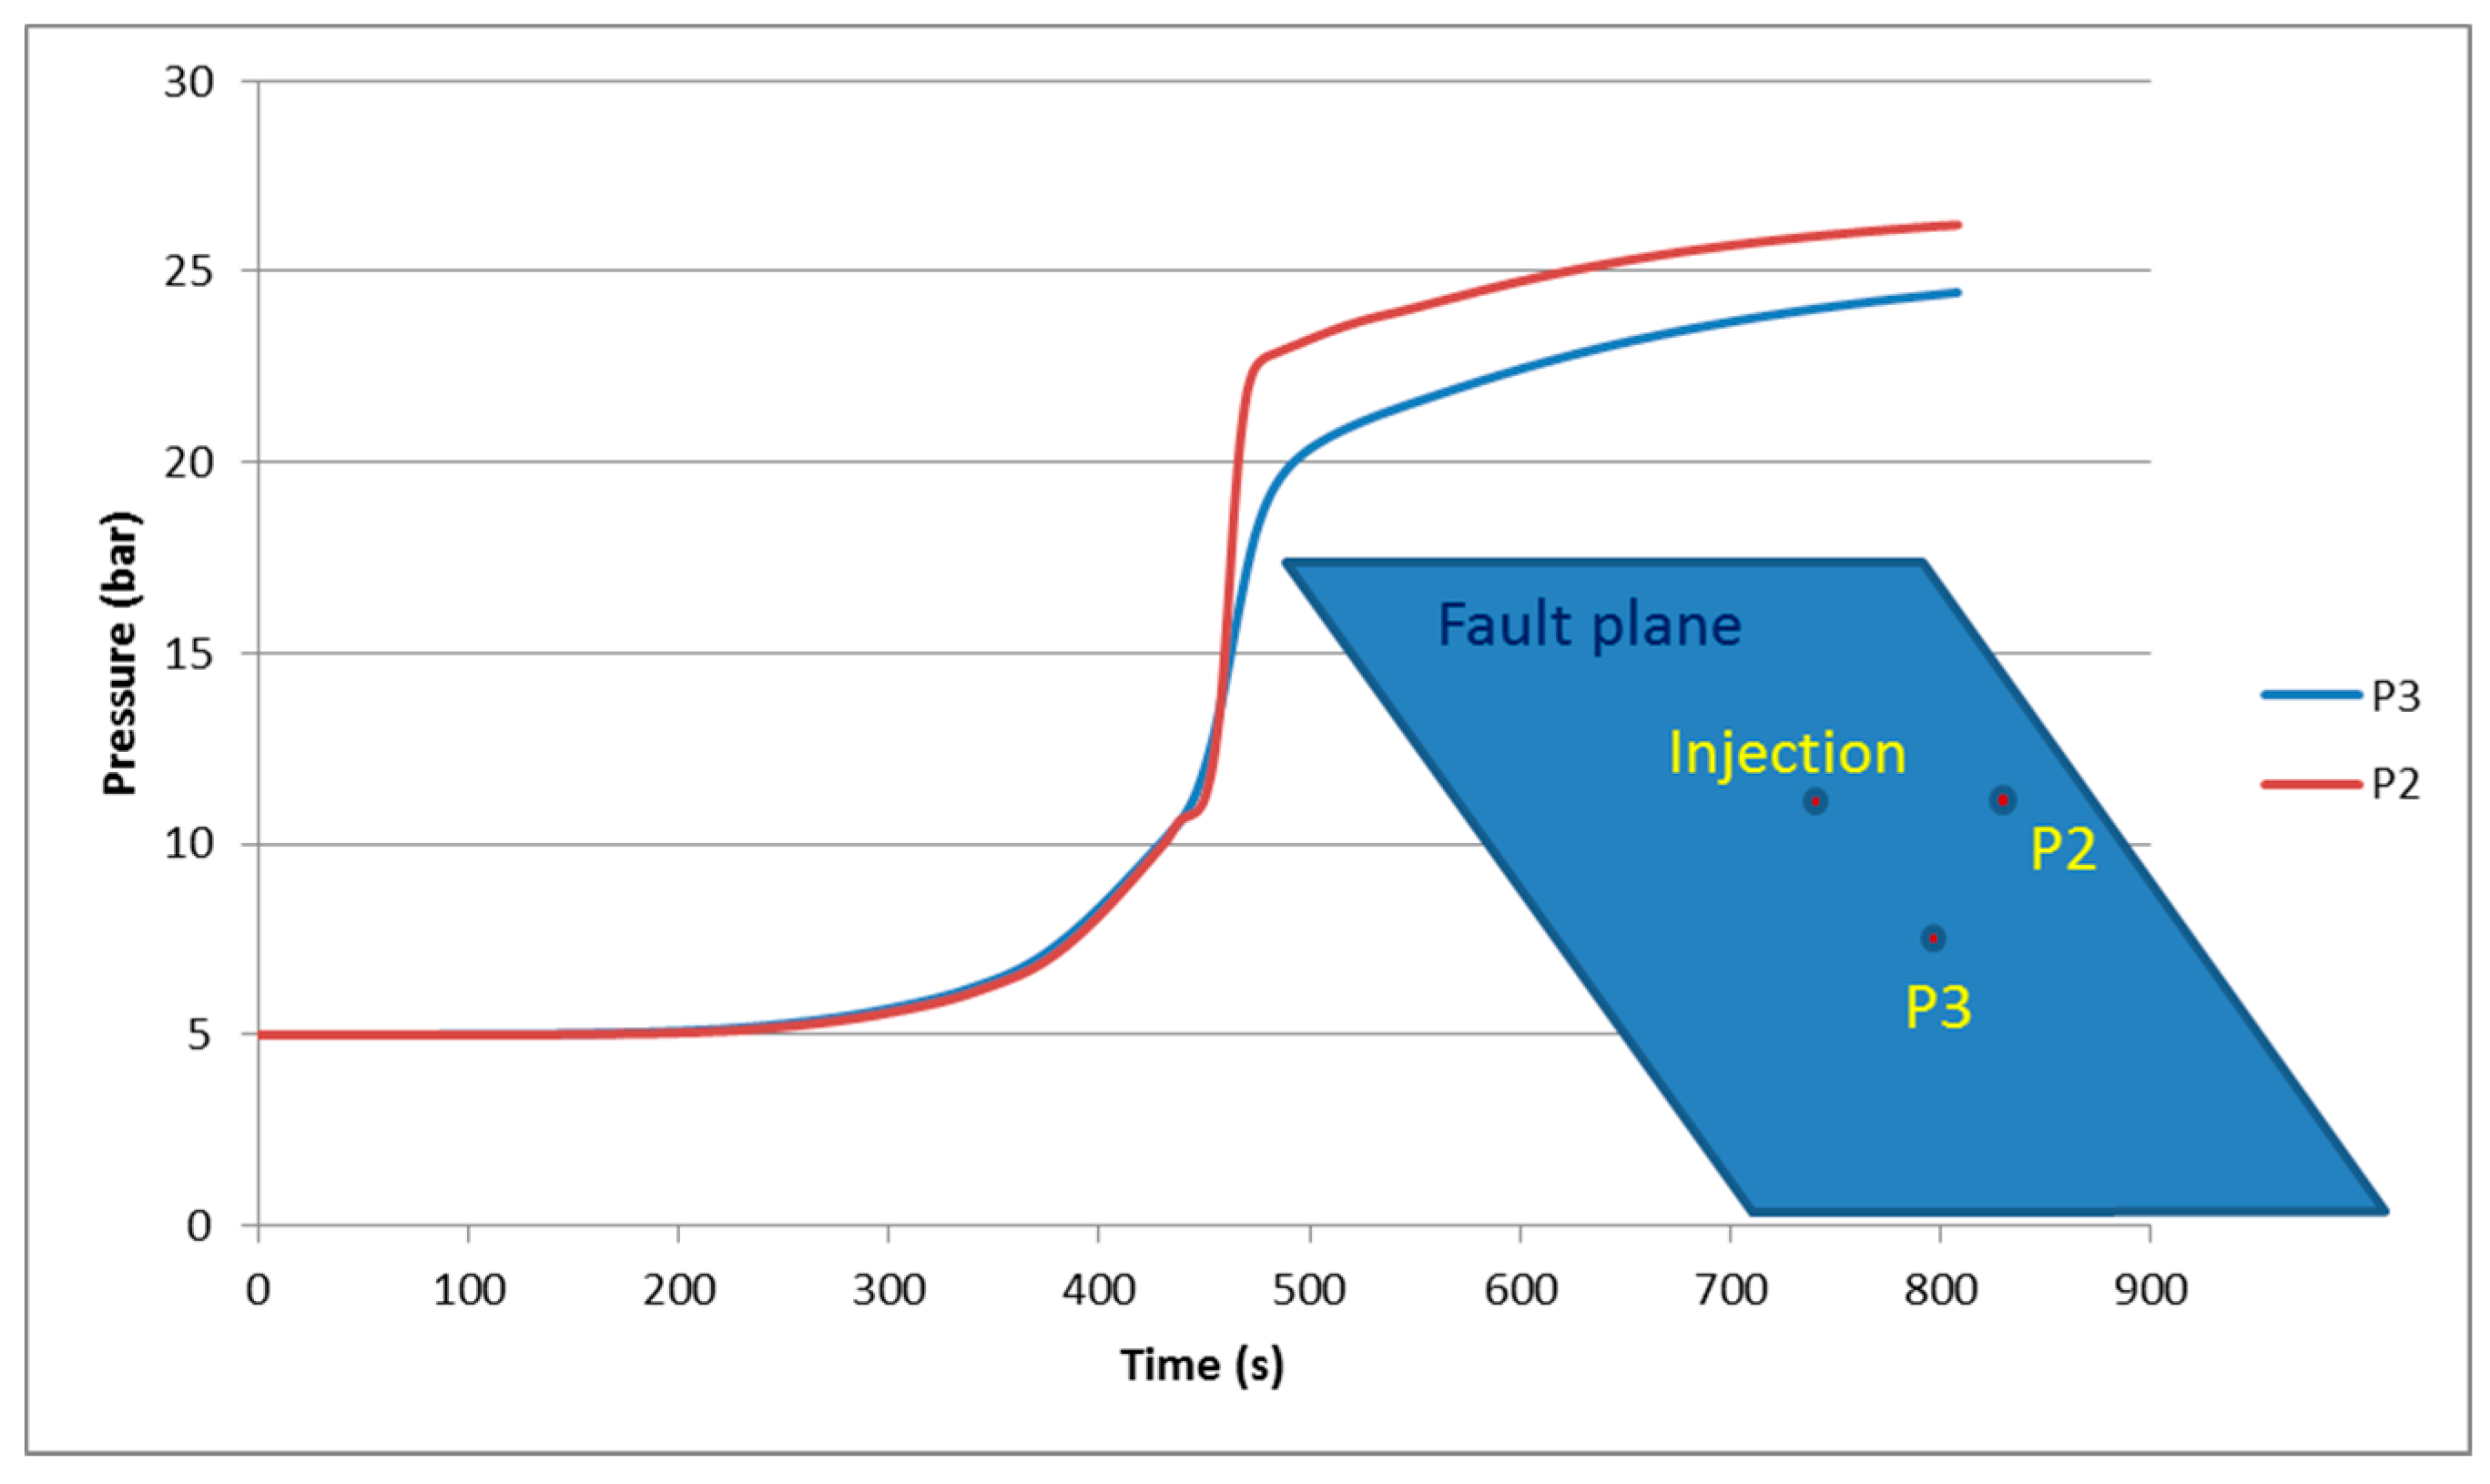
Figure 13 compares the extent of the fault failure between the homogeneous and heterogeneous cases with some noticeable differences being found. The effects of heterogeneity can be better appreciated by looking at the pressure response of two monitoring points at the same radial distance of 1.5 m from the injection point (Figure 14). P2 is on the fault at a horizontal distance of 1.5 m from the injection point, while P3 is situated at the same radial distance but down-dip of the fault. There is a substantial difference in the pressure response of the two monitoring points; this effect is observed in the field, both for the present experiment, and other similar ones in sedimentary argillaceous formations. It was also found that some monitoring points did not show any pressure response, while other points at similar radial distances showed strong responses [17]. The mathematical framework to simulate heterogeneity as described in this paper seems promising for the simulation of that observed phenomenon.
4.3. Effects of In-Situ Stress
The magnitudes of the in-situ stress tensor as measured in the field are lower than the ones assumed in the base case simulation. In the variant scenario considered here, it is assumed that the major, intermediate and minor principal stresses are, respectively:
σ1 = 6 MPa, σ2 = 4.2 MPa and σ3 = 3.3 MPa
The above values are within the range of the field measurements (Table 2). As in the base case (Figure 3), the major principal stress is assumed to be vertical; the intermediate principal stress is horizontal and oriented at N045°, and the minor principal stress is horizontal and oriented at N315°.
In order to ensure the initial stability of the fault, the shear strength parameters for the fault need to be increased, and the damage enhancement parameter A has to be decreased as follows:
Friction angle φ = 22° and cohesion c = 0.7 MPa; A = 15.
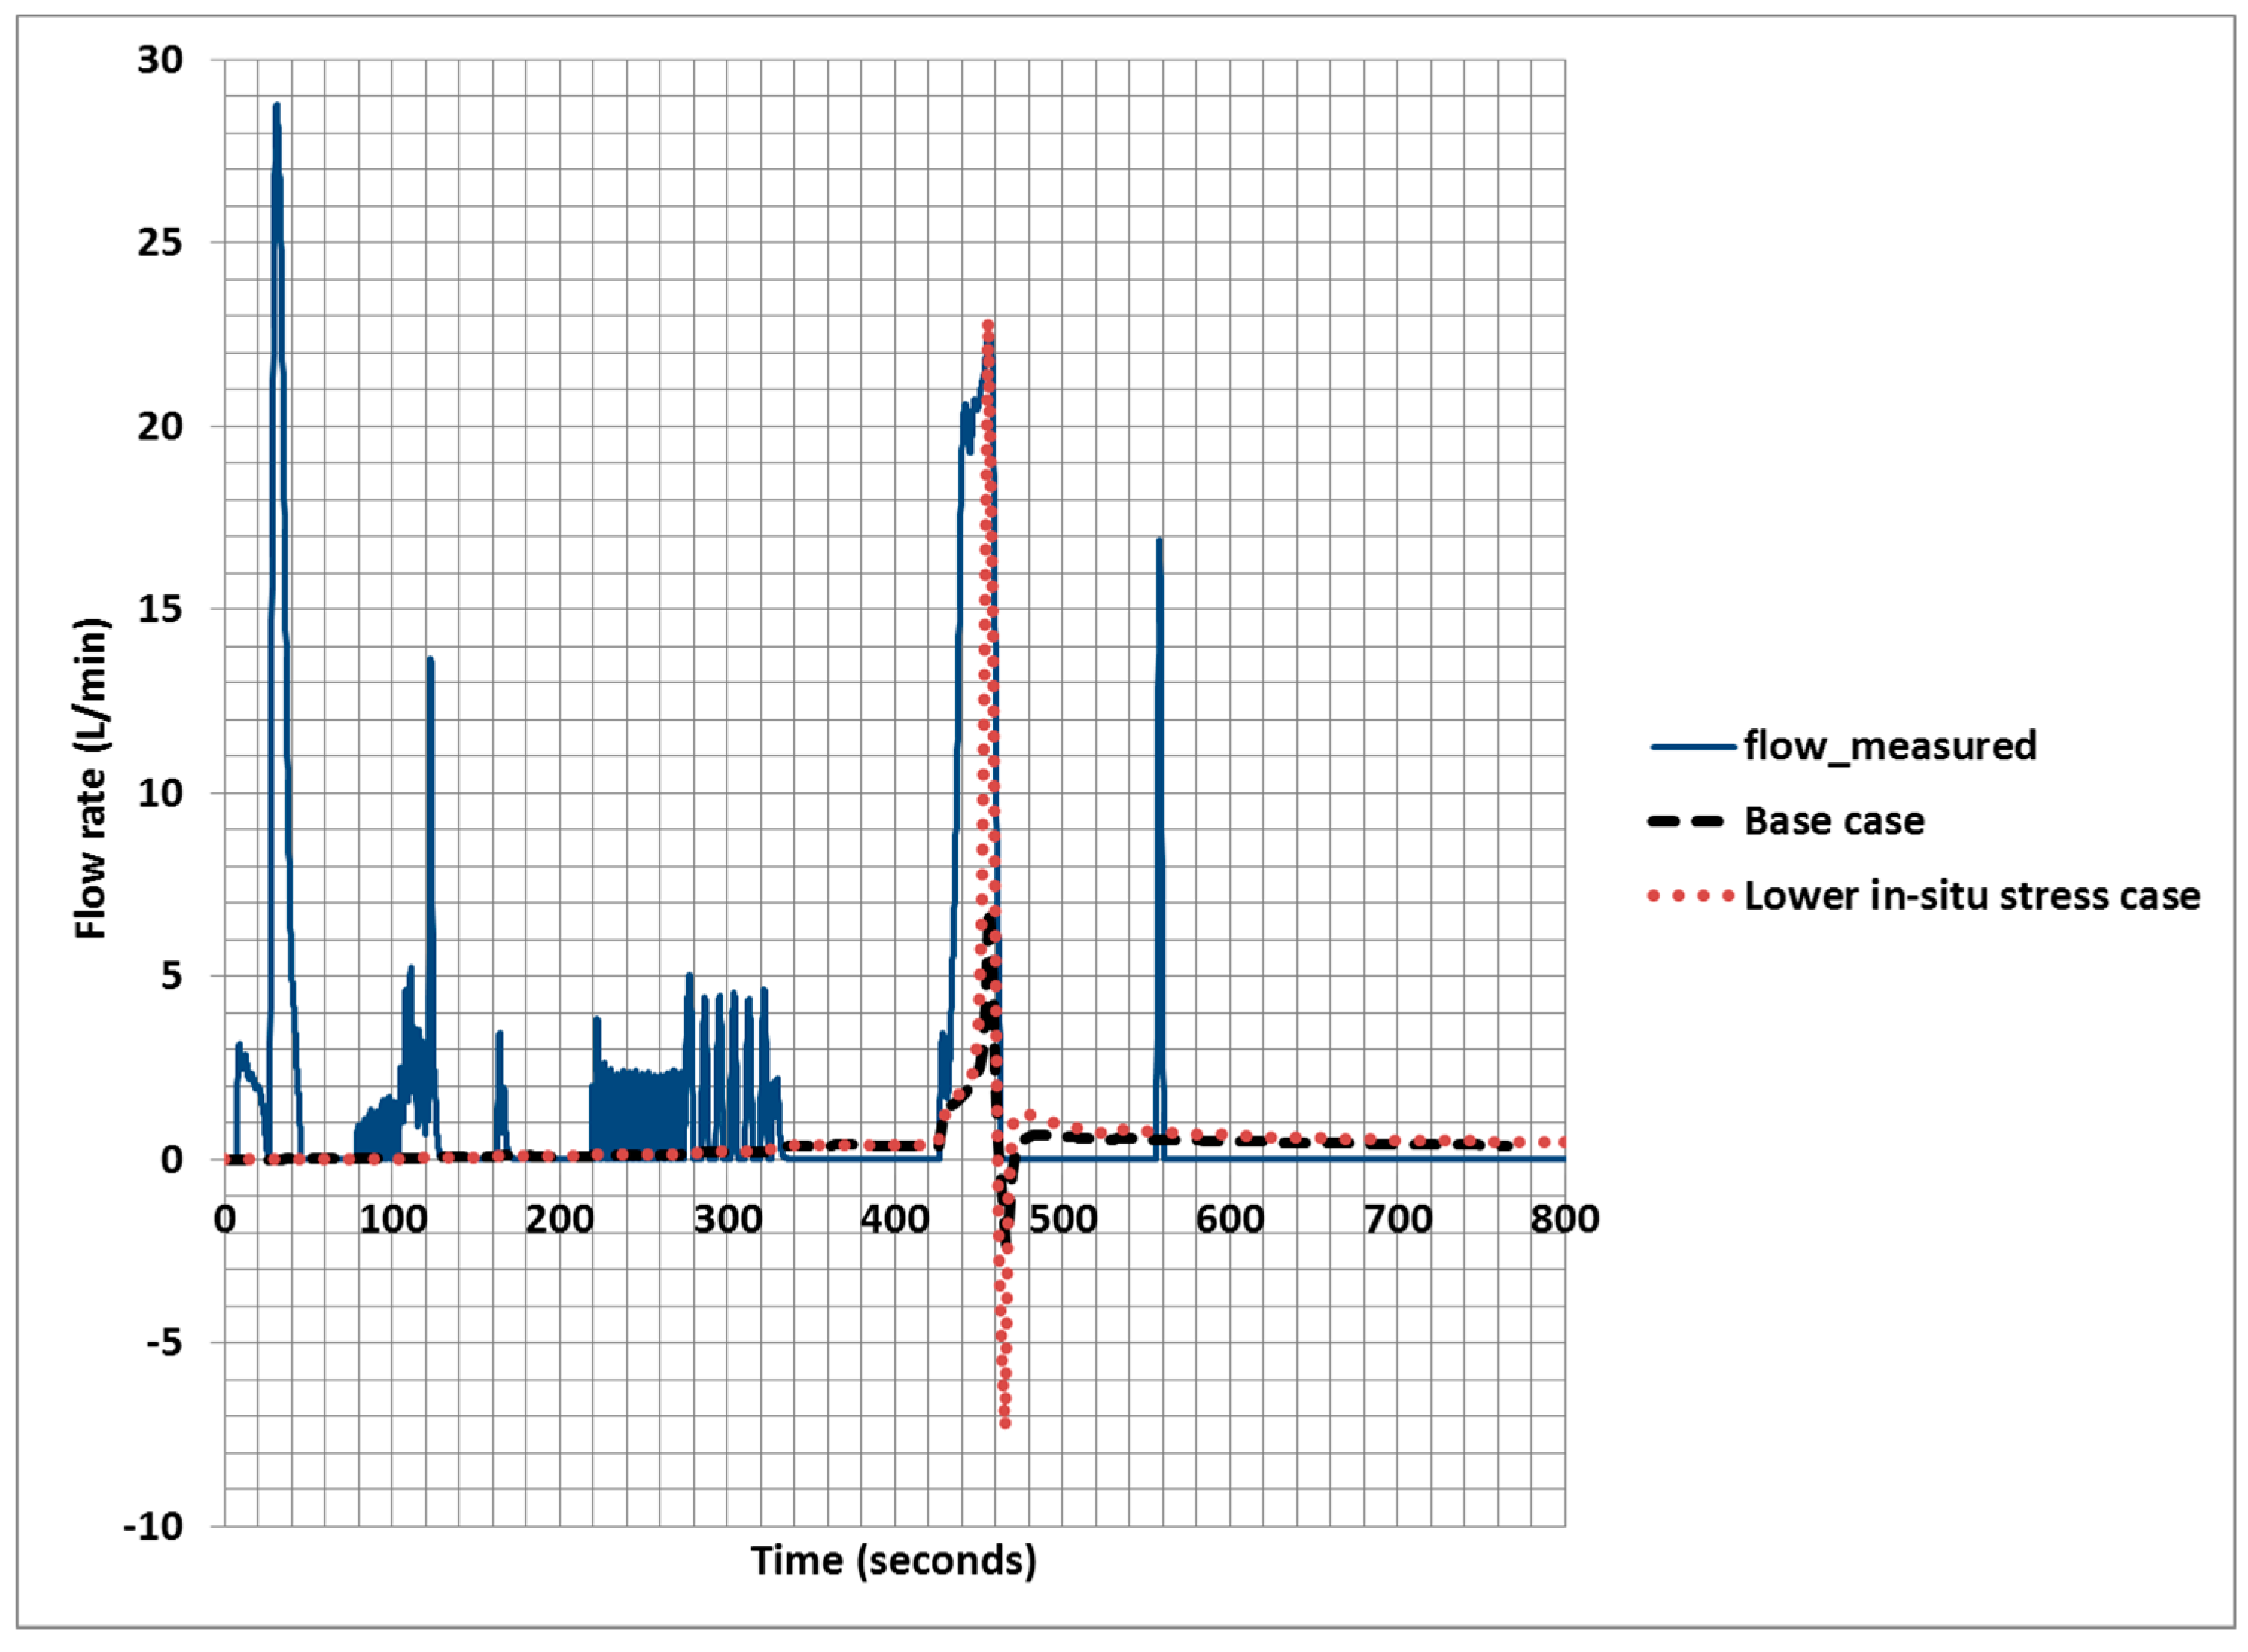
The simulated extent of fault failure is comparable to the one of the base case. The simulated injection rate shown in Figure 15 follows the same pattern as compared to the base case, with a higher peak value that is in better agreement with the measured value. However, compared to the base case simulation, the current case results in a more important overprediction of the relative displacement between the anchors at the injection point.
5. Conclusions
In this research we developed a mathematical model for fault reactivation due to pore pressure increase, based on the classical theory of poromechanics and Coulomb’s friction. A relationship for fault permeability evolution is proposed, taking into account fault movement and damage induced in the fault after failure. The model was used in the simulation of a controlled water injection experiment in a secondary fault in Opalinus Clay. It was shown that as the injection pressure increases, the effective stress in the fault near the injection point decreases leading to fault failure and a sharp increase in permeability. This phenomenon is accompanied by substantial increases in fault movement and injection rate, as well as the generation of a very small seismic event. The model correctly predicts the above processes that were recorded by the field instruments. We also performed a parametric study to examine the influence of fault shear strength and in-situ stress magnitude. We have found that the above factors are critical, and need to be adequately characterized in order to be able to predict the fault’s hydro-mechanical behaviour. It is commonly observed in many water injection experiments that monitoring points at similar distance from the injection points respond very differently; this phenomenon could be attributed to the pronounced heterogeneous nature of natural faults. In this research, we applied an algorithm to generate heterogeneous fault properties that shows good potential to replicate the above heterogeneous response.
The authors plan to further improve and validate the model to simulate the injection experiment for the Main Fault at the Mont Terri URL. Improvement to the model will include the consideration of anisotropy in both the host rock and the fault in both elastic and plastic domains. In this paper, many fault parameters, such as the friction angle, were derived through a calibration procedure because they were not readily available at the time this research was conducted. Recent experimental data for fault properties [7,8,9,10,11,12] will be used in future work. The conditions leading to the generation of seismic events, and estimates of their magnitudes will also be studied. Finally, scoping analyses would be performed to assess the influence of radiogenic heat and glacial meltwater recharge on faults near a hypothetical repository for radioactive waste.
Author Contributions
Conceptualization, T.S.N., J.R., Y.G. and B.G.; data curation, Y.G., J.R. and B.G.; investigation, T.S.N., J.R., Y.G. and B.G.; project administration, J.R. and B.G.; software, T.S.N.; writing—original draft, T.S.N.; writing—review and editing, T.S.N., J.R. and Y.G.
Funding
Funding was provided by CNSC and ENSI for CNSC and ENSI authors. LBNL authors were funded by ENSI for technical task lead within the DECOVALEX-2019 as part of Work for Others funding, provided by the Director, Office of Science, of the U.S. Department of Energy under Contract No. DE-AC02-05CH11231. Additional funding to LBNL authors for experimental data analysis was provided by the Spent Fuel and Waste Science and Technology, Office of Nuclear Energy, of the U.S. Department of Energy under Contract Number DE-AC02-05CH11231 with Lawrence Berkeley National Laboratory.
Acknowledgments
The work presented in this paper result from the authors’ participation in the DECOVALEX project. The project is an international research project comprising participants from industry, government and academia, focusing on development of understanding, models and codes in complex coupled problems in sub-surface geological and engineering applications; DECOVALEX-2019 is the current phase of the project. The authors appreciate and thank the DECOVALEX-2019 Funding Organizations Andra, BGR/UFZ, CNSC, US DOE, ENSI, JAEA, IRSN, KAERI, NWMO, RWM, SÚRAO, SSM and Taipower for their financial and technical support of the work described in this paper. The statements made in the paper are, however, solely those of the authors and do not necessarily reflect those of the funding organisations. The data used in this paper originated from the FS experiment conducted in the Mont Terri rock laboratory between June and November 2015. The experiment partners swisstopo, ENSI, JAEA and US DOE are thanked for their technical support and their funding.
Conflicts of Interest
There is no known conflicts of interest.
References
- McGarr, A.; Bekins, B.; Burkhardt, N.; Dewey, J.; Earle, P.; Ellsworth, W.; Ge, S.; Hickman, S.; Holland, A.; Majer, E.; et al. Coping with earthquakes induced by fluid injection. Science 2015, 347, 830–831. [Google Scholar] [CrossRef]
- Zhao, H.; Ma, F.; Liu, G.; Feng, X.; Guo, J. Analytical investigation of hydraulic fracture-induced seismicity and fault activation. Environ. Earth Sci. 2018, 77, 526. [Google Scholar] [CrossRef]
- Noronha, J. Deep Geological Repository Design Report—Crystalline/Sedimentary Rock environment; Report APM-REP-00440-0015 R001; Nuclear Waste Management Organization: Toronto, ON, Canada, 2016; Available online: https://www.nwmo.ca/en/Reports (accessed on 6 May 2019).
- Posiva, O. Safety Case for the Disposal of Spent Nuclear Fuel at Olkiluoto—Synthesis 2012. Posiva Oy 2012. Report POSIVA 2012-12. Available online: http://www.posiva.fi/en/final_disposal/safety/the_safety_case#.W_cCPrCoszs (accessed on 6 May 2019).
- ANDRA. Dossier options de Surete−Partie apres Fermeture. ANDRA 2016. Identification CG-TE-D-NTE-AMOA-SR2-0000-15-0062/A. Available online: https://www.andra.fr/cigeo/les-documents-de-reference (accessed on 6 May 2019).
- Kanamori, H. Energy budget of earthquakes and seismic efficiency. Int. Geophys. 2001, 76, 293–305. [Google Scholar] [CrossRef]
- Behnsen, J.; Faulkner, D. The effect of mineralogy and effective normal stress on frictional strength of sheet silicates. J. Struct. Geol. 2012, 4, 49–61. [Google Scholar] [CrossRef]
- Orellana, L.F.; Scuderi, M.M.; Collettini, C.; Violay, M. Do scaly clays control seismicity on faulted shale rocks? Earth Planet. Sci. Lett. 2018, 488, 59–67. [Google Scholar] [CrossRef]
- Orellana, L.F.; Scuderi, M.M.; Collettini, C.; Violay, M. Frictional Properties of Opalinus Clay: Implications for Nuclear Waste Storage. J. Geophys. Res. Solid Earth 2018, 123, 157–175. [Google Scholar] [CrossRef]
- Rutter, E.H.; Mecklenburgh, J. Influence of Normal and Shear Stress on the Hydraulic Transmissivity of Thin Cracks in a Tight Quartz Sandstone, a Granite, and a Shale. J. Geophys. Res. Solid Earth 2018, 123, 1262–1285. [Google Scholar] [CrossRef] [Green Version]
- Scuderi, M.M.; Collettini, C. Fluid Injection and the Mechanics of Frictional Stability of Shale-Bearing Faults. J. Geophys. Res. Solid Earth 2018, 123, 8364–8384. [Google Scholar] [CrossRef]
- Orellana, L.F.; Giorgetti, C.; Violay, M. Contrasting mechanical and hydraulic properties of wet and dry fault zones in a proposed shale-hosted nuclear waste repository. Geophys. Res. Lett. 2019, 46, 1357–1366. [Google Scholar] [CrossRef]
- Rutqvist, J.; Rinaldi, A.P.; Cappa, F.; Jeanne, P.; Mazzoldi, A.; Urpi, L.; GuGlielmi, Y.; Villarrasa, V. Fault activation and induced seismicity in geological carbon storage—Lesson learned from recent modeling studies. J. Rock Mech. Geotech. Eng. 2016, 8, 789–804. [Google Scholar] [CrossRef]
- Eaton, D.W.; Schultz, R. Increased likelihood of induced seismicity in highly overpressured shale formations. Geophys. J. Int. 2018, 214, 751–757. [Google Scholar] [CrossRef]
- Ellsworth, W. Injection-induced earthquakes. Science 2013, 341, 142–149. [Google Scholar] [CrossRef] [PubMed]
- Guglielmi, Y.; Cappa, F.; Avouac, J.P.; Henry, P.; Elsworth, D. Seismicity triggered by fluid injection-induced aseismic slip. Science 2015, 348, 1224–1226. [Google Scholar] [CrossRef] [PubMed] [Green Version]
- Guglielmi, Y.; Elsworth, D.; Cappa, F.; Henry, P.; Gout, C.; Dick, P.; Durand, J. In situ observations on the coupling between hydraulic diffusivity and displacements during fault reactivation in shales. J. Geophys. Res. 2015, 120, 7729–7748. [Google Scholar] [CrossRef]
- Guglielmi, Y.; Henry, P.; Nussbaum, C.; Dick, P.; Gout, C.; Amann, F. Underground Research Laboratories for Conducting Fault Activation Experiments in Shales. In Proceedings of the 49th U.S. Rock Mechanics/Geomechanics Symposium, San Francisco, CA, USA, 28 June–1 July 2015. [Google Scholar]
- Guglielmi, Y.; Birkholtzer, J.; Rutqvist, J.; Jeanne, P.; Nussbaum, C. Can fault leakage occur before or without reactivation? Results from an in-situ reactivation at Mont Terri. Energy Procedia 2017, 114, 3167–3174. [Google Scholar] [CrossRef]
- Thury, M.; Bossart, P. The Mont Terri rock laboratory, a new international research project in a Mesozoic shale formation, in Switzerland. Eng. Geol. 1999, 52, 347–359. [Google Scholar] [CrossRef]
- Bossart, P.; Bernier, F.; Birkholzer, J.; Bruggeman, C.; Connolly, P.; Dewonck, S.; Fukaya, M.; Herfort, M.; Jensen, M.; Matray, J.-M.; et al. Mont Terri rock laboratory, 20 years of research: Introduction, site characteristics and overview of experiments. Swiss J. Geosci. 2017, 110, 3–22. [Google Scholar] [CrossRef]
- Jaegg, D.; Laurich, B.; Nussbaum, C.; Sschuster, K.; Connolly, P. Tectonic structure of the “Main Fault” in the Opalinus Clay, Mont Terri rock laboratory (Switzerland). Swiss J. Geosci. 2017. [Google Scholar] [CrossRef]
- Laurich, B.; Urai, J.L.; Desbois, G.; Vollmer, C.; Nussbaum, C. Microstructural evolution of an incipient fault zone in Opalinus Clay: Insights from an optical and electron microscopic study of ion-beam polished samples from the Main Fault in the Mt-Terri Underground Research Laboratory. J. Struct. Geol. 2014, 67, 107–128. [Google Scholar] [CrossRef]
- Laurich, B.; Urai, J.L.; Nussbaum, C. Microstructures and deformation mechanisms in Opalinus Clay: Insights from scaly clay from the Main Fault in the Mont Terri Rock Laboratory (CH). Solid Earth 2017, 8, 27–44. [Google Scholar] [CrossRef]
- Nussbaum, C.; Kloppenburg, A.; Caër, T.; Bossart, P. Tectonic evolution around the Mont Terri rock laboratory, northwestern Swiss Jura: Constraints from kinematic forward modelling. Swiss J. Geosci. 2017, 110, 39–66. [Google Scholar] [CrossRef]
- Nussbaum, C.; Bossart, P.; Amann, F.; Aubourg, C. Analysis of tectonic structures and excavation induced fractures in the Opalinus Clay, Mont Terri underground rock laboratory (Switzerland). Swiss J. Geosci. 2011, 104, 187–210. [Google Scholar] [CrossRef]
- Guglielmi, Y.; Cappa, F.; Lançon, H.; Janowczyk, J.B.; Rutqvist, J.; Tsang, C.F.; Wang, J.S.Y. ISRM Suggested Method for Step-Rate Injection Method for Fracture In-Situ Properties (SIMFIP): Using a 3-Components Borehole Deformation Sensor. Rock Mech. Rock Eng. 2013, 47, 303–311. [Google Scholar] [CrossRef]
- Zimmerman, R.W.; Bodvarsson, G.S. Hydraulic Conductivity of Rock Fractures; Report LBL-35976; Earth Sciences Division, Lawrence Berkeley Laboratory: Berkeley, CA, USA, 1994.
- Gens, A.; Vaunat, J.; Garitte, B.; Wileveau, Y. In-situ behaviour of a stiff layered clay subject to thermal loading: Observations and interpretation. Geotechnique 2007, 57, 207–228. [Google Scholar] [CrossRef]
- Corkum, A.; Martin, D. The mechanical behavior of weak mudstone (Opalinus Clay) at low stresses. Int. J. Rock Mech. Min. Sci. 2007, 44, 196–209. [Google Scholar] [CrossRef]
- Martin, C.D.; Lanyon, G.W. Measurement of in-situ stress in weak rocks at Mont Terri Rock Laboratory, Switzerland. Int. J. Rock Mech. Min. Sci. 2003, 40, 1077–1088. [Google Scholar] [CrossRef]
- Sjodin, B. How to Generate Random Surfaces in COMSOL Multiphysics®, COMSOL blog. Available online: https://www.comsol.com/blogs/how-to-generate-random-surfaces-in-comsol-multiphysics/ (accessed on 6 May 2019).
- Peitgen, H.O.; Saupe, D. The Science of Fractal Images; Springer-Verlag: New York, NY, USA, 1988. [Google Scholar]
Figure 1.
Geological cross-section along the Mont Terri Underground Research Laboratory (adapted from [26]).
Figure 1.
Geological cross-section along the Mont Terri Underground Research Laboratory (adapted from [26]).

Figure 2.
Cross Section along Main Fault and the secondary faults showing the location of the packed-off injection chambers. The packed-off intervals are equipped with the HPPP apparatus, which measures relative displacements in three directions. Seismic events are also measured at the locations shown in red. (a) Geological section through the Main Fault and secondary faults. (b) Packed-off section.

Figure 3.
Numerical model and boundary conditions for water injection in secondary fault. The model dimensions are 10 m × 20 m × 20 m.
Figure 3.
Numerical model and boundary conditions for water injection in secondary fault. The model dimensions are 10 m × 20 m × 20 m.

Figure 4.
Comparison of calculated and measured fault displacement at injection point. Fault movement is clearly shown to be correlated to the injection pressure, but not in a proportional manner.
Figure 4.
Comparison of calculated and measured fault displacement at injection point. Fault movement is clearly shown to be correlated to the injection pressure, but not in a proportional manner.

Figure 5.
Fault failure and opening and permeability at highest injection pressure. (a) The deformed shape is shown with a high degree of exaggeration. The failure zone is shown in red and corresponds to the largest opening of the fault. (b) The distribution of permeability parallel to the fault plane is shown in log scale.

Figure 6.
Comparison of simulated and measure injection flow rate.

Figure 7.
Comparison of simulated at measured pressure response at monitoring point.

Figure 8.
Comparison of injection rate for different fault shear strength parameters.

Figure 9.
Effect of friction angle on extent of fault failure.

Figure 10.
Elastic energy stored in the fault during the injection test.

Figure 11.
Artificial generation of friction angle for heterogeneous fault. The contours of generated values are in o.
Figure 11.
Artificial generation of friction angle for heterogeneous fault. The contours of generated values are in o.

Figure 12.
Comparison of injection rate between homogeneous and heterogeneous cases.

Figure 13.
Extent of fault failure; comparison between homogeneous and heterogeneous case. The red colour shows the failure zone in the fault.
Figure 13.
Extent of fault failure; comparison between homogeneous and heterogeneous case. The red colour shows the failure zone in the fault.

Figure 14.
Effect of heterogeneity on pressure response (β = 1.8).

Figure 15.
Effect of lower in-situ stress on injection flow rate.


Table 1.
Assumed input properties.
| Property | Rock Mass | Fault |
|---|---|---|
| Young’s modulus | 6.3 GPa | 12 GPa perpendicular to fault 60 GPa parallel to fault plane |
| Poisson ratio | 0.32 | |
| Shear modulus | 4 GPa (for shear movement between fault walls) 30 GPa (for shear in fault plane) | |
| Permeability | 10−20 m2 | 10−20 m2 for flow perpendicular to fault Equations (3) and (4) for flow parallel to fault plane |
| Friction angle | 22° | |
| Cohesion | 0 | |
| Dilation angle | 17° | |
| Initial fracture hydraulic aperture | 5 mm | |
| Fracture spacing | 1.66 cm | |
| Fault thickness | 20 cm | |
| Damage enhancement Factor A | 28 [-] |
© 2019 by the authors. Licensee MDPI, Basel, Switzerland. This article is an open access article distributed under the terms and conditions of the Creative Commons Attribution (CC BY) license (http://creativecommons.org/licenses/by/4.0/).
Share and Cite
MDPI and ACS Style
Nguyen, T.S.; Guglielmi, Y.; Graupner, B.; Rutqvist, J. Mathematical Modelling of Fault Reactivation Induced by Water Injection. Minerals 2019, 9, 282. https://doi.org/10.3390/min9050282
AMA Style
Nguyen TS, Guglielmi Y, Graupner B, Rutqvist J. Mathematical Modelling of Fault Reactivation Induced by Water Injection. Minerals. 2019; 9(5):282. https://doi.org/10.3390/min9050282
Chicago/Turabian StyleNguyen, Thanh Son, Yves Guglielmi, Bastian Graupner, and Jonny Rutqvist. 2019. "Mathematical Modelling of Fault Reactivation Induced by Water Injection" Minerals 9, no. 5: 282. https://doi.org/10.3390/min9050282
Note that from the first issue of 2016, this journal uses article numbers instead of page numbers. See further details here.