Article

Nanoscale Structure of Zoned Laurites from the Ojén Ultramafic Massif, Southern Spain

by
Sandra Baurier-Aymat
1,
Abigail Jiménez-Franco
1,2,3,*,
Josep Roqué-Rosell
1,2,
José María González-Jiménez
4,
Fernando Gervilla
4,5,
Joaquín A. Proenza
1,2,
Joan Mendoza
6 and
Fernando Nieto
4,5
1
Departament de Mineralogia, Petrologia i Geologia Aplicada, Universitat de Barcelona, Marti i Franquès s/n, 08028 Barcelona, Spain
2
Institut de Nanociència i Nanotecnologia, IN2UB Facultat de Química, Universitat de Barcelona Av. Diagonal 645, 08028 Barcelona, Spain
3
Posgrado en Ciencias de la Tierra, Universidad Nacional Autónoma de México, Ciudad Universitaria, Delegación Coyoacán, 04510 Cd. de México, Mexico
4
Departamento de Mineralogía y Petrología, Facultad de Ciencias, Universidad de Granada, Avda. Fuentenueva s/n, 18002 Granada, Spain
5
Instituto Andaluz de Ciencias de la Tierra (IACT), CSIC-UGR, Avda. de las Palmeras 4, 18100 Armilla, Granada, Spain
6
Centres Científics i Tecnològics, Universitat de Barcelona, Lluís Solé i Sabarís, 1-3, 08028 Barcelona, Spain
*
Author to whom correspondence should be addressed.
Minerals 2019, 9(5), 288; https://doi.org/10.3390/min9050288
Submission received: 17 April 2019 / Revised: 7 May 2019 / Accepted: 8 May 2019 / Published: 11 May 2019
(This article belongs to the Special Issue Minerals Down to the Nanoscale: A Glimpse at Ore-Forming Processes)

Abstract

:
We report the first results of a combined focused ion beam and high-resolution transmission electron microscopy (FIB/HRTEM) investigation of zoned laurite (RuS2)-erlichmanite (OS2) in mantle-hosted chromitites. These platinum-group minerals form isolated inclusions (<50 µm across) within larger crystals of unaltered chromite form the Ojén ultramafic massif (southern Spain). High-magnification electron microscopy (HMEM), high angle-annular dark field (HAADF) and precession electron diffraction (PED) data revealed that microscale normal zoning in laurite consisting of Os-poor core and Os-rich rims observed by conventional micro-analytical techniques like field emission scanning electron microscope and electron microprobe analysis (FE-SEM and EPMA) exist at the nanoscale approach in single laurite crystals. At the nanoscale, Os poor cores consist of relatively homogenous pure laurite (RuS2) lacking defects in the crystal lattice, whereas the Os-richer rim consists of homogenous laurite matrix hosting fringes (10–20 nm thickness) of almost pure erlichmanite (OsS2). Core-to-rim microscale zoning in laurite reflects a nonequilibrium during laurite crystal growth, which hampered the intra-crystalline diffusion of Os. The origin of zoning in laurite is related to the formation of the chromitites in the Earth’s upper mantle but fast cooling of the chromite-laurite magmatic system associated to fast exhumation of the rocks would prevent the effective dissolution of Os in the laurite even at high temperatures (~1200 °C), allowing the formation/preservation of nanoscale domains of erlichmanite in laurite. Our observation highlights for the first time the importance of nanoscale studies for a better understanding of the genesis of platinum-group minerals in magmatic ore-forming systems.

1. Introduction

The platinum-group minerals (PGM) include a group of minerals that concentrate the six platinum-group elements (PGE; Os, Ir, Ru, Rh, Pt, and Pd). Among these minerals, the members of the laurite solid solution series; laurite (RuS2)-erlichmanite (OsS2) are the most abundant, particularly in chromite ores (s.l. chromitites) associated to ultramafic rocks from the upper oceanic and subcontinental lithospheric mantle (SCLM) [1]. Representing >75% of the PGM documented in these types of ore, these grains of laurite-erlichmanite in the mantle-hosted chromitites are found as tiny (<25 µm across) solid inclusions forming anhedral to euhedral crystals, in single or composite aggregates, associated with other PGM, base-metal sulfides and/or silicates [2]. Several studies, based on single-spot and elemental mapping with electron microprobe analysis (EPMA), have shown that the laurite and erlichmanite in the mantle-hosted chromitites, like those found in chromite ores from the crust, show mutual substitution between the Ru and Os [3,4,5,6,7].
The ample substitution of Os by Ru in laurite and vice versa in erlichmanite usually results in different patterns of zoning, which [8] are grouped into three main types: (i) grains with Os-poor (laurite) core and Os-rich rim (normal zoning), (ii) grains with Os-rich core an Os-poor rim (reverse zoning) and (iii) grains made up of complex intergrowth of Os-rich, Os-poor laurite and/or erlichmanite (oscillatory zoning). Although post-magmatic alteration may also produce zoning in laurite-erlichmanite [9,10], the origin of zoning in laurite-erlichmanite grains included in unaltered chromite grains from mantle-hosted chromitites is widely accepted to be magmatic [6,11,12]. The analysis of zoned laurites using laser ablation multi-collector inductively coupled plasma source mass spectrometer (LA-MC-ICPMS) also confirmed this hypothesis showing that elemental Os zoning in laurite correlates with variations in the Os isotopic composition [12]. The isotopic heterogeneities observed within individual grains of laurite-erlichmanite are interpreted to reflect the crystallization of the PGM and host chromitites in the upper mantle during mixing of individual pulses of melts with distinctive element and isotopic compositions originally derived from already heterogeneous sources [12,13,14,15,16].
Chemically and isotopically zoned laurite shows a characteristic internal ordering with growth– related bands, parallel to crystal faces, which are frequently interrupted by the external boundary of the grain. These microstructures have been interpreted to reflect partial dissolution of the zoned grain because of sudden changes of composition of the parental melt [8]. It is apparently consistent with the fact that over a wide range of temperatures (>500–1000 °C) the Os uptake in pyrite-type structures like laurite takes place by step-growth processes such as dissolution-precipitation instead solid-state diffusion [12,17]. Recently, several authors have reported nanosized PGM sulfide minerals (e.g., cooperite/braggite, laurite), and Pt-Fe alloy, arsenides and oxides by combining focused ion beam and transmission electron microscopy (FIB/TEM) confirming the magmatic origin of these phases [18,19,20]. However, the structure of these intergrowths at the nanoscale remains largely unexplored.
This paper provides the first nanoscale characterization of zoned laurites in nature, using a combination of focused ion beam (FIB) micro-sampling techniques, transmission electron microscopy (TEM) and precession electron diffraction (PED) observations. We investigated zoned laurite crystals from chromite deposits from the Ojén lherzolite massif (southern Spain), where laurite grains exhibiting normal and oscillatory zoning patterns have already been documented [21]. Previous electron microprobe analysis showed that these zoned laurites show relatively high contents of As and Ir, which indeed correlates with Os rim zoning. These relatively high As-Ir contents were originally interpreted as reflecting “incorporation of increasing amounts of the irarsite molecule” [3,21].
The new results provided here, show that zoning in laurite was not produced by diffusional processes but by non-equilibrium growth of Os domains in the laurite rim with a pre-existing Ru-rich laurite core. Moreover, higher Os (± As) enrichments are due to the existence of nanoscale (10–20 nm) domains of erlichmanite within laurite, which has partitioned not only Os but also As.

2. Geological Background of the Samples

In this study, we focus on zoned laurite-erlichmanite crystals identified in three chromitite bodies from the Ojén ultramafic massif in southern Spain (Figure 1a,b), namely chromitite bodies ARC and ACA from the locality of the Arroyo de los Caballos and CD from Cerro del Algarrobo [3,21,22,23,24].
The Ojén ultramafic massif is located at the internal zone of the Betic Cordillera (southern Spain) and, together with the Ronda, Carratraca (southern Spain) and Beni Boussera (northern Morocco) massifs, is one of the largest ultramafic bodies that crop out around the northern and southern margins of the Alboran Sea (westernmost Mediterranean Sea) (Figure 1a). On the Iberian side, the ultramafic massif crops out in the so-called Serranía de Ronda, covering relatively wide areas: Ronda (~300 km2), Ojén (~80 km2) and Carratraca (~60 km2). These ultramafic massifs chiefly consist of lherzolite and harzburgite with lesser amounts of dunite and pyroxenites layers, which were locally, intruded by leucocratic dykes at ca. 18–22 Ma.
A great body of work carried out over the past three decades has provided a deep characterization of the peridotites of the Serranía de Ronda, revealing the existence of four kilometer-scale structural, petrological and geochemical domains from top to bottom of the mantle section (Figure 1b): (1) garnet-spinel mylonite domain, (2) spinel tectonite domain, (3) granular peridotite domain, and (4) plagioclase tectonite domain [25,26,27,28,29]. These domains represent vestiges of an old Proterozoic (1.8 Ga) subcontinental lithospheric mantle (SCLM) with a protracted record of early exhumation from the roots of thick continental lithosphere and its final emplacement in an extremely attenuated shallow continent in the Miocene. This tectonic evolution is associated with the development and evolution of a back-arc basin in a suprasubduction setting behind the Betic-Rif orogenic wedge [30,31,32,33]. An estimation by [34] suggested a very rapid ascent of the ultramafic rocks from the roots of a SCLM towards their final emplacement in the crust of ~0.4 cm/year.
The chromitite hosting the zoned laurite-erlichmanite crystals analyzed here are from the northern part of the plagioclase-tectonite domain of the Ojén ultramafic massif (Figure 1). These chromitite bodies form irregular pods, schlieren and entwined veins enclosed in 1–10 m thick tabular dunite bodies hosted in lherzolite and harzburgite. Asthenosphere-promoted, pervasive partial melting of the subcontinental lithospheric mantle with infiltration of mafic and calcalkaline volatile-rich melts resulted in re-fertilization reactions at the recrystallization front [23]. Previous works [3,21,23,35] showed that the chromitite consist of chromite crystals with variable size (from a few millimeters to 2 cm) often hosting a broad variety of solid inclusions, including PGM, base-metal sulfides (BMS) and silicates, frequently forming composite aggregates of up to 50 µm in diameter. To ensure the magmatic origin of the zoned laurite-erlichmanite grain, this study focused exclusively on grains that were fully hosted in unaltered chromite.

3. Methods

3.1. Sampling, Imaging and Chemical Characterization of the Platinum-Group Minerals (PGM)

Five selected polished sections of chromitites from the Ojén ultramafic massif were carefully studied under the ore microscope to localize and identify the PGM grains. Selected EPMA analysis of laurite-erlichmanite grains are shown in Table 1. These grains were identified (under back-scattered electron mode) and preliminary by means of their EDX spectra obtained using a Field Emission Scanning Electron Microscope (FE-SEM) Jeol JSM-7100 belonging to the Centres Científics i Tecnològics, Universitat de Barcelona (Spain). The operating conditions constituted an accelerating voltage of 20 kV and a probe current of 8 μA.
Subsequently, the quantitative composition of selected PGM grains was acquired using a JEOL JXA-8230 electron probe microanalyzer (EPMA) equipped with five tunable wavelength dispersive spectrometers at the Centres Científics i Tecnològics, Universitat de Barcelona (Barcelona, Spain). The operating conditions were 40° take-off angle, an accelerating voltage of 15 kV, a beam current of 10 nA, with a 1 µm-diameter beam fully focused. The following WDS crystals were used: PETJ for Ru Lα, Rh Lα, Pd Lβ, S Kα, TAPH for As Lβ and LIFL for Pt Lα, Ir Lα, Os Lα, Cu Kα, Ni Kα, Fe Kα and Cr Kα. The standards were Ru metal for Ru Lα, Rh metal for Rh Lα, Pd metal for Pd Lβ, chalcopyrite (CuFeS2) for S Kα, GaAs (gallium arsenide) for As Lβ, Pt metal for Pt Lα, Ir metal for Ir Lα, Os metal for Os Lα, chalcopyrite (CuFeS2) for Cu Kα, Ni metal for Ni Kα, FeS2 (pyrite) for Fe Kα and Cr2O3 (chromium(III) oxide) for Cr Kα. Interference corrections were applied to Ru Lα for interference by Ru Lβ, to Ir Lα for interference by Cu Kα, to Rh Lβ for interference by Pd Lα, to Ru Lβ for interference by Pd Lα, to Cu Kβ for interference by Os Lα and to Rh Lα for interference by Pt Lα.

3.2. Nanoscale Study of the Zoned Laurite Crystal

An electro-transparent thin-foil was prepared and extracted from a laurite grain (namely ARC-16/7) characterized by a remarkable core-to-rim enrichment in Os (i.e., normal zoning) by means of focused ion beam scanning (FIB-SEM) Zeiss® Neon40 at the Research Centre in Multiscale Science and Engineering of the UPC (Universitat Politécnica de Catalunya, Barcelona, Spain). The sample was coated with a Pt metallic protective slip and then the sample was milled by means of Ga ion bombardment until a 10 × 15 μm thin-foil was obtained. The thin-foil was extracted, welded to a Cu TEM grid and thinned down to an electron transparent thickness (down to 80 nm). Details of the FIB methodology are given in [36].
Later, the thin-foil was subsequently studied using a Transmission Electron Microscope (TEM) FEI Titan G2 TEM equipped with Field Emission cannon XFEG, with spherical correction for the objective lens and working at 300 kV from the Centro de Instrumentación Científica of the Universidad de Granada, Granada, Spain. The FEI Titan G2 TEM is equipped with four energy-dispersive analysis of X-rays (EDX) detectors (FEI microanalysis Super X) and high angle-annular dark field detector (HAADF). High magnification electron microscopy images (HMEM) were acquired using Gatan CCD Camera Orius SC1000. The EDX provided elemental maps and microanalysis from areas and points of interest, the HAADF provided high Z-contrast images and the HMEM allowed microtexture characterization. The obtained images were processed using Digital Micrograph® Version 1.71.38 and the elemental maps using INCA® Microanalysis Suite version 4.09 software package.
The thin-foil was also analyzed using (TEM) JEOL JEM-2100 LaB6 at the Centres Científics i Tecnològics, Universitat de Barcelona (Barcelona, Spain) to obtain high precession angle electron diffraction patterns (PED) on the Os rich zoned laurite domains. The TEM JEOL JEM-2100 LaB6 is equipped with energy dispersed analysis of X-rays (EDX) Oxford Instruments INCA xsight and HAADF, operating at 200 kV in STEM mode. The TEM is equipped with the commercial PED system DigiSTAR manufactured by NanoMEGAS®. The PED patterns were recorded with a Stingray external camera by Gatan® (Pleasanton, CA, USA) and the X-ray maps and spectra with an X-ray microanalysis INCA® ultrathin window Si (Li) detector by Oxford Instruments® (Abington, Oxfordshire, UK) while operating the TEM at 200 kV with a beam size used in this mode of ~15 nm as in [37].
To obtain phase maps for the corresponding PGM grain domains, PED patterns were collected sequentially using the external Stingray camera while the sample area was scanned by an incident quasiparallel nanobeam (<2 mrad). A 225 × 175 pixels map on a 950 nm × 1260 nm area was retrieved. Beam scanning and precessing over the sample area took ~360 min (4800 points s−1). Each PED pattern was recorded with a precession angle of 1° and saved imposing a d-spacing value cut-off of 0.55 Å−1. Since our data corresponds to high PED angle diffraction patterns, we have used the central and outer noncentral diffraction spots to determine the zone axis as accurately as possible. Once the automated acquisition of several thousand PED patterns was completed, phase identification was performed for each individual pattern, by comparing with previously generated model templates using the Topspin® software package (Version 3.1, Nanomegas, Brussels, Belgium). The subsequent data processing of the PED patterns followed the procedure of [37,38].
Additionally, bright field maps were obtained under precessed illumination in parallel to correlation index map images to stress features such as compositional variations, in-grain precipitates and allow highlighting of selective crystalline domains [37]. By combining all these data, we aimed to obtain the mineral phase distribution of chromite, laurite and erlichmanite at sub-micron scale within the PGM aggregate.

4. Results

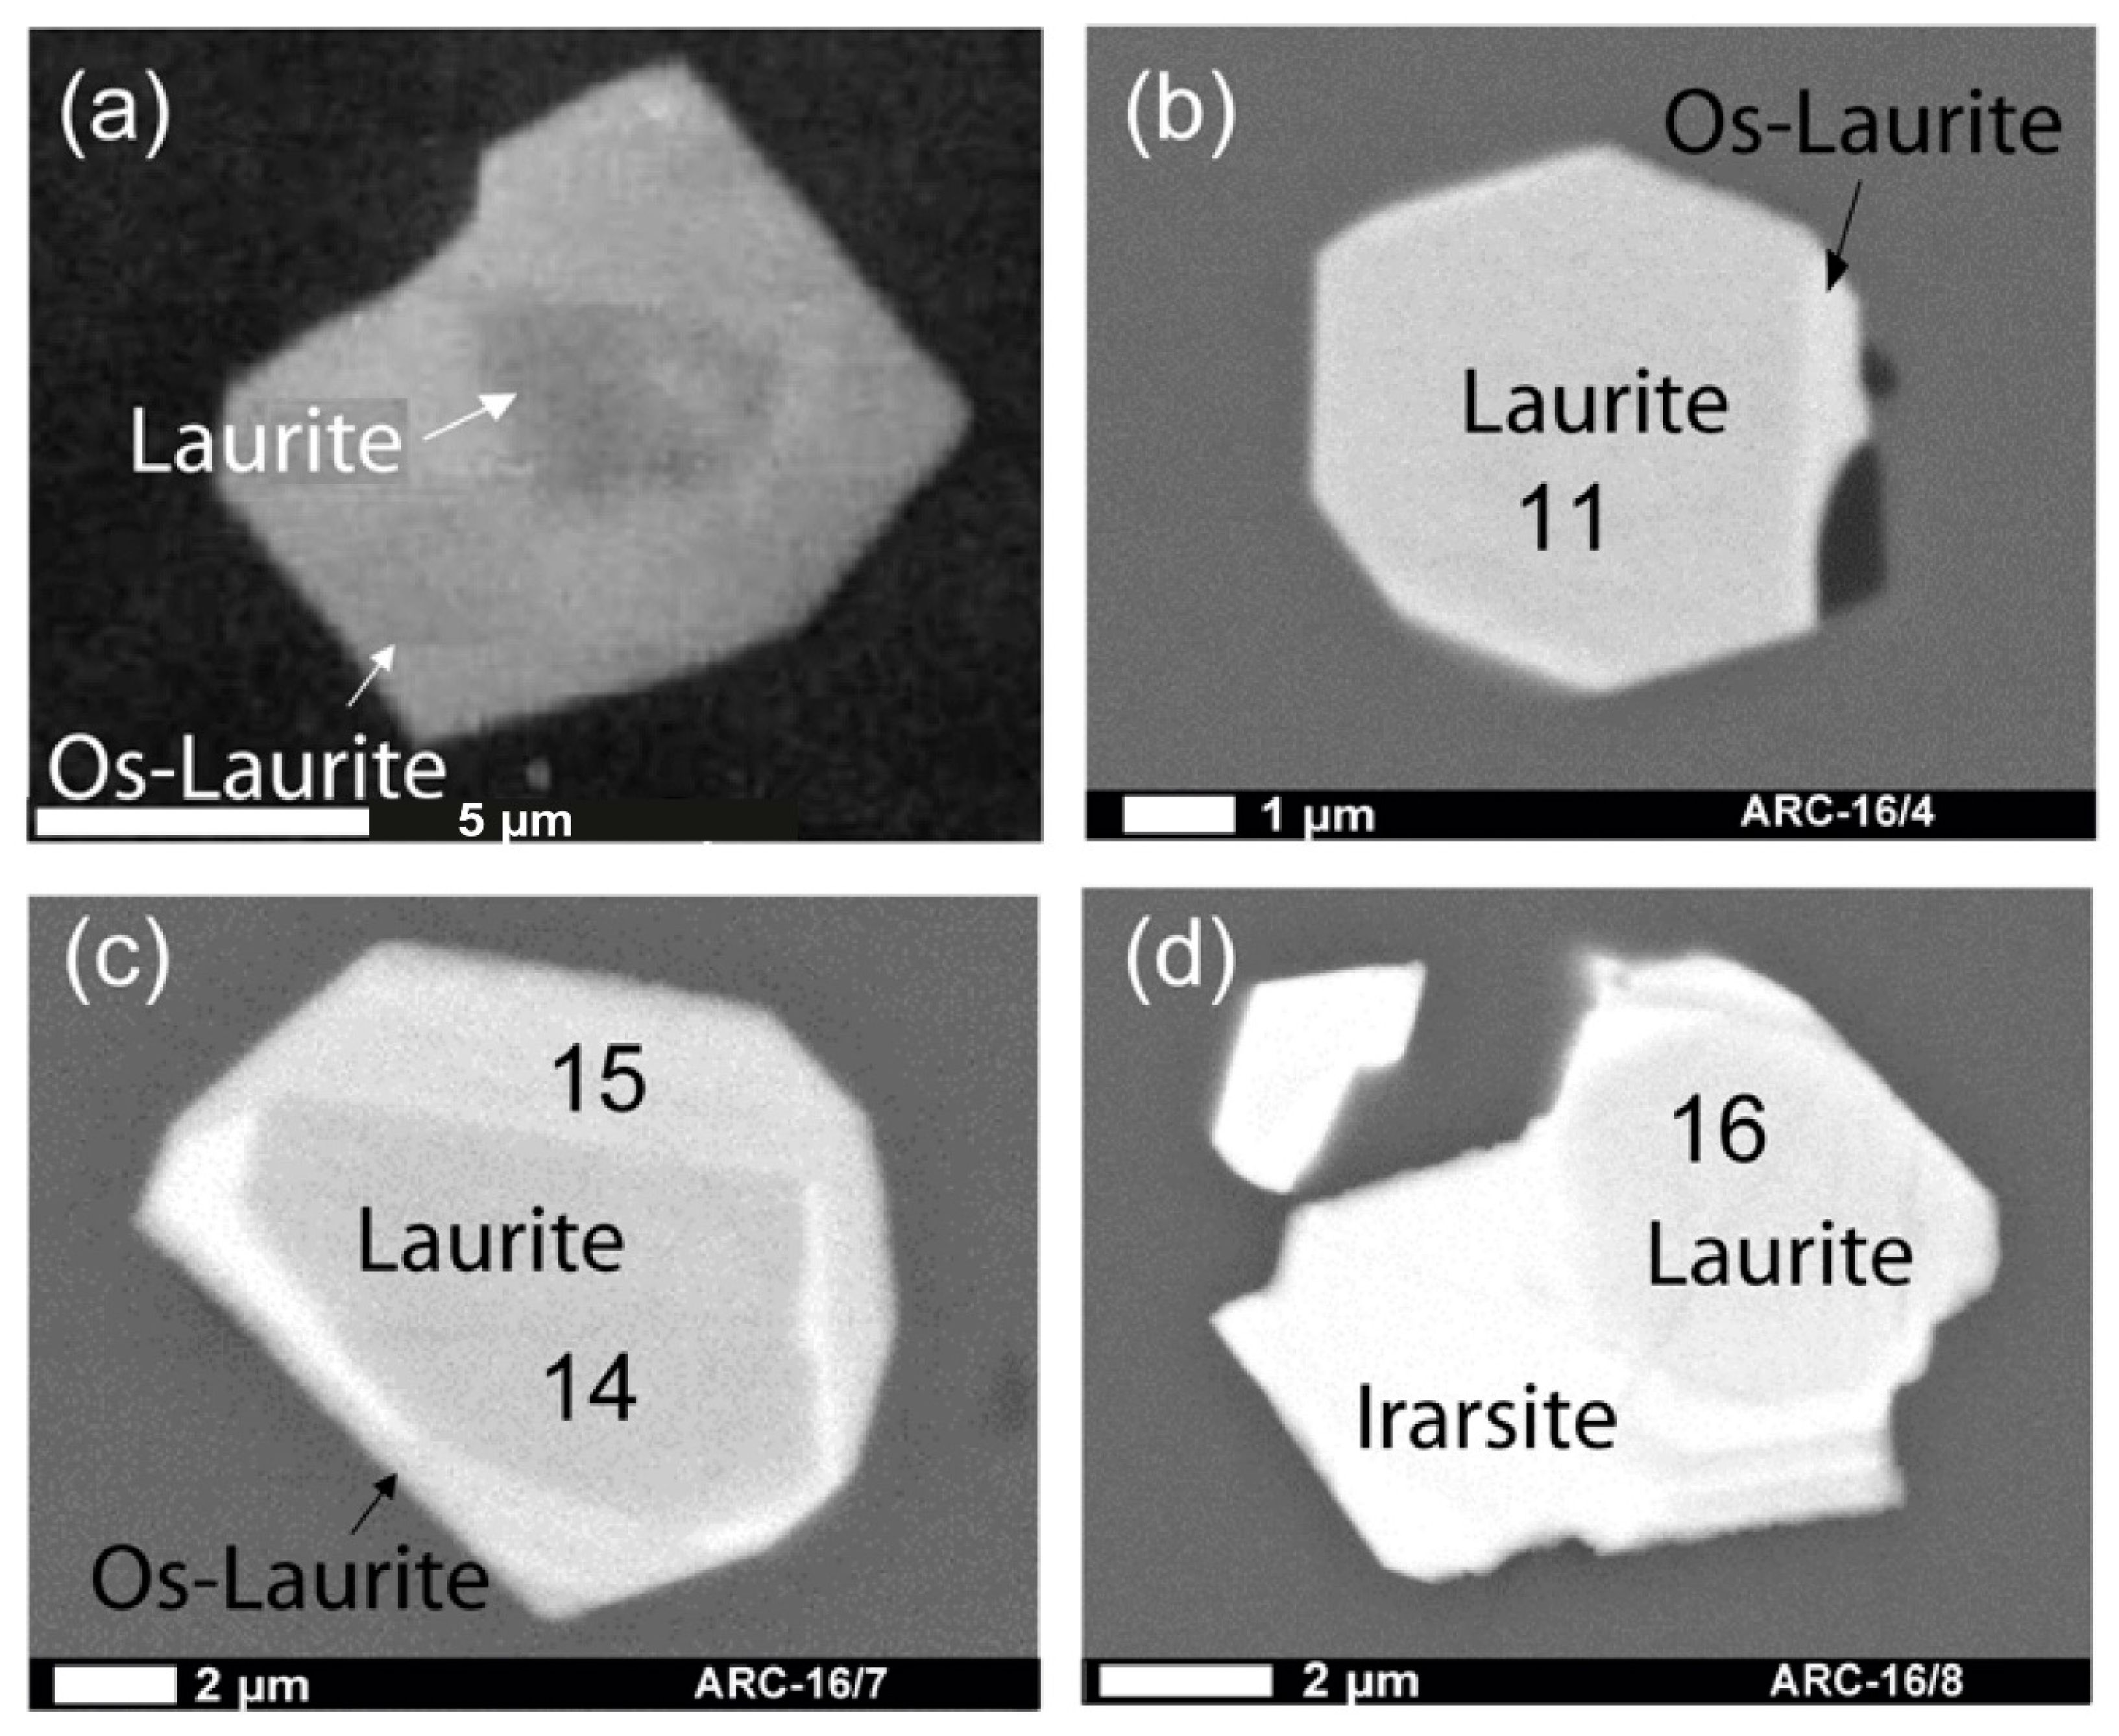
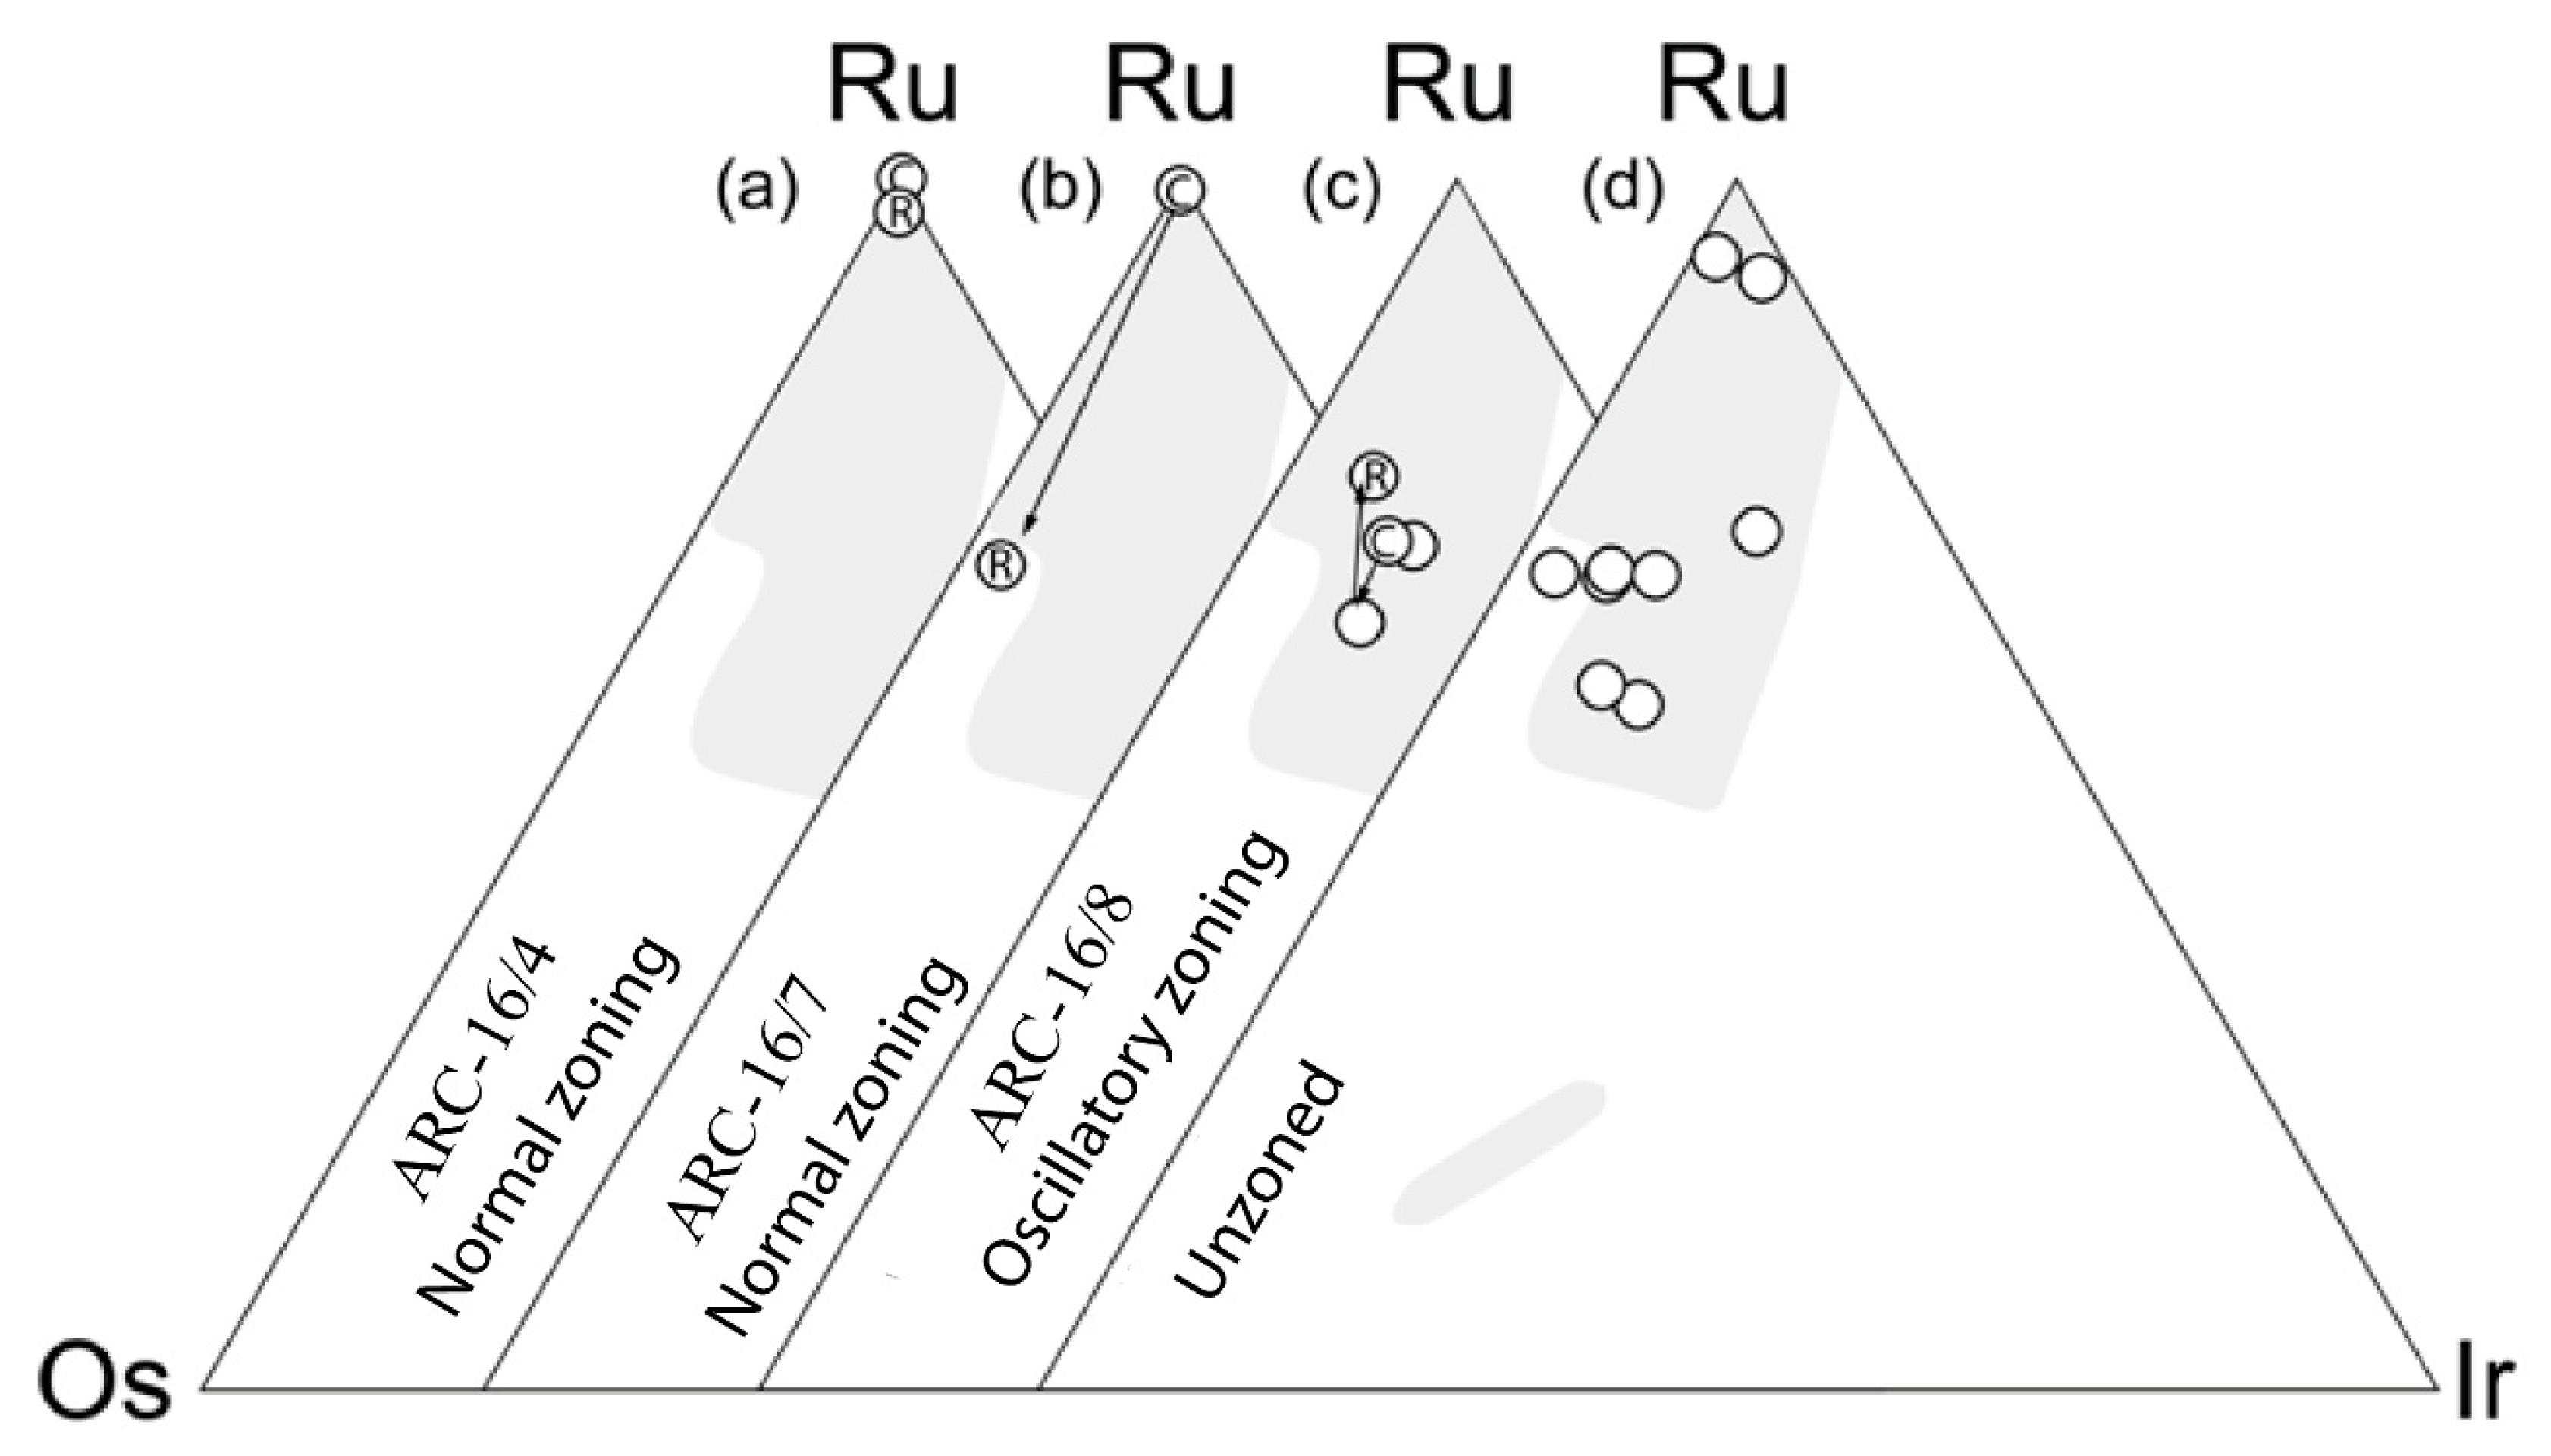
4.1. Laurite Zoning Patterns in the Ojén Ultramafic Massif

A total of 44 grains of laurite were identified in the studied polished-thin sections. All laurites were found included in unaltered chromite forming small (<30 µm) euhedral and less commonly anhedral isolated single or composite grains with Ir-Pt-Rh-Ru sulfarsenides, irarsite (IrAsS), hollingworthite (RhAsS), platarsite (PtAsS), ruarsite (RuAsS) and the Pt-arsenide sperrylite (PtAs2) (Figure 2). Amongst the 21 laurite grains identified in the samples from the Arroyo de los Caballos, only six exhibit zoning under the back-scattered mode of the SEM (Figure 2a–d), although due to the small size of some of these laurite grains and very fine scale of zoning only four grains (ARC-16/4, ARC-16/7, ARC-16/8 and ACA-4/9), could be reliably analyzed with the electron microprobe (Figure 2a–d). One zoned laurite grain described by [21] from the ARC chromitite displays a small rounded (or corroded) core of Os-poor laurite [(Ru0.74Os0.09Ir0.12)Σ=0.95(S1.85As0.20)Σ=2.05], wrapped by Os-richer laurite rim [(Ru0.61Os0.18Ir0.13)Σ=0.93(S1.86As0.21)Σ=2.07] with idiomorphic outlines (Figure 2a).
In this study we have also identified another two zoned laurite grains from the same chromitite (namely ARC-16/4, ARC-16/7; Table 1 and Figure 2b,c and Figure 3a,b), which are characterized by cores surrounded by bands with variable Os contents but still defining a core-to-rim of Os increasing trend (i.e., normal zoning as defined by [8]). The measured chemical composition of the core of the zoned laurite ARC-16/4 is [(Ru0.95Rh0.09Fe0.01)Σ=1.05(S1.91As0.04)Σ=1.95] whereas zoned laurite ARC-16/7 exhibit core-to-rim variation between [(Ru0.95Rh0.08Fe0.02)Σ=1.05(S1.90As0.05)Σ=1.95] and [(Ru0.87Rh0.07Ir0.01Os0.07Fe0.02)Σ=1.04(S1.92As0.04)Σ=1.96] (Figure 2b,c; Table 1).
In addition, one grain from the ARC and other from the ACA chromitite bodies also exhibit grains (i.e., ARC-16/8 and ACA-4/9; Table 1 and Figure 2d and Figure 3c) with bands of laurite with variable Os, Ru and Ir contents alternating with thin (not appropriate for reliable quantitative determinations with EPMA) bands of irarsite. In the zoned laurite grain ARC-16/8 the core of Os-rich laurite [(Ru0.64Os0.17Ir0.11Rh0.07Fe0.02)Σ=1.01(S1.84As0.15)Σ=1.99] is surrounded by alternating bands of Os-poor and Ir-As-rich laurite (Figure 2d; Table 1) with an associated outermost rim of irarsite. In contrast, the zoned laurite grain ACA-4/9 exhibits an oscillatory zoning characterized by a nuclei of Os-poor laurite [(Ru0.66Os0.18Ir0.09Rh0.08Fe0.02)Σ=1.03(S1.86As0.11)Σ=1.97] surrounded by a first rim of Os-richer laurite [(Ru0.62Os0.23Ir0.10Rh0.08Fe0.02)Σ=1.05(S1.84As0.11)Σ=1.95], a second rim of Os-poor laurite [(Ru0.72Os0.18Ir0.06Rh0.06Fe0.03))Σ=1.02(S1.90As0.06)Σ=1.95] (Figure 3c, Table 1) which finally are surrounded by irarsite bands [(Ir0.45Rh0.33Ru0.16Os0.04)Σ=0.98(S1.21As0.78)Σ=1.99].
Unzoned laurites accompanying the zoned laurites described above are also present in the chromitite bodies and their measured compositions range from [(Ru0.91Os0.08Rh0.03Ir0.01Fe0.02)Σ=1.05(S1.95)Σ=1.95] to [(Ru0.64Os0.29Ir0.07Fe0.02)Σ=1.02(S1.98)Σ=1.98] with negligible amounts of Pt, Rh and Ir in their compositions (Table 1, Figure 3d)).

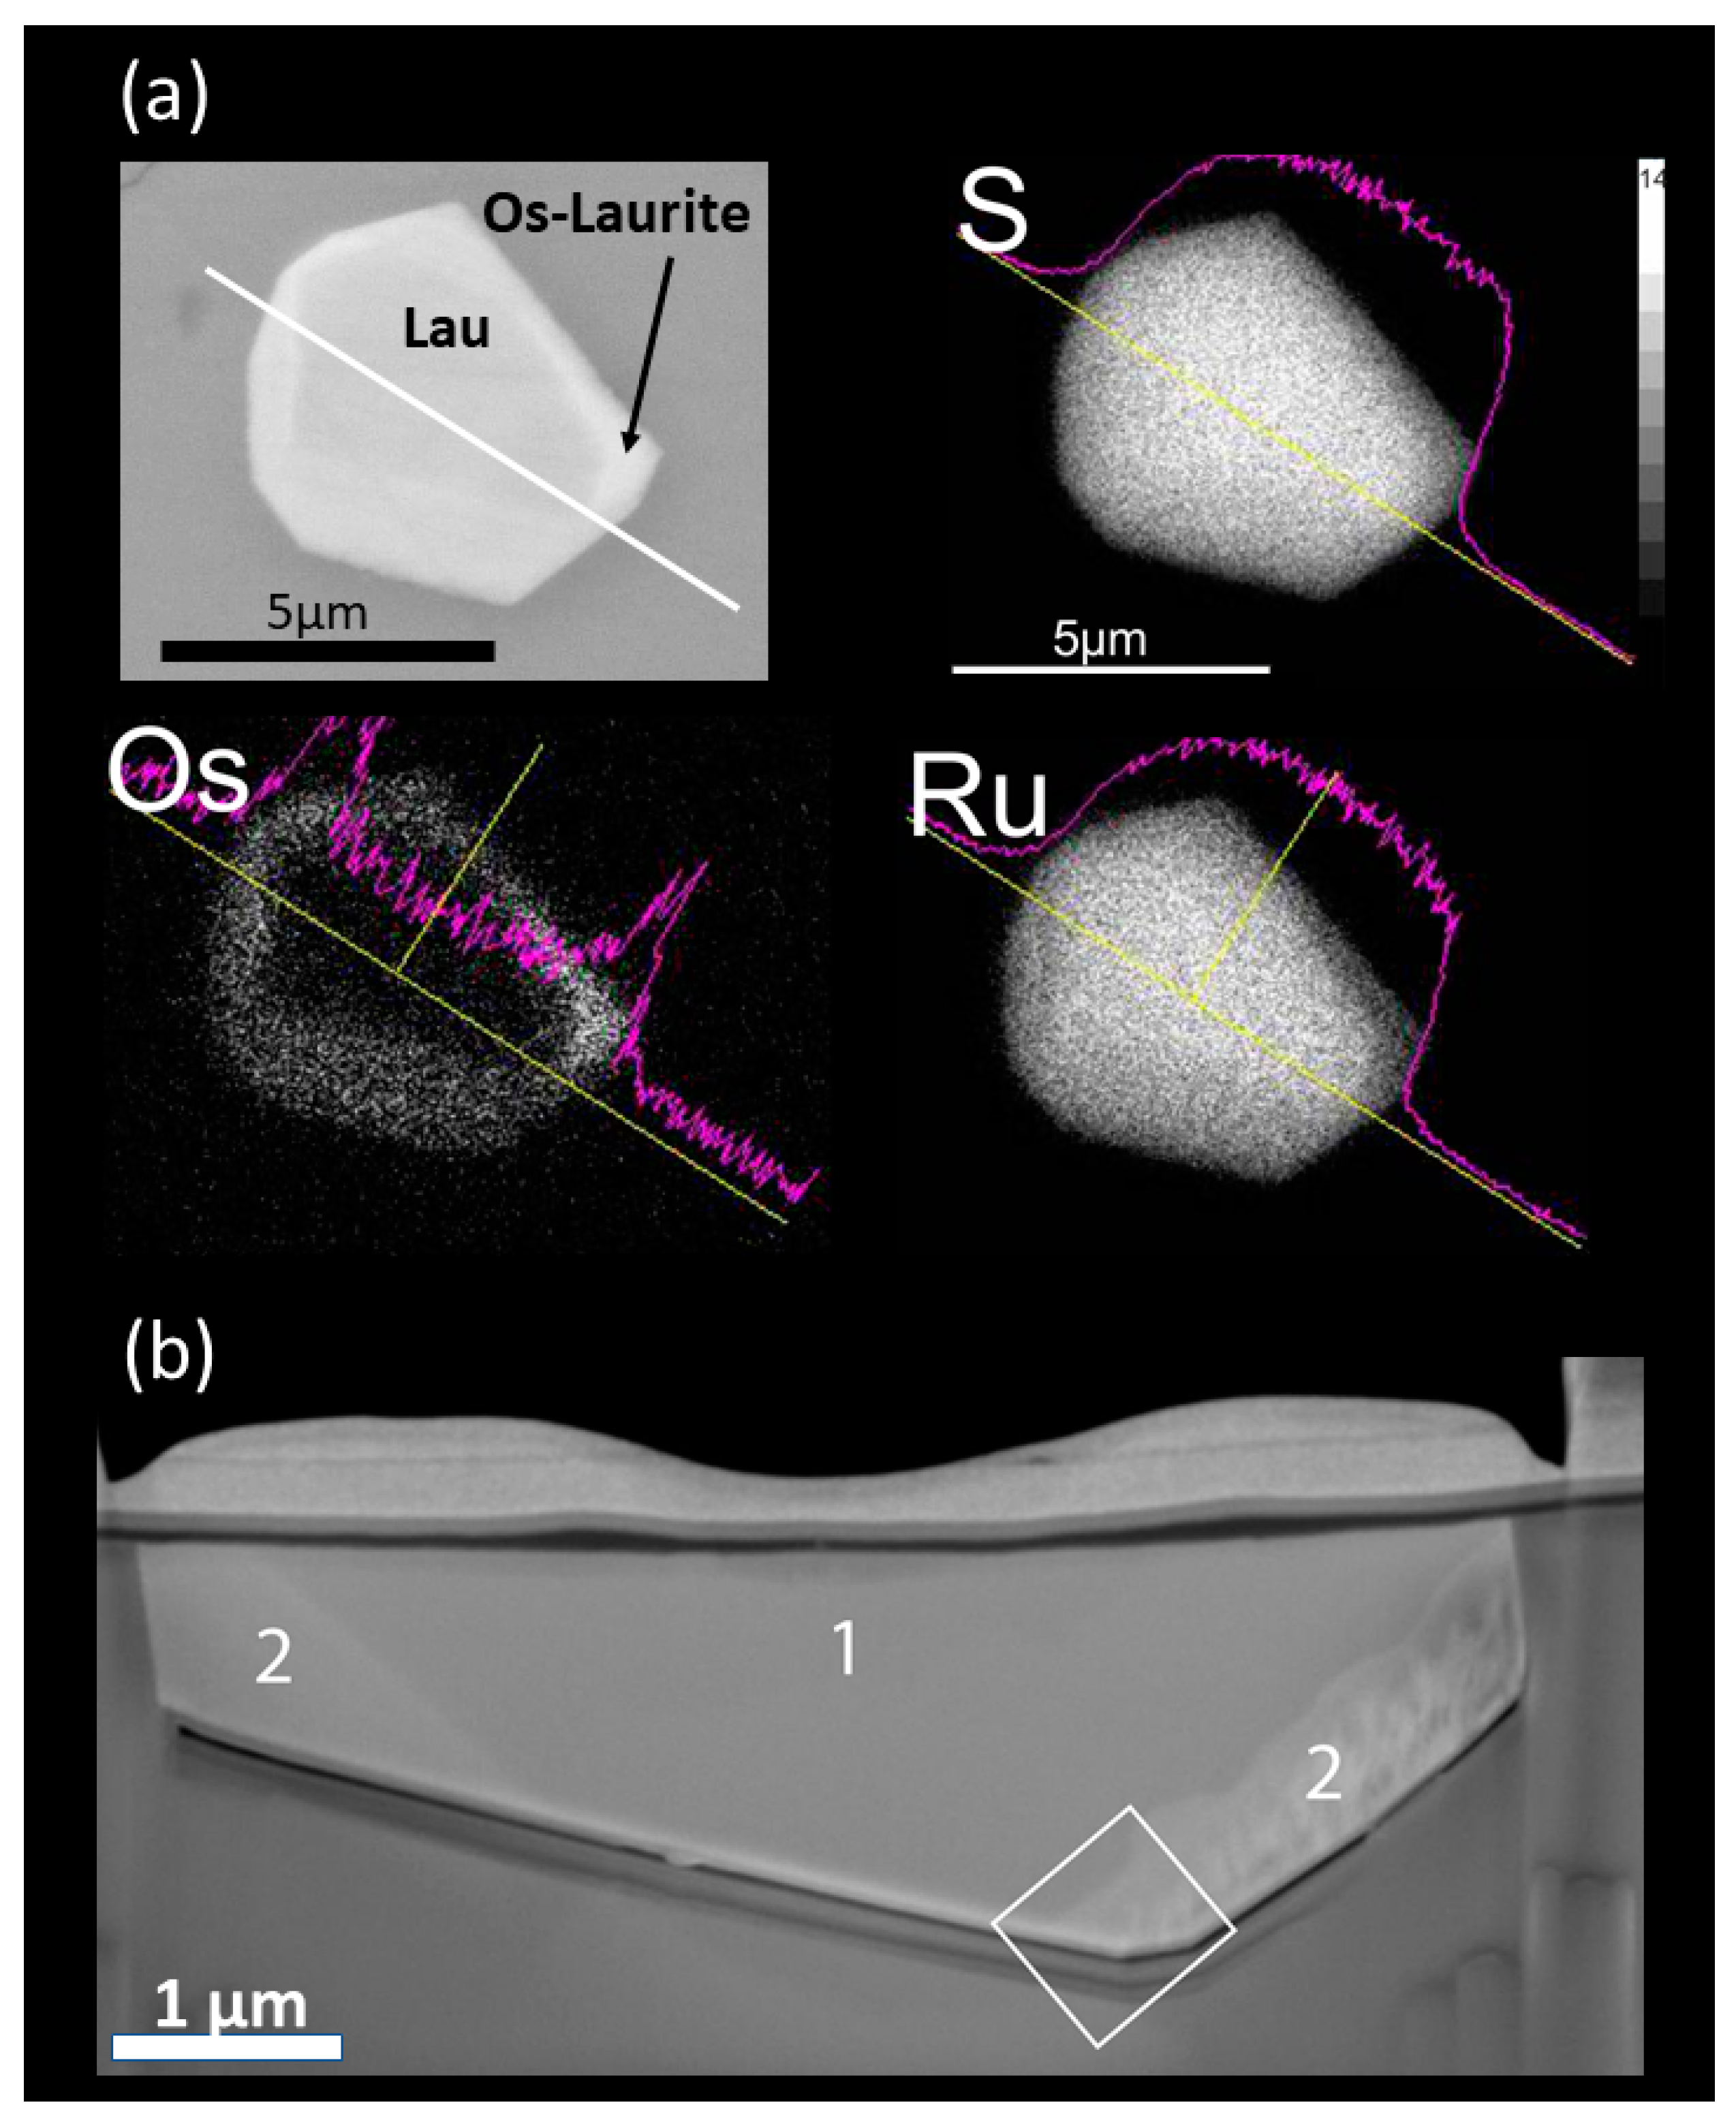
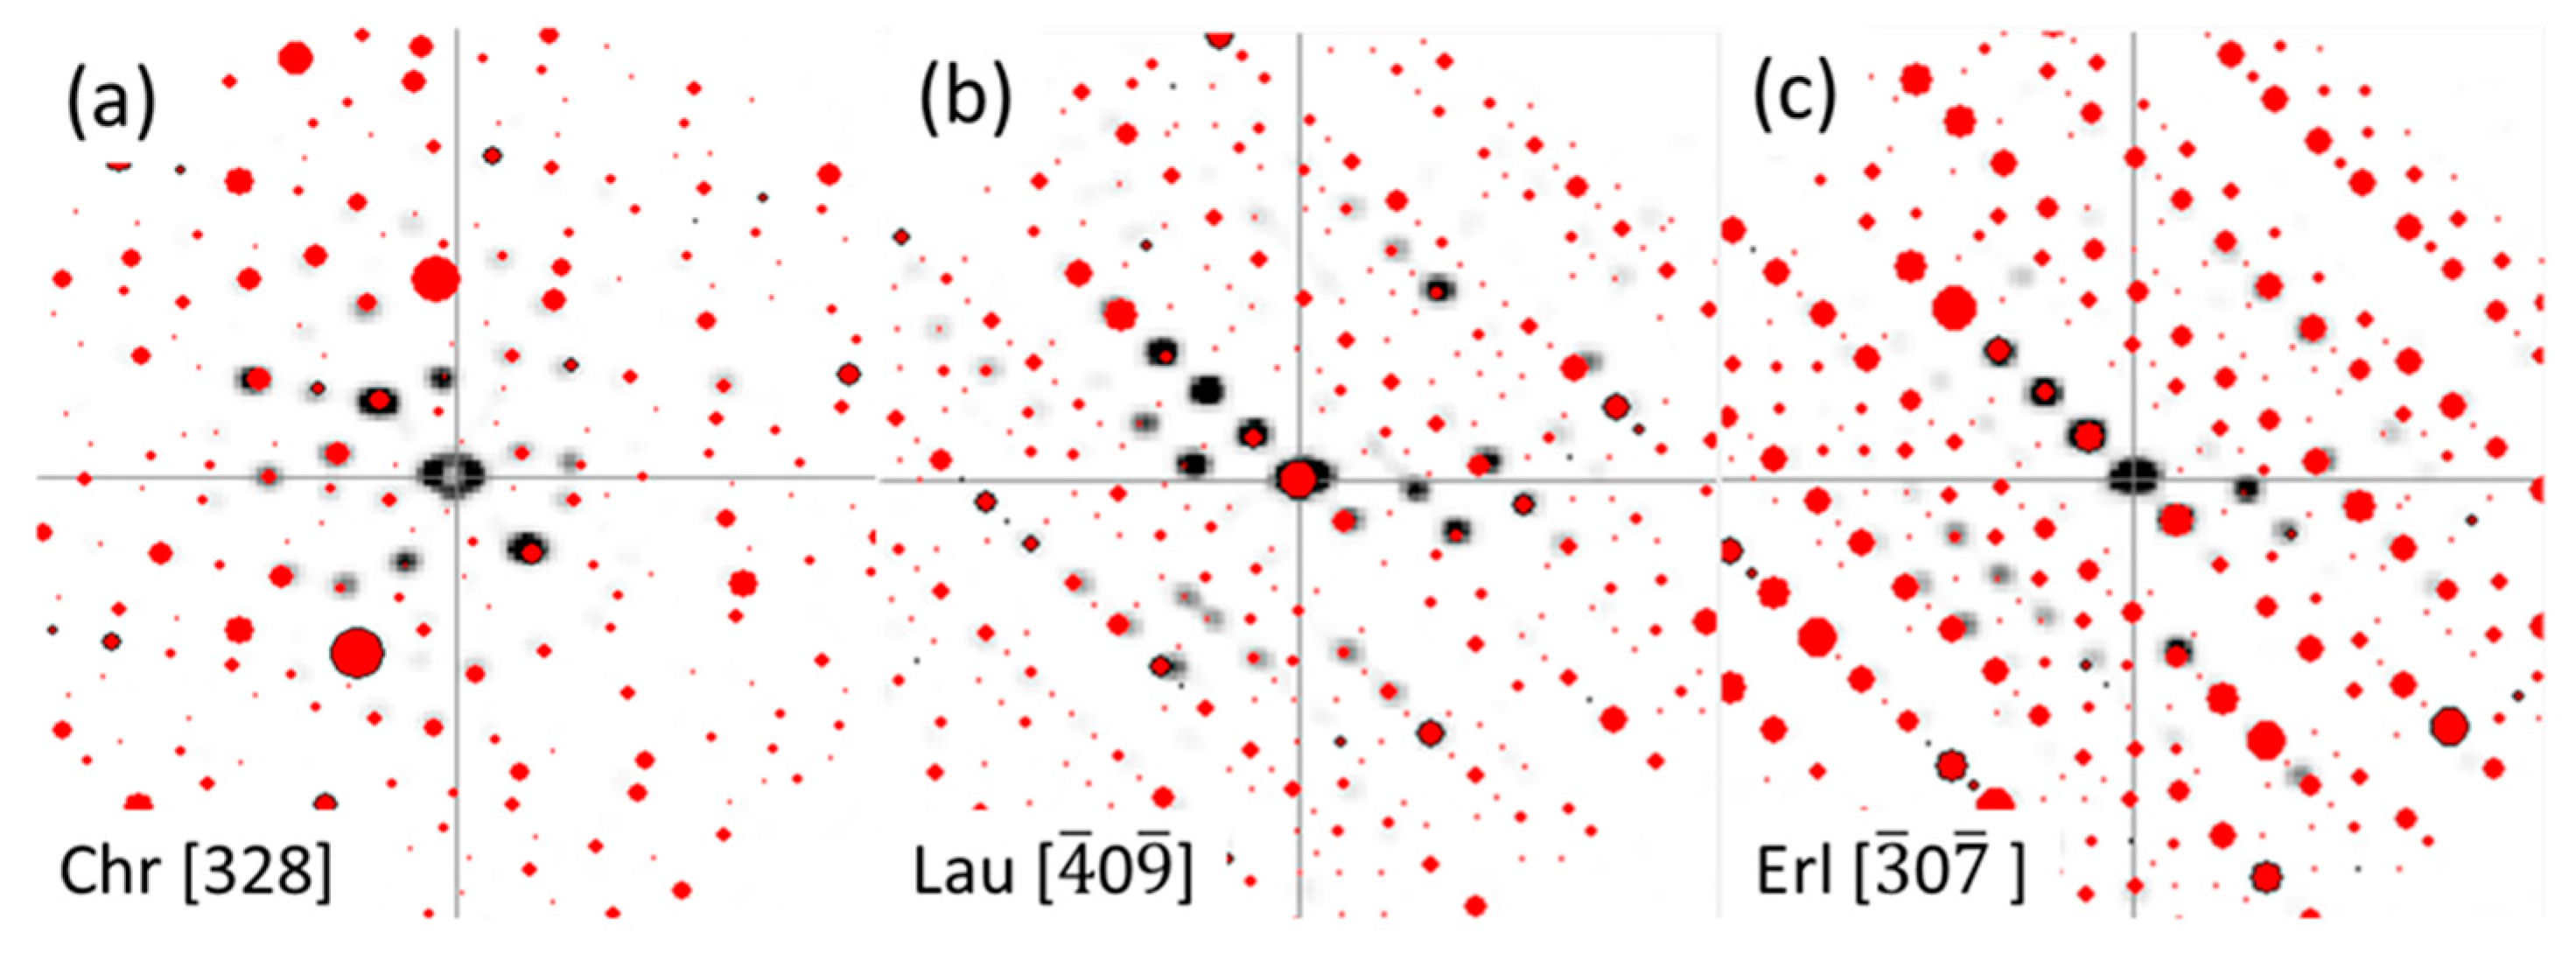
4.2. Nanoscale Structure of Zoned Laurite

One thin-foil (Figure 4) was cut perpendicular to the zoned microstructure of the laurite grain ARC-/7 revealing a pseudo-trapezoidal zoned shape (Figure 4). The BSE images acquired from both sides of the thin-foil displayed nanometric-scale heterogeneities, which is fully consistent with the micro-structural core-to-rim Os zoning observed in the acquired BSE images on the surface of a polished thin section (Figure 4a,b). The SEM-EDX mapping revealed overall homogenous contents of S throughout the grain. The different domains observed in the grains exhibit a positive correlation between the contents of S and Ru, and Os appears to be predominantly concentrated in the rim. However, the obtained BSE images from the thin-foil revealed compositional heterogeneities associated to the Os rich rim that has been further characterized by means of TEM (Figure 4b).
The TEM images from ARC-16/7 thin-foil confirmed the presence of two compositionally distinct domains, corresponding to the core and the rim as observed using FE-SEM from the grain cross section (Figure 5). In agreement with the EPMA and SEM-EDX analysis, the obtained TEM-EDX profiles across the core-rim contact show that the core is enriched in Ru, whereas at the rim there are higher concentrations of Os, S and to a minor extent As (Figure 5). In addition, the HAADF images indicate that at the nanoscale, the rim internally consists of 10–20 nm-wide parallel fringes with alternating composition (Figure 5a). The selected area electron diffraction (SAED) patterns taken at the core-rim boundary (Figure 5b) indicate that these fringes are not the result of an array of interferences and superpositions of different plane orientations or powder diffraction rings characteristic of polycrystalline/amorphous phases but a continuous single-crystal (Figure 5). Nevertheless, the TEM-EDS profiles obtained across the rim confirmed that these lattices correspond to distinctively different nanoscale chemical domains, with the white fringes corresponding to atomically heavier domains enriched in Os and dark fringes as atomically lighter domains enriched in Ru (Figure 5c). The observed Ir content is scarce and almost invariable throughout the profile (Figure 5d).
Furthermore, the analysis at the core-rim contact was performed using PED to unequivocally identify the crystalline phases, their distribution and orientation (Figure 6a,b). The central and outer noncentral diffraction spots from the high PED angle diffraction patterns were used to determine the phase assignations as accurately as possible. The transmitted beam intensity fluctuation maps were obtained (virtual bright field image) by integrating the intensity within a virtual aperture placed on the same position. The PED associated virtual bright field (VBF) map confirmed the Os enrichment at the rim with a distinctive lower transmitted electron beam intensity in agreement with the TEM-EDX mapping (Figure 7a,c). The PED-based map has further been used to study the crystal domains, size and orientation within the thin-foil.
Each individual experimental PED pattern was compared with the full set of generated templates using the laurite, erlichmanite and chromite structures [39,40,41] and a correlation index (goodness of matching map) in association with the scanned area. The PED patterns showed in Figure 6 have been obtained at the same spot where compositional fringes had been identified and, additionally where the reliability index was higher by assigning the best orientation for each individual pattern obtained. This PED-based phases map also reveals that higher Os contents in the fringes observed in the rim domain of the grain correspond to erlichmanite (OsS2), which are found in some cases as segregated and aligned in parallel fringes (10–20 nm wide) within the monocrystalline laurite constituting most of the PGM grain (Figure 7).
The obtained PED-based crystal phase maps shown in Figure 7 confirmed that two crystal phases constitute the rim zone, and the corresponding automated pattern indexing enabled analysis of their crystallographic textures. The dominant [ 4 ¯ 0 9 ¯ ] (laurite) and the [ 3 ¯ 0 7 ¯ ] (erlichmanite) constituting the 10–20 nm fringes have been identified with little disarrange angle (Figure 6a,b), which is consistent with compositional differences observed in EDX profiles (Figure 7d,e). The indexation of the three phases recognized with the PED mapping, obtained from the matching of the corresponding diffraction patterns show a good identification of laurite, the erlichmanite fringes and the surrounding hosting chromite (Figure 6c).

5. Discussion

5.1. Magmatic Origin of Laurites from the Ojén Chromitites

The occurrence of the zoned laurites within unaltered chromite crystals in the Ojén chromitites suggests that these grains were mechanically trapped during the formation of the hosting mineral [4,11,14]. In addition, the euhedral shape of most of these grains (Figure 2a–c) suggests that these minerals crystallized freely from a melt prior or contemporary to chromite [42].
The hypothesis that laurite could form during crystallization of the chromitites from basaltic melts at relatively high temperatures (>1000 °C) is supported by a series of experiments [12,43,44,45,46] indicating that almost stoichiometric Os-poor laurite can crystallize from S-undersaturated basaltic melt at 1200–1300 °C and log fS2 from −2 to −1.3. The results of these experiments also showed that Os solubility in laurite crystallizing directly from a basaltic melt increases with decreasing temperature or increasing fS2.
In addition, the results provided in the experiments carried out by [45] also support the notion that laurite can crystallize directly out of a S-bearing sulfide-undersaturated silicate melt, although they proposed a model in which laurite would form by reaction of nano-to-micron sized metallic Ru-(Os-Ir) alloys with S eventually dissolved in the silicate melt. More recently, [12] have demonstrated experimentally the growth in equilibrium of laurite and Pt-Ir-Os-Fe alloys from Ni-Cu-Fe sulfide melts at >1200 °C.
Single-spot analysis laurite from the investigated chromitite bodies using EPMA shows a wide range of Os contents up to the end-member erlichmanite (OsS2) (Figure 3), indicating that they formed at a somewhat wider range of temperatures (and sulfur fugacity) than those defined by [43] for the stability of pure laurite (1300–1150 °C). Therefore, the origin of these PGM can be related with their crystallization from the basaltic melts that have crystallized the chromite in the mantle [3,21,23].

5.2. Nanostructure of Cores and Rims in Zoned Laurites from the Ojén Chromitites

There is a consensus that a progressive increase in the Os content of laurite would be expected on cooling because of both decreasing temperature and increasing fS2, thus normal zoning should reflect the different stages of fractional crystallization during cooling of the chromitite parental melt [42,47,48,49]. In contrast, oscillatory zoning consisting of bands of Os-poor and Os-rich laurite often alternating with irarsite (Figure 2d and Figure 3c) indeed highlight the existence of a magmatic system with different fS2 (and a As) gradients in space and/or time, with or without changes in temperature, and over short time spans [6,8,11]. However, these hypotheses depart from the assumption that there is a complete mutual substitution of Ru⇔Os between laurite and erlichmanite as these two disulfides are isostructural [50].
The TEM observation of the thin-foil extracted from the laurite ARC-16/7 displaying normal core-to-rim zoning shows that, this zoned grain is laurite (Figure 4b, Figure 5c and Figure 7a). The EPMA of the core of this grain yielded up to 53.98 wt.% Ru and negligible amounts of Os, which is consistent with the nanoscale textures observed and the homogenous distribution showed by the elemental map acquired using TEM-EDX. The disparity between the laurite chemistry and the presence of erlichmanite resides in the fact that the EPMA spatial resolution is ~2 μm, way too large to discriminate the Os influence between core and rim domains within the normal zoning (Figure 7a).
This contrasts with the heterogenous nanostructure of the outer Os-richer rim surrounding this Os-poor nucleus. The rim consists of alternating fringes of erlichmanite up to 10–20 nm preferentially oriented within a relatively homogenous laurite matrix (see compositional TEM-EDX profiles in Figure 5d and Figure 6b and PED map in Figure 7d).
The HMEM images and the PED analysis indicate that there is not significant crystallographic mismatch between the core of laurite and the Os-richer rim consisting of a laurite matrix hosting nano-domain of erlichmanite. These observations suggest that changes in chemistry in zoned laurite-erlichmanite grains indeed reflect crystallization in non-equilibrium conditions what would prevent the intra-crystalline diffusion of Os from core to rim within the laurite structure at high temperature. These changes in the chemistry of the parental melt would account in parallel to variations of the thermodynamic conditions as noted in the previous section.
Interestingly, the HMEM images and the PED analysis also show that in the Os-rich rim the crystallographic orientation of the erlichmanite fringes match those of the Ru-rich matrix of laurite (Figure 7d), suggesting that these nano-meter sized domains of erlichmanite fringes could form as a result of: (1) the exsolution of Os from laurite, (2) heterogeneous dissolution of Os in the structure of laurite at high temperature. In the first scenario, one could assume that Os entered in the structure of laurite at high temperature but upon cooling it would exsolved via the occupation of vacancies in the position or Ru. An equilibration of a chemically heterogeneous laurite grain by intra-crystalline diffusion of Os could be expected during subsolidus cooling from the very high temperatures of crystallization of laurite and host chromite (~1300–1150 °C) up to the typical lower conditions of closure of the chromitite system (~600 °C). If so, this would evidence a compositional gap between laurite and erlichmantite at low temperature, which has not yet been defined in experiments. However, we already noted that peridotites (and hosted chromitite including laurite grains) from the Ojén ultramafic massif experienced a very fast exhumation from the roots of the SCLM towards their final emplacement into the crust. This rapid exhumation very likely caused a relatively fast cooling of the chromite and their hosted laurite inclusions, which could prevent the complete homogenization of Os into the laurite structure allowing the preservation of the erlichmanite fringes within a matrix of pure laurite. Thus, as the temperature fell, the miscibility gap widened until at low temperatures very little solid solution existed resulting in a two phases mixture.
A third alternative is that the observed fringes of erlichmanite in laurite reflect breakdown of laurite into erlichmanite due to spinodal decomposition. The spinodal decomposition is a typical solution model where the solid solution is unstable to variations in composition, leading to a unmixing process into regions of different compositions [51]. This has been documented in many other high-temperature minerals such as silicates (e.g., feldspar [52,53,54,55,56,57] and clinopyroxenes [58]) or oxides (e.g., spinel exsolution in magnetite [59]). In the case of sulfides, spinodal ordering has been calculated in Zn-Fe-S and Sn-Pb-S in the corresponding phases diagrams in disequilibrium conditions [60,61]. The spinodal decomposition differs from nucleation and growth in that it proceeds from a compositional perturbation small in degree but large in extent. This perturbation grows, and a new phase gradually emerges which is structurally coherent with its surroundings across a diffuse interface. Thus, unlike the classical nucleation, there is no clear stage at which the second phase appears [56]. The phases identification extracted from the PED mapping and the fringes observed in the HAADF image indicate that in laurites the spinodal decomposition indeed took place where there an increase of Os content results in an increase of free energy, the re-equilibrium is shown to nucleate a new phase (i.e., erlichmanite in the Os-rich rim) (Figure 7d,e).
Theoretically, these fluctuations may allow the coexistence of regions with slightly different lattice parameters [51], which agrees with the small disarrange between the laurite and the erlichmenite fringes as seen in Figure 5, Figure 6 and Figure 7. These regions are periodic, very fine scale (ideally between 5 nm and 50 nm) and with sinusoidal compositional modulations throughout the crystal, the same characteristics are shown in laurite from Figure 7b,e. Likewise, if the cooling rate is fast the wavelength from the partial decomposition remains constant and lies in the range 1–35 nm [62].
As noted above, the proposed spinodal decomposition in laurites could be explained because the peridotites and the hosted chromitite including the laurite grains from the Ojén ultramafic massif experienced a very fast exhumation from the roots of the SCLM towards their final emplacement into the crust. In fact, [63] already proposed that due the rapid exhumation very likely caused a relatively fast cooling of the chromite bodies; which could prevent the complete homogenization of Os into the laurite structure allowing the preservation of the 20 nm wide erlichmanite observed fringes within the Os-rich laurite rim.

5.3. Nanoscale Coupling of Os and As in Erlichmanite

Single-spot EPMA show that both zoned and unzoned laurite from the three chromitite bodies analyzed in this study display positive correlations of Ir vs. As (Figure 8; Table 1), which in some of the zoned laurites is directly related with the higher Os content. Despite that some laurites from the chromitites CD and ARC have As below detection limits, they still contain Ir of up to 6.55 wt.% and up to 10.14 wt.% respectively. Considering all the analyzed laurites, the positive Ir vs. As correlation define trends parallel to Ir/As line = 1, and present coupled Ir-As enrichments of similar extent (Figure 8).
Empirical data indicate that laurite can accommodate up to 10 wt.% Ir [1], although synthetic laurite obtained in experiments overall have <3 wt.% Ir [12,43]). Thus, previous authors [3,21] suggested the possibility that Ir and As in laurite from the Ojén chromitites could be controlled by the presence of molecule (sic. nanoinclusions) of irarsite (IrAsS). However, the detailed TEM analysis carried out in this study does not reveal the presence of nanoinclusions of sulfarsenides in laurite, rather we observed that this positive Ir/As correlation is particularly remarkable in those laurites containing bands, or associated with, irarsite, which confirms the influence of the sulfarsenide not as nanoparticles as suggested by [3].
On the other hand, while single-spot EPMA of the zoned laurite grain ARC-16/7 shows almost invariable As contain between the core and rim on grain ARC-16/7 (1.75 to 1.73 wt.%, Table 1), micro-profile analysis acquired using HRTEM indicate slightly higher As contents in the Os-rich rim (Figure 5d). Apparently, within this Os-rich rim the relatively higher peaks of As match with erlichmanite fringes suggesting a possible coupling of As with Os. This is consistent with recent experiments [64] showing that despite of the tendency of Os to form metal-S complexing at high temperatures, its affinity towards As in melts increases significantly below 1200 °C, consistent with the hypothesis that erlichmanite could crystallize at lower temperatures and higher As activity in the melt than laurite.

6. Conclusions

This is the first nanoscale study on the structure of minerals of the laurite-erlichmanite solid solution series by means of a combination of FIB-HRTEM-PED. The obtained results show that the Os enrichment detected in laurite by conventional micro-analytical techniques (FE-SEM and EPMA) might correspond in some cases to the presence of nanoscale domains of erlichmmanite within a matrix of Os-rich laurite. These observations above are twofold. First, the conventional definition of the intermediate terms of the solid solution, i.e., Os-poor or Os-rich laurite, between the pure species laurite (RuS2) and erlichmanite (OsS2) only using in-situ single-spot EPMA analysis or BSE images using SEM should be reevaluated in some natural cases. It can only be adequately assessed by detailed TEM studies. Secondly, zoning in laurite grains can occur not only at the microsize scale but also at the nanoscale-domain and it is not related with subsolidus re-equilibrium of the grains but is reflects composition in equilibrium with the environment at the time of its formation. Nanoscale domains of erlichmanite in the Os rich laurite rim may reflect a spinodal decomposition of laurite structure to exsolve Os even at the high temperature of crystallization of chromitites (1200 °C), particularly in magmatic systems that experienced a relatively fast undercooling. Fast cooling of the chromitite-laurite magmatic system could be also responsible for the preservation of microscale zoning in laurite-erlichmanite grains, which is the result of changes in the thermodynamic conditions of the melt and nonequilibrium conditions hampering the intracrystalline diffusion of Os limited by the diffusion of Os during laurite crystal growth. Our results confirm (at the nanoscale approach) that zoning in laurite-erlichmanite is a faithful record of heterogeneous physicochemical environment in which these minerals and their host chromitites form in the upper mantle. Additionally, the discrepancy highlighted by our observations illustrate the necessity of additional experiments to determine the solubility limits for Os and Ru in the structure of erlichmanite-laurite under conditions of relatively fast cooling that usually occur in natural systems as well as at temperatures lower than magmatic.

Author Contributions

J.M. methodology, formal analysis and software; F.N. and F.G. validation, S.B.-A, A.J.-F. and J.R.-R. formal analysis, investigation, data curation, and writing—original draft preparation, J.M.G.-J. and J.A.P. writing—review and editing, supervision, project administration, and funding acquisition.

Funding

This research was supported by Spanish projects: RTI2018-099157-A-I00 and CGL2015-65824-P granted by the “Ministerio de Ciencia, Innovación y Universidades” and Ministerio de Economía y Competitividad” (MINECO) respectively. Additional funding was provided by the Ramón y Cajal Fellowship RYC-2015-17596 granted by the Spanish MINECO to JMGJ. A. Jiménez-Franco is supported with a postdoctoral grant (CVU 350809) from the National Council on Science and Technology (CONACYT) of Mexico.

Acknowledgments

Jesús Montes is acknowledged for preparation of thin sections, Isabel Sánchez Almazo and Alicia González Segura (Centro de Instrumentación Científica of the University of Granada). Trifon Todorov Trifonov is acknowledged for preparation of TEM thin-foil (Centre de Recerca en Ciència i Enginyeria Multiescala). We also thank the three anonymous reviewers for constructive comments.

Conflicts of Interest

The authors declare no conflict of interest.

References

  1. O’Driscoll, B.; González-Jiménez, J.M. Petrogenesis of the Platinum-Group Minerals. Rev. Mineral. Geochem. 2016, 81, 489–578. [Google Scholar] [CrossRef]
  2. Gervilla, F.; Proenza, J.A.; Frei, R.; González-Jiménez, J.M.; Garrido, C.J.; Melgarejo, J.C.; Meibom, A.; Díaz-Martínez, R.; Lavaut, W. Distribution of platinum-group elements and Os isotopes in chromite ores from Mayarí-Baracoa Ophiolitic Belt (eastern Cuba). Contrib. Mineral. Petrol. 2005, 150, 589–607. [Google Scholar] [CrossRef]
  3. Torres-Ruiz, J.; Garuti, G.; Gazzotti, M.; Gervilla, F.; Fenoll Hach-All, I.P. Platinum-group minerals in chromitites from the Ojén lherzolite massif (Serranía de Ronda, Betic Cordillera, Southern Spain). Mineral. Petrol. 1996, 56, 25–50. [Google Scholar] [CrossRef]
  4. Melcher, F.; Grum, W.; Simon, G.; Thalhammer, T.V.; Stumpfl, E.F. Petrogenesis of the ophiolitic giant chromite deposits of Kempirsai, Kazkhstan: A study of solid and fluid inclusions in chromite. J. Petrol. 1997, 38, 1419–1458. [Google Scholar] [CrossRef]
  5. Coggon, J.A.; Nowell, G.M.; Pearson, D.G.; Oberthür, T.; Lorand, J.P.; Melcher, F.; Parman, S.W. The 190Pt–186Os decay system applied to dating platinum-group element mineralization of the Bushveld Complex, South Africa. Chem. Geol. 2012, 302, 48–60. [Google Scholar] [CrossRef]
  6. Prichard, H.M.; Barnes, S.J.; Fisher, P.C.; Pagé, P.; Zientek, M.L. Laurite and Associated PGM in the Stillwater Chromitites: Implications for Processes of Formation, and Comparisons with Laurite in the Bushveld and Ophiolitic Chromitites. Can. Mineral. 2017, 55, 121–144. [Google Scholar] [CrossRef]
  7. Weiser, T.W. Platinum-group minerals (PGM) in placer deposits. In The Geology, Geochemistry, Mineralogy and Mineral Beneficiation of Platinum-Group Elements; Cabri, L.J., Ed.; Canadian Institute of Mining, Metallurgy and Petroleum: Montreal, QC, Canada, 2002; CIM Special Volume 54; pp. 721–756. [Google Scholar]
  8. González-Jiménez, J.M.; Gervilla, F.; Proenza, J.A.; Kerestedjian, T.; Augé, T.; Bailly, L. Zoning of laurite (RuS2)–erlichmanite (OsS2): Implications for the genesis of PGM in ophiolite chromitites. Eur. J. Mineral. 2009, 21, 419–432. [Google Scholar] [CrossRef]
  9. Proenza, J.A.; Zaccarini, F.; Escayola, M.; Cábana, C.; Schalamuk, A.; Garuti, G. Composition and textures of chromite and platinum-group minerals in chromitites of the western ophiolitic belt from Pampeans Ranges of Córdoba, Argentina. Ore Geol. Rev. 2008, 33, 32–48. [Google Scholar] [CrossRef]
  10. Oberthür, T.; Melcher, F.; Weiser, T.W. Detrital platinum-group minerals and gold in placers of Southeastern Samar Island, Philippines. Can. Mineral. 2017, 55, 45–62. [Google Scholar] [CrossRef]
  11. González-Jiménez, J.M.; Griffin, W.L.; Proenza, J.A.; Gervilla, F.; O’Reilly, S.Y.; Akbulut, M.; Pearson, N.J.; Arai, S. Chromitites in ophiolites: How, where, when, why? Part II. The crystallization of chromitites. Lithos 2014, 189, 140–158. [Google Scholar] [CrossRef]
  12. Fonseca, R.O.C.; Brückel, K.; Bragagni, A.; Leitzke, F.P.; Speelmanns, I.M.; Wainwright, A.N. Fractionation of Rhenium from Osmium during noble metal alloy formation in association with sulfides: Implications for the interpretation of model ages in alloy-bearing magmatic rocks. Geochim. Cosmochim. Acta 2017, 216, 184–200. [Google Scholar] [CrossRef]
  13. Malitch, K.N.; Augé, T.; Badanina, I.Y.; Goncharov, M.M.; Junk, S.A.; Pernicka, E. Os-rich nuggets from Au-PGE placers of the Maimecha-Kotui Province, Russia: A multi-disciplinary study. Mineral. Petrol. 2002, 76, 121–148. [Google Scholar] [CrossRef]
  14. Ahmed, A.H.; Hanghøj, K.; Kelemen, P.B.; Hart, S.R.; Arai, S. Osmium isotope systematics of the Proterozoic and Phanerozoic ophiolitic chromitites: In situ ion probe analysis of primary Os-rich PGM. Earth Planet. Sci. Lett. 2006, 245, 777–791. [Google Scholar] [CrossRef] [Green Version]
  15. Marchesi, C.; González-Jiménez, J.M.; Gervilla, F.; Garrido, C.J.; Griffin, W.L.; O’Reilly, S.Y.; Proenza, J.A.; Pearson, N.J. In situ Re-Os isotopic analysis of platinum-group minerals from the Mayarí Cristal ophiolitic massif (Mayarí-Baracoa Ophioitic Belt, eastern Cuba): Implications for the origin of Os-isotope heterogeneities in podiform chromitites. Contrib. Mineral. Petrol. 2011, 161, 977–990. [Google Scholar] [CrossRef]
  16. González-Jiménez, J.M.; Gervilla, F.; Griffin, W.L.; Proenza, J.A.; Augé, T.; O’Reilly, S.Y.; Pearson, N.J. Os-isotope variability within sulfides from podiform chromitites. Chem. Geol. 2012, 291, 224–235. [Google Scholar] [CrossRef]
  17. Brenan, J.M.; Cherniak, D.J.; Rose, L.A. Diffusion of osmium in pyrrhotite and pyrite; implications for closure of the Re–Os isotopic system. Earth Planet. Sci. Lett. 2000, 180, 399–413. [Google Scholar] [CrossRef]
  18. Wirth, R.; Reid, D.; Schreiber, A. Nanometer-sized platinum-group minerals (PGM) in base metal sulfides: New evidence for an orthomagmatic origin of the merensky reef pge ore deposit, bushveld complex, South Africa. Can. Mineral. 2013, 51, 143–155. [Google Scholar] [CrossRef]
  19. Junge, M.; Wirth, R.; Oberthür, T.; Melcher, F.; Schreiber, A. Mineralogical siting of platinum-group elements in pentlandite from the Bushveld Complex, South Africa. Miner. Depos. 2014, 50, 41–54. [Google Scholar] [CrossRef] [Green Version]
  20. González-Jiménez, J.M.; Reich, M. An overview of the platinum-group element nanoparticles in mantle-hosted chromite deposits. Ore Geol. Rev. 2017, 81, 1236–1248. [Google Scholar] [CrossRef]
  21. Gutierrez-Narbona, R.; Lorand, J.P.; Gervilla, F.; Gros, M. New data on base metal mineralogy and platinum group minerals in the Ojén chromitites (Serranía de Ronda, Betic Cordillera, southern Spain). J. Mineral. Geochem. 2003, 2, 143–173. [Google Scholar] [CrossRef]
  22. Gervilla, F.; Leblanc, M. Magmatic ores in high temperature alpine-type Lherzolite massifs (Ronda, Spain, and Beni Bousera, Morocco). Econ. Geol. 1990, 85, 112–132. [Google Scholar] [CrossRef]
  23. González-Jiménez, J.M.; Marchesi, C.; Griffin, W.L.; Gutiérrez-Narbona, R.; Lorand, J.P.; O’Reilly, S.Y.; Garrido, C.J.; Gervilla, F.; Pearson, N.J.; Hidas, K. Transfer of Os isotopic signatures from peridotite to chromitite in the subcontinental mantle: Insights from in situ analysis of platinum-group and base-metal minerals (Ojén peridotite massif, southern Spain). Lithos 2013, 164–167, 74–85. [Google Scholar] [CrossRef]
  24. González-Jiménez, J.M.; Marchesi, C.; Griffin, W.L.; Gervilla, F.; Belousova, E.A.; Garrido, C.J.; Romero, R.; Talavera, C.; Leisen, M.; O’Reilly, S.Y.; et al. Zircon recycling and crystallization during formation of chromite- and Ni-arsenide ores in the subcontinental lithospheric mantle (Serranía de Ronda, Spain). Ore Geol. Rev. 2017, 90, 193–209. [Google Scholar] [CrossRef]
  25. Obata, M. The Ronda Peridotite: Garnet-, Spinel-, and Plagioclase-Lherzolite Facies and the P–T trajectories of a high-temperature mantle intrusion. J. Petrol. 1980, 21, 533–572. [Google Scholar] [CrossRef]
  26. Van der Wal, D.; Vissers, R.L.M. Uplift and emplacement of upper-mantle rocks in the western Mediterranean. Geology 1993, 21, 1119–1122. [Google Scholar] [CrossRef]
  27. Van der Wal, D.; Vissers, R.L.M. Structural petrology of the Ronda Peridotite, SW Spain: Deformation history. J. Petrol. 1996, 37, 23–43. [Google Scholar] [CrossRef]
  28. Garrido, C.J.; Bodinier, J.L. Diversity of mafic rocks in the Ronda peridotite: Evidence for pervasive melt-rock reaction during heating of subcontinental lithosphere by upwelling asthenosphere. J. Petrol. 1999, 40, 729–754. [Google Scholar] [CrossRef]
  29. Lenoir, X.; Garrido, C.J.; Bodinier, J.L.; Dautria, J.M.; Gervilla, F. The recrystallization front of the Ronda peridotite: Evidence for melting and thermal erosion of subcontinental lithospheric mantle beneath the Alboran Basin. J. Petrol. 2001, 42, 141–158. [Google Scholar] [CrossRef]
  30. Booth-Rea, G.; Ranero, C.R.; Martinez-Martinez, J.M.; Grevemeyer, I. Crustal types and Tertiary tectonic evolution of the Alboran sea, western Mediterranean. Geochem. Geophys. Geosyst. 2007, 8, 1–25. [Google Scholar] [CrossRef]
  31. Garrido, C.J.; Gueydan, F.; Booth-Rea, G.; Precigout, J.; Hidas, K.; Padron-Navarta, J.A.; Marchesi, C. Garnet lherzolite and garnet-spinel mylonite in the Ronda peridotite: Vestiges of Oligocene backarc mantle lithospheric extension in the western Mediterranean. Geology 2011, 39, 927–930. [Google Scholar] [CrossRef]
  32. Marchesi, C.; Garrido, C.J.; Bosch, D.; Bodinier, J.-L.; Hidas, K.; Padrón-Navarta, J.A.; Gervilla, F.A. Late Oligocene Suprasubduction Setting in the Westernmost Mediterranean Revealed by Intrusive Pyroxenite Dikes in the Ronda Peridotite (Southern Spain). J. Geol. 2012, 120, 237–247. [Google Scholar] [CrossRef]
  33. Precigout, J.; Gueydan, F.; Gapais, D.; Garrido, C.J.; Essaifi, A. Strain localisation in the subcontinental mantle—A ductile alternative to the brittle mantle. Tectonophysics 2007, 445, 318–336. [Google Scholar] [CrossRef]
  34. Platt, J.P.; Soto, J.I.; Whitehouse, M.J.; Hurford, A.J.; Kelley, S.P. Thermal evolution, rate of exhumation, and tectonic significance of metamorphic rocks from the floor of the Alboran extensional basin, western Mediterranean. Tectonics 1998, 17, 671–689. [Google Scholar] [CrossRef] [Green Version]
  35. Gervilla, F.; Kojonen, K. The platinum-group minerals in the upper section of the Keivitsansarvi Ni-Cu-PGE deposit, Northern Finland. Can. Mineral. 2002, 40, 377–394. [Google Scholar] [CrossRef]
  36. Wirth, R. Focused Ion Beam (FIB) combined with SEM and TEM: Advanced analytical tools for studies of chemical composition, microstructure and crystal structure in geomaterials on a nanometre scale. Chem. Geol. 2009, 261, 217–229. [Google Scholar] [CrossRef]
  37. Roqué-Rosell, J.; Portillo-Serra, J.; Aiglsperger, T.; Plana-Ruiz, S.; Trifonov, T.; Proenza, J.A. Au crystal growth on natural occurring Au—Ag aggregate elucidated by means of precession electron diffraction (PED). J. Cryst. Growth. 2018, 483, 228–235. [Google Scholar] [CrossRef]
  38. Zou, X.; Hovmöller, S.; Oleynikov, P. Electron Crystallography: Electron Microscopy and Electron Diffraction; International Union of Crystallography Book Series, 16; Oxford University Press: Oxford, UK, 2011; ISBN 978-0-19-958020-0. [Google Scholar]
  39. Lutz, H.D.; Mueller, B.; Schmidt, T.; Stingl, T. Structure refinement of pyrite-type ruthenium disulfide, RuS2, and ruthenium diselenide, RuSe2. Acta Crystallogr. Sect. C-Cryst. Struct. Commun. 1990, 46, 2003–2005. [Google Scholar] [CrossRef]
  40. Stingl, T.; Müller, Β.; Lutz, H.D. Crystal structure refinement of osmium (II) disulfide, OsS2. Z. Kristallogr. Cryst. Mater. 1992, 202, 161–162. [Google Scholar] [CrossRef]
  41. Lenaz, D.; Braidotti, R.; Princivalle, F.; Garuti, G.; Zaccarini, F. Crystal chemistry and structural refinement of chromites from different chromitite layers and xenoliths of the Bushveld Complex. Eur. J. Mineral. 2007, 19, 599–609. [Google Scholar] [CrossRef]
  42. Augé, T.; Johan, Z. Comparative study of chromite deposits from Troodos, Vourinos, North Oman and New Caledonia ophiolites. In Mineral Deposits within the European Community; Boissonnas, J., Omenetto, P., Eds.; Society for Geology Applied to Mineral Deposits, Spec. Publ.; Springer: Berlin, Germany, 1988; Volume 6, pp. 267–288. ISBN 978-3-642-51860-7. [Google Scholar]
  43. Brenan, J.M.; Andrews, D. High-temperature stability of laurite and Ru–Os–Ir alloy and their role in PGE fractionation in mafic magmas. Can. Minerl. 2001, 39, 341–360. [Google Scholar] [CrossRef]
  44. Andrews, D.; Brenan, J.M. Phase-equilibrium constraints on the magmatic origin of laurite + Ru-Os-Ir alloy. Can. Mineral. 2002, 40, 1705–1716. [Google Scholar] [CrossRef]
  45. Bockrath, C.; Ballhaus, C.; Holzheid, A. Stabilities of laurite RuS2 and monosulphide liquid solution at magmatic temperature. Chem. Geol. 2004, 208, 265–271. [Google Scholar] [CrossRef]
  46. Finnigan, C.S.; Brenan, J.M.; Mungall, J.E.; McDonough, W.F. Experiments and models bearing on the role of chromite as a collector of platinum group minerals by local reduction. J. Petrol. 2008, 49, 1647–1665. [Google Scholar] [CrossRef]
  47. Augé, T.; Legendre, O.; Maurizot, P. The distribution of Pt and Ru–Os–Ir minerals in the New Caledonia ophiolite. In Proceedings of the 8th Internationa Platinum, Rustenburg, South Africa, 29 June–3 July 1998; pp. 129–132. [Google Scholar]
  48. Garuti, G.; Zaccarini, F.; Economou-Eliopoulos, M. Paragenesis and composition of laurite from the chromitites of Othrys (Greece): Implications for Os–Ru fractionation in ophiolitic upper mantle of the Balkan Peninsula. Miner. Depos. 1999, 34, 312–319. [Google Scholar] [CrossRef]
  49. Zaccarini, F.; Tredoux, M.; Miller, D.E.; Garuti, G.; Aiglsperger, T.; Proenza, J.A. The occurrence of platinum-group element and gold minerals in the Bon Accord Ni-oxide body, South Africa. Am. Mineral. 2014, 99, 1774–1782. [Google Scholar] [CrossRef] [Green Version]
  50. Bowles, J.F.W.; Atkin, D.; Lambert, J.L.M.; Deans, T.; Phillips, R. The chemistry, reflectance, and cell size of the erlichmanite (OsS2)–laurite (RuS2) series. Mineral. Mag. 1983, 47, 465–471. [Google Scholar] [CrossRef]
  51. Putnis, A. Introduction to Mineral Sciences, 2nd ed.; Cambridge University Press: Cambridge, MA, USA, 1992; pp. 282–284. ISBN 9780521429474. [Google Scholar]
  52. Ghiorso, M.S.; Carmichael, I.S.E.; Rivers, M.L.; Sack, R.O. The gibbs free energy of mixing of natural silicate liquids; an expanded regular solution approximation for the calculation of magmatic intensive variables. Contrib. Mineral. Petrol. 1983, 84, 107–145. [Google Scholar] [CrossRef]
  53. Tajčmanová, L.; Abart, R.; Wirth, R.; Habler, G.; Rhede, D. Intracrystalline Microstructures in Alkali Feldspars from Fluid-Deficient Felsic Granulites: A Mineral Chemical and TEM Study. Contrib. Mineral. Petrol. 2012, 164, 715–729. [Google Scholar] [CrossRef]
  54. Cahn, J.W. Spinodal decomposition. Trans. Metall. Soc. AIME 1968, 242, 166–180. [Google Scholar]
  55. Brown, W.L.; Parsons, I. Storage and release of elastic strain energy the driving force for low temperature reactivity and alteration of alkali feldspars. In Defects and Processes in the Solid State Geoscience Applications; Boland, J.N., Fitz-Gerald, J.D., Eds.; Elsevier: Amsterdam, The Netherlands, 1993; The McLaren Volume Developments in Petrology 14; pp. 267–290. ISBN 978-94-011-1106-5. [Google Scholar]
  56. Yund, R.A.; McCallister, R.H. Kinetics and Mechanisms of Exsolution. Chem. Geol. 1970, 6, 5–30. [Google Scholar] [CrossRef]
  57. Abart, R.; Petrishcheva, E.; Kässner, S.; Milke, R. Perthite microstructure in magmatic alkali feldspar with oscillatory zoning; Weinsberg Granite, Upper Austria. Mineral. Petrol. 2009, 97, 251–263. [Google Scholar] [CrossRef]
  58. Brizi, E.; Nazzareni, S.; Princivalle, F.; Zanazzi, P.F. Clinopyroxenes from mantle-related xenocrysts in alkaline basalts from Hannuoba (China): Augite-pigeonite exsolutions and their thermal significance. Contrib. Mineral. Petrol. 2003, 145, 578–584. [Google Scholar] [CrossRef]
  59. Harrison, R.J.; Putnis, A. Interaction between exsolution microstructures and magnetic properties of the magnetite-spinel solid solution. Am. Mineral. 1997, 82, 131–142. [Google Scholar] [CrossRef]
  60. Leute, V.; Behr, A.; Hünting, C.; Schmidtke, H.M. Phase diagram and diffusion properties of the quasibinary system (Sn, Pb)S. Solid State Ionics 1994, 68, 287–294. [Google Scholar] [CrossRef]
  61. Sack, R.O. Thermochemistry of Sulfide Mineral Solutions. Rev. Mineral. Geochem. 2006, 61, 265–364. [Google Scholar] [CrossRef]
  62. Huston, E.L.; Cahn, J.W.; Hilliard, J.E. Spinodal decomposition during continuous cooling. Acta Met. 1966, 14, 1053–1062. [Google Scholar] [CrossRef]
  63. Gervilla, F.; González Jiménez, J.; Roqué-Rosell, J.; Baurier-Amat, S.; Proenza, J.A. Nanoscale Structure of Zoned Laurites; Goldschmidt: Boston, MA, USA, 2018. [Google Scholar]
  64. Helmy, H.M.; Bragagni, A. Platinum-group elements fractionation by selective complexing, the Os, Ir, Ru, Rh-arsenide-sulfide systems above 1020 °C. Geochim. Cosmochim. Acta 2017, 216, 169–183. [Google Scholar] [CrossRef]
Figure 1. (a) Geographical situation of the ultramafic massifs located in southern Spain and in northern Morocco (in black) and (b) Schematic map of the Ojén lherzolitic massif showing its three petrological and metamorphic domains (modified from [23,24]. The different acronyms for the chromitite bodies referred in previous works of study are ACA and ARC for Arroyo de los Caballos and CD for Cantera de Dunitas.
Minerals 09 00288 g001
Figure 2. Backscattered electron images of zoned laurites from the Ojén ultramafic Massif. (a) Euhedral laurite with normal zoning enclosed in chromite (ARC) [21], (b,c) Subhedral-euhedral normal zoned laurites with Os-rich cores included within the chromite matrix, (ARC from this study), (d) Anhedral grain with oscillatory zoning composed of laurite and irarsite (ARC) from this study. Numbers in b, c and d correspond to EPMA results showed in the Table 1.
Minerals 09 00288 g002
Figure 3. Ru-Os-Ir plots of the laurite grains from the investigated chromitites and from those studied by [21] (shaded domains). From left to right: (a) Plot of a grain with normal zoning with little chemical variation between core (C) and rim (R), (b) Plot of one grain with normal zoning with remarkable chemical variation (C: cores, R: rims, arrows indicate compositional variation from cores to rims); (c) Plot of laurite grains displaying oscillatory zoning) and (d) Plot of laurites without zoning.
Minerals 09 00288 g003
Figure 4. (a) Backscattered electron (BSE) images of euhedral normal zoned laurite (ARC-16/7 grain) with Os-rich core included within the chromite matrix. EDX elemental mapping and compositional profile obtained using SEM reveal for S, Os and Ru are also shown. (b) BSE images collected with FIB-SEM of the thin-foil extracted from the laurite ARC-16/7 grain. 1 (core zone) and 2 (rim zone) show different compositional zoning domains, white rectangle corresponds to the region of interest showing core-rim boundary.
Minerals 09 00288 g004
Figure 5. (a) HAADF image of the core-rim contact of the laurite thin-foil (ARC-16/7 grain). (b) Diffraction pattern obtained on the fringes domain showing a monocrystalline pattern of laurite. (c) Detail of the HAADF image of the rim to core contact of the laurite thin-foil. White arrow showing the direction of the EDX profile obtained. (d) EDX profile showing the compositional variations of Ru-Lα, Os-Lα, Ir-Lα. S-Kα and As-Lβ vs counts per second (cts).
Minerals 09 00288 g005
Figure 6. Precession Electron Diffraction (PED) patterns with their corresponding Miller indices corresponding to (a) chromite (Chr) and the associated (b) laurite (Lau) and the associated (c) erlichmanite (Erl) from the Os-rich zoning. Indexing intensities, phase identification and crystal orientation has been performed using the AstarTM software package.
Minerals 09 00288 g006
Figure 7. (a) TEM EDX mapping displaying Os and Ru distribution across laurite zonation, white rectangle shows the PED selected area. (b) Its correspondent elemental composition variability vs counts per second (cts) EDS profile displaying the Os/Ru correlation (black) with light fringes. (c) Virtual Bright Field (VBF) image shows the darker area enriched in Os. (d) Phases distribution map acquired by PED with chromite (dark grey) laurite (yellow) and erlichmanite (blue). (e) HAADF image of the nanoscale fringes located within the rim domain of the laurite grain with the trace of the EDS profile (white arrow).
Minerals 09 00288 g007
Figure 8. Plot of lr versus As (at %) for laurite-erlichmanite from the Ojén ultramafic Massif, updated from [1,6]. Black polygons correspond to grains displaying normal zoning and dark-grey for oscillatory zoning (C = core; R = rim). The different acronyms for the chromitite bodies referred in previous works of study are ACA and ARC for Arroyo de los Caballos and CD for Cantera de Dunitas. Symbols from this study follow the same code used in [1], to the exception of grey circles corresponding to analysis of Arroyo de los Caballos (undifferentiated) and white to Cerro de Águila from [6]. Numbers correspond to EPMA results showed in the Table 1. Literature and new data define positive correlation trends parallel to the Ir: As = 1 line.
Minerals 09 00288 g008
Table 1. Representative EPMA analyses of minerals from the laurite-erlichmanite series.
GrainPhase (wt.%)#OsIrRuPtPdRhFeNiCuSAsCrTotal
ACA-4/1OsP-La113.8113.5134.93b.l.db.l.d1.060.760.250.0430.632.332.1199.43
ACA-4/2OsP-La221.049.2534.09b.l.db.l.d0.370.520.080.0330.761.081.1898.40
ACA-4/5OsP-La322.487.8533.41b.l.db.l.d0.430.710.050.0330.450.791.7097.90
ACA-4/6OsR-La422.779.7923.45b.l.db.l.d2.330.570.050.0826.863.601.4490.94
ACA-4/9COsP-La517.268.3932.680.010.264.060.67-b.l.d29.464.091.7198.60
ACA-4/9OsP-La621.669.0930.50b.l.d0.083.780.690.02b.l.d28.924.011.71100.46
ACA-4/9ROsP-La717.316.0437.230.230.143.080.730.04b.l.d31.172.231.89100.09
ACA-4/10OsP-La85.825.4644.770.350.343.680.940.05b.l.d32.471.382.5997.86
ACA-4/14OsR-La926.339.2628.610.320.371.320.610.08b.l.d29.702.511.58100.69
ACA-4/16OsP-La1021.049.2534.09b.l.db.l.d0.370.520.080.0330.761.081.1898.40
ARC-16/4COsP-La110.010.5054.660.21b.l.d5.000.390.03b.l.d35.321.621.2398.97
ARC-16/5OsP-La1225.683.2132.130.650.331.120.550.03b.l.d30.451.171.6897.01
ARC-16/6OsP-La137.970.9850.990.31b.l.d1.670.470.05b.l.d34.50b.l.d1.0698.00
ARC-16/7COsP-La140.120.2853.980.38b.l.d4.540.480.02b.l.d34.251.751.4897.28
ARC-16/7ROsP-La157.340.9347.540.460.253.860.560.020.0233.481.731.7297.91
ARC-16/8OsP-La1616.2110.1432.000.020.123.800.500.060.0429.185.381.4498.89
CD-32/9OsR-La1727.306.5532.18b.l.d0.23b.l.d0.640.06b.l.d31.54b.l.d1.4999.99
Apfu (atoms per formula unit)OsIrRuPtPdRhFeNiCuSAsRu/(Ru + Os)
ACA-4/1OsP-La10.140.140.69--0.020.03--1.910.060.83
ACA-4/2OsP-La20.220.100.68--0.010.02--1.940.030.75
ACA-4/5OsP-La30.240.080.68--0.010.03--1.940.020.74
ACA-4/6OsR-La40.270.120.53--0.050.02--1.900.110.66
ACA-4/9COsP-La50.180.090.65--0.080.02--1.860.110.78
ACA-4/9OsP-La60.230.100.62--0.080.03--1.840.110.73
ACA-4/9ROsP-La70.180.060.72--0.060.03--1.900.060.80
ACA-4/10OsP-La80.060.050.84--0.070.03--1.910.030.94
ACA-4/14OsR-La90.290.100.58--0.030.02--1.910.070.67
ACA-4/16OsP-La100.220.100.68--0.010.02--1.940.030.75
ARC-16/4COsP-La11--0.94--0.080.01--1.920.041.00
ARC-16/5OsP-La120.280.030.650.01-0.020.02--1.950.030.70
ARC-16/6OsP-La130.080.010.91--0.030.02--1.95-0.92
ARC-16/7COsP-La14--0.95--0.080.02--1.900.041.00
ARC-16/7ROsP-La150.070.010.87--0.070.02--1.920.040.92
ARC-16/8OsP-La160.170.110.64--0.070.02--1.840.150.79
CD-32/9OsR-La170.290.070.64---0.02--1.98-0.69
OsP-La: Os-poor laurite, OsR-La: Os-rich laurite, C: Core, R: Rim, b.l.d.: below limit of detection.

