Crystals from the Powellite-Scheelite Series at the Nanoscale: A Case Study from the Zhibula Cu Skarn, Gangdese Belt, Tibet


1
School of Chemical Engineering, The University of Adelaide, Adelaide, S.A. 5005, Australia
2
Key Laboratory of Mineral Resources, Institute of Geology and Geophysics, Chinese Academy of Sciences, Beijing 100029, China
3
Adelaide Microscopy, The University of Adelaide, Adelaide, S.A. 5005, Australia
*
Author to whom correspondence should be addressed.
Minerals 2019, 9(6), 340; https://doi.org/10.3390/min9060340
Submission received: 1 May 2019
/
Revised: 24 May 2019
/
Accepted: 30 May 2019
/
Published: 3 June 2019
(This article belongs to the Special Issue Minerals Down to the Nanoscale: A Glimpse at Ore-Forming Processes)
Abstract
:Scheelite (CaWO4) and powellite (CaMoO4) are isostructural minerals considered as a non-ideal solid solution series. Micron- to nanoscale investigation of a specimen of skarnoid from Zhibula, Gangdese Belt, Tibet, China, was carried out to assess the identity of the phases within a broad scheelite-powellite (Sch-Pow) compositional range, and to place additional constraints on redox changes during ore formation. An electron probe microanalysis shows that Mo-rich domains within complex oscillatory-zoned single crystals, and as thin sliver-like domains, have a compositional range from 20 mol.% to 80 mol.% Pow. These occur within a matrix of unzoned, close-to-end-member scheelite aggregates (87 mol.%–95 mol.% Sch). Laser-ablation inductively coupled plasma mass spectrometry spot analysis and element mapping reveal systematic partitioning behaviour of trace elements in skarn minerals (grossular50, diopside80, anorthite, and retrograde clinozoisite) and scheelite-powellite aggregates. The Mo-rich domains feature higher concentrations of As, Nb, and light rare earth elements LREE, whereas W-rich domains are comparatively enriched in Y and Sr. Transmission electron microscopy (TEM) was carried out on focused-ion-beam-prepared foils extracted in situ from domains with oscillatory zoning occurring as slivers of 20 mol.%–40 mol.% Pow and 48 mol.%–80 mol.% Pow composition within an unzoned low-Mo matrix (20 mol.% Pow). Electron diffractions, high-angular annular dark field (HAADF) scanning-TEM (STEM) imaging, and energy-dispersive spectroscopy STEM mapping show chemical oscillatory zoning with interfaces that have continuity in crystal orientation throughout each defined structure, zoned grain or sliver. Non-linear thermodynamics likely govern the patterning and presence of compositionally and texturally distinct domains, in agreement with a non-ideal solid solution. We show that the sharpest compositional contrasts are also recognisable by variation in growth direction. Atomic-scale resolution imaging and STEM simulation confirm the presence of scheelite-powellite within the analysed range (20 mol.%–80 mol.% Pow). Xenotime-(Y) inclusions occur as nm-wide needles with epitaxial orientation to the host scheelite-powellite matrix throughout both types of patterns, but no discrete Mo- or W-bearing inclusions are observed. The observed geochemical and petrographic features can be reconciled with a redox model involving prograde deposition of a scheelite+molybdenite assemblage (reduced), followed by interaction with low-T fluids, leading to molybdenite dissolution and reprecipitation of Mo as powellite-rich domains (retrograde stage, oxidised). The observation of nanoscale inclusions of xenotime-(Y) within scheelite carries implications for the meaningful interpretation of petrogenesis based on rare earth element (REE) concentrations and fractionation patterns. This research demonstrates that HAADF-STEM is a versatile technique to address issues of solid solution and compositional heterogeneity.
1. Introduction
Solid solutions comprise two (or more) ions or molecules sharing a single crystal lattice. Among minerals, exchange of these components without any significant change in structure defines a solid solution series. Complete solid solution is said to exist when unlimited solid solution occurs between end-members. Geological processes can, however, lead to the preservation of co-existing, compositionally distinct members of a complete binary solid solution series.
Scheelite (CaWO4) and powellite (CaMoO4) are isostructural tungstate and molybdate minerals widely considered as a continuous, binary solid solution series, the powellite-scheelite series (e.g., [1]), in which Mo6+ and W6+ substitute for one another. Together with the analogue Pb-molybdate and -tungstate minerals—stolzite, Pb(WO4) and wulfenite, Pb(MoO4) — they make up the scheelite group, crystallizing in the tetragonal crystal system, space group I41/a, point group 4/m. Hazen et al. [2] give crystal structure data and assess changes in crystal structure up to 5.7 GPa.
On the basis of the results of experimental synthesis, the series is considered continuous from scheelite to powellite [3]. This is also supported by the small difference (<1%) in the unit cell parameters [2], suggesting a wide range of miscibility. However, the variation in cell parameters with composition, that is, the fact that a is greater for scheelite and c greater for powellite, implies a greater degree of complexity than may be expected in an ideal solid solution series [4].
Scheelite is a common mineral found in tungsten skarns, in medium- to high-temperature hydrothermal veins and greisens, and in granitic pegmatites. As a resistate mineral, it can also be concentrated in alluvial deposits. Powellite is, by contrast, rare as a hypogene mineral. It more typically occurs as a secondary mineral in the oxidation zones of Mo-bearing hydrothermal deposits in which the primary Mo-mineral is molybdenite.
Variation in the Mo content of scheelite and generally higher powellite components appear to be a common feature of skarns (e.g., [5]). Hsu and Galli [1] noted a broad compositional range for scheelite-powellite of contact-metasomatic origin (up to 53.5 mol.% CaMoO4), even though most of the specimens they analyzed (by wet chemical methods) contained <5.0 mol.% CaMoO4. In other ore types analyzed by them, scheelite rarely contained more than 0.05 mol.% CaMoO4. Hsu and Galli [1] went on to invoke multistage mineralization in contact-metasomatic rocks to explain the presence of different compositions in CaWO4–CaMoO4 compositional space, either as separate grains or as overgrowths. Hsu [6] later reconciled the scarcity of coexisting scheelite-powellite assemblages in terms of the very different fO2 conditions required for the formation of powellite and scheelite. In contrast, the common scheelite-molybdenite association is consistent with their wide overlap in fS2-fO2 conditions.
Compositional data obtained in situ on intermediate members of the powellite-scheelite series are nevertheless scarce in the literature. Förster et al. [7] report powellite components of 3.2 mol.% to 58 mol.% in scheelite from the Altenberg Sn deposit, Erzgebirge, Germany, including compositionally-zoned, single crystals. Brugger et al. [8] report a continuous range of compositions of 28 mol.%–70 mol.% powellite from small syngenetic exhalative Fe–Mn deposits in the eastern Swiss Alps that also displayed distinctive zoning expressed as W-rich rims surrounding a Mo-rich core. Such observations are consistent with the nonideal solid solution model for scheelite-powellite given by Fernández-González et al. [4], in which the crystallization behaviour of the system CaWO4–CaMoO4–H2O is considered to lead to compositional zoning at the grain-scale. Additional compositional data for intermediate compositions, albeit at the scheelite end of the spectrum, are given by Kwak and Tan (<~20 mol.% powellite [9]) and Zaw and Singoyi (<~5 mol.% powellite [10]).
Specimens of scheelite-powellite have also been studied for variation in the concentration of other elements that can occur within the crystal structure or as discrete inclusions. For example, As and Y were measured as minor elements in zoned scheelite-powellite grains from the occurrence in the Swiss Alps [8] and these show a positive correlation with Mo content along grain rims and fractures. Moreover, discrete rare earth element (REE)-minerals, such as paraniite-(Y) and [Ca2Y(AsO4)(WO4)2], were documented as nanoscale inclusions within the Mo-rich domains. Geochemical modelling of REE patterns in zoned scheelite from the giant Archean gold deposits, Kalgoorlie (Western Australia), combined with μ-X-ray absorption near edge structure (XANES) spectroscopy, has shown that changes in the oxidation state of europium can track fluid–rock interactions via pH variation [11,12]. Many recent studies (e.g., [13,14,15]) have focused on the variation in REE fractionation patterns in scheelite from individual deposits, or from different deposit types in a given metallogenetic province. These studies have used measurable variation to track the evolution of ore-forming fluids and the impact of sequential or superimposed events.
Advances in modern analytical techniques, particularly those dedicated to quantitative measurement of trace element concentrations and Z-contrast high-resolution imaging, and especially when the two techniques are combined (e.g., [16,17,18,19]), allow for a better understanding of the solid-solution series, as well as the incorporation of trace elements into minerals and their subsequent release upon recrystallization or replacement.
In this contribution, we report micron-scale intergrowths among compositionally varied, intermediate members of the scheelite-powellite series, which occur as accessory phases in the Zhibula Cu skarn, Gangdese belt, southern Tibet [20,21,22]. We investigate, at the nanoscale, the boundaries between distinct domains with different mol.% powellite components within single grains of scheelite-powellite. Using these specimens, our objectives are firstly to shed light on the fundamental character and crystallization behaviour of the scheelite-powellite solid solution. Secondly, these new data allow additional constraints to be placed on changes in redox conditions during formation of the Zhibula skarn. As an additional objective, concentrations of rare earth element (REE) are measured in Zhibula scheelite-powellite. These data are evaluated in the context of nanoscale observations showing the presence of xenotime inclusions in scheelite.
2. Zhibula Cu Skarn
Copper–Mo mineralisation is often formed as paired porphyry–skarn systems associated with magmatism along subduction/post subduction settings in young Alpine belts, such as the Gangdese Belt in southern Tibet [23]. A good, well-studied example is represented by the Zhibula Cu skarn (0.32 Mt Cu, @ 1.64% Cu grade; Figure 1) and Qulong porphyry Cu–Mo deposit, which lie ~2 km apart [20,21,22]. Miocene magmatism at ~17 Ma was documented from both deposits, albeit from deeper monzogranite and granodiorite dikes at Zhibula [20,24].
The skarn protolith is found in the limestone/dolomite sequences throughout the Yeba volcano–sedimentary sequence of Jurassic age (U–Pb zircon age 174.4 ± 1.7 Ma; [20]). Fluid inclusion data from Zhibula indicate fluids typical of skarn evolution, from relatively high temperature (405–667 °C), high salinity (up to 44.0 wt.% NaCl equiv.) fluids to low temperature (194–420 °C), moderate salinity (10.1–18.3 and 30.0–44.2 wt.% NaCl equiv.) fluids, with a dominance of magmatic–hydrothermal fluids based upon sulphur, hydrogen and oxygen isotope data [20,21].
Skarn assemblages and trace element concentrations in garnet and associated minerals from the Zhibula deposit reveal a diverse mineralogy and orefield-scale zonation controlled by variation in the local environment, including fluid source(s) and protoliths [22]. Late skarn, superimposed onto early skarnoid in both marble and tuff, has a distal character relative to the more proximal, massive skarn formed at the same location, where proximal and distal refers to the spatial relationship with fault-driven fluids generating a metasomatic reaction. The trace element signatures of garnet vary in space and time and are controlled by a variety of factors, for example, the mineralogy of co-crystallizing phases, variation in X(CO2), salinity, and proximity to local fluid sources and/or intrusion contact. A conspicuous feature of Zhibula garnets is the marked enrichment in several trace elements, including W, Sn, As, and Mo, supporting the genetic connection and sharing of ore-forming fluids between skarn and Cu–Mo porphyry. Although the Cu mineralisation forms massive lenses, the skarn hosting the orebodies also contains disseminations and pockets of a diverse range of sulphides; Fe-oxides; and, importantly, also scheelite and molybdenite. The latter two minerals, and particularly oscillatory-zoned grains of scheelite-powellite, are present as coarser aggregates along stringer zones in skarnoid formed on behalf of tuff. The sample analysed here is from this assemblage.
3. Sample and Methodology
A specimen of garnet–diopside–anorthite skarnoid containing grains representative of minerals in the scheelite-powellite solid solution (sample #168) was prepared as a one-inch-diameter polished block. All analytical work was carried out at Adelaide Microscopy, University of Adelaide.
Imaging was performed in reflected light and using an FEI Quanta 450 scanning electron microscope (SEM) (FEI, Hillsboro, OR, USA) with energy-dispersive X-ray spectrometry and back-scatter electron (BSE) imaging capabilities. Cathodoluminescence (CL) imaging was performed using a Gatan CL system (Gatan Inc., Pleasanton, CA, USA) on a FEI Quanta 600 SEM (FEI, Hillsboro, OR, USA). Images were acquired at a voltage of 10 kV and contrast-enhanced for better observation.
Quantitative mineral compositional data were obtained using a Cameca SX-Five electron probe microanalyser (Cameca SAS, Gennevilliers Cedex, France). X-ray lines and standards used were as follows: Ca Kα (scheelite), Mn Kα (rhodonite), Mg Kα, Si Kα, Fe Kα (almandine garnet), Al Kα (albite), Ti Kα (rutile), Cr Kα (chromite), P Kα (apatite), Nb Lα (niobium metal), V Kα (vanadium metal), W Lα (scheelite), Zn Kα (willemite), Zr Lα (zircon), Mo Lα (powellite), Sn Lα (cassiterite), Ta Mα (Ta), and Ni Kα (pentlandite). Count times were 15 s for unknown and 10 s background for all elements. Average minimum detection limits (in wt.%) were as follows: Ca (0.01), Mn (0.03), Mg (0.01), Si (0.03), Fe (0.03), Al (0.02), Ti (0.01), Cr (0.03), P (0.02), Nb (0.06), V (0.03), W (0.13), Zn (0.05), Zr (0.04), Mo (0.03), Sn (0.03), Ta (0.04), Ni (0.03). Most elements were consistently below the minimum limits of detection, therefore, only Ca, W, and Mo are included in the table.
Trace element data were obtained by laser ablation inductively coupled plasma mass spectrometry (LA-ICP-MS) using a RESOlution 193 ArF M-50 excimer laser ablation system (Applied Spectra Inc., Fremont, SA, USA) coupled to an Agilent 7700x ICP-MS. Analyses for spots were performed with an energy density of ~3 J/cm2, spot size of 29 μm, and repetition rate of 5 Hz. Each spot analysis consisted of ~30 s of background acquisition and ~40 s of sample data acquisition. Standard reference materials were NIST-610 [25] and GSD-1G [26]. Concentrations of elements were calculated using GLITTER software [27] and calibrated using 43Ca as the internal standard. Analyses for mapping were performed with an energy density of ~3 J/cm2, a spot size of 7 μm, a scan speed of 7 µm/s, and a repetition rate of 10 Hz. A 10 s background acquisition was acquired at the start of every raster, and to allow for cell wash-out, gas stabilization, and computer processing, a delay of 20 s was used after each line. Identical rasters were done on reference materials NIST-610 at the start and end of each mapping run. Images were compiled and processed using the program Iolite [28]. Average minimum detection limits, in ppm, were as follows: Ti (0.485), Fe (7.621), As (0.302), Sr (0.017), Nb (0.010), La (0.007), Ce (0.008), Pr (0.006), Nd (0.030), Sm (0.041), Eu (0.011), Gd (0.039), Tb (0.006), Dy (0.023), Y (0.007), Ho (0.006), Er (0.018), Tm (0.005), Yb (0.025), Lu (0.006).
Foils for transmission electron microscopy (TEM) study were prepared using an FEI-Helios nanoLab dual focused ion beam-SEM (FIB-SEM; Hillsboro, OR, USA), following procedures outlined by Ciobanu et al. [29]. TEM imaging, electron diffractions, and energy-dispersive X-ray (EDX) spectra were obtained using a Philips CM200 TEM (Philips, Eindhoven, The Netherlands) equipped with a LaB6 source, double-tilt holder, and Gatan Orius digital camera (Gatan Inc., Pleasanton, CA, USA) operated at 200 kV. Energy-dispersive X-ray spectra (EDS) were acquired using an Oxford Instruments X-Max 65T SDD detector (Oxford Instruments, Abingdon, UK) running Aztec software. Measurements on the diffractions were performed using DigitalMicrograph™ 3.11.1 (Gatan Inc., Pleasanton, CA, USA). High angle annular dark field scanning-TEM (HAADF STEM) imaging and EDX spot analysis and mapping were performed using an FEI Titan Themis S/TEM instrument (FEI, Hillsboro, OR, USA) operated at 80 kV. This instrument is equipped with the X-FEG Schottky source and Super-X EDS geometry.
Diffraction indexing was carried out using Winwulff© 1.5.2 software (JCrystalSoft, Livermore, CA, USA) and publicly available data from the American Mineralogist Crystal Structure Database. Crystal structure simulations were carried out using CrystalMaker® version 10.1.1 (CrystalMaker Software, Begbroke, UK) and STEM for xHREMTM version 4.1 software (HREM Research, Tokyo, Japan).
4. Results
4.1. Sample Petrography
The skarnoid in the studied sample comprises a primary assemblage of calcic garnet with intermediate composition in the grossular (Gr)–andradite series (Gr50), anorthite, and lesser diopside (Di80). This is superimposed by a retrograde association of clinozoisite, actinolite/tremolite, and chlorite. Garnet aggregates occur as small lenses/islands within a groundmass of anorthite + diopside (Figure 2a). The dark, quartz-bearing part of the sample is made up of relicts of the tuff protolith (Figure 2a), recognisable from igneous accessories such as zircon and ilmenite, the latter broken down to symplectites of rutile and titanite. Retrograde clinozoisite and actinolite/tremolite replace grossular and diopside (Figure 2b,c). Thin stringers containing scheelite-powellite (Sch-Pow) and molybdenite are found in the groundmass outside the garnet (Figure 2b), where they are intergrown with minerals from the retrograde assemblage. Molybdenite forms short, acicular bundles mostly surrounding and partially replacing the Sch-Pow aggregates (Figure 2c).
The Sch-Pow aggregates (tens to hundreds of μm in size) exhibit oscillatory zoning, as dark and bright zones on both BSE and CL images, with irregular distribution throughout the imaged areas (Figure 3). On both types of images, Mo-rich areas are darker and surround the brighter, W-rich domains (Figure 3a). Centres of oscillatory zoning occur throughout either domain type, but are better displayed on BSE images for the Mo-rich areas, whereas concentric growth zones and brightest rims in the W-rich domains are displayed on CL images (Figure 3b,c). The darkest (Mo-richest) areas in the assemblage are either un-zoned at this magnification, or show sub-micron, high-contrast zoning (arrowed in Figure 3a).
4.2. Compositional Data: Major and Trace Elements
The extent of compositional variation within the scheelite-powellite aggregates was assessed by electron probe microanalysis (EPMA; Table 1). Individual spot analyses targeted homogenous areas (either W- or Mo-rich) and profiles were set across areas with oscillatory zoning. Concentrations of WO3 and MoO3 are within the following ranges: 21.55 wt.%–77.32 wt.% and 2.70 wt.%–51.86 wt.%, respectively, with a spread of powellite component between 5 mol.% and 79 mol.%. Concentrations of CaO are 19.98 wt.% to 25.46 wt.%.
The W versus Mo variation across oscillatory zoning patterns throughout the Mo-rich domains was also assessed by EDS SEM mapping (Figure 4). The maps reproduce, to some extent, the observed zoning on BSE images at medium or high-contrast (Figure 4a,c, respectively); the best fit is obtained for high-Mo zones (no more than a few μm-wide; Figure 4b). Although sub-micron-scale zoning patterns are not clearly visible because of the resolution of the technique, the inverse correlation between W and Mo is nonetheless clear and is responsible for the patterns observed on BSE images.
Trace element LA-ICP-MS data for scheelite-powellite are summarised in Table 2. Relatively homogeneous domains were targeted for analysis, but owing to crater size relative to the size of banding, it proved difficult to obtain reliable analytical data for the most Mo-rich domains. Nevertheless, the analysis provided some valuable findings. The most abundant trace elements are Sr (106~282 ppm), As (6.4~37 ppm), and Nb (2.7~6.4 ppm). ∑REY (REE+Y) concentrations range up to 114 ppm and are dominated by La (1.4–16 ppm), Ce (4–44 ppm), and Nd (4–36 ppm). Concentrations of heavy rare earth elements (HREE) are at or below minimum detection limits. Yttrium is also low (<2.8 ppm). Importantly, ∑REY, As, and Nb all display a positive correlation with Mo content, whereas Sr shows a contrasting correlation and is relatively enriched in scheelite compared with powellite (Figure 5). We also note concentrations of 2–3 ppm Ti in powellite, but <1 ppm in scheelite. Concentrations of several elements are measurable, yet very low and are not tabulated. These include Na (<5 ppm), Al (<2 ppm, Al (<1 ppm), Sc (<0.2 ppm), V (<2 ppm), Cr (<1 ppm), Mn (<2 ppm), Co (<1 ppm), Ni (<1 ppm), Cu (<1 ppm), Zn (<1 ppm), Rb (<0.3 ppm), Sn (<0.5 ppm), Ba (<1 ppm), Ta (<0.1 ppm), Pb (<3 ppm), Bi (<0.2 ppm), Th (<0.1 ppm), and U (<0.1 ppm).
Chondrite-normalized REY fractionation trends show variation among minerals in the skarnoid and the lithologies responsible for its formation, tuff protolith, and granodiorite intrusion (Figure 6). Although ∑REY values (16~114 ppm) are relatively low compared with most other scheelites worldwide (generally hundreds to thousands of ppm), they depict variation between W- and Mo-rich domains, indicating an increase in light rare earth elements (LREE) correlating with the powellite component (Figure 6a). In contrast, the intermediate Sch-Pow compositions represent an average of the two trends (Figure 6b), as these are obtained from areas with zoning. Nonetheless, all data (from three areas of the sample) display comparable trends, featuring a steep negative slope from LREE to HREE, and pronounced negative Eu- and Y-anomalies (Figure 6a,b). Grossular garnet and clinozoisite are the main REE carriers for prograde and retrograde stages, respectively (Figure 6c). Diopside and anorthite, both part of the prograde skarn, contain the least REE. The whole rock data for tuff (protolith) and granodiorite show comparable trends, albeit with a negative Eu-anomaly for the tuff (Figure 6d).
LA-ICP-MS element maps of scheelite-powellite (Figure 7 and Supplementary Material Figure S1) allow a visualization of grain-scale trace element distributions. These maps confirm that LREE (La, Ce, Pr and Nd), As, and Nb are all relatively enriched in Mo-dominant parts, whereas Sr exhibits an inverse correlation trend. The W-rich domains display Y-enrichment, which correlates with the strongest contrast (luminescence) on the CL images shown in Figure 3. This is concordant with the observation that the W-rich parts of the aggregates are close to end-member scheelite and display chaotic oscillatory zoning (CL images) with respect to HREE, particularly Y. In contrast, Mo-rich domains show compositional oscillatory zoning partially underpinned also by trace elements such as LREE, As, and Nb (Figure 7).
4.3. Nanoscale Characterisation of Scheelite-Powellite Grains
The nanoscale study was conducted for two reasons. Firstly, we sought to identify how the compositional ranges of Sch-Pow domains are expressed at the nanoscale, and secondly, to establish whether sub-μm-scale mineral inclusions (e.g., molybdenite, REE-minerals) are present, particularly in the areas with the highest Mo. Two areas of known composition (Figure 8a), both displaying oscillatory zoning, were selected: (i) a grain with intermediate composition across the series; and (ii) a high-Mo sliver (up to 80 mol.% Pow) (Figure 8b–e). Both areas represent Mo-richer domains throughout the Sch-Pow aggregates, but with different compositional ranges, averaging ~30 mol.% Pow for (i), and up to ~80 mol.% Pow for (ii), thus covering the lower and higher ends of the Mo-rich patterned areas (Figure 8a). Cross-section imaging shows that one side of the oscillatory-zoned grain is truncated at depth by zones of Mo- and W-high zones (Figure 8b,c). The Mo-rich sliver (48 mol.%–80 mol.% Pow) sits in a matrix of low Pow content (~20 mol.%) with no zoning (Figure 8d,e).
The geometry of the three domains depicted for the sampled oscillatory-zoned grain changed slightly during the thinning of the slice and subsequent lifting and attachment to the copper grid (Figure 9a–c). The oscillatory zoning on one side of this grain is visible on the secondary electron (SE) image, but not on the bright-field (BF) TEM image; a fourth, sub-surface domain is exposed in the S/TEM foil (Figure 9b,c). Electron diffractions obtained from the foil show no changes in orientation between the zoned grain (domain #1) and the Mo-richer domain (#2), as exemplified by the Sch/Pow zone axis obtained across the boundary between the two domains (Figure 9d). The junction between domains is marked, however, by saw-tooth boundaries and swarms of inclusions/pores (Figure 9e). These are considered indicative of (re-)crystallisation during fluid percolation. Nanometre-wide needles of xenotime-(Y) are present throughout the oscillatory-zoned grain (domain #1; Figure 9f,g).
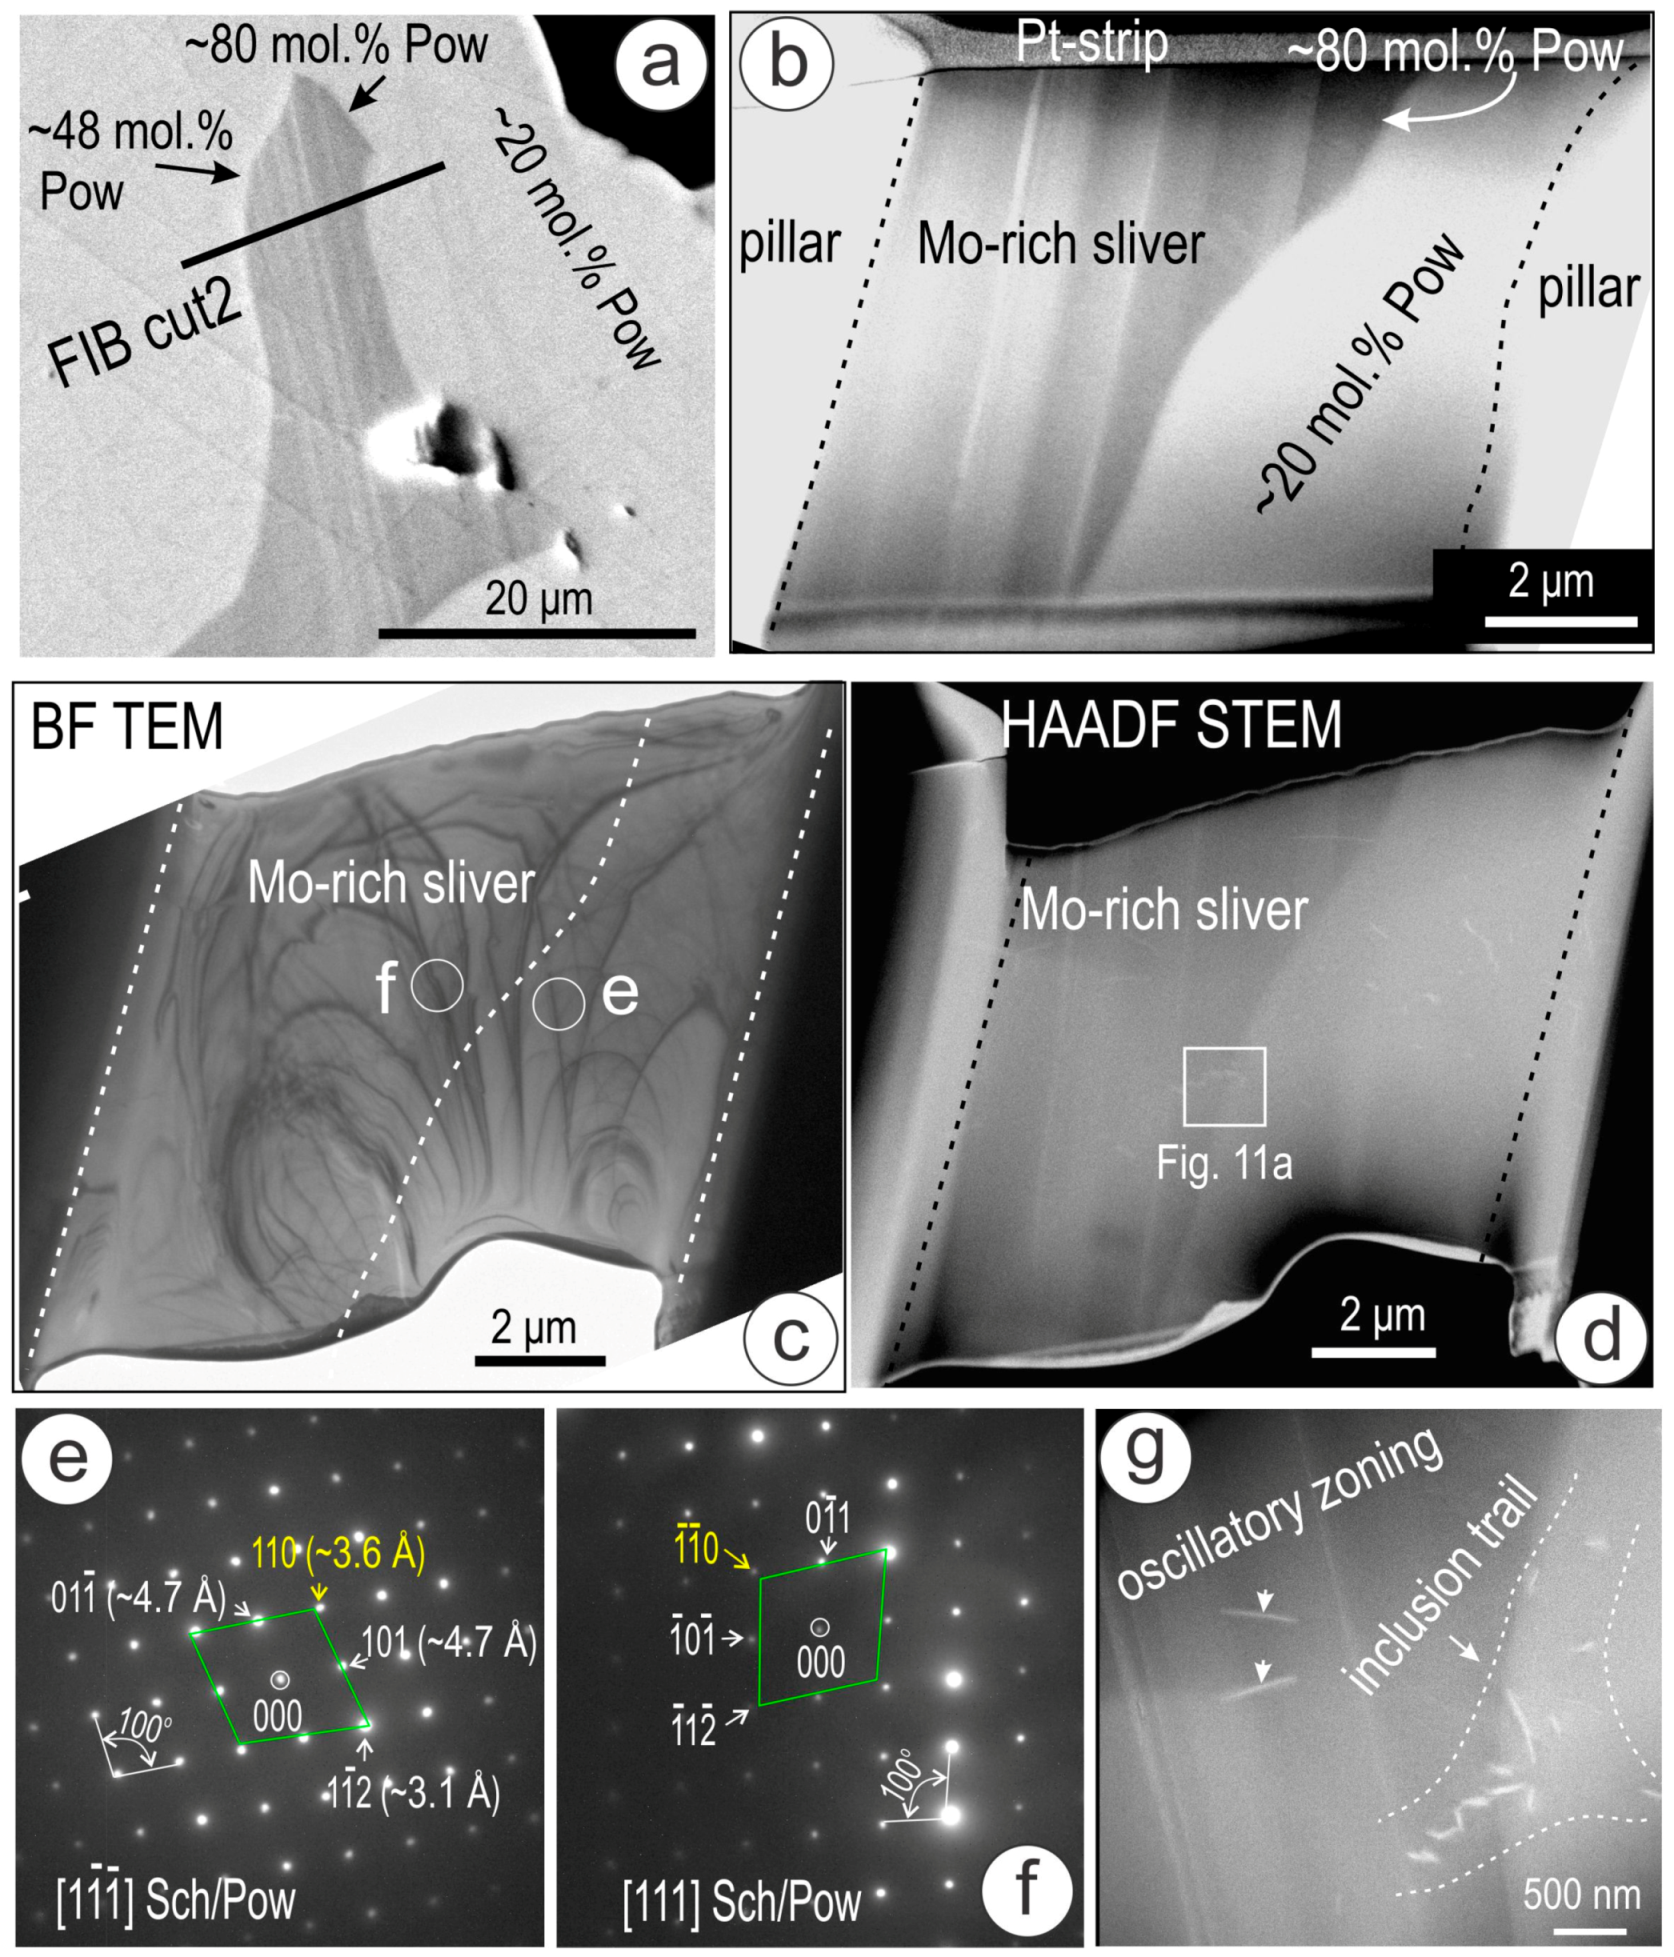
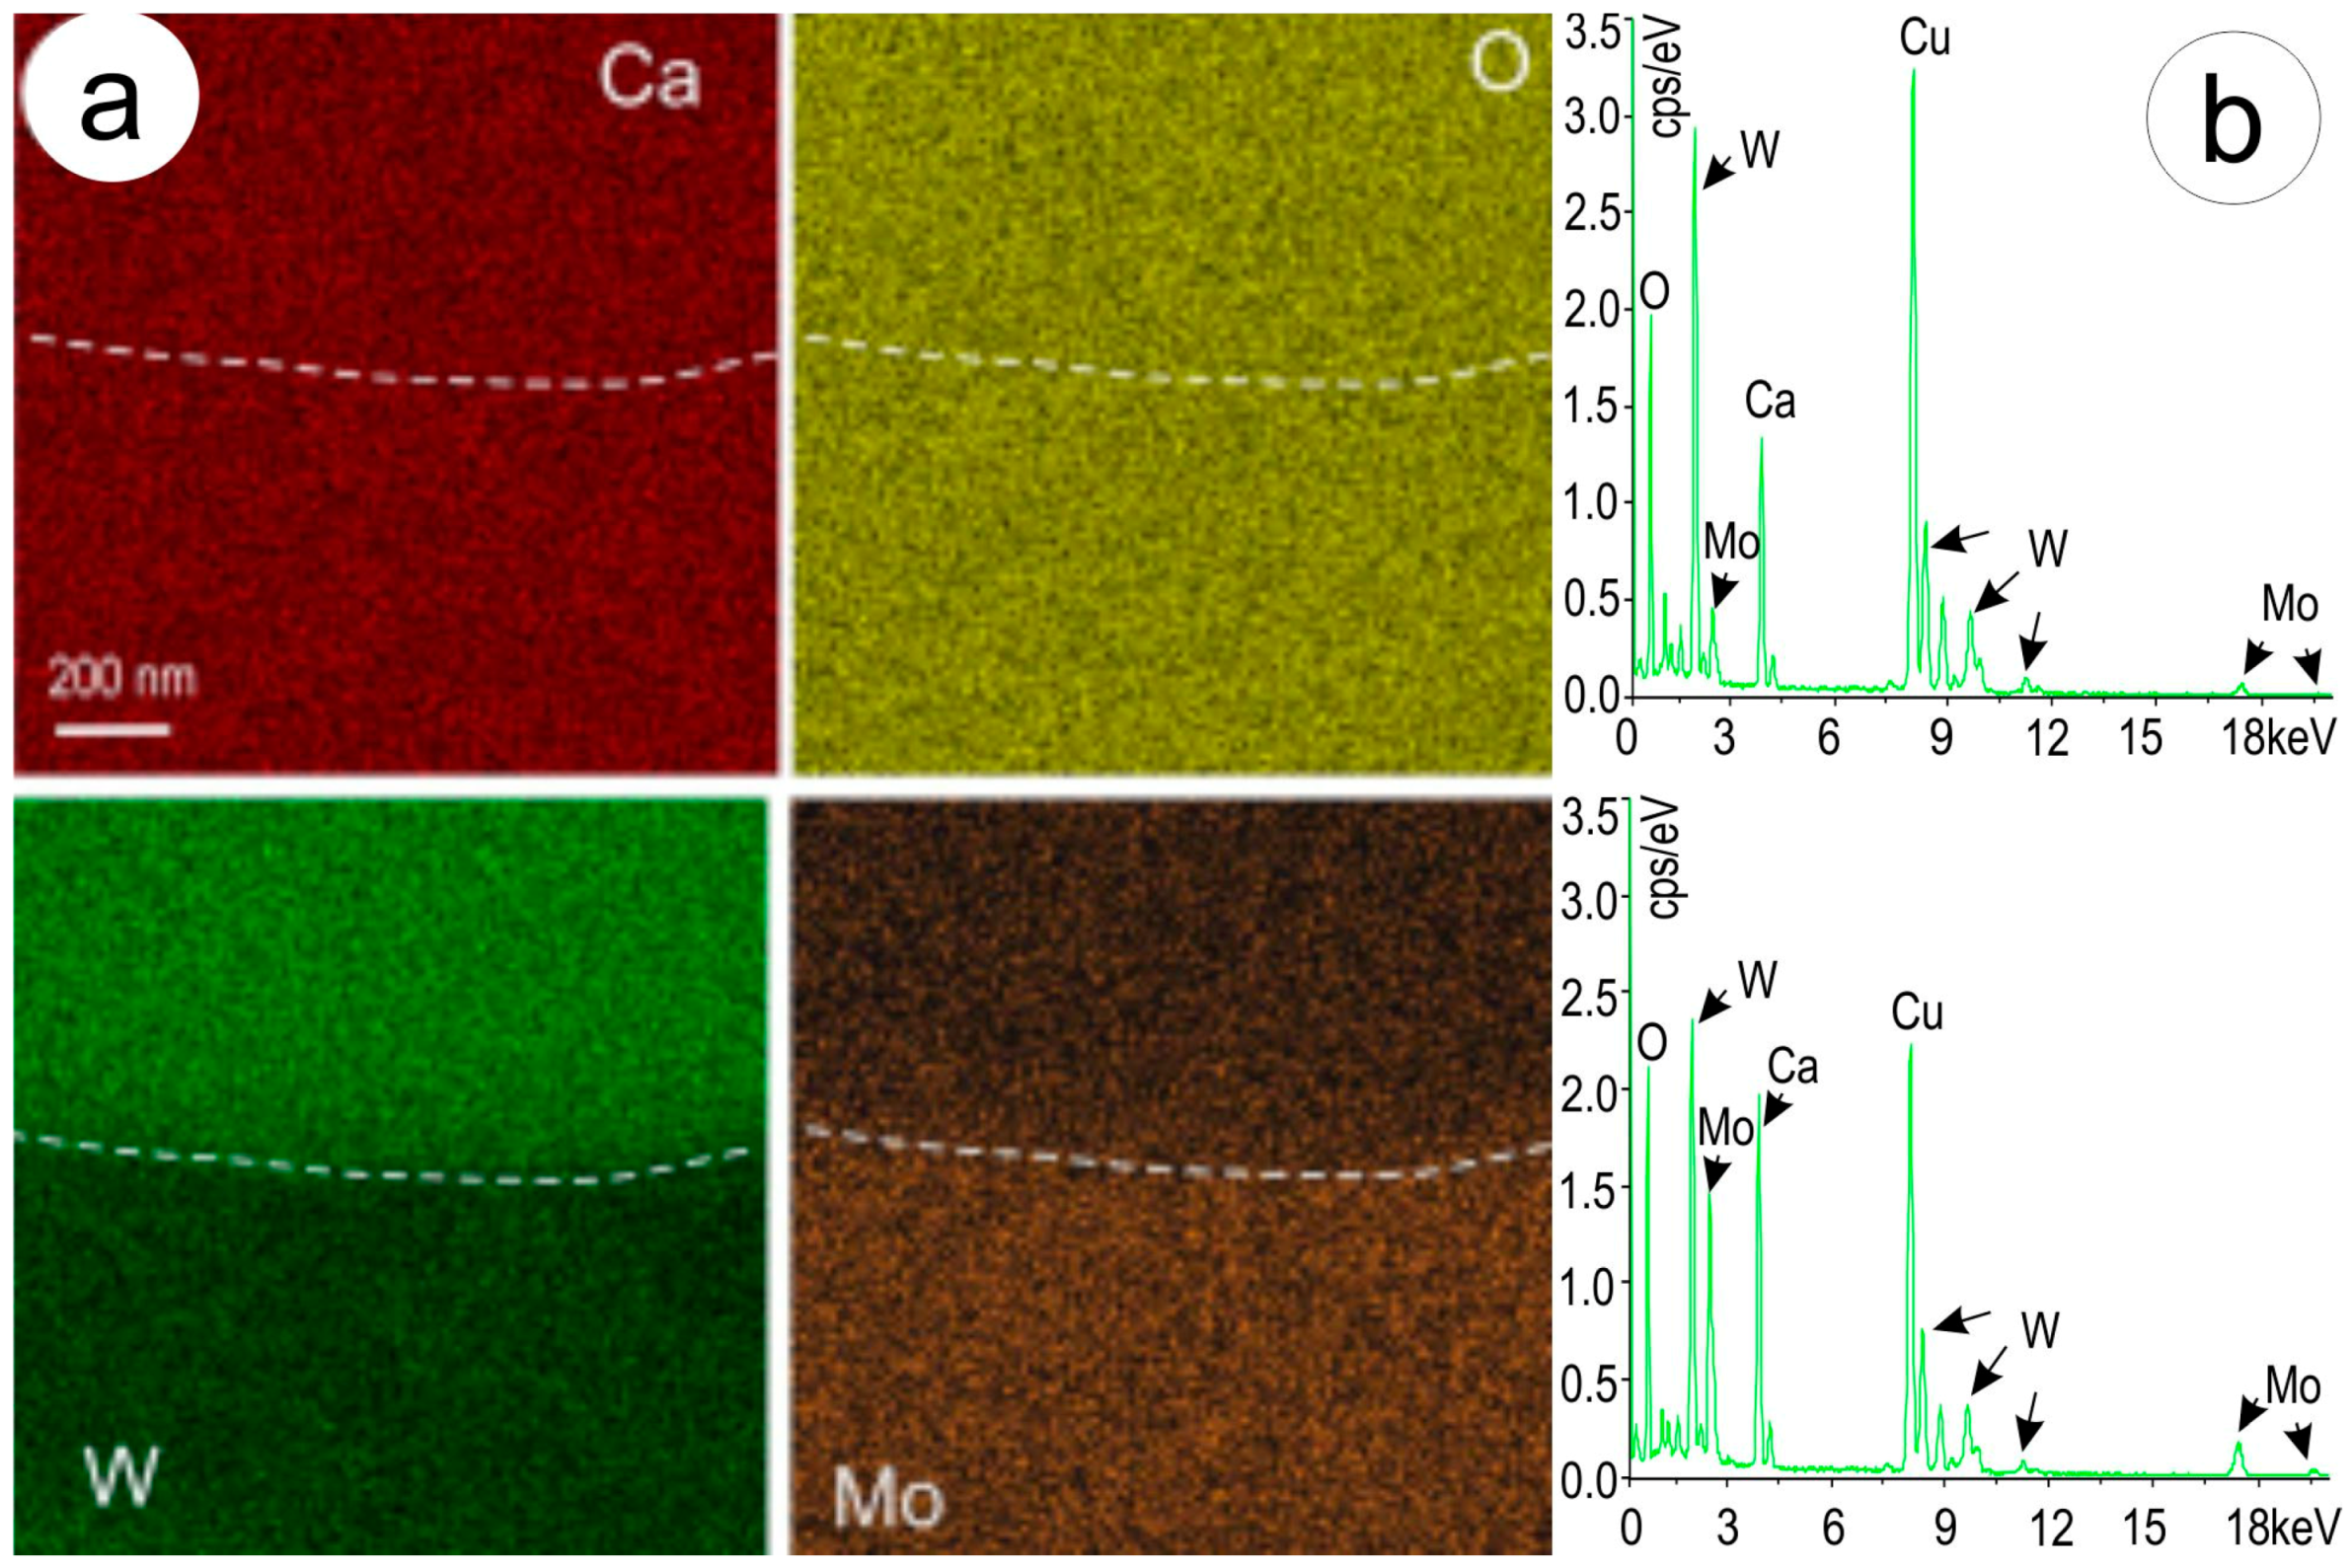
The sample obtained from one of the slivers with the highest Mo-content shows continuation of oscillatory zoning at depth (Figure 10a–d). In this case, selected areas of electron diffraction (SAEDs) obtained from the sliver and the matrix are rotated to one another at ~80° about * on the Sch/Pow zone axis (Figure 10e,f). The same type of nm-wide needle-shaped lamellae of xenotime-(Y) [Y(Ce,Nd)PO4] is present in the sample trails crosscutting the domain boundary (Figure 10g). The compositional differences across the two domains were assessed by EDS STEM mapping and spot analysis (Figure 11).
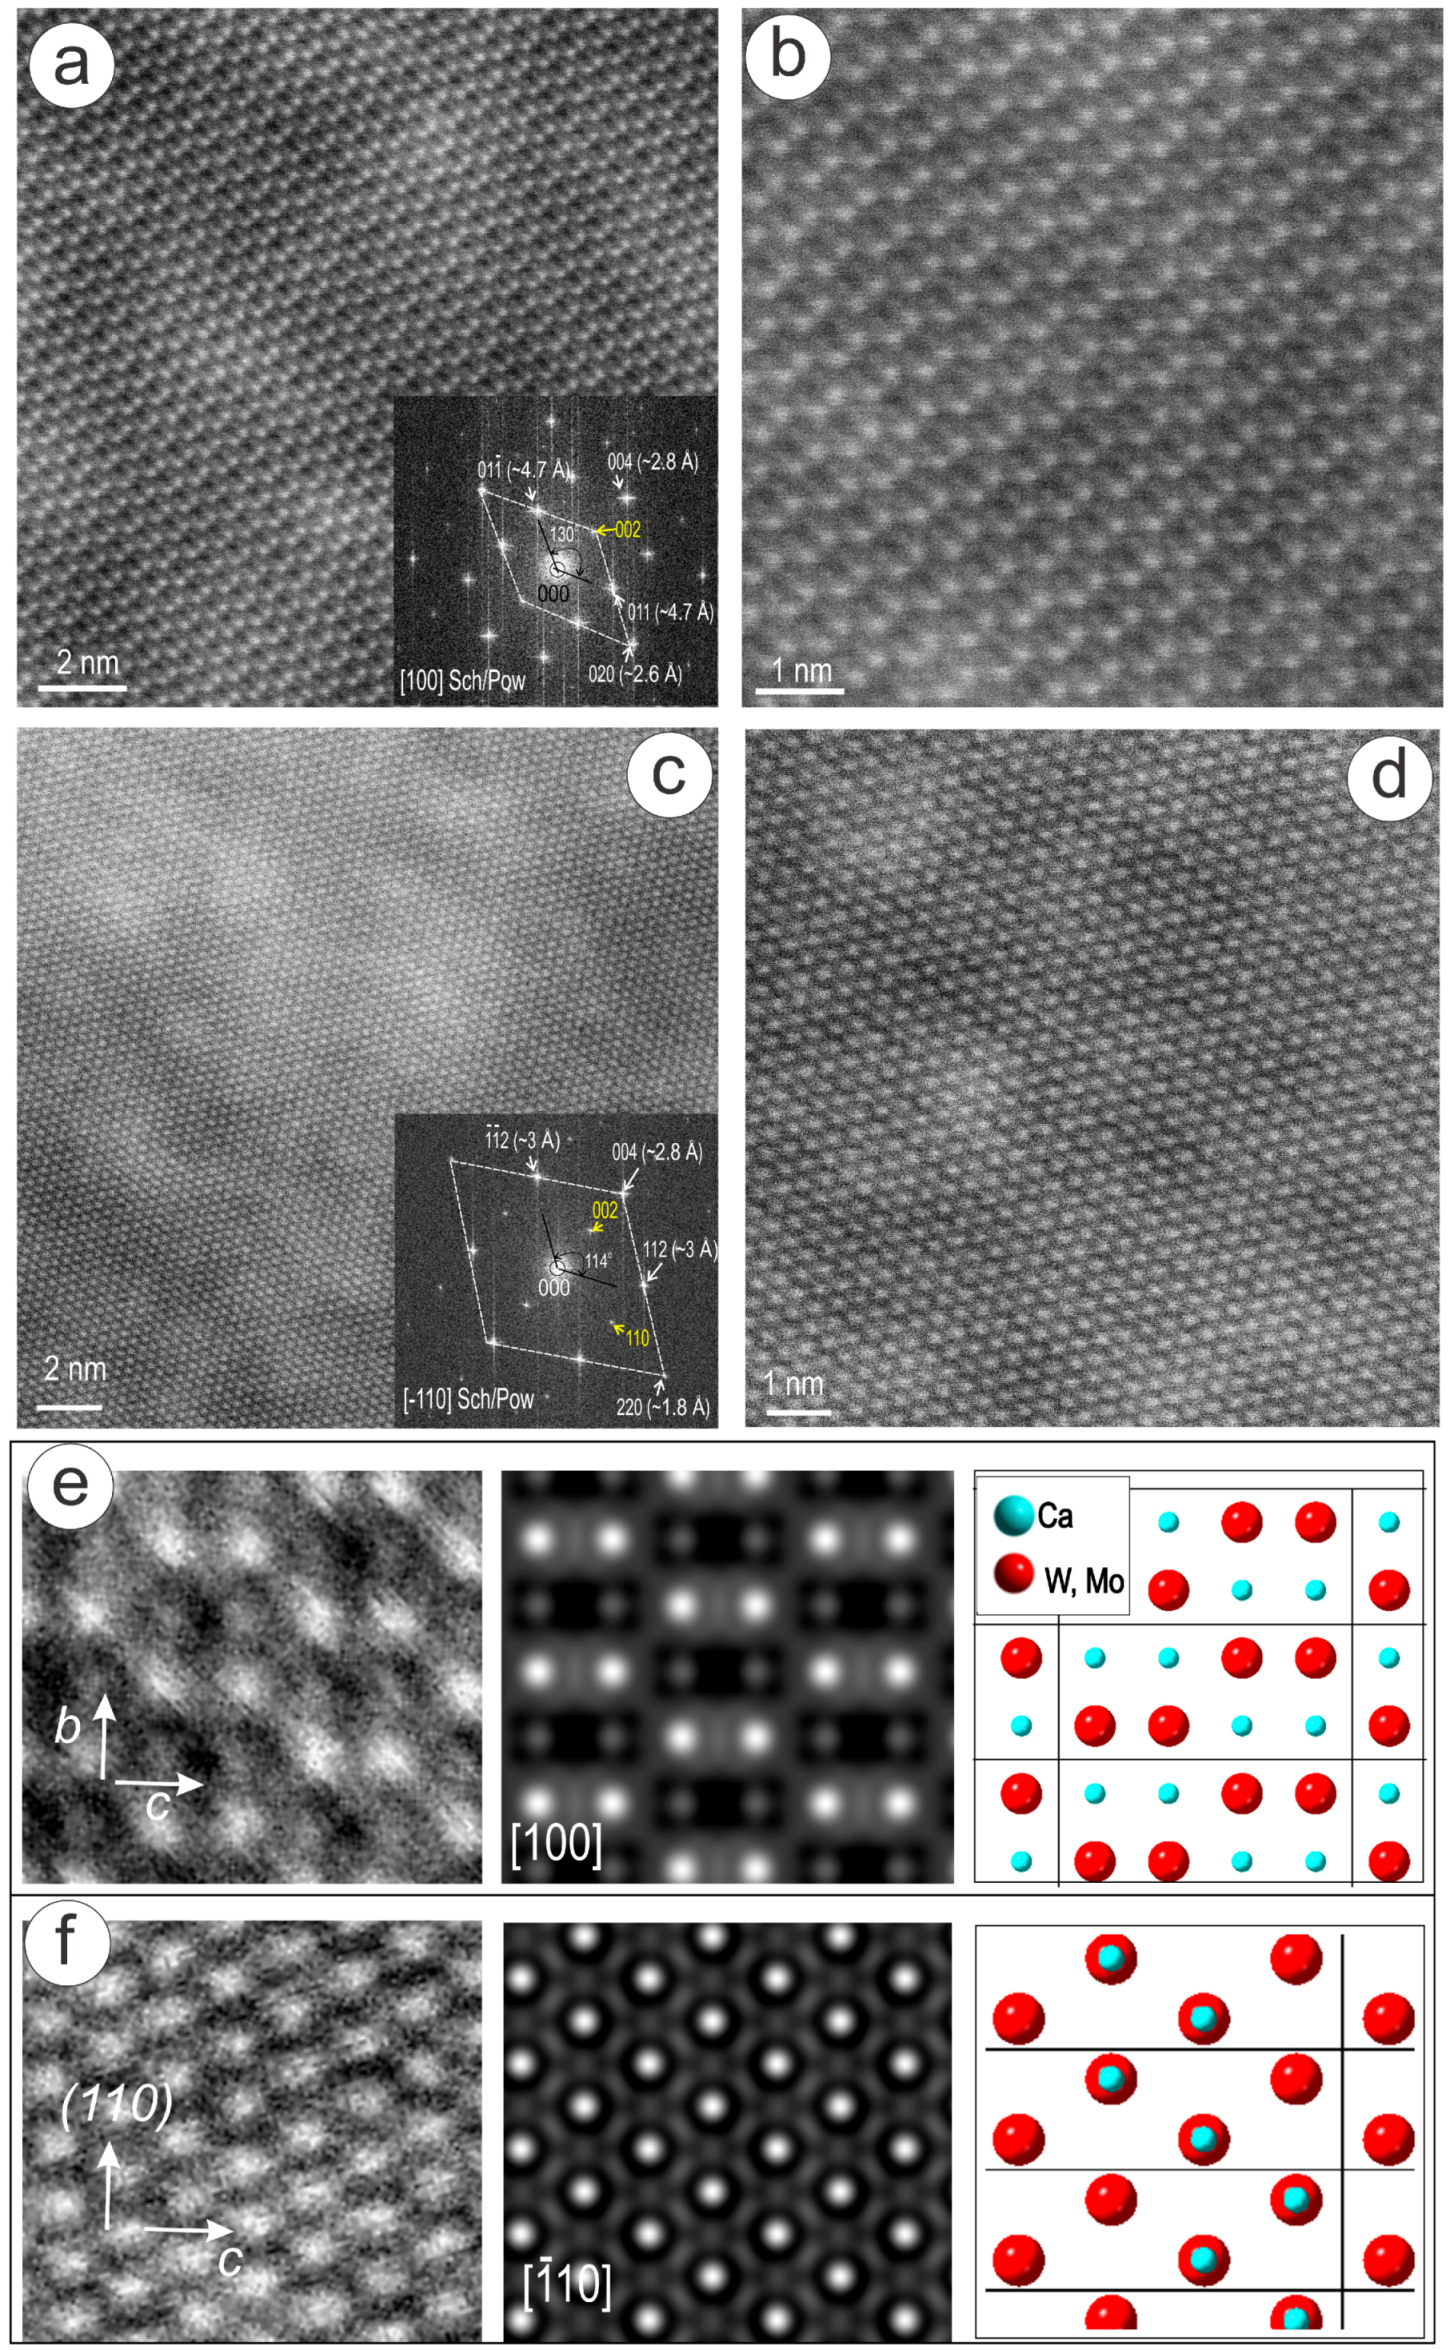
High-resolution HAADF STEM imaging of scheelite-powellite on two main zone axes (Figure 12) shows the same patterns for the two domains. The [100]Sch/Pow zone axis (Figure 12a,b) features pairs of bright W and Mo, and less bright Ca, atoms forming dumbbell arrays, whereas on the Sch/Pow zone axis, atoms of the same HAADF intensity and size form a tighter rhomb-shaped pattern (Figure 12c,d). STEM simulations show a good fit with the images and the crystal structure models (Figure 12e,f). The latter allow interpretation of the HAADF STEM images in terms of atom types, that is, brighter spots correspond to W or Mo, and the less brighter spots to Ca on the [100] zone axis. An overlap between W, Mo, and Ca atoms accounts for the even intensity of spots on the zone axis.
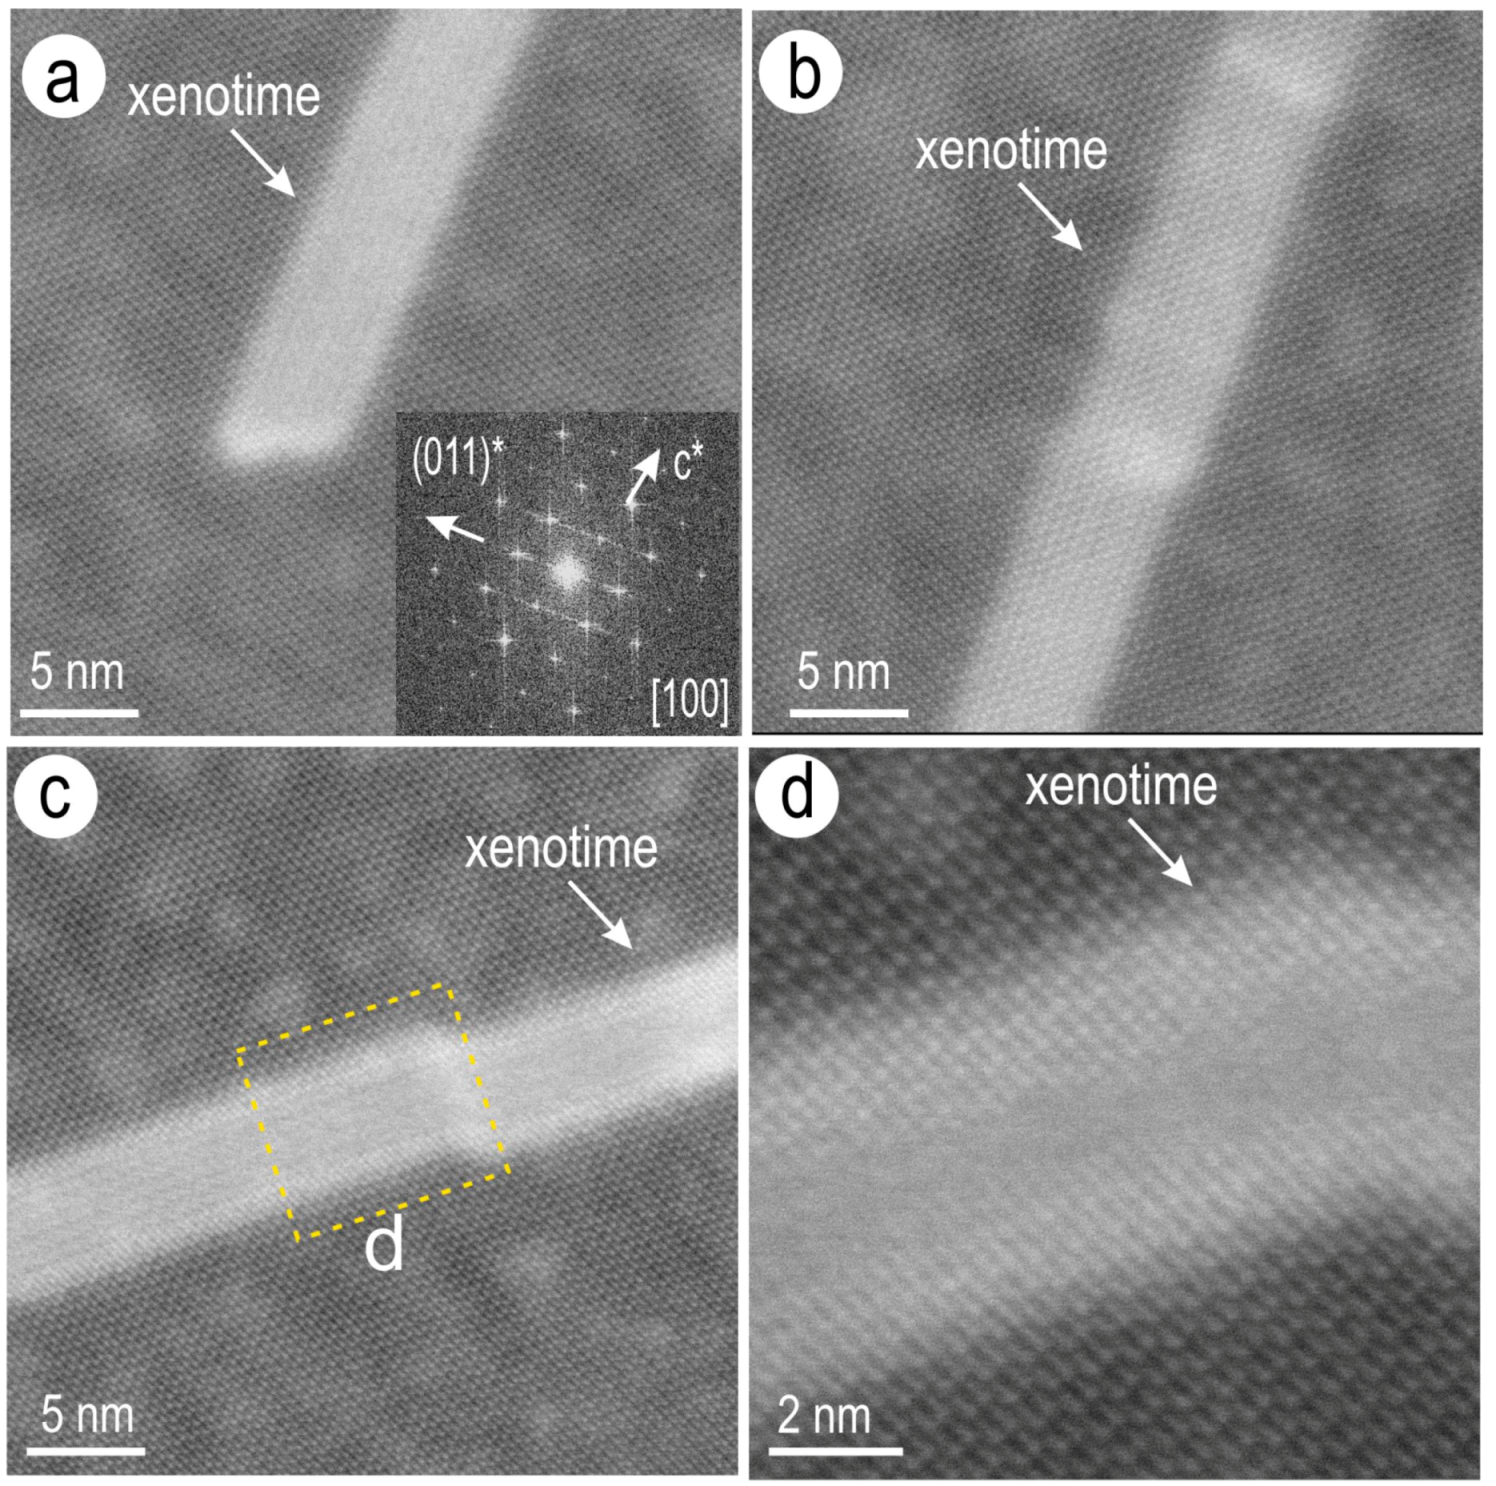
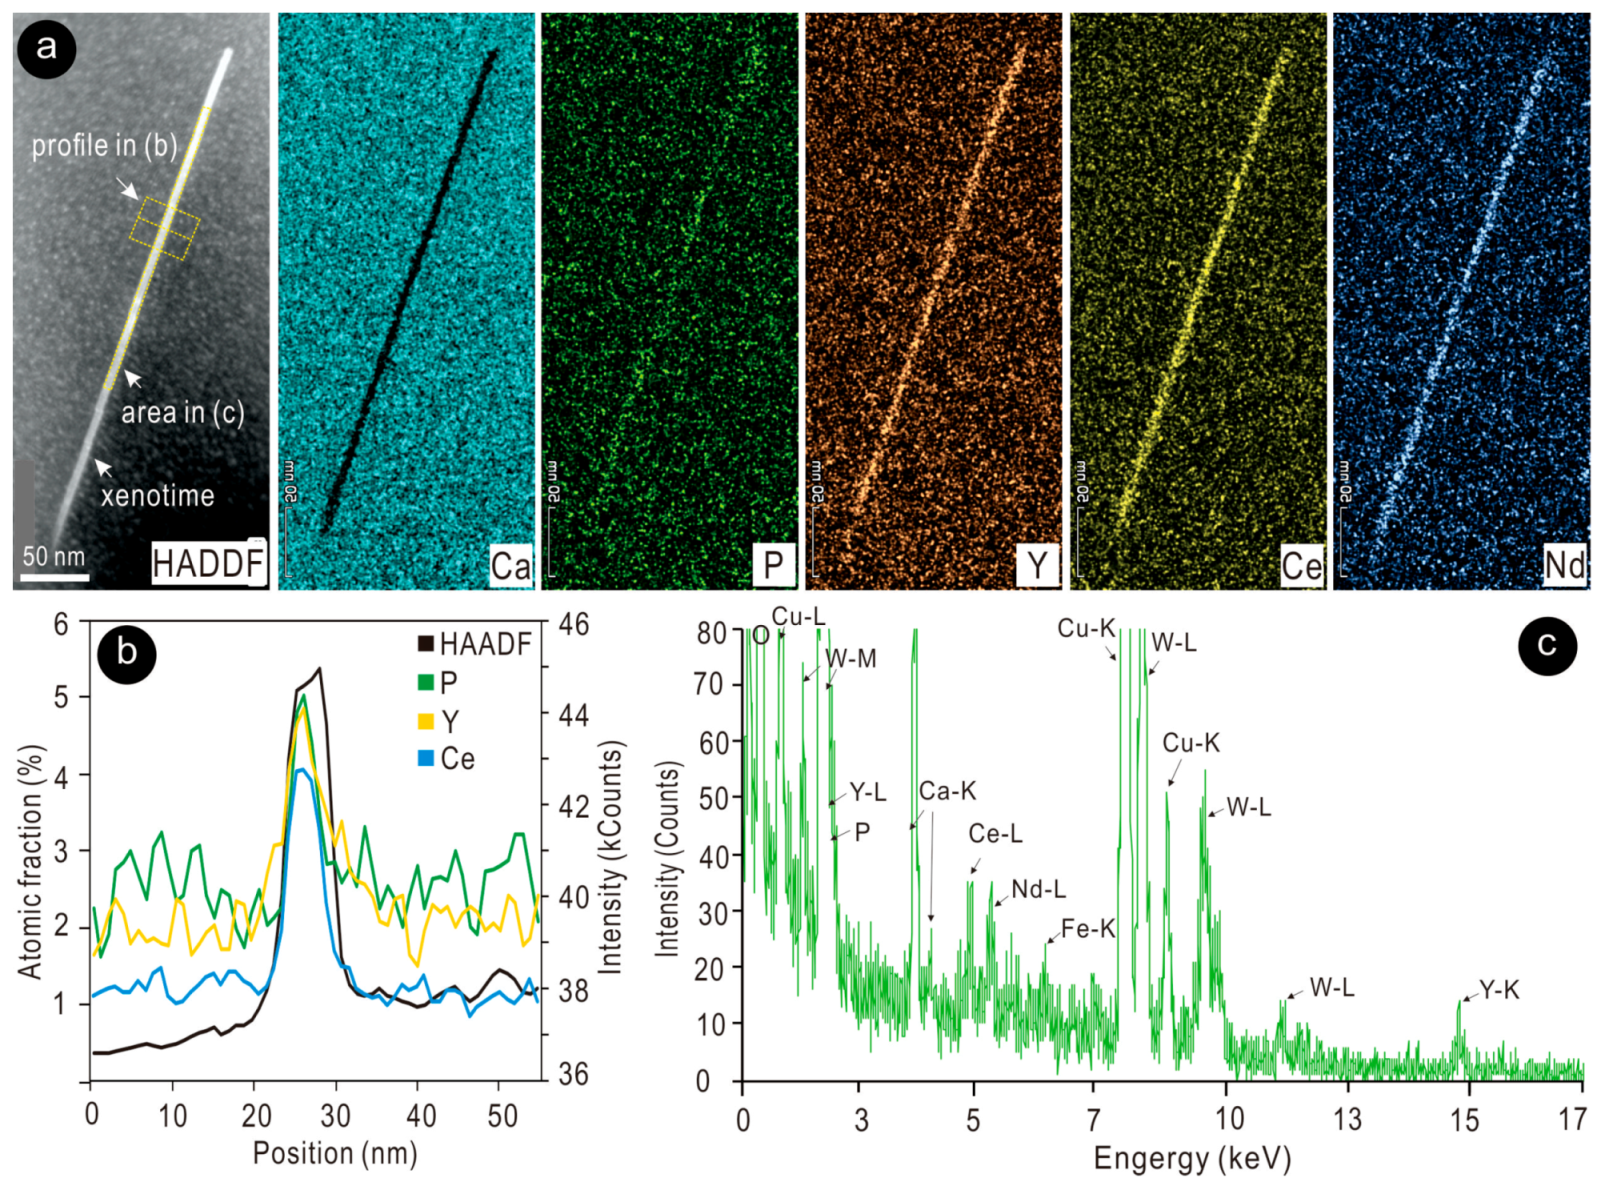
The nm-scale needles are identified as homogenous lamellae of xenotime-(Y) based on high-resolution EDS STEM maps, profiles, and spot analyses (Figure 13 and Figure 14). The widths of these lamellae are 5–10 nm, but their lengths can vary from tens to hundreds of nm. HAADF STEM imaging of the inclusions with the specimen tilted on [100]Sch/Pow (Figure 15) shows they have sharp edges; are epitaxial with host scheelite/powellite (Figure 15a and Fast Fourier Transform (FFT) in the inset); and, moreover, display kink-steps along the longer lamellae (Figure 15b,c). The margins of the xenotime lamellae overlap with host Sch-Pow, as seen from high-resolution imaging (Figure 15d). The coherent orientation between the two phases is shown in the FFT obtained from the image shown in Figure 15a. It is most likely that the inclusions are on the same [100] zone axis as the host. Compatibility in terms of crystal symmetry and unit cell parameters between xenotime (space group I41/amd, a = 6.897 Å, and c = 6.0276 Å [34]) and scheelite-powellite [2] facilitates the formation of congruent intergrowths between the two phases, as shown here.
5. Discussion
5.1. Solid Solution in the Scheelite-Powellite Series: Evidence from Zhibula
The Mo-rich areas (20 mol.%–80 mol.% Pow) are variously patterned and form throughout an aggregate of scheelite that is otherwise close to the W-end member in composition (~87 mol.%–95 mol.% Sch), and un-zoned with respect to W versus Mo content. Nevertheless, the latter show oscillatory to chaotic growth textures in terms of trace element concentrations (CL patterns in Figure 2). The scalloped boundaries of the slivers with the highest Mo content (up to 80 mol.% Pow) against the matrix (20 mol.% Pow, according to EPMA data) differ from the concentric, crystal oscillatory zoning spanning low to intermediate ranges of Mo content (20 mol.%–41 mol.% Pow) in the Mo-rich patterned areas. HAADF STEM imaging and EDS STEM mapping show the sharp compositional contrast of the Mo-rich sliver (Figure 10 and Figure 11), but not the intragrain zoning (Figure 9). The nanoscale study confirms that both chemically-zoned structures, grain and sliver, have crystal structures within the scheelite-powellite series and that no other Mo- or W-minerals (e.g., molybdenite, Pb-molybdates, or -tungstates) are present as inclusions that could account for the chemical variation measured at the micron-scale (EPMA data). Atomic distributions on two zone axes were assessed by imaging and STEM simulation (Figure 12), indicating without doubt that the solid solution series expands up to ~80 wt. % Pow. Electron diffractions, however, display forbidden reflections on three main zone axes, that is, , [100], and (Figure 10 and Figure 12), suggesting a lower symmetry within the space group I41/a.
Both types of patterns show chemical oscillatory zoning with interfaces that have continuity in crystal orientation throughout each defined structure, zoned grain or sliver. In contrast, the interfaces between the sliver and the matrix, where there is a sharp chemical difference, show a rotation of {011} lattice vectors (Figure 10), differing from the contacts of low chemical difference (zoned grain and embedding domain; Figure 9).
Although the sub-μm-scale oscillatory zoning in either of the two cases cannot be quantitively evaluated by EDS STEM analysis, the observed differences in terms of the type of interfaces may be readily correlated with the non-ideal character of the scheelite-powellite solid solution [4]. This implies that growth patterns of the solid can develop sharp gradients in terms of composition that are not linearly related to the variation in the aqueous solution from which they crystallise. The non-linear thermodynamics governing the patterning may account for the formation of distinct domains within the Mo-rich areas of the scheelite-powellite aggregates, of which the sharpest contrast in chemical composition is also recognisable by variation in the growth directions, as is shown for the Mo-rich sliver (Figure 10).
5.2. Formation Conditions and Evolutionary Model
The co-existence of close-to-end-member scheelite and powellite in the same aggregate cannot, however, be reconciled with the presence of molybdenite on the margins of such aggregates (Figure 2c) considering the control played by redox equilibria (Figure 8a) in the three mineral assemblages (e.g., the work of [1]). The inferred oxidising conditions necessary for powellite stability relative to the reducing condition necessary for formation of a stable scheelite + molybdenite assemblage are amply discussed in the recent literature for a variety of W- or W-bearing deposits, particularly from China (e.g., [5,31,35]).
The nanoscale observations in the present study show that some grain boundaries between domains with and without chemical zoning are imbricated with one another (nm-scale saw-tooth boundaries; Figure 9e) and, furthermore, are accompanied by nanopores ± inclusions. Such features are concordant with replacement reactions in which interfaces are controlled by coupling dissolution with re-precipitation rates (CDRR). Moreover, such an interpretation is supported by the fact that in both types of structures, acicular inclusions of xenotime-(Y) are present (Figure 10g, Figure 13 and Figure 14). This implies that the Sch-Pow aggregates have experienced, at least partially, fluid percolation with CDRR-type replacement of pre-existing phases (Sch-rich domains) by Mo-bearing phases (Pow-rich areas). The trace element group—(i) As, Nb, and LREE; (ii) Y and Sr—are clearly shown by LA-ICP-MS spot analysis and element mapping to be associated either with the Mo- or W-rich domains, respectively (Figure 7). This is in contrast with the positive correlation between As + Y and Mo, and also the presence of nanoscale inclusions of Y-arsenate-tungstate such as paraniite-(Y) in grains of ~70 mol.% Pow from the Swiss Alps [8]. Whereas trends obtained from the LA-ICP-MS data indicate overall positive correlations between Mo and REE, Me5+ (As, Nb), and between W and Sr (Figure 5), these cannot be accurately used to interpret substitution mechanisms (concentrations are too low for reliable quantification by EPMA). Such trends can nonetheless further substantiate the two distinct stages invoked to explain formation of W- and Mo-rich domains in the Sch-Pow aggregates from the Zhibula skarnoid.
Many empirical studies have been dedicated to interpretation of REY partitioning patterns in scheelite relative to deposit types and sources of fluids (e.g., [15] and references therein). Other studies have considered the controlling role played by ionic radius size in defining partitioning trends between LREE and HREE in various REE3+-for-Ca2+ substitution schemes in calcic minerals (skarn garnet, apatite, or scheelite) formed in hydrothermal or metasomatic environments (e.g., [36]). Whereas systematic relationships between crystal structural configuration and trace element incorporation following Goldschmidt’s rules are broadly true for minerals like magnetite [37], or simple sulphides (e.g., [38]), REE partitioning in calcic minerals has been proven to vary widely in domains within the same grain, grains in single samples, orezones within a given deposit, or from different stages of hydrothermal evolution (e.g., [11,23,35,39,40,41,42].
The variation in chondrite-normalised REY fractionation trends has been assessed by numerical simulations using the same basic REY for Ca substitution model, but variable fluid composition, for example, for skarn garnet [39], scheelite [12,43], or apatite [44]. An interpretation based on shifting redox conditions of W- versus -Mo + REE incorporation in Sch-Pow associations, with an oxidizing Mo-rich-Sch stage, followed by reducing Mo-poor-scheelite stage corresponding to main prograde to retrograde skarn evolution was proposed for the Baoshan W skarn, China [43], albeit with a return to oxidizing conditions at the end of mineralization as a result of an influx of meteoric waters.
We propose a similar evolution for the Zhibula skarnoid, in which the reducing, prograde stage accounts for the scheelite-molybdenite association, whereas those domains richest in Pow component form during the oxidising, retrograde stage. This may be achieved by interaction between fluids that dissolve molybdenite and reprecipitate Mo as Pow-rich domains—at least in those occurring as slivers throughout the Sch-Pow aggregates. The slight enrichment of LREE in the Mo-rich domains relative to W-rich domains (Figure 6a) is also concordant with the formation of nanoscale inclusions of xenotime-(Y), indicating that HREE are relatively insoluble in lower T, retrograde fluids.
The skarnoid is not typical of the main stage skarn at Zhibula [22] and all minerals in the assemblage, including garnet, are quite low in total REY concentration (Figure 6c). Formation conditions were shown to vary from high T (~600 °C) and low X(CO2) (~0.003) in the early, skarnoid stage to low T (~300 °C) and high X(CO2), (~0.1) conditions in late-stage skarn (at Pfluid = 0.6 Kbar [22]). Although scheelite and molybdenite are present throughout main skarn assemblages, Sch-Pow aggregates of the type documented here are restricted to such skarnoids.
The presence of such REY-bearing inclusions in scheelite, as shown here and in previous studies (e.g., [8]), draws attention to the potential over-interpretation of REY patters obtained from LA-ICP-MS data, which may be unable to distinguish between lattice-bound REE and REE contained within sub-micron-sized inclusions [17]. This important point emphasizes how complementary micron- to nanoscale-studies, in situ and on the same samples, not only provide valuable additional information, but may be essential for ensuring correct interpretation [16,18].
6. Conclusions
The following conclusions are reached.
- A wide range of compositions within the scheelite-powellite solid solution series, from 20 mol.% to 80 mol.% Pow, occur as patterned, oscillatory-zoned single crystals and sliver domains, in a matrix of unzoned/weakly zoned, close-to-end-member scheelite (87 mol.%–95 mol.% Sch) in the Zhibula skarnoid (prograde grossular50–diopside80–anorthite with retrograde clinozoisite). Molybdenite is present on the margins of the Sch-Pow aggregates. Compositional data and element mapping at the µm-scale reveal systematic partitioning behaviour of trace elements in skarn minerals and scheelite-powellite aggregates. The Mo-rich domains positively correlate with higher concentrations of As, Nb, and LREE, whereas W-rich domains are relatively enriched in Y and Sr.
- Electron diffractions, HAADF STEM imaging, and EDS STEM mapping of thinned foils prepared from the two main types of patterns show chemical oscillatory zoning with interfaces that have continuity in crystal orientation throughout each defined structure, zoned grain or sliver. In contrast, the interfaces with a sharp chemical difference (sliver to matrix), show rotation of {011} lattice vectors differing from the continuity in orientation at interfaces of low chemical difference (zoned grain and embedding domain). Atomic-scale resolution imaging and STEM simulation confirm scheelite-powellite within the analysed range (20 mol.% to 80 mol.% Pow). No discrete Mo- or W-bearing inclusions are observed, which might contribute to this compositional variation.
- The non-linear thermodynamics governing the patterning in non-ideal solid solution may account for the formation of distinct patterning domains within the Mo-rich areas of the scheelite-powellite aggregates, of which the sharpest contrast in chemical composition is also recognisable by variation in the growth directions.
- Nanoscale inclusions of xenotime-(Y) with epitaxial orientation to the host scheelite-powellite matrix are observed in both cases. This observation carries implications for the overall REE content of the host phase and, implicitly, for the use of REE concentrations and fractionation patterns for petrogenetic interpretation.
- A genetic model that accounts for observed geochemical and petrographic features involves deposition of a scheelite + molybdenite assemblage during the more reduced, prograde skarn stage followed by an oxidised, retrograde stage leading to the Mo-rich patterned domains within scheelite. During this stage, the lower-T oxidising (?) fluids can dissolve molybdenite and reprecipitate Mo as powellite-rich domains. The slight enrichment of LREE in the Mo-rich domains relative to W-rich domains is concordant with formation of nanoscale inclusions of xenotime-(Y), as well as Y-enrichment on the margins of scheelite, indicating that HREE are not soluble in lower T, retrograde fluids.
- This research demonstrates the utility of the HAADF-STEM technique on foils extracted in situ from a sample that has been texturally and compositionally well-characterised to address issues of solid solution and compositional heterogeneity. Such an approach has potential broad application for understanding analogous mineral series and constraining processes of ore genesis.
Supplementary Materials
The following are available online at https://www.mdpi.com/2075-163X/9/6/340/s1, Supplementary Material: Table S1 (full EPMA dataset), Table S2 (full LA-ICP-MS dataset), and Figure S1 (Supplementary LA-ICP-MS element map.
Author Contributions
J.X. and C.L.C. conceived this contribution and conducted all analytical work, assisted by A.S. (operating Titan Themis instrument). The manuscript was written by J.X., C.L.C., and N.J.C. with contribution from A.S.
Funding
J.X. acknowledges support from the National Natural Science Foundation of China (Grant No. 41802098), Key Laboratory of Mineral Resources (Grant No. KLMR2017-13), China Postdoctoral Science Foundation, and China Scholarship Council.
Acknowledgments
Staff at Adelaide Microscopy are gratefully acknowledged for assistance with instrument operation. The AMMRF is acknowledged for instrument access. J.X. expresses appreciation to Youye Zheng for his assistance with field work. We acknowledge the comments from four reviewers that assisted us to refine ideas expressed in this manuscript.
Conflicts of Interest
The authors declare no conflict of interest.
References
- Hsu, L.C.; Galli, P.E. Origin of the Scheelite-Powellite Series of Minerals. Econ. Geol. 1973, 68, 681–696. [Google Scholar] [CrossRef]
- Hazen, R.M.; Finger, L.W.; Mariathasan, J.W.E. High-pressure crystal chemistry of scheelite-type tungstates and molybdates. J. Phys. Chem. Solids 1985, 46, 253–263. [Google Scholar] [CrossRef]
- Tyson, R.M.; Hemphill, W.R.; Theisen, A.F. Effect of the W:Mo ratio on the shift of excitation and emission spectra in the scheelite-powellite series. Am. Miner. 1988, 73, 1145–1154. [Google Scholar]
- Fernandez-González, Á.; Andara, Á.; Prieto, M. Mixing properties and crystallization behaviour of the scheelite-powellite solid solution. Cryst. Growth Des. 2007, 7, 545–552. [Google Scholar] [CrossRef]
- Song, G.X.; Qin, K.Z.; Li, G.M.; Evans, N.J.; Chen, L. Scheelite elemental and isotopic signatures: Implications for the genesis of skarn-type W-Mo deposits in the Chizhou Area, Anhui Province, Eastern China. Am. Miner. 2014, 99, 303–317. [Google Scholar] [CrossRef]
- Hsu, L.C. Effects of oxygen and sulfur fugacities on the scheelite-tungstenite and powellite-molybdenite stability relations. Econ. Geol. 1977, 72, 664–670. [Google Scholar] [CrossRef]
- Förster, H.J.; Hunger, H.J.; Grimm, L. Elektronenstrahlmikroanalytische Untersuchungen von Erzmineralen aus der Zinn-Lagerstatte Altenberg (Erzgebirge, DDR). 3. Mitteilung: Die Scheelit-Powellit-Mischkristallreihe. Chem. Der Erde Geochem. 1987, 46, 321–328. [Google Scholar]
- Brugger, J.; Gieré, R.; Grobéty, B.; Uspensky, E. Scheelite-powellite and paraniite-(Y) from the Fe-Mn deposit at Fianel, Eastern Swiss Alps. Am. Miner. 1998, 83, 1100–1110. [Google Scholar] [CrossRef]
- Kwak, T.A.P.; Tan, T.H. The geochemistry of zoning in skarn minerals at the King Island (Dolphin) mine. Econ. Geol. 1981, 76, 468–497. [Google Scholar] [CrossRef]
- Zaw, K.; Singoyi, B. Formation of magnetite-scheelite skarn mineralization at Kara, Northwestern Tasmania: Evidence from mineral chemistry and stable isotopes. Econ. Geol. 2000, 95, 1215–1230. [Google Scholar] [CrossRef]
- Brugger, J.; Lahaye, Y.; Costa, S.; Lambert, D.; Bateman, R. Inhomogeneous distribution of REE in scheelite and dynamics of Archean hydrothermal systems (Mt. Charlotte and Drysdale gold deposits, Western Australia). Contrib. Min. Pet. 2000, 139, 251–264. [Google Scholar]
- Brugger, J.; Etschmann, B.; Pownceby, M.; Liu, W.; Grundler, P.; Brewe, D. Oxidation state of europium in scheelite: Tracking fluid-rock interaction in gold deposits. Chem. Geol. 2008, 257, 26–33. [Google Scholar] [CrossRef]
- Ghaderi, M.; Palin, J.M.; Campbell, I.H.; Sylvester, P.J. Rare earth element systematics in scheelite from hydrothermal gold deposits in the Kalgoorlie-Norseman region, Western Australia. Econ. Geol. 1999, 94, 423–437. [Google Scholar] [CrossRef]
- Dostal, J.; Kontak, D.J.; Chatterjee, A. Trace element geochemistry of scheelite and rutile from metaturbidite-hosted quartz vein gold deposits, Meguma Terrane, Nova Scotia, Canada: Genetic implications. Miner. Pet. 2009, 97, 95–109. [Google Scholar] [CrossRef]
- Poulin, R.S.; Kontak, D.J.; McDonald, A.M.; McClenaghan, B.M. Assessing Scheelite As an Ore-deposit Discriminator Using Its Trace-element REE Chemistry. Can. Miner. 2018, 56, 265–302. [Google Scholar] [CrossRef]
- Ciobanu, C.L.; Cook, N.J.; Maunders, C.; Wade, B.P.; Ehrig, K. Focused Ion Beam and Advanced Electron Microscopy for Minerals: Insights and Outlook from Bismuth Sulphosalts. Minerals 2016, 6, 112. [Google Scholar] [CrossRef]
- Cook, N.J.; Ciobanu, C.L.; George, L.; Zhu, Z.-Y.; Wade, B.; Ehrig, K. Trace Element Analysis of Minerals in Magmatic-Hydrothermal Ores by Laser Ablation Inductively-Coupled Plasma Mass Spectrometry: Approaches and Opportunities. Minerals 2016, 6, 111. [Google Scholar] [CrossRef]
- Cook, N.J.; Ciobanu, C.L.; Ehrig, K.; Slattery, A.; Verdugo-Ihl, M.R.; Courtney-Davies, L.; Gao, W. Advances and Opportunities in Ore Mineralogy. Minerals 2017, 7, 233. [Google Scholar] [CrossRef]
- Keyser, W.; Ciobanu, C.L.; Cook, N.J.; Feltus, H.; Johnson, G.; Slattery, A.; Wade, B.P.; Ehrig, K. Mineralogy of Zirconium in Iron-Oxides: A Micron- to Nanoscale Study of Hematite Ore from Peculiar Knob, South Australia. Minerals 2019, 9, 244. [Google Scholar] [CrossRef]
- Xu, J.; Zheng, Y.Y.; Sun, X.; Shen, Y.H. Geochronology and petrogenesis of Miocene granitic intrusions related to the Zhibula Cu skarn deposit in the Gangdese belt, southern Tibet. J. Asian Earth Sci. 2016, 120, 100–116. [Google Scholar] [CrossRef]
- Xu, J.; Zheng, Y.Y.; Sun, X.; Shen, Y.H. Alteration and mineralization at the Zhibula Cu skarn deposit, Gangdese belt, Tibet. Ore Geol. Rev. 2016, 75, 304–326. [Google Scholar] [CrossRef]
- Xu, J.; Ciobanu, C.L.; Cook, N.J.; Zheng, Y.; Sun, X.; Wade, B.P. Skarn formation and trace elements in garnet and associated minerals from Zhibula copper deposit, Gangdese Belt, southern Tibet. Lithos 2016, 262, 213–231. [Google Scholar] [CrossRef]
- Hou, Z.Q.; Cook, N.J. Metallogenesis of the Tibetan collisional orogen: A review and introduction to the special issue. Ore Geol. Rev. 2009, 36, 2–24. [Google Scholar] [CrossRef]
- Li, G.M.; Rui, Z.Y.; Wang, G.M.; Lin, F.C.; Liu, B.; She, H.Q.; Feng, C.Y.; Qu, W.J. Molybdenite Re–Os dating of Jiama and Zhibula polymetallic copper deposits in Gangdese metallogenic belt of Tibet and its significance. Miner. Depos. 2005, 24, 481–489, (in Chinese with English abstract). [Google Scholar]
- Jochum, K.P.; Weis, U.; Stoll, B.; Kuzmin, D.; Yang, Q.; Raczek, I.; Jacob, D.E.; Stracke, A.; Gunther, D.; Enzweiler, J. Determination of reference values for NIST SRM 610-617 glasses following ISO guidelines. Geostand. Geoanal. Res. 2011, 35, 397–429. [Google Scholar] [CrossRef]
- Guillong, M.; Hametner, K.; Reusser, E.; Wilson, S.A.; Günther, D. Preliminary characteristics of new glass reference materials (GSA-1G, GSC-1G, GSD-1G and GSE-1G) by laser ablation-inductively coupled plasma-mass spectrometry using 193 nm, 213 nm and 266 nm wavelengths. Geostand. Geoanal. Res. 2005, 29, 315–331. [Google Scholar] [CrossRef]
- Van Achterbergh, E.; Ryan, C.G.; Jackson, S.E.; Griffin, W.L. Data Reduction Software for LA-ICP-MS. In Laser-ablation-ICPMS in the Earth Sciences: Principles and Applications; Sylvester, P.J., Ed.; Mineral. Assoc.: Quebec City, QC, Canada, 2001; pp. 239–243. [Google Scholar]
- Woodhead, J.D.; Hellstrom, J.; Paton, C.; Hergt, J.M.; Greig, A.; Maas, R. A Guide to Depth Profiling and Imaging Applications of LA-ICM-PS. In Laser Ablation ICPMS in the Earth Sciences: Current Practices and Outstanding Issues; Mineralogical Association of Canada, Short Course Series 40; Sylvester, P.J., Ed.; Mineralogical Association of Canada: Quebec City, QC, Canada, 2008; pp. 135–145. [Google Scholar]
- Ciobanu, C.L.; Cook, N.J.; Utsunomiya, S.; Pring, A.; Green, L. Focussed ion beam—transmission electron microscopy applications in ore mineralogy: Bridging micron- and nanoscale observations. Ore Geol. Rev. 2011, 42, 6–31. [Google Scholar] [CrossRef]
- Orhan, A. Evolution of the Mo-rich scheelite skarn mineralization at Kozbudaklar, Western Anatolia, Turkey: Evidence from mineral chemistry and fluid inclusions. Ore Geol. Rev. 2017, 80, 141–165. [Google Scholar] [CrossRef]
- Song, S.W.; Mao, J.W.; Xie, G.Q.; Yao, Z.; Chen, G.; Rao, J. The formation of the world-class Zhuxi scheelite skarn deposit: Implications from the petrogenesis of scheelite-bearing anorthosite. Lithos 2018, 312–313, 153–170. [Google Scholar] [CrossRef]
- Sun, K.K.; Chen, B. Trace elements and Sr-Nd isotopes of scheelite: Implications for the W-Cu-Mo polymetallic mineralization of the Shimensi deposit, South China. Amer. Miner. 2017, 102, 1114–1128. [Google Scholar]
- Battey, M.H.; Moss, A.A. Powellite from Traprain Law, Haddingtonshire, Scotland. Miner. Mag. 1962, 33, 158–161. [Google Scholar] [CrossRef]
- Ni, Y.; Hughes, J.M.; Mariano, A.N. Crystal chemistry of the monazite and xenotime structures. Am. Miner. 1995, 80, 21–26. [Google Scholar] [CrossRef]
- Ding, T.; Ma, D.; Lu, J.; Zhang, R. Garnet and scheelite as indicators of multi-stage tungsten mineralization in the Huangshaping deposit, southern Hunan province, China. Ore Geol. Rev. 2018, 94, 193–211. [Google Scholar] [CrossRef]
- Gaspar, M.; Knaack, C.; Meinert, L.D.; Moretti, R. REE in skarn systems: A LA-ICP-MS study of garnets from the Crown Jewel gold deposit. Geochim. Cosmochim. Acta 2008, 72, 185–205. [Google Scholar] [CrossRef]
- Nadoll, P.; Angerer, T.; Mauk, J.L.; French, D.; Walshe, J. The chemistry of hydrothermal magnetite: A review. Ore Geol. Rev. 2014, 61, 1–32. [Google Scholar] [CrossRef]
- George, L.L.; Cook, N.J.; Ciobanu, C.L. Partitioning of trace elements in co-crystallized sphalerite–galena–chalcopyrite hydrothermal ores. Ore Geol. Rev. 2016, 77, 97–116. [Google Scholar] [CrossRef]
- Smith, M.; Henderson, P.; Jeffries, T.; Long, J.; Williams, C. The rare earth elements and uranium in garnets from the Beinn an Dubhaich Aureole, Skye, Scotland, UK: Constraints on processes in a dynamic hydrothermal system. J. Pet. 2004, 45, 457–484. [Google Scholar] [CrossRef]
- Ismail, R.; Ciobanu, C.L.; Cook, N.J.; Teale, G.S.; Giles, D.; Schmidt Mumm, A.; Wade, B. Rare earths and other trace elements in minerals from skarn assemblages, Hillside iron oxide–copper–gold deposit, Yorke Peninsula, South Australia. Lithos 2014, 184–187, 456–477. [Google Scholar] [CrossRef]
- Krneta, S.; Ciobanu, C.L.; Cook, N.J.; Ehrig, K.; Kontonikas-Charos, A. Rare earth element behaviour in apatite from the Olympic Dam Cu-U-Au-Ag deposit, South Australia. Minerals 2017, 7, 135. [Google Scholar] [CrossRef]
- Krneta, S.; Ciobanu, C.L.; Cook, N.J.; Ehrig, K.; Kontonikas-Charos, A. The Wirrda Well and Acropolis prospects Gawler Craton, South Australia: Insights into evolving fluid conditions through apatite chemistry. J. Geochem. Explor. 2017, 181, 276–291. [Google Scholar] [CrossRef]
- Zhao, W.W.; Zhou, M.F.; Williams-Jones, A.E. Constraints on the uptake of REE by scheelite in the Baoshan tungsten skarn deposit, South China. Chem. Geol. 2017, 477, 123–136. [Google Scholar] [CrossRef]
- Krneta, S.; Ciobanu, C.L.; Cook, N.J.; Ehrig, K.J. Numerical modelling of REE fractionation patterns in fluorapatite from the Olympic Dam deposit (South Australia). Minerals 2018, 8, 342. [Google Scholar] [CrossRef]
Figure 1.
Simplified geological map of the Zhibula Cu skarn deposit. Abbreviations: JSSZ, Jinsha Suture Zone; BNSZ, Bangong–Nujiang Suture Zone IYZSZ; Indus–Yarlung Zangbo Suture Zone.
Figure 1.
Simplified geological map of the Zhibula Cu skarn deposit. Abbreviations: JSSZ, Jinsha Suture Zone; BNSZ, Bangong–Nujiang Suture Zone IYZSZ; Indus–Yarlung Zangbo Suture Zone.
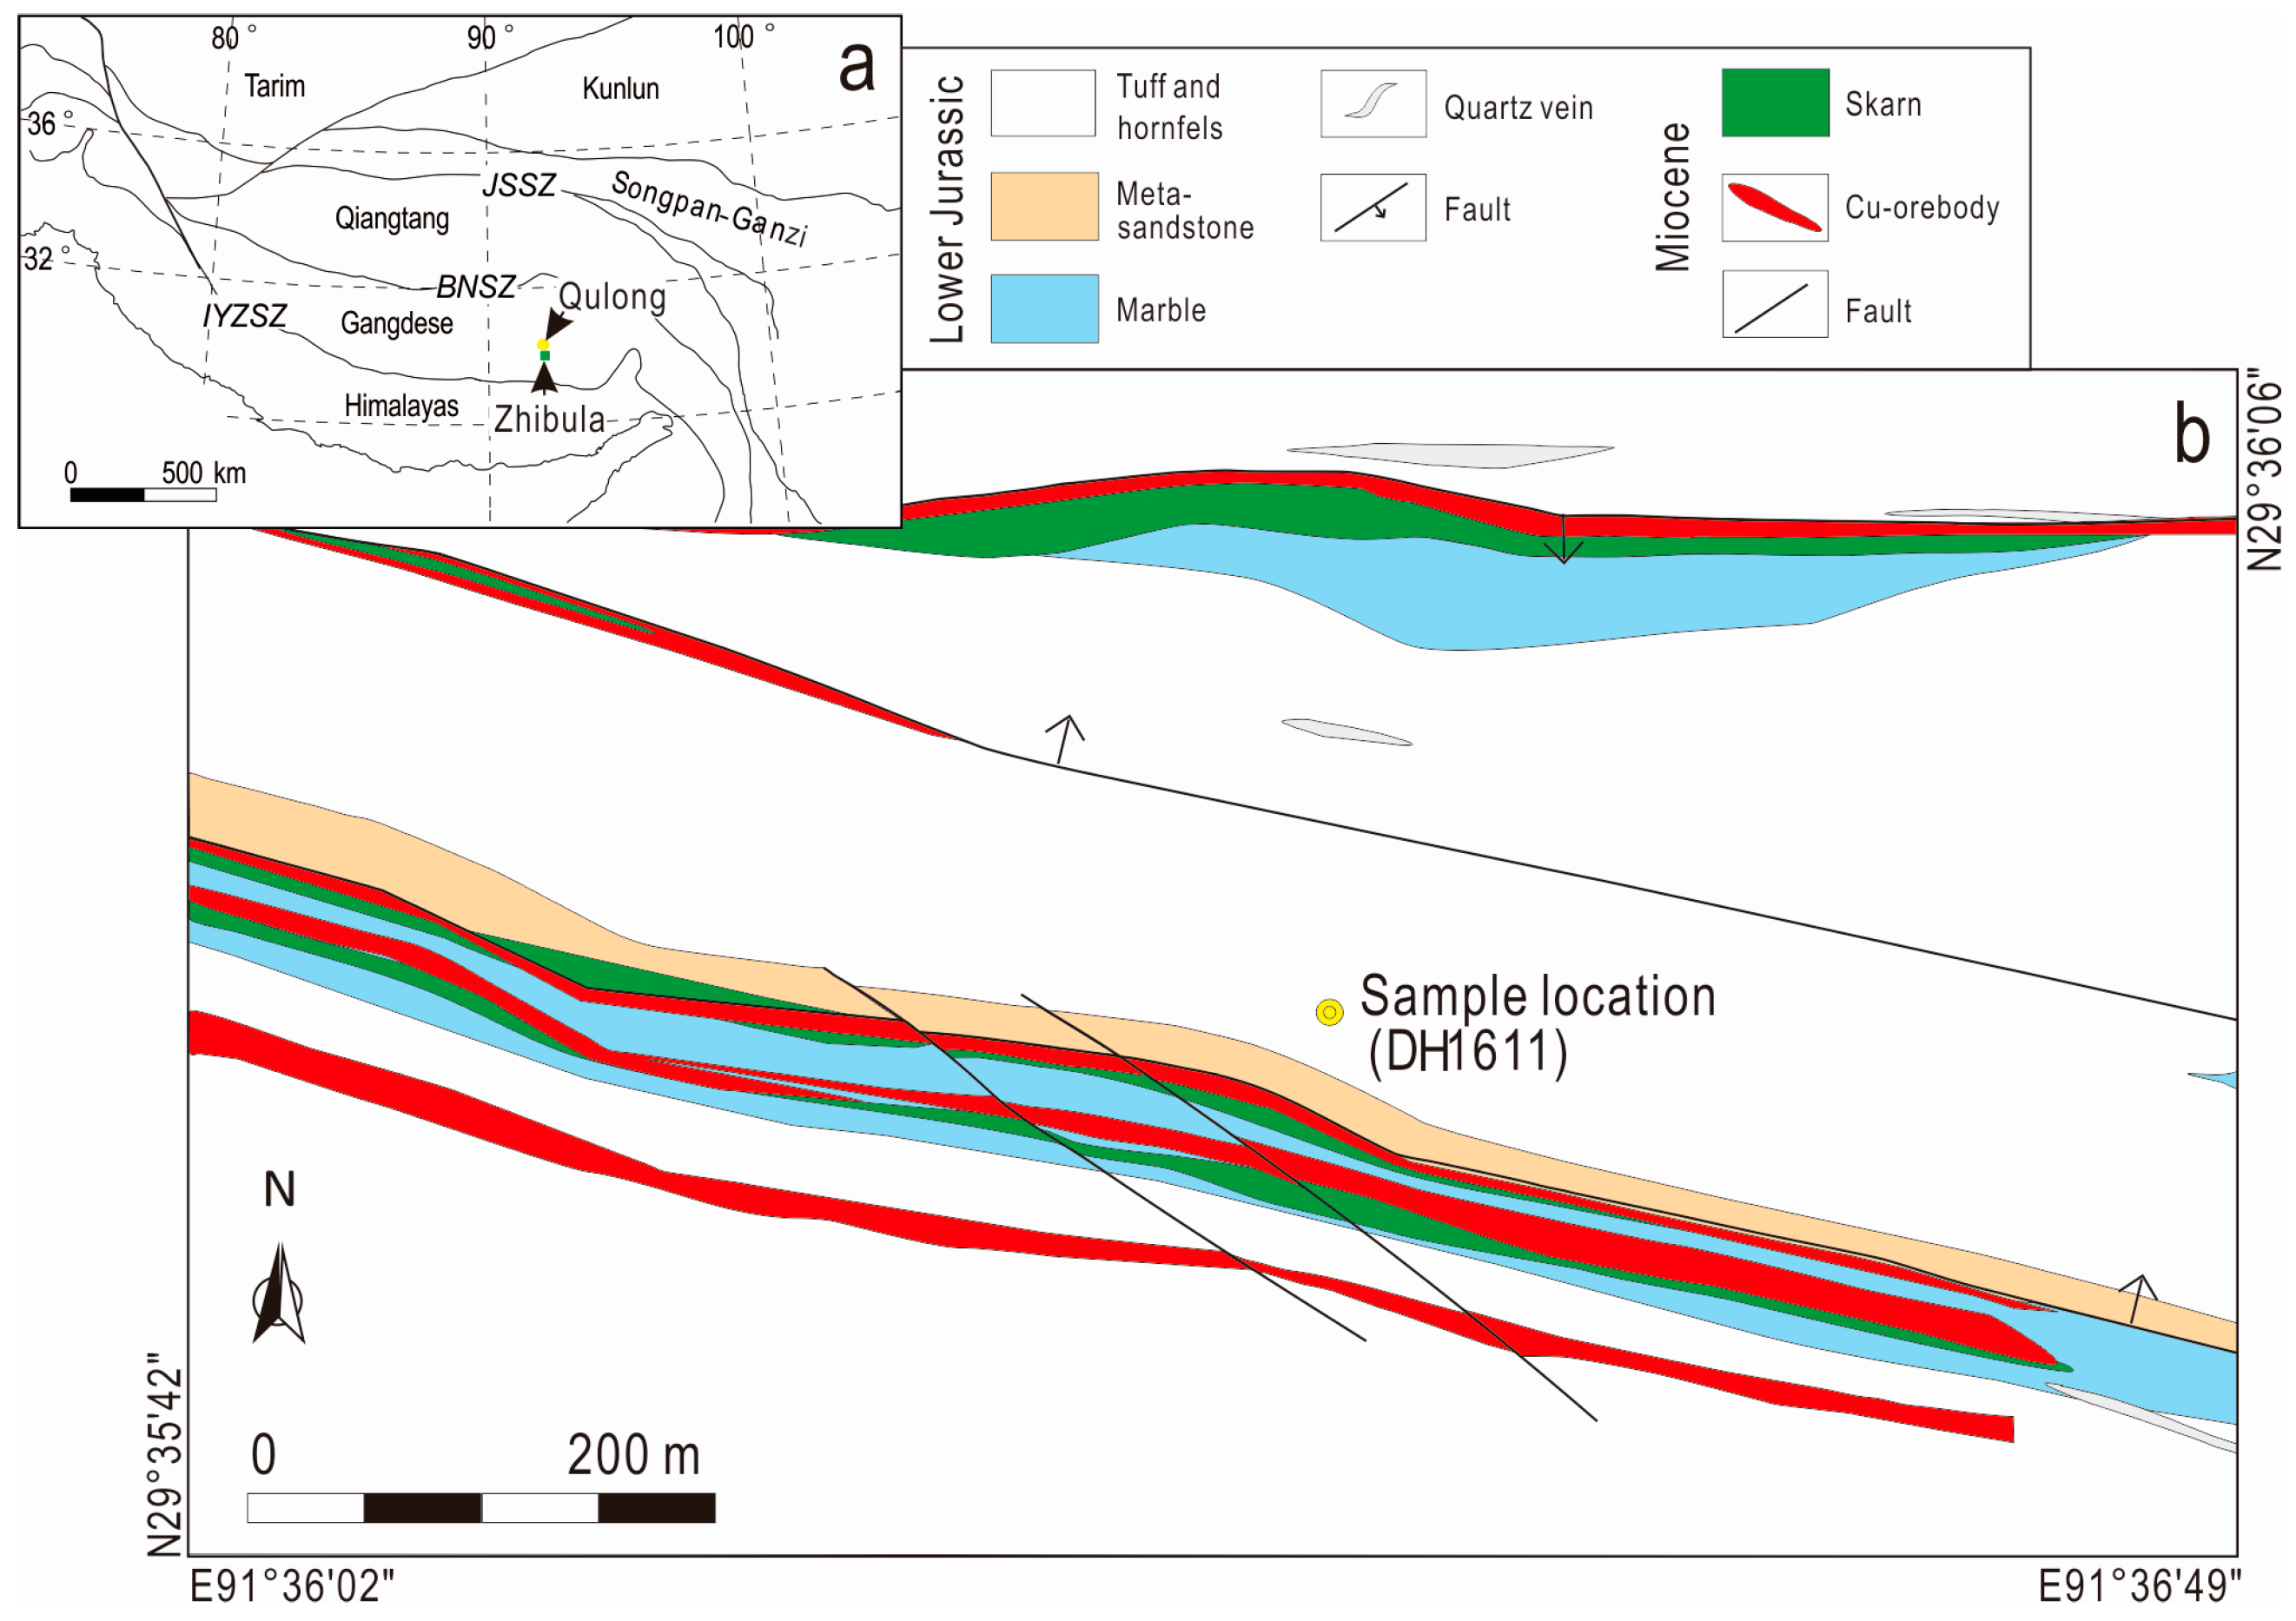
Figure 2.
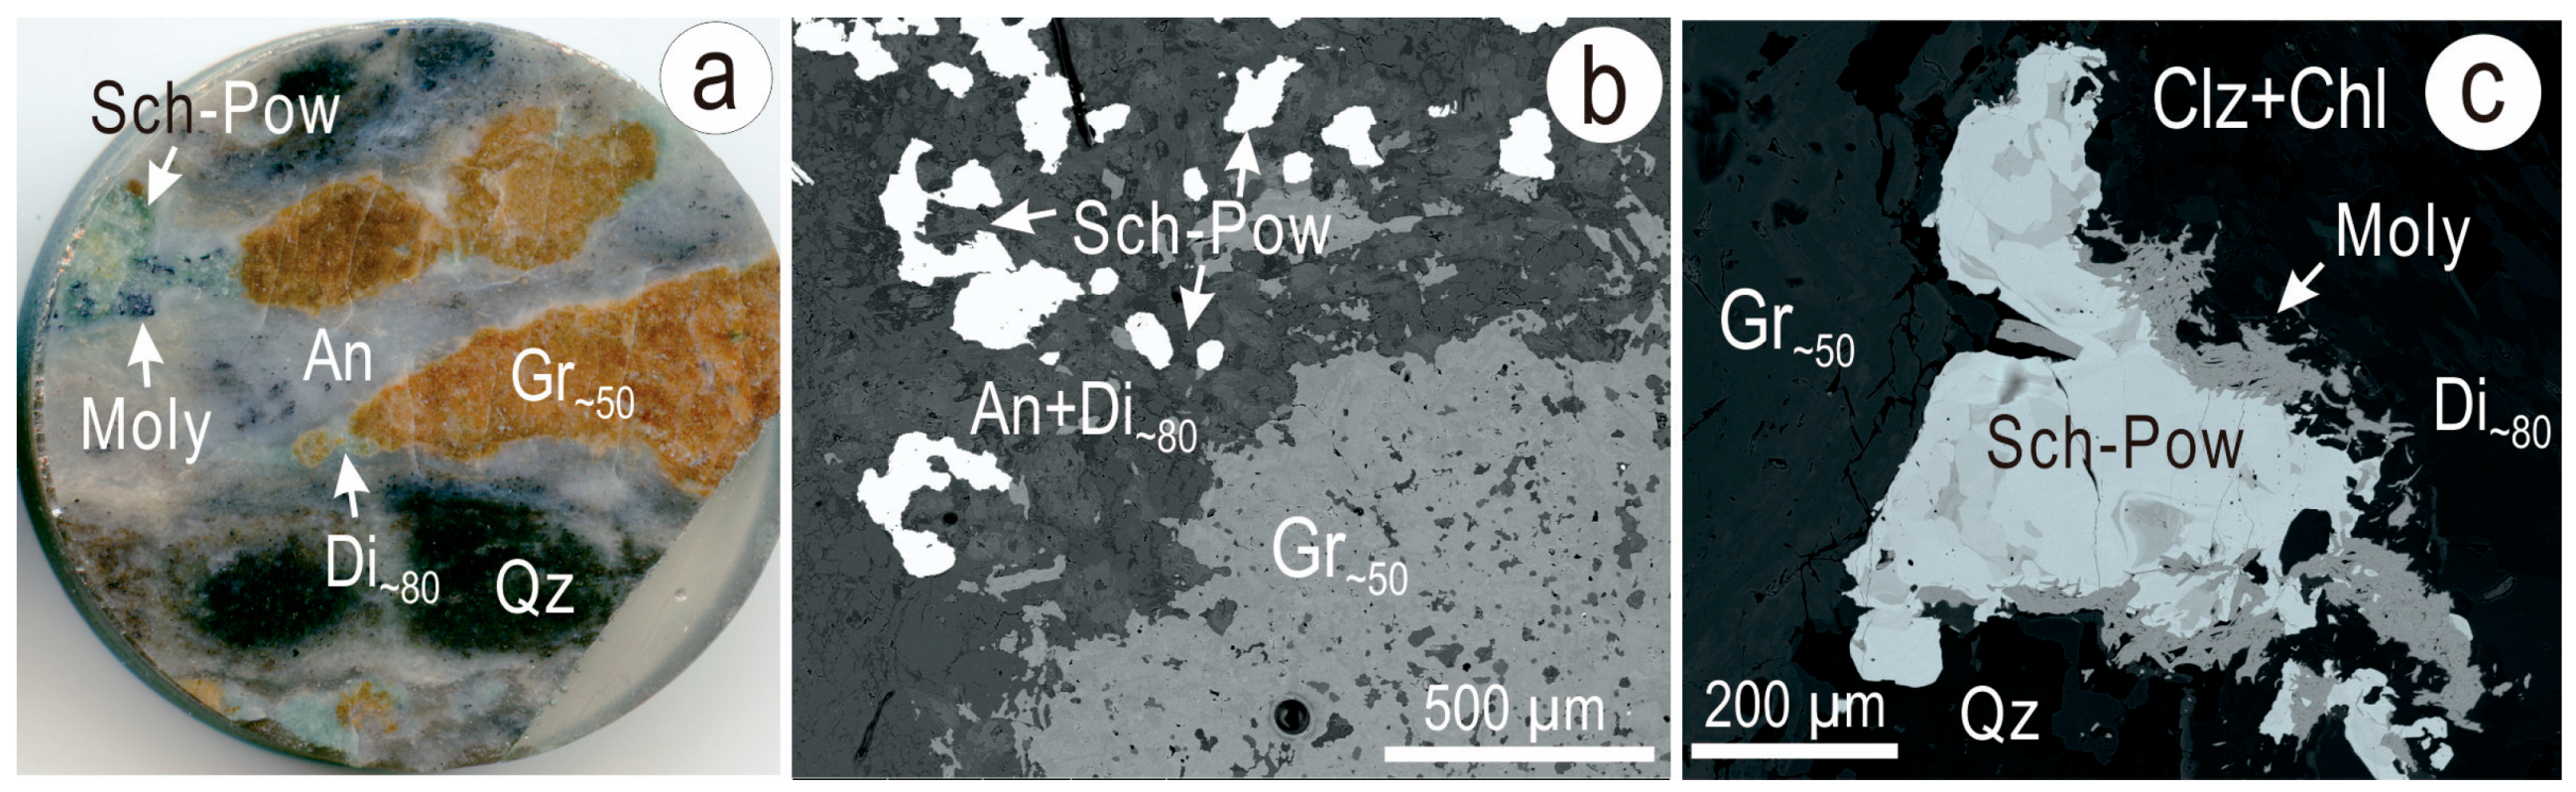
Reflected light photograph of 1″-diameter polished section (a) and back-scatter electron (BSE) images (b,c) showing petrographic aspects of the skarnoid containing the analysed scheelite-powellite grains. (a) Grossular (Gr~50) lenses in a groundmass of anorthite (An) and diopside (Di~80). Quartz (Qz)-chlorite (Chl) rich-areas are relicts from the tuff protolith. (b) Edge of stringer zone with scheelite-powellite (Sch-Pow) at the boundary to one of the grossular garnet lenses. (c) Aggregate of Sch-Pow with molybdenite (Moly) along the margins. The groundmass includes secondary clinozoisite (Clz) and Chl.
Figure 2.
Reflected light photograph of 1″-diameter polished section (a) and back-scatter electron (BSE) images (b,c) showing petrographic aspects of the skarnoid containing the analysed scheelite-powellite grains. (a) Grossular (Gr~50) lenses in a groundmass of anorthite (An) and diopside (Di~80). Quartz (Qz)-chlorite (Chl) rich-areas are relicts from the tuff protolith. (b) Edge of stringer zone with scheelite-powellite (Sch-Pow) at the boundary to one of the grossular garnet lenses. (c) Aggregate of Sch-Pow with molybdenite (Moly) along the margins. The groundmass includes secondary clinozoisite (Clz) and Chl.

Figure 3.
BSE image (a) and cathodoluminescence (CL) images (b,c) showing textures and growth zones in aggregates of scheelite-powellite (Sch-Pow). (a) The aggregate consists of W-rich domains (brighter), weakly- or un-zoned with garlands of smaller, Mo-rich, oscillatory-zoned grains. There are however, Mo-rich areas that lack zonation and also thin slivers with strong-contrast, oscillatory zoning (arrowed). (b,c) CL images show growth zones in W-rich domains with strong contrast along the rims suggesting REE-enrichment. Chaotic patterns are shown in (b), whereas crystal oscillatory zoning is revealed in (c).

Figure 4.
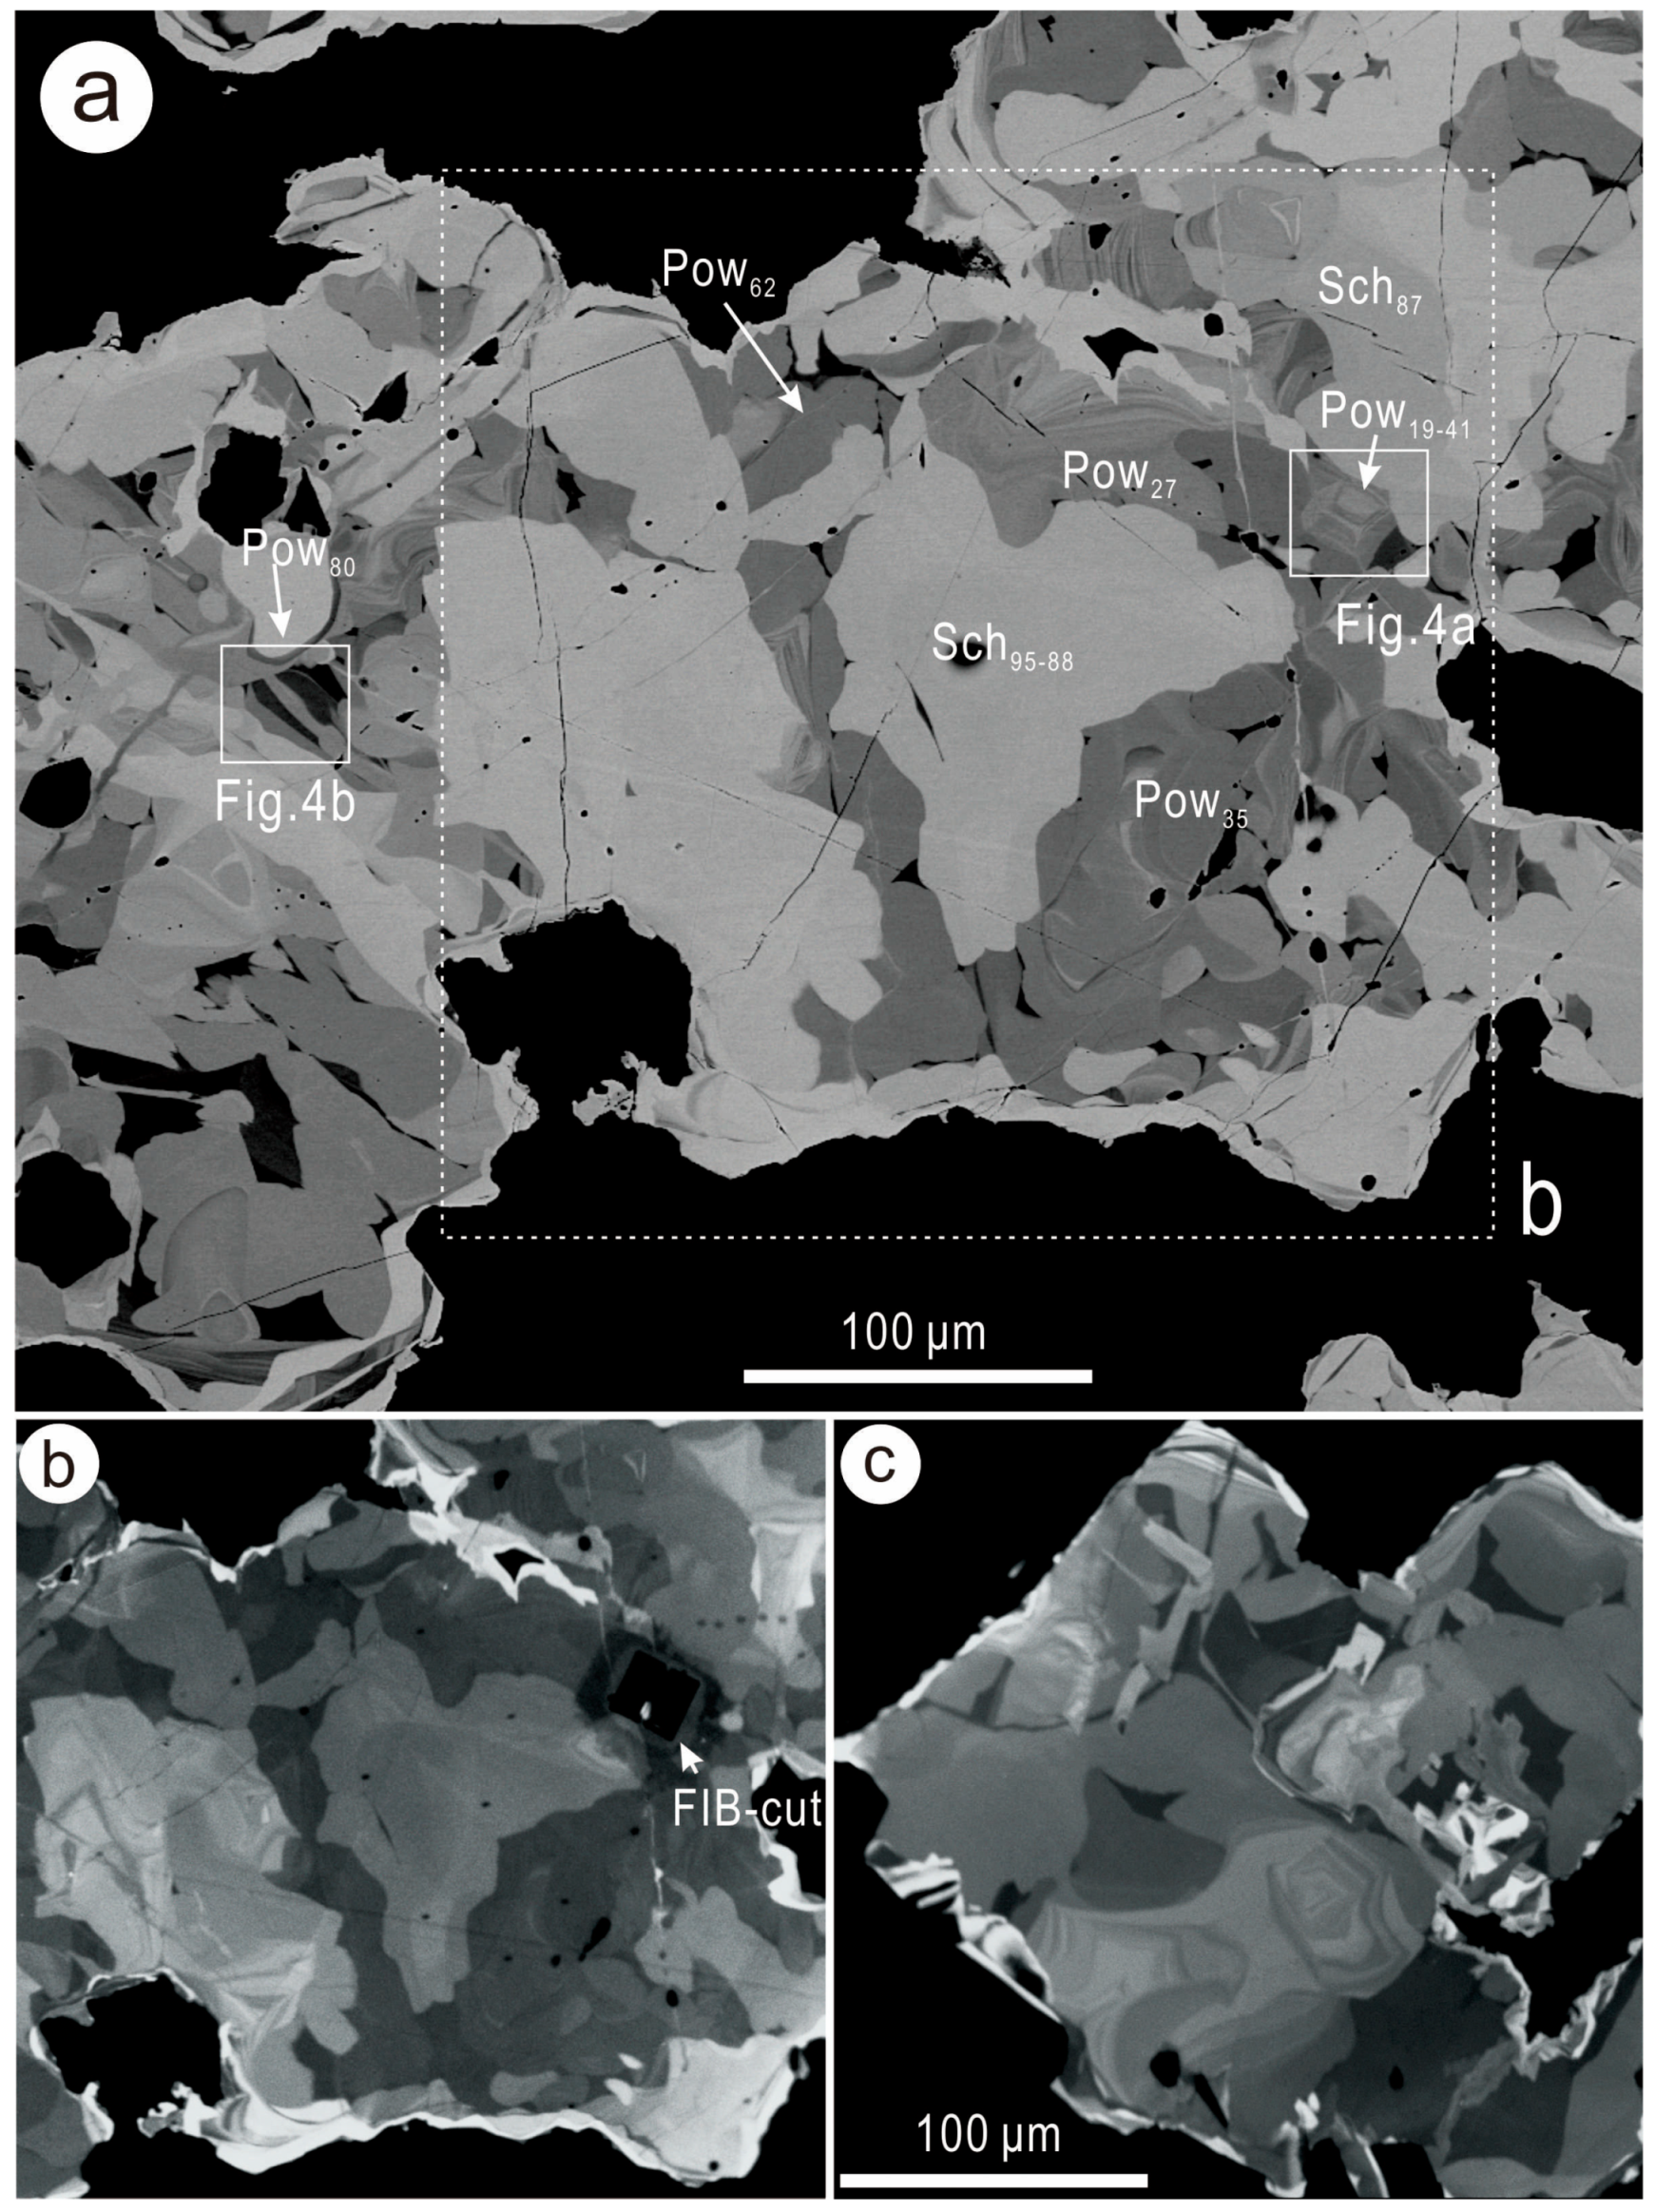
BSE images and scanning electron microscope (SEM)-energy-dispersive X-ray spectra (EDS) maps for three selected areas representing various styles of zoning in scheelite-powellite (Sch-Pow) aggregates. (a) Small crystal (~30 μm diameter) of intermediate Sch-Pow composition (medium contrast on the BSE image) with sub-micron oscillatory zoning. (b,c) High-Mo slivers (strong contrast on BSE images) showing wider and finer oscillatory zoning with respect to Mo vs. W. Note the highest Pow (up to ~80 mol.%) was measured from such areas.
Figure 4.
BSE images and scanning electron microscope (SEM)-energy-dispersive X-ray spectra (EDS) maps for three selected areas representing various styles of zoning in scheelite-powellite (Sch-Pow) aggregates. (a) Small crystal (~30 μm diameter) of intermediate Sch-Pow composition (medium contrast on the BSE image) with sub-micron oscillatory zoning. (b,c) High-Mo slivers (strong contrast on BSE images) showing wider and finer oscillatory zoning with respect to Mo vs. W. Note the highest Pow (up to ~80 mol.%) was measured from such areas.
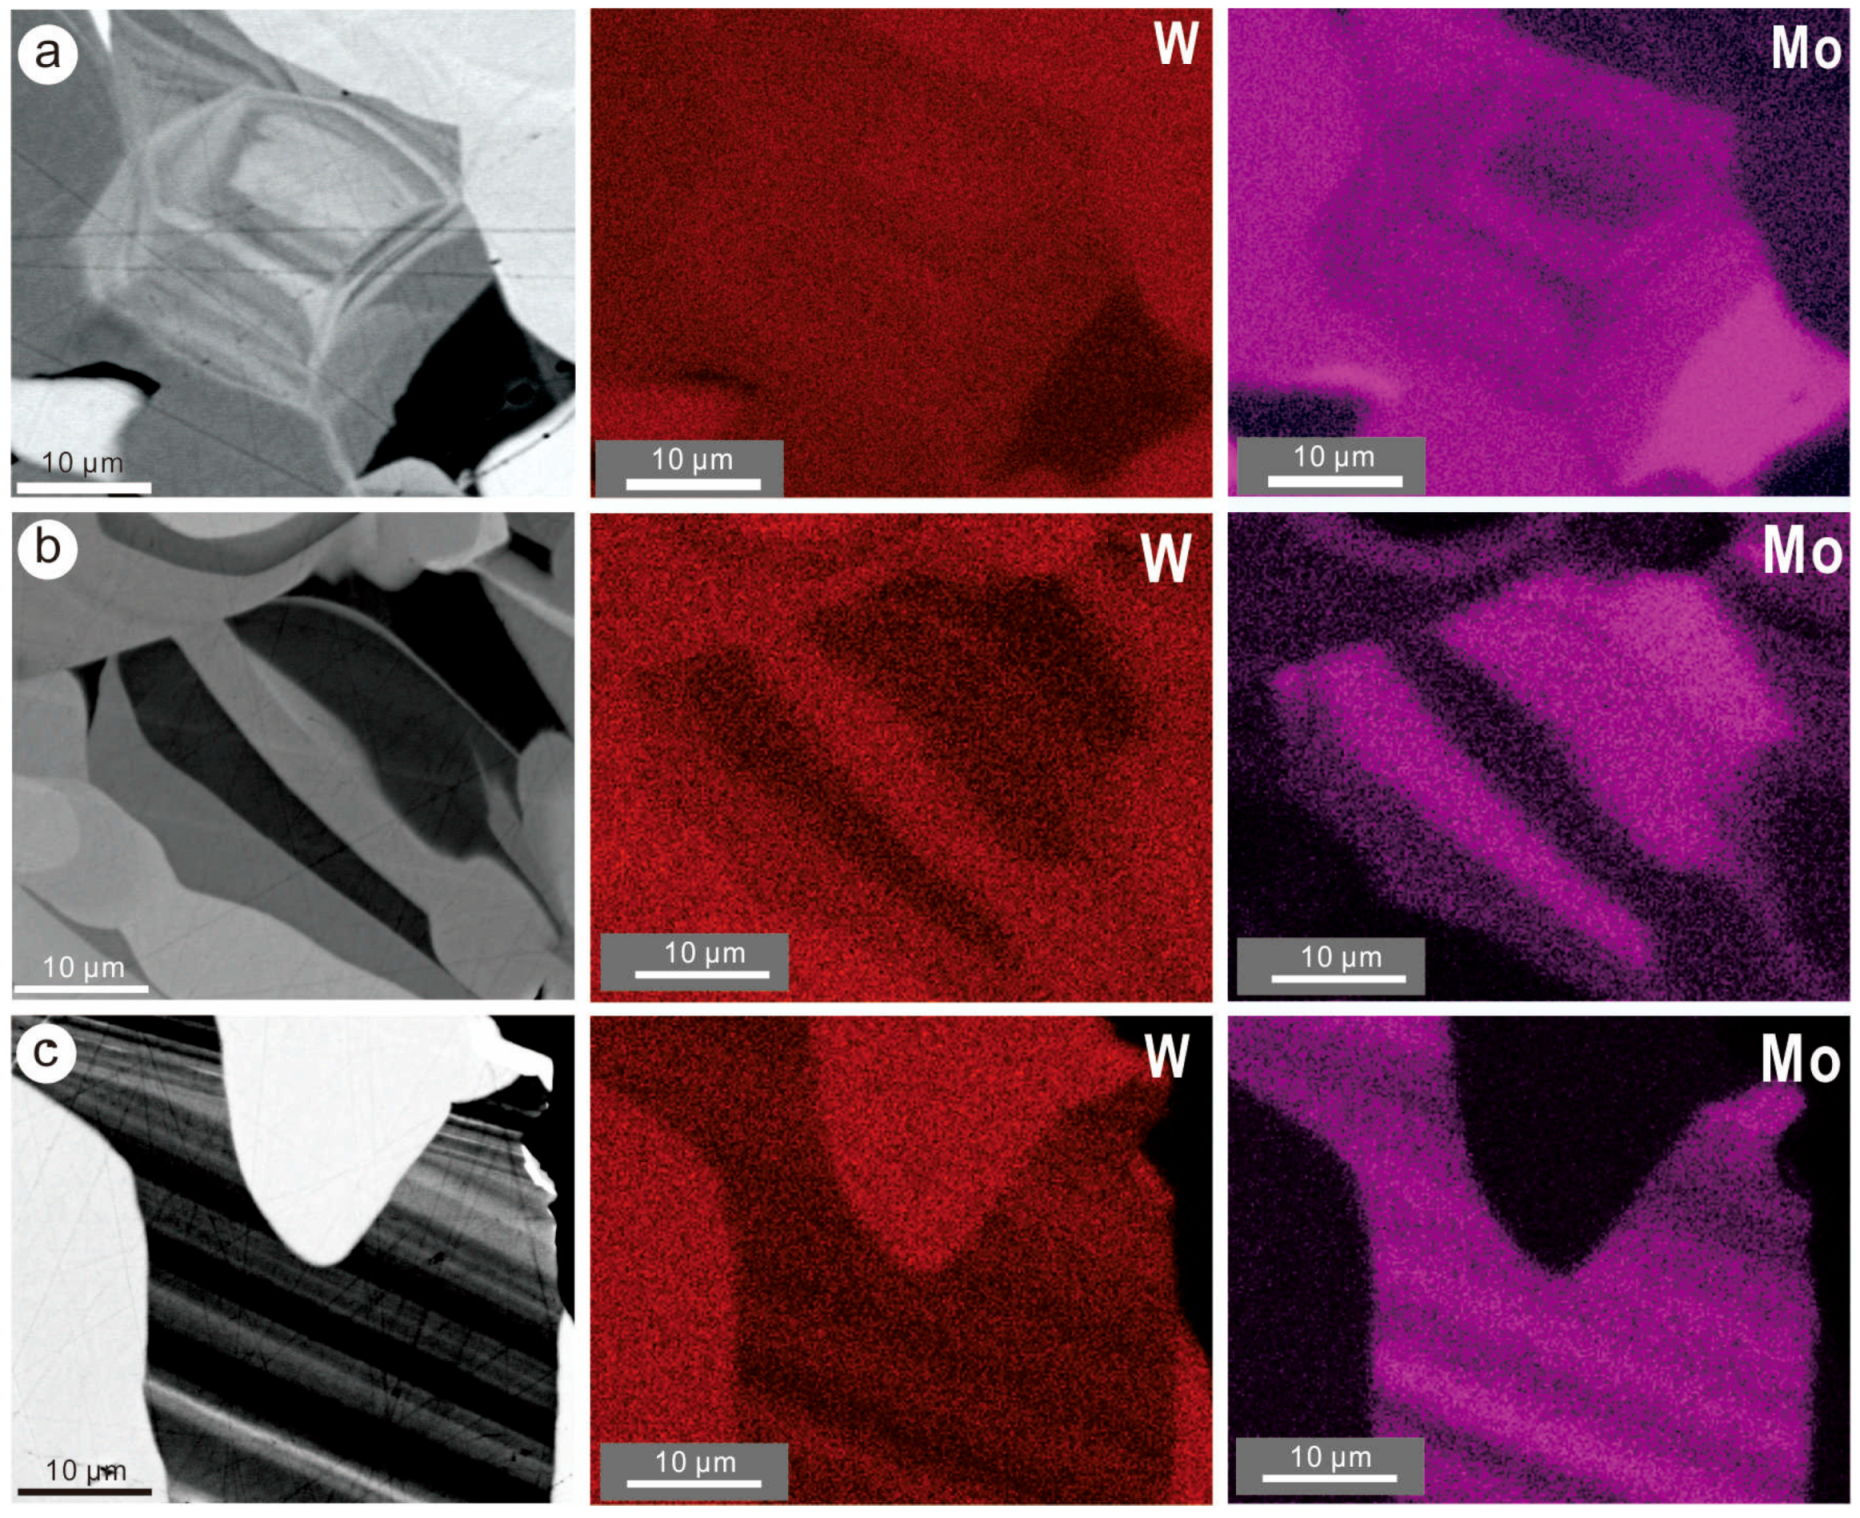
Figure 5.
Binary plots showing trace element correlations in scheelite-powellite. (a) W vs. ΣREY + Nb + As; (b) Nb vs. ΣREY; (c) As vs. Nb; (d) Mo vs. ΣREY; (e) Mo vs. As; (f) As vs. ΣREY; (g) Sr vs. W; (h) Sr vs. Mo; (i) Sr vs. ΣREY + As + Nb.
Figure 5.
Binary plots showing trace element correlations in scheelite-powellite. (a) W vs. ΣREY + Nb + As; (b) Nb vs. ΣREY; (c) As vs. Nb; (d) Mo vs. ΣREY; (e) Mo vs. As; (f) As vs. ΣREY; (g) Sr vs. W; (h) Sr vs. Mo; (i) Sr vs. ΣREY + As + Nb.
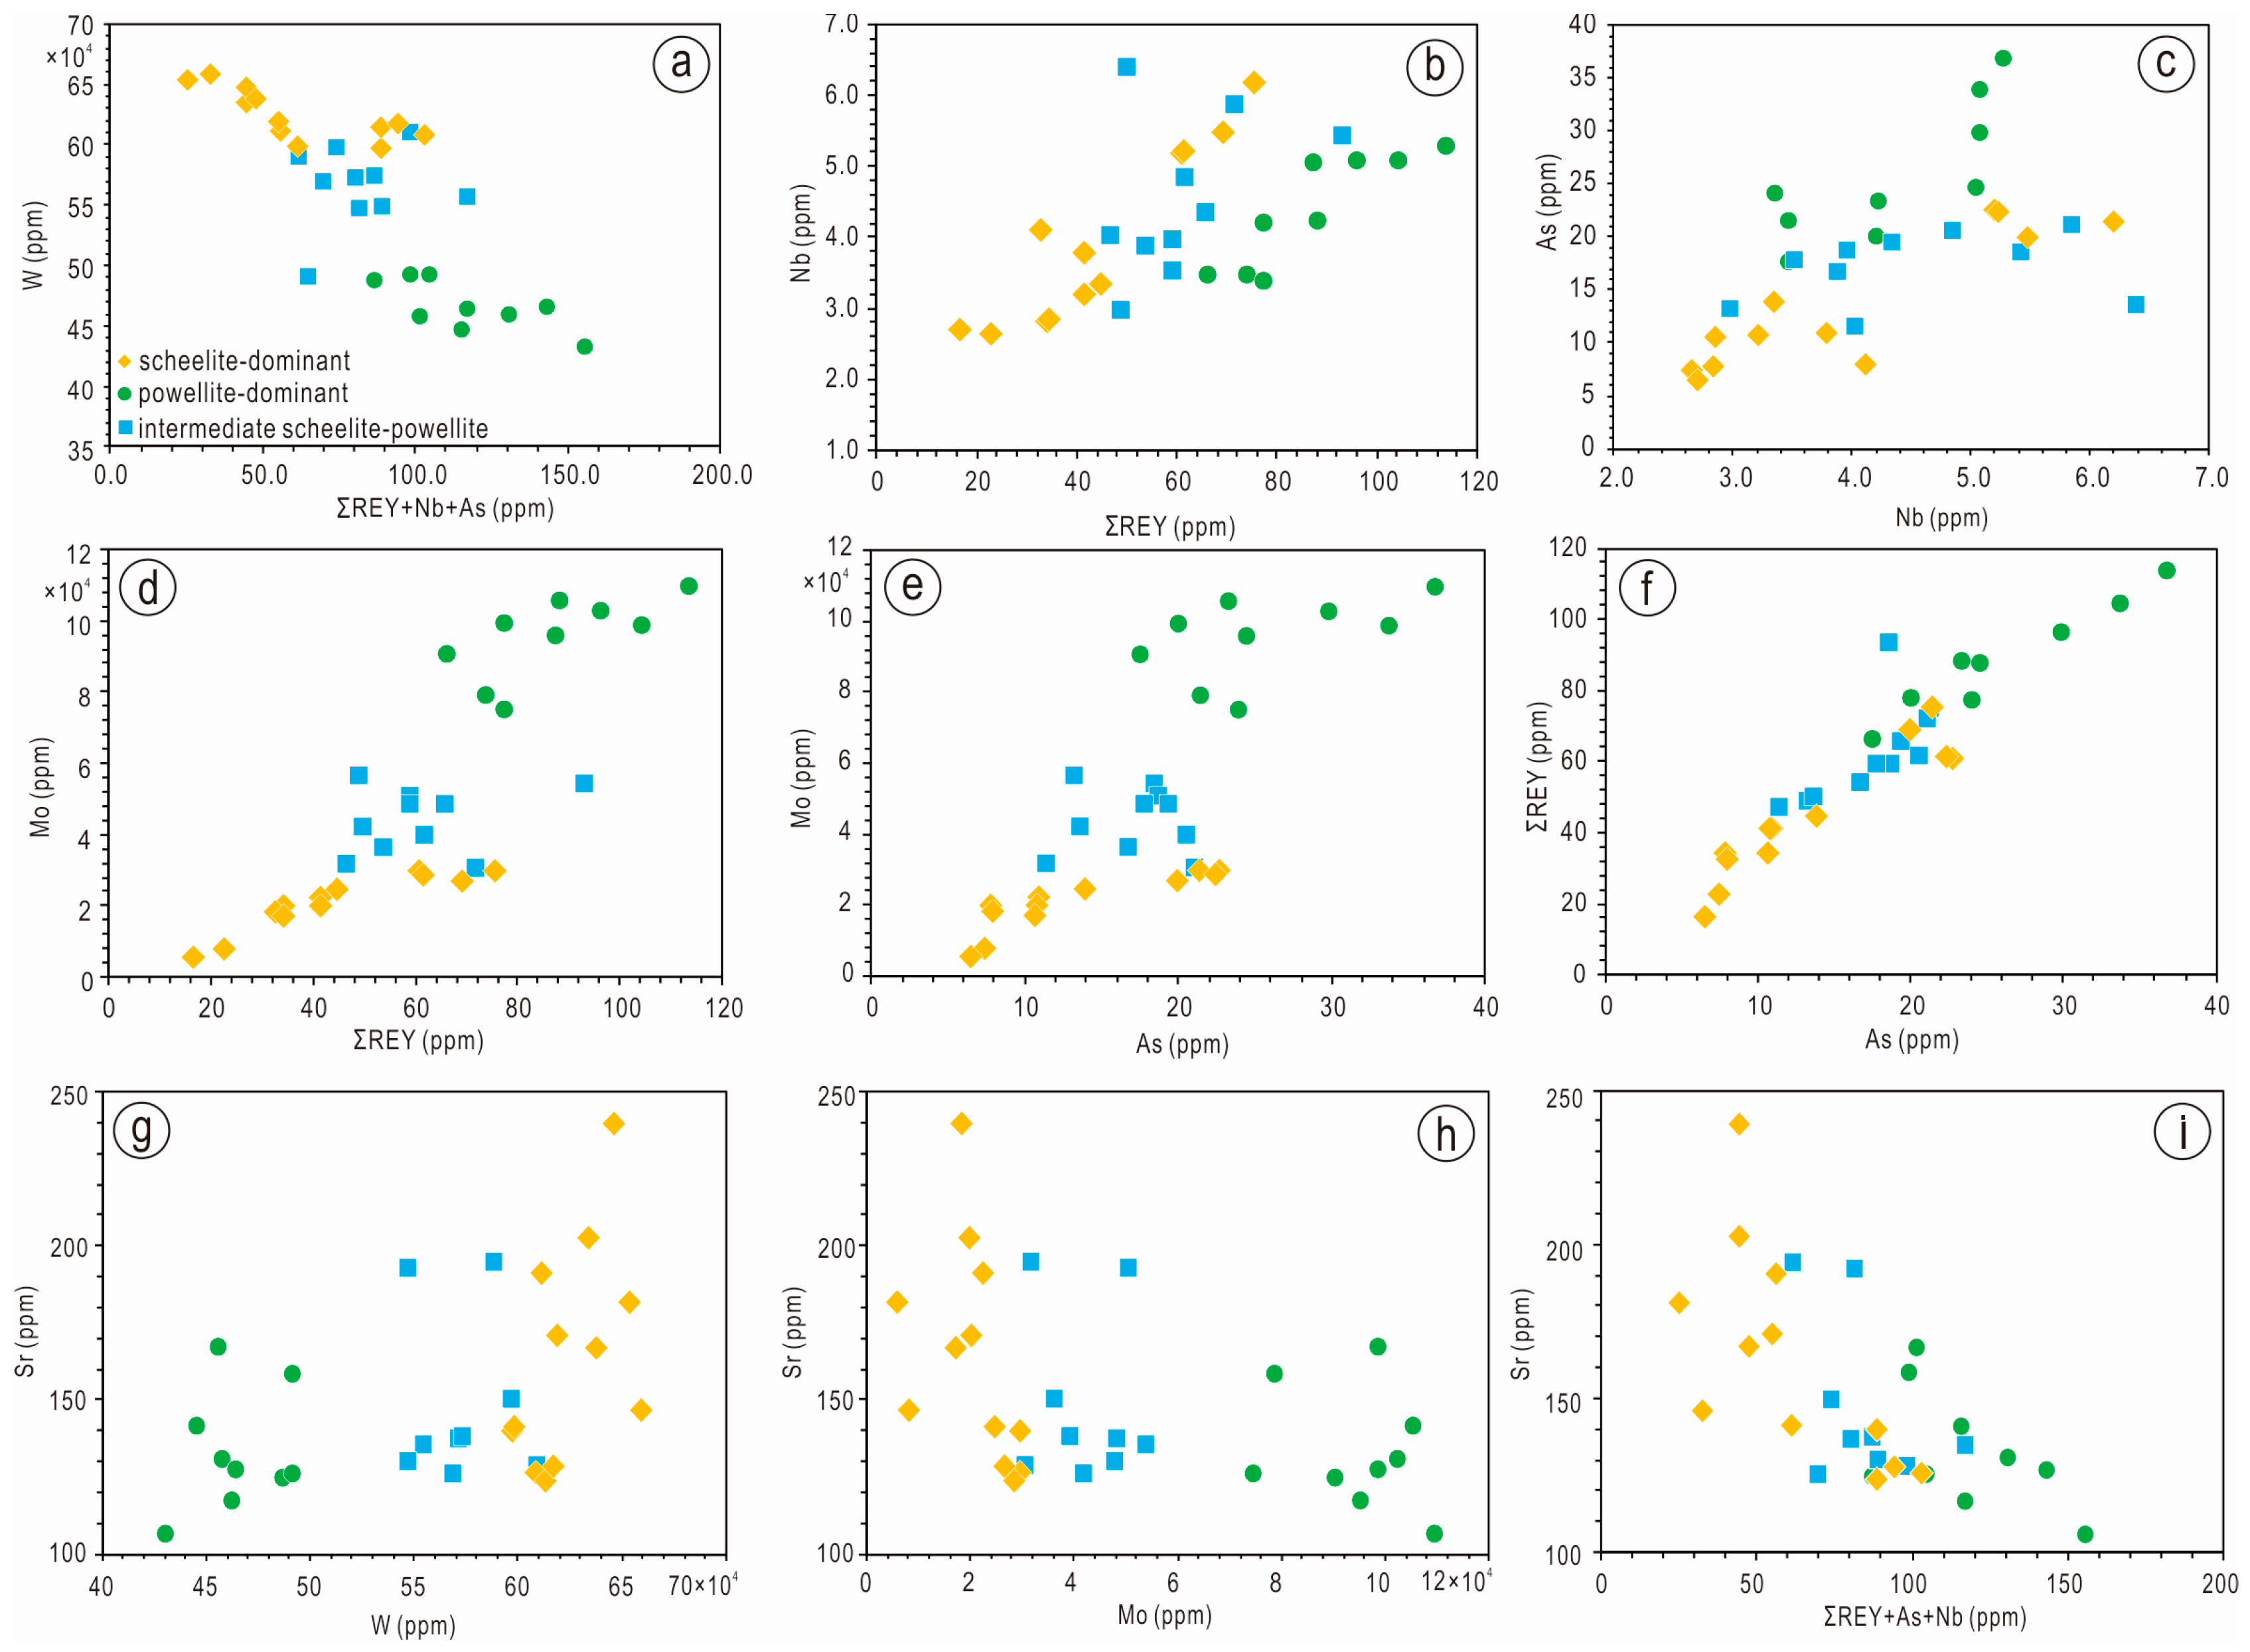
Figure 6.
Chondrite-normalized REY fractionation trends for scheelite-powellite (a,b; individual analyses Table 2) and for skarn minerals in the same sample (#168; averages from Xu et al. [22]) in (c) and for lithologies (whole rock data; Xu et al. [20] in (d)). Note the change in the patterns towards higher LREE in powellite-dominant areas in (a). Grossular (Gr~50) and clinozoisite (in (c)) are main REE carriers for the prograde and retrograde stages, respectively. Note the MREE-rich trend in Gr~50 and its marked variation with colour/retrograde stage. Trends for the two lithologies are relatively similar except the negative Eu anomaly in the tuff, shown in (d).

Figure 7.
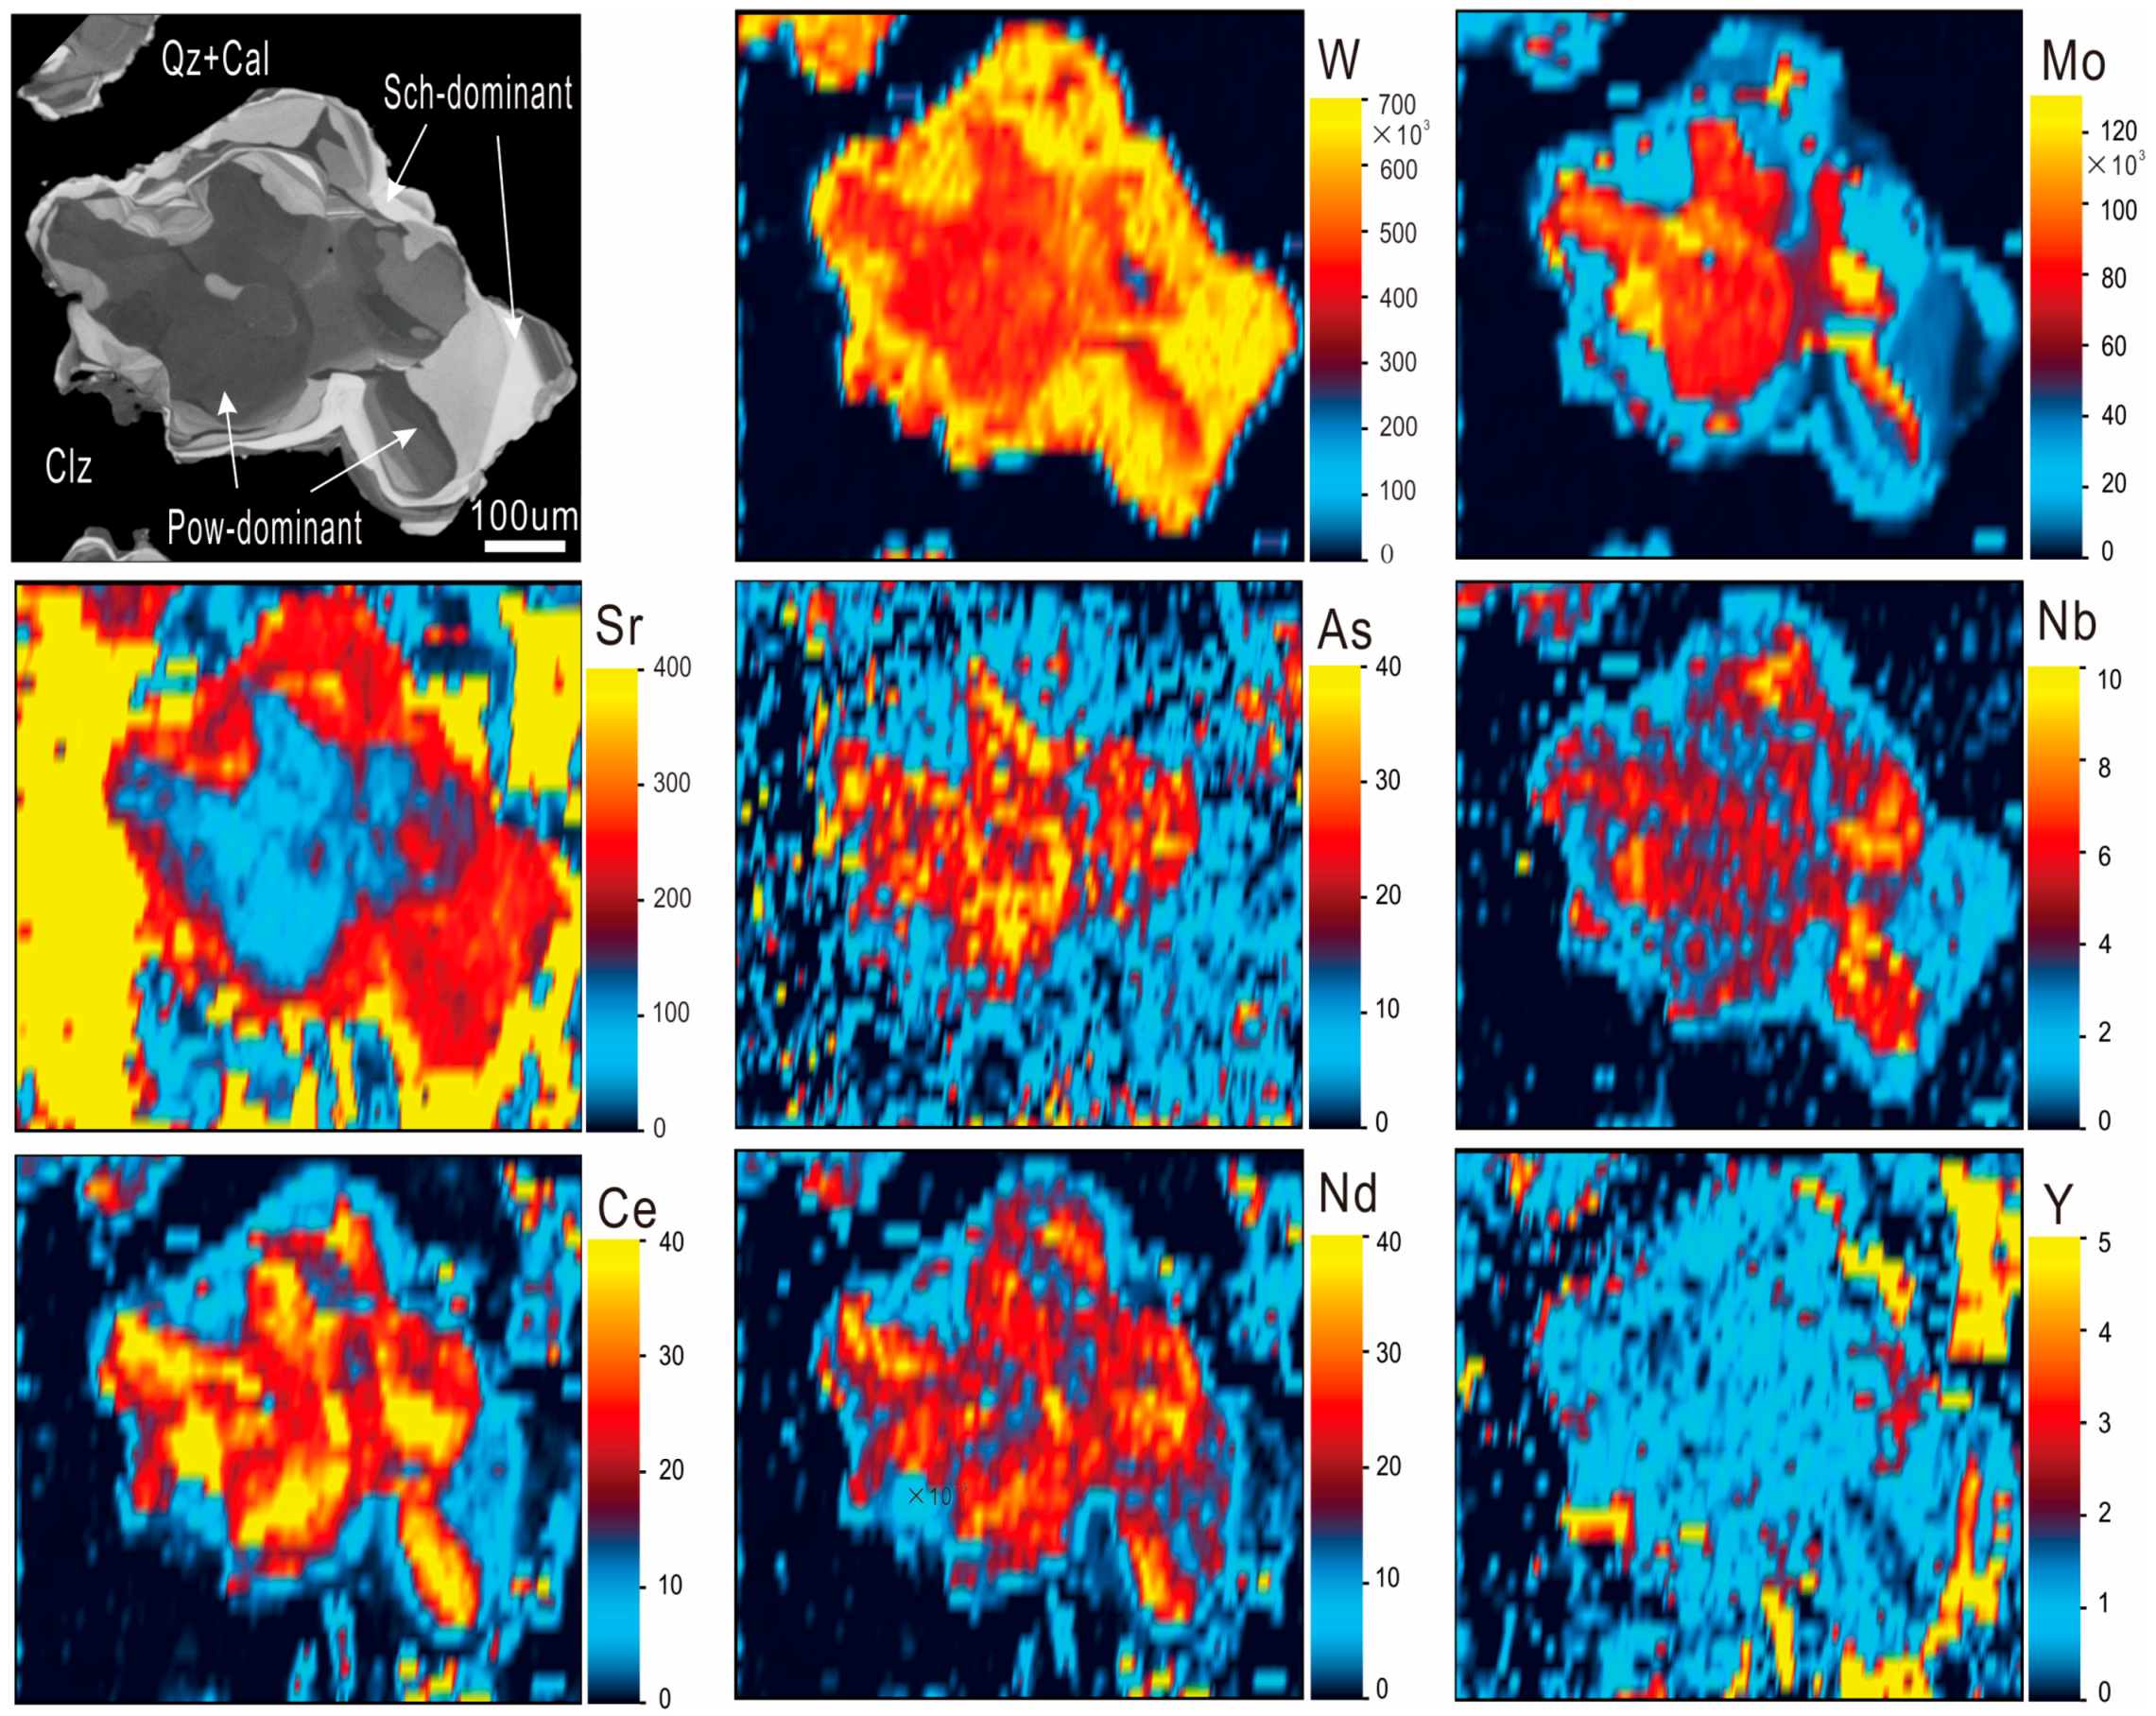
Laser ablation inductively coupled plasma mass spectrometry (LA-ICP-MS) element maps of scheelite-powellite for selected elements. Colour scales in parts-per-million. The image shown upper left is a CL image of the mapped area. Note strong relative enrichment in As, LREE (Ce and Nd are shown), and Nb in powellite (dark on CL image), and relative enrichment in Sr in scheelite. Yttrium shows no correlation with Mo content, but is apparently present at a higher concentration within the Sch-dominant rims. See main text for additional explanation.
Figure 7.
Laser ablation inductively coupled plasma mass spectrometry (LA-ICP-MS) element maps of scheelite-powellite for selected elements. Colour scales in parts-per-million. The image shown upper left is a CL image of the mapped area. Note strong relative enrichment in As, LREE (Ce and Nd are shown), and Nb in powellite (dark on CL image), and relative enrichment in Sr in scheelite. Yttrium shows no correlation with Mo content, but is apparently present at a higher concentration within the Sch-dominant rims. See main text for additional explanation.

Figure 8.
(a) Plot of wt.% MoO3 vs. wt.% WO3 for Zhibula scheelite-powellite (EPMA data) showing a range straddling from ~5 mol.% to 80 mol.% Pow (highlighted by pink overlay). The dataset thus represents one of the widest spreads along the Sch-Pow tie-line recorded from a single occurrence. The composition of areas chosen for nanoscale investigation is indicated. Selected examples of scheelite-powellite from published data are shown for comparison: Kara [10], Kozbudaklar [30], King Island [9], Zhuxi [31], Jitoushan-Baizhangyan [5], Shimensi [32], Trapranin Law [33], and Fianel [8]. (b–e) BSE images (left) and secondary electron (SE) images (right) showing plan view and depth (cross-section imaging) of the areas selected for nanoscale study. Tungsten and Mo distribution for the same areas are shown on EDS-SEM maps from Figure 4a,c. FIB—focused ion beam.
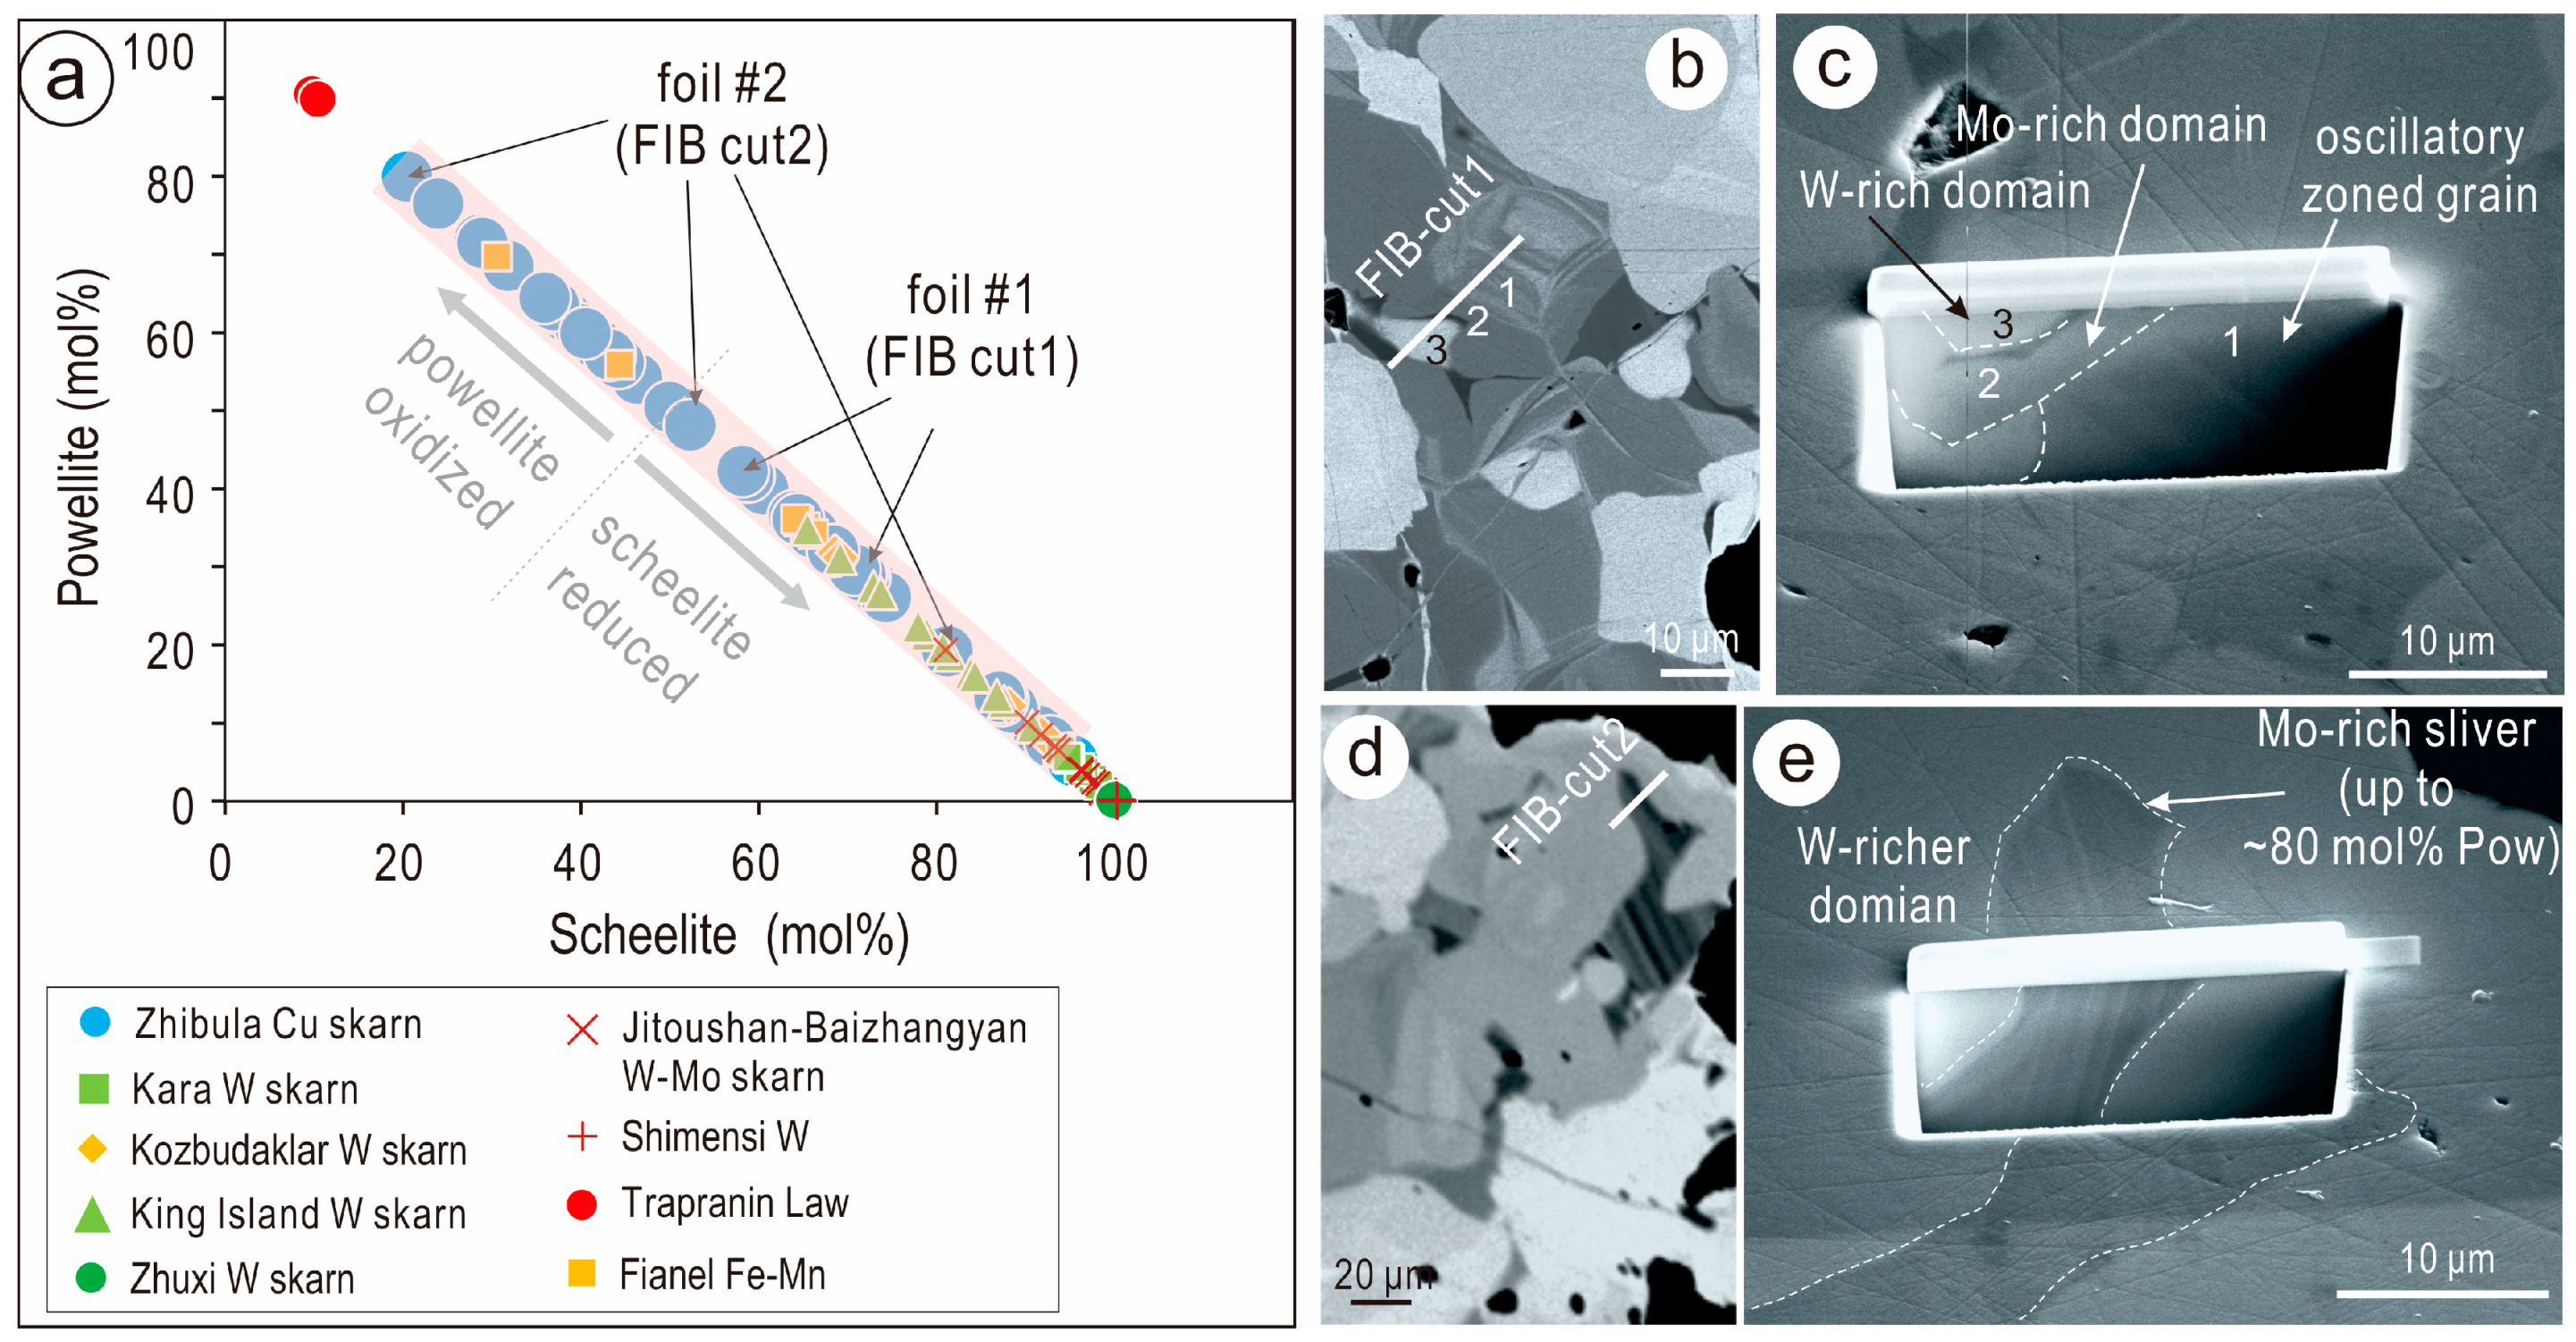
Figure 9.
(a–c) Plan and depth views of the area sampled for the zoned grain of intermediate Sch-Pow composition. (a) BSE image showing the correspondence between EPMA spot analysis and the FIB cut across three distinct domains as marked. (b,c) Secondary electron (SE) and bright-field (BF) transmission electron microscopy (TEM) images showing the scanning TEM (S/TEM) foil. Note oscillatory zoning depicted on the SE image in (b) and also the presence of a fourth sub-surface domain. (d) Selected areas of electron diffraction (SAEDs) on scheelite/powellite showing no changes in orientation between different compositional domains [#1 and #2 as marked on (c)]. (e) BF TEM image showing the boundary between different domains being affected by inclusions/pores and saw-tooth imbrication. (f,g) BF and high-angular annular dark field (HAADF) STEM images showing needle-like inclusions in the oscillatory zoned grain. Xtm—xenotime.

Figure 10.
(a–d) Plan and depth views of the area sampled for the highest powellite (Pow) content as marked. Note correlation between oscillatory zoning on SE image (b) and HAADF STEM image (d–f). SAEDs obtained from Mo-rich sliver and Mo-poor (20 wt.% Pow) matrix showing twinned domains with rotation at ~80° about * on Sch/Pow zone axis. Note the presence of forbidden reflections marked in yellow. (g) HAADF STEM image showing inclusions trails (xenotime-Y) across the sliver boundary.

Figure 11.
EDS STEM maps (a) and spectra (b) showing the boundary between the Mo-rich sliver and the matrix. Map location is shown on Figure 10d. The Cu signal is from the TEM grid.
Figure 11.
EDS STEM maps (a) and spectra (b) showing the boundary between the Mo-rich sliver and the matrix. Map location is shown on Figure 10d. The Cu signal is from the TEM grid.

Figure 12.
HAADF STEM images (a–d) showing atomic arrangements in scheelite-powellite on zone axes as marked on FFTs (insets). (e,f) From left to right, HAADF image, STEM simulation, and crystal model for the [100] and zone axes (imaged in a–d). Note the good fit between the images and simulation in each case. The bright spots on the HAADF images can be attributed in agreement with the crystal models. Crystal structures from Hazen et al. [2]. Unit cells for scheelite and powellite: a = 5.2429 Å, c = 11.3737 Å; and a = 5.222 Å, c = 11.425 Å, respectively; space group I41/a in both cases.

Figure 13.
EDS STEM maps (a), intensity profile (b), and spectrum (c) showing two needles of xenotime-(Y) in scheelite-powellite from the zoned grain shown in Figure 9g. Location of profile and area for spectrum are marked in (a). The Cu signal is from the TEM grid.
Figure 13.
EDS STEM maps (a), intensity profile (b), and spectrum (c) showing two needles of xenotime-(Y) in scheelite-powellite from the zoned grain shown in Figure 9g. Location of profile and area for spectrum are marked in (a). The Cu signal is from the TEM grid.

Figure 14.
EDS STEM maps (a), intensity profile (b), and spectrum (c) showing one of the longest xenotime-(Y) needles in scheelite-powellite from the zoned grain shown in Figure 9g. Location of profile and area for spectrum are marked in (a). Note that higher resolution improves confidence with the mapped elements (compare with Figure 13). The Cu signal is from the TEM grid.

Figure 15.
High-resolution HAADF STEM images on [100]Sch/Pow showing lamellae of xenotime in scheelite-powellite (Sch-Pow) zoned grain of intermediate composition (foil #1). (a) Sharp edge of lamella epitaxially intergrown with Sch-Pow as shown on FFT from inset. (b,c) Images showing the xenotime lamellae are homogenous and display kink-steps. (d) Detail of xenotime lamella (rectangle marked in c) showing the edges are embedded within the host Sch-Pow.

Table 1.
EPMA data for Zhibula scheelite-powellite.
| Point # | CaO | WO3 | MoO3 | Total | Ca | W | Mo | Total | Sch | Pow |
|---|---|---|---|---|---|---|---|---|---|---|
| wt.% | wt.% | wt.% | wt.% | apfu | apfu | apfu | apfu | %.mol | %.mol | |
| Unzoned/weakly zoned W-rich domains (n = 9) | ||||||||||
| Minimum | 20.0 | 70.9 | 2.70 | 97.9 | 1.006 | 0.861 | 0.053 | 0.992 | 86.5 | 13.5 |
| Maximum | 20.4 | 77.3 | 6.86 | 100.0 | 1.025 | 0.944 | 0.134 | 0.998 | 94.6 | 5.4 |
| Mean | 20.2 | 74.0 | 4.88 | 99.0 | 1.014 | 0.899 | 0.096 | 0.995 | 90.4 | 9.6 |
| SD | 0.1 | 2.1 | 1.51 | 0.7 | 0.006 | 0.030 | 0.029 | 0.002 | 2.9 | 2.9 |
| Patterned Mo-rich domains spanning ~Sch20-80Pow20-80 (n = 30) | ||||||||||
| Minimum | 21.2 | 21.4 | 14.5 | 97.1 | 0.984 | 0.201 | 0.270 | 0.996 | 20.4 | 20.1 |
| Maximum | 25.8 | 63.2 | 52.4 | 101.4 | 1.013 | 0.727 | 0.798 | 1.005 | 79.9 | 79.6 |
| Mean | 23.5 | 41.7 | 34.5 | 99.7 | 0.997 | 0.434 | 0.566 | 1.001 | 45.4 | 54.6 |
| SD | 1.2 | 10.9 | 9.9 | 0.8 | 0.007 | 0.136 | 0.137 | 0.002 | 14.5 | 14.5 |
| Oscillatory-zoned grain in Mo-rich domains (FIB cut; foil #1), in order of increasing Pow component | ||||||||||
| 1 | 20.8 | 68.3 | 10.0 | 99.2 | 1.014 | 0.804 | 0.192 | 0.995 | 80.8 | 19.2 |
| 2 | 21.0 | 63.7 | 13.9 | 98.5 | 1.004 | 0.737 | 0.261 | 0.999 | 73.9 | 26.1 |
| 3 | 21.3 | 61.5 | 15.2 | 98.0 | 1.014 | 0.710 | 0.285 | 0.995 | 71.4 | 28.6 |
| 4 | 21.5 | 61.3 | 16.0 | 98.7 | 1.013 | 0.700 | 0.296 | 0.996 | 70.3 | 29.7 |
| 5 | 21.3 | 61.8 | 15.5 | 98.7 | 1.010 | 0.708 | 0.289 | 0.997 | 71.0 | 29.0 |
| 6 | 21.3 | 61.0 | 15.8 | 98.1 | 1.012 | 0.701 | 0.295 | 0.996 | 70.3 | 29.7 |
| 7 | 21.6 | 60.0 | 17.5 | 99.1 | 1.007 | 0.677 | 0.320 | 0.998 | 67.9 | 32.1 |
| 8 | 22.1 | 57.1 | 20.4 | 99.5 | 1.009 | 0.631 | 0.366 | 0.997 | 63.3 | 36.7 |
| 9 | 22.0 | 55.2 | 22.6 | 99.8 | 0.995 | 0.602 | 0.399 | 1.002 | 60.1 | 39.9 |
| 10 | 22.2 | 53.1 | 23.3 | 98.5 | 1.006 | 0.583 | 0.414 | 0.998 | 58.5 | 41.5 |
The full dataset is given as Supplementary Material Table S1.
Table 2.
Laser ablation inductively coupled plasma mass spectrometry (LA-ICP-MS) data for Zhibula scheelite-powellite (ppm).
Table 2.
Laser ablation inductively coupled plasma mass spectrometry (LA-ICP-MS) data for Zhibula scheelite-powellite (ppm).
| Ti | Fe | As | Sr | Nb | Mo | La | Ce | Pr | Nd | Sm | Eu | Gd | Tb | Dy | Y | Ho | Er | Tm | Yb | Lu | ΣREY | W | |
|---|---|---|---|---|---|---|---|---|---|---|---|---|---|---|---|---|---|---|---|---|---|---|---|
| Scheelite-dominant (n = 12) | |||||||||||||||||||||||
| Mean | 0.67 | 14 | 13 | 172 | 3.9 | 19,875 | 4.6 | 13 | 2.4 | 14 | 3.1 | 0.49 | 2.1 | 0.16 | 0.53 | 1.3 | 0.07 | 0.10 | 0.01 | 0.04 | 0.01 | 42 | 626,727 |
| SD | 0.20 | 3.7 | 6.3 | 47 | 1.2 | 8268 | 2.2 | 6.4 | 1.1 | 6.7 | 1.2 | 0.07 | 0.86 | 0.07 | 0.24 | 0.66 | 0.04 | 0.06 | 0.00 | 0.01 | 0.00 | 19 | 21,550 |
| Maximum | 1.1 | 19 | 23 | 282 | 6.2 | 29,485 | 8.3 | 24 | 4.2 | 25 | 5.2 | 0.61 | 3.7 | 0.31 | 1.0 | 2.8 | 0.16 | 0.25 | 0.02 | 0.06 | 0.01 | 76 | 658,904 |
| Minimum | <mdl | 8.0 | 6.4 | 124 | 2.7 | 5673 | 1.4 | 4.4 | 0.81 | 3.6 | 0.90 | 0.31 | 0.63 | 0.07 | 0.22 | 0.42 | 0.02 | 0.03 | <mdl | <mdl | <mdl | 16 | 597,184 |
| Powellite-dominant (n = 9) | |||||||||||||||||||||||
| Mean | 2.2 | 15 | 26 | 133 | 4.4 | 94,866 | 13 | 34 | 5.5 | 27 | 3.8 | 0.38 | 1.9 | 0.12 | 0.39 | 0.87 | 0.04 | 0.08 | 0.01 | 0.03 | 0.01 | 87 | 465,453 |
| SD | 0.36 | 5.2 | 6.5 | 19 | 0.79 | 11,747 | 2.3 | 6.1 | 1.0 | 5.0 | 0.70 | 0.07 | 0.47 | 0.04 | 0.11 | 0.31 | 0.02 | 0.03 | 0.00 | 0.01 | 0.00 | 16 | 21,122 |
| Maximum | 2.6 | 21 | 37 | 167 | 5.3 | 109,489 | 16 | 44 | 7.1 | 36 | 5.0 | 0.46 | 2.8 | 0.20 | 0.55 | 1.5 | 0.07 | 0.13 | 0.01 | 0.04 | 0.01 | 114 | 491,828 |
| Minimum | 1.5 | 8.0 | 18 | 106 | 3.4 | 74,484 | 10 | 26 | 4.2 | 21 | 2.8 | 0.23 | 1.3 | 0.08 | 0.25 | 0.59 | 0.02 | 0.04 | <mdl | <mdl | <mdl | 66 | 430,934 |
| Intermediate scheelite-powellite (n = 10) | |||||||||||||||||||||||
| Mean | 1.3 | 17 | 17 | 148 | 4.5 | 43,709 | 7.3 | 21 | 3.6 | 20 | 3.8 | 0.50 | 2.5 | 0.17 | 0.62 | 1.5 | 0.07 | 0.14 | 0.01 | 0.04 | 0.01 | 61 | 564,895 |
| SD | 0.25 | 2.9 | 3.4 | 27 | 1.1 | 9159 | 1.9 | 5.5 | 0.73 | 3.7 | 0.92 | 0.07 | 0.92 | 0.07 | 0.24 | 0.51 | 0.03 | 0.05 | 0.00 | 0.02 | 0.00 | 14 | 33,321 |
| Maximum | 1.5 | 22 | 21 | 194 | 6.4 | 56,319 | 12 | 35 | 5.3 | 27 | 5.5 | 0.63 | 4.3 | 0.29 | 1.1 | 2.6 | 0.14 | 0.23 | 0.02 | 0.08 | 0.01 | 93 | 609,128 |
| Minimum | 0.68 | 14 | 11 | 125 | 3.0 | 30,518 | 5.3 | 16 | 2.8 | 15 | 2.7 | 0.40 | 1.3 | 0.09 | 0.37 | 0.81 | 0.04 | 0.06 | 0.01 | <mdl | 0.01 | 47 | 490,079 |
Note: Average minimum detection limits (mdl), in ppm, were as follows: Ti (0.485), Fe (7.621), As (0.302), Sr (0.017), Nb (0.010), La (0.007), Ce (0.008), Pr (0.006), Nd (0.030), Sm (0.041), Eu (0.011), Gd (0.039), Tb (0.006), Dy (0.023), Y (0.007), Ho (0.006), Er (0.018), Tm (0.005), Yb (0.025), and Lu (0.006). The full dataset is given as Supplementary Material Table S2.
© 2019 by the authors. Licensee MDPI, Basel, Switzerland. This article is an open access article distributed under the terms and conditions of the Creative Commons Attribution (CC BY) license (http://creativecommons.org/licenses/by/4.0/).
Share and Cite
MDPI and ACS Style
Xu, J.; Ciobanu, C.L.; Cook, N.J.; Slattery, A. Crystals from the Powellite-Scheelite Series at the Nanoscale: A Case Study from the Zhibula Cu Skarn, Gangdese Belt, Tibet. Minerals 2019, 9, 340. https://doi.org/10.3390/min9060340
AMA Style
Xu J, Ciobanu CL, Cook NJ, Slattery A. Crystals from the Powellite-Scheelite Series at the Nanoscale: A Case Study from the Zhibula Cu Skarn, Gangdese Belt, Tibet. Minerals. 2019; 9(6):340. https://doi.org/10.3390/min9060340
Chicago/Turabian StyleXu, Jing, Cristiana L. Ciobanu, Nigel J. Cook, and Ashley Slattery. 2019. "Crystals from the Powellite-Scheelite Series at the Nanoscale: A Case Study from the Zhibula Cu Skarn, Gangdese Belt, Tibet" Minerals 9, no. 6: 340. https://doi.org/10.3390/min9060340
Note that from the first issue of 2016, this journal uses article numbers instead of page numbers. See further details here.