Article

Invisible Gold in Pyrite from Epithermal, Banded-Iron-Formation-Hosted, and Sedimentary Gold Deposits: Evidence of Hydrothermal Influence

1
Faculty of Science, Shizuoka University, 836 Ohya, Shizuoka 422-8529, Japan
2
Geological Survey of Japan, AIST, Central 7, Higashi 1-1-1, Tsukuba 305-8567, Japan
3
Department of Geology and Mining, School of Physical and Mineral Sciences, University of Limpopo, Private Bag X1106, Sovenga 0727, South Africa
4
Atmosphere and Ocean Research Institute, University of Tokyo, Chiba 277-8564, Japan
5
Department of Environmental Security Systems, Chiba Institute of Science, Chiba 288-0025, Japan
*
Author to whom correspondence should be addressed.
Minerals 2019, 9(7), 447; https://doi.org/10.3390/min9070447
Submission received: 6 June 2019 / Revised: 10 July 2019 / Accepted: 12 July 2019 / Published: 19 July 2019
(This article belongs to the Special Issue Minerals Down to the Nanoscale: A Glimpse at Ore-Forming Processes)

Abstract

:
“Invisible gold” in pyrite is defined as an Au solid solution of the pyrite lattice, sub-microscopic Au nanoparticles (NPs) in the pyrite, or other chemisorption complexes of Au. Because the relationship between the Au and As concentrations in pyrite could indicate the genesis of the deposit, the purpose of this study is to assess the micro-analytical characteristics of the Au–As relationship in pyrite from epithermal and hydrothermally affected sedimentary Au deposits by secondary ion mass spectrometry. The Au and As concentrations in pyrite vary from 0.04 to 30 ppm and from 1 to 1000 ppm, respectively, in the high-sulfidation Nansatsu-type epithermal deposits; these concentrations are both lower than those of the low-sulfidation epithermal Hishikari deposit. The Au concentrations in pyrrhotite and pyrite reach 6 and 0.3 ppm, respectively, in the Kalahari Goldridge banded-iron-formation-hosted gold deposit, and Au in pyrrhotite may sometimes exist as NPs, whereas As concentrations in pyrrhotite and pyrite are both low and lie in a narrow range from 6 to 22 ppm. Whether Au is present as NPs is important in ore dressing. The Au and As concentrations in pyrite from the Witwatersrand gold field range from 0.02 to 1.1 ppm and from 8 to 4000 ppm, respectively. The shape of the pyrite grains might prove to be an indicator of the hydrothermal influence on deposits of sedimentary origin, which implies the genesis of the deposits.

1. Introduction

It has been observed that gold recoveries from ore in many gold mining operations are generally lower than those determined by assay [1]. This is because Au has been found to occur as electrum or native Au and as “invisible gold” that is too small to see by optical microscope. The “invisible gold” comprises sub-microscopic Au nanoparticles (NPs; <100 nm, [2,3,4]) in minerals, such as sulfides, Au in a solid solution of sulfide crystals, Au in surficial nonautonomous phases [5], and chemisorbed Au polysulfide complexes [6]. Such Au types are referred to as “invisible gold”. It is of great concern whether the “invisible gold” occurs as NPs or as structurally bound in the lattices of the sulfides because the former could be extracted from finely pulverized concentrate, while the latter results in the ore being refractory. Microbeam analytical techniques have been applied to evaluate the presence of Au in sulfides in Au deposits [7,8,9,10,11,12]. Morishita and Hammond [13] observed Au peaks corresponding to NPs in pyrrhotite from a banded-iron-formation (BIF)-hosted Au deposit in South Africa using secondary ion mass spectrometry (SIMS) depth profiling techniques.
Several studies have shown that there is generally a positive correlation between Au and As concentrations in hand specimens obtained from geochemical Au explorations (e.g., [14]). Pyrite is ubiquitous in most hydrothermal deposits, and several papers have reported that arsenian pyrite is a common host for invisible gold (e.g., [8]). The Au content in pyrite generally increases with an increasing As content [15,16,17].
Reich et al. [18] have shown that the solubility of Au in arsenian pyrite from Carlin-type and epithermal Au deposits increases with the As content in the pyrite. They proposed an empirical solubility limit of Au, which defines the boundary between Au being present as NPs (Au0) or solid solutions (Au+) in pyrite. Morishita et al. [19] found a positive correlation between Au and As in the Hishikari pyrite in a microscopic area of 3 μm. Additionally, Morishita et al. [20] demonstrated that there is a linear correlation between Au and As concentrations in pyrite from the three ore zones of the high-grade Hishikari deposit.
The purpose of this study is to present the micro-analytical characteristics of the Au–As relationship in pyrite and pyrrhotite (if applicable) from epithermal, BIF-hosted, and sedimentary Au deposits by SIMS for considering the genesis of these ore deposits.

2. Geological Setting and Mineralogy

2.1. High- vs. Low-Sulfidation Epithermal Deposits

In epithermal systems, deposits with high-sulfidation-state minerals, including enargite, tennantite, and covellite, are commonly referred to as “high-sulfidation” or “acid sulfate” deposits [21,22]. In contrast, “low-sulfidation” deposits (or “adularia–sericite” deposits) of epithermal Au mineralization related to near-neutral pH and relatively reduced fluids are associated with low-sulfidation-state minerals [22].

2.2. Epithermal Deposits in Kyushu, Japan

Kyushu is located at the intersection of the Southwestern Japan Arc and the Ryukyu arc on the eastern margin of the Eurasian plate facing the Philippine Sea Plate. Many epithermal Au deposits of Pliocene to Pleistocene age occur in Late Cenozoic subaerial andesitic to dacitic volcanic rocks in Kyushu, Japan (Figure 1). Kagoshima-ken (a prefecture in Kyushu) is situated in the southernmost part of Kyushu and constitutes two historically fixed districts, the Hokusatsu (Northern Kagoshima) and Nansatsu (Southern Kagoshima) districts (Figure 1). Three high-sulfidation epithermal deposits, the Kasuga, Iwato, and Akeshi deposits, are in the Nansatsu district of Kagoshima-ken and are thus commonly called the Nansatsu-type Au deposits. The low-sulfidation epithermal Hishikari deposit in the Hokusatsu district is about 90 km north of the Nansatsu-type Au deposits (Figure 1).

2.3. High-Sulfidation Nansatsu-Type Au Deposits in the Nansatsu District of Kagoshima-ken

Calc-alkaline volcanism in Kagoshima-ken has moved eastward at an average speed of 0.6 cm/year from 8 Ma to date [25,26]. The eastward shift of the volcanic front may be due to a progressive steepening of the west-dipping subduction slab [26]. As hydrothermal activity has followed the volcanism, the location of Au mineralization has also moved eastward. Among the three Nansatsu-type Au deposits, the westernmost Kasuga deposit formed circa 5 Ma, and the intermediate Iwato and easternmost Akeshi deposits (younger than 4 Ma) have formed in turn in the Nansatsu district of Kagoshima-ken (Figure 1) [26]. The present-day active volcanic front occurs approximately 30 km east of the Nansatsu deposits. The Nansatsu district is underlain by sedimentary rocks of the Cretaceous Shimanto Supergroup (primarily of the Kawanabe Group). Kaolinite and its higher-temperature polymorph, dickite, are common in the Nansatsu deposits [27].

2.3.1. Kasuga Deposit

The Kasuga main ore body consists of a silicified zone extending 500 m E–W and 100 m N–S, with a thickness of approximately 80 m. The silica body is enveloped by an argillic zone that consists of an inner dickite (alunite–pyrophyllite) zone and an outer illite–chlorite zone. The average Au content of the silicified rock ranges from 2 to 3 g/t [28]. The principal ore minerals in the deposit are enargite and native gold. Pyrite is ubiquitous throughout the ore body. Several quartz veinlet systems are oriented radially with respect to a basement depression in the vicinity of Kasuga [27]. The mineral paragenesis of the Kasuga deposit is given in Table 1.

2.3.2. Iwato Deposit

The Iwato silicified zone extends more than 1200 m E–W and approximately 200 m N–S, with a thickness of approximately 100 m. Three groups of ore bodies occur within the silicified zone; from east to west, these are the Maruyama ore bodies, the Arabira ore bodies, and the Iwashita ore body. Although the silicified zone continues further to the southwest, minable Au has not been found there. Most of the silicified rocks there contain more than 0.2 g/t Au. The high-grade zone (above 4 g/t) often has a mushroom shape [28]. The mineral paragenesis of the Iwato deposit is given in Table 1.

2.3.3. Akeshi Deposit

A silicified zone (300 m × 200 m, with a thickness of approximately 150 m) contains high-grade zones consisting of gray or milky white quartz. The No. 1 ore body (100 m NE–SW with a width of 40 m) plunges SW at an angle of 60° from the surface (75 m above sea level) to 75 m below sea level. The Akeshi mineralization is the youngest of the three Nansatsu deposits. The Kasuga and Iwato ore bodies formed before deposition of the Nansatsu Middle Volcanics, which host the Akeshi deposit [27]. Primary Au is closely associated with luzonite and pyrite [31]. The mineral paragenesis of the Akeshi deposit is given in Table 1.

2.4. Low-Sulfidation Au Deposits in the Hokusatsu District of Kagoshima-ken

Au mineralization in the Hokusatsu district (Figure 1) is typical of low-sulfidation quartz veins with adularia and calcite. The epithermal Au deposits, including the Hishikari deposit and the Kushikino deposit [32], which is the second largest in Kyushu, have formed from the Pliocene to Pleistocene in the Hokusatsu district.

Hishikari Deposit

The Hishikari deposit, located in the southern part of Kyushu, is the largest Au deposit in Japan (Figure 1). The Hishikari deposit is a low-sulfidation epithermal deposit and is quite famous for its high-grade ore. The Hishikari deposit consists of the Sanjin, Honko, and Yamada ore zones. The Sanjin and Honko ore zones occur in the Cretaceous basement sedimentary rocks of the Lower Shimanto Group. In contrast, veins in the Yamada ore zone occur in Pleistocene andesitic rocks that overlie the basement sedimentary rocks. The mineralization of the Hishikari deposit began at 1.15 Ma and ended by 0.60 Ma [24]. The Hishikari veins consist mainly of quartz, adularia, and smectite, and the most abundant metallic mineral is pyrite. The mineral paragenesis of the Hishikari deposit is given in Table 1. The occurrence of As-bearing minerals, such as arsenopyrite, is not known.

2.5. BIF-Hosted Deposit

Kalahari Goldridge Deposit

The Kalahari Goldridge deposit is a typical lode-gold deposit hosted by BIF in the Archaean Kraaipan Greenstone Belt in the Northwestern Province of South Africa (Figure 2). The genesis of the deposit has been documented [30,33,34]. The Kalahari Goldridge deposit is hosted in a strata-bound iron-formation (3.41 Ga) [35]. It comprises the D zone, A zone, Watertank, and Windmill ore bodies. The entire ore body stretches along a strike length of approximately 6.5 km N–S. The ore zone is characterized by meta-sedimentary rocks.
Principal mineralogy at Kalahari Goldridge includes silicates (chlorite, stilpnomelane, minnesotaite, and muscovite), carbonates (siderite, ankerite–dolomite series, and calcite), and opaque minerals (magnetite, pyrite, pyrrhotite, and chalcopyrite) [30,33,34]. The Kalahari Goldridge deposit hosted by BIF was formed under relatively reduced circumstances, and pyrite and pyrrhotite were found in the deposit. The mineral paragenesis of the Kalahari Goldridge deposit is given in Table 1.
Mineralogical studies at the Kalahari Goldridge deposit have revealed that despite the relatively high assay values found in bulk ores, particularly in pyrrhotite-rich areas, samples showed minor or no visible Au grains during microscopic observations [33,34]. These observations suggest that Au likely occurs at submicroscopic levels or is structurally bound in the lattices of the sulfides in these samples. The presence of submicroscopic Au in sulfides has been a major contributor to refractory Au ores, which presents great difficulty in using conventional extractive metallurgy to extract the Au from these ores. At the Kalahari Goldridge mine, Au recovery stands at 80%, indicating the possible occurrence of submicroscopic Au in the ores at the deposit.

2.6. Sedimentary Au Deposits (Witwatersrand Au Fields)

The Witwatersrand sedimentary basin is situated in the central part of the Kaapvaal Craton of South Africa. This basin consists of a 6000 m-thick layer of clastic sedimentary rocks, the Archaean Witwatersrand Supergroup, and yields auriferous and uraniferous quartz-pebble conglomerates (reefs) [36]. The Witwatersrand Supergroup, which is divided into the lower West Rand and upper Central Rand Groups, has contributed more than one-third of the world’s total historic production. The bottom of the Witwatersrand Supergroup has been dated to 2970 Ma [37], whereas the top has been dated to 2714 Ma [38]. The reefs are considered to represent vast fluvial fans. The Au is mostly of detrital origin, deposited syngenetically with the conglomerates [39]. Pyrite is ubiquitous in the Witwatersrand Au-bearing conglomerates [37].
The initial source of Au was the surrounding Archaean granite–greenstone terrain of the Kaapvaal Craton [36]. The Au occurred in association with pyrite, carbon, and uranium, and most of it has been subsequently modified during later hydrothermal activity [36]. Although debate is ongoing as to whether the genesis of the Witwatersrand Au deposits can be attributed to a paleo-placer source or a hydrothermal source, the modified placer process (a combination of the two sources) is thought to be more plausible [40].

2.6.1. South Deep Deposit

The South Deep Au mine in the West Rand Goldfield lies at the northwestern edge of the Witwatersrand Basin at latitude 26°25′ S, longitude 27°40′ E (Figure 3). The mining target reefs are both the Ventersdorp Contact Reef (VCR) and the Upper Elsburg formation conglomerates [36]. The VCR overlies footwall lithologies of the Turffontein Subgroup in the western part of the mining area. The Upper Elsburg reefs consist of multiple stacked reefs. The Upper Elsburg reef is well-understood thanks to information integrated from surface drilling, three-dimensional (3D) surface seismic surveys, and underground long inclined drillings [36]. Au production amounted to 4885 kg in 2018 [41].

2.6.2. KDC West Deposit

The Kloof–Driefontein Complex (KDC) is situated in the Far West Rand Goldfields at latitude 26°24′ S and longitude 27°30′ E (Figure 3). The Kloof Au Mine (KDC East) and Driefontein Au Mine (KDC West) are situated in the mining area. Au mineralization occurs within quartz-pebble conglomerate reefs, which are developed above unconformable surfaces near the basin margin. The mining target reefs are the Carbon Leader Reef (CL), Ventersdorp Contact Reef (VCR), and Middelvlei Reef (MR). The CL represents most of the current mineral reserves in the KDC West. It varies in thickness from a mere carbon streak to a multiple-band conglomerate of about 200 cm thick [39]. The deepest operating level is 3420 m below the surface (50 Level at 5 Shaft) in the KDC West. The current mineral reserves will possibly remain operating until 2039 [42]. In 2018, the underground production from the KDC West amounted to 8952 kg [43].

3. Materials and Methods

3.1. Materials

Pyrite is the most abundant sulfide and is ubiquitous throughout the high-sulfidation epithermal deposits in the Nansatsu district (the Kasuga, Iwato, and Akeshi deposits) and the low-sulfidation epithermal Hishikari deposit (Table 1). Pyrite samples from the Kasuga deposit were collected from drill core 11MANU-1, which was drilled vertically from the 100 mL (100 m above sea level) bench of the mine [45]. The Iwato pyrite samples were from the 150 mL bench of the Maruyama open pit. The Akeshi pyrite samples containing covelline and native sulfur were from the −50 mL (underground) bench of the No. 1 ore body. Pyrite and pyrrhotite from the Kalahari Goldridge deposit, as well as pyrite from the South Deep and KDC West deposits in the Witwatersrand Basin, South Africa, were sampled for analysis.
The size and shape of the analyzed minerals are described in Table 2. Because the size of a mineral grain is measured on a thin section, it roughly represents the actual 3D substance. Table 2 gives the lengths of the major and minor axes of the grains. The roundness [46], which indicates the degree of abrasion, is another important factor in describing mineral grains in sedimentary-origin Au deposits. The mineral grains assessed in this study were divided into four categories based on their roundness: Crystalline, angular, subangular, and rounded, in order of increasing roundness. The crystalline grains retain their original crystal shapes.

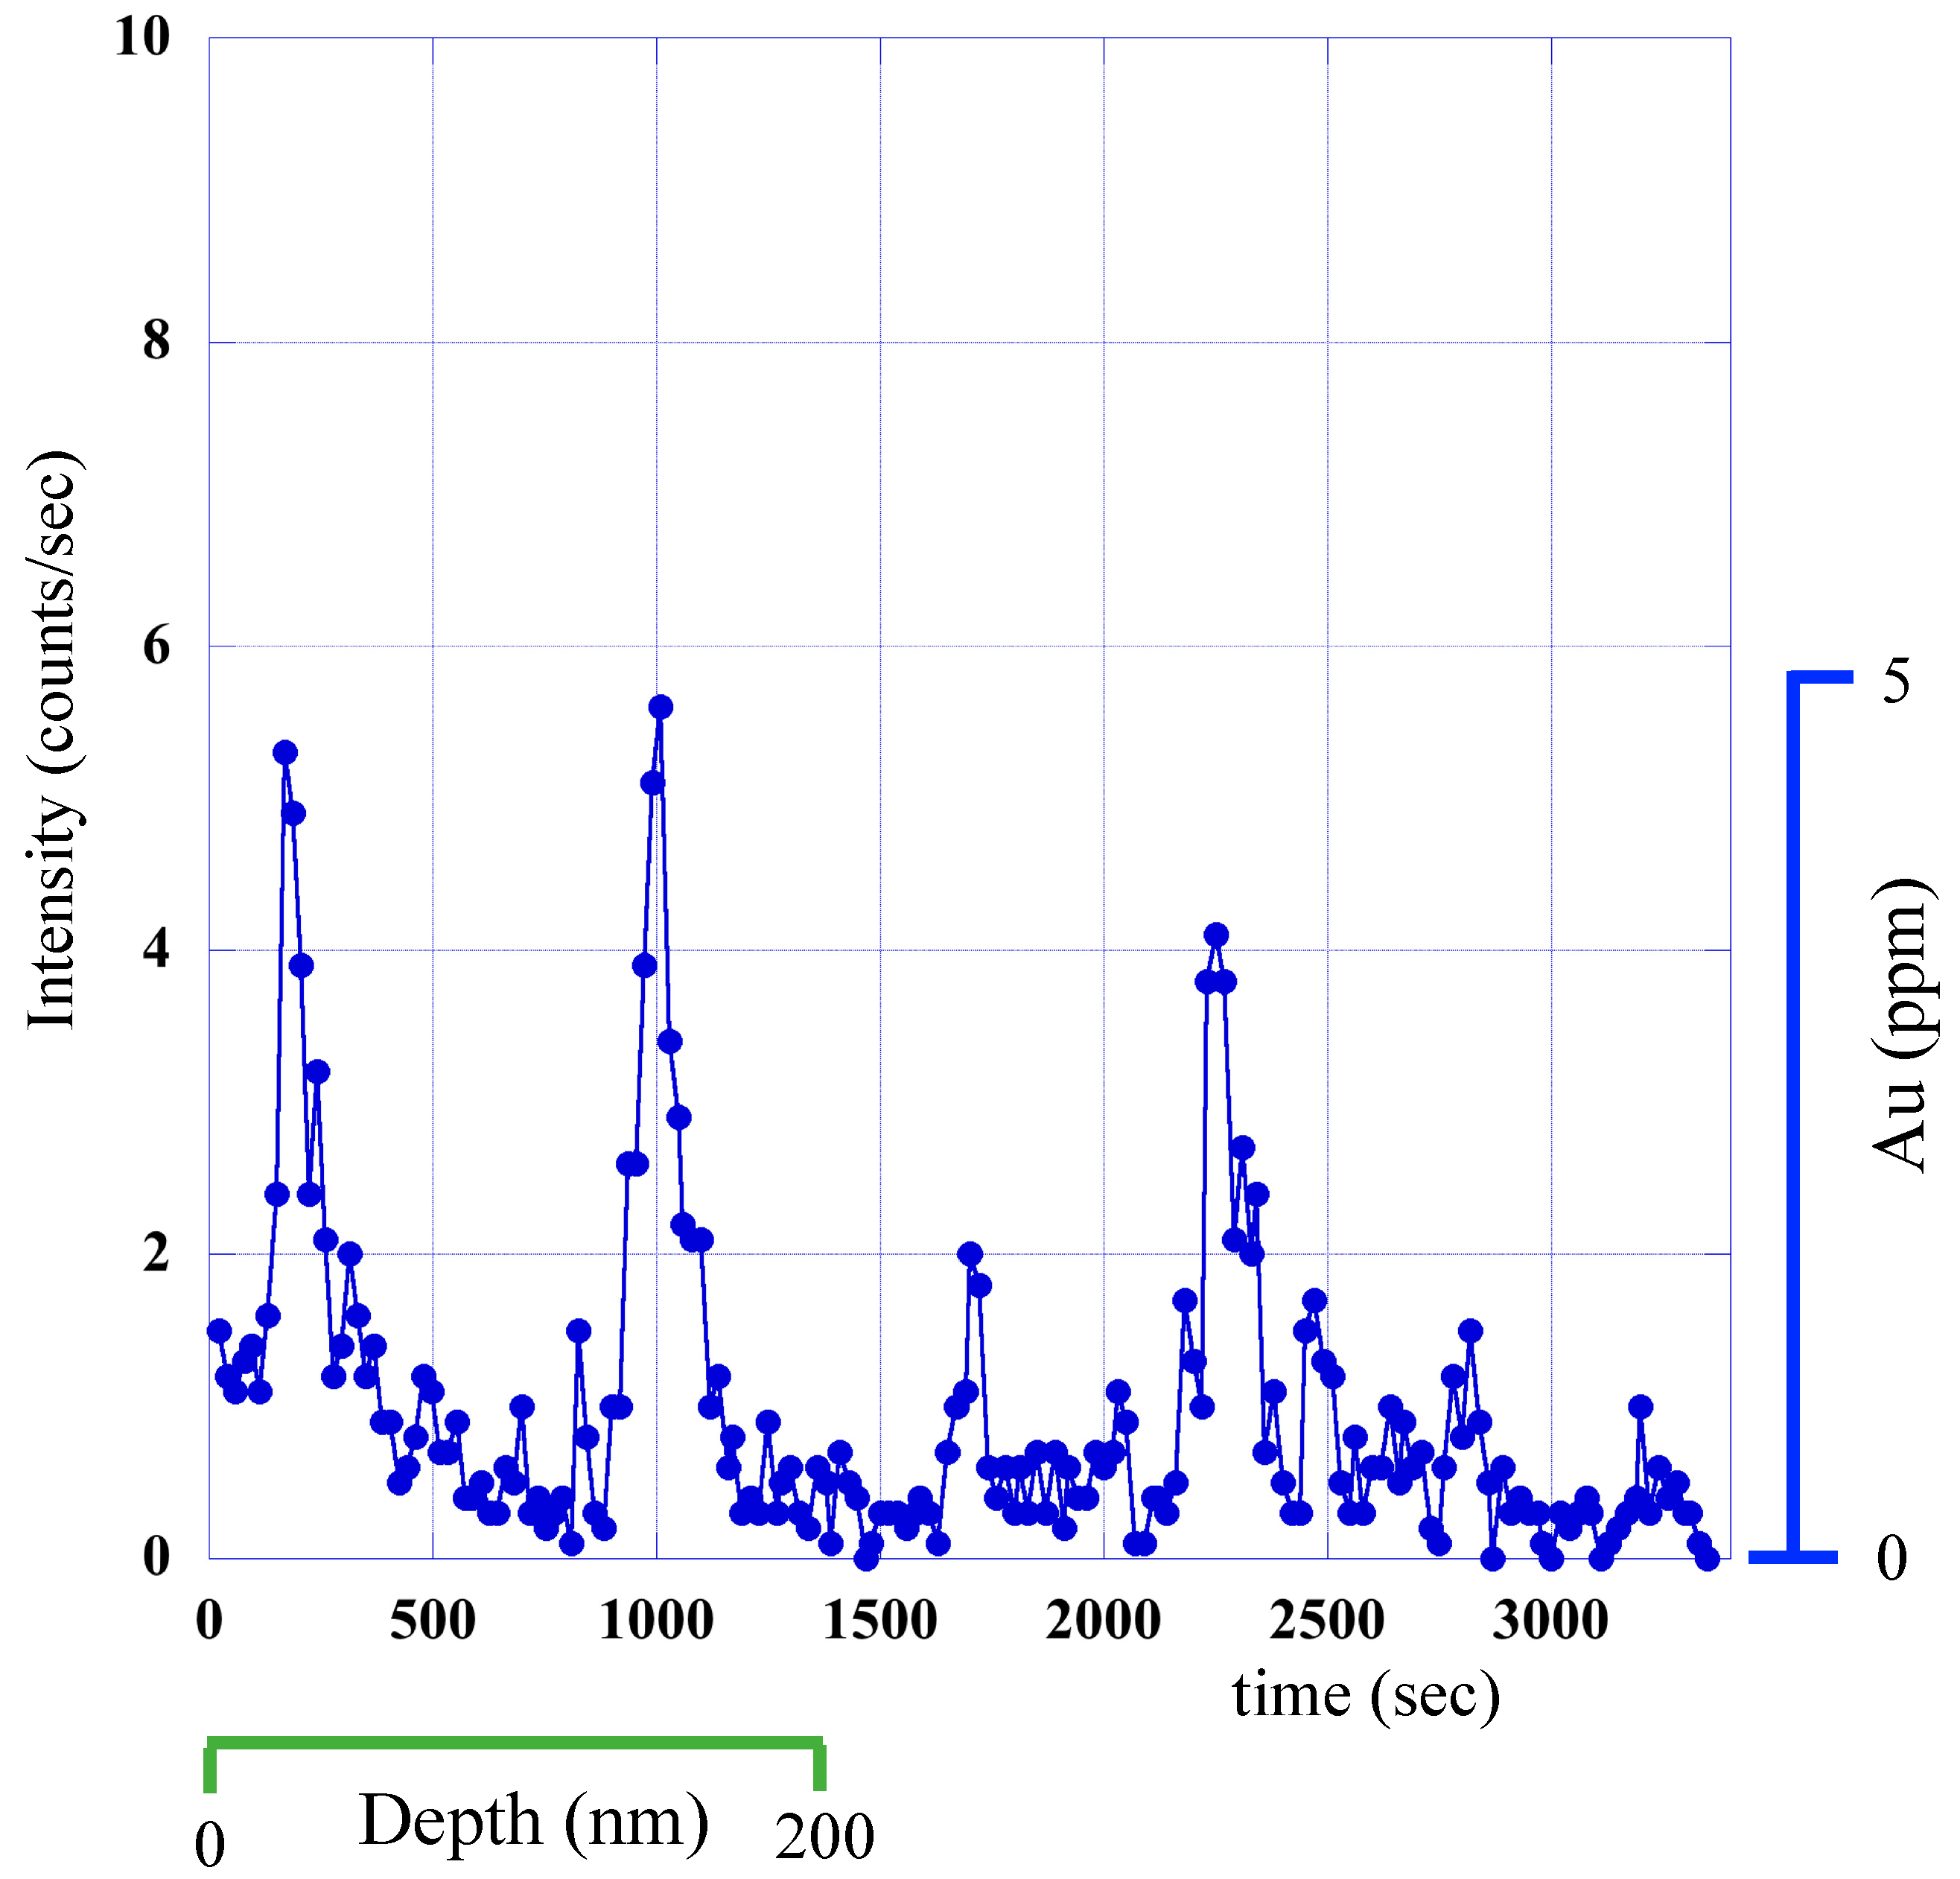
3.2. Analytical Methods

The pyrite and pyrrhotite were quantitatively analyzed (3 μm × 3 μm field) using a Cameca IMS 1270 spectrometer at the Geological Survey of Japan (GSJ), National Institute of Advanced Industrial Science and Technology (AIST). A defocused Cs+ primary ion beam was restricted to 20 μm in diameter by a circular aperture to obtain a homogeneous primary beam of approximately 100 pA. Sputtered negative secondary ions with an accelerating voltage of −10 kV were extracted from the carbon-coated polished sample surface and were detected using a total impact energy of 20 kV (primary accelerating voltage of +10 kV and secondary extraction voltage of −10 kV). The secondary 197Au and 75As ions (both are monoisotopic), as well as the matrix 34S used as an internal reference, were detected using an electron multiplier (EM). A rectangular field aperture of 300 μm × 300 μm was introduced into the secondary ion optics, limiting the analyzed area on the sample surface to a central square measuring 3 μm × 3 μm to avoid the crater edge effect. The centering of the primary beam was ascertained each time by looking at the beam position in the field aperture of 2 mm × 2 mm (primary beam of 20 μm in diameter). An electron flood gun was used on the sample surface for the purpose of charge compensation to achieve better stability of the secondary ions. The isobaric interference of 133Cs32S2 is clearly separated from 197Au (MM = 1728) by a mass-resolving power of 3300 without energy filtering [20]. Measurements at 3, 5, and 10 s for 34S, 75As, and 197Au ions, respectively, were allocated for each measurement cycle. It takes 24 s for a one-cycle measurement, which includes the waiting time for the magnetic hysteresis stabilization. The detection limits, which were computed as three times the standard deviation of the background noise, for the Au and As measurements were 15 ppb and 0.6 ppm, respectively, for an 34S count of 3 × 10⁵ cps if the background noise is assumed to have a Poisson distribution. The analysis size using the IMS 1270 was 3 μm.
The sulfur isotope ratios of pyrite grains from the KDC West deposit were measured using the multi-collection system of the SIMS spectrometer with Faraday cups. The analyzed area on the sample surface is a circle with a diameter of 20 μm, the same area as the primary beam bombardment; therefore, depth profiling is not available. The primary beam intensity was increased to 1 nA to obtain a high intensity of 32S secondary ions (2 × 10⁸ cps) for high-precision sulfur isotope measurements. The measured data were normalized using a standard pyrite sample (δ34S = +5.1‰) and are reported relative to Canyon Diablo Troilite (CDT). The accuracy is less than ±0.2‰ (2σ). The analysis size using the IMS 1270 for sulfur isotope ratios was 20 μm.
A NanoSIMS 50 at the Atmosphere and Ocean Research Institute (AORI) of the University of Tokyo was used for the analysis of several samples, as indicated in Table 2. After pre-sputtering with a 500 pA Cs+ rastered beam over a 30 μm × 30 μm area to remove the carbon coat from the sample surface and stabilize the secondary ion intensity by Cs+ implantation, a focused 30 to 50 pA Cs+ primary ion beam was scanned over the inner 20 μm × 20 μm area for analysis. An electron flood gun was used for the purpose of charge compensation. Negative secondary ions were extracted by an accelerating voltage of 8 kV and introduced into the mass spectrometer. The matrix 34S and the secondary 75As and 197Au ions were measured simultaneously using multi-collectors with EMs. The beam intensity of 34S was approximately 3.3 × 10⁵ to 3.8 × 10⁵ cps. The dead time (~44 ns) of the counting system was corrected. The entrance slit was set to a width of approximately 40 μm, and the exit slits for each EM were set to a width of 75 μm. A mass-resolving power of 8000 was attained with adequate flat-topped peaks. To reduce background noise and contamination from the area surrounding the analyzed part, beam blanking was adopted. Only the inner approximately 10 μm × 10 μm area of the scanned area was measured (32 × 32 pixels out of 64 × 64 pixels), meaning that only 25% of the total secondary ions produced were counted. It took about 1000 s to carry out one analysis run of 50 cycles. The detection limits, computed as three times the standard deviation of the background noise, for the Au and As measurements were 7 ppb and 0.3 ppm, respectively, for a 34S count of 3.3 × 10⁵ cps if the background noise is assumed to have a Poisson distribution. The analysis size using the NanoSIMS 50 was 10 μm.
The pyrite grains in ore samples from the Witwatersrand Au fields were analyzed by electron probe microanalysis (EPMA) for Fe, Cu, Co, Ni, As, and S using a JEOL JXA-8900 probe at Shizuoka University operated at 20 kV and 12 nA, with natural pyrite (FeS2) and Arsenopyrite (FeAsS) and pure metal samples (Co, Cu, Ni) as standards. The detection limit was 0.01 wt% for all the measured elements. The analysis size was 10 μm.

3.3. Standardization

Quantitative SIMS analysis requires the use of reference standards for each element and the analyzed host mineral because of matrix effects on secondary ion intensities. Standard samples for Au measurements in pyrite and pyrrhotite and for As measurements in pyrite were prepared. Calibration of the Au concentration in a mineral was conducted using external standard samples of pyrite and pyrrhotite that were implanted with 197Au ions at a dosage of 1 × 10¹⁵ atoms/cm2 with an implantation energy of 1.6 MeV using the 1.7 MV Tandetron accelerator located at the University of Western Ontario, Canada [20]. Calibration of the As concentration in pyrite was also performed using external standard samples that were implanted with As ions at a dosage of 3 × 10¹⁵ atoms/cm2, with an implantation energy of 0.4 MeV. After analyzing a standard for depth profiling, the depth of the sputtered borehole was measured using a surface profiler to determine the relative sensitivity factor (RSF), which was used to calculate the concentration in the unknown sample [20]. The calibration of the As concentration in pyrrhotite was conducted using EPMA-determined pyrrhotite samples.

4. Results

The results of the Au and As measurements are given in Table 2. Because the detection limits for Au and As measurements were 15 ppb and 0.6 ppm, respectively, at the GSJ SIMS, the last figures of the Au and As concentrations have some errors at low-level intensities. The detection limits of 8 ppb and 0.3 ppm for Au and As measurements, respectively, at the AORI SIMS might be low enough to guarantee the whole figures in Table 2.
The Au and As concentrations in the pyrite from the Kasuga deposit vary from 0.04 to 24 ppm and from 1 to 400 ppm, respectively (Table 2). The Au and As concentrations in the pyrite from the Iwato deposit vary from 0.16 to 2.8 ppm and from 14 to 43 ppm, respectively (Table 2). The Au and As concentrations in pyrite from the Akeshi deposit vary from 0.04 to 34 ppm and from 56 to 1100 ppm, respectively (Table 2). The Iwato pyrite grains contain less As than those from the other deposits.
The Au and As concentrations in the pyrite and pyrrhotite from the Kalahari Goldridge deposit are given in Table 2. In addition to the above results, substantial Au analytical data without As content was obtained at the beginning of this study (Table A1). The Au concentrations in pyrrhotite and pyrite vary from 0.01 to 5.62 ppm and from 0.01 to 0.32 ppm, respectively (Table 2, Table A1), whereas the As concentrations in pyrrhotite and pyrite are both low, with a narrow range from 6 to 22 ppm (Table 2). Although the Au–As relationship cannot be ascertained from the Au data alone (Table A1), Au depth profiles were acquired during every Au measurement. The Au concentration of pyrite is very low (less than 0.3 ppm).
The analytical results of the pyrite from the South Deep and KDC West deposits in the Witwatersrand Basin are given in Table 2. The Au and As concentrations in the pyrite from the South Deep deposit vary from 0.02 to 1.1 ppm and from 8 to 4000 ppm, respectively (Table 2). The Au and As concentrations in the pyrite from the KDC West deposit vary from 0.04 to 0.6 ppm and from 22 to 1500 ppm, respectively (Table 2).
The EPMA analysis results for Fe, Cu, Co, Ni, As, and S in pyrite from the South Deep and KDC West deposits are given in Table A2 and Table A3, respectively. The analysis positions were allocated near the SIMS analysis points. Most pyrites contain Co and Ni in addition to As, but the Cu concentration is generally negligible (Table A2 and Table A3).
Two sulfur isotope ratios of the pyrite from the KDC West deposit were obtained. The analysis positions were near D3 (core 250 μm × 350 μm subangular) and near D2 (rim 300 μm × 300 μm rounded). The δ34S values in these positions are +3.0‰ and +5.8‰, respectively.

5. Discussion

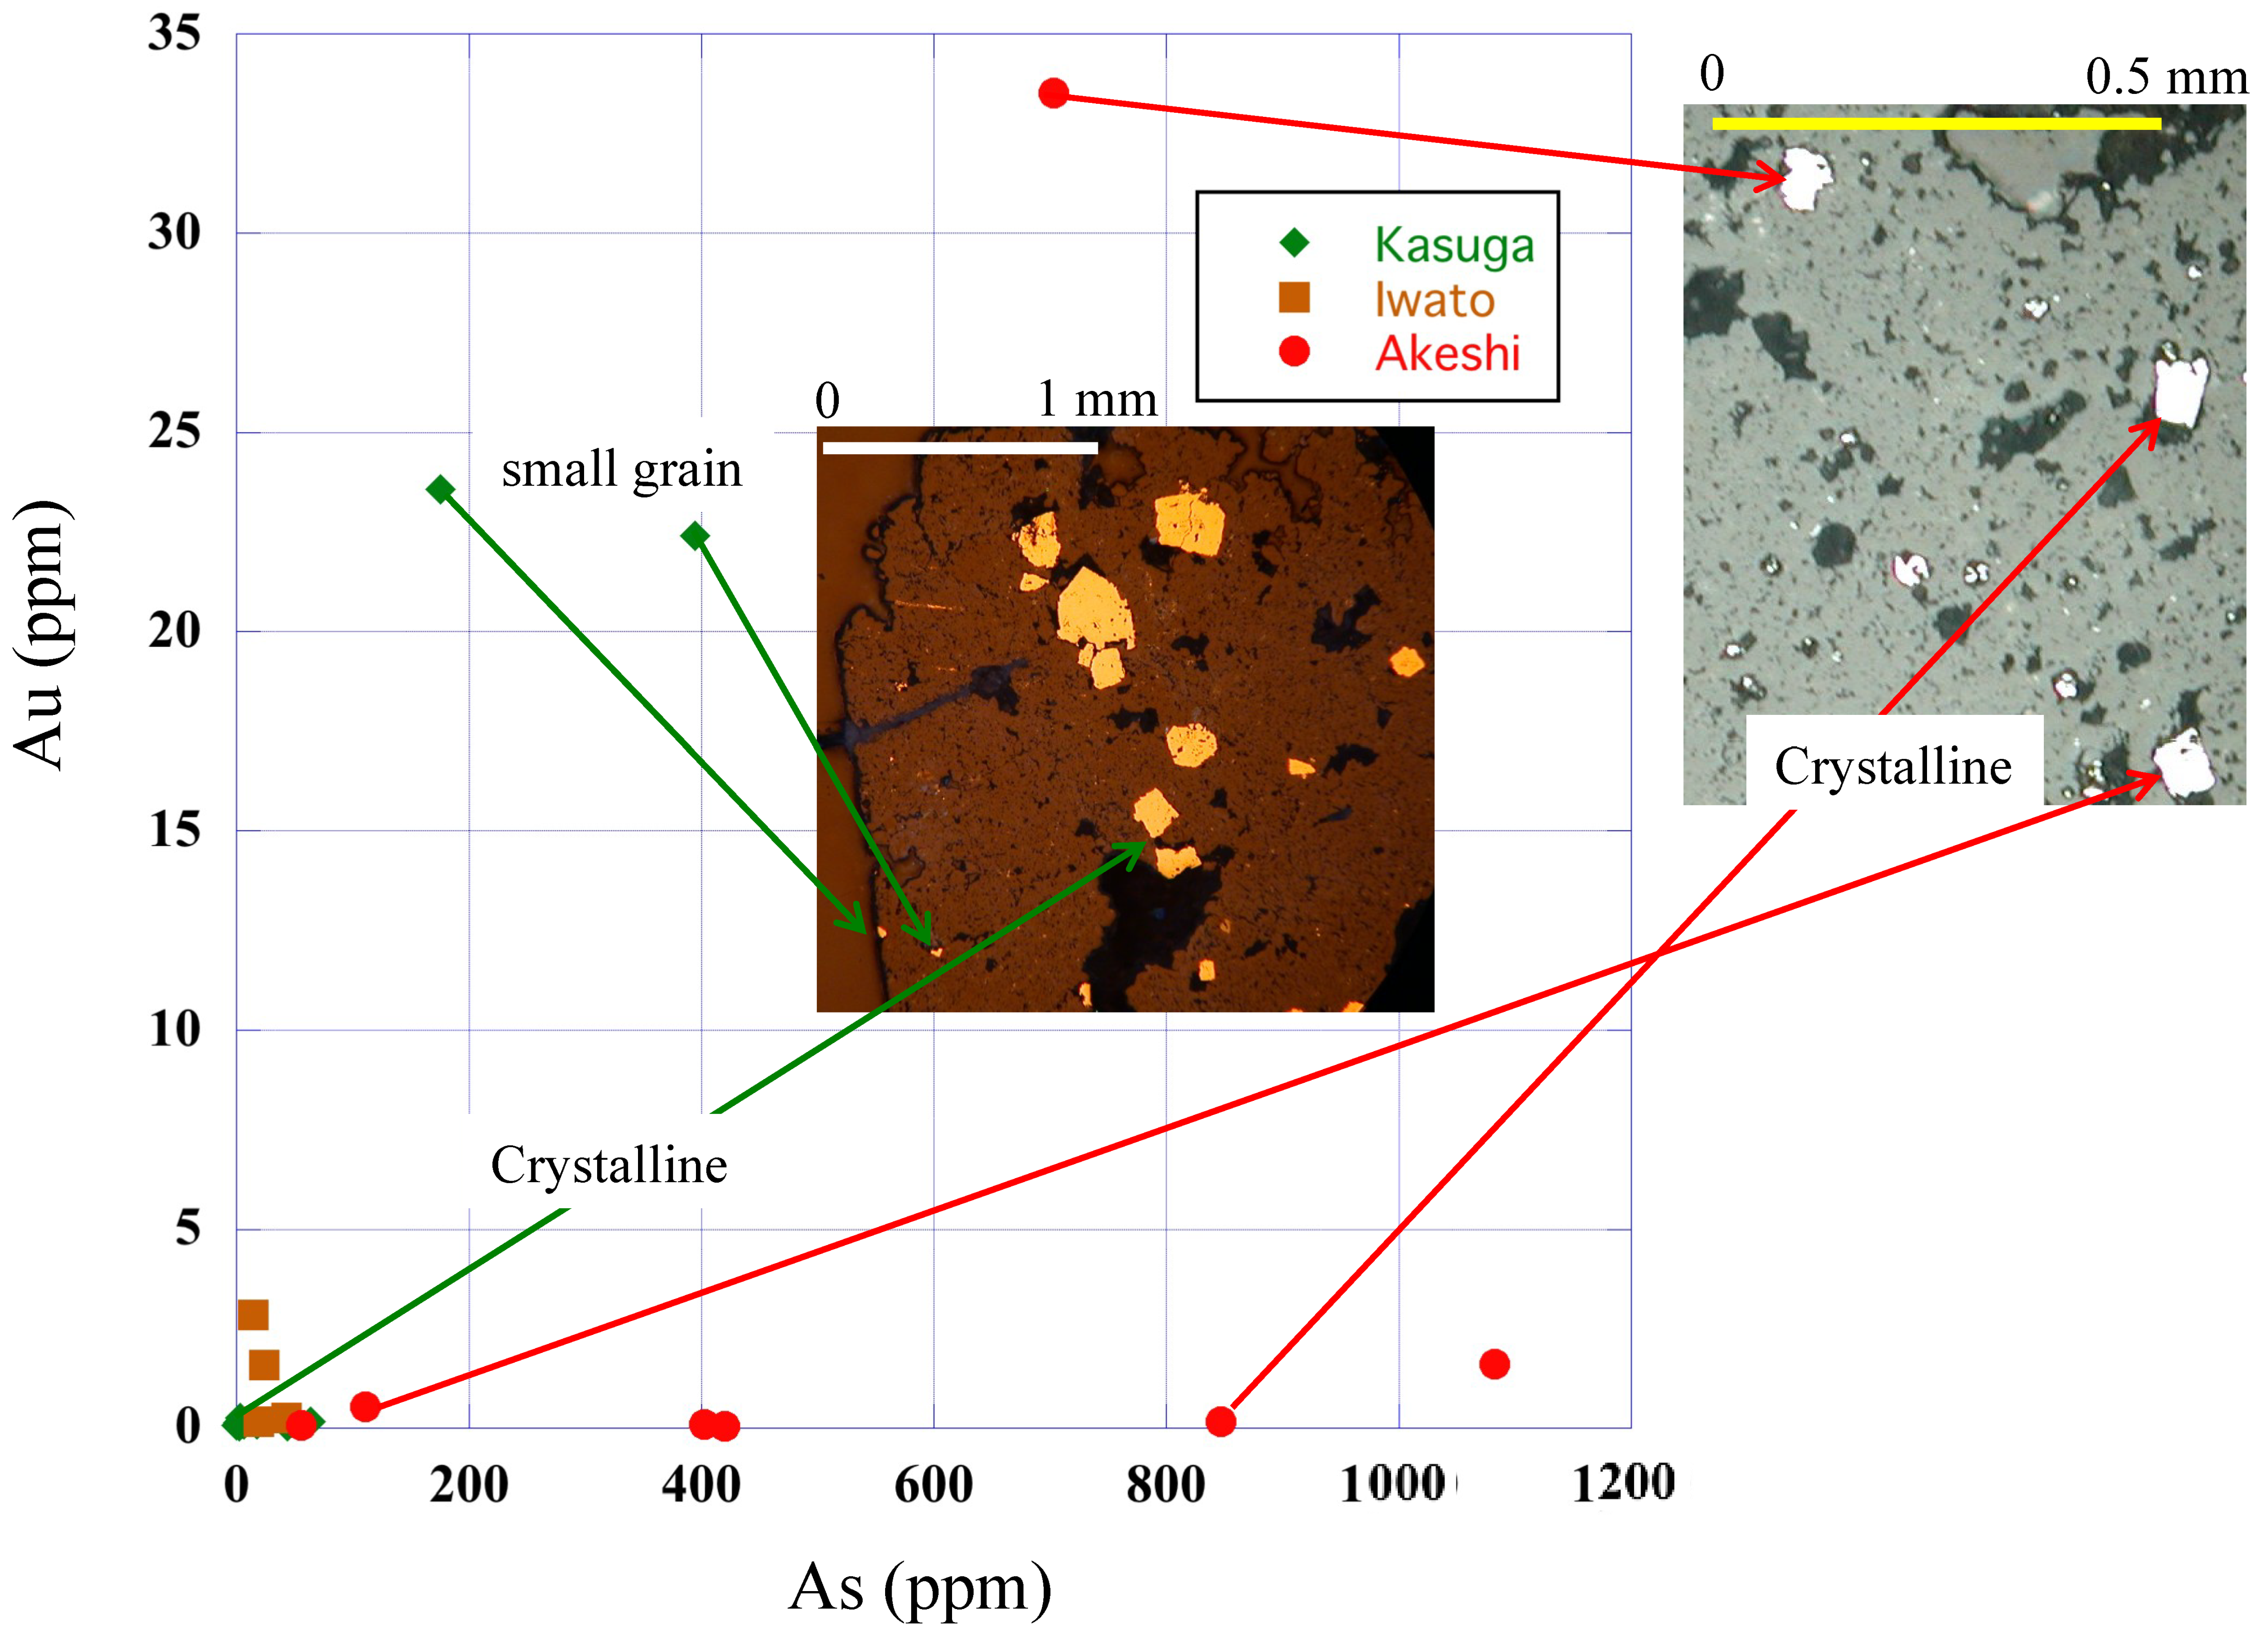
5.1. Epithermal Au Deposits

Figure 4 shows the Au and As concentrations in pyrite from the high-sulfidation Nansatsu-type Au deposits. Three samples from the Nansatsu-type Au deposits have relatively high Au concentrations of around 30 ppm (Figure 4, Table 2), which are more than the solubility of Au in synthesized pure pyrite (up to 3 ppm; [47]). Concerning natural arsenic pyrite, relatively large Au+ ions are able to enter the crystal structure when the structure is distorted by As incorporation into the structure [3,48]. Among the three high Au samples, two small grains of less than 20 μm from the Kasuga deposit have high Au concentrations, and the appearance of the pyrite from the Akeshi deposit is irregular. On the other hand, the low-Au pyrite grains, which contain less Au than the solubility of Au in synthesized pure pyrite [47] regardless of the As content, are all bigger than 50 μm, with a crystalline appearance. The fluid in the stage (probably late stage) might contain little Au but a moderate amount of As, and the fluid might be slightly saturated with pyrite.
Regarding the As content, the pyrite grains from the Iwato deposit contain very little As. The other two deposits, the Kasuga and Akeshi deposits, contain relatively high concentrations of As in their pyrite grains. In accordance with the As content in pyrite, the As-containing minerals enargite and luzonite (both of the chemical compositions are Cu3AsS4) occur in the Kasuga and Akeshi deposits, respectively; however, no such minerals were found in the Iwato deposit (Table 1).
At the Hishikari deposit (a typical low-sulfidation Au deposit), the specific value of the Au–As ratio in pyrite proves to be characteristic of the specific Au-bearing vein and its specific depth [20]. The Au–As ratio (3.4 × 10⁻²) is high in the Sanjin ore zone, which consists of high-grade veins in or above the Cretaceous accretionary sedimentary rocks. The Au–As ratio (1 × 10⁻²) is moderate in the Honko ore zone, which consists of several high-grade veins, and also occurs in or above the basement sedimentary rocks [20]. In contrast, the Au–As ratio (0.4 × 10⁻²) is gentle in the Yamada ore zone, which consists of relatively low-grade veins, and occurs in Pleistocene andesitic pyroclastic rocks that unconformably overlie the basement sedimentary rocks [20]. According to [20], it may be possible to infer the nature of unknown veins by determining their Au–As ratios.

5.2. Kalahari Goldridge Deposit

The Au and As concentrations in the pyrite and pyrrhotite from the Kalahari Goldridge deposit are both low (Table 2), and no relationship was found between the two elements. However, the Au concentration in the pyrrhotite varies in a wide range from 0.01 to 5.6 ppm (Table A1). Therefore, the occurrence of Au in pyrrhotite was examined by SIMS depth analysis.
Figure 5 shows the SIMS depth profile of Au in a Kalahari pyrrhotite sample (Au1*14.adp in Table A1). The sample surface was bombarded by a Cs+ beam, which formed a crater on the sample surface, and the Au ion count was measured along with the matrix 34S ion count as a reference. The measurement of the depth of the resulting crater allows the conversion of the time scale to a depth scale (horizontal axis in Figure 5) because the primary beam current stability was fairly good (fluctuation of 1%–2%) during the measurement. The left-hand vertical axis shows the Au intensity in counts per second, and the right-hand vertical axis shows the raw data converted into the Au concentration in parts per million based on the relative sensitivity factor (RSF). Because the Au intensity is normalized by the intensity of the reference 34S, the measured Au variation is not caused by instrumental instability or fluctuation but represents the actual variation in Au content with the depth. Figure 5 shows that the pyrrhotite contains Au in concentrations that vary with depth from 1 to 16 ppm, with an average concentration of 5.6 ppm (Table A1). The presence of several peaks in the Au concentration with widths of 50 nm, as shown in Figure 5, suggest that Au occurs as NPs rather than as a solid solution in the pyrrhotite lattice. The high spatial resolution of 3 nm along the depth direction in the SIMS analysis is characteristically useful in assessing the presence of Au NPs.
Au NPs in pyrrhotite are not uncommon in the Kalahari Goldridge deposit, so similar depth profiles in pyrrhotite are shown in Figure A1 (34S_Au4*111.adp in Table A1) and Figure A2 (34S_Au4*105.adp in Table A1). In contrast, pyrite has little Au, and no Au NPs were detected in the Kalahari Goldridge deposit samples. The depth profile in Figure A3 (Au1*47.adp in Table A1) shows only low signals. The existence of Au NPs is important when the preconcentration of Au by sulfide flotation is considered.

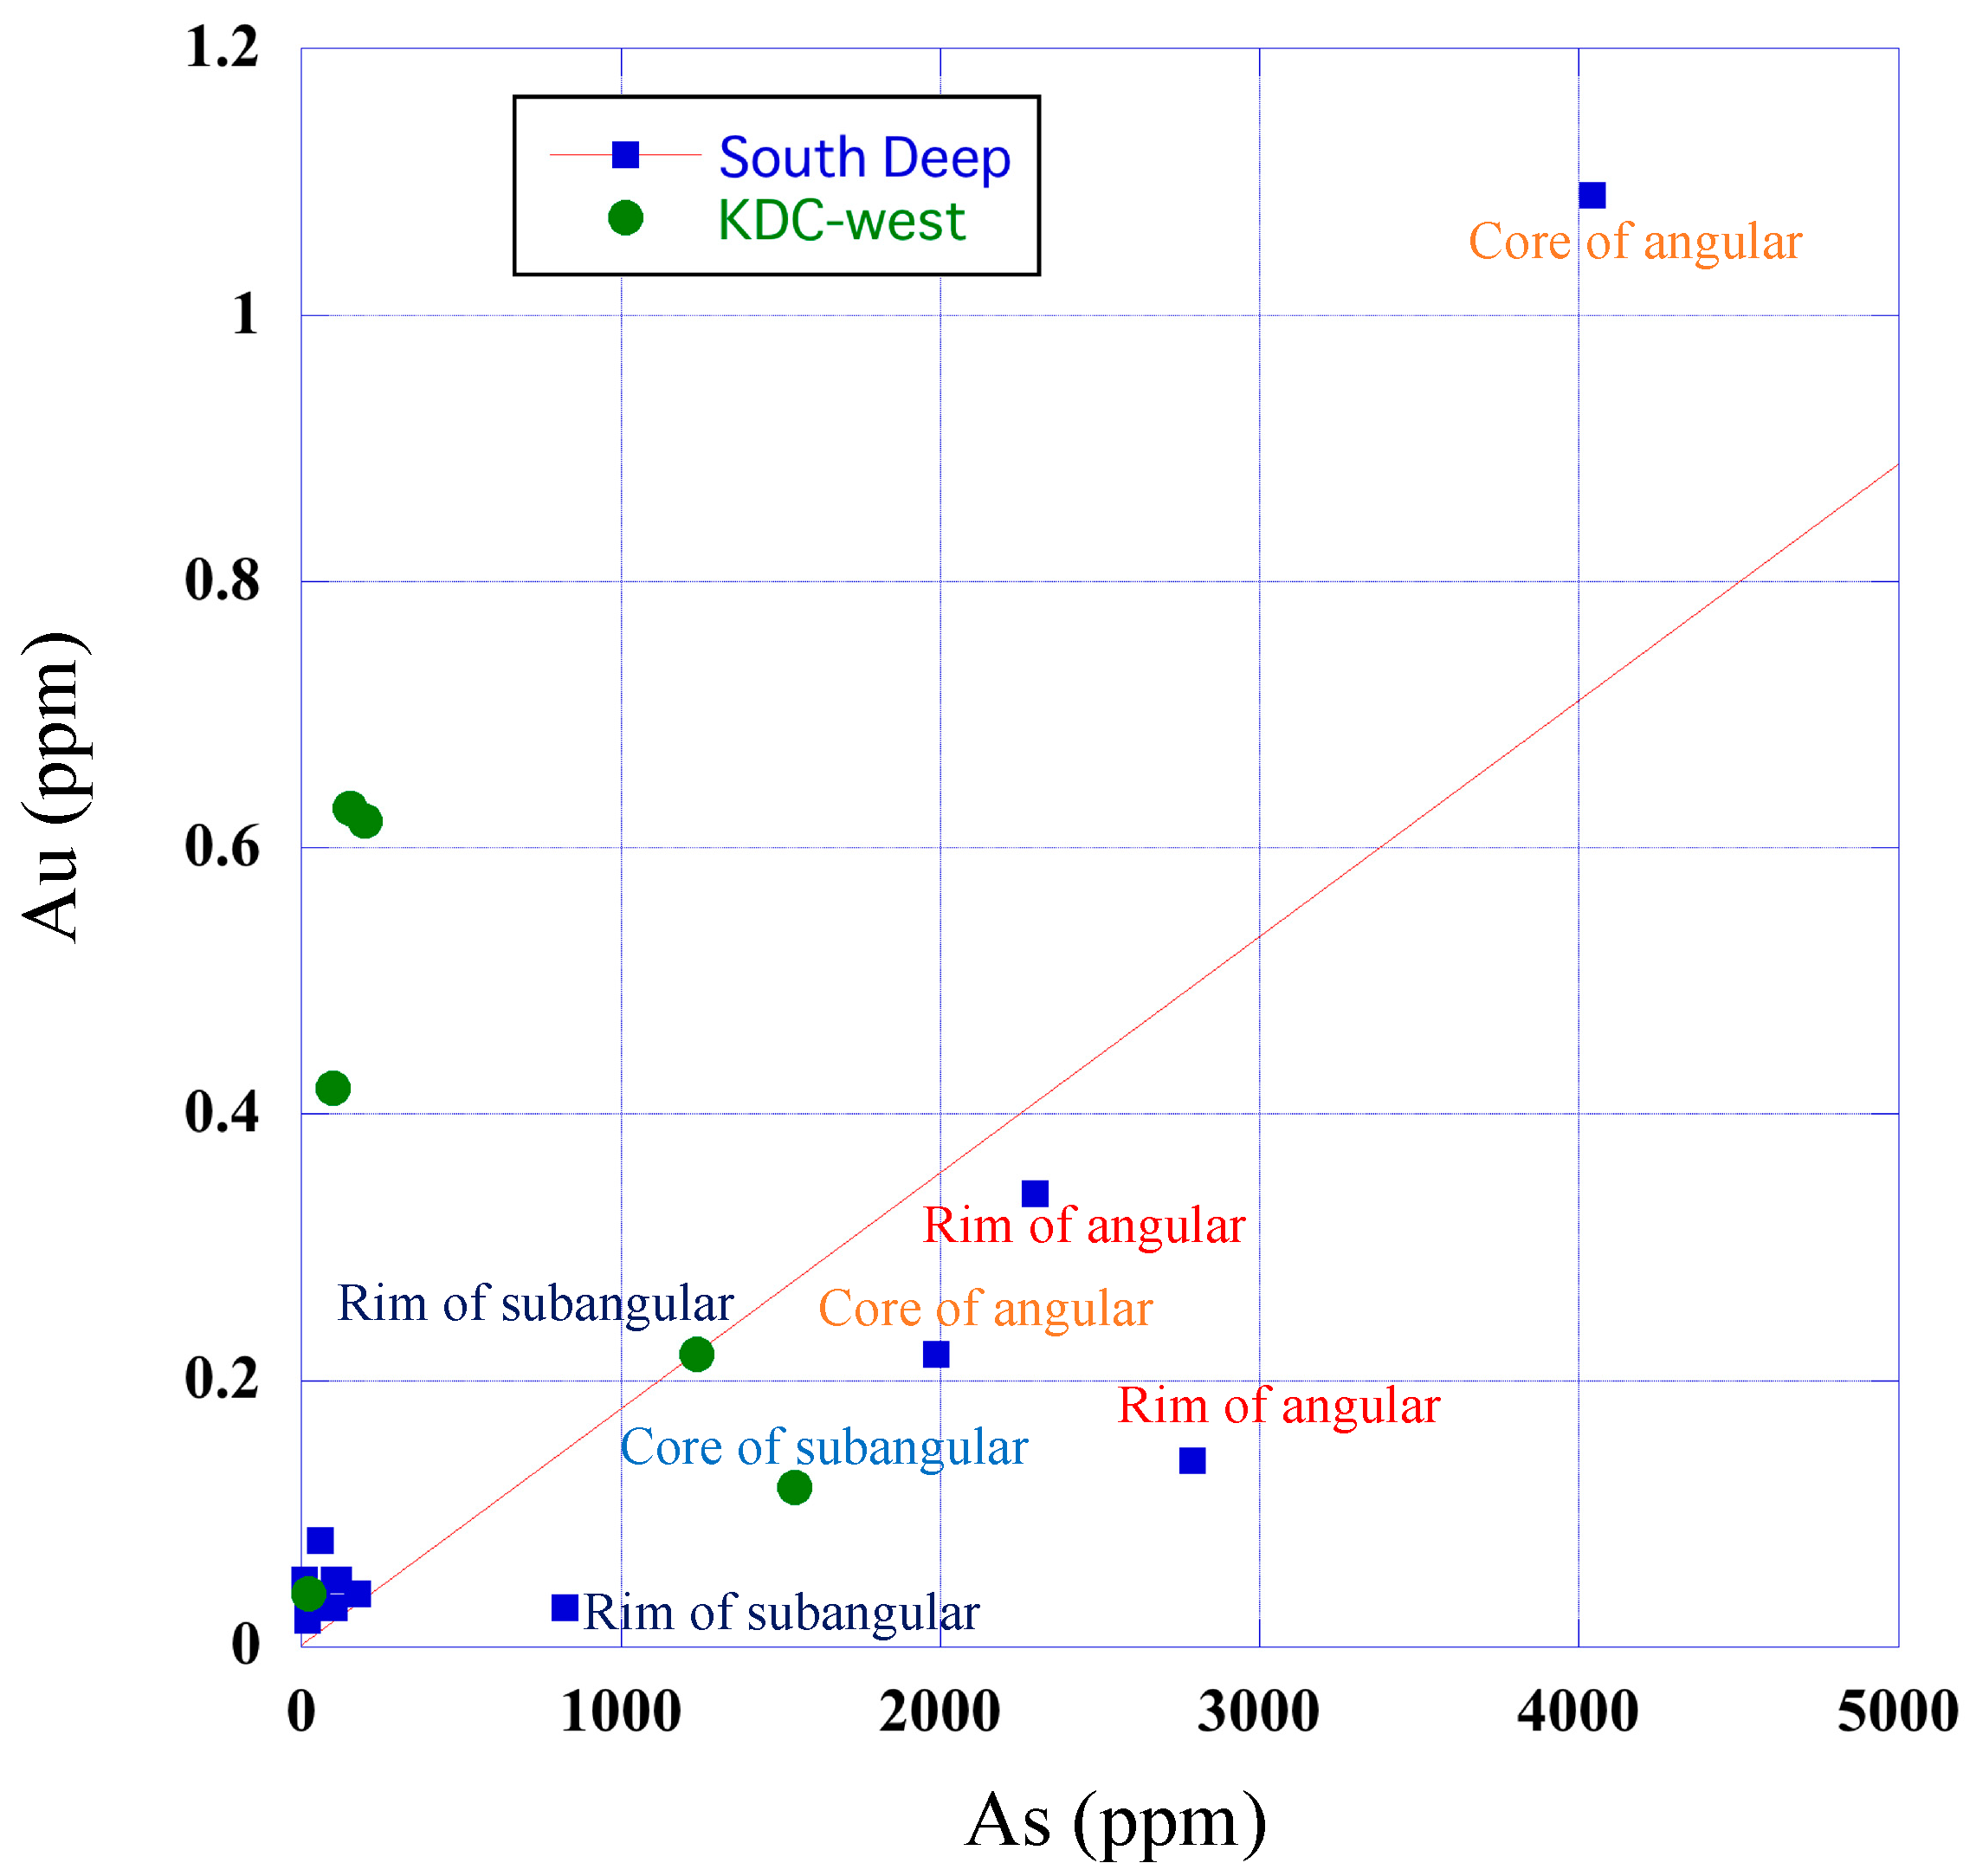
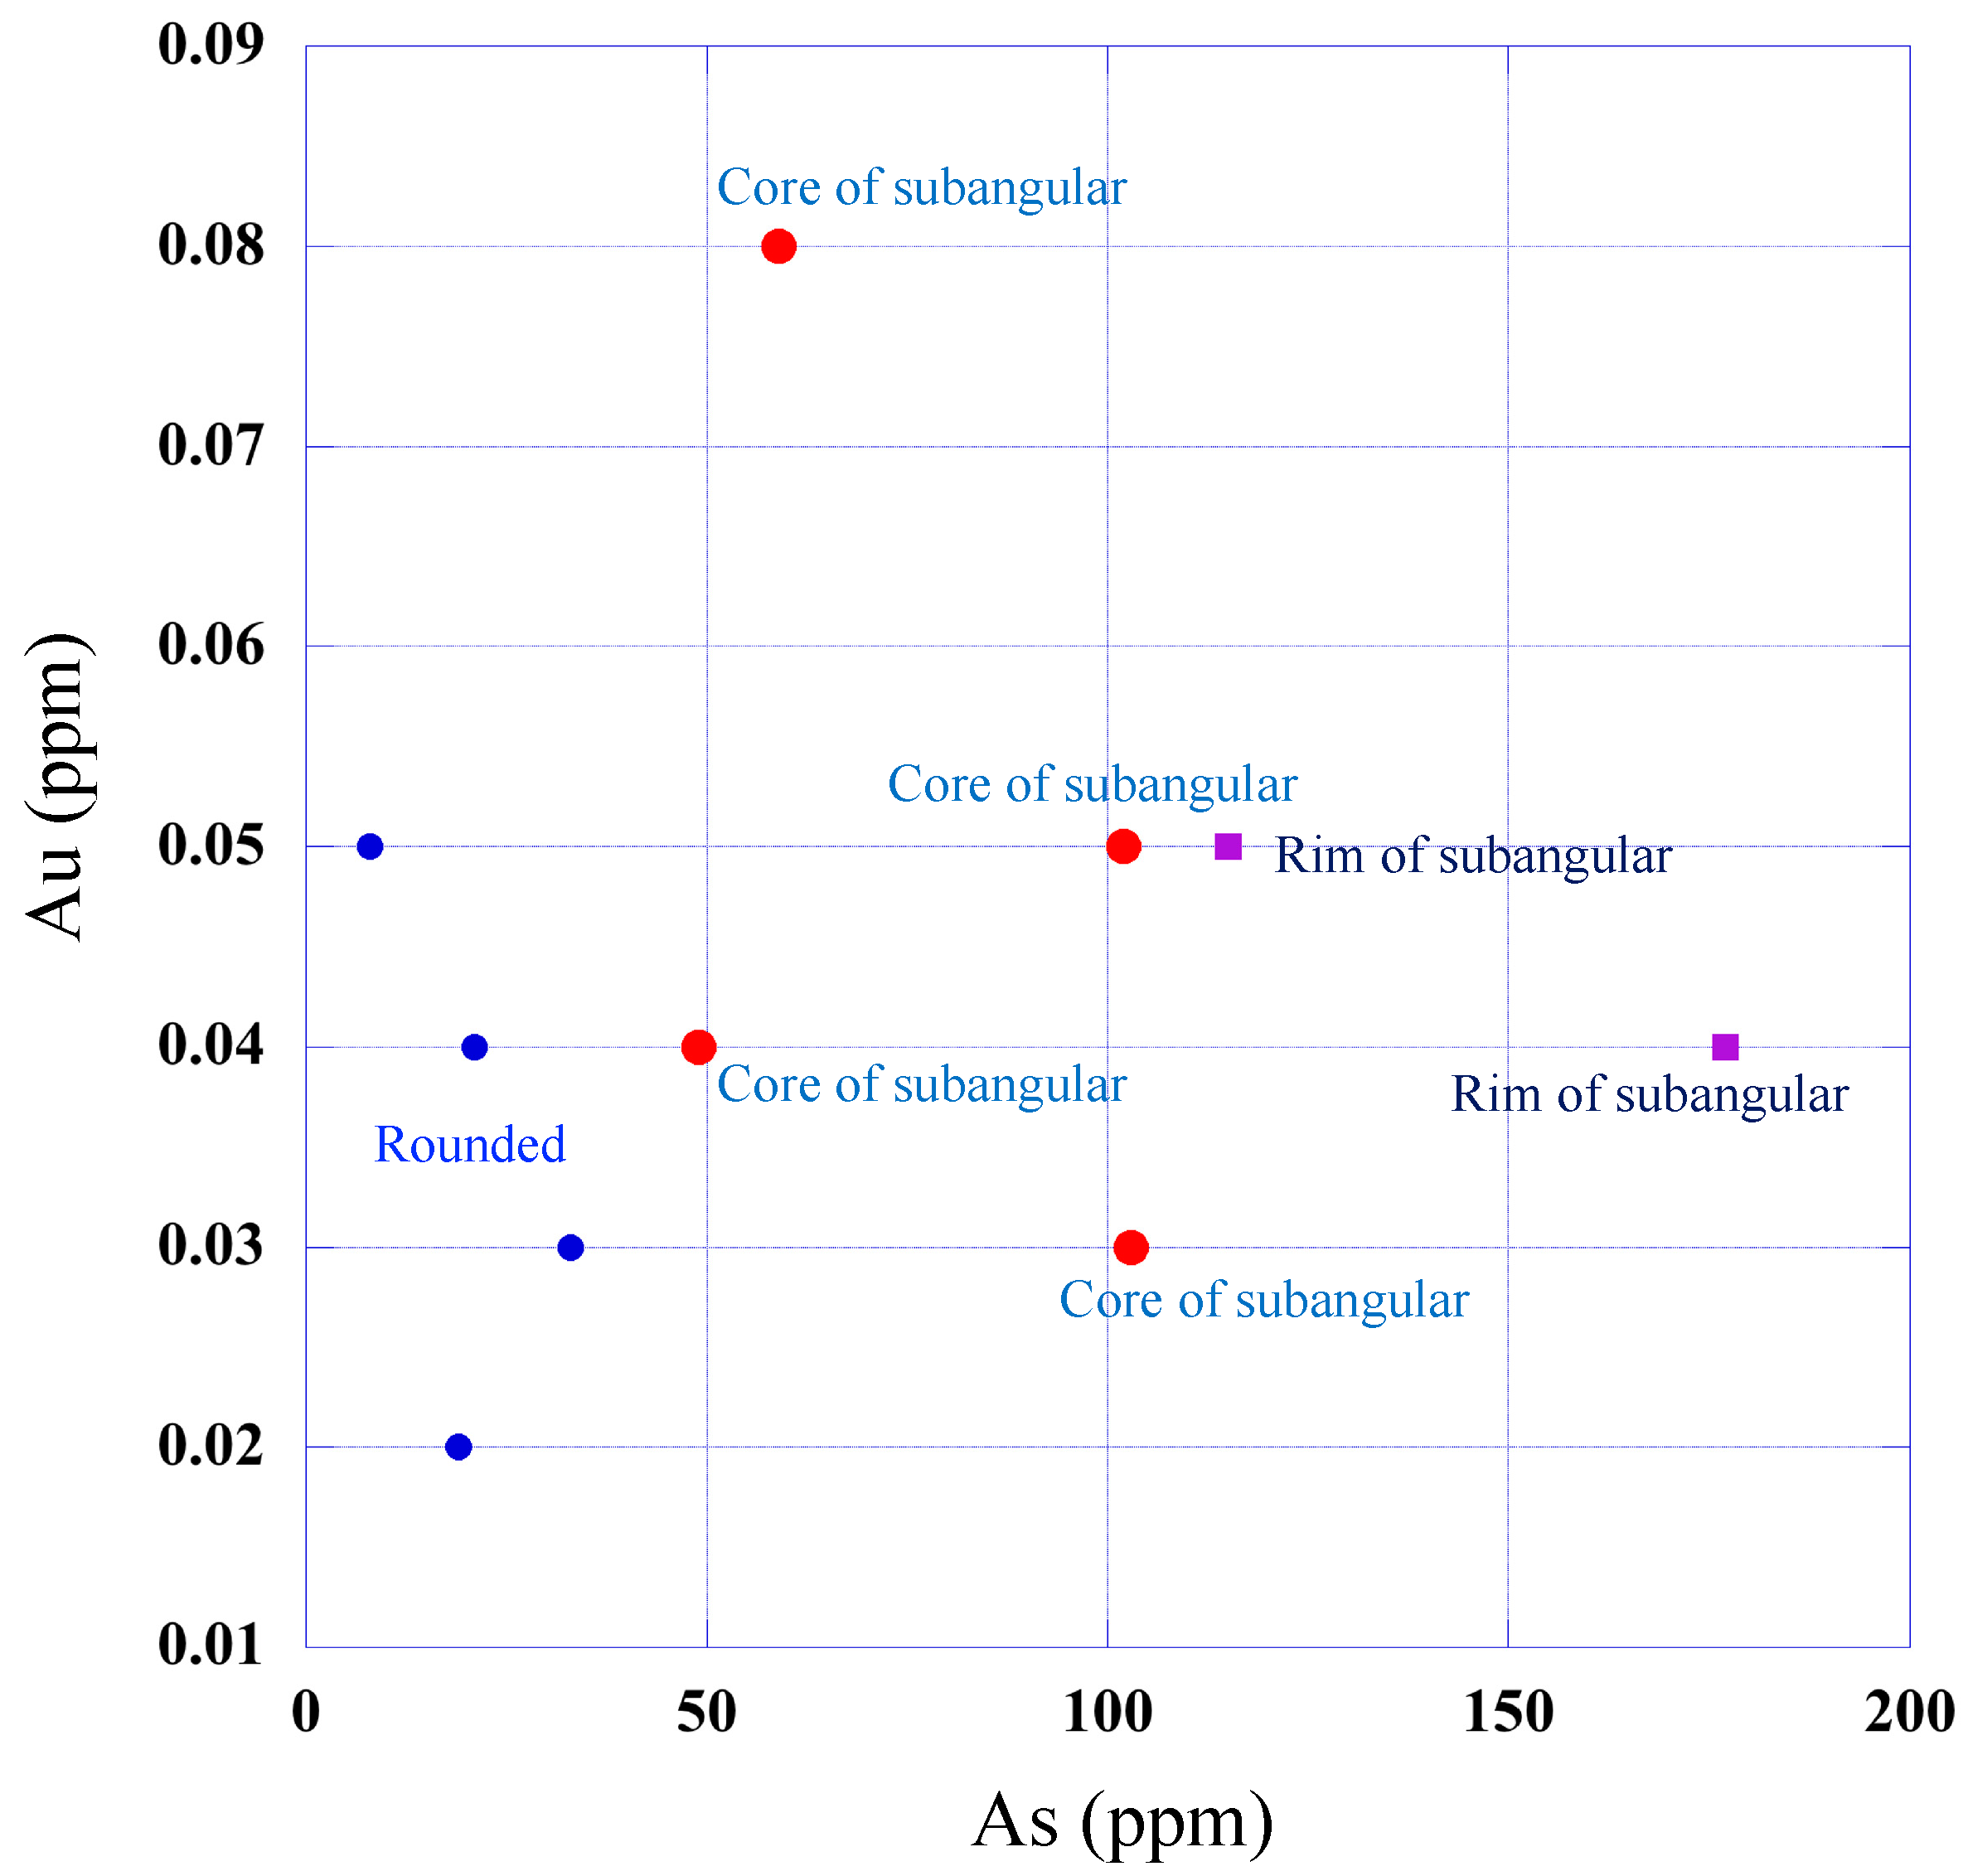
5.3. Witwatersrand Au Field

Pyrite grains from the South Deep deposit show a positive correlation between Au and As (Figure 6). The coefficient of determination R2 is 0.71. The angular grains have more As than the subangular or rounded grains (Figure 6, Table 2). Figure 7 shows an area of lower concentrations of the Au–As relationship in the subangular and rounded pyrite grains from the South Deep deposit. The rims of the pyrite grains contain more As than their cores do (Figure 7, Table 2). Both the rim and core of the rounded pyrite grains contain little Au or As.
The roundness of the grains is an indicator of the degree of abrasion during transportation in the sedimentary basin. Conversely, angularity may be caused by precipitation from various types of hydrothermal fluids. In the latter case, the rim of a grain may be composed of precipitation from a fluid while the core is of sedimentary origin. These suggest a hydrothermal influence on pyrite formation in the South Deep deposit. The rounded pyrite is sedimentary in origin, and the angular pyrite is thought to have precipitated from hydrothermal fluids. The subangular pyrite may be partly influenced by a late-stage hydrothermal fluid. The As concentration in rounded pyrite from the KDC West deposit is also low, which is similar to the case of the South Deep rounded pyrite; however, in contrast to the South Deep rounded pyrite, its Au content varies (Figure 6).
The δ34S values of the D3 sample (subangular pyrite) and the D2 sample (rounded pyrite) from the KDC West deposit are +3.0‰ and +5.8‰, respectively. In a previous paper, the broader range of the δ34S values for rounded pyrite (from −4.7‰ to +6.7‰) confirms its heterogeneous sulfur composition [49]. This heterogeneity supports the presumption that the rounded pyrite has a placer origin [40,49]. Additionally, the euhedral pyrite and pyrite overgrowths have a restricted δ34S range (from −0.5‰ to +2.5‰) [49]. The δ34S values of the rounded and subangular pyrite grains at the KDC West deposit are consistent with published data. The δ34S value of subangular pyrite is slightly higher than the upper limit of the range because the subangular grain might be a mixture of pyrites with placer and hydrothermal origins. Concerning the subangular pyrite from the KDC West deposit, the Au–As relationship is similar to that of the angular pyrite from the South Deep deposit (Figure 6), which might also be influenced by hydrothermal fluids. The shape of the pyrite grains might prove to be an indicator of hydrothermal influence on sedimentary deposits.

5.4. Au–As Relationship

Figure 8 shows all the SIMS data of the Au and As concentrations in pyrite and pyrrhotite (Table 2) in a log–log plot of their molar content. The solid line represents the empirical solubility limit of Au as a function of the As concentration [18]. Almost all the data lie on or below the line. The blue symbols represent high-sulfidation epithermal pyrite from the three Nansatsu-type deposits. The data are scattered over wide ranges of both Au and As contents. The analysis of one sample from the Kasuga deposit (Au5*260.adp, Table 2) is above the Au solubility limit; however, there are no Au NPs in the pyrite, because the depth profile shows constant Au intensity. Green symbols represent pyrite grains from Au deposits in the Witwatersrand Au field. The Au and As concentrations are scattered over relatively wide ranges, but a high Au content is not found in any sample. Orange circles represent pyrite (solid) and pyrrhotite (open) from the BIF-hosted Kalahari deposit. They have a narrow range of As concentrations but are scattered over a wide range of Au concentrations. Other than the rough positive correlation between Au and As concentrations in the South Deep deposit (R2 = 0.71; Figure 6), clear Au–As correlations are not seen in Figure 8. The reason why there are few Au–As correlations might partly be because of later-stage hydrothermal Au and As precipitations onto the existing pyrite surfaces, and additionally, because the majority of Au concentrations in Figure 8 are below 3 ppm (experimental Au solubility limit for pure pyrite) [47].
Figure 5 shows that the Au in pyrrhotite grains exists as Au NPs. Although the As concentration of the grains was not analyzed, the narrow range of As concentrations for the Kalahari deposit would restrict the value. The Au content of 5.62 ppm (Table A1) corresponds to 1.23 × 10⁻⁴ mol%, which is above the solubility limit of Au for pyrite in Figure 8 when the As concentration is in the range for the Kalahari pyrrhotite. In contrast, the As concentrations of pyrrhotite for A1 (34S_Au4*111.adp in Table A1) and A2 (34S_Au4*105.adp in Table A1) correspond to 2.8 × 10⁻⁵ and 1.9 × 10⁻⁵ mol%, respectively, which are below the solubility limit of Au for pyrite in Figure 8 when the As concentration is in the range for the Kalahari pyrrhotite. This suggests either the Au solubility limit of pyrrhotite is lower than that for pyrite or Au could exist in the form of Au NPs despite the sulfide being below the Au solubility limit [20,50]. In any case, the information on the existence of Au NPs is of great significance in the processing of Au-bearing ore by sulfide flotation because sufficient extraction of Au depends on the mode of Au occurrence in the sulfides.
Figure 9 compares the Au–As relationship with that from the high-grade low-sulfidation epithermal Hishikari data [20]. The Au solubility limit is also shown. The Hishikari pyrite grains contain more Au and As than the pyrite and pyrrhotite grains analyzed in this study. The As range of the Hishikari host rocks is scattered similarly to that of the Hishikari ore, and the Au range of the Hishikari host rocks is similar to that of the Witwatersrand Basin.

6. Conclusions

Pyrite is the principal sulfide of most Au deposits and is ubiquitous in such deposits. The Au–As relationships in pyrite and pyrrhotite from epithermal, BIF-hosted, and sedimentary Au deposits were determined by SIMS. The Au and As concentrations in pyrite varied from 0.04 to 30 ppm and from 1 to 1000 ppm, respectively, in the high-sulfidation Nansatsu-type epithermal deposits. Both concentrations are lower than those of the low-sulfidation epithermal Hishikari deposit, where the Au and As concentrations in pyrite range from 0.1 to 2800 ppm and from 0 to 70,000 ppm (7 wt%), respectively [20]. The Au concentrations in pyrrhotite and pyrite reach 6 and 0.3 ppm, respectively, in the Kalahari Goldridge BIF-hosted Au deposit, and the Au contained in the pyrrhotite might sometimes exist in the form of NPs, whereas the As concentrations in pyrrhotite and pyrite are low and lie in a narrow range from 6 to 22 ppm. The existence of Au NPs is important when preconcentration of Au by sulfide flotation is considered, while the existence of lattice Au cannot be confirmed. The Au and As concentrations in pyrite from the Witwatersrand Au field range from 0.02 to 1.1 ppm and from 8 to 4000 ppm, respectively. The Au and As concentrations of almost all the pyrites lie on or below the Au solubility limit [18], indicating that Au+ is the dominant form of Au in the studied pyrites. The shape of the pyrite from a sedimentary deposit might prove to be an indicator of the hydrothermal influence on the deposit, which is supposed to relate with the genesis of the deposit. This study will further demonstrate that the analysis of Au and As concentrations in pyrite from other ore deposits could elucidate the genesis of the deposits.

Author Contributions

Conceptualization: Y.M., N.Q.H., and H.U. Methodology: Y.M. Formal analysis: Y.M. Investigation: Y.M., Y.S., and N.T. (SIMS); and K.M. and R.K. (EPMA). Resources: Y.M., N.Q.H., K.M., R.K., and H.U. Writing—original draft preparation: Y.M. Writing—review and editing: All authors. Project administration: Y.M., N.Q.H., and H.U. Funding acquisition: Y.M.

Funding

This research was funded by the Japan Society for the Promotion of Science (JSPS) Kakenhi grant numbers 15K05340 and 18K03758; the Japan Mining Promotive Foundation (Nihon Kogyo Shinkokai); the Geological Survey of Japan, AIST; and the Atmosphere and Ocean Research Institute, University of Tokyo.

Acknowledgments

The authors are grateful to geologists at the Kasuga, Iwato, Akeshi, Kalahari Goldridge, South Deep and KDC West mines for providing ore samples. The author (Y.M.) is indebted to Genji Saito and Isoji Miyagi of the Geological Survey of Japan for their help with SIMS analyses.

Conflicts of Interest

The authors declare no conflict of interest.

Appendix A

Figure A1. Depth profiles in pyrrhotite (34S_Au4*111.adp in Table A1) from the Kalahari Goldridge deposit. (a) Au and 34S intensities (cps) on a logarithmic scale plotted against time. The corresponding depth is shown along the time scale. (b) Au intensity on a linear scale. The corresponding Au concentration is shown along the intensity scale. Several peaks corresponding to Au NPs (nanoparticles) are present in the profile.
Minerals 09 00447 g0a1
Figure A2. Depth profile of Au concentration in pyrrhotite (34S_Au4*105.adp in Table A1) from the Kalahari Goldridge deposit. Several peaks corresponding to Au NPs are present in the profile.
Minerals 09 00447 g0a2
Figure A3. Depth profile of Au concentration vs. depth in pyrite (Au1*47.adp in Table A1) from the Kalahari Goldridge deposit. No peaks corresponding to Au NPs are present in the profile. The Au concentration is very low and includes EM (electron multiplier) background noise.
Minerals 09 00447 g0a3

Appendix B

Table A1. Results of the SIMS Au analysis of pyrite and pyrrhotite grains from the Kalahari deposit.
Sample NameDepositLocAnalysis SpotAnalysis No.MineralAu (ppm)
GDP636/72/BD zone #9Au1*13.adpPyrrhotite0.05
GDP636/72/BD zone #10Au1*14.adpPyrrhotite5.62
GDP636/72/BD zone #12Au1*16.adpPyrrhotite0.06
118/21/15AD zonenorth pit BIF#6 py-1Au1*23.adpPyrite-crystalline0.26
118/21/15AD zonenorth pit BIF#7 po-3Au1*24.adpPyrrhotite0.05
118/21/15AD zonenorth pit BIF#11 po-5Au1*28.adpPyrrhotite0.69
118/21/15AD zonenorth pit BIF#14 po-8Au1*31.adpPyrrhotite0.55
118/21/15AD zonenorth pit BIF#16 po-10Au1*34.adpPyrrhotite1.75
DD18/18/1BD zonesouth pit BIF#2 po-1Au1*45.adpPyrrhotite0.02
DD18/18/1BD zonesouth pit BIF#3 py-1Au1*47.adpPyrite0.03
DD18/18/1BD zonesouth pit BIF#5 po-2Au1*48.adpPyrrhotite0.04
DD18/18/1BD zonesouth pit BIF#6 po-3Au1*49.adpPyrrhotite0.04
DD18/18/1BD zonesouth pit BIF#8 po-4Au1*51.adpPyrrhotite0.09
118/21/11AD zonenorth pit BIF#3 Au1*52.adpPyrite0.04
118/21/11AD zonenorth pit BIF#8Au1*56.adpPyrrhotite0.14
118/21/11AD zonenorth pit BIF#9Au1*57.adpPyrrhotite0.28
GDP636/72/BD zone #3 py-1Au1*58.adpPyrite0.14
GDP636/72/BD zone #8 po-4Au1*64.adpPyrrhotite0.11
GDP636/72/BD zone #9 po-5Au1*65.adpPyrrhotite0.09
118/21/8BD zonenorth pit BIF#2 py-1Au1*68.adpPyrite0.03
118/21/8BD zonenorth pit BIF#5 po-2Au1*70.adpPyrrhotite0.07
118/21/8BD zonenorth pit BIF#7 py-2Au1*73.adpPyrite0.01
118/21/8BD zonenorth pit BIF#9 po-5Au1*75.adpPyrrhotite0.07
118/21/15AD zonenorth pit BIF#20 po-2034S_Au4*102.adpPyrrhotite0.08
118/21/15AD zonenorth pit BIF#21 po-2134S_Au4*103.adpPyrrhotite0.10
118/21/15AD zonenorth pit BIF#22 po-2234S_Au4*104.adpPyrrhotite1.29
118/21/15AD zonenorth pit BIF#22 po-2234S_Au4*111.adpPyrrhotite1.28
118/21/15AD zonenorth pit BIF#23 po-2334S_Au4*105.adpPyrrhotite0.89
118/21/15AD zonenorth pit BIF#23 po-2334S_Au4*112.adpPyrrhotite0.66
118/21/15AD zonenorth pit BIF#24 po-2434S_Au4*106.adpPyrrhotite0.06
118/21/15AD zonenorth pit BIF#25 po-2534S_Au4*107.adpPyrrhotite0.49
118/21/15AD zonenorth pit BIF#26 po-2634S_Au4*108.adpPyrrhotite0.58
118/21/15AD zonenorth pit BIF#27 po-2734S_Au4*109.adpPyrrhotite0.41
Table A2. Results of the EPMA analysis of pyrite from the South Deep deposit.
Analysis SpotAnalysis PositionFe (wt%)Cu (wt%)Co (wt%)Ni (wt%)As (wt%)S (wt%)Total (wt%)
11core S1145.85 -0.36 0.08 0.04 53.60 99.93
12rim S1246.41 -0.10 0.11 0.01 54.32 100.94
14core S1346.73 0.02 0.04 0.01 -53.77 100.57
15rim S1446.15 -0.09 0.08 0.05 54.01 100.37
5core S15, S2746.05 0.04 0.05 -0.18 53.85 100.17
6rim S16, S2646.67 -0.05 0.02 0.32 53.82 100.88
7rim S16, S2646.21 0.01 0.07 0.04 0.25 54.03 100.60
8rim S16, S2646.57 0.03 0.07 0.03 0.13 52.47 99.30
9core S2446.37 -0.05 0.01 0.02 53.75 100.19
10rim S2546.33 -0.10 0.03 -52.60 99.06
3Rim S2846.99 0.01 0.08 --51.87 98.95
4Rim S2846.32 -0.11 0.02 0.02 53.95 100.42
1core S2945.62 -0.05 --54.70 100.37
2core S2946.54 -0.07 0.02 0.00 52.72 99.35
13core S3045.99 -0.22 --53.74 99.95
Analysis SpotAnalysis PositionFe (mol%)Cu (mol%)Co (mol%)Ni (mol%)As (mol%)S (mol%)Total (mol%)
11core S1132.83 -0.25 0.06 0.02 66.85 100.00
12rim S1232.86 -0.07 0.07 0.01 67.00 100.00
14core S1333.27 0.01 0.03 0.01 -66.69 100.00
15rim S1432.86 -0.06 0.05 0.02 67.00 100.00
5core S15, S2732.87 0.03 0.04 -0.09 66.97 100.00
6rim S16, S2633.16 -0.04 0.01 0.17 66.62 100.00
7rim S16, S2632.86 0.01 0.05 0.03 0.13 66.93 100.00
8rim S16, S2633.70 0.02 0.05 0.02 0.07 66.14 100.00
9core S2433.11 -0.03 0.00 0.01 66.85 100.00
10rim S2533.56 -0.07 0.02 -66.36 100.00
3Rim S2834.18 0.00 0.05 --65.74 99.98
4Rim S2832.98 -0.07 0.01 0.01 66.92 99.99
1core S2932.36 -0.04 --67.60 100.00
2core S2933.61 -0.05 0.01 0.00 66.33 100.00
13core S3032.89 -0.15 --66.95 99.99
core S11: Core of the grain, where it is close to S11 in Table 2.
Table A3. Results of the EPMA analysis of pyrite from the KDC West deposit.
Analysis SpotAnalysis PositionFe (wt%)Cu (wt%)Co (wt%)Ni (wt%)As (wt%)S (wt%)Total (wt%)
1rim D146.03 -0.11 -0.06 52.32 98.51
9core SgD145.25 -0.06 0.03 0.11 54.17 99.62
5rim SgD345.62 -0.09 0.11 0.12 53.78 99.71
4rim D245.24 0.06 0.40 0.07 0.04 53.94 99.75
12rim D246.25 -0.29 0.13 0.02 53.17 99.86
13rim D245.84 0.01 0.55 0.09 0.04 52.06 98.58
14rim D246.23 -0.44 0.09 0.02 53.46 100.24
Analysis SpotAnalysis PositionFe (mol%)Cu (mol%)Co (mol%)Ni (mol%)As (mol%)S (mol%)Total (mol%)
1rim D133.52 -0.08 -0.03 66.37 100.00
9core SgD132.37 -0.04 0.02 0.06 67.51 99.99
5rim SgD332.68 -0.06 0.07 0.06 67.12 100.00
4rim D232.38 0.04 0.27 0.05 0.02 67.24 100.00
12rim D233.20 -0.20 0.09 0.01 66.50 100.00
13rim D233.42 0.01 0.38 0.06 0.02 66.11 100.00
14rim D233.05 -0.30 0.06 0.01 66.58 100.00
rim D1: rim of the grain, where it is close to D1 in Table 2. core SgD1: core of the same grain as D1 grain.

References

  1. Chryssoulis, S.L.; Cabri, L.J. Significance of gold mineralogical balances in mineral processing. Trans. Inst. Min. Metall. 1990, 99, C1–C10. [Google Scholar]
  2. Palenik, C.S.; Utsunomiya, S.; Reich, M.; Kesler, S.E.; Wang, L.; Ewing, R.C. “Invisible” gold revealed: Direct imaging of gold nanoparticles in a Carlin-type deposit. Am. Min. 2004, 89, 1359–1366. [Google Scholar] [CrossRef]
  3. Deditius, A.P.; Utsunomiya, S.; Renock, D.; Ewing, R.C.; Ramana, C.V.; Becker, U.; Kesler, S.E. A proposed new type of arsenian pyrite: Composition, nanostructure and geological significance. Geochim. Cosmochim. Acta 2008, 72, 2919–2933. [Google Scholar] [CrossRef]
  4. Deditius, A.P.; Utsunomiya, S.; Reich, M.; Kesler, S.E.; Ewing, R.C.; Hough, R.; Walshe, J. Trace metal nanoparticles in pyrite. Ore Geol. Rev. 2011, 42, 32–46. [Google Scholar] [CrossRef]
  5. Tauson, V.L.; Lipko, S.V.; Smagunov, N.V.; Kravtsova, R.G. Trace Element Partitioning Dualism under Mineral–Fluid Interaction: Origin and Geochemical Significance. Minerals 2018, 8, 282. [Google Scholar] [CrossRef]
  6. Pokrovski, G.S.; Kokh, M.A.; Proux, O.; Hazemann, J.L.; Bazarkina, E.F.; Testemale, D.; Escoda, C.; Boiron, M.C.; Blanchard, M.; Aigouy, T.; et al. The nature and partitioning of invisible gold in the pyrite-fluid system. Ore Geol. Rev. 2019, 109, 545–563. [Google Scholar] [CrossRef]
  7. Chryssoulis, S.L.; Cabri, L.J.; Lennard, W. Calibration of the ion microprobe for quantitative trace precious metal analyses of ore minerals. Econ. Geol. 1989, 84, 1684–1689. [Google Scholar] [CrossRef]
  8. Cabri, L.J.; Chryssoulis, S.L.; de Villiers, J.P.R.; Laflamme, J.H.G.; Buseck, P.R. The nature of “invisible” gold in arsenopyrite. Can. Miner. 1989, 27, 353–362. [Google Scholar]
  9. Chryssoulis, S.L.; Weisener, C.G. Secondary Ion Mass Spectrometry Relative Sensitivity Factors for Ru, Rb, Pb, Ag, Os, Ir, Pt and Au in Sulfide Minerals. In Secondary Ion Mass Spectrometry: SIMS X; Benninghoven, A., Hagenhoff, B., Werner, H.W., Eds.; John Wiley & Sons: New York, NY, USA, 1997; pp. 983–986. [Google Scholar]
  10. Cabri, L.J.; McMahon, G. SIMS analysis of sulfide minerals for Pt and Au: Methodology and relative sensitivity factors (RSF). Can. Miner. 1995, 33, 349–359. [Google Scholar]
  11. Larocque, A.C.L.; Cabri, L.J. Ion-microprobe quantification of precious metals in sulfide minerals. Rev. Econ. Geol. 1998, 7, 155–167. [Google Scholar]
  12. Chouinard, A.; Paquette, J.; Williams-Jones, A.E. Crystallographic Controls on Trace-Element Incorporation in Auriferous Pyrite from the Pascua Epithermal High-Sulfidation Deposit, Chile Argentina. Can. Miner. 2005, 43, 951–963. [Google Scholar] [CrossRef]
  13. Morishita, Y.; Hammond, N.Q. Sub-microscopic gold from the Kalahari Goldridge deposit, Kraaipan Greenstone belt, South Africa. In The Ninth Biennial SGA Meeting; Andrew, C.J., Ed.; Irish Association for Econmic Geology: Dublin, Ireland, 2007; Volume 2, pp. 1019–1022. [Google Scholar]
  14. Silberman, M.L.; Berger, B.R. Relationship of trace-element patterns to alteration and morphology in epithermal precious-metal deposits. SEG Rev. Econ. Geol. 1985, 2, 203–232. [Google Scholar]
  15. Cook, N.J.; Chryssoulis, S.L. Concentrations of "invisible gold" in the common sulfides. Can. Miner. 1990, 28, 1–16. [Google Scholar]
  16. Arehart, G.B.; Chryssoulis, S.L.; Kesler, S.E. Gold and arsenic in iron sulfides from sediment-hosted disseminated gold deposits; implications for depositional processes. Econ. Geol. 1993, 88, 171–185. [Google Scholar] [CrossRef]
  17. Pals, D.W.; Spry, P.G.; Chryssoulis, S. Invisible Gold and Tellurium in Arsenic-Rich Pyrite from the Emperor Gold Deposit, Fiji: Implications for Gold Distribution and Deposition. Econ. Geol. 2003, 98, 479–493. [Google Scholar] [CrossRef]
  18. Reich, M.; Kesler, S.E.; Utsunomiya, S.; Palenik, C.S.; Chryssoulis, S.L.; Ewing, R.C. Solubility of gold in arsenian pyrite. Geochim. Cosmochim. Acta 2005, 69, 2781–2796. [Google Scholar] [CrossRef]
  19. Morishita, Y.; Shimada, N.; Shimada, K. Invisible gold and arsenic in pyrite from the high-grade Hishikari gold deposit, Japan. Appl. Surf. Sci. 2008, 255, 1451–1454. [Google Scholar] [CrossRef]
  20. Morishita, Y.; Shimada, N.; Shimada, K. Invisible gold in arsenian pyrite from the high-grade Hishikari gold deposit, Japan: Significance of variation and distribution of Au/As ratios in pyrite. Ore Geol. Rev. 2018, 95, 79–93. [Google Scholar] [CrossRef]
  21. Barton, P.B., Jr.; Skinner, B.J. Sulfide mineral stabilities. In Geochemistry of Hydrothermal Ore Deposits, 2nd ed.; Barnes, H.L., Ed.; Wiley Interscience: New York, NY, USA, 1979; pp. 278–403. [Google Scholar]
  22. Heald, P.; Foley, N.K.; Hayba, D.O. Comparative anatomy of volcanic-hosted epithermal deposits; acid-sulfate and adularia-sericite types. Econ. Geol. 1987, 82, 1–26. [Google Scholar] [CrossRef]
  23. Geological Survey of Japan, AIST. Geological map of Japan 1:2,000,000, 5th ed. In 1:2,000,000 Map Series, 4th ed.; Geological Survey of Japan: Tsukuba, Ibaraki, Japan, 2002. [Google Scholar]
  24. Izawa, E.; Urashima, Y. Quaternary gold mineralization and its geologic environments in Kyushu, Japan. In Society of Economic Geologists Guidebook Series (CD-ROM); Society of Economic Geologists: Littletown, CO, USA, 2001; Volume 34, pp. 1–9. [Google Scholar]
  25. Izawa, E.; Urashima, Y. Quaternary gold mineralization at its geologic environments in Kyushu, Japan. Econ. Geol. 1989, 6, 233–241. [Google Scholar]
  26. Izawa, E. Evolution of volcanic and hydrothermal systems in southern Kyushu. Geol. Surv. Jpn. Rep. 1992, 279, 84–88. [Google Scholar]
  27. Hedenquist, J.W.; Matsuhisa, Y.; Izawa, E.; White, N.C.; Giggenbach, W.F.; Aoki, M. Geology, geochemistry, and origin of high sulfidation Cu-Au mineralization in the Nansatsu District. Jpn. Econ. Geol. 1994, 89, 1–30. [Google Scholar] [CrossRef]
  28. Urashima, Y.; Izawa, E.; Hedenquist, J.W. Nansatsu-Type Gold Mineralization in the Makurazaki District. In Society of Mining Geologists of Japan Guidebook2; Mining Geologists of Japan: Akasaka, Tokyo, Japan, 1987; Volume 2, pp. 13–22. [Google Scholar]
  29. Izawa, E.; Urashima, Y.; Ibaraki, K.; Suzuki, R.; Yokoyama, T.; Kawasaki, K.; Koga, A.; Taguchi, S. The Hishikari gold deposit: High-grade epithermal veins in Quaternary volcanics of southern Kyushu Jpn. J. Geochem. Explor. 1990, 36, 1–56. [Google Scholar] [CrossRef]
  30. Hammond, N.Q.; Morishita, Y. Source of ore fluids at the Kalahari Goldridge deposit, Kraaipan greenstone belt, South Africa: Evidence from Sr, C and O isotope signatures in carbonates. Geofluids 2009, 9, 356–364. [Google Scholar] [CrossRef]
  31. Tokunaga, M. Geology and ore deposits of the Kasuga mine and Akeshi mine, in the Makurazaki district, Kagoshima prefecture. Min. Geol. 1954, 4, 205–212, (In Japanese with English abstract). [Google Scholar]
  32. Morishita, Y.; Nakano, T. Role of basement in epithermal deposits: The Kushikino and Hishikari gold deposits, southwestern Japan. Ore Geol. Rev. 2008, 34, 597–609. [Google Scholar] [CrossRef]
  33. Hammond, N.Q.; Moore, J.M. Archaean lode gold mineralization in banded iron formation at the Kalahari Goldridge deposit, Kraaipan greenstone belt, South Africa. Miner. Depos. 2006, 41, 483–503. [Google Scholar] [CrossRef]
  34. Hammond, N.Q.; Moore, J.M.; Sheets, R.W. Physico-chemical conditions of ore-forming fluids associated with genesis of the Kalahari Goldridge deposit, Kraaipan Greenstone Belt, South Africa. Ore Geol. Rev. 2007, 30, 106–134. [Google Scholar] [CrossRef]
  35. Anhaeusser, C.R.; Walraven, F. Episodic granitoid emplacement in western Kaapvaal Craton: Evidence from the Achaean Kraaipan granite-greenstone terrane, South Africa. J. Afr. Earth Sci. 1999, 28, 289–309. [Google Scholar] [CrossRef]
  36. Gold Fields Ltd. 2017 Mineral Resources and Mineral Reserves Supplement. 2017. Available online: https://www.goldfields.com/pdf/investors/integrated-annual-reports/2017/mrr-2017-hires.pdf (accessed on 19 April 2019).
  37. Robb, L.J.; Robb, V.M. Gold in the Witwatersrand Basin. In The Mineral Resources of South Africa: Handbook; Wilson, M.G.C., Anhaeusser, C.R., Eds.; Council for Geoscience: Silverton, CO, USA, 1998; Volume 16, pp. 294–349. [Google Scholar]
  38. Robb, L.J.; Meyer, F. The Witwatersrand Basin, South Africa: Geological framework and mineralization processes. Ore Geol. Rev. 1995, 10, 67–94. [Google Scholar] [CrossRef]
  39. Gold Fields Ltd. Kloof-Driefontein Complex (KDC) Technical Short Form Report 31 December 2011. Available online: https://goldfields.com/reports/ar_dec_2011/minerals/pdf/kdc_mine.pdf (accessed on 19 April 2019).
  40. Tucker, R.F.; Viljoen, R.P.; Viljoen, M.J. A Review of the Witwatersrand Basin–The World’s Greatest Goldfield. Episodes 2016, 39, 105. [Google Scholar] [CrossRef]
  41. Gold Fields Ltd. Gold Fields 2018 Results. Available online: http://www.goldfields.com/reports/fy2018/pdf/booklet.pdf (accessed on 19 April 2019).
  42. Sibanye-Stillwater Ltd. Company Financial Statements 2017. Available online: http://reports.sibanyestillwater.com/2017/download/SBY-CFS2017.pdf (accessed on 19 April 2019).
  43. Sibanye-Stillwater Ltd. Operating and Financial Results for the six Months and Year Ended 31 December 2018. Available online: https://thevault.exchange/?get_group_doc=245/1550722223-sibanye-results-booklet-H2-YE-2018-21feb2019.pdf (accessed on 19 April 2019).
  44. Phillipps, G.N.; Law, J.D.M. Witwatersrand Gold Fields: Geology, Genesis, and Exploration. Rev. Econ. Geol. 2000, 13, 439–500. [Google Scholar]
  45. MITI. Report on the Regional Survey of the Nansatsu Region, Heisei 11 (FY); Ministry of International Trade and Industry: Tokyo, Japan, 2000; p. 58. (In Japanese)
  46. Pettijohn, F.J. Sedimentary Rocks, 3rd ed.; Harper & Row: New York, NY, USA, 1975; pp. 56–61. [Google Scholar]
  47. Tauson, V.L. Gold solubility in the common gold-bearing minerals: Experimental evaluation and application to pyrite. Eur. J. Miner. 1999, 11, 937–948. [Google Scholar] [CrossRef]
  48. Simon, G.; Kao, L.S.; Huang, H.; Penner-Hahn, J.E.; Kesler, S.E. Oxidation state of gold and arsenic in gold-bearing arsenian pyrite. Am. Miner. 1999, 84, 1071–1079. [Google Scholar] [CrossRef]
  49. Groves, D.I.; England, G.L.; Rasmussen, B.; Krapež, B. Palaeoenvironmental significance of rounded pyrite in siliciclastic sequences of the Late Archaean Witwatersrand Basin: Oxygen-deficient atmosphere or hydrothermal alteration? Sedimentology. 2002, 49, 1133–1156. [Google Scholar]
  50. Sung, Y.H.; Brugger, J.; Ciobanu, C.L.; Pring, A.; Skinner, W.; Nugus, M. Invisible gold in arsenian pyrite and arsenopyrite from a multistage Archaean gold deposit: Sunrise Dam, Eastern Gold fields Province, Western Australia. Min. Depos. 2009, 44, 765–791. [Google Scholar] [CrossRef]
Figure 1. Epithermal gold deposits in Kyushu in Southwestern Japan [23,24]. The location of the Kasuga, Iwato, and Akeshi deposits are shown in addition to the Hishikari deposit.
Minerals 09 00447 g001
Figure 2. Simplified geologic map of the Kraaipan terrane [35], showing the locality of the Kalahari mine. Numbers indicate approximate ages (Ma) of BIFs and related rocks.
Minerals 09 00447 g002
Figure 3. Location of the Witwatersrand gold mines [44], showing the localities of the South Deep and KDC (Kloof–Driefontein Complex) West mines.
Minerals 09 00447 g003
Figure 4. Au and As concentrations (ppm) in pyrite from the high-sulfidation Nansatsu-type (Kasuga, Iwato, and Akeshi) gold deposits. Reflected-light photos showing the shapes of pyrite grains are added to the graph. See Section 5.1 for details.
Minerals 09 00447 g004
Figure 5. Secondary ion mass spectrometry (SIMS) depth profile of Au in pyrrhotite (Au1*14.adp in Table A1) from the Kalahari Goldridge deposit. The analysis started at the surface of the pyrrhotite grain (left end of the graph) and proceeded toward the interior (right end of the graph), resulting in the formation of a crater. The left vertical axis shows the raw data in counts per second. The right vertical axis shows the Au concentration (ppm) in pyrite calculated from the raw data using the RSFAu-pyrrhotite value. Note that the crater is very shallow and several peaks of Au with of approximately 50 nm in width (Au nanoparticles (NPs)) were observed. RSF: relative sensitivity factor.
Minerals 09 00447 g005
Figure 6. Relationship between Au and As concentrations (ppm) in pyrite from the South Deep and KDC West deposits. A rough positive correlation (R2 = 0.71) between the Au and As concentrations was obtained for the South Deep pyrite, whereas the relationship for the KDC West deposit showed different behavior from that of the South Deep deposit. The analysis position (rim or core) and the shape of the pyrite are given near the symbol.
Minerals 09 00447 g006
Figure 7. Relationship between Au and As concentrations (ppm) in pyrite from the South Deep deposit (an area of lower Au and As concentrations of Figure 6). The analysis position (rim or core) and the shape of the pyrite are given near the symbol. Violet and red symbols represent data collected at the rim and core of subangular grains, respectively. Rounded grains are shown in blue.
Minerals 09 00447 g007
Figure 8. Log–log plot of the relationship between the Au and As concentrations (mol%), including all the SIMS data for the pyrite and pyrrhotite. Every deposit is allocated a symbol in the legend. The solid line represents the empirical solubility limit of Au in pyrite as a function of As concentration [18]. Note that almost all the data lie on or below the line. See Section 5.4 for details. The labels ‘Kalahari Py’ and ‘Kalahari Po’ represent pyrite and pyrrhotite grains, respectively, from the Kalahari deposit.
Minerals 09 00447 g008
Figure 9. Log–log plot of the relationship between the Au and As concentrations (mol%), including all the SIMS data for the pyrite and pyrrhotite. The Au–As relationship in pyrite from the Hishikari deposit [20] is included for reference. The solid line represents the empirical solubility limit of Au in pyrite as a function of As concentration [18]. The labels ‘Hishikari’ and ‘HR for H’ represent pyrite grains in ore veins and host rocks, respectively, from the Hishikari deposit.
Minerals 09 00447 g009
Table 1. General description of the studied Au deposits.
TypeSub-Type/RegionNameMineral Assemblage
Epithermalhigh-sulfidation Nansatsu-typeKasugaquartz, enargite, pyrite, native gold, alunite, kaolinite, dickite, covelline, native sulfur, goethite [27,28]
Epithermalhigh-sulfidation Nansatsu-typeIwatoquartz, pyrite, native gold, alunite, kaolinite, dickite, goethite [28]
Epithermalhigh-sulfidation Nansatsu-typeAkeshiquartz, luzonite, pyrite, native gold, covelline, alunite, native sulfur, kaolinite, dickite, smectite, scorodite, goethite [28]
Epithermallow-sulfidation vein-typeHishikariquartz, adularia, smectite, pyrite, marcasite, electrum, naumannite-aguilarite, pyrargyrite, chalcopyrite [29]
BIF-hosted hydrothermalKraaipan greenstone beltKalahari Goldridgequartz, siderite, ankerite, calcite, pyrite, pyrrhotite, stilpnomelane, chlorite, magnetite, epidote, plagioclase [30]
Sedimentary & hydrothermalauriferous palaeoplacer/Witwatersrand basinSouth Deepquartz, pyrite, native gold
Sedimentary & hydrothermalauriferous palaeoplacer/Witwatersrand basinKDC Westquartz, pyrite, native gold
BIF: banded iron formation. KDC: Kloof-Driefontein Complex.
Table 2. Results of secondary ion mass spectrometry (SIMS) analysis.
DepositSample NameLocalityAnalysis SpotAnalysis No.MineralAu (ppm)As (ppm)Analysis Position-Size-Roundness
KasugaS11319.6 m depthN1Au5*246.adppyrite0.06 44 core-260 μm × 320 μm-subangular
KasugaS11319.6 mN11Au5*256.adppyrite0.04 2 core-the same grain as above
KasugaS11319.6 mN2Au5*247.adppyrite0.09 6 core-120 μm × 130 μm-subangular
KasugaS11319.6 mN3Au5*248.adppyrite0.05 44 rim-the same grain as above
KasugaS11319.6 mN4Au5*249.adppyrite0.10 2 rim-the same grain as above
KasugaS11320.5 mN6Au5*251.adppyrite0.24 3 core-400 μm × 400 μm-subangular
KasugaS11320.5 mN7Au5*252.adppyrite0.17 3 rim-50 μm × 60 μm-subangular
KasugaS11390.2 mN8Au5*253.adppyrite0.17 64 core-200 μm × 300 μm-subangular
KasugaS113138.3 mN10Au5*255.adppyrite0.14 1 core-100 μm × 250 μm-subangular
KasugaS11319.6 mN12Au5*257.adppyrite0.09 2 core-50 μm × 90 μm-subangular
KasugaS11319.6 mN13Au5*258.adppyrite0.09 17 core-50 μm × 100 μm-subangular
KasugaS11319.6 mN14Au5*259.adppyrite0.06 2 core-120 μm × 140 μm-angular
KasugaS11319.6 mN15Au5*260.adppyrite23.58 176 core-20 μm × 40 μm-subangular
KasugaS11319.6 mN16Au5*261.adppyrite22.40 395 core-20 μm × 30 μm-subangular
IwatoS176MaruyamaPy1aAu5a*285.adppyrite1.59 24 rim-150 μm × 200 μm-mosaic
IwatoS176MaruyamaPy1bAu5a*287.adppyrite2.84 14 rim-the same grain as above
IwatoS176MaruyamaPy4aAu5a*286.adppyrite0.16 19 core-100 μm × 200 μm-mosaic
IwatoS176MaruyamaPy3aAu5a*288.adppyrite0.25 43 core-30 μm × 40 μm-subangular
Akeshi S174No.1 ore body#2Au5a*290.adppyrite0.17 847 rim-50 μm × 70 μm-crystalline
Akeshi S174No.1 ore body#4Au5a*292.adppyrite1.60 1083 rim-20 μm × 40 μm-subangular
Akeshi S174No.1 ore body#5Au5a*293.adppyrite0.08 403 core-30 μm × 50 μm-subangular
Akeshi S174No.1 ore body#6Au5a*294.adppyrite0.04 420 rim-20 μm × 50 μm-subangular
Akeshi S174No.1 ore body#3Au5a*295.adppyrite33.53 703 rim-30 μm × 60 μm-irregular
Akeshi S174No.1 ore body#7Au5a*296.adppyrite0.07 56 core-50 μm × 90 μm-subangular
Akeshi S174No.1 ore body#8Au5a*297.adppyrite0.54 111 core-50 μm × 60 μm-crystalline
KalahariS79D zone 118/21/11A#3 Au4*2.adppyrite0.01 22 core-500 μm × 1000 μm-subangular
KalahariS82D zone 118/21/15AK2_20703_8 #1pyrite0.32 17 core-80 μm × 100 μm-subangular
KalahariS82D zone 118/21/15A#31 PoAu5aa*31.adpPyrrhotite0.53 8 core-250 μm × 250 μm-mosaic
KalahariS82D zone 118/21/15A#32 PoAu5aa*32.adpPyrrhotite0.80 12 core-the same grain as above
KalahariS82D zone 118/21/15A#23 PoAu5aa*33.adpPyrrhotite0.86 6 core-the same grain as above
KalahariS82D zone 118/21/15AK1_30703_2 #1Pyrrhotite0.87 19 core-the same grain as above
KalahariS82D zone 118/21/15AK1_40703_3 #1Pyrrhotite0.25 17 core-the same grain as above
KalahariS82D zone 118/21/15AK1_50703_4 #1Pyrrhotite0.07 13 core-the same grain as above
KalahariS82D zone 118/21/15AK1_60703_5 #1Pyrrhotite0.01 8 core-50 μm × 50 μm-mosaic
KalahariS82D zone 118/21/15AK2_10703_7 #1Pyrrhotite0.01 8 core-200 μm × 250 μm-rounded
KalahariS82D zone 118/21/15AK2_30703_9 #1Pyrrhotite0.01 8 core-100 μm × 100 μm-mosaic
South DeepS196MIT in Upper ElsburgsS110702_4 #1pyrite0.04 21 core-350 μm × 450 μm-rounded
South DeepS196MIT in Upper ElsburgsS120702_5 #1pyrite0.02 19 rim-the same grain as above
South DeepS196MIT in Upper ElsburgsS130702_6 #1pyrite0.03 103 core-200 μm × 400 μm-subangular
South DeepS196MIT in Upper ElsburgsS140702_7 #1pyrite0.03 827 rim-the same grain as above
South DeepS196MIT in Upper ElsburgsS150702_8 #1pyrite0.22 1988 core-200 μm × 270 μm-angular
South DeepS196MIT in Upper ElsburgsS160702_9 #1pyrite0.34 2297 rim-the same grain as above
South DeepS196MIT in Upper ElsburgsS261026_6 #1pyrite0.14 2789 rim-the same grain as above
South DeepS196MIT in Upper ElsburgsS271026_7 #1pyrite1.09 4042 core-the same grain as above
South DeepS196MIT in Upper ElsburgsS211026_1 #1pyrite0.05 8 core-300 μm × 600 μm-round
South DeepS196MIT in Upper ElsburgsS221026_2 #1pyrite0.05 115 rim-160 μm × 250 μm-subangular
South DeepS196MIT in Upper ElsburgsS231026_3 #1pyrite0.04 49 core-the same grain as above
South DeepS196MIT in Upper ElsburgsS241026_4 #1pyrite0.05 102 core-200 μm × 300 μm-subangular
South DeepS196MIT in Upper ElsburgsS251026_5 #1pyrite0.04 177 rim-the same grain as above
South DeepS196MIT in Upper ElsburgsS281026_8 #1pyrite0.03 33 rim-600 μm × 650 μm-rounded
South DeepS196MIT in Upper ElsburgsS291026_9 #1pyrite0.02 19 core-the same grain as above
South DeepS196MIT in Upper ElsburgsS301026_10 #1pyrite0.08 59 core-50 μm × 80 μm-subangular
KDC WestS1972B (Carbon Leader)D3Au5aa*1.adppyrite0.12 1546 core-250 μm × 350 μm-subangular
KDC WestS1972B (Carbon Leader)D1Au5aa*3.adppyrite0.22 1238 rim-250 μm × 350 μm-subangular
KDC WestS1972B (Carbon Leader)D2Au5aa*2.adppyrite0.62 200 rim-300 μm × 300 μm-rounded
KDC WestS1972B (Carbon Leader)D140702_3 #1pyrite0.63 153 rim-the same grain as above
KDC WestS1972B (Carbon Leader)D130702_2 #1pyrite0.42 100 core-the same grain as above
KDC WestS1972B (Carbon Leader)D120702_1 #1pyrite0.04 22 core-150 μm × 200 μm-rounded
#1: determined by Atmosphere and Ocean Research Institute (AORI) NanoSIMS at the University of Tokyo.

