Article

Nanoscale Study of Titanomagnetite from the Panzhihua Layered Intrusion, Southwest China: Multistage Exsolutions Record Ore Formation

1
Key Laboratory of Ministry of Education on Safe Mining of Deep Metal Mines, Northeastern University, Shenyang 110819, China
2
School of Chemical Engineering and Advanced Materials, The University of Adelaide, Adelaide SA 5005, Australia
3
School of Resources and Civil Engineering, Northeastern University, Shenyang 110819, China
4
Adelaide Microscopy, The University of Adelaide, Adelaide SA 5005, Australia
5
Analysis and Testing Center, Science and Technology Research Institute, Northeastern University, Shenyang 110819, China
*
Author to whom correspondence should be addressed.
Minerals 2019, 9(9), 513; https://doi.org/10.3390/min9090513
Submission received: 13 July 2019 / Revised: 12 August 2019 / Accepted: 22 August 2019 / Published: 26 August 2019
(This article belongs to the Special Issue Minerals Down to the Nanoscale: A Glimpse at Ore-Forming Processes)

Abstract

:
Titanomagnetite from Fe-Ti-V ores of the Lanjiahuoshan deposit, Panzhihua layered intrusion, Southwest China, was investigated at the nanoscale. The objectives were to establish the composition of exsolution phases and their mutual relationships in order to evaluate the sequence of exsolution among oxide phases, and assess mechanisms of ore formation during magma emplacement. At the micron-scale, titanomagnetite shows crosscutting sets of exsolutions with ilmenite and Al-Mg-Fe-spinel (pleonaste), as well as overprint, both in terms of phase re-equilibration and remobilization of trace elements. Most complex textures were found in titanomagnetite surrounded by ilmenite and this was selected for high-angle annular dark field scanning transmission electron microscopy (HAADF STEM) imaging and STEM energy-dispersive X-ray spectrometry (EDS) spot analysis and mapping on a thin foil prepared in situ on a focused ion beam scanning electron microscope platform. Titanomagnetite revealed two sequential sets of exsolutions, {111} crosscutting {100}, which are associated with changes in phase speciation and trace element distribution patterns. Qandilite is the dominant spinel phase inside titanomagnetite; magnesioferrite is also identified. In contrast, Fe-poor, Al-rich, Mg-bearing spinel is present within ilmenite outside the grain. Vanadium enrichment in newly-formed magnetite lamellae is clear evidence for trace element remobilization. This V-rich magnetite shows epitaxial relationships with ilmenite at the contact with titanomagnetite. Two-fold super-structuring in ilmenite is evidence for non-redox re-equilibration between titanomagnetite and ilmenite, supporting published experimental data. In contrast, the transformation of cubic Ti-rich spinel into rhombohedral ilmenite imaged at the nanoscale represents the “oxy-exsolution” model of titanomagnetite–ilmenite re-equilibration via formation of a transient ulvöspinel species. Nanoscale disorder is encountered as vacancy layers in Ti-rich spinel, and lower symmetry in the Fe-poor, Al-Mg phase, suggesting that slow cooling rates can preserve small-scale phase equilibration. The cooling history of titanomagnetite ore can be reconstructed as three distinct stages, concordant with published models for the magma plumbing system: equilibrium crystallization of Al-rich, Mg-bearing titanomagnetite from cumulus melts at ~55 km, with initial exsolutions occurring above 800 °C at moderate fO2 conditions (Stage 1); crosscutting {111} exsolutions resulting in formation of qandilite, attributable to temperature increase due to emplacement of another batch of melt affecting the interstitial cumulus during uplift. Formation of 2-fold superstructure ilmenite + V-rich magnetite exsolution pairs representing non-redox equilibration indicates resetting of the cooling path at this stage (Stage 2); and ilmenite formation from pre-existing Ti-rich spinel and ulvöspinel, illustrative of redox-driven cooling paths at <10 km (Stage 3). HAADF STEM provides direct imaging of atomic arrangements, allowing recognition of processes not recognizable at the micron-scale, and can thus be used to constrain exsolution models during ore formation.

1. Introduction

Layered intrusions can host sizable deposits of Fe-Ti-V oxides, such as those known from the Panzhihua mafic-ultramafic igneous complex, Emeishan Large Igneous Province (ELIP), Southwest China [1]. In such ores, magnetite with high Ti content, hereafter referred as titanomagnetite ( Fe 1 + X 2 + Fe 2 2 X 3 + Ti X O 4 ), is one of the main components. Titanomagnetite is an intermediate member in the series magnetite (γ-Fe3O4)-ulvöspinel (Fe2TiO4), with complete solid solution (ss) generally considered at temperatures exceeding 600 °C [2]. The solvus in the series was reassessed by experiments fitted to thermodynamic calculations and is currently considered at a lower temperature (~527 °C) [3]. Both species are oxide spinels with the general formula AB2O4. Magnetite is one of the 2–3 spinels, where A and B are either divalent (Fe, Mg, Mn, Zn, Co, Ni, Cu), or trivalent (Fe, Al, Cr, V) cations. Ulvöspinel, however, is included in the 4–2 spinel subgroup, where A and B are tetravalent cations (Ti, Si, Ge) and divalent (Fe, Mg, Mn) cations, respectively [4]. Ideal magnetite and ulvöspinel have cubic ( F d 3 ¯ m ) inverse spinel structures with the crystal-structural formulae T(Fe3+)M(Fe2+Fe3+)O4 and T(Fe2+)M(Fe2+Ti4+)O4, respectively, where T is the tetrahedral site, and M is the octahedral site [5]. Titanomagnetite is derived from magnetite via the coupled substitution:
2Fe3+ → Fe2+ + Ti4+
However, the distribution, vacancies, and temperature control of ordering over the T and M sites are highly debated. Studies of synthetic crystals with various compositions in the series show that tetrahedral bond length increases with Ti content, but further complexity is generated due to internal electron exchange [5]. Based on present nomenclature, the oxyspinel group contains 33 named minerals with numerous solid solutions series and includes recently introduced vacancy-bearing species of lower cubic or tetragonal symmetry, e.g., maghemite [γ- ( Fe 0.67 3 + 0.33 ) Fe 2 O 4 ] [6].
Ulvöspinel and ilmenite (Fe2+TiO3; rhombohedral, R 3 ¯ ) were recognized as lamellar sets or blebs along {100} and {111} directions in magnetite from magmatic iron ores and igneous rocks [7]. These inclusions, postulated as exsolutions from titanomagnetite formed during ore and magma cooling, were interpreted in two ways: (i) ulvöspinel is unstable during oxidation and breaks down to ilmenite + magnetite; or (ii) ilmenite unmixes directly from titanomagnetite [7]. Observing that ilmenite is likely to form solid solutions with kin structures, such as hematite (α-Fe2O3; R 3 ¯ c ), rather than spinels, and based on experimental data and phase equilibrium in the system FeO-Fe2O3-TiO2, a previous study [8] introduced the titanomagnetite–ilmenite thermo-oxybarometer with wide application for “coexisting pairs of titaniferous magnetite and ilmenite” in rocks. The thermometer uses the temperature control for cation exchange in Equation (1), written as a mineral reaction between titanomagnetitess (magnetite–ulvöspinel) and ilmenitess (hematite–ilmenite):
Fe2TiO4 (ulvöspinel) + Fe2O3 (hematite) = FeTiO3 (ilmenite) + Fe3O4 (magnetite)
Based on the hypothesis in [7], the oxybarometer uses either iron redox equilibria at the magnetite hematite oxygen buffer, or an equilibrium involving the Ti-rich endmembers of the titanomagnetitess and ilmenitess:
6FeTiO3 (ilmenite) + 2Fe3O4 (magnetite) = 6Fe2TiO4 (ulvöspinel) + O2
The “Doxy-exsolution” model introduced in [8] was further refined with respect to parameters for exchange and redox reactions [9,10,11], becoming popularly applied, yet also highly debated. For example, experimental studies addressing ilmenite unmixing directly from titanomagnetite [7] show evidence for non-redox ilmenite exsolutions realized by vacancy relaxation in spinels [12]. Based on textures and electron microprobe analysis (EPMA) of samples from magmatic ores, ordered cation vacancies are attributed to a high-temperature ilmenite modification that forms from a solid solution with magnetite [13]. Subsequent experimental studies of titanomagnetite-ilmenite equilibrium at 1100–1300 °C and moderate fO2 conditions include additional elements (e.g., Al and Mg) and discuss the influence these have on the thermo-oxybarometer at temperatures exceeding 800 °C [14]. The complexity of exsolutions in titanomagnetite, including additional phases, such as other spinels, and corundum, is also acknowledged in recent studies interpreting subsolidus evolution and textural equilibration by complex sets of exsolutions [15,16,17,18].
Considering the fine and ultrafine nature of such exsolutions, as well as the various crystal structural modifications invoked in the debate about their genesis, nanoscale studies are most suitable for solving the nature of the species present in such assemblages. Advanced microscopy, and particularly Z-contrast imaging by scanning transmission electron microscopy (STEM) on samples obtained by focused ion beam (FIB) from a site of petrogenetic interest previously assessed by complementary techniques [19,20], provides unparalleled insights into understanding mineralization processes down to the nanoscale [18,21,22,23,24,25]. Important for the research reported here are the discovery of Si-Fe-nanoprecipitates or nanoparticles in “silician magnetite” from different deposit types [26,27], imaging of nanoscale-intergrowths between different olivine derivative minerals (laihunite series [28] that could be present in magmatic iron ores), and the definition of nanominerals, such as luogufengite, a new Al-bearing Fe2O3 polymorph, ε-Fe2O3 [29].
In this contribution, we undertake imaging of titanomagnetite from Panzhihua ores by high-angle annular dark field transmission electron microscopy (HAADF STEM). This material displays complex micron-scale intergrowths and overprints. The study was undertaken with the following purposes: (i) to assess trace elements distribution across micron- and nanoscales of observation; (ii) to characterize the species in the assemblages at the nanoscale; (iii) to interpret the sequence of exsolutions; and (iv) to assess mechanisms of ore formation during magma emplacement. The results contribute to confirmation or (re)evaluation of the sequence of exsolution among Fe-Ti-Al-Mg-oxide phases, and in turn carry implications for the reliability and accuracy of physicochemical conditions that can be calculated or interpreted on the basis of Fe-Ti-oxide compositions at the micron-scale. The study is illustrative of the complexity of processes in layered igneous intrusions where Fe-Ti-oxides re-equilibrate during slow cooling in crustal magma chambers.

2. Background

The Panzhihua layered intrusion within the ~260 Ma Emeishan Large Igneous Province (ELIP) is composed of melagabbro, hosting the Fe-Ti-V oxide orebodies, and Fe-Ti oxide-poor leucogabbros. Petrological models are hotly debated [30,31,32,33,34,35,36]. The origin of the ores is attributed to either direct crystallization and accumulation from an immiscible Fe-Ti-V-rich liquid [1,31,32], or formation via fractional crystallization and gravitational accumulation of Fe-Ti-V-oxides [30,33,34]. One of the latest models considers differentiation of basaltic magma in a continental setting in the context of a magma plumbing system for the ELIP province [35]. Evidence in support of this model is provided by relationships between clinopyroxene exsolution pairs in olivine gabbro [18].
Various attempts have been undertaken to relate titanomagnetite with different types of intergrowths to the oxide content in host rocks [33], silicate disequilibrium, and variation of fO2 and H2O content in the parent magma [36], or prolonged cooling history resulting in distinct exsolution mechanisms: (i) ulvöspinel exsolution and oxidation; (ii) oxy-exsolution of ilmenite; (iii) direct ilmenite unmixing from titanomagnetite; and (iv) rebalancing processes between the various oxides, including Al, Mg, and Zn-bearing spinels [15]. Titanomagnetite from Panzhihua has been studied by high-resolution (HR) transmission electron microscopy (TEM), showing relationships with coulsonite ( Fe 2 + V 2 3 + O 4 ) [37]. The presence of wüstite has been determined based on electron diffraction patterns [38].
A recent comprehensive study dealing with petrography and trace element signatures in silicates and Fe-Ti-oxides from the Lanjiahuoshan deposit, one of largest ore accumulation in Panzhihua igneous complex, shows that titanomagnetite is also present as lamellae crosscutting clinopyroxene forming symplectites with silicates interpreted as secondary melts, and as inclusions in pyrrhotite [39]. The same study shows overprinting as the result of the reaction between a late hydrothermal fluid and clinopyroxene, which led to the formation of hydrated minerals (pargasite and phlogopite), as well as a potassium metasomatic event, postdating intrusion solidification that led to the formation of K-feldspar. Trace element partitioning between titanomagnetite and silicates are affected by scavenging of metals by ilmenite (Mn, Sc, Zr, Nb, Sn, Hf, and Ta) and sulfides, as well as a marked partitioning of Co, Ni, Zn, Ga, As, and Sb into spinels exsolved from titanomagnetite [39]. Titanomagnetite is the main host for V, with measured concentrations of thousands of ppm V (3300–4400 ppm), whereas ilmenite (as coarser grains) contains hundreds (300–800) of ppm V. Nanoscale study of titanomagnetite exsolutions within clinopyroxene shows complex, ultrafine exsolutions with the presence of ulvöspinel and hercynite, in addition to ilmenite [18]. Panzhihua samples were used as an example to illustrate the role of minor phases in controlling trace element distribution between rock-forming silicates (pyroxene, olivine, feldspar), titanomagnetite (the dominant oxide), and sulfides (pyrrhotite, minor pentlandite, chalcopyrite, and cobaltpentlandite) in complex oxide-silicate-sulfide assemblages. For example, the high field strength elements (Sc, Zr, Hf, Ta, and Nb) are all markedly enriched in ilmenite relative to titanomagnetite, whereas Zn, Ga, and others occur preferentially in exsolved spinels [20].

3. Samples and Analytical Methodology

The study was carried out on two polished blocks (PL82F and PL82L), each one inch in diameter, from a single high-grade magnetite ore sample from Orebody 8, Lanjiahuoshan deposit, within the ~110 m-thick lower zone of the Panzhihua intrusion. The lower zone is composed of coarse-grained melagabbro and can be divided into orebodies 7 and 8 [39]. Orebody 8 is the main orebody and contains dense disseminated and massive ores, with interlayers of plagioclase- or olivine-bearing ores, fine-grained gabbro, and layered gabbro [39]. The estimated modal mineralogy of this sample, based on extensive petrography detailed in [39], is 67% Fe-Ti-oxides, 15% clinopyroxene, 10% plagioclase, 5% sulfides, and <1% olivine. The silicates occur as isolated grains with a granoblastic texture within the Fe-Ti-oxides. Mutual boundaries between oxides and silicates can be either sharp or display a caries texture, indicating silicates replaced by Fe-Ti-oxide. In one polished block (PL82F), cm-sized sulfide pockets are observed along plagioclase-rich layers, whereas in the other (PL82L), coarser ilmenite is present [39].
A FEI Quanta 450 scanning electron microscope (SEM) (FEI, Hillsboro, OR, USA) with energy dispersive X-ray spectrometry (EDS) and back-scatter electron (BSE) imaging capabilities was used at an accelerating voltage of 20 kV and beam current of 10 nA to obtain information on micron-scale mineral distributions and textures.
Laser ablation inductively coupled plasma mass spectrometry (LA-ICP-MS) mapping was obtained on a Resolution LR 193-nm excimer laser ablation system (Applied Spectra Inc., Fremont, SA, USA) coupled to an Agilent 7700cx Quadrupole ICP-MS (Agilent Technologies, Santa Clara, CA, USA) by ablating sets of parallel line rasters in a grid across areas in the sample using a laser repetition of 10 Hz and energy output of 70 mJ. A beam size of 11 µm and scan speeds of 11 µm/s were selected to achieve the desired sensitivity of the elements of interest and adequate spatial resolution. Redeposition during mapping was minimized by pre-ablating each line prior to data collection. A 10 s background acquisition was acquired at the start of each line, and to allow for cell wash-out, gas stabilization, and computer processing, a delay of 20 s was used after each line. Identical rasters were performed on reference material GSD-1G, with two at the start and two at the end of every mapping run. Element mappings were constructed using Iolite software [40].
Cross-section imaging and TEM sample preparation were performed on a FEI Helios Nanolab 600 DualBeamTM FIB-SEM (FEI, Hillsboro, OR, USA). Procedures outlined by Ciobanu et al. [41] were followed in the extraction and thinning of TEM foils by ion beam (Ga+) milling. Four thin foils were prepared across titanomagnetite grains showing intergrowths of various types.
All thin foils were assessed at the nanoscale using electron diffractions and bright field TEM imaging using a Philips CM200 TEM (Philips, Eindhoven, The Netherlands) operated at 200 kV. The instrument was equipped with a LaB6 source, double-tilt holder and Gatan Orius digital camera (Gatan Inc., Pleasanton, CA, USA). Energy-dispersive X-ray spectra (EDS) were acquired using an Oxford Instruments X-Max 65T silicon drift detector running Aztec software (Oxford Instruments, Abingdon, UK). Image and diffraction measurements were performed using DigitalMicrographTM 3.11.1 (Gatan Inc., Pleasanton, CA, USA).
HAADF STEM imaging and EDS spot analysis and mapping on one of the selected thin foils were performed using an ultra-high-resolution, probe corrected, FEI Titan Themis S/TEM operated at 200 kV (FEI, Hillsboro, OR, USA). The other three foils are shown in Supplementary Materials Figure S1. This instrument is equipped with the new extreme field emission gun Schottky source and Super-X EDS geometry. The Super-X EDS detector provides geometrically symmetric EDS detection with an effective solid angle of 0.8 sr. Probe correction delivered sub-Ångstrom spatial resolution, and an inner collection angle greater than 50 mrad was used for HAADF experiments using the Fischione HAADF detector.
Electron diffraction and fast Fourier transform (FFT) indexing were conducted using WinWulff© 1.5.2 software (JCrystalSoft, Livermore, CA, USA) and publicly available data from the American Mineralogist Crystal Structure Database [42]. Crystal structure simulations were carried out using CrystalMaker®Version 10.1.1 (CrystalMakerSoftware, Begbroke, UK) and STEM simulations using xHREMTM Version 4.1 software (HREM Research, Tokyo, Japan). All instruments used are housed at Adelaide Microscopy, The University of Adelaide.

4. Results

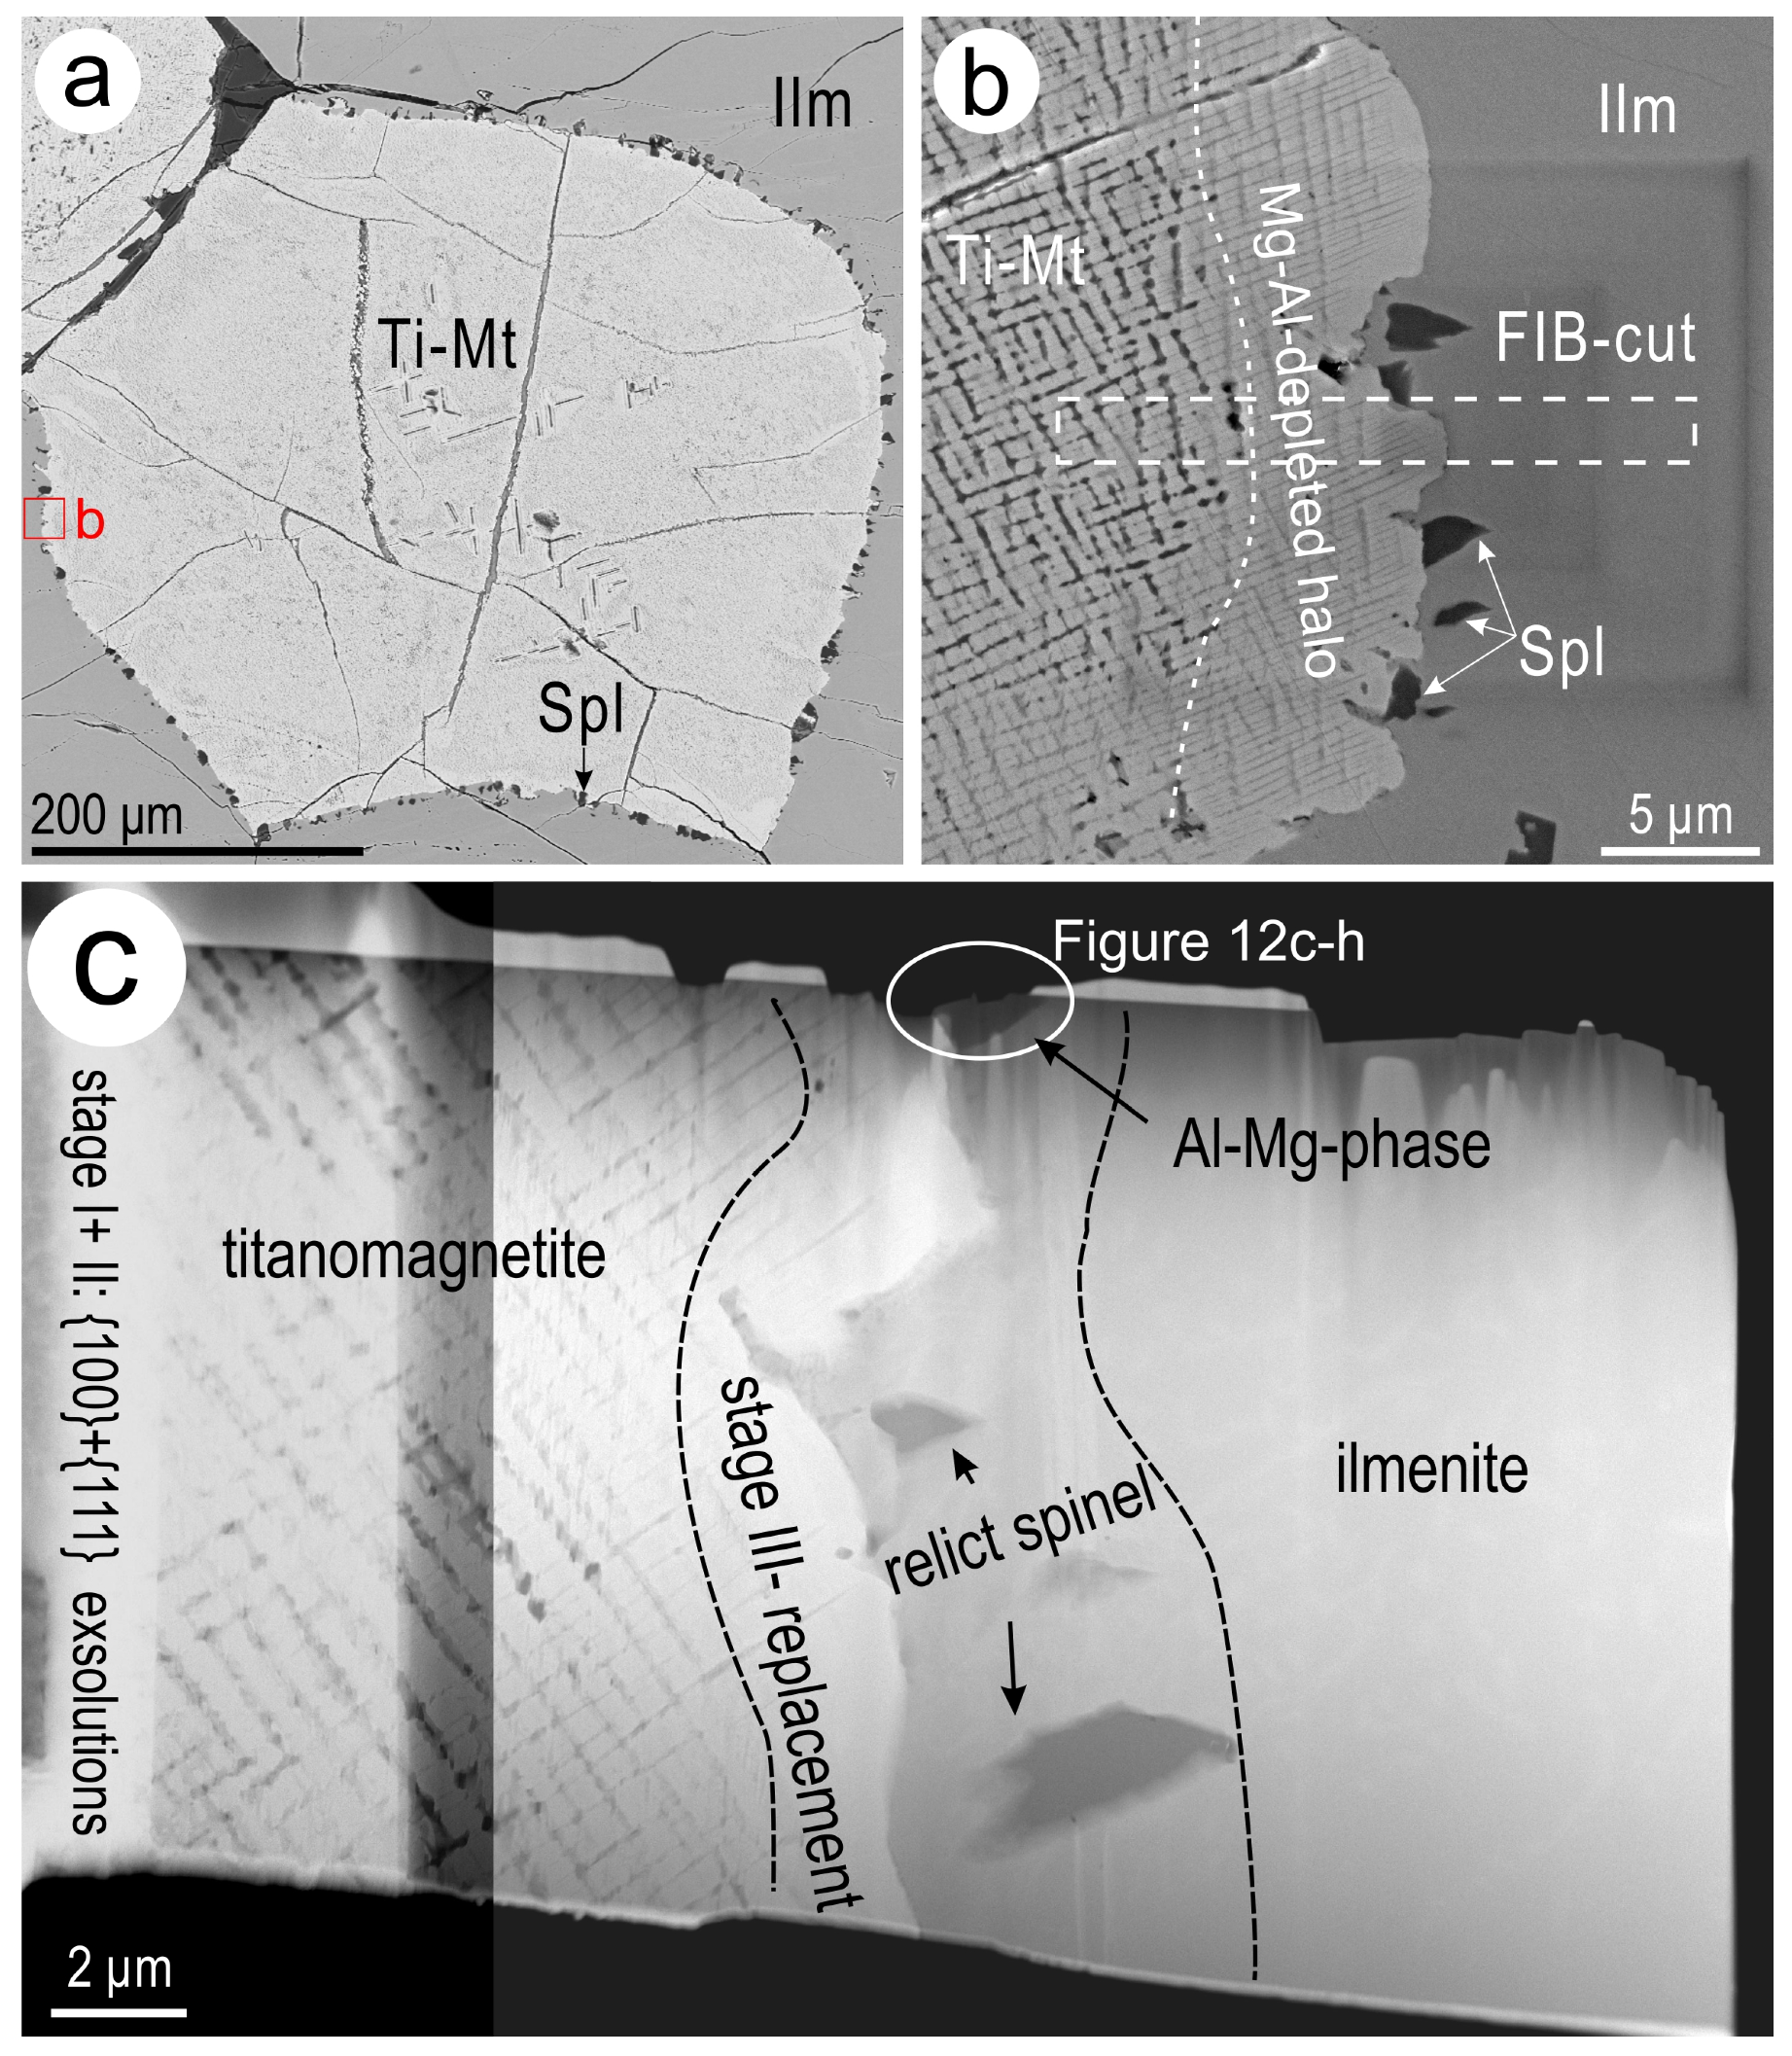
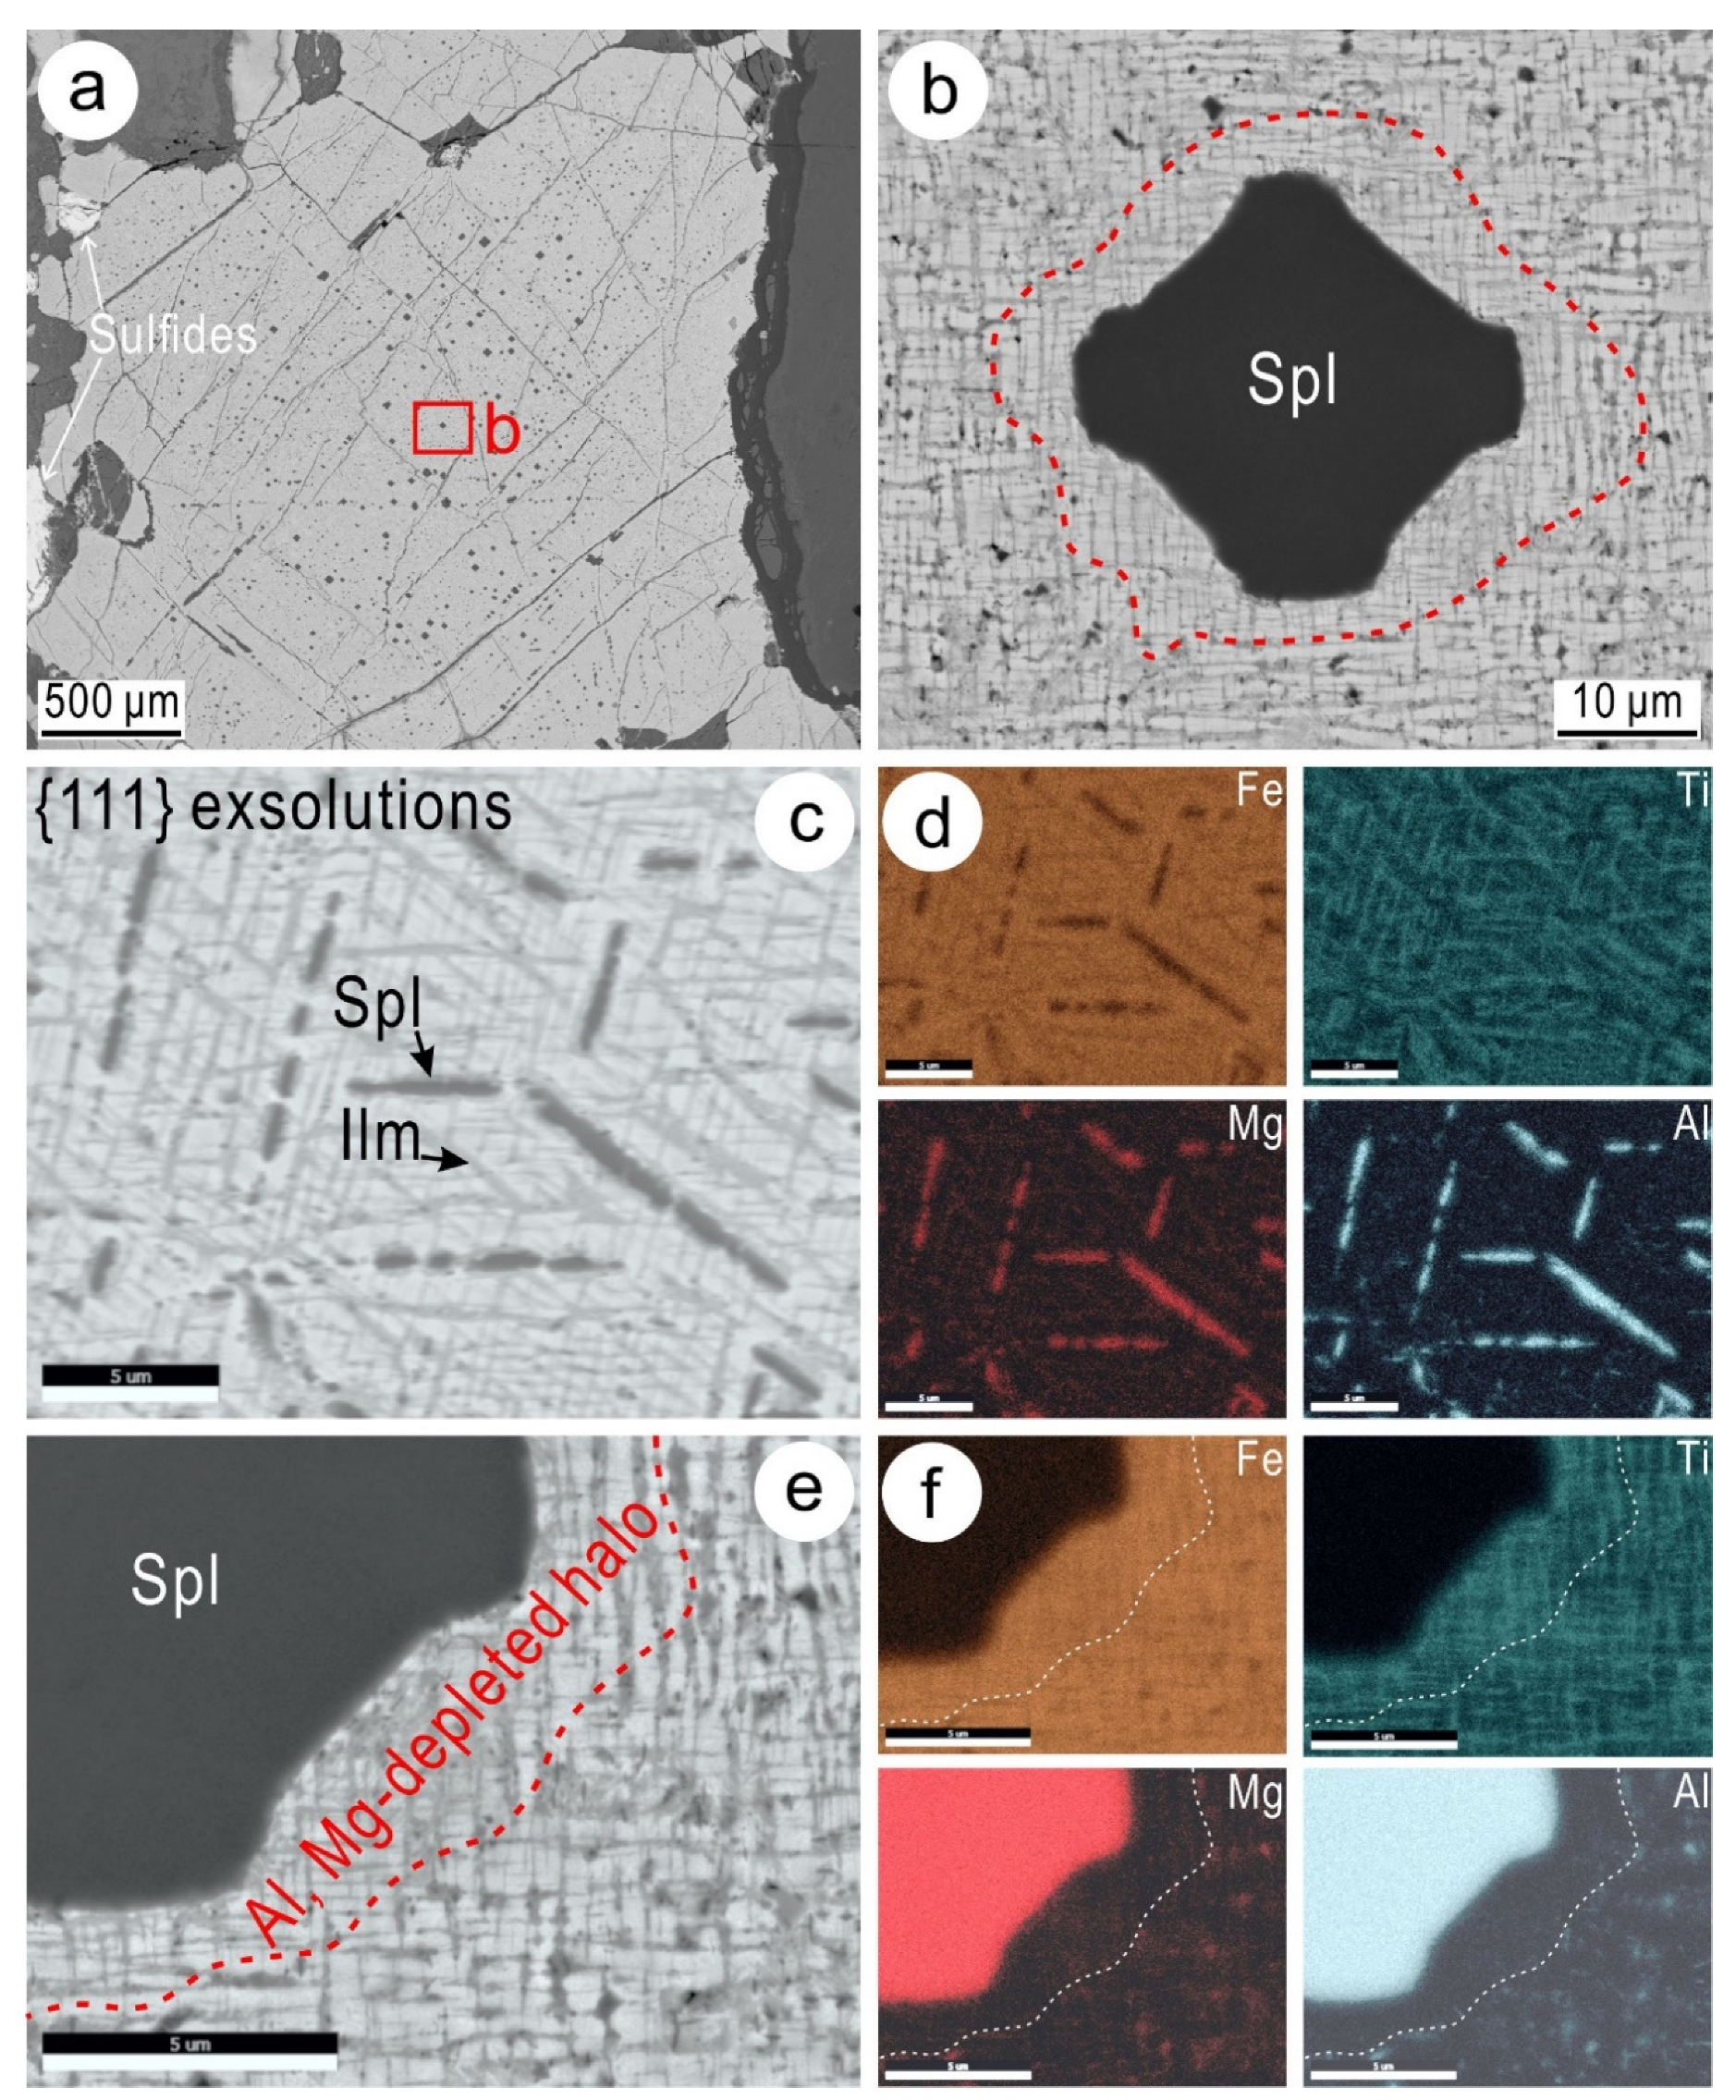
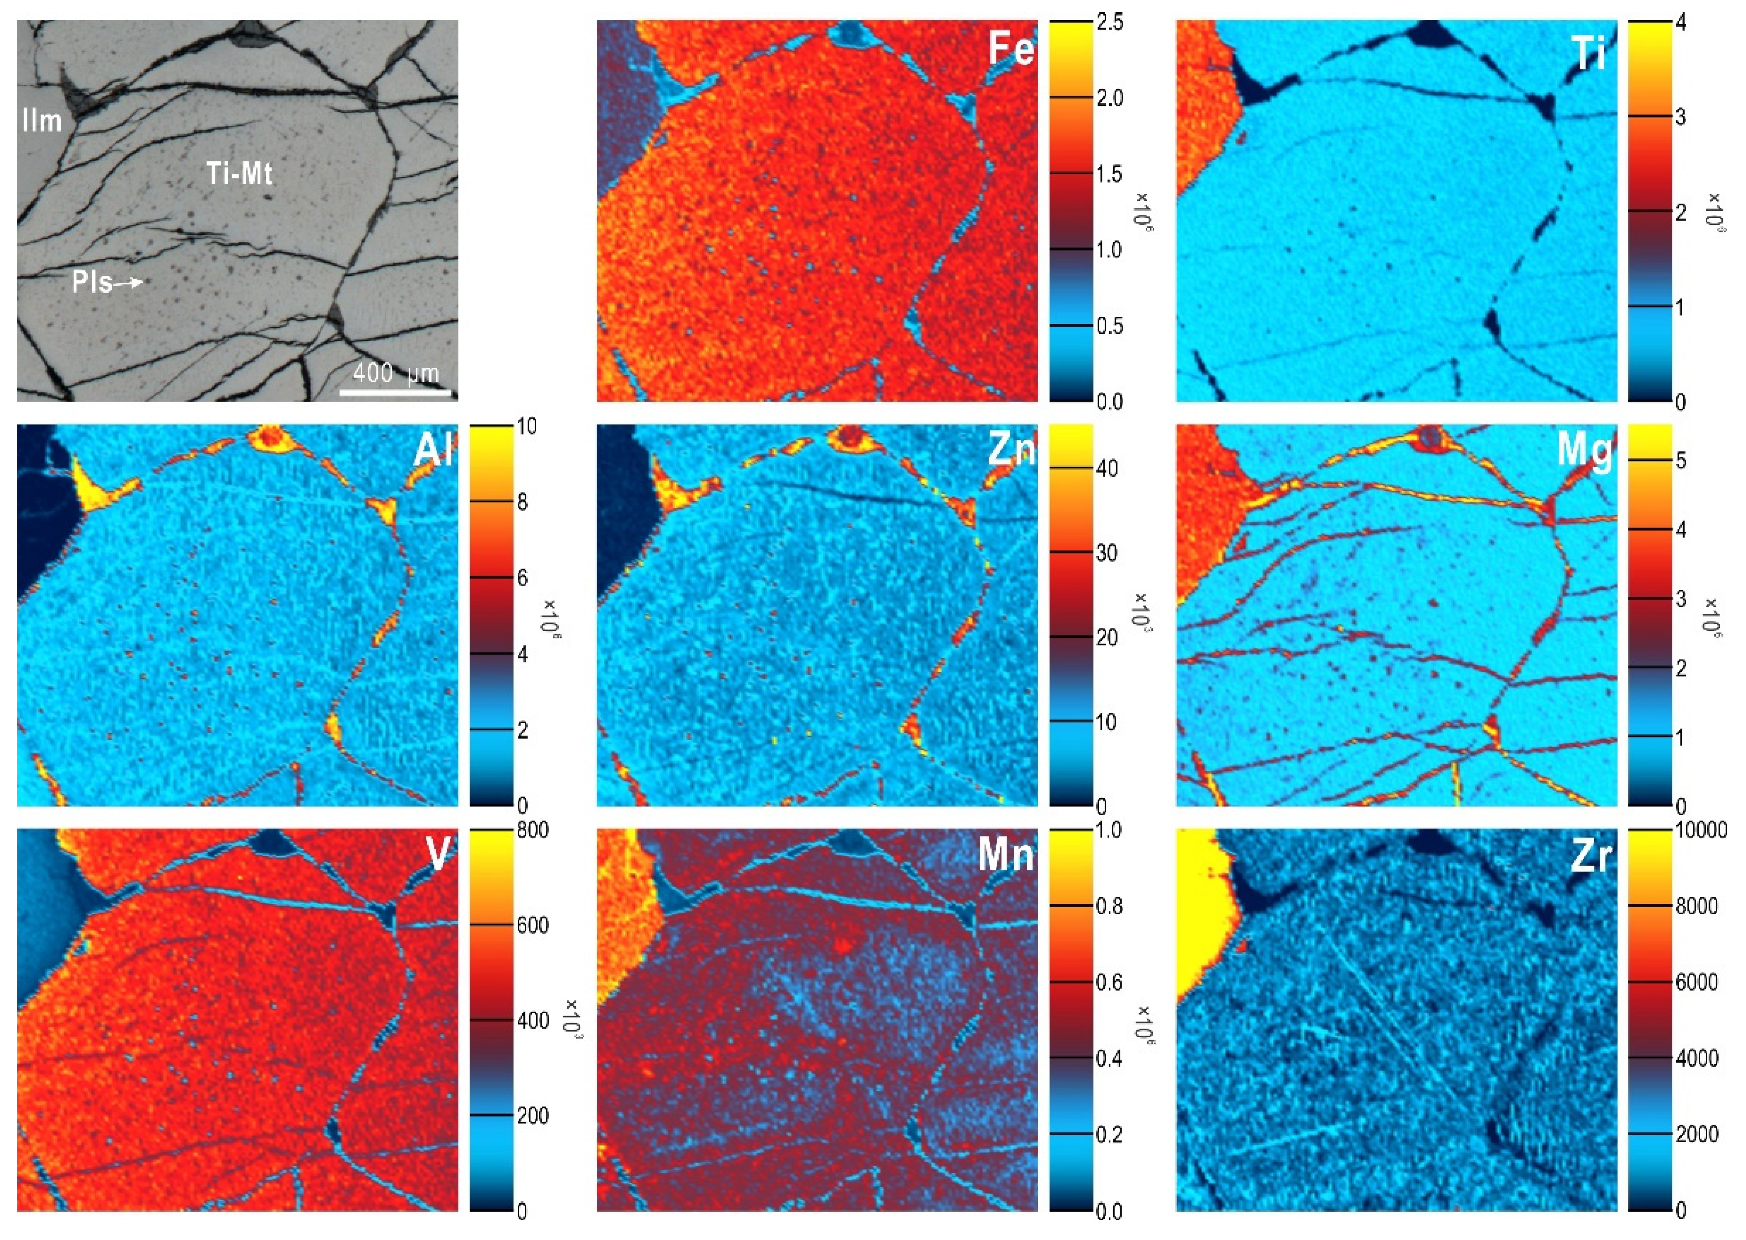
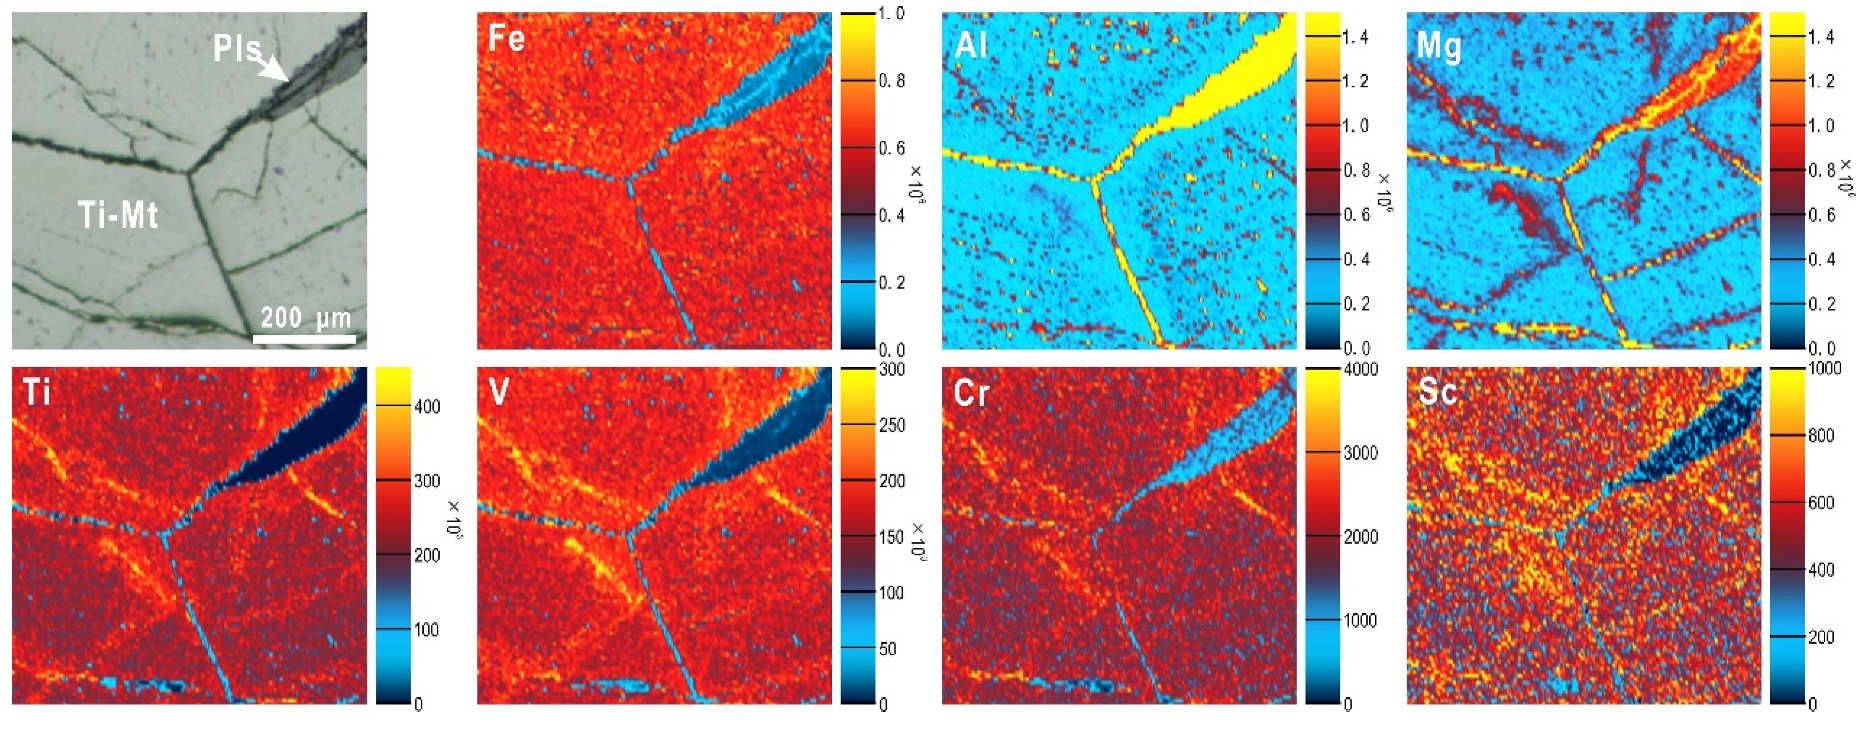
4.1. Titanomagnetite Textures and Trace Element Distributions at the Micron-Scale

Titanomagnetite from the Panzhihua ore is coarse-grained (mm-sized) and displays crystallographically oriented arrays of sub-micron mineral inclusions (ilmenite + spinels) typical of liquid magmatic ores (Figure 1). Each grain of titanomagnetite can, nonetheless, feature further textural complexity, such as fields of coarser inclusions, crosscutting veinlets hosting sulfides, and marginal replacement by silicates (Figure 1a). In detail, spinel grains occur either at junctions or along planes with {100} or {111} orientations in host titanomagnetite (Figure 1b,c). These sets of planes are marked by sets of finer lamellae of ilmenite. Formation of coarser spinel (tens of microns) with a square shape in cross-section is accompanied by the disappearance of smaller spinel grains within the surrounding halo (~10–20 microns in width; Figure 1b). SEM-EDS maps for Fe, Ti, Mg, and Al, and the observed ratios between these elements, indicate the presence of two main phases, ilmenite and spinel, as inclusions in titanomagnetite, and also show a subtle depletion in Mg and Al within the halo surrounding the square spinel (Figure 1c–f).
Mapping of titanomagnetite by LA-ICP-MS reveals trace element distributions throughout grains containing ilmenite + spinel inclusions (Figure 2 and Figure 3). In one case, Al, Zn, and Mg are enriched along grain boundaries, and Mg is also concentrated along crosscutting fractures and in adjacent ilmenite (Figure 2). In contrast, V shows pervasive distribution within the grain and is not concentrated along grain boundaries or fractures. Manganese and Zr are concentrated within the adjacent ilmenite and also display the presence of fine arrays within the grains with enrichment and depletion relative to their concentration within the main part of the grain. Such patterns indicate preferential partitioning between titanomagnetite and ilmenite, as well as re-mobilization of trace elements both outside (Al, Mg, Zn) and within the grain (Mn, Zr).
Further complexities in the trace element patterns are illustrated by element maps obtained at triple-junctions in titanomagnetite (Figure 3). In this case, the boundaries are clearly marked by the presence of showing an intermediate member along the spinel-hercynite join (MgAl2O4–FeAl2O4), informally named pleonaste [39], and the assemblage displays sub-structures concentrating Mg, Ti, V, Cr, and Sc within individual grains of titanomagnetite. Overall, such patterns are indicative of nanoscale complexity that can be related to an overprint event.
Representative of more complex overprinting are titanomagnetite grains with sub-rounded and partially scalloped morphologies (Figure 4a). Such grains also contain areas with marked coarsening of inclusions, as well as internal fractures. On the surface of the polished block, sets of inclusions form a dense weave pattern (Figure 4b). In detail, the grain boundaries display inliers produced by replacement of ilmenite. Spinel grains, some tens to several hundred of nm in size with irregular morphology, are present throughout the surrounding ilmenite. The boundaries are also marked by a brighter grey color in BSE images, forming a narrow margin no more than 1–3 µm in width, indicating loss of Al and Mg relative to the main part of the grain.

4.2. Nanoscale Study

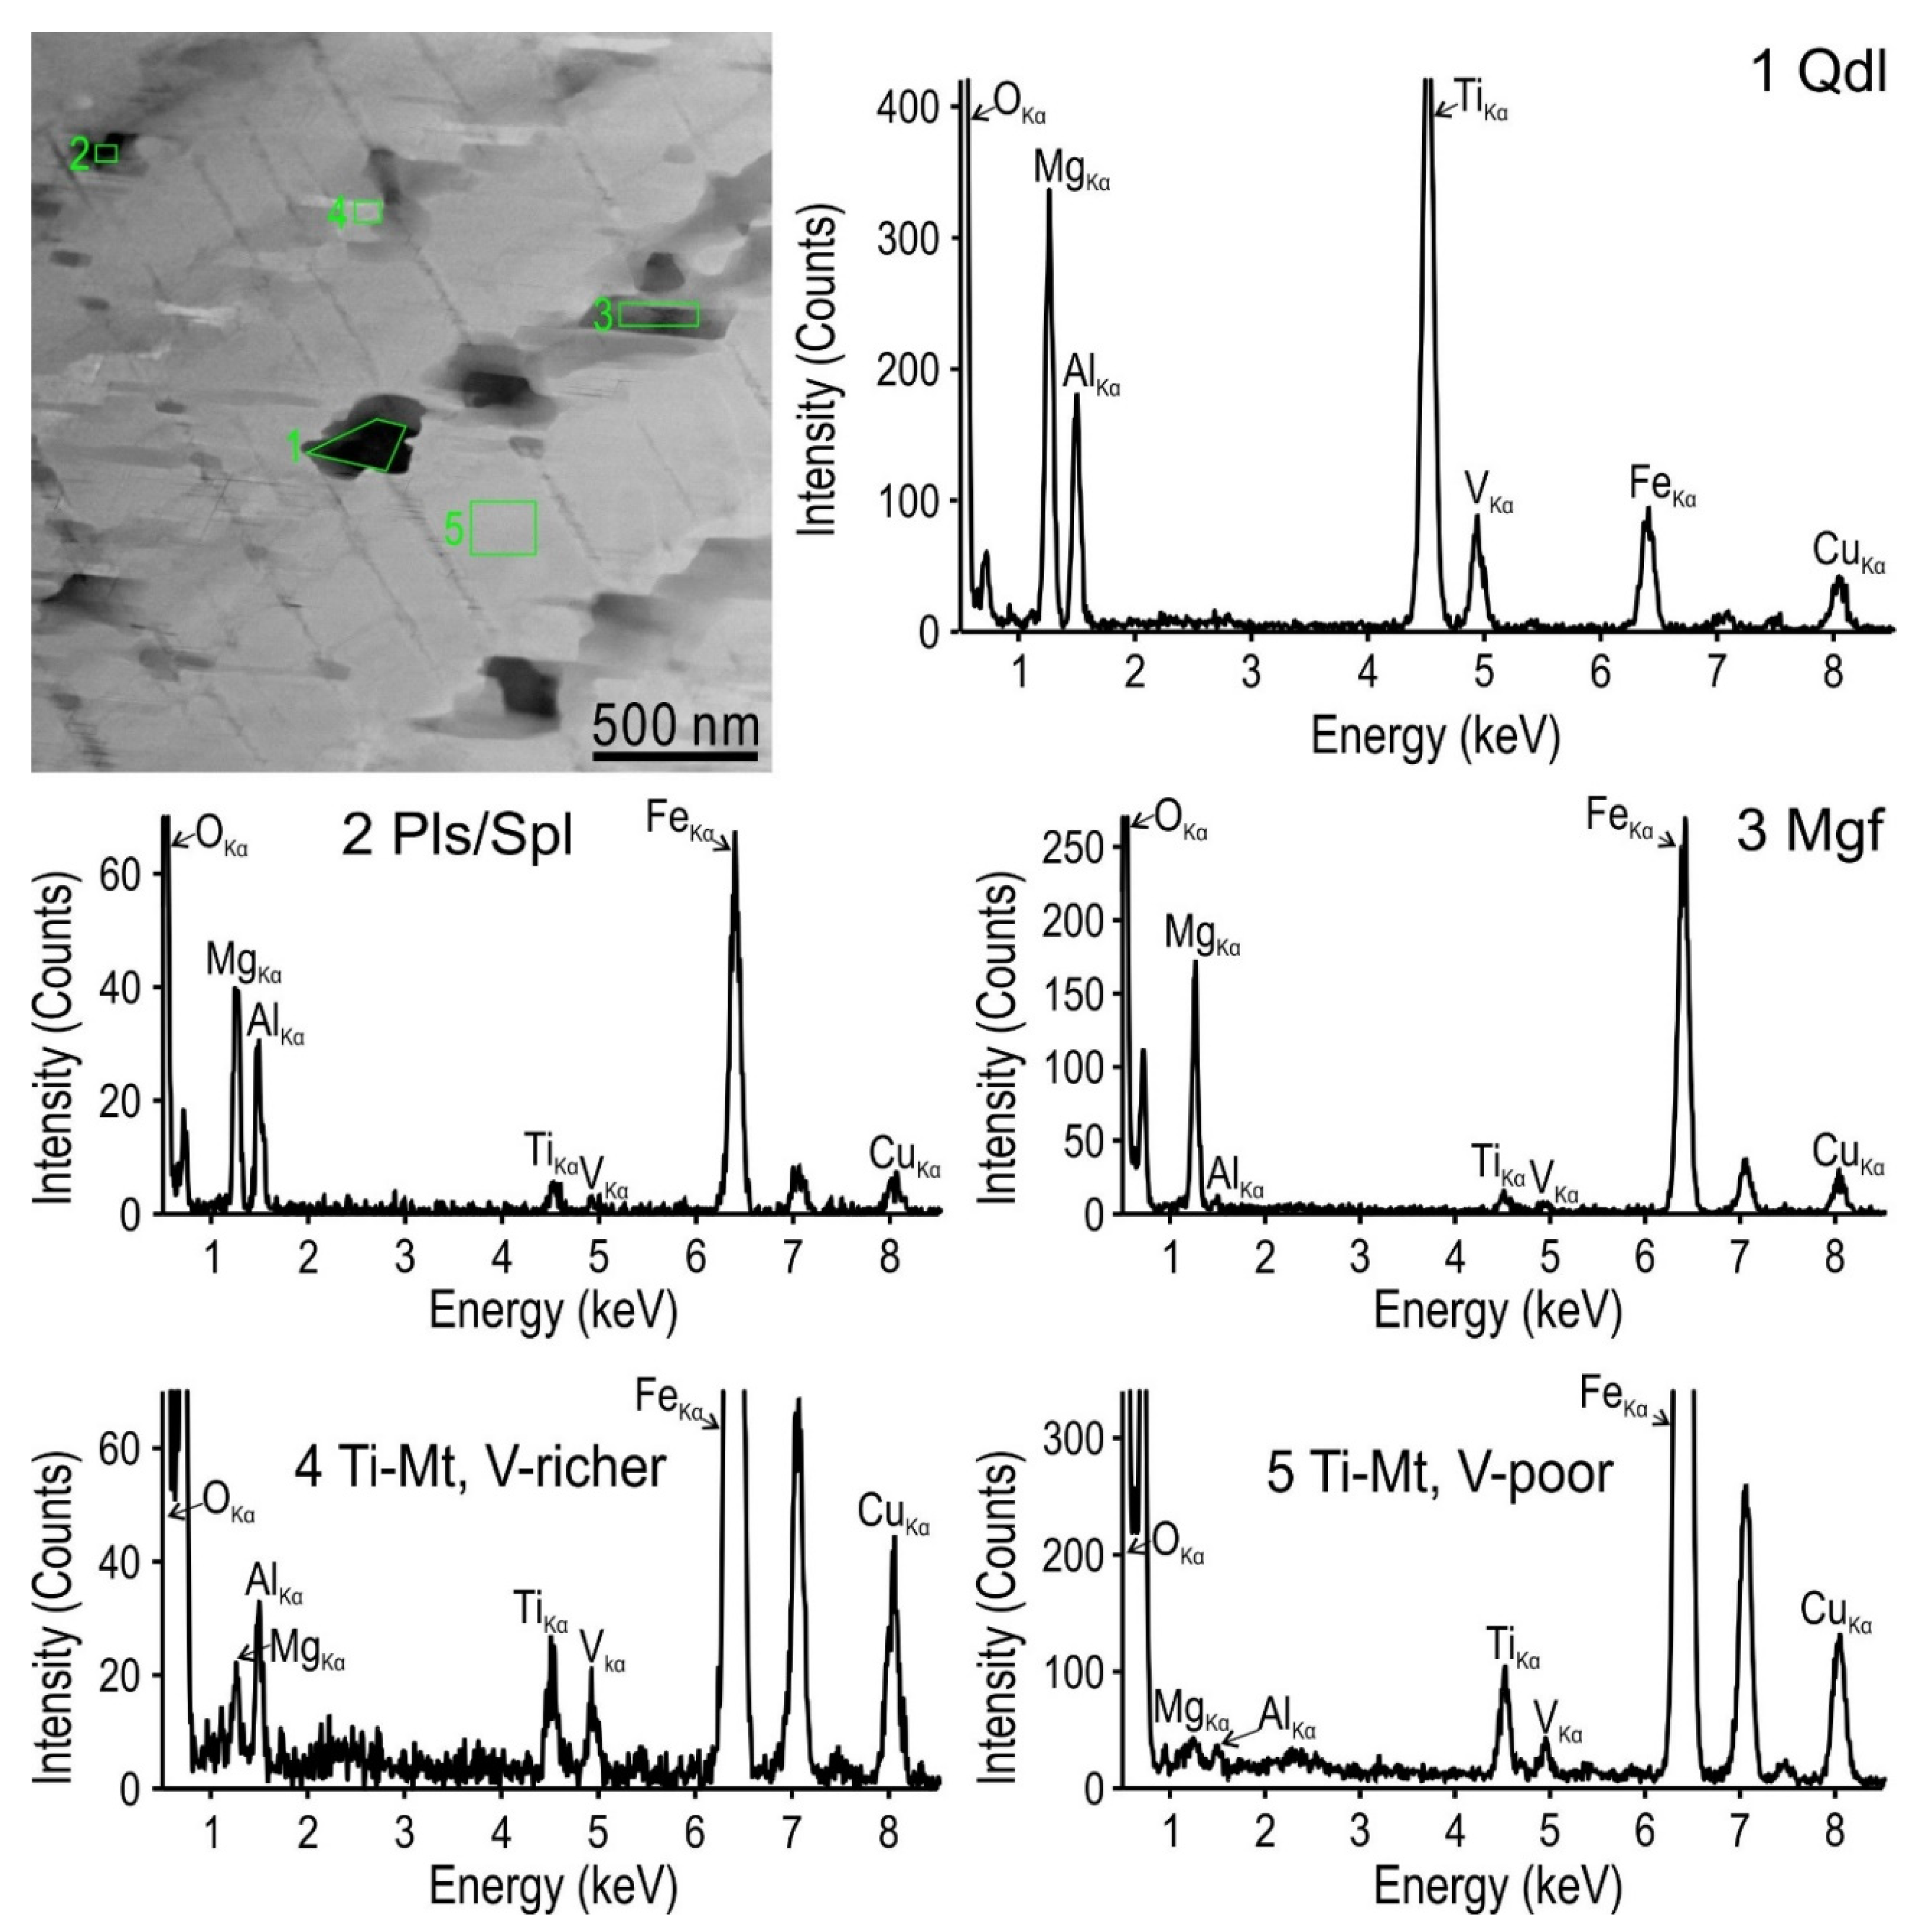
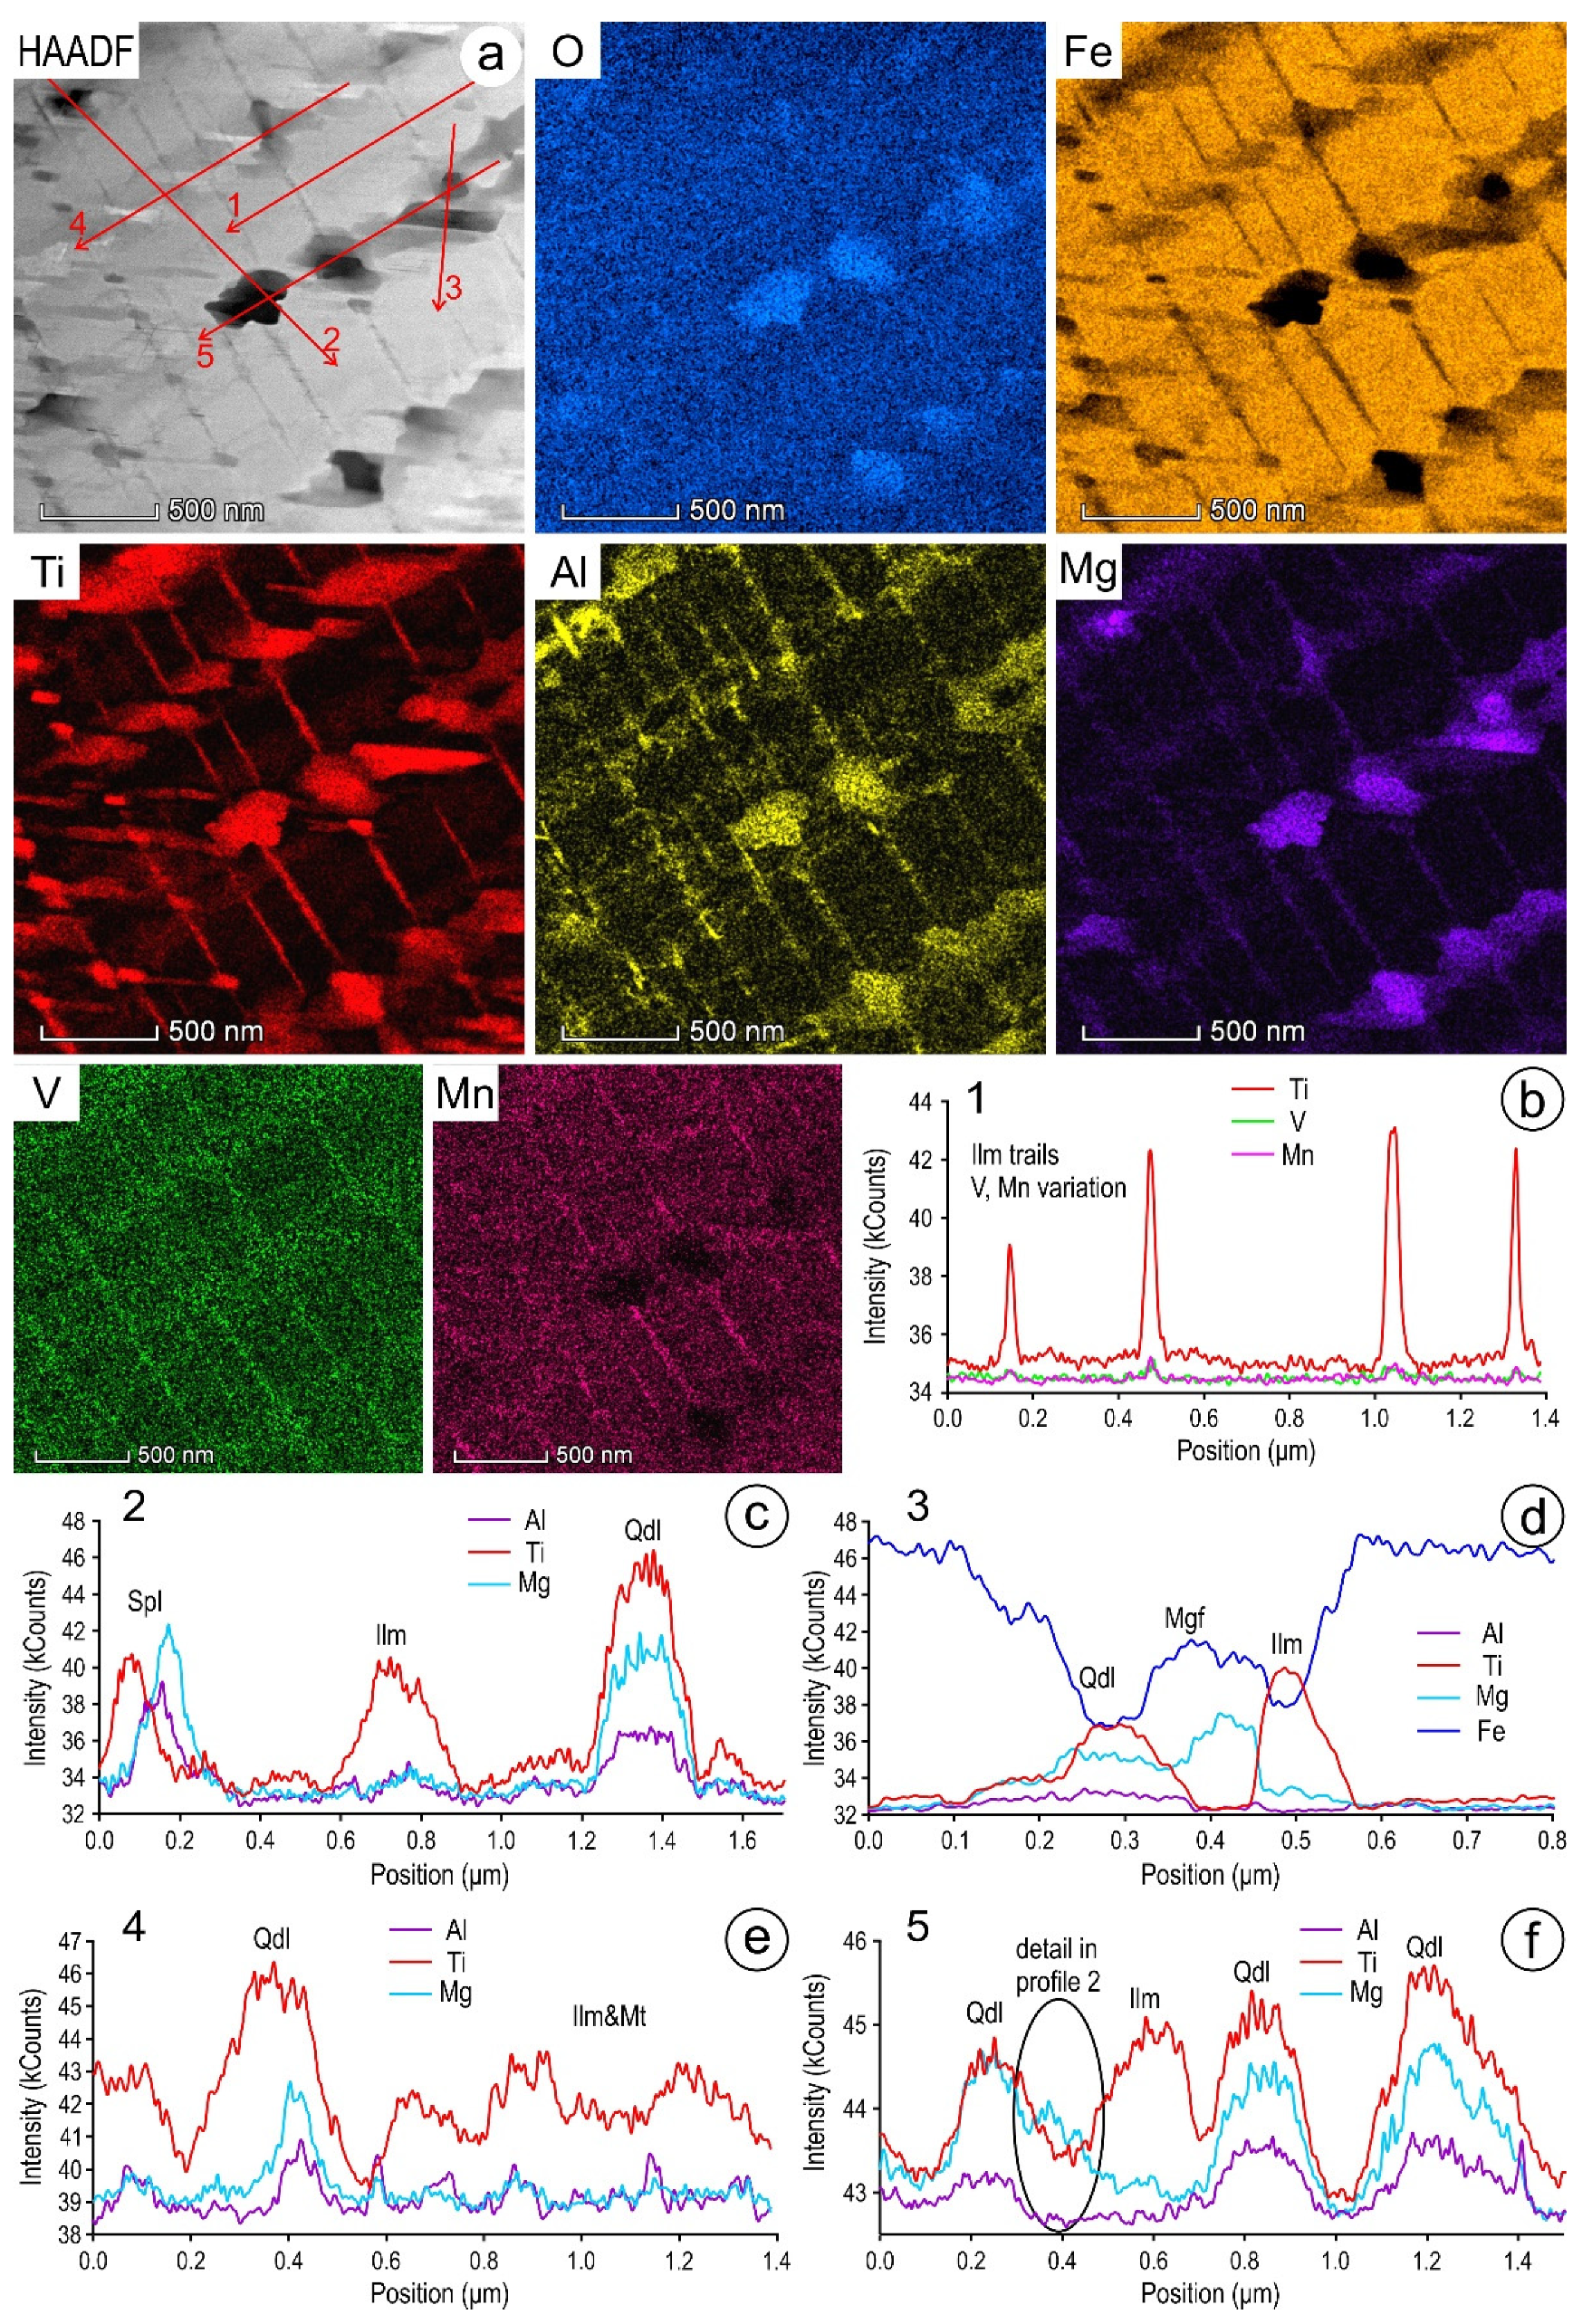
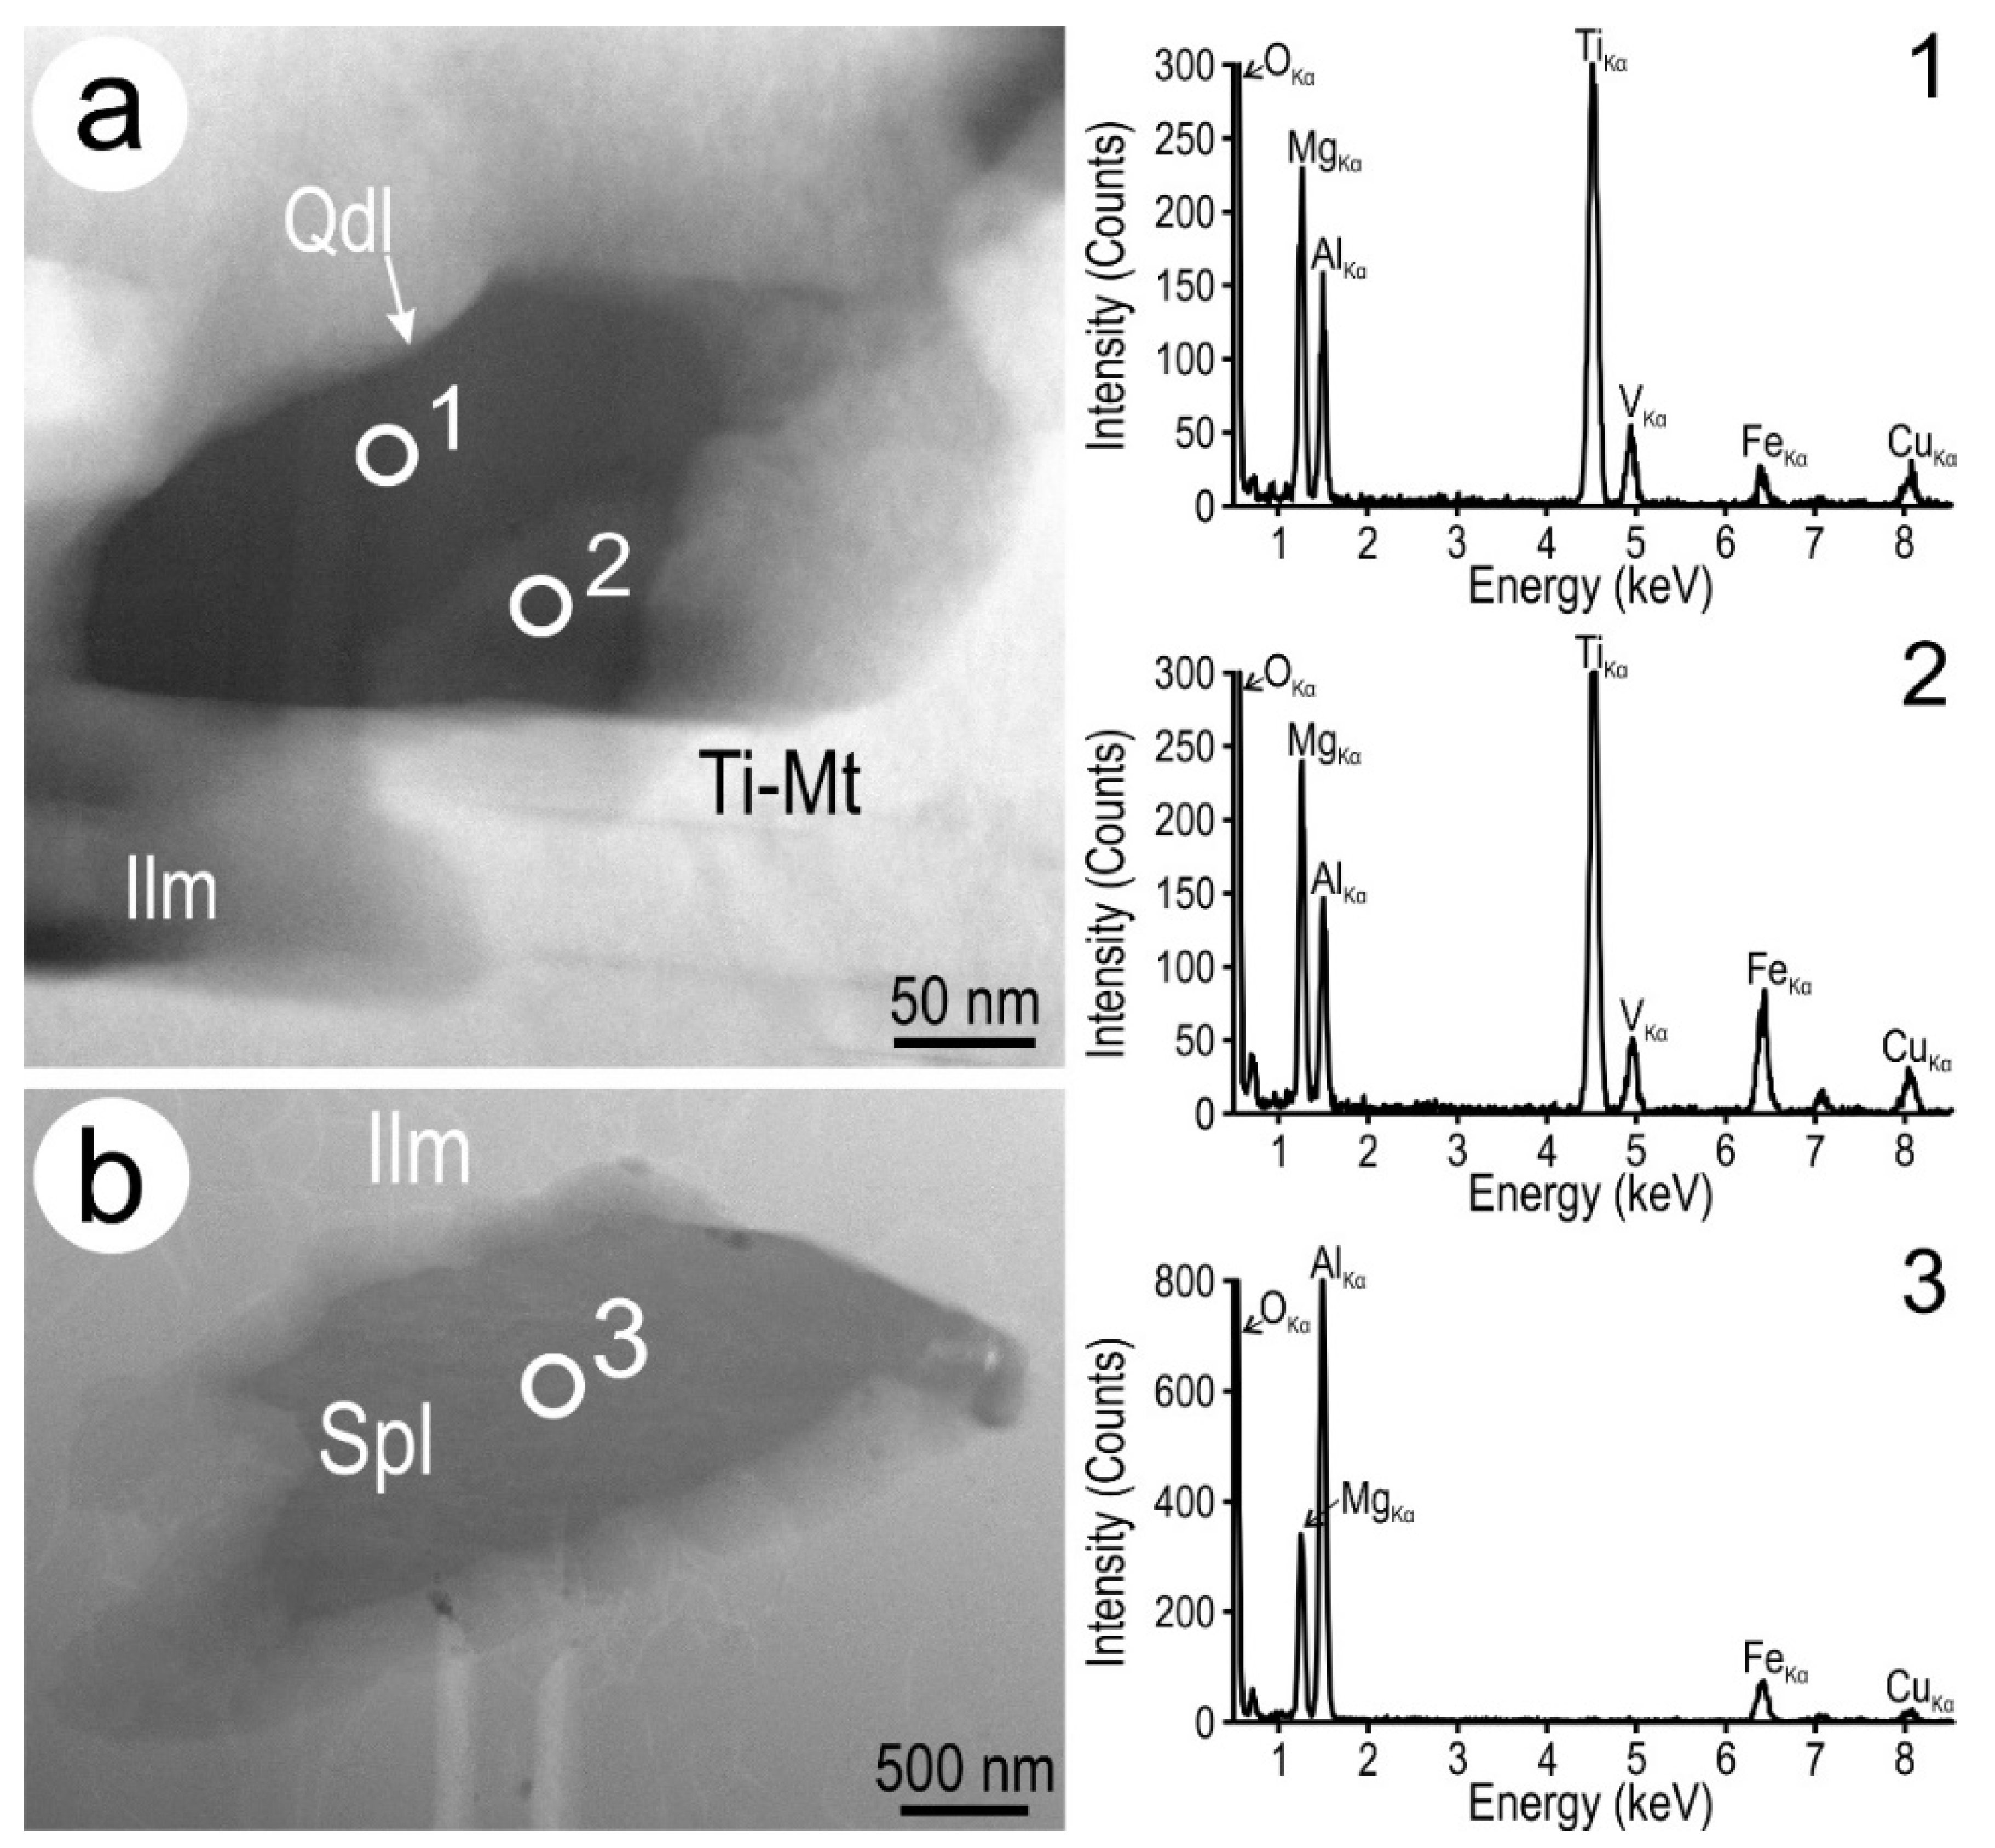
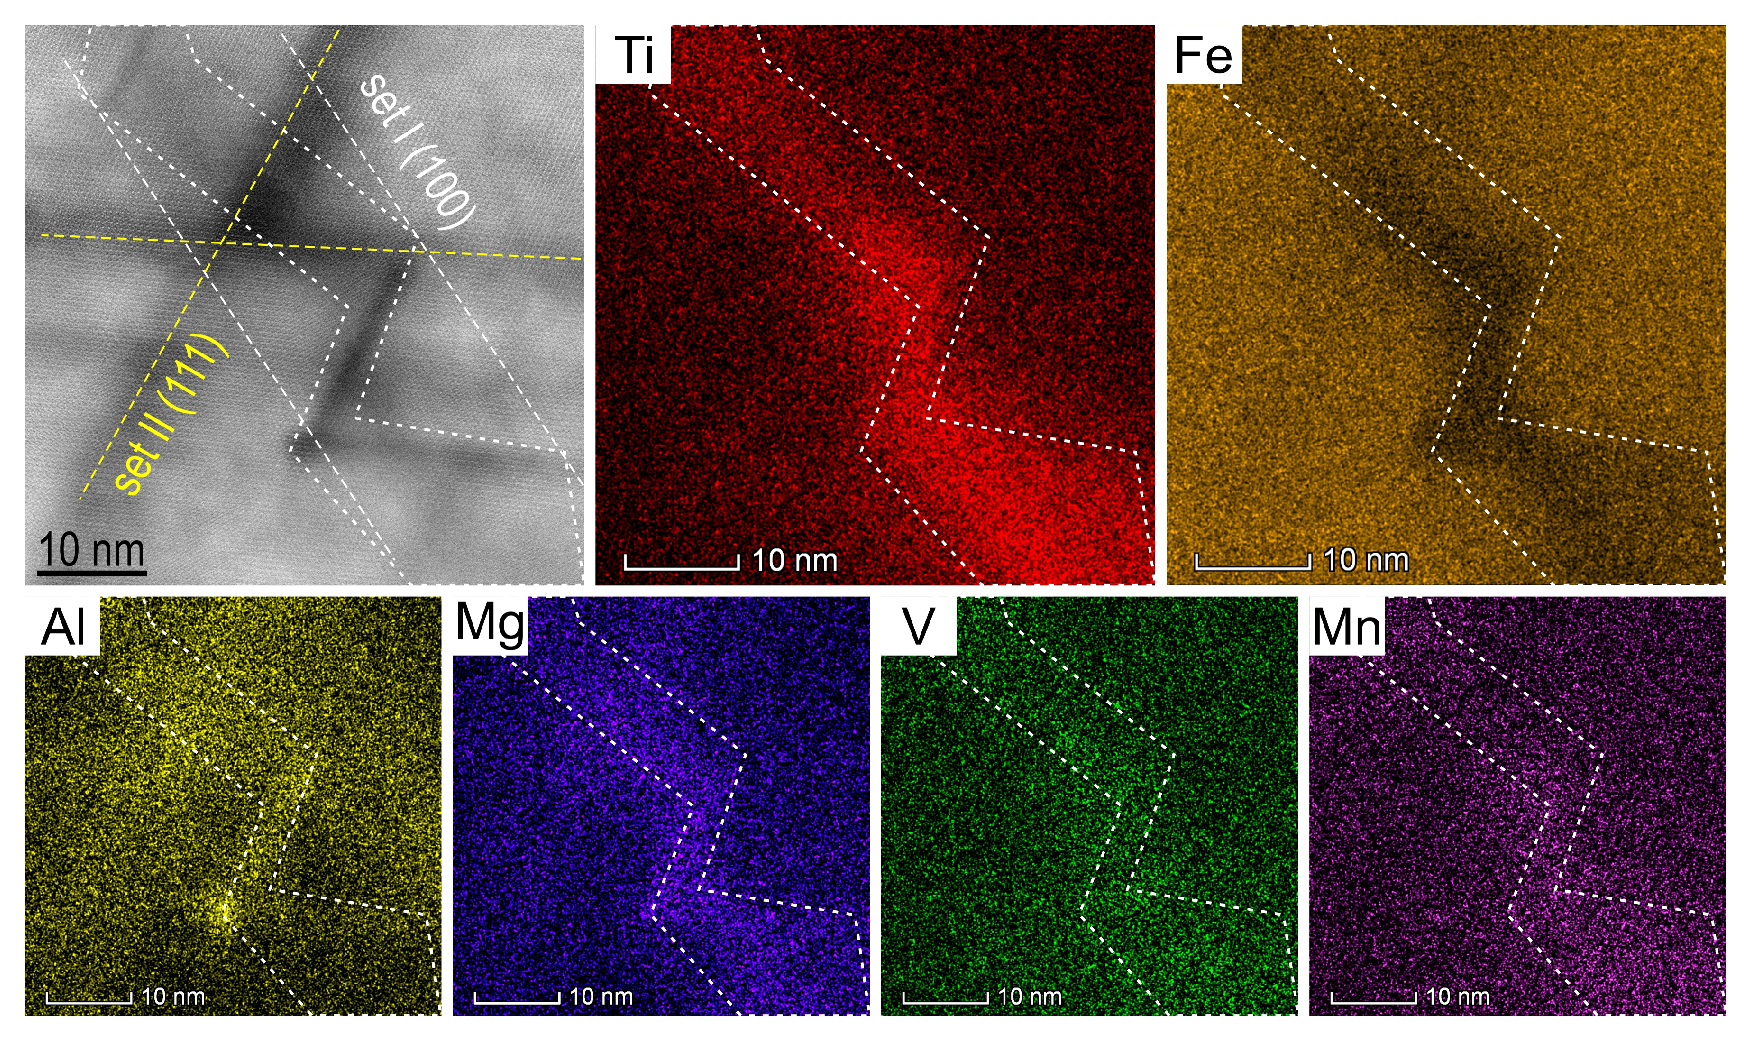
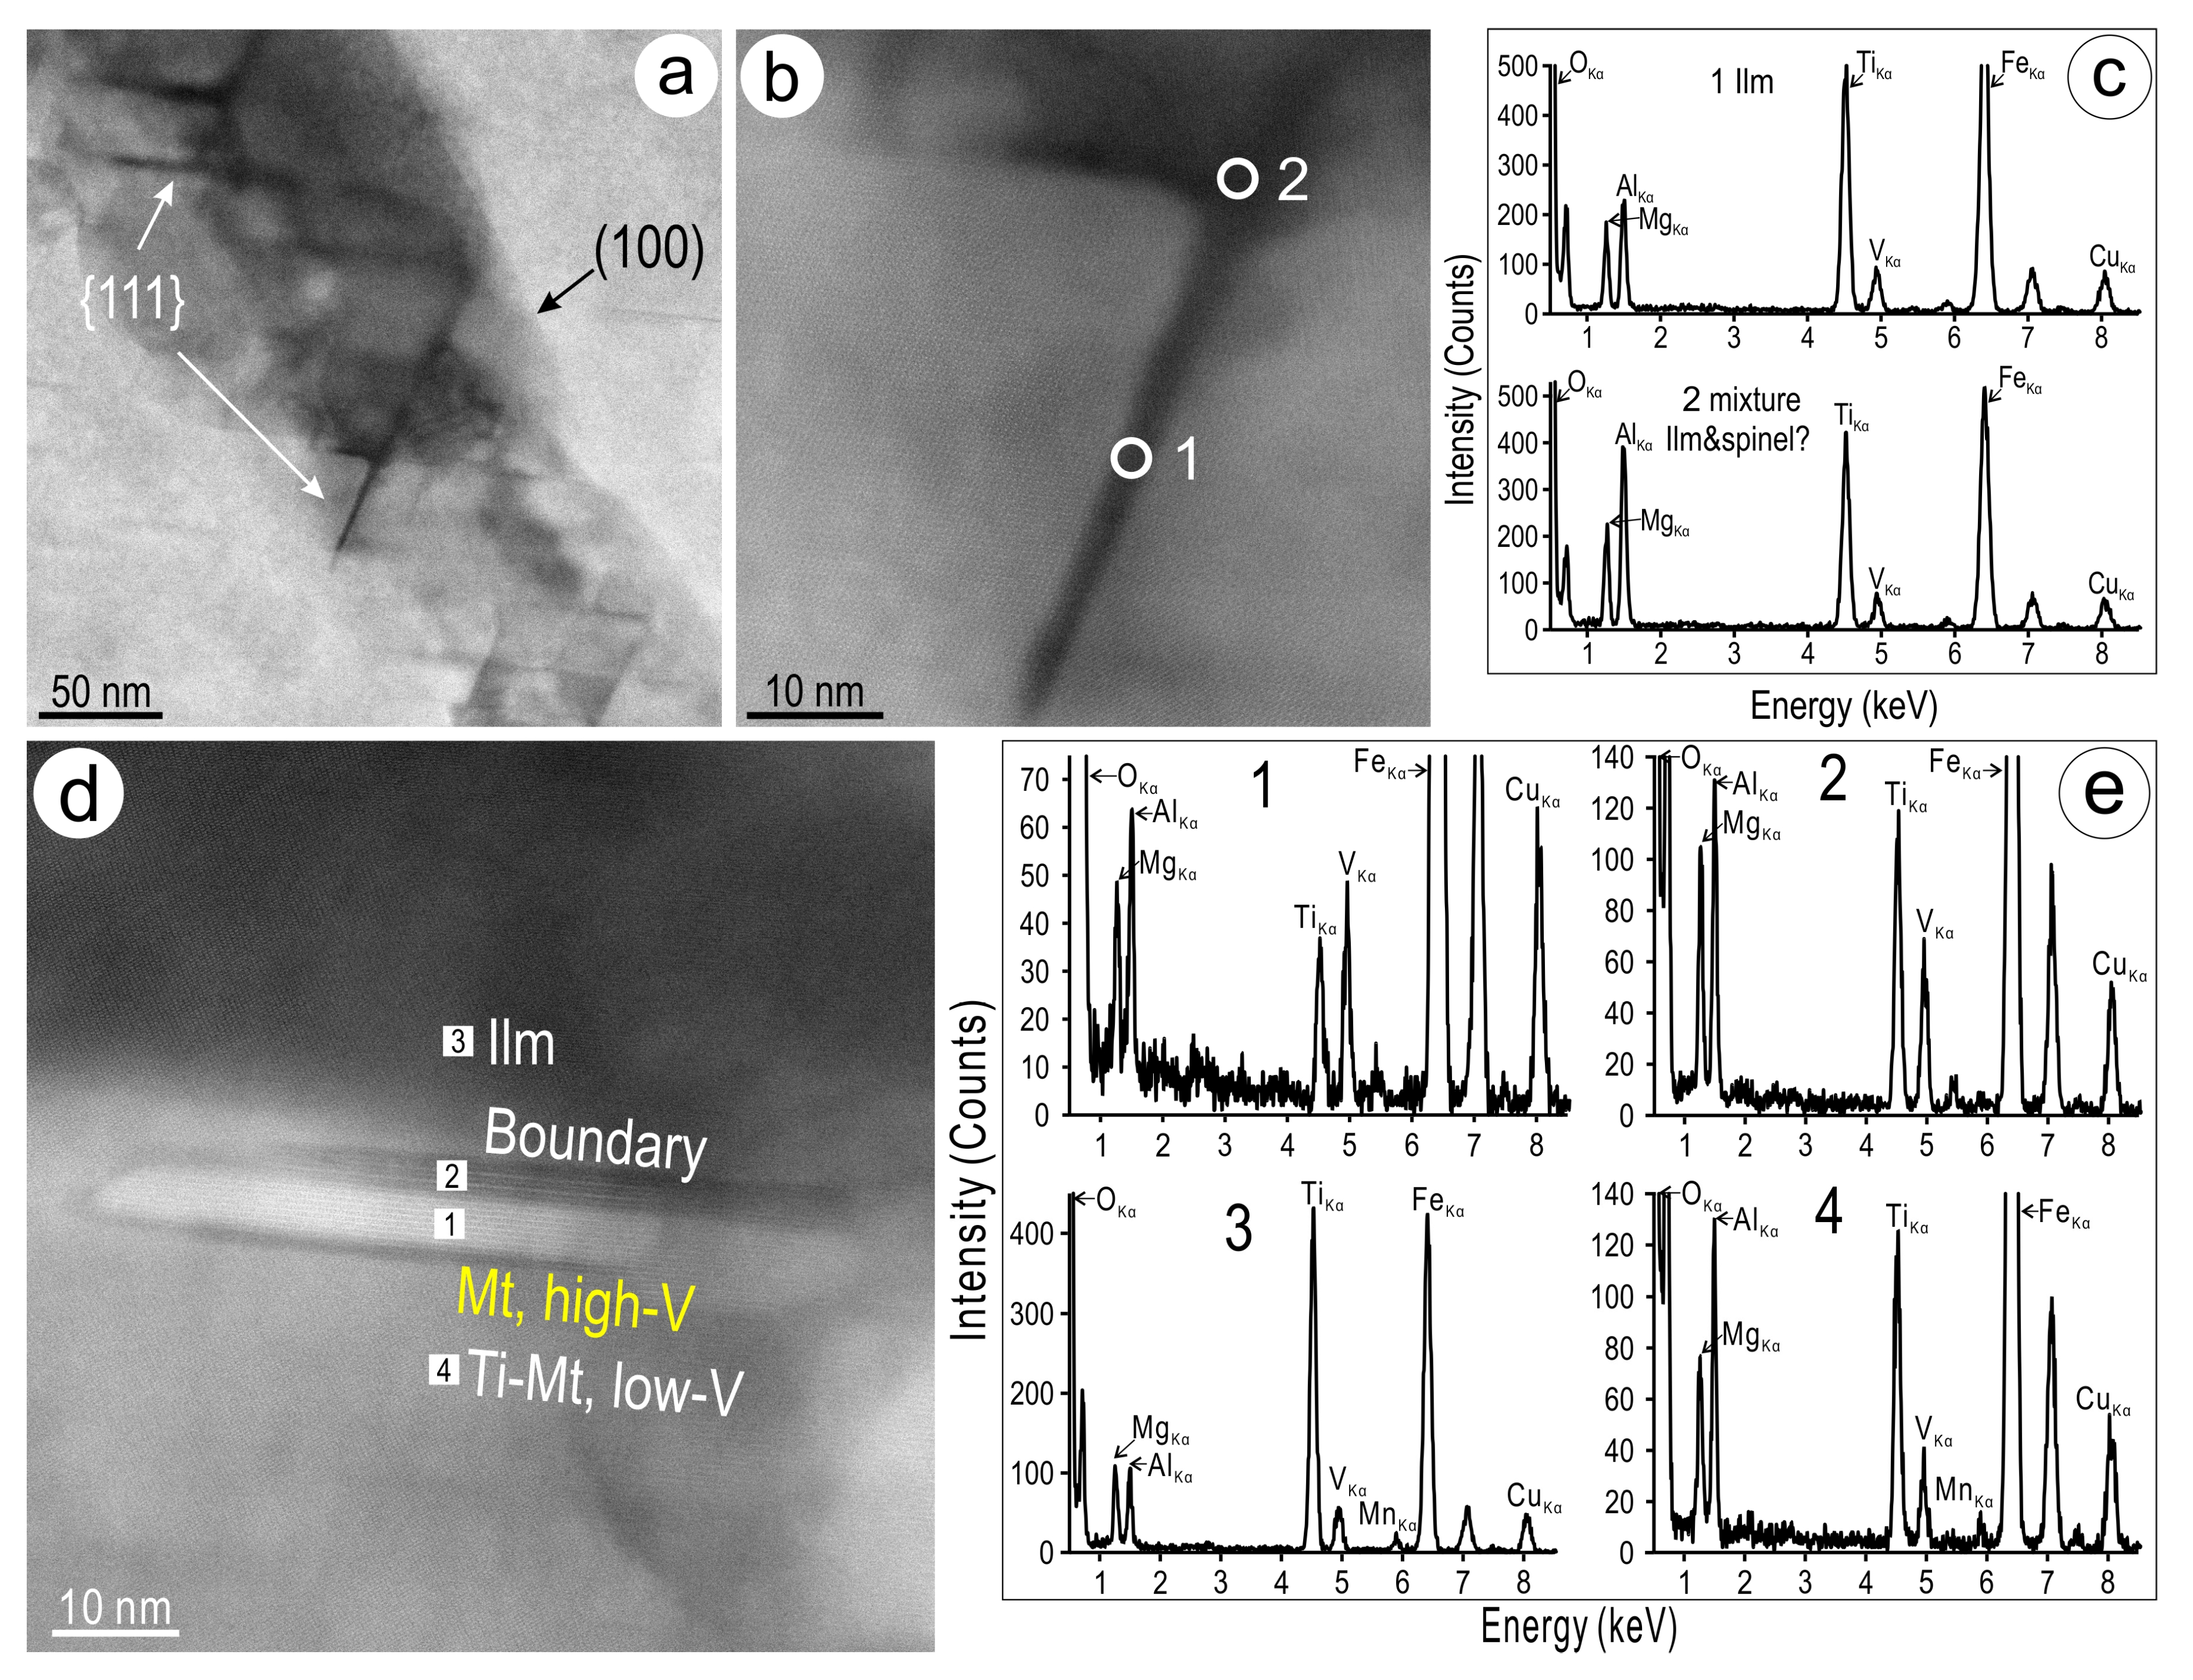
4.2.1. Phase Associations: Textures and Mineral Chemistry

The nanoscale study carried out on the thin foil extracted from across the grain boundary of the sub-rounded titanomagnetite to ilmenite shows that the same textures are present at depth, except that the inclusions display a {100} network (Figure 4c). These inclusions dissipate towards the edge of the grain. The coarsest relict spinel inclusions (up to several hundred nm) are irregular and enclosed within ilmenite, just outside the titanomagnetite. Some of these inclusions are, nonetheless, directly attached to the titanomagnetite margin.
Imaging of titanomagnetite across the foil shows changes in the inclusion patterns from the inner side to the margin of the grain (Figure 5a). At a lower resolution, these display well-defined rectangular patterns with spinel minerals nucleating at the junction of the {100} set of planes, which are marked by the presence of ilmenite (Figure 5b). In contrast, the margin shows a set of brighter bands corresponding to only one direction of the {100} planes (Figure 5c). Such bands have darker rims on the HAADF STEM images. A second set of inclusion planes perpendicular to the bands is also present close to the margin (Figure 5d). Nonetheless, these are very irregular in terms of width and length relative to the rectangular pattern in the inner part of the titanomagnetite. The latter features spinel inclusions distributed at the junction of crosscutting planes surrounded by irregular areas with ilmenite and a sub-type of titanomagnetite with a darker appearance (Ti-richer; see below) than the rest of the grain (Figure 5e–g). Such areas are also characterized by the presence of short, narrow lamellae that show the brightest intensity in the images (see below). The orientation of these lamellae is along {111} planes crosscutting the main rectangular {100} pattern. This second pattern of inclusions is also recognized in areas towards the margin of the titanomagnetite grain (Figure 5h–j). The {111} network crosscuts bands from the pre-existing {100} network and can extend beyond the latter or be constrained within a single band (Figure 5h,i). The same heterogeneity as in the rectangular patterns is also observed, albeit with well-defined narrow lamellae of darkest appearance underlining the {111} planes. In addition, such thin lamellae are also observed crosscutting smaller (20 nm wide) grains of a spinel mineral (Figure 5j).
Mapping of an area with rectangular patterns from the inner part of titanomagnetite (Figure 6a) shows the two sets of patterns in terms of major element components, i.e., O, Fe, Ti, Al, and Mg. The spinel minerals are depicted as well-defined blebs at the junction of the two {100} planes by the relative enrichment in Ti, Al, Mg, and O, and corresponding depletion in Fe. The maps for Ti and Al, and to a lesser extent also Mg, also show subsets of narrow lamellae. Tiny high-Al specks are observed along the arrays with spinel minerals. Titanium-rich lamella also forms distinct {111} subsets and the bleb-like morphology of some of the spinel minerals is skewed along the same directions. Trace elements such as V and Mn are enriched along the Ti-Al-rich subsets and around the bleb inclusions. Other trace elements presented on LA-ICP-MS maps in Figure 2 and Figure 3 are present at concentrations of tens to hundreds of ppm, well-below the detection limit of the STEM EDS detectors, and cannot be recognized on the STEM EDS maps and spectra.
EDS line profiles obtained across various direction on the map (Figure 6b–f) show the extremely high variation in Ti, one of the main components present in the species. Positive correlations between Ti and both V and Mn are observed along the line profile taken across the subset of Ti-Al-richer lamellae (Figure 6b–f). Line profiles across the blebs show, somewhat surprisingly, a much greater variation than expected, particularly the presence of qandilite (TiMg2O4; see below) and magnesioferrite (MgFe2O4), in addition to pleonaste or spinel sensu stricto (MgAl2O4; Figure 6c–f). The Ti-bearing spinel qandilite is actually the dominant species among the spinel mineral inclusions (Figure 6f).
The identity of these species was also checked by STEM EDS spectra obtained from the mapped area (Figure 7). The spectra show the presence of all three spinel species, albeit with higher Fe content than expected, most likely due to the underlying titanomagnetite and limited thickness of the blebs. Interestingly, qandilite also contains Al, but this element is not present in magnesioferrite. The bright lamellae show titanomagnetite but with higher V content than host titanomagnetite (spots 4 and 5 in Figure 7). The Al-rich specks on the map (shown in Figure 6a), although too small to be analyzed individually, may be considered as hercynite (FeAl2O4). Individual spectra obtained from blebs from the inner part of titanomagnetite (areas shown in Figure 5e,f) confirm that qandilite is dominant (Supplementary Materials Figure S4). Some of the larger grains of qandilite display zoning with respect to Fe content, whereas the much larger grains within ilmenite, outside the titanomagnetite grain, have a composition close to endmember spinel (Figure 8).
Compositional variation within the two sets of patterns at the edge of titanomagnetite (shown in Figure 5h) is represented by relative enrichment in Ti, Al, Mg, V, and Mn, and corresponding depletion in Fe (Figure 9). The {111} lamellar sets extend across one of the {100} bands. The crosscutting relationships are expressed on Al and Mg maps, whereas Ti shows stronger enrichment along the {100} band. This indicates that the crosscutting {111} lamellae are composed of assemblages with a second generation of ilmenite + Ti-Mg-(Al)-spinels (Figure 10a–c). The spectra show that the compositions of some lamellae correspond to ilmenite, whereas domains at the junctions between two lamellae sets indicate Fe-Ti-Mg-(Al)-bearing composition (Figure 10b,c). The identity of the species within this assemblage is addressed by high-resolution imaging in the next section, and this explains the mixture of phases shown in some of the EDS spectra. Spot analysis taken across a line from titanomagnetite to ilmenite show the thin, bright lamella of magnetite with the strongest enrichment in V relative to higher-Ti magnetite and ilmenite (Figure 10d,e).

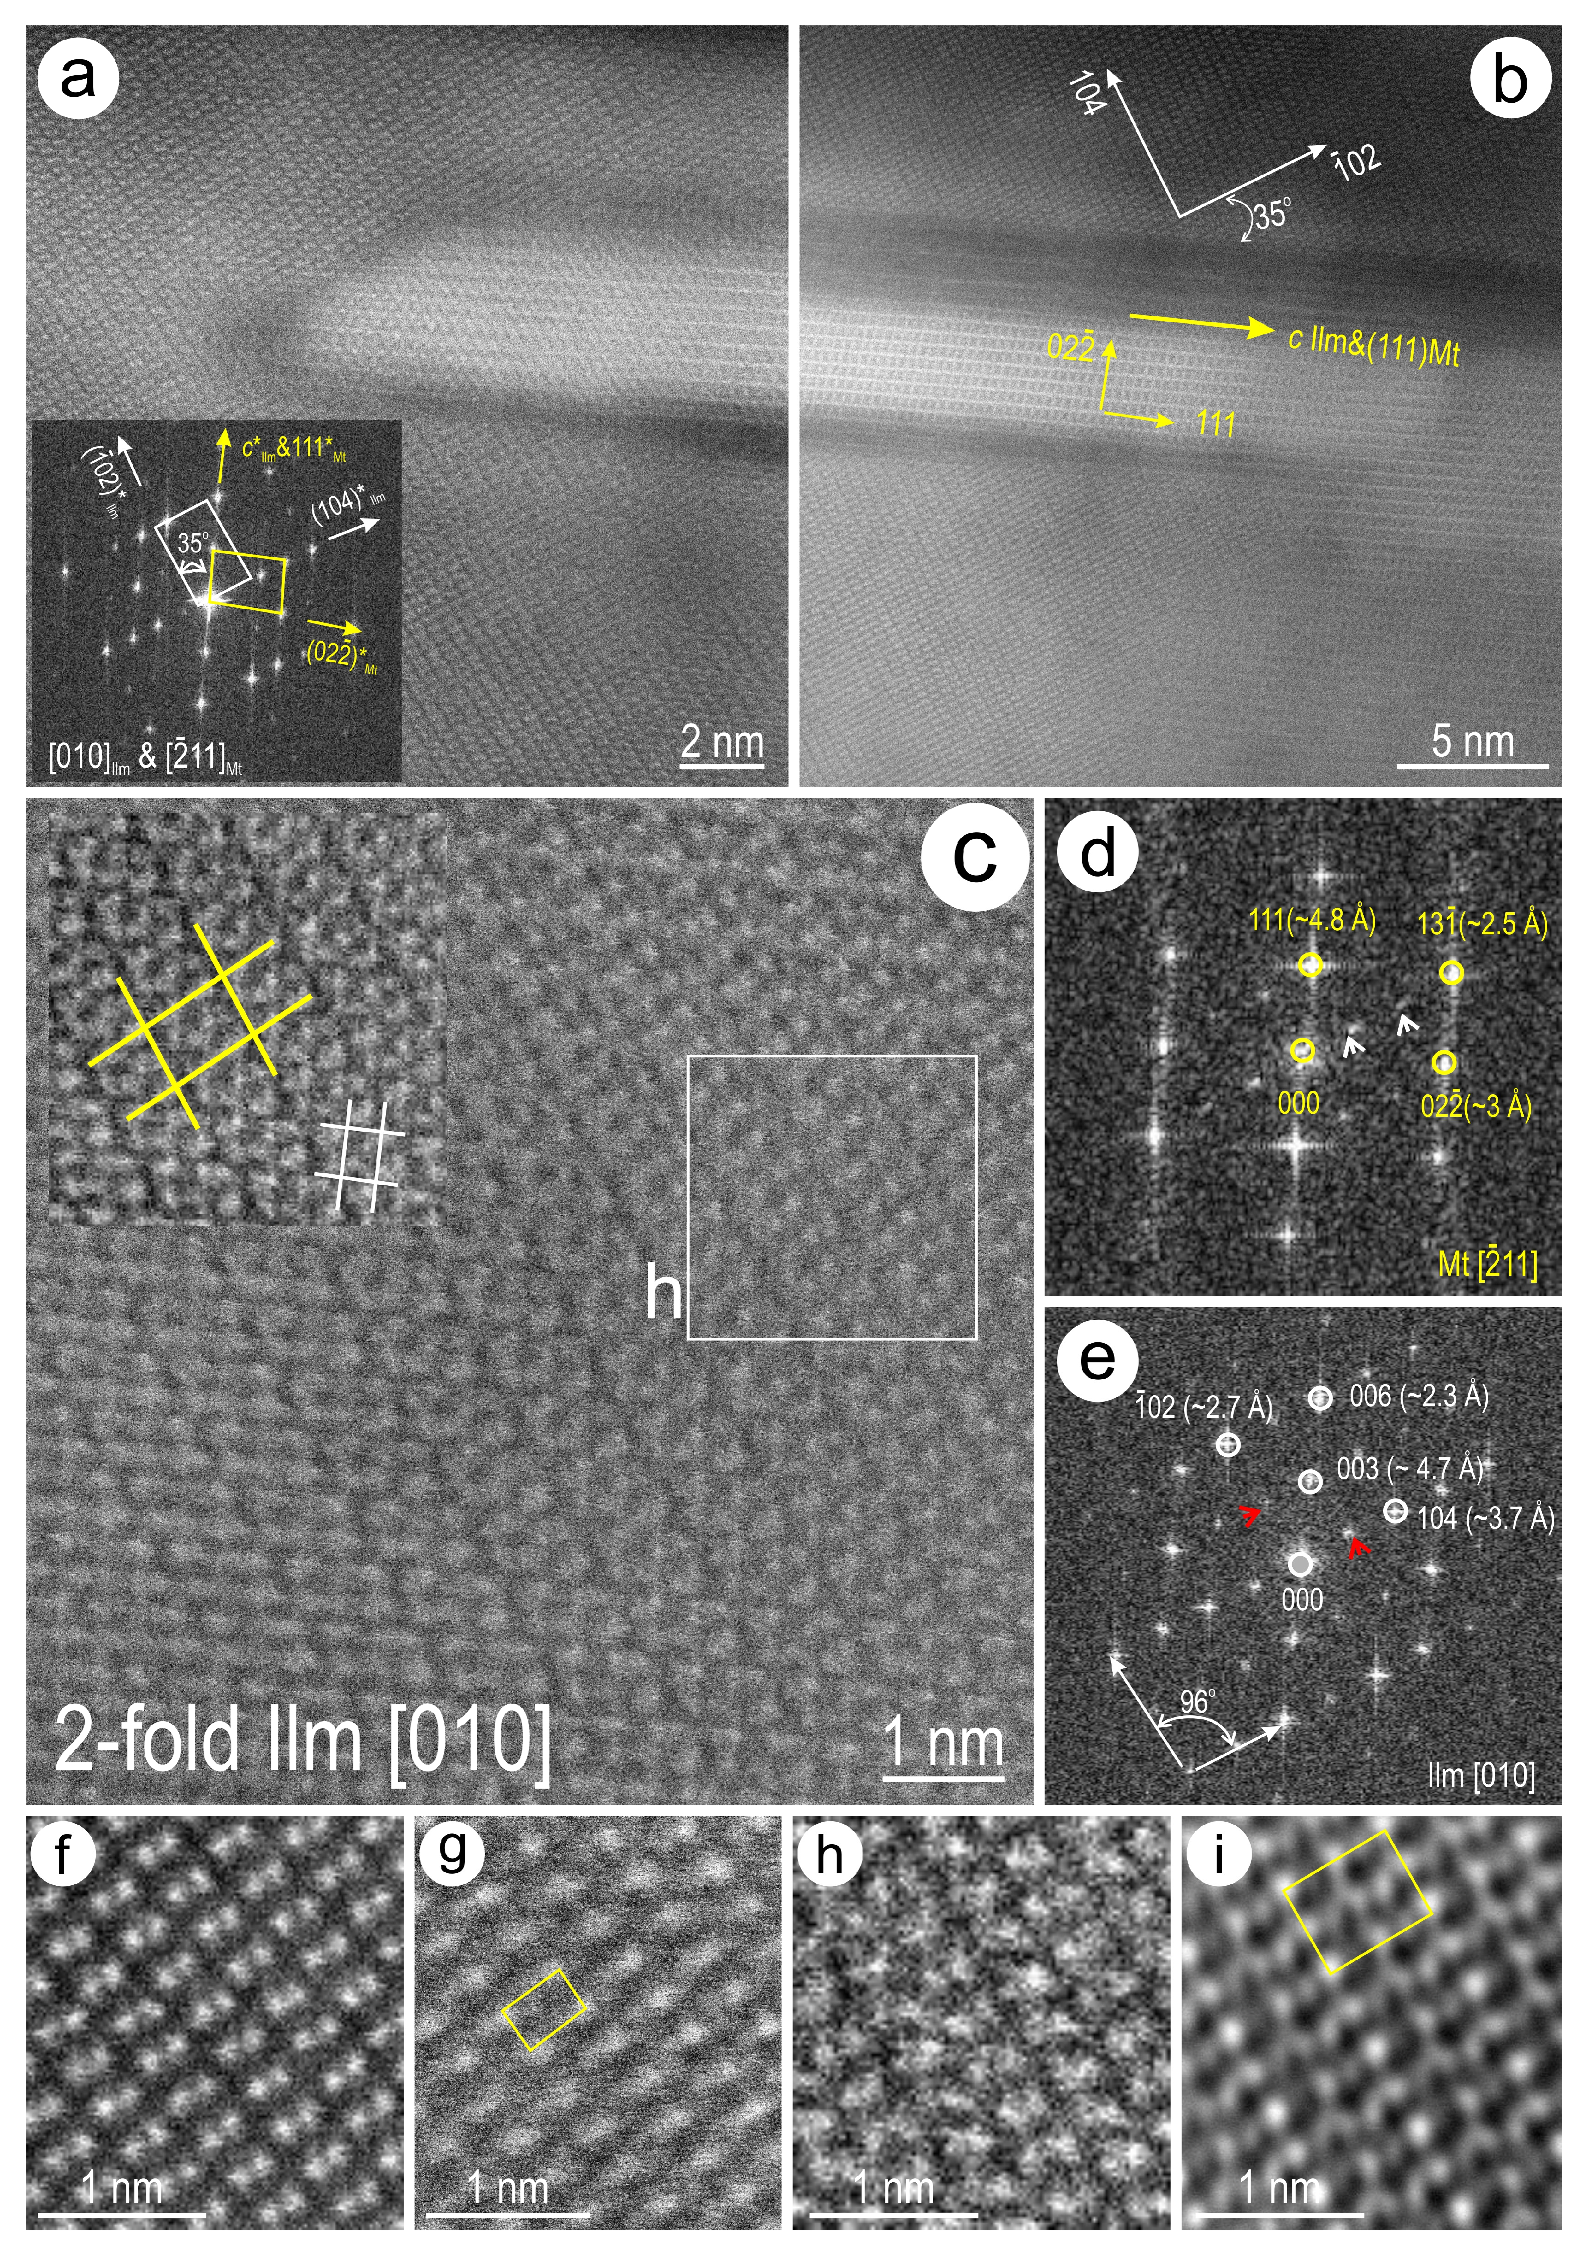
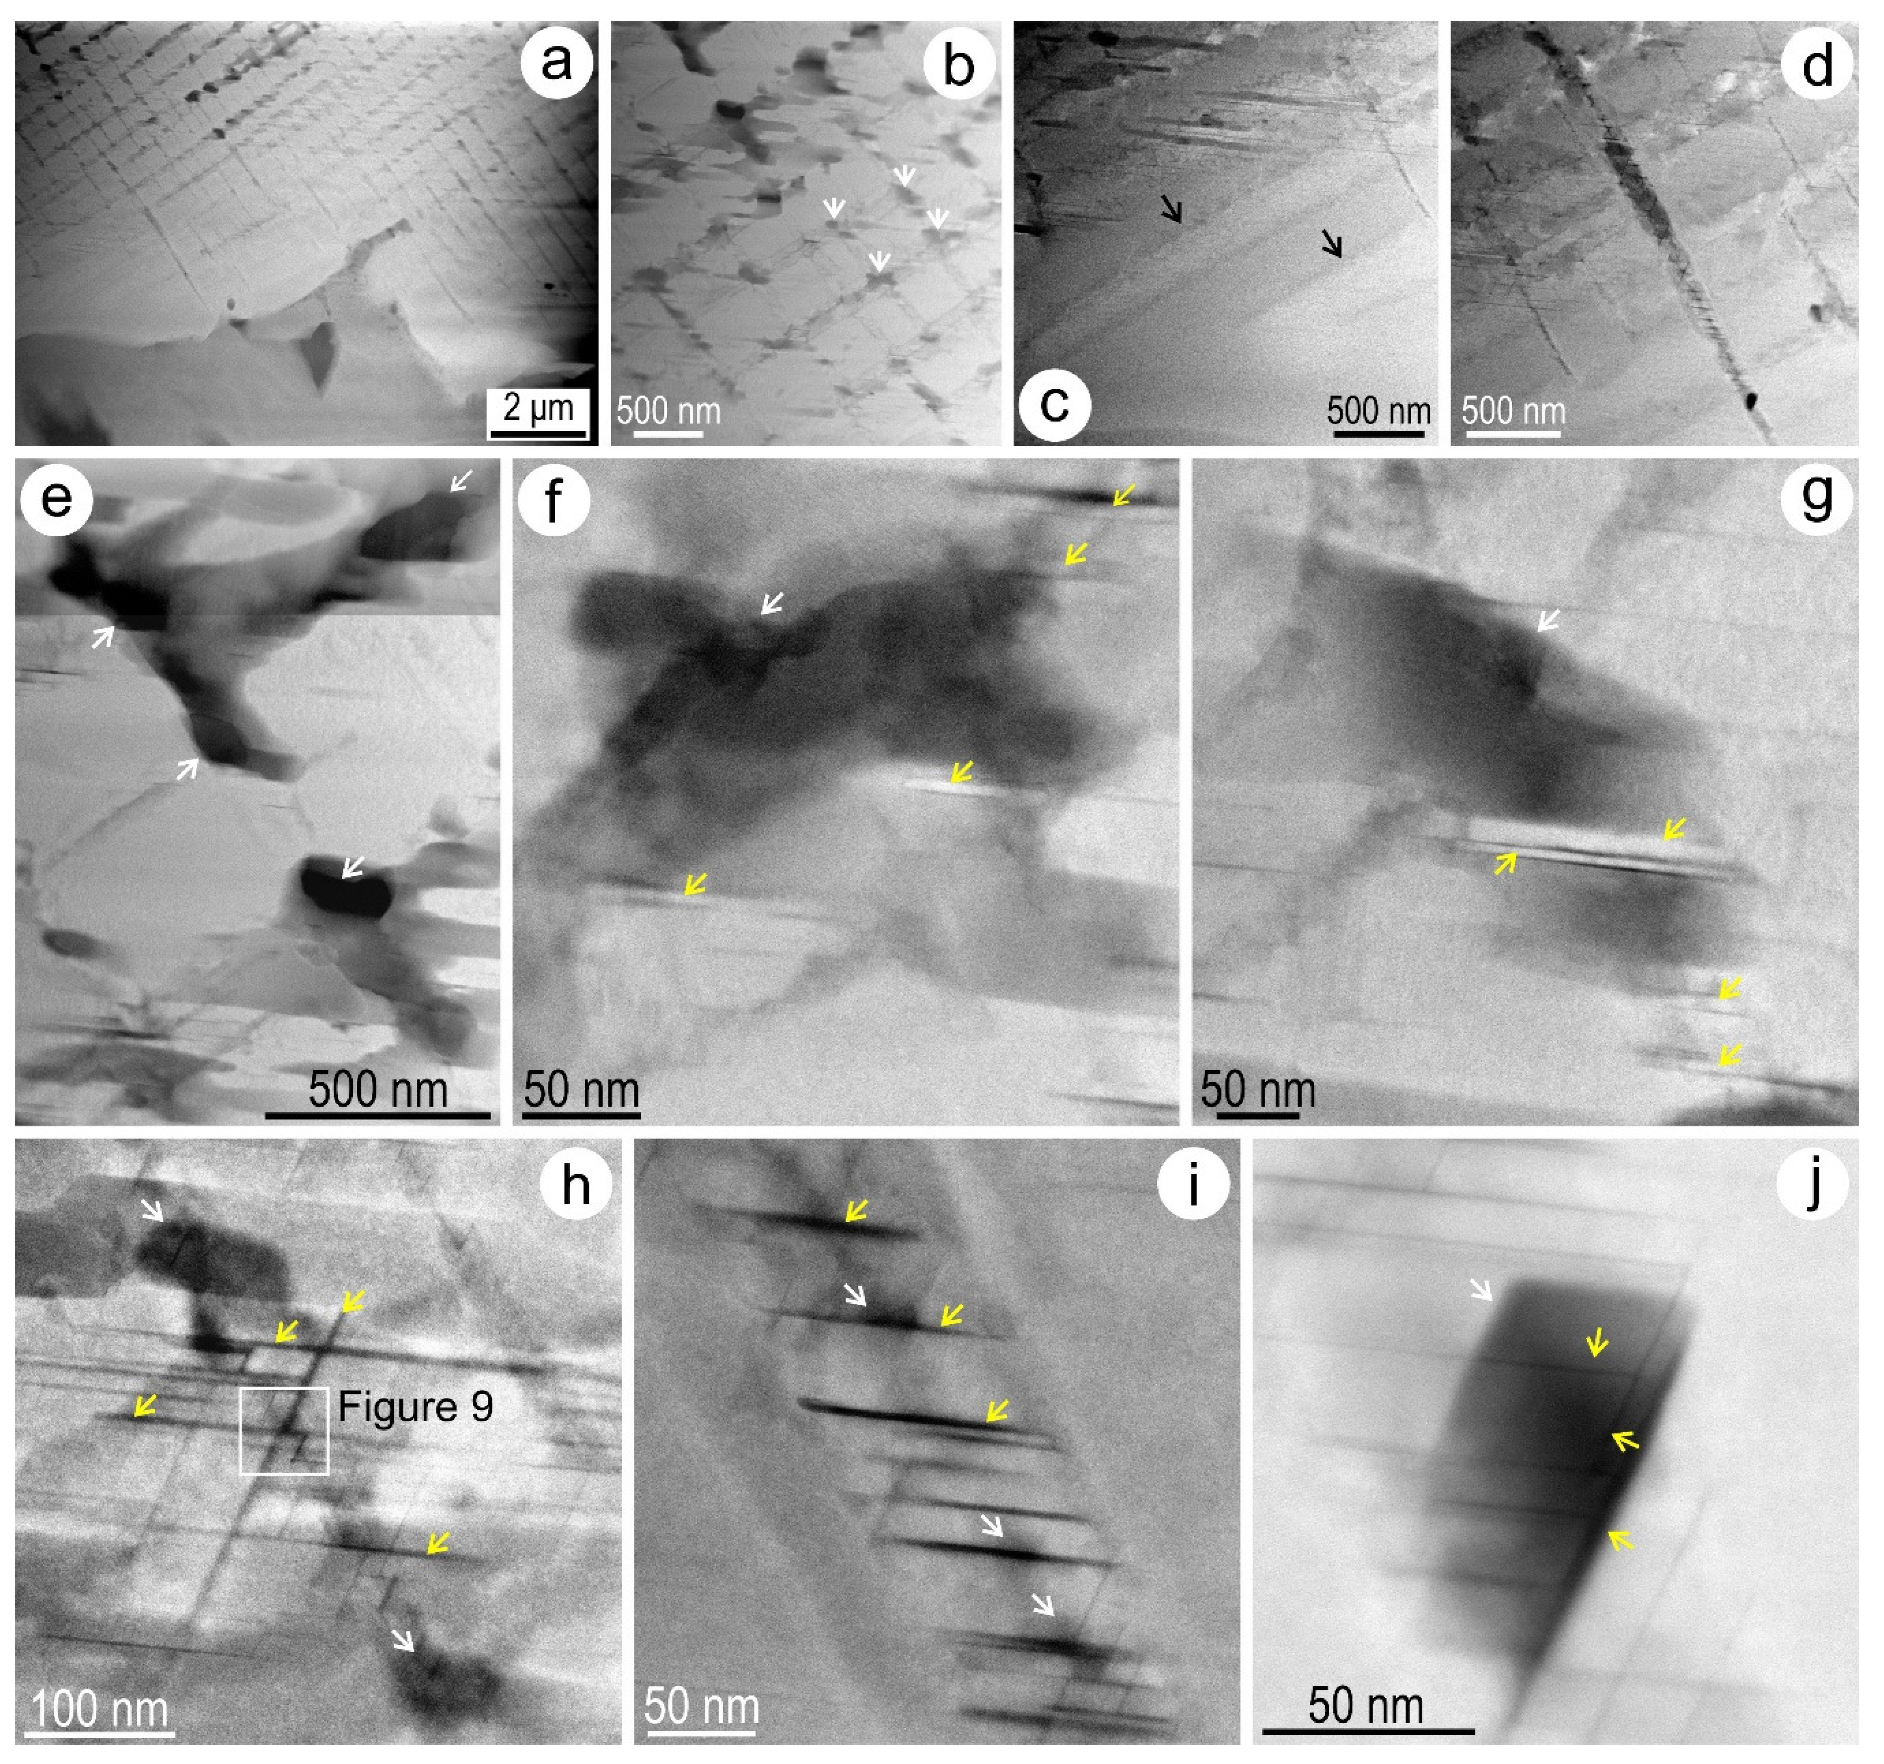
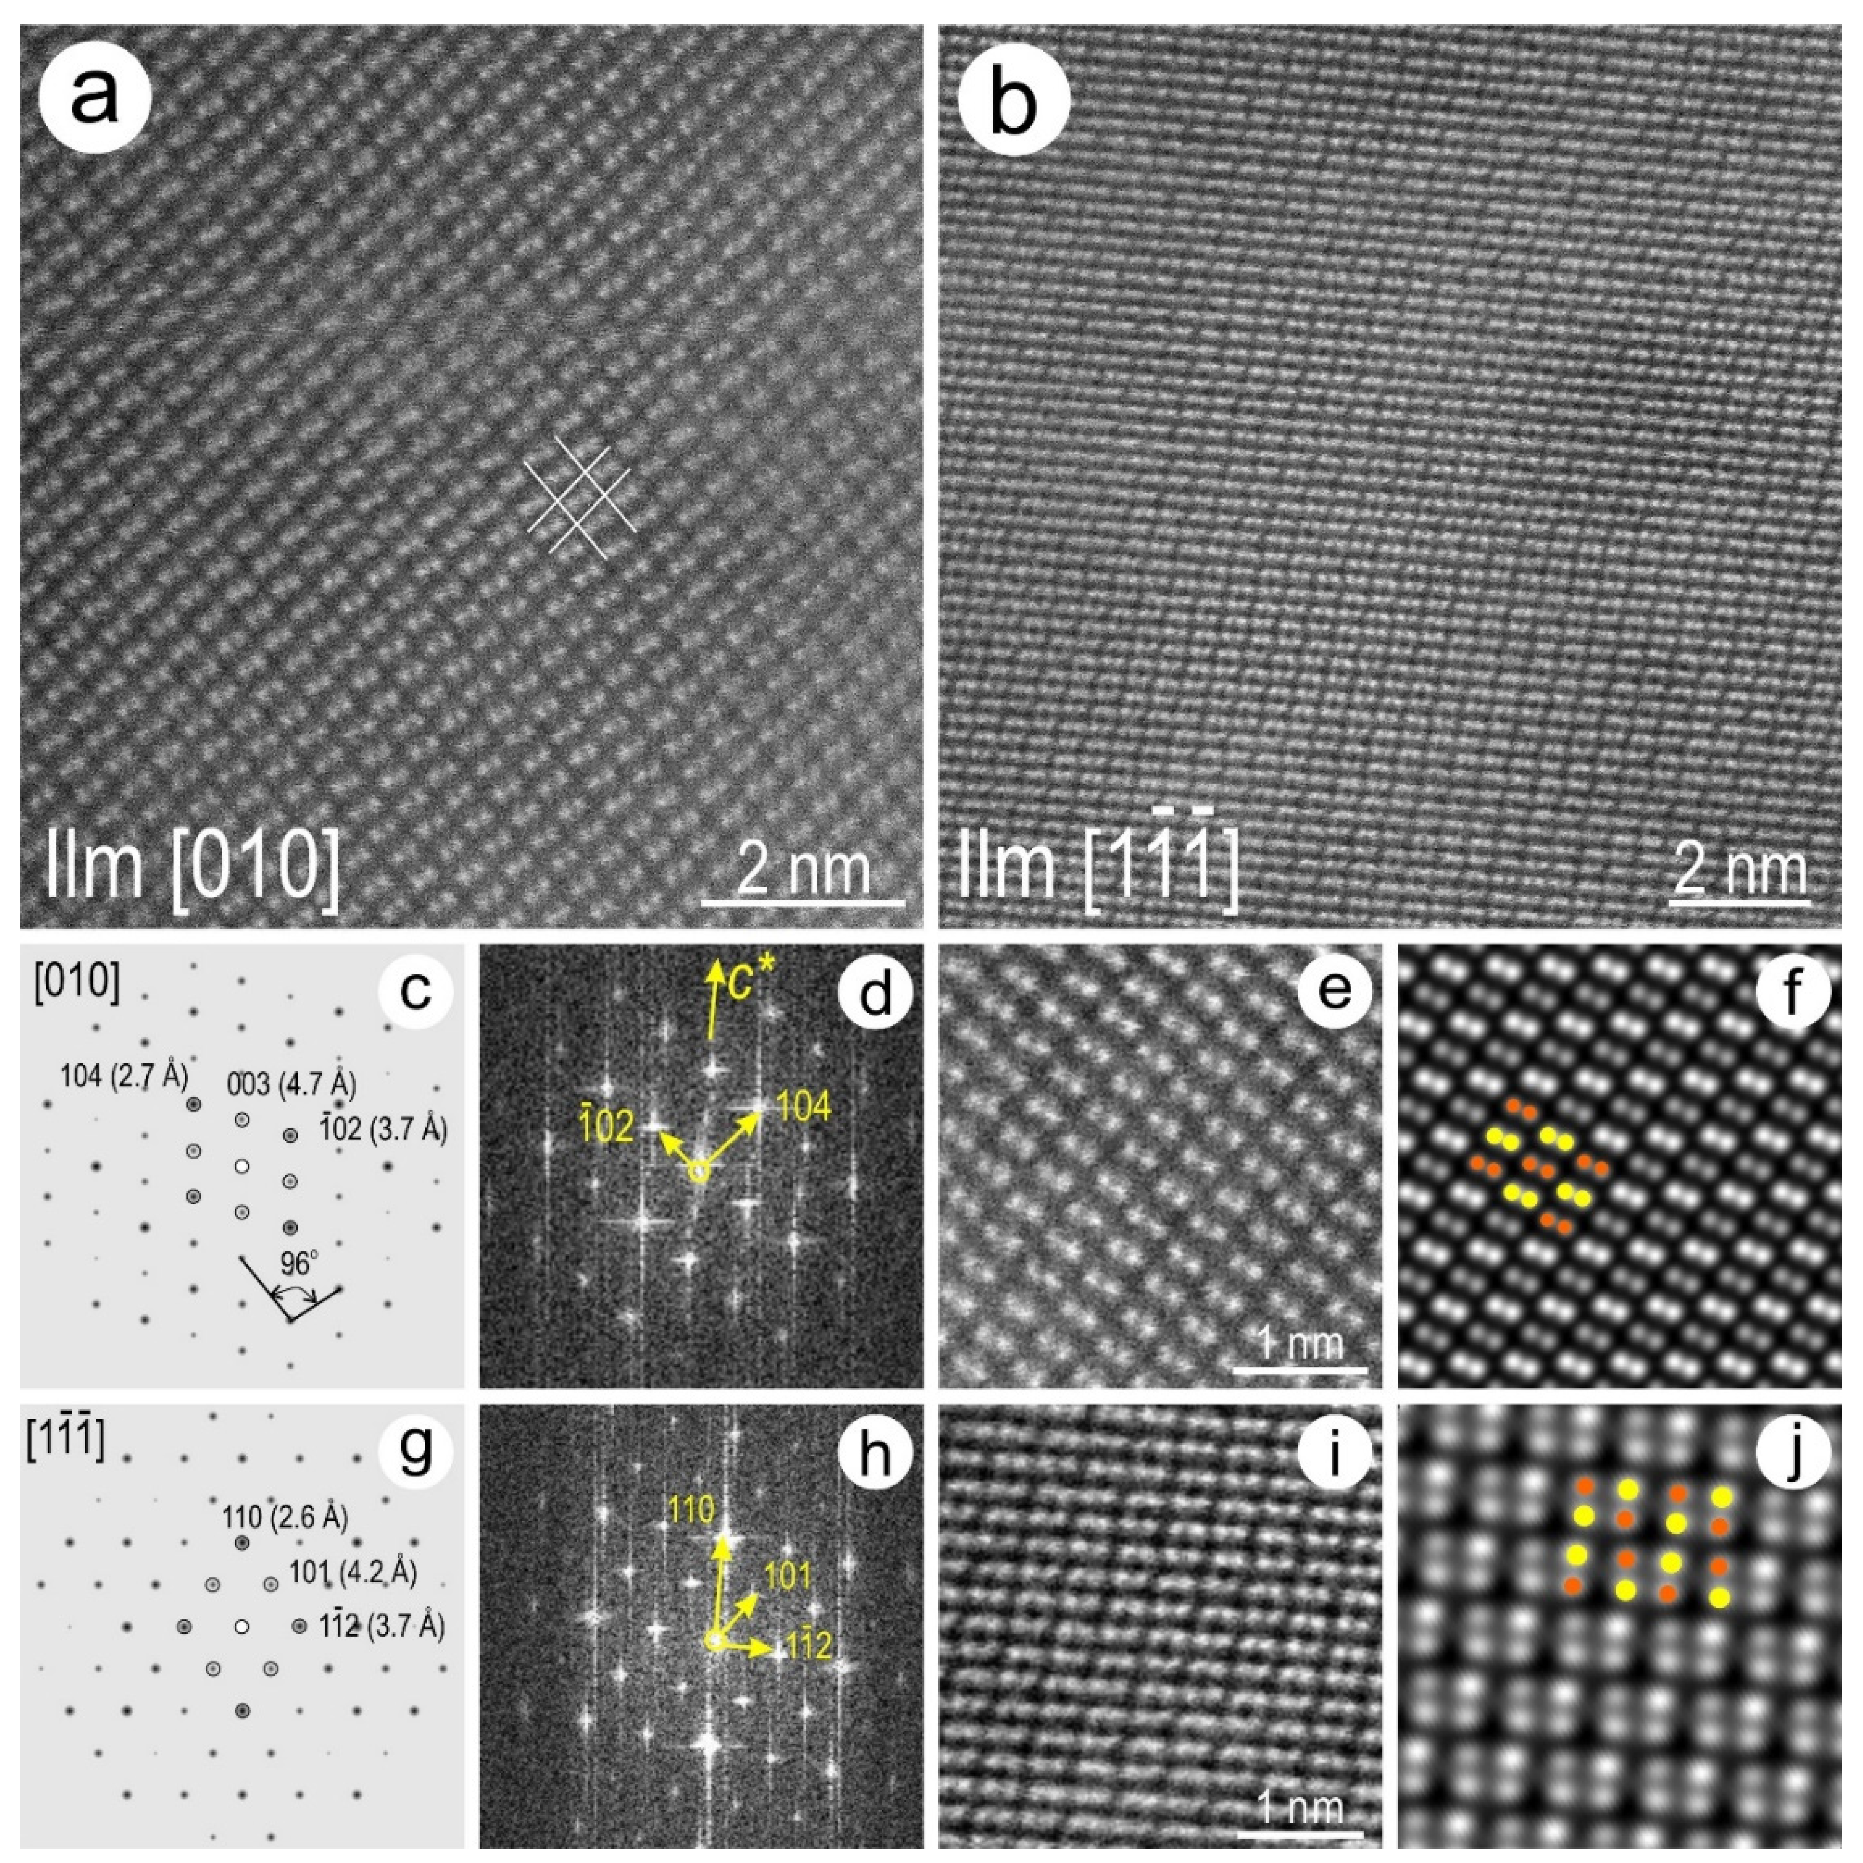
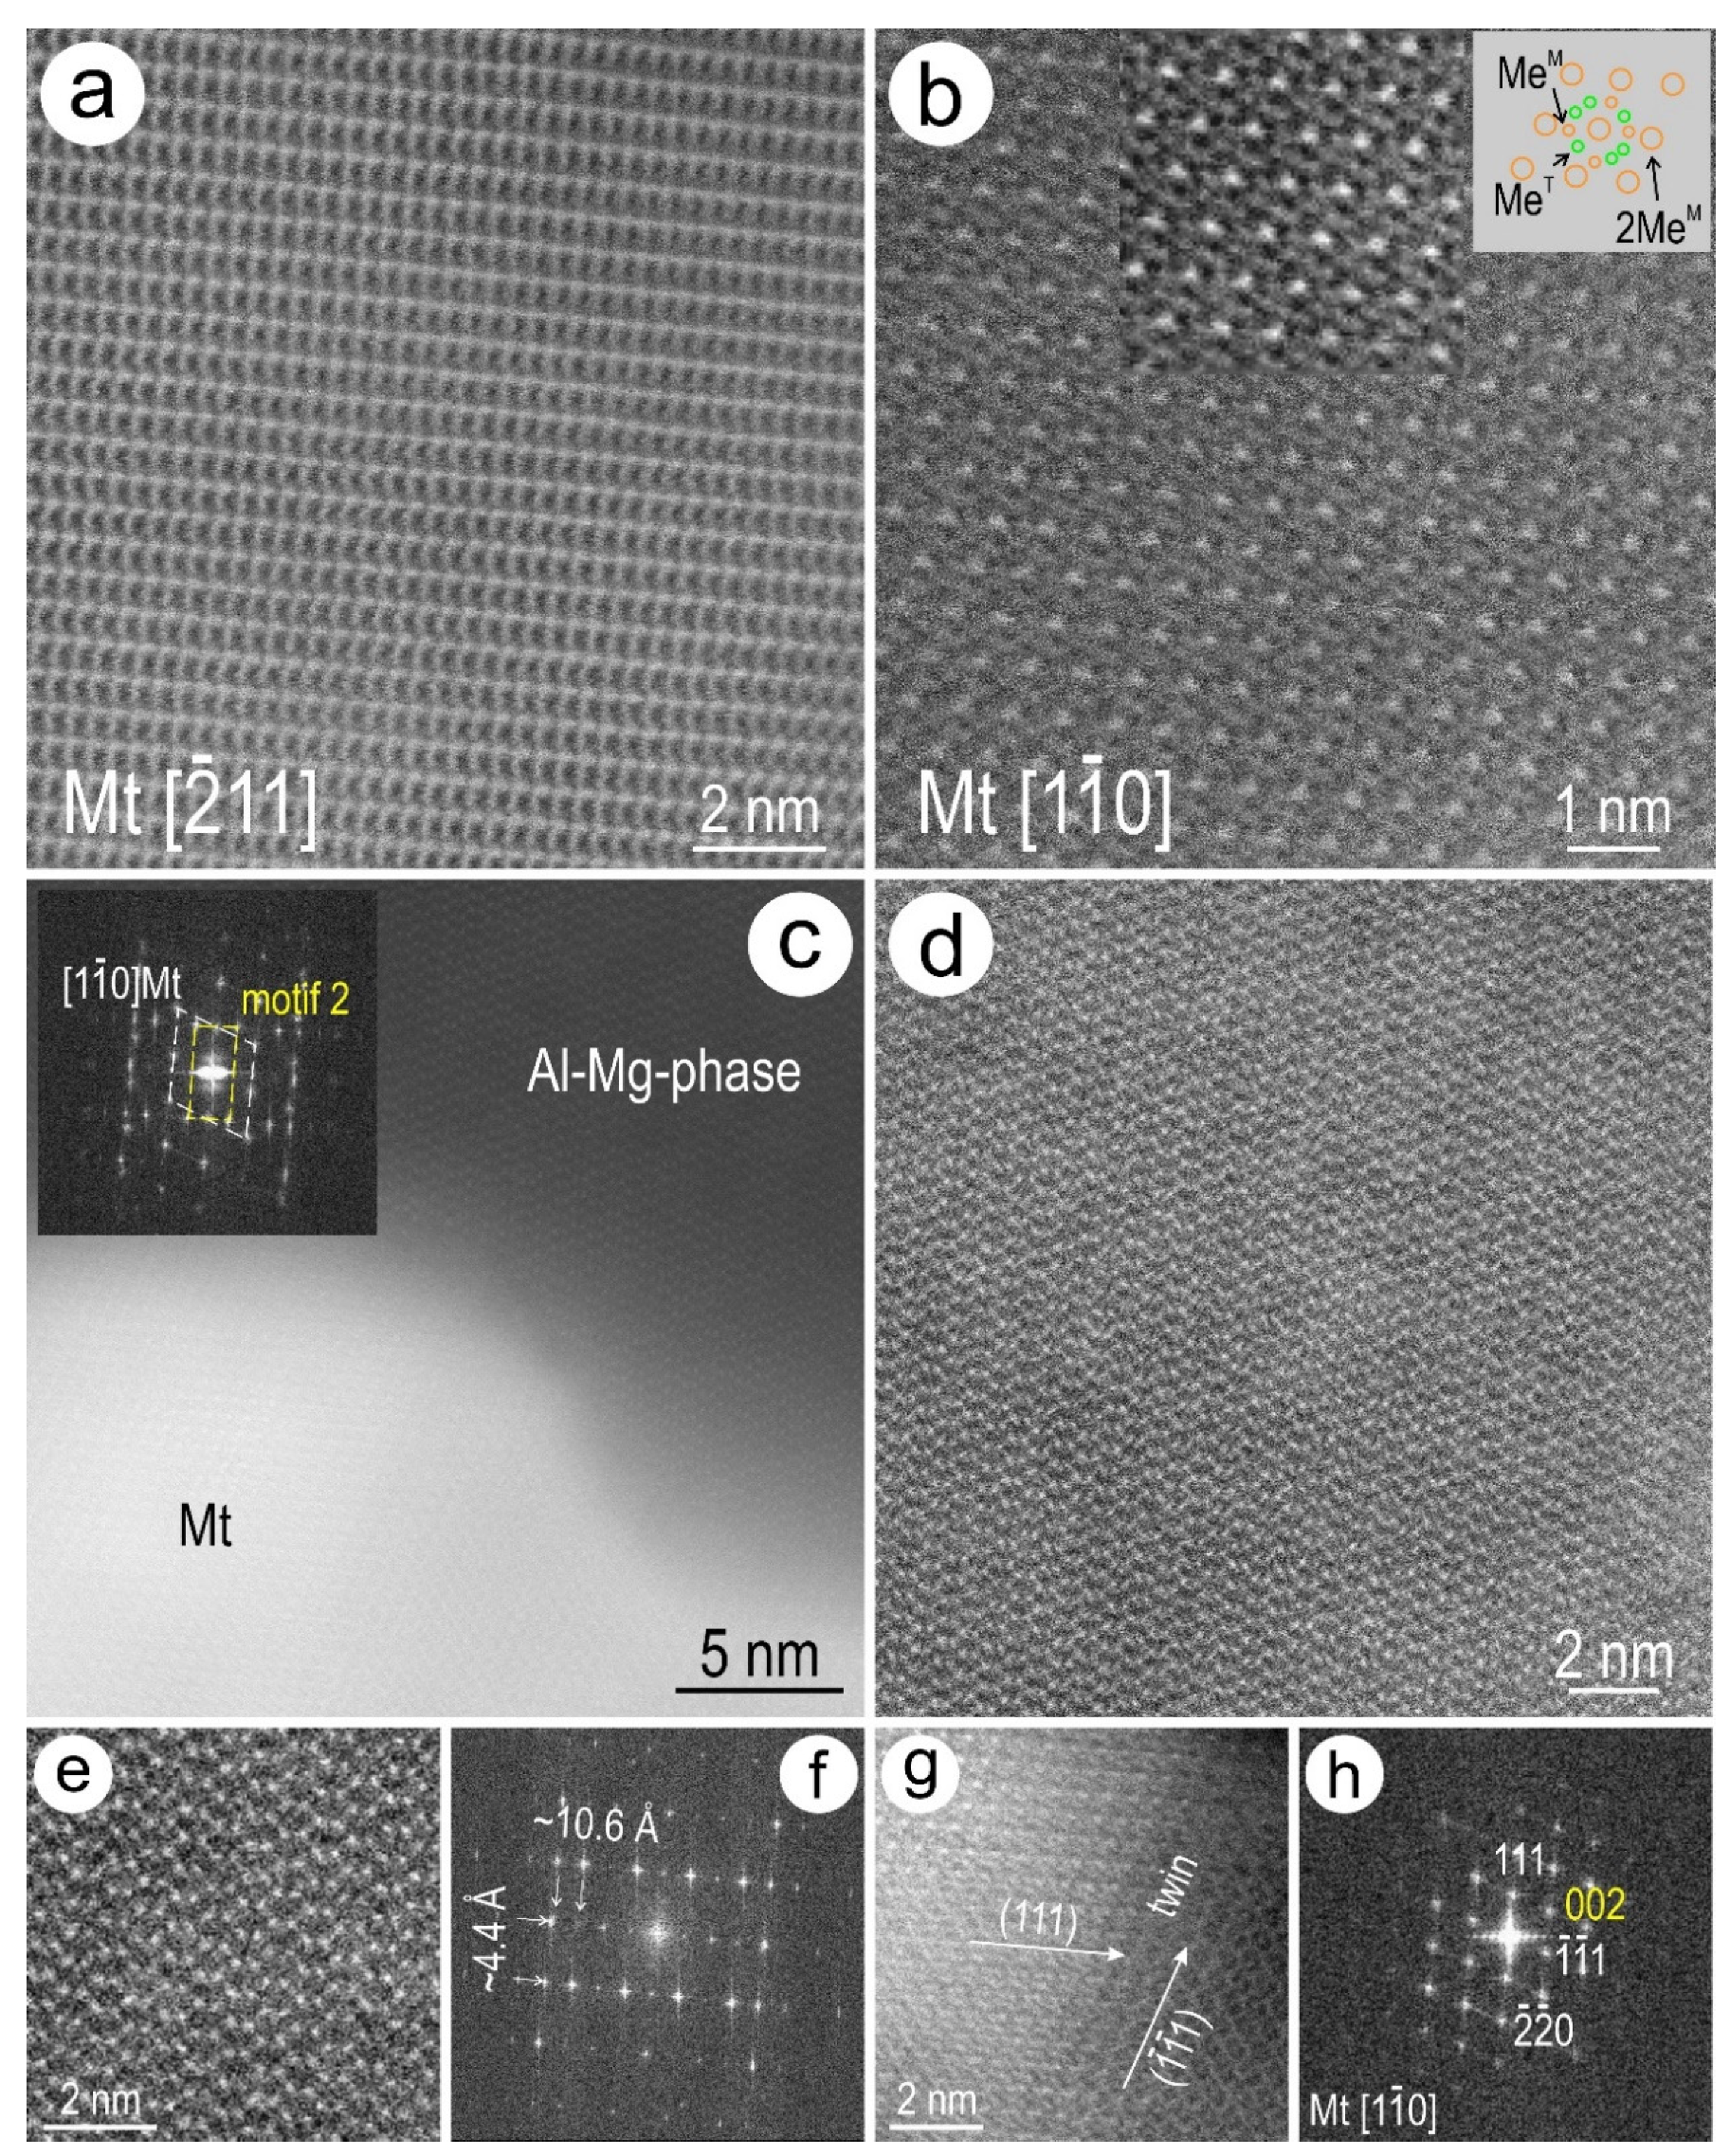
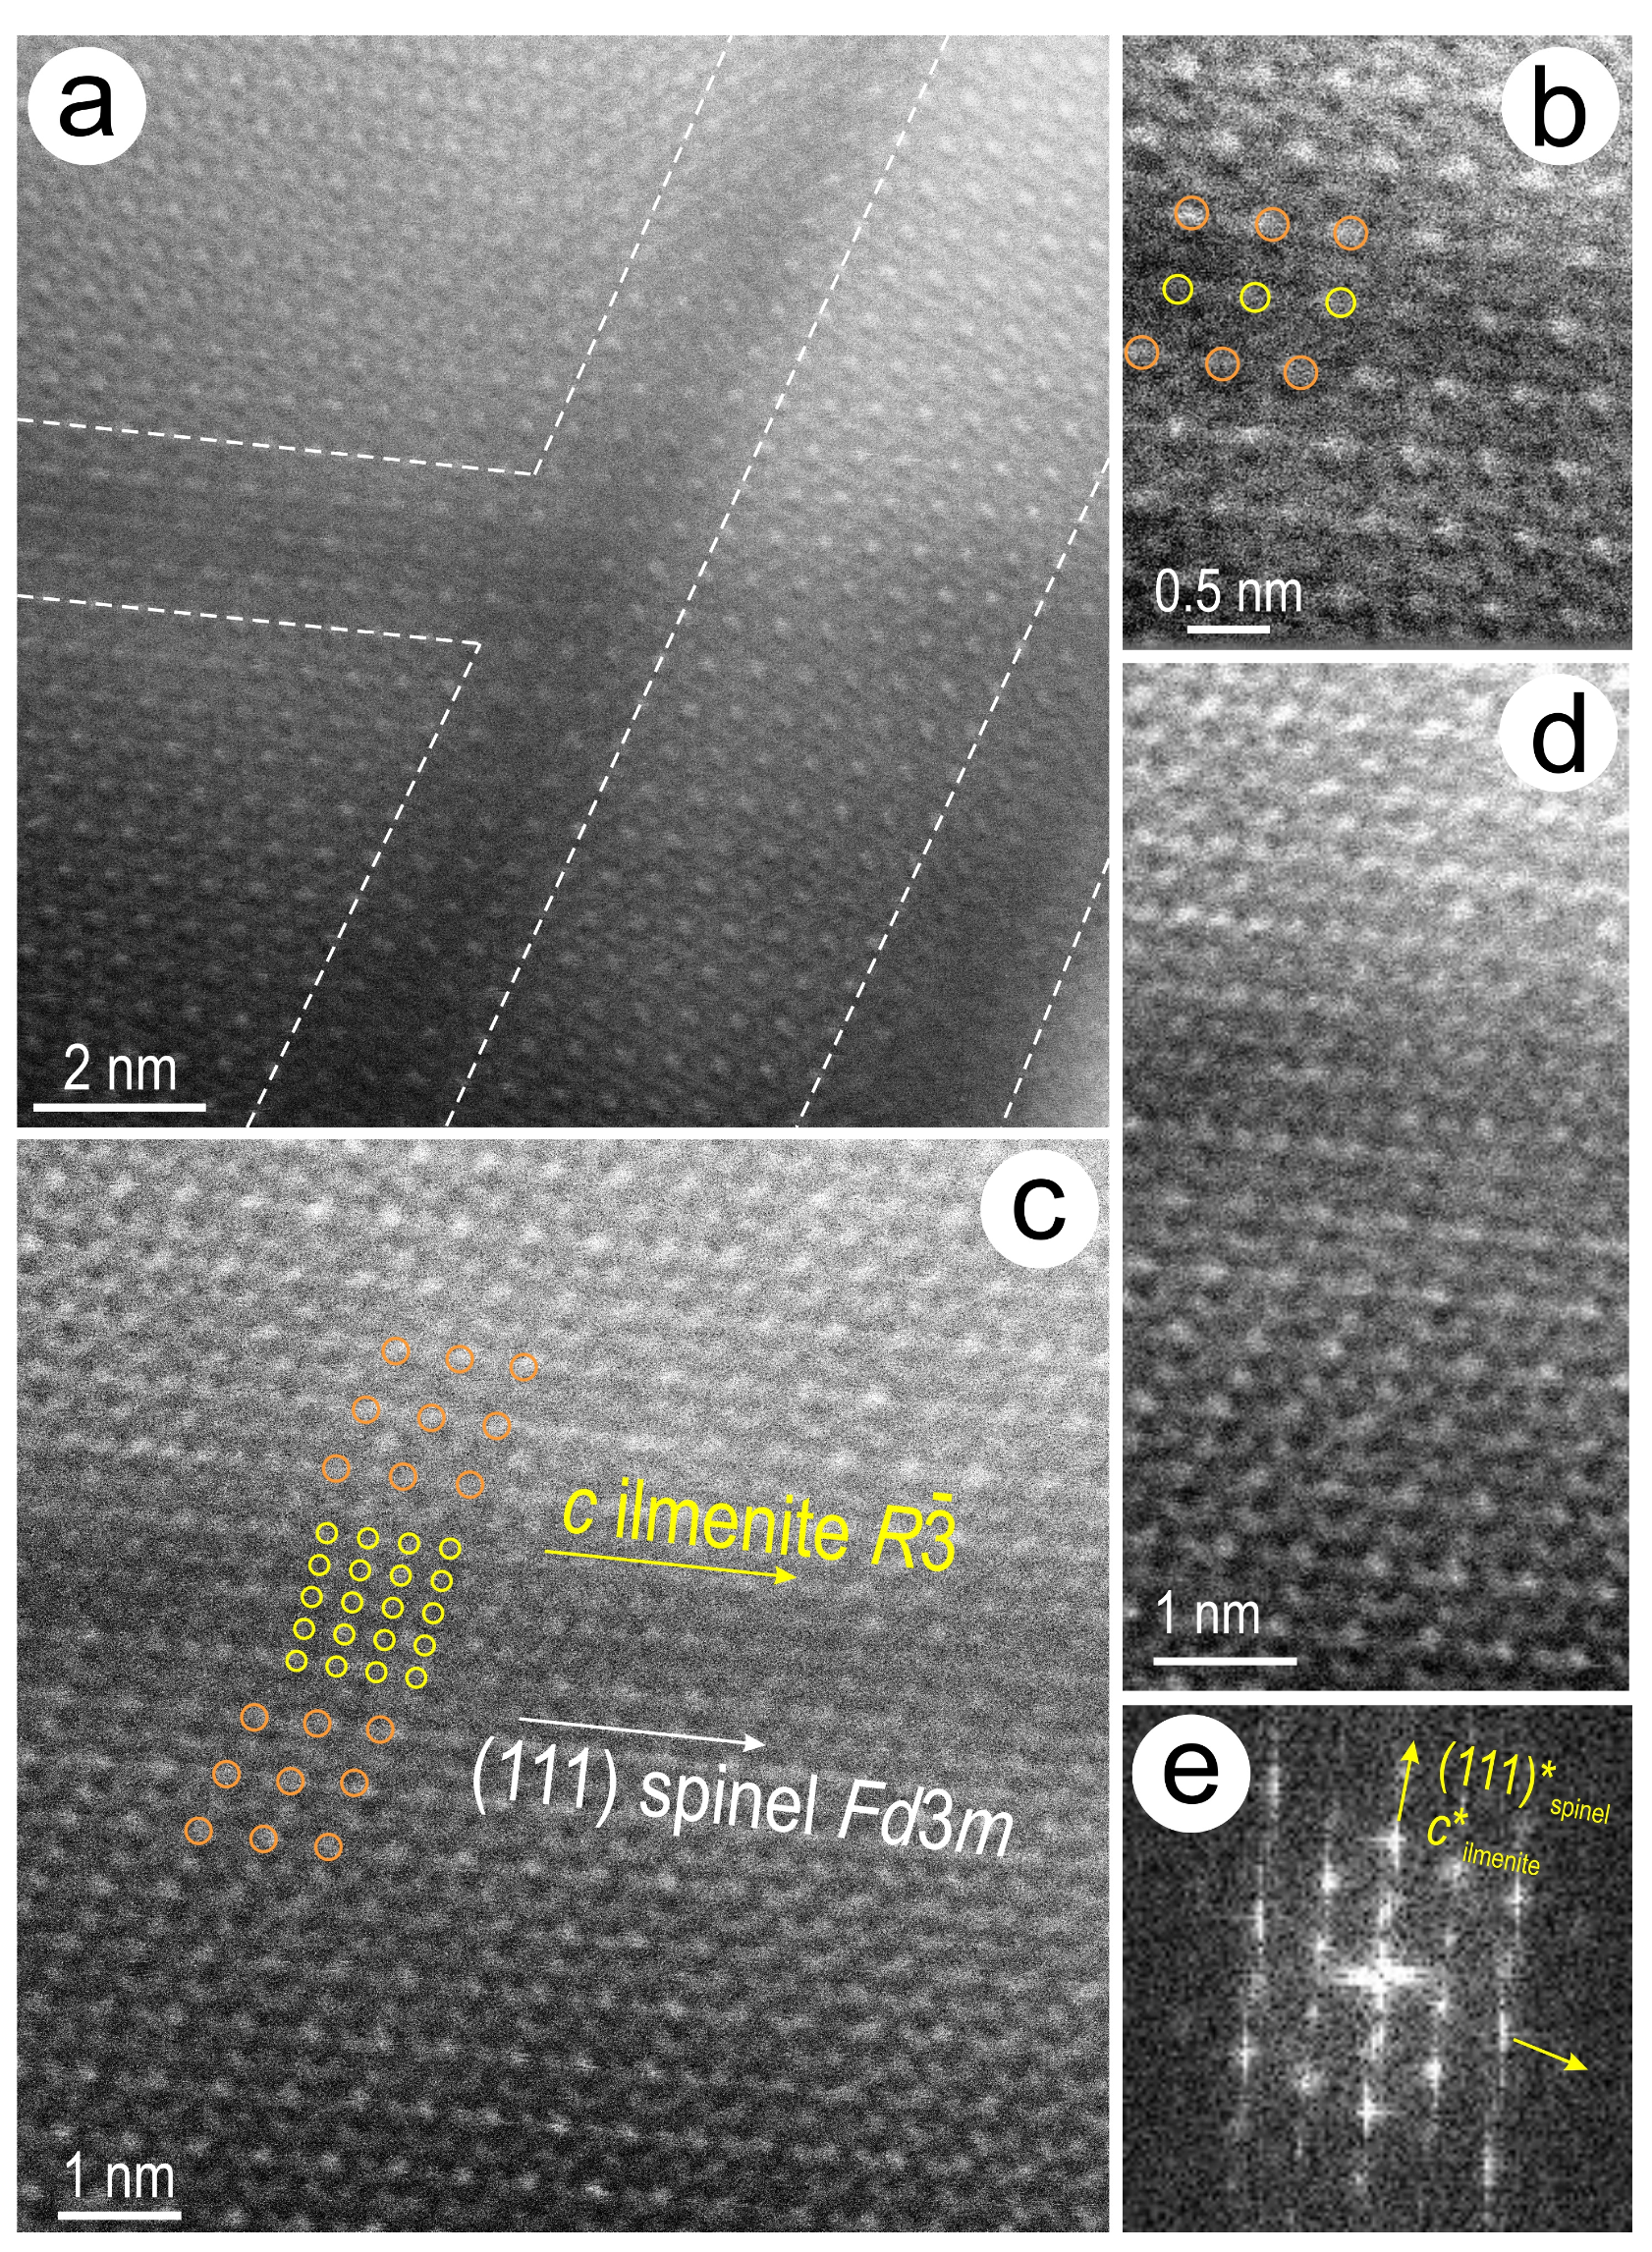
4.2.2. High-Resolution Imaging of Fe-Ti-Oxides in the Ore Assemblage

In order to better constrain the observed textural and compositional patterns, high-resolution imaging was performed by tilting the sample to achieve alignment with two zone axes for the two main mineral components, ilmenite and spinel. The ilmenite was imaged from areas within and outside titanomagnetite on [010] and [ 1 1 ¯ 1 ¯ ] zone axes, respectively (Figure 11a,b). The atomic arrangements were interpreted after calculating the zone axes from simulated electron diffractions matching the fast Fourier transforms (FFT) obtained from the real images and comparing these images with STEM simulations and crystal structure models (Figure 11c–j). There is a good match between the atomic-scale resolution images and the STEM simulations. The atom arrangements on the two ilmenite zone axes correspond to alternating Fe and Ti dumbbell motifs with comparable density for each group along the direction of view. A structural model with Fe-Ti mixed sites was used for ilmenite [43] and this can explain the mild intensity contrast observed between the Fe and Ti atoms.
Magnetite from the bright, Ti-poor, V-rich lamella shown in Figure 10d was imaged on the [ 2 ¯ 11 ] zone axis, whereas titanomagnetite (and other spinels) from close to the margin of the grain was imaged on the [ 1 1 ¯ 0 ] zone axis (Figure 12a,b). The HAADF STEM images show typical atomic arrangements that were previously assessed by STEM simulations for magnetite [27]. The brightest spots on the images represent double columns of atoms in the octahedral position (2MeM), whereas the less bright spots correspond to single atoms in either octahedral (MeM) or tetrahedral positions (MeT). The [ 1 1 ¯ 0 ] spinel structure displays a characteristic ring of 10 single-column atoms (MeM or MeT) surrounding each 2MeM site. The rectangular and rhombus-like motifs on [ 2 ¯ 11 ] and [ 1 1 ¯ 0 ] zone axes of magnetite shown in Figure 12a,b are typical for any spinel mineral with Fd3m cubic symmetry. The dumbbell motifs, such as those shown for ilmenite in Figure 11, represent atomic arrangements that are not possible in minerals with Fd3m cubic symmetry but are characteristic of many orientations in minerals with rhombohedral or tetragonal symmetry. Imaging of a titanomagnetite at the contact with one of the inclusions that has an Al-Mg-(Fe)-spinel-like composition (placed at the top of the thin foil in Figure 4c), a tetragonal polymorph of spinel, as suggested by [44] shows coherent intergrowths between the two phases (Figure 12c). The FFT obtained from this image shows an overlap between [ 1 1 ¯ 0 ] titanomagnetite and a rectangular motif. The latter corresponds to an image with a dumbbell motif and FFT showing rectangular lattice vectors with spacings at ~4.4 Å × 10.6 Å (Figure 12d–f).
Titanomagnetite also shows twin- and misorientation nanodomains which are expressed as steaking on (111)* directions (Figure 12g,h). Polymorphic transition from the high-temperature cubic (Fd3m) to the low-temperature tetragonal (P4122) structure has been determined in synthetic Mg2TiO4 and Zn2TiO4 spinels [44]. Temperature dependent cation order-disorder has also been discussed for synthetic Mg2TiO4 [45]. A transition from cubic to tetragonal symmetry in the Al-Mg-Fe-spinel phase could explain the observed dumbbell atomic arrangement in our case.
High-resolution imaging of the bright magnetite at the contact between titanomagnetite and ilmenite shown in Figure 10 shows that this represents [ 2 ¯ 11 ] magnetite coherently intergrown with [010]ilmenite (Figure 13a,b). The FFT shows the intergrowth between the two structures with (111) magnetite parallel to c*ilmenite. In detail, however, ilmenite shows domains with 2-fold superstructuring (Figure 13c). This superstructuring is also expressed as satellite reflections on FFTs obtained from both magnetite and ilmenite (Figure 13d,e). The overlap between the ilmenite and magnetite can be seen in parts of the area (marked in inset Figure 13c) but the satellite reflections in Figure 13e cannot be explained by such overlap. In addition, the HAADF detector using convergent mode STEM imaging eliminates effects of dynamical diffraction [46] and thus such satellite reflections are not artifacts introduced by the specimen thickness. Differences between ilmenite[010] with simple and double-sized structural motifs are also shown on noise-filtered Z-contrast images (Figure 13f–i).
A further case of nm-scale structural modification is observed within the darker sets of lamellae forming within the Ti-rich spinel, and represented by changes in atom arrangements on [ 1 1 ¯ 0 ] spinel with Fd3m symmetry (Figure 14a). The narrowest lamellae show modifications by loss in signal intensity for 2MeM and MeT/M (Figure 14b) concordant with interpretations invoking the presence of metal vacancies (e.g., [26,27]). In the wider lamellae, a transition from [ 1 1 ¯ 0 ] spinel to [010]ilmenite is observed (Figure 14c–e).

5. Discussion

5.1. Re-Equilibration and Replacement Processes in Panzhihua Fe-Ti-Ores

The junctions between the two sequential sets of exsolutions in titanomagnetite are associated with changes in phase associations and trace element distribution patterns (Figure 6, Figure 7, Figure 8, Figure 9 and Figure 10). These are not observable at the micron-scale (Figure 1, Figure 2 and Figure 3). Among these changes, the most remarkable is the formation of qandilite as the dominant type of spinel inside the titanomagnetite grain, whereas a Fe-poor, Al-rich, Mg-bearing spinel is present within ilmenite outside the grain. Locally, magnesioferrite is also identified at the junction between the two lamellar sets. The morphology of the spinel minerals within and outside titanomagnetite is indicative of new growth (note, in particular, the euhedral to subhedral morphology of qandilite) and replacement (irregular morphology of spinel), respectively. If we also consider the difference in the chemistry of these species, such aspects suggest the grain has experienced chemical-structural transformations that cannot be entirely attributed to a simple cooling path. Analogous conclusions were reached in a nanoscale study of exsolutions in clinopyroxene from Panzhihua, which host titanomagnetite lamellae [18].
Considering the lack of direct textural evidence for new inputs of melt in the areas of the mineral reactions discussed, the junctions between lamellar sets can be assumed to result from a process of solid-state diffusion involving elements remobilized from pre-existing {100} spinel + ilmenite phases. In such a case, qandilite forms as the result of Ti release from titanomagnetite and subsequent incorporation into spinel sensu stricto or pleonaste. The zonation with respect to Fe in qandilite (Figure 8a) is further evidence for such a scenario.
The Ti-poor, V-rich, nanometer-wide lamellae of magnetite are instead interpreted to have formed as the result of reaction between ilmenite and titanomagnetite. Epitaxial crystallization is observed between {111} magnetite and c ilmenite (Figure 13). The {111} directions in the newly formed magnetite are, however, rotated ~35° to {111} in the host titanomagnetite, indicating that this is a newly-formed phase. Ilmenite with two-fold superstructuring is observed only at such contacts, and is thus indicative of sub-solidus, non-redox re-equilibration between the two phases, as has been previously suggested based on experiments or microdiffractions of ultrafine lamellae in titanomagnetite [12,47].
The enrichment in V in the newly formed magnetite relative to either titanomagnetite or ilmenite (Figure 10d,e) is evidence of trace element remobilization at this stage. Whereas the V-rich magnetite nanometer-size lamellae shown here could be considered to represent an incipient stage of coulsonite formation in the ores, there are no antiphase domains or stacking faults such as those reported from HR-TEM studies of intergrowths between magnetite and coulsonite ( Fe 2 + V 2 3 + O 4 ) at Panzhihua [37]. Although observable only at the nanoscale, these lamellae are likely to be important V-carriers given their pervasive occurrence throughout domains containing exsolutions (Figure 5). The same nanoscale associations may be present in the fine structures enriched in Mg, Ti, V, Cr, and Sc observed on LA-ICP-MS maps (Figure 3). Vanadium enrichment in fine lamellar hematite relative to ilmenite and magnetite was shown at the micron-scale in Fe-Ti mineralization from the Northwest River anorthosite, south-central Labrador, Canada [48]. While this could be the missing evidence in support of the oxidative model shown in [8], the identity of these lamellae as hematite would require crystal structure confirmation. Nevertheless, it is clear that there could be more than one cooling model for titanomagnetite.
Close to the titanomagnetite margin, the inverse process of Ti release from the Ti-rich spinel (likely ulvöspinel; Figure 5j) and its subsequent incorporation into nanometer-wide ilmenite lamellae is observed. The process is accommodated by lowering the symmetry (via metal vacancies) along 2d111 layers in the host spinel (Figure 14). This association could be considered as the classic scenario of down-T titanomagnetite-ilmenite re-equilibration leading to the development of trellis exsolution, along which the formation of ilmenite obliterates any precursor ulvöspinel.
Cation order-disorder in 4–2 spinels (qandilite, ulvöspinel) and 2–3 spinels (magnetite, spinel sensu stricto and pleonaste) is T-dependent with rates of ordering that can obliterate high-T disorder during cooling, as shown from neutron diffraction studies of synthetic qandilite [45]. Qandilite, similar to magnetite, shows inverse cation distribution with Ti occupying half the octahedral sites at room T but becomes disordered above 900 °C, with 4% Ti present in the tetragonal site at 1416 °C [45]. The present data shows nanoscale disorder in both 4–2 and 2–3 type of spinels, i.e., 2d111 vacancy layers in Ti-rich spinel, and dumbbell atomic arrangement in the Al-Mg-phase (Figure 12d–f and Figure 14), suggesting that much slower cooling rates relative to those in the experiments could preserve such aspects in natural samples undergoing small-scale phase equilibration.
The boundary appears depleted in Ti and enriched in Al (and Mg) relative to the inner part of the titanomagnetite, although, locally, the junction between the two exsolution sets is still marked by Ti but with local enrichment in Al (hercynite nanoparticles; Figure 9). At the same time, the Ti-depletion in such areas leads to wider lamellae of V-rich magnetite towards the grain boundary (Figure 5c). The replacement of titanomagnetite by ilmenite is clearly not crystallographically controlled, thus indicating a superimposed process that may have involved later fluids rather than phase re-equilibration during cooling. The spinels occurring at the ilmenite boundary or within ilmenite are most likely relicts (based on their ragged morphology and random orientation relative to ilmenite but coherent with titanomagnetite) that were inherited from titanomagnetite rather than forming during such replacement.

5.2. Ore Formation During Magma Emplacement: Relevance of Nanoscale Characterization

The nanoscale aspects of titanomagnetite from the Panzhihua ore discussed here and those of titanomagnetite lamellae exsolved from clinopyroxene [18] share many similarities, including complex ultrafine textures, but differ from one another in several ways. The latter features longer ilmenite lamellae crosscutting pre-existing, ultrafine exsolutions in which hercynite is the main spinel type, magnetite without measurable Ti content is present, and no measurable V is found in either magnetite or ilmenite [18]. Pairs of clinopyroxene exsolutions crosscut by titanomagnetite exsolutions record initial P-T-x conditions of ~2 GPa and ~1100 °C [18], concordant with an origin within the deepest (~55 km) peridotitic magma chamber at the boundary of the upper mantle that was suggested in previous geological models [35]. Although the titanomagnetite lamellae formed during uplift to an intermediate high-Mg basaltic chamber, the first titanomagnetite grains, belonging to the initial ore stage, occur within the intercumulus liquid in the lower chamber at T > 1100 °C. Such protore will become more substantial within the intermediate chamber, even though different, successive magma batches could produce chemical heterogeneity within the cumulus. The presence of Mg and Al in the titanomagnetite, measurable even in the latest, Ti-poor, V-richer magnetite lamella, is evidence that the ore inherits an early intercumulus composition. This contrasts with suggestions that the ore crystallized after the silicate phases based on geochemical modelling of whole rock data [36]. The latter authors consider that titanomagnetite crystallized after the silicates (plagioclase and clinopyroxene) but the study ignores their presence as inclusions within clinopyroxene [18], as well as within interstitial Fe-Ti-oxide-clinopyroxene melts [39]. The samples discussed here, including the titanomagnetite–ilmenite ore studied at the nanoscale, have comparable micron-scale textures with those considered by Howarth et al. [36], as well as others [15,31,33,39].
The data presented here show that the cooling history of titanomagnetite-ilmenite ore has three stages. If we consider ilmenite as a late phase that post-dates titanomagnetite crystallization, then Stage 1 is equilibrium crystallization of Al-rich, Mg-bearing titanomagnetite from cumulus melts. The first set of {100} exsolutions could have occurred above 800 °C at moderate fO2 conditions according to recent studies of titanomagnetite–ilmenite equilibrium in the Fe-Ti-Al-Mg-O system [14]. Such temperatures, which are higher than the 600 °C previously considered for the titanomagnetite-ilmenite thermo-oxybarometer based on [8], would be within the T range of the intermediate magma chamber at a depth of 30–33 km [18,35]. Following the first set of exsolution, local coarsening of spinel, elsewhere called “clot” textures, takes place within the pre-existing exsolution networks via solid state diffusion. Fields with spinel coarsening are typical within titanomagnetite ores, as was shown here (Figure 1 and Figure 4), and in the literature on Panzhihua [15,31,33,39]. Direct evidence for Mg-Al-depletion haloes around such grains, indicative that this process post-dates the first exsolution set, is given here. In other examples of titanomagnetite with Al-spinel and corundum exsolutions, the “clot” texture is considered to predate the exsolution network (Lac Dore complex, Quebec, Canada) [17]. Considering that this texture occurs mostly within the central part of titanomagnetite, it could be indicative of slow-cooling cumulus grains.
Stage 2 is recorded by the crosscutting {111} exsolution sets, which result in the formation of the Ti-rich spinel qandilite rather than more ilmenite. The ”arrest” of ilmenite growth down-T, leading to titanomagnetite with “dwarfed” exsolutions when compared with textures reported elsewhere (e.g., Lac Dore complex, Miller Range (MIL) 03346 Martian nakhlite meteorite) [17,49], could be attributed to T-increase due to emplacement of another batch of melt, which would directly affect some of the interstitial cumulus [39]. The cooling path is reset, as seen from re-equilibration textures throughout the grain, and the ilmenite + V-rich magnetite exsolution pair represent non-redox equilibration without any transient ulvöspinel. Growth of such textures with an oblique orientation to the two crosscutting lamellar sets results in the weave-texture observed on the surface of the sample.
Stage 3 can be reconciled with conditions after uplift in the layered intrusions at the shallowest level (<10 km) and is recorded by re-equilibration of ilmenite sourced from Ti-rich ulvöspinel, a typical scenario used to explain the redox-driven formation of trellis exsolutions. The disequilibrium between titanomagnetite and ilmenite, invoked in geochemical models assuming an open system with multiple replenishments and variable fO2 [36], can be illustrated by the replacement of titanomagnetite by ilmenite. However, the textures observed down to the nanoscale indicate fluid-mediated reactions (e.g., progressive chemical-textural changes towards grain boundaries, spinel inherited from titanomagnetite) rather than melt digestion. The much lower fO2 required for ilmenite stability would nonetheless be difficult to explain. Alternatively, the titanomagnetite–ilmenite ore could be the result of direct crystallization from cumulus melts [33] that are compositionally heterogeneous. In this case, the results shown here are illustrative of post-magmatic overprinting processes, during which ore fracturing creates pathways for fluid percolation.
The present data draws attention to the importance of bridging micron- to nanoscales of observation to understand exsolution sequences in Fe-Ti-oxides. Correct application of the titanomagnetite-ilmenite thermo-oxybarometer depends not only on good calibrations [14] but also on textural assessment based upon the exsolved species (e.g., the newly integrative model of ilmenite-Al-spinel-corundum exsolution in titanomagnetite) [17]. As shown here, the Panzhihua ores would require an additional variant of the model, in which qandilite is considered as one of the spinel species.

6. Conclusions

Titanomagnetite shows junctions between two sequential sets of exsolutions, i.e., {111} crosscutting {100}, which are associated with changes in phase speciation and trace element distribution patterns that are not recognizable at the micron-scale. Most remarkable is the presence of qandilite as the dominant type of spinel inside the titanomagnetite. Locally, magnesioferrite is also identified. In contrast, Fe-poor, Al-rich, Mg-bearing spinel is present within ilmenite outside the grain. The enrichment in V in the newly formed magnetite lamellae (up to 10 nm wide) relative to either titanomagnetite or ilmenite is clear evidence for trace element remobilization at this stage.
Vanadium-rich magnetite shows epitaxial relationships with ilmenite at the contact to titanomagnetite. The 2-fold superstructuring in ilmenite is evidence of non-redox re-equilibration between the two phases, as has been previously postulated from experimental data. In contrast, the transformation of the cubic Ti-rich spinel structure into rhombohedral ilmenite imaged at the nanoscale represents the “oxy-exolution” model of titanomagnetite-ilmenite re-equilibration via formation of a transient ulvöspinel species.
Nanoscale disorder is encountered in both 4–2 and 2–3 type of spinels, i.e., vacancy layers in Ti-rich spinel (ulvöspinel), and lower symmetry (dumbbell atomic arrangement) in the Fe-poor, Al-Mg phase, respectively, suggesting that slow cooling rates can preserve small-scale phase equilibration during geological events.
Considering that ilmenite post-dates titanomagnetite crystallization, the data presented here show that the cooling history of titanomagnetite ore records three distinct stages that are interpretable in the context of published models of a magma-plumbing system rooted in the upper mantle.
Stage 1 shows equilibrium crystallization of Al-rich, Mg-bearing titanomagnetite from cumulus melts at depth (~55 km). The first set of {100} exsolutions could have occurred above 800 °C at moderate fO2 conditions according to recent studies of titanomagnetite–ilmenite equilibrium in the Fe-Ti-Al-Mg-O system.
Stage 2 is recorded by crosscutting {111} exsolutions, which results in the formation of qandilite rather than more ilmenite. The ”arrest” of ilmenite growth leading to titanomagnetite with “dwarfed” exsolutions could be attributed to a temperature increase due to emplacement of another batch of melt affecting the interstitial cumulus during uplift to an intermediate magma chamber. Formation of ilmenite + V-rich magnetite exsolution pairs representing non-redox equilibration (without transient ulvöspinel) indicates resetting of the cooling path at this stage.
Stage 3 is recorded during or after uplift at the shallowest levels (<10 km) and shows ilmenite forming from pre-existing Ti-rich spinel and ulvöspinel, illustrative of redox-driven cooling paths. Disequilibrium between titanomagnetite and ilmenite (replacement relationships) can be associated with published models assuming an open system with multiple replenishments and variable fO2, or could alternatively represent fluid-mediated reactions rather than melt digestion.
The present study shows the advantage of using HAADF STEM, which provides direct imaging of atomic arrangements when viewed on a direction of interest. Thus, this technique can be used to constrain exsolution models, as well as for fingerprinting reactions down to the nanoscale, which is relevant in understanding ore formation and transformation.

Supplementary Materials

The following are available online at https://www.mdpi.com/2075-163X/9/9/513/s1, Figure S1: BSE and SE images showing the locations (a,b) and morphologies (c–e) of the other three foils not shown in Figure 4. Figure S2: Extended LA-ICP-MS element maps for Figure 2. Figure S3: Extended LA-ICP-MS element maps for Figure 3. Figure S4: HAADF STEM image and STEM EDS spectra showing qandilite and variable Ti and V content in ilmenite and magnetite. Figure S5: HAADF STEM image and STEM EDS spectra. The third spectrum shows the overlay of spinel and ilmenite. Figure S6: HAADF STEM image and STEM EDS spectra showing variable Ti and V content in ilmenite, titanomagnetite, magnetite, qandilite, and spinel.

Author Contributions

C.L.C. and W.G. devised the project. W.G., C.L.C., and N.J.C. wrote the paper, assisted by F.H., A.S., who operated the Titan Themis instrument. D.S. assisted with data processing.

Funding

W.G. and F.H. acknowledge support from the National Natural Science Foundation of China (Grant No. 41272062), China Postdoctoral Science Foundation (Grant No. 2019M651136), Key Laboratory of Mineralogy and Metallogeny (GIGCAS, Grant No. KLMM20170103), Postdoctoral Foundation of Northeastern University (Grant No. 20190320), and China Scholarship Council (Grants No. 201506080060 and 201606080020). C.L.C. acknowledges support from the project “Trace elements in iron oxides”, supported by BHP Olympic Dam and the South Australian Mining and Petroleum Services Centre of Excellence. N.J.C. acknowledges support from the Australian Research Council Research Hub for Australian Copper-Uranium.

Acknowledgments

Additional microanalytical assistance was kindly provided by Animesh Basak, Ben Wade, and Sarah Gilbert (Adelaide Microscopy). We acknowledge the pertinent comments of three anonymous reviewers, who assisted in refining ideas and expression.

Conflicts of Interest

The authors declare no conflict of interest.

References

  1. Zhou, M.F.; Robinson, P.T.; Lesher, C.M.; Keays, R.R.; Zhang, C.J.; Malpas, J. Geochemistry, petrogenesis and metallogenesis of the Panzhihua gabbroic layered intrusion and associated Fe-Ti-V oxide deposits, Sichuan Province, SW China. J. Petrol. 2005, 46, 2253–2280. [Google Scholar] [CrossRef]
  2. Price, G.D. Subsolidus phase relations in the titanomagnetite solid solution series. Am. Mineral. 1981, 66, 751–758. [Google Scholar]
  3. Lilova, K.I.; Navrotsky, A.; Pearce, C.I.; Rosso, K.M.; Gorski, C. Thermodynamics of the magnetite-ulvöspinel (Fe3O4-Fe2TiO4) solid solution. Am. Mineral. 2012, 97, 1330–1338. [Google Scholar] [CrossRef]
  4. Biagioni, C.; Pasero, M. The systematics of the spinel-type minerals: An overview. Am. Mineral. 2014, 99, 1254–1264. [Google Scholar] [CrossRef]
  5. Bosi, F.; Halenius, U.; Skogby, H. Crystal chemistry of the magnetite-ulvöspinel series. Am. Mineral. 2009, 94, 181–189. [Google Scholar] [CrossRef]
  6. Bosi, F.; Biagioni, C.; Pasero, M. Nomenclature and classification of the spinel supergroup. Eur. J. Mineral. 2019, 31, 183–192. [Google Scholar] [CrossRef] [Green Version]
  7. Ramdohr, P. Ulvöspinel and its significance in titaniferous iron ores. Econ. Geol. 1953, 48, 677–688. [Google Scholar] [CrossRef]
  8. Buddington, A.F.; Lindsley, D.H. Iron-titanium oxide minerals and synthetic equivalents. J. Petrol. 1964, 5, 310–357. [Google Scholar] [CrossRef]
  9. Andersen, D.J.; Lindsley, D.H. New (and final!) models for the Ti-magnetite/ilmenite geothermometer and oxygen barometer. Abstract, AGU Spring Meeting, Washington, DC, USA. Eos Trans. Amer. Geophys. Union 1985, 66, 416. [Google Scholar]
  10. Ghiorso, M.S.; Sack, R.O. Fe-Ti Oxide Geothermometry: Thermodynamic Formulation and the Estimation of Intensive Variables in Silicic Magmas. Contrib. Mineral. Petrol. 1991, 108, 485–510. [Google Scholar] [CrossRef]
  11. Lindsley, D.H. Experimental studies of oxide minerals. Rev. Mineral. 1991, 25, 69–106. [Google Scholar]
  12. Lattard, D. Experimental evidence for the exsolution of ilmenite from titaniferous spinel. Am. Mineral. 1995, 80, 968–981. [Google Scholar] [CrossRef]
  13. Mücke, A. Magnetite, ilmenite and ulvite in rocks and ore deposits: Petrography, microprobe analyses and genetic implications. Mineral. Petrol. 2003, 77, 215–234. [Google Scholar] [CrossRef]
  14. Sauerzapf, U.; Lattard, D.; Burchard, M.; Engelmann, R. The titanomagnetite-ilmenite equilibrium: New experimental data and thermo-oxybarometric application to the crystallization of basic to intermediate rocks. J. Petrol. 2008, 49, 1161–1185. [Google Scholar] [CrossRef]
  15. Tan, W.; Liu, P.; He, H.; Wang, C.Y.; Liang, X. Mineralogy and origin of exsolution in Ti-rich magnetite from different magmatic Fe-Ti oxide-bearing intrusions. Can. Mineral. 2016, 54, 539–553. [Google Scholar] [CrossRef]
  16. Ivanyuk, G.Y.; Kalashnikov, A.O.; Pakhomovsky, Y.A.; Bazai, A.V.; Goryainov, P.M.; Mikhailova, J.A.; Yakovenchuk, V.N.; Konopleva, N.G. Subsolidus evolution of the magnetite-spinel-ulvöspinel solid solutions in the Kovdor phoscorite-carbonatite complex, NW Russia. Minerals 2017, 7, 215. [Google Scholar] [CrossRef]
  17. Arguin, J.P.; Pagé, P.; Barnes, S.J.; Girard, R.; Duran, C. An integrated model for ilmenite, Al-spinel, and corundum exsolutions in titanomagnetite from oxide-rich layers of the Lac Doré Complex (Québec, Canada). Minerals 2018, 8, 476. [Google Scholar] [CrossRef]
  18. Gao, W.; Ciobanu, C.L.; Cook, N.J.; Slattery, A.; Huang, F.; Wang, D. Nanoscale study of lamellar exsolutions in clinopyroxene from olivine gabbro: Recording crystallization sequences in iron-rich layered intrusions. Am. Mineral. 2019, 104, 244–261. [Google Scholar]
  19. Ciobanu, C.L.; Cook, N.J.; Maunders, C.; Wade, B.P.; Ehrig, K. Focused ion beam and advanced electron microscopy for minerals: Insights and outlook from bismuth sulphosalts. Minerals 2016, 6, 112. [Google Scholar] [CrossRef]
  20. Cook, N.J.; Ciobanu, C.L.; Ehrig, K.; Slattery, A.; Verdugo-Ihl, M.R.; Courtney-Davies, L.; Gao, W. Advances and opportunities in ore mineralogy. Minerals 2017, 7, 233. [Google Scholar] [CrossRef]
  21. Owen, N.D.; Ciobanu, C.L.; Cook, N.J.; Slattery, A.; Basak, A. Nanoscale study of clausthalite-bearing symplectites in Cu-Au-(U) ores: Implications for ore genesis. Minerals 2018, 8, 67. [Google Scholar] [CrossRef]
  22. Keyser, W.; Ciobanu, C.L.; Cook, N.J.; Feltus, H.; Johnson, G.; Slattery, A.; Wade, B.P.; Ehrig, K. Mineralogy of zirconium in iron-oxides: A micron- to nanoscale study of hematite ore from Peculiar Knob, South Australia. Minerals 2019, 9, 244. [Google Scholar] [CrossRef]
  23. Xu, J.; Ciobanu, C.L.; Cook, N.J.; Slattery, A. Crystals from the Powellite-Scheelite series at the nanoscale: a case study from the Zhibula Cu Skarn, Gangdese Belt, Tibet. Minerals 2019, 9, 340. [Google Scholar] [CrossRef]
  24. Courtney-Davies, L.; Ciobanu, C.L.; Verdudo-Ihl, M.R.; Slattery, A.; Cook, N.J.; Dmitrijeva, M.; Keyser, W.; Wade, B.P.; Domnick, U.I.; Ehrig, K.; et al. Zircon at the nanoscale records metasomatic processes leading to large magmatic-hydrothermal ore systems. Minerals 2019, 9, 364. [Google Scholar] [CrossRef]
  25. Verdugo-Ihl, M.R.; Ciobanu, C.L.; Slattery, A.; Cook, N.J.; Ehrig, K.; Courtney-Davies, L. Copper-arsenic nanoparticles in hematite: Fingerprinting fluid-mineral interaction. Minerals 2019, 9, 388. [Google Scholar] [CrossRef]
  26. Xu, H.F.; Shen, Z.Z.; Konishi, H. Si-magnetite nano-precipitates in silician magnetite from banded iron formation: Z-contrast imaging and ab initio study. Am. Mineral. 2014, 99, 2196–2202. [Google Scholar] [CrossRef]
  27. Ciobanu, C.L.; Verdugo-Ihl, M.R.; Slattery, A.; Cook, N.J.; Ehrig, K.; Courtney-Davies, L.; Wade, B.P. Silician magnetite: Si-Fe-nanoprecipitates and other mineral inclusions in magnetite from the Olympic Dam deposit, South Australia. Minerals 2019, 9, 311. [Google Scholar] [CrossRef]
  28. Xu, H.F.; Shen, Z.Z.; Konishi, H.; Fu, P.; Szlufarska, I. Crystal structures of laihunite and intermediate phases between laihunite-1M and fayalite; Z-contrast imaging and ab initio study. Am. Mineral. 2014, 99, 881–889. [Google Scholar] [CrossRef]
  29. Xu, H.F.; Lee, S.; Xu, H.W. Luogufengite: A new nano-mineral of Fe2O3 polymorph with giant coercive field. Am. Mineral. 2017, 102, 711–719. [Google Scholar] [CrossRef]
  30. Song, X.Y.; Qi, H.W.; Hu, R.Z.; Chen, L.M.; Yu, S.Y.; Zhang, J.F. Formation of thick stratiform Fe-Ti oxide layers in layered intrusion and frequent replenishment of fractionated mafic magma: Evidence from the Panzhihua intrusion, SW China. Geochem. Geophys. Geosyst. 2013, 14, 712–732. [Google Scholar] [CrossRef]
  31. Zhou, M.F.; Chen, W.T.; Wang, C.Y.; Prevec, S.A.; Liu, P.P.; Howarth, G.H. Two stages of immiscible liquid separation in the formation of Panzhihua-type Fe-Ti-V oxide deposits, SW China. Geosci. Front. 2013, 4, 481–502. [Google Scholar] [CrossRef]
  32. Hou, T.; Zhang, Z.C.; Pirajno, F. A new metallogenic model of the Panzhihua giant V-Ti-iron oxide deposit (Emeishan Large Igneous Province) based on high-Mg olivine-bearing wehrlite and new field evidence. Internat. Geol. Rev. 2012, 54, 1721–1745. [Google Scholar] [CrossRef]
  33. Pang, K.N.; Zhou, M.F.; Lindsley, D.; Zhao, D.G.; Malpas, J. Origin of Fe-Ti oxide ores in mafic intrusions: Evidence from the Panzhihua Intrusion, SW China. J. Petrol. 2008, 49, 295–313. [Google Scholar] [CrossRef]
  34. Pêcher, A.; Arndt, N.; Jean, A.; Bauville, A.; Ganino, C.; Athurion, C. Structure of the Panzhihua intrusion and its Fe-Ti-V. deposit, China. Geosci. Front. 2013, 4, 571–581. [Google Scholar] [CrossRef]
  35. Tao, Y.; Putirka, K.; Hu, R.Z.; Li, C. The magma plumbing system of the Emeishan large igneous province and its role in basaltic magma differentiation in a continental setting. Am. Mineral. 2015, 100, 2509–2517. [Google Scholar] [CrossRef]
  36. Howarth, G.H.; Prevec, S.A.; Zhou, M.F. Timing of Ti-magnetite crystallisation and silicate disequilibrium in the Panzhihua mafic layered intrusion: Implications for ore-forming processes. Lithos 2013, 170, 73–89. [Google Scholar] [CrossRef]
  37. Wang, Y.G.; Ye, H.Q.; Ximen, L.L.; Kuo, K.H. A HREM study of the intergrowth of magnetite and coulsonite. Acta Cryst. 1989, 45, 264–268. [Google Scholar] [CrossRef]
  38. Wang, Y.G.; Ping, D.H.; Guo, J.G. High-resolution transmission-electron-microscopy observation of the ultra-fine structure of natural magnetite. J. Appl. Cryst. 1994, 27, 96–102. [Google Scholar] [CrossRef]
  39. Gao, W.; Ciobanu, C.L.; Cook, N.J.; Huang, F.; Meng, L.; Gao, S. Petrography and trace element signatures in silicates and Fe-Ti-oxides from the Lanjiahuoshan deposit, Panzhihua layered intrusion, Southwest China. Lithos 2017, 294–295, 164–183. [Google Scholar] [CrossRef]
  40. Paton, C.; Hellstrom, J.; Paul, B.; Woodhead, J.; Hergt, J. Iolite: Freeware for the visualisation and processing of mass spectrometric data. J. Anal. Atom. Spectr. 2011, 26, 2508–2518. [Google Scholar] [CrossRef]
  41. Ciobanu, C.L.; Cook, N.J.; Utsunomiya, S.; Pring, A.; Green, L. Focussed ion beam–transmission electron microscopy applications in ore mineralogy: Bridging micron- and nanoscale observations. Ore Geol. Rev. 2011, 42, 6–31. [Google Scholar] [CrossRef]
  42. Downs, R.T.; Hall-Wallace, M. The American Mineralogist Crystal Structure Database. Am. Mineral. 2003, 88, 247–250. [Google Scholar]
  43. Harrison, R.J.; Redfern, S.A.T. Short- and long-range ordering in the ilmenite-hematite solid solution. Phys. Chem. Miner. 2001, 28, 399–412. [Google Scholar] [CrossRef]
  44. Millard, R.L.; Peterson, R.C.; Hunter, B.K. Study of the cubic to tetragonal transition in Mg2TiO4 and Zn2TiO4 spinels by 17O MAS NMR and Rietveld refinement of X-ray diffraction data. Am. Mineral. 1995, 80, 885–896. [Google Scholar] [CrossRef]
  45. O’Neill, H.S.C.; Redfern, S.A.T.; Kesson, S.; Short, S. An in situ neutron diffraction study of cation disordering in synthetic qandilite Mg2TiO4 at high temperatures. Am. Mineral. 2003, 88, 860–865. [Google Scholar] [CrossRef]
  46. Pennycook, S. Structure determination through Z-contrast microscopy. Adv. Imaging Electron Phys. 2002, 123, 173–206. [Google Scholar]
  47. Krasnova, N.I.; Krezer, Y.L. New data on the nature of fine and ultrafine lamellae in titanomagnetite. Eur. J. Mineral. 1995, 7, 1361–1372. [Google Scholar] [CrossRef] [Green Version]
  48. Valvasori, A.A.; Hanchar, J.M.; Piercey, S.; Fonkwe, M.L.D. The origin and evolution of V-rich, magnetite dominated Fe-Ti oxide mineralization; Northwest River Anorthosite, south-central Labrador, Canada. Mineral. Depos. 2019, 2019, 1–21. [Google Scholar] [CrossRef]
  49. Righter, K.; Keller, L.P.; Rahman, Z.; Christoffersen, R. Redox-driven exsolution of iron-titanium oxides in magnetite in Miller Range (MIL) 03346 nakhlite: Evidence for post crystallization oxidation in the nakhlite cumulate pile? Am. Mineral. 2014, 99, 2313–2319. [Google Scholar] [CrossRef]
Figure 1. Back-scatter electron (BSE) images (a,b) and BSE images with SEM-EDS maps (cf) showing μm-scale textural complexity in titanomagnetite (Ti-Mt) from Panzhihua. (a) Grain displaying coarser spinel (Spl) inclusions throughout the core, crosscutting fractures, and marginal replacement by silicates. Note the presence of a sulfide grain (arrowed) close to the grain boundary. (b) Detail of area representative of {100} ilmenite (Ilm) + spinel inclusions with relatively coarse, square-shaped spinel in the center. Note the absence of smaller spinel grains within the halo surrounding the coarser inclusions (red dashed line). (c,d) Typical {111} sets of exsolutions in titanomagnetite comprising ilmenite and spinel. (e,f) Detail showing the halo surrounding the spinel inclusion in (b) with Al and Mg depletion.
Minerals 09 00513 g001
Figure 2. Reflected light photomicrograph (top left) and LA-ICP-MS maps showing patterns of trace element distribution in titanomagnetite (Ti-Mt) with inclusions of pleonaste (Pls) and crosscutting fractures. Note the concentration of Al, Zn, and Mg along the grain boundary, whereas the fractures show relative enrichment in Mg and corresponding depletion in V, Mn, and Zr. Manganese and Zr are both higher in adjacent ilmenite (Ilm) but show antipathetic correlation with one another along fine linear arrays within the grain, i.e., Mn-depleted and Zr-enriched. Scales are in counts-per-second. Extended maps are shown in Supplementary Materials Figure S2.
Minerals 09 00513 g002
Figure 3. Reflected light photomicrograph (top left) and LA-ICP-MS maps showing patterns of trace elements distribution at the triple junction between three titanomagnetite (Ti-Mt) grains. The grain boundaries host pleonaste (Pls). The maps show internal substructures concentrating Mg, Ti, V, Cr, and Sc. Scales in counts-per-second. Extended maps are shown in Supplementary Materials Figure S3.
Minerals 09 00513 g003
Figure 4. BSE images (a,b) and HAADF STEM image (c) showing a titanomagnetite (Ti-Mt) grain enclosed within ilmenite (Ilm) that was studied at the nanoscale. (a) The titanomagnetite displays a sub-rounded, partially scalloped morphology and contains areas of coarser inclusions, as well as intra-grain fractures. (b) Detail of titanomagnetite margin showing inliers of ilmenite replacement. The grain displays weave-patterns of inclusions that appear to fade away towards the contact boundary with ilmenite. The contact is also marked by irregular grains of spinel (Spl). (c) In-depth, the titanomagnetite shows comparable features with those described on the surface of the polished block. The only difference is that the weave pattern of inclusions becomes an apparent {100} network.
Minerals 09 00513 g004
Figure 5. Low-resolution HAADF STEM images showing inclusion networks and phase associations throughout titanomagnetite (Ti-Mt). (a) Field of view on the S/TEM foil in Figure 4c showing the gradual change in inclusion density across the titanomagnetite and areas that were studied in closer detail, as marked. (b) Typical rectangular network with spinel minerals (arrowed) at the junctions between {100} planes hosting ilmenite (Ilm) lamellae. (c) Margin showing a set of brighter bands (arrowed) with darker rims in titanomagnetite. These are oriented along the {100} planes rather than forming a rectangular network. (d) Details of the margin showing inclusions along a second array of planes crosscutting the brighter bands in titanomagnetite. Note these are irregular with respect of length and width. (eg) Details of the rectangular network of inclusions characteristic for the inner part of the grain. Note that spinel minerals (arrowed) are surrounded by irregular areas of ilmenite and titanomagnetite. In addition, thin lamellae with brightest intensity (yellow arrows) underline {111} planes crosscutting the rectangular {100} network. (hj) Details of the second inclusion arrays in (d). These shows both spinel (white arrows) and a lamellar {111} network with phases that appear darkest in the images (yellow arrows).
Minerals 09 00513 g005
Figure 6. HAADF STEM image and STEM EDS maps (a) showing compositional patterns in the inner part of titanomagnetite. Note the presence of spinel minerals with bleb-like morphology highlighted by major elements, whereas linear subsets are only depicted by Ti, Al, and trace elements represented by V and Mn. (bf) EDS line profiles 1–5 as shown in the image showing variation in major and trace elements, as marked. See text for additional explanation. Note: Ilm = ilmenite; Mgf = magnesioferrite; Mt = magnetite; Qdl = qandilite; Spl = spinel.
Minerals 09 00513 g006
Figure 7. HAADF STEM image (top left) and STEM EDS spectra 1–5 obtained from areas, as marked on the image. The spectra show the presence of variable spinel types, as marked. Magnetite with variable Ti and V content is also present. The high Fe peak is partially due to the shallowness of the spinel mineral inclusions. The Cu peak is from the TEM grid. Note: Mgf = magnesioferrite; Mt = magnetite; Pls = pleonaste; Qdl = qandilite; Spl = spinel.
Minerals 09 00513 g007
Figure 8. HAADF STEM images (left) and STEM EDS spectra 1–3 (right) showing spinel minerals representative of the association. (a) Qandilite (Qdl) with compositional zoning with respect to Fe is dominant throughout the titanomagnetite (Ti-Mt). (b) Compositions recognized as spinel sensu stricto (Spl) are representative of the inclusions in ilmenite (Ilm) outside the titanomagnetite. Additional spectra are shown in Supplementary Materials Figure S5. The Cu signal is from the TEM grid.
Minerals 09 00513 g008
Figure 9. HAADF STEM image (top left) and STEM EDS maps showing compositional variation in areas with crosscutting patterns marked as set II {111} lamellae across a set I {100} band. Both sets comprise ilmenite + spinel minerals. Titanium correlates positively with Al, Mg, V, and Mn, and negatively with Fe. Of all the elements, Al shows the most pronounced correlation with the textures and also shows a spot of high concentration at the edge of {111} directions.
Minerals 09 00513 g009
Figure 10. (a,b) Low-magnification HAADF STEM images and (c) spectra 1 and 2 showing phase association within {111} networks from the edge of titanomagnetite. (a) Well-defined lamellar network superimposed onto one of the {100} bands. (b) Details from (a) showing the junction between two lamellae. (c) Spectra 1 and 2 from areas as marked in (b) showing ilmenite (top) and Fe-Ti-Mg-(Al)-spinel or a mixture between ilmenite and a spinel mineral (bottom). The Cu peak is due to the TEM grid. (d) Low-magnification HAADF STEM image of the bright low-Ti, high-V lamellar magnetite (Mt) at the boundary between titanomagnetite (Ti-Mt) and ilmenite (Ilm). (e) STEM EDS spectra taken along a line from titanomagnetite to magnetite and ilmenite (points 1–4), showing variation in V across the assemblage. Note the highest peak is recorded in the bright lamella rather than from titanomagnetite or ilmenite. Additional spectra are shown in Supplementary Materials Figure S6. The Cu peak is due to the TEM grid.
Minerals 09 00513 g010
Figure 11. (a,b) High-resolution HAADF STEM images showing ilmenite on zone axes, as marked. The four panels (cj) show, from left to right: indexed electron diffraction simulation, FFT, HAADF STEM image, and STEM simulation for [010] (cj) [ 1 1 ¯ 1 ¯ ] zone axes, respectively. Overlays of atoms obtained from crystal structure models for ilmenite using crystallographic data from [43] on the STEM simulations are yellow (Fe) and orange (Ti).
Minerals 09 00513 g011
Figure 12. (a,b) High-resolution HAADF STEM images showing magnetite on zone axes, as marked. Interpretation of atomic arrangements based on a previous study [27]. The inset in (b) shows the typical ring of 10-smaller spots (single column metals in either octahedral (M) or tetrahedral (T) sites) surrounding each brighter or larger spot corresponding to double-column metal 2MeM with a beam parallel to the ( 1 1 ¯ 0 ) direction. (c) Contact between magnetite and Al–Mg–phase with coherent orientation between the two species (FFT in inset). (d) High-resolution image of the Al-Mg-phase (spinel composition) showing the dumbbell atomic arrangement atypical for cubic spinels of high symmetry. (e,f) Details of the dumbbell structure and FFT obtained from (d). (g,h) Details of magnetite in (c) and corresponding FFT. This shows nanotwins in {111} directions. Forbidden reflections present on FFT in (h) are marked in yellow.
Minerals 09 00513 g012
Figure 13. (a,b) HAADF STEM images showing orientation between the V-rich, Ti-poor magnetite lamellae (Mt; bright) in host ilmenite (Ilm) from Figure 10d. FFT pattern shown as inset indicates c*Ilm is parallel to (111)*Mt. White and yellow rectangles highlight the coherent intergrowth between ilmenite and magnetite, respectively. (c) High-resolution HAADF STEM image of ilmenite showing 2-fold superstructuring in the vicinity of the magnetite lamella. Inset shows an overlap between the magnetite (white lines) and the double-sized cell of ilmenite (yellow lines). (d) FFT obtained from magnetite showing two satellite reflections along ( 13 1 ¯ ) * due to intergrowths with a two-fold ilmenite structure (white arrows). (e) FFT obtained from ilmenite showing the presence of satellite reflections (red arrows) due to the superstructuring, as shown in (c). (f,g) Ilmenite on the [010} zone axis (cropped from Figure 11a) and noise-filtered Z-contrast image showing the size of the smallest motif arrangement (yellow rectangle). (h,i) Superstructure of ilmenite from the rectangle marked in (c) and noise-filtered Z-contrast image showing the structural motif (yellow rectangle), which is double-sized relative to the motif in (g).
Minerals 09 00513 g013
Figure 14. (a,b) High-resolution HAADF STEM images showing Ti-rich spinel crosscut by darker lamellae marked as dashed lines in (a). Details (b) show changes in atomic arrangement in spinel [ 1 1 ¯ 0 ] across the lamellae. The loss in intensity for the 2MeM double-atom columns (yellow and orange circles) is observed across the one-unit, cell-wide lamella and is attributable to metal vacancies [26,27]. (c) High-resolution HAADF STEM image showing changes across a lamella where the structural motif in spinel [ 1 1 ¯ 0 ] is no longer retained (only 2MeM marked). The image instead shows a motif with dumbbell atoms corresponding to ilmenite [010] (see Figure 11). (d,e) Crop and FFT from the image in (c) showing details of the image and the intergrowth between the spinel and ilmenite.
Minerals 09 00513 g014

