1. Introduction
Amphiboles are a widespread family of rock forming minerals with general formula (A
0–
1B
2C
5T
8O
22W
2); they are the most common heavy minerals in Alpine–Himalayan orogenic belts formed by continental collision [
1]. Amphiboles are formed under a wide range of pressures, temperatures and chemical environments, and their composition reflects the crystallization conditions providing important information on the metamorphic evolution of source areas [
2]. Some chemical properties of detrital minerals are directly revealed by optical features that are quickly identified and recorded during grain counting [
3]. Amphiboles, and in particular detrital amphiboles, thus represent accurate provenance tracers that can be profitably used in provenance studies. In the tremolite–ferro-actinolite series, □Ca
2Mg
5Si
8O
22(OH)
2–□Ca
2Fe
2+5Si
8O
22(OH)
2, the members can be distinguished by
X = Mg/(Mg + Fe
2+) ratio. The compositional range of tremolite extends from □Ca
2Mg
5Si
8O
22(OH)
2 to □Ca
2Mg
4.5Fe
2+0.5Si
8O
22(OH)
2 (0.9 ≤
X ≤ 1) actinolite extends from □Ca
2Mg
<4.5Fe
2+>0.5Si
8O
22(OH)
2 to □Ca
2 Mg
2.5Fe
2+2.5Si
8O
22(OH)
2 (0.5 <
X < 0.9), and ferro-actinolite extends from □Ca
2Mg
<2.5Fe
2+>2.5 Si
8O
22(OH)
2 to □Ca
2Fe
2+5Si
8O
22(OH)
2 X < 0.5 [
4].
A great variety of techniques can be applied for the identification of single crystal in sediments: optical microscope studies [
5], microprobe analysis [
6], Raman spectroscopy [
7], Fourier transform infrared spectroscopy and X-ray diffraction [
8]. In provenance studies and heavy-mineral analysis of sediments, Raman discrimination of amphiboles is not yet widely applied [
9]. Raman databases, mostly based on the OH stretching bands (3500–3800 cm
−1 spectral range), are sparse in literature. In this paper we have checked the advantages of the Raman spectroscopic approach and discussed limitations applying this technique on real samples and with different spectrometers in the laboratory and in the field. This study is intended as a complementary tool to the classical optical studies performed by polarizing microscope and it aims to help to distinguish, in a quick and representative way, the different suites of Ca-amphiboles commonly found in modern sediments. An additional objective is the reduction of the bias introduced by the different skill of each operator, always present during the optical assessment of amphibole colour in heavy-mineral slides. When analyzing rocks in the amphibolite-facies, the distinction between common blue-green hornblende and rare actinolite is important. It can be assessed by a well established and time consuming chemical analysis by SEM-EDS, but it is not easy to be achieved only through the optical properties collected during observation with a mineralogical microscope and by different operators. Extinction angle varies with chemistry but its measurement is affected by the orientation of the mineral in grain mounts. Even the different grain size (15–500 micron), normally observed under the microscope, strongly influences the colors and pleochroism of amphiboles for the same chemistry. This can be a major issue, as an example, during the analysis of detrital amphiboles in marine scientific expeditions where the suite of amphiboles to be recognized over a big sample requires a huge effort to achieve a proper identification. The discrimination made only by traditional optical techniques between tremolite and cummingtonite or between actinolite and grunerite requires a careful identification of subtle differences in birefringence and extinction, needing a very expert eye, with a high risk of errors.
In this work, we took advantage from the collections of heavy minerals from sediments, available at the Department of Earth and Environmental Sciences (DISAT) in Milano-Bicocca (Milano, Italy). The huge number of slides (more than 5500) prepared in more than 15 years for heavy mineral analyses, from samples collected in different geological settings and countries all around the world [
10], contain thousands of amphiboles embedded in Canada Balsam. For this study, we selected Alpine mineral samples in the tremolite–ferro–actinolite series, sometimes called nephrite series from the name of the green rock nephrite comprising massive cryptocrystalline felted calcic amphiboles of the homonymous series [
11]. The characterization was performed by micro-Raman spectroscopy and Scanning Electron Microscopy coupled with Energy-dispersed X-ray Spectroscopy (SEM-EDS), to obtain the relationship between the Raman spectra and the
X = Mg/(Mg + Fe
2+) ratio, with the aim to obtain a method for the estimation of the composition directly from the Raman spectrum. The attempt to obtain the composition of members of the nephrite series, and in particular the cation ratio
X by means of micro-Raman spectroscopy is not new. We start from the fundamental work on the cation distribution on amphiboles of Wang et al. [
12] and from the application of Raman micro-spectroscopy on the study of jades proposed by Chen et al. [
11] to develop a quick method for the identification of nephrite using both low and high wavenumber regions of the spectrum. The use of the method to realize composition maps in zoned crystals of actinolite is shown.
In addition, we evaluated the possible use of mobile instrumentation. This can extend the application fields for the Raman analysis of the calcic amphiboles, for example, in the field archaeology and conservation science. Nephrite is the main component of the so-called “true-jade” (the other main type of jade has pyroxene nature, being composed by the clinopyroxene jadeite Na(Al,Fe
3+)Si
2O
6). The identification of the composition of nephrite is then of great interest in archaeology and art history, giving information useful for provenance and authentication purposes. The use of a mobile Raman spectrometer can allow the study of archaeologic jade objects [
13,
14] in situ and in fast and completely non-invasive way. In addition, fibrous tremolite is considered an asbesto mineral, very dangerous for human health. The use of mobile Raman spectroscopy can allow a quick identification directly in the natural environment [
15].
2. Materials and Methods
The analyzed samples are twenty minerals in the tremolite–ferro–actinolite series, coming from different localities in the Alps, supposed to cover all the compositional range from nearly pure tremolite to ferro-actinolite terms (
Table 1). The samples were embedded in araldite resin and polished, in order to perform SEM-EDS analysis. On each sample, the same points were analyzed by SEM-EDS and micro-Raman spectroscopy according to the following strategy. We measured with SEM-EDS 8/10 points for each sample. Then we selected only homogeneous points in order to maintain the average compositional dispersion lower than 0.025 (taken as the uncertainty for SEM-EDS measurements). Then micro-Raman measurements (nearly 10) were performed as nearest as possible to the selected points. A new set of raw mineral specimens, in part overlapping the previous one, was used for the analysis with the portable Raman system.
Non-polarized micro-Raman spectra have been obtained on the mineral fragments embedded in the resin stab in nearly backscattering geometry with a Horiba LabRam apparatus (HORIBA Scientific, Kyoto, Japan), equipped with an Olympus microscope (Olympus, Tokyo, Japan) with 10×, 50×, ULWD 50× and 100× objectives and a motorized x–y stage. The 632.8 nm line of a He–Ne laser and the 473.1 nm line of a doubled Nd:YAG laser were used as excitation; the 632.8 nm line was mostly used to obtain high resolution spectra in the low wavenumber range (100–1200 cm−1), whereas the 473.1 nm source was utilized for higher efficiency in the detection of the OH stretching signals of the OH groups in the range 3000–4000 cm−1. Laser power (less than 1 mW on the sample) was controlled by means of density filters, to avoid heating effects. The minimum lateral resolution was about 1 μm (with the 100× objective), the depth resolution was set to few micrometers by means of a confocal hole. The spectral resolution was ~2 cm−1 (at 632.8 nm) and ~4 cm−1 (at 473.1 nm). The system was calibrated using the 520.6 cm−1 Raman band of silicon. In the high wavenumber range, the spectra were further calibrated using spectral lamps: in particular, for the OH stretching region, with the 473.1 nm laser, we used the main emission lines of Hg in fluorescent bulbs (546.07, 576.96 and 579.07 nm).
The spectra were collected using 100× and 50× ULWD (ultra long working distance) objectives. Several points for each samples were measured, with repeated acquisitions of 60 s each. A simple polynomial background subtraction was performed on each spectrum with LabSpec® software. The same program was used to perform spectral deconvolution, using Gauss-Lorentzian functions, to determine position, width and intensity (amplitude and area) of the Raman bands. With excitation at 632.8 nm, the position of the bands was obtained with an uncertainty better than 0.5 cm−1.
Raman maps were obtained on a rectangular matrix of 9 × 11 points in an area of 40 × 75 square micrometers. The acquisition time for each point was 30 s. A gray tone image was obtained by associating the lightness to the position of the actinolite main peak in the range 660–680 cm−1. A smoothing in the digital map was performed for a best comparison with the microscope photograph of the same area.
In addition, Raman spectra have been obtained on some raw samples, not embedded in resins, with a high resolution confocal Raman microscope (Renishaw inVia Reflex, Renishaw, Wotton-under-Edge, UK), equipped with a Leica DM2500 polarizing microscope (Leica Microsystems, Wetzlar, Germany), with a 50× LWD (long working distance) objective and motorized x–y stages. Spectra were obtained by the 532 nm line of a solid-state laser with a power of few mW at the sample, spectral resolution of ±0.5 cm−1 and acquisition time of 2 min.
Raman measurements were also made with a portable instrument: a handheld Enspectr RaPort
® spectrometer, equipped with a 532 nm laser (max power 30 mW, used at half power) with a spectral resolution of ~8 cm
−1. The laser spot is approximatively 0.5 mm. The wide measurement range (100–4000 cm
−1) makes this tool a good choice for the in situ study of hydrous silicates [
16,
17]. The instrument has a weight of nearly 2 Kg and is operated by a laptop through USB 2.0 connection. Typical acquisition times are of the order of 60 s, but some dark samples required longer acquisition times.
SEM-EDS measurements have been performed on the mineral samples embedded in resin stab. Samples were analyzed for their major elements with a Tescan VEGA TS Univac 5136 XM scanning electron microscope coupled with an EDAX Genesis 4000 XMS Imaging 60 SEM-EDS at the University of Milano-Bicocca, Milano, Italy, under an electron beam accelerated at 20 kV, with 250 nm spot size and a current of 190 ± 1 pA, The quantification was obtained using natural standards (Astimex Scientific Ltd, Toronto, ON, Canada). Counting time was 100 sec plus deadtime (25%). ZAF matrix correction was applied. The Fe
3+ content was calculated according to Hawthorne et al. [
4] and end member according to IMA classification [
4,
18].
3. Results and Discussion
The chemical composition of the samples of the main set obtained by SEM-EDS is reported in
Table 2. All the investigated samples belong to the nephrite series of calcic amphiboles, and range from pure tremolite (sample #21) to Fe-actinolite (sample #17). Some samples of tremolite contain small amount of iron (up to 3.26 wt % FeOt) and aluminium (up to 3.68 wt % Al
2O
3). The actinolite samples show a variable concentration of iron (5.27–13.16 wt % FeOt) with Fe
3+ ranging from 0 to 0.325 apfu. Some actinolites have small content of chromium (up to 0.80 wt % Cr
2O
3).
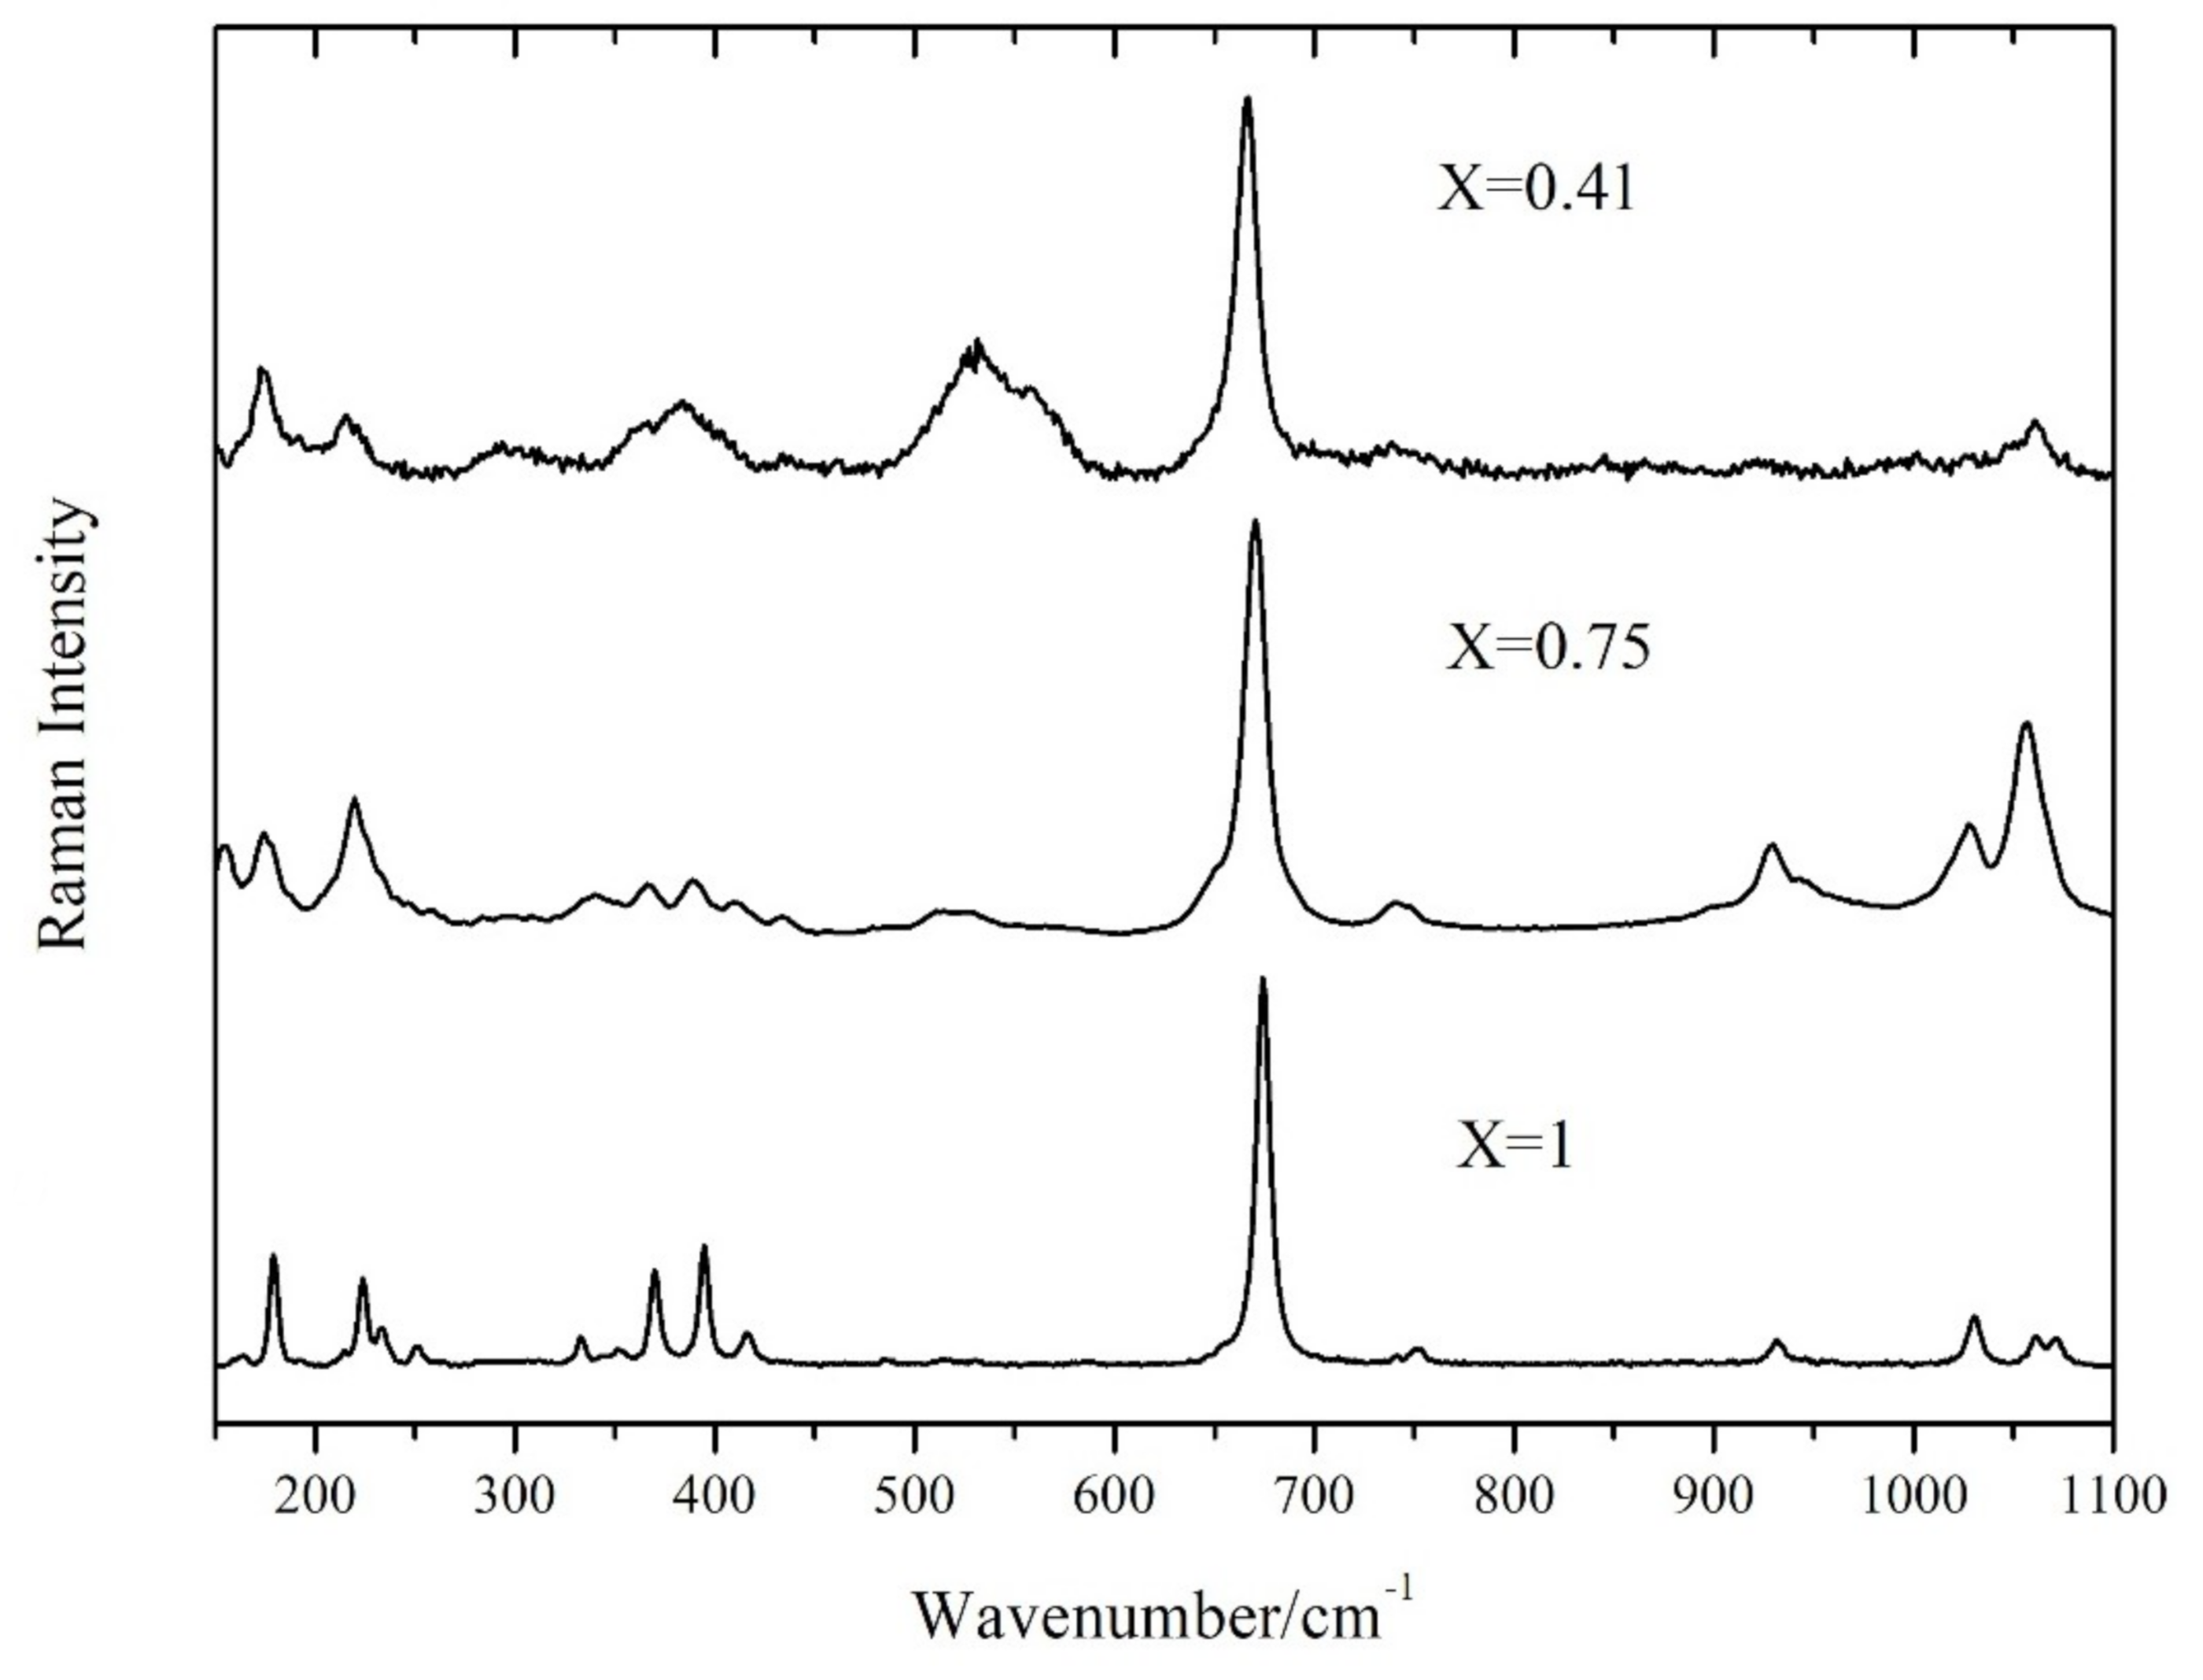
The Raman spectrum of tremolite and actinolite between 100 and 1100 cm
−1 (
Figure 1) is characterized by the typical features of the spectra of amphibole minerals [
19,
20,
21]. A possible schematic representation is the following: under 200 cm
−1, lattice vibrations; between 300 and 600 cm
−1, Mg–OH and Fe–OH vibrations, Si–O–Si bending motions and OH
− librations; between 650 and 750 cm
−1, the strong Si–O–Si symmetric stretching, over 750 cm
−1, the O–Si–O symmetric stretching and the O–Si–O and Si–O–Si asymmetric stretching motions.
As Mg is substituted by Fe2+, the Raman bands broaden; the main band at nearly 670 cm−1 changes its width (FWHM) from 9 cm−1 for pure tremolite (X = 1) to 18 cm−1 for Fe-actinolite (X = 0.41). Some of the minor peaks are no more resolved and merge into broad features.
The main feature of the Raman spectra in the low-wavenumber region, at nearly 675 cm
−1, is the Si–O–Si symmetrical stretching (
Figure 1) with A
g symmetry. This mode, when substituting Mg
2+ with the heavier Fe
2+, downshifts from 675 cm
−1 in pure tremolite to 667 cm
−1 in Fe-rich actinolite (
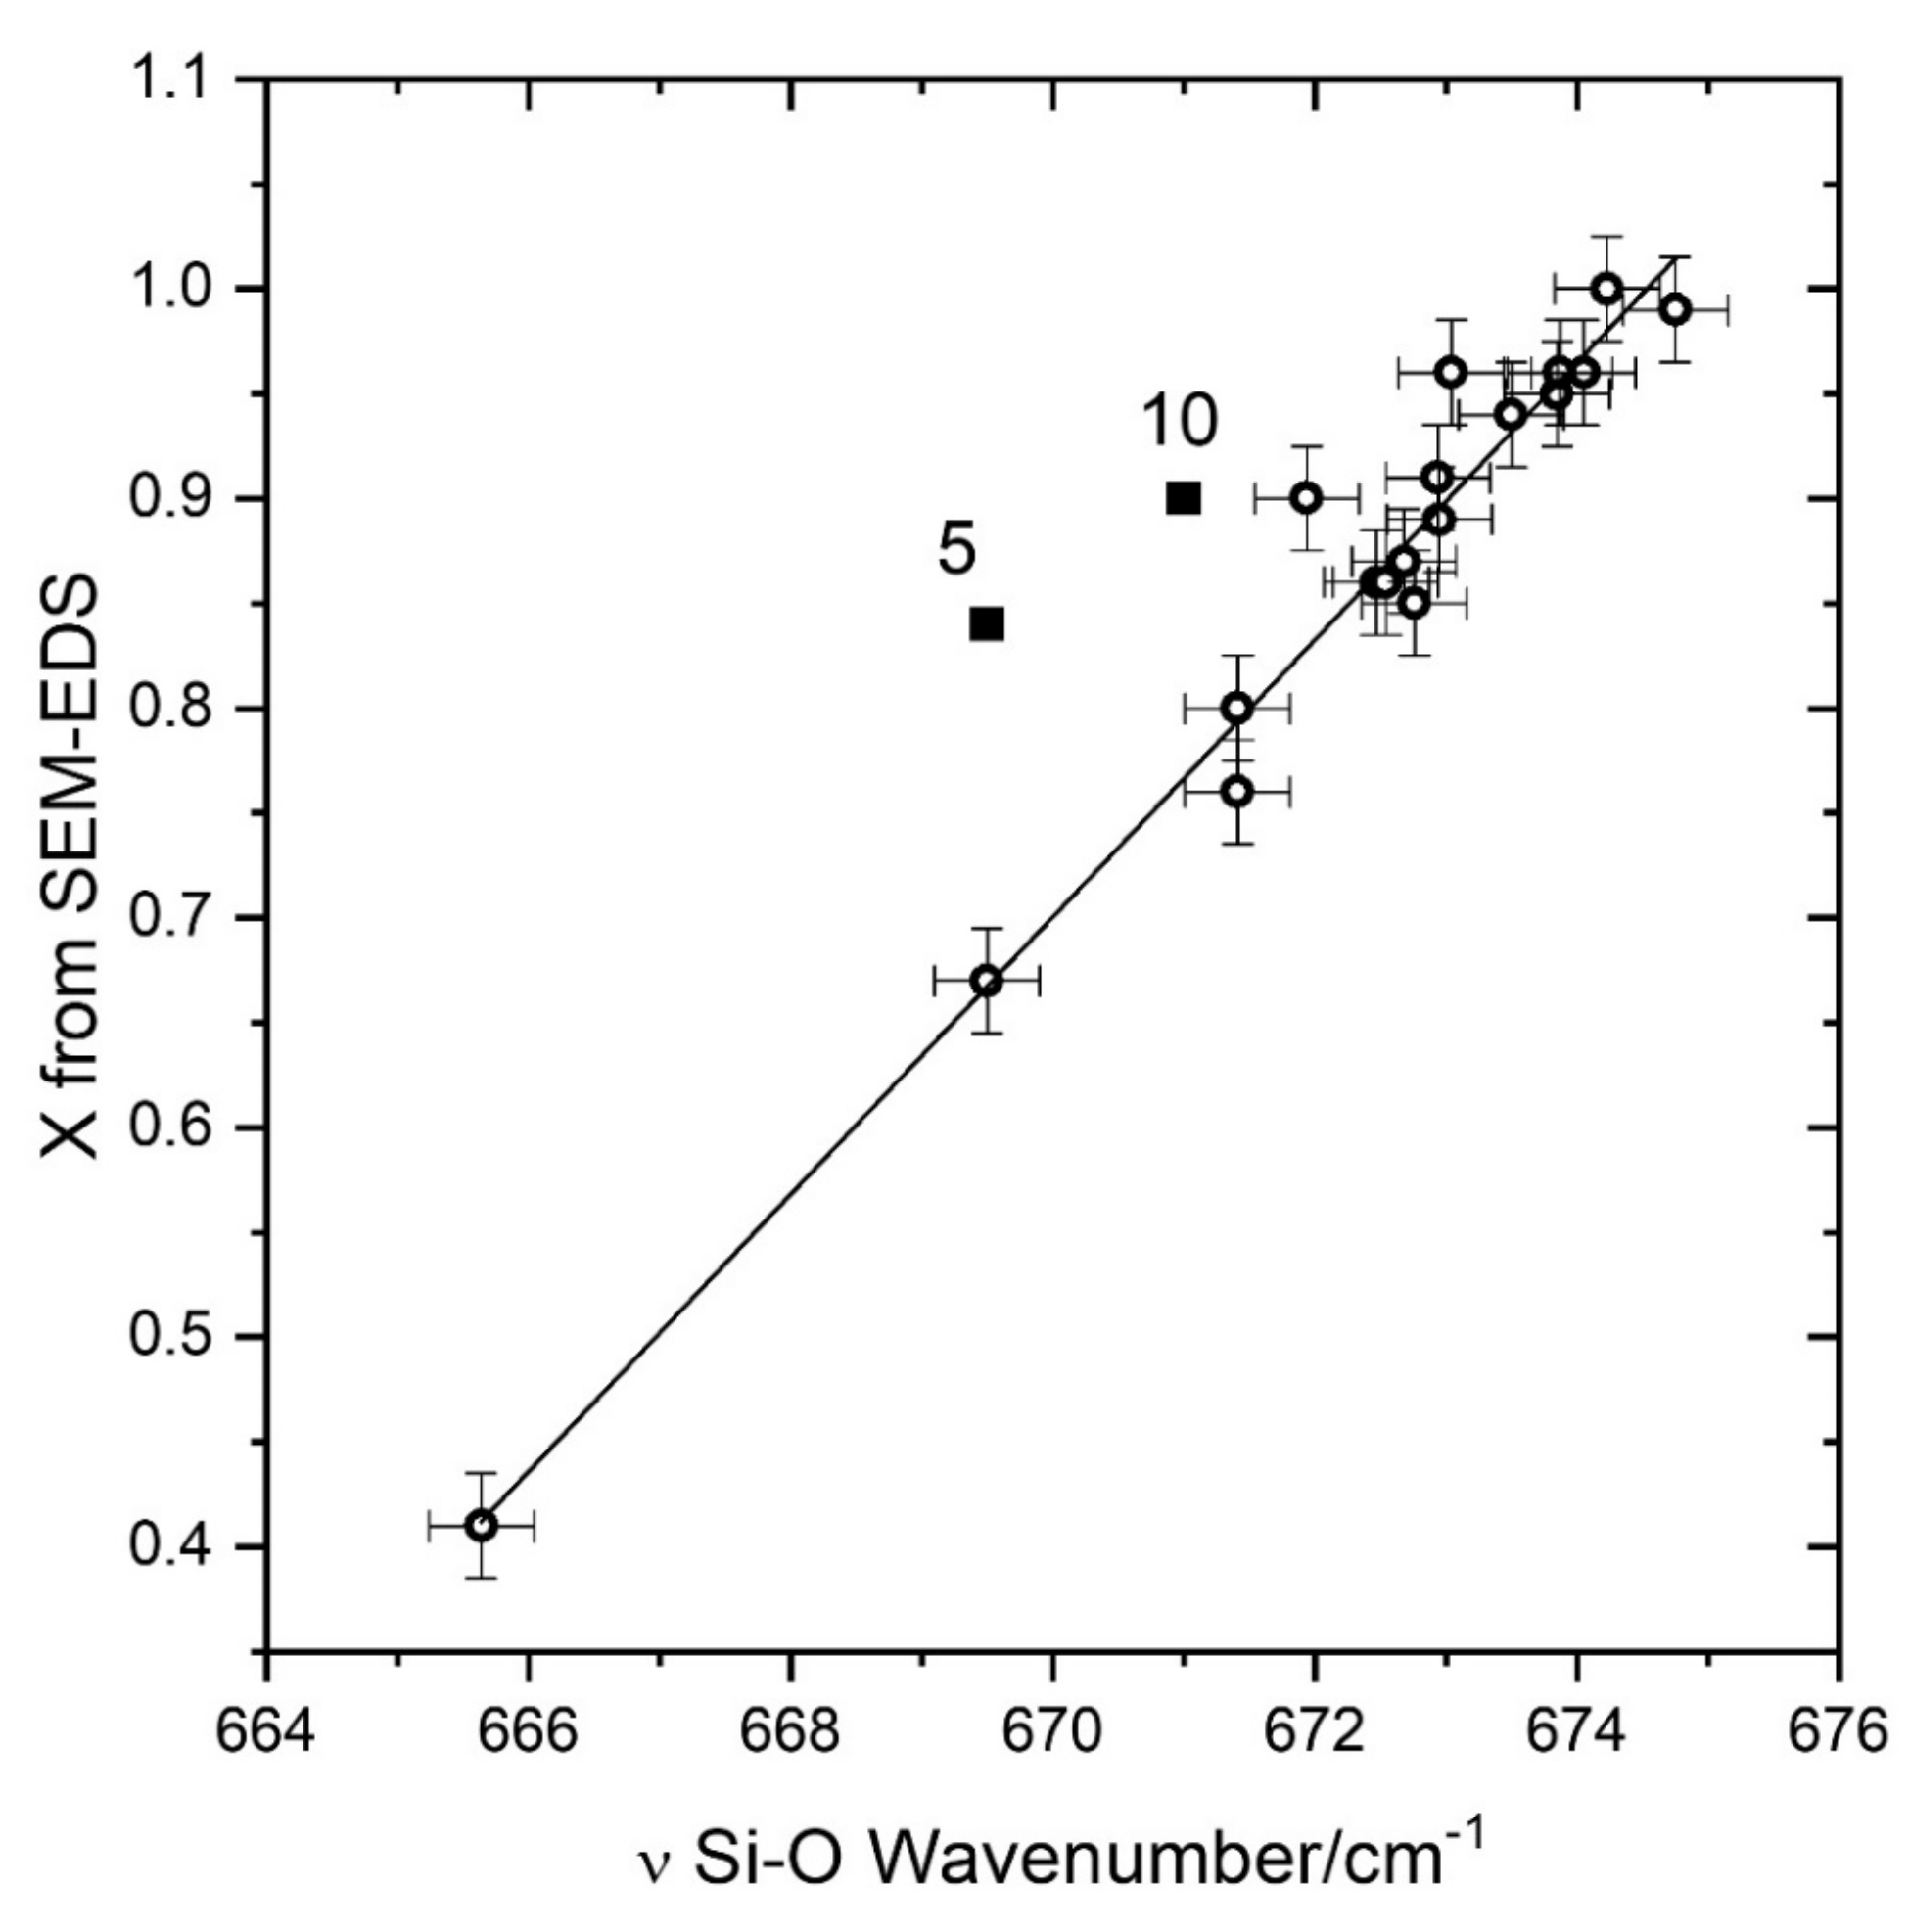
X = 0.41, at the border with Fe-actinolite). A linear trend of the wavenumber with composition is expected by the one-mode behavior usually shown by Si–O vibrations in chain silicates and in particular in amphiboles [
22]. This trend is clearly evidenced in
Figure 2. A linear interpolation allows to obtain a simple formula relating the position of the main A
g band with the X ratio as obtained by SEM-EDS data (see
Table 2):
X = 0.066 × (
ν − 659.3), where ν is expressed in cm
−1 and 659.33 is the ν value for
X = 0, as obtained from the interpolation. The least squares linear fitting procedure returned a value of the coefficient
R2 = 0.962 and the standard errors on the slope (0.003). The intercept is zero with a standard error of 0.04. The standard error on X obtained from the interpolation is 0.03.
Only two points (not used in the interpolation procedure) are markedly far from the straight line, related to two samples presenting specific analysis problems. The first one is related to sample #5, very small with a large compositional variability (e.g., Fe2+ amount ranges from 0.58 to 1.27 in different points) and showing a small amount of Mn, able to occupy M4 as well as M1, M2, M3 sites. The second point is related to sample #10, highly zoned with large variations in composition. For these two samples, the main source of error is the compositional gradient near the analysed points; a small error in the position can produce a big change in the X value or in the wavenumber of the main Raman peak giving useless results. The parameters obtained from the linear interpolation represent a first tool useful to determine the composition of minerals in the nephrite series from a quick Raman spectrum. This method requires a very good wavenumber calibration of the spectrometer, but it can be also used when noisy or weak spectra are obtained, being based only on the position of the most intense Raman peak.
We verified the shift to lower frequencies of the main A
g peak with the increase of iron, by making a micrometric Raman map (10 × 5 points) on a zoned, needle-shaped, tremolite crystal coming from Alpe Rosso (Vigezzo Valley, Italy). As visible in the microscope image (
Figure 3 top) the green color, due to the presence of iron, increases from left to right (nearly along the maximum elongation of the crystal). The grey color map (
Figure 3 bottom) represents the position of the A
g main band: lower lightness means lower wavenumber (higher Fe amount). As expected, the intensity of green color in the picture is well paralleled by the dark parts of the Raman map.
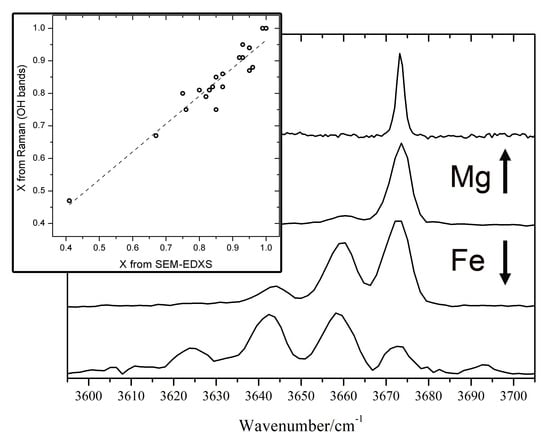
In the high-wavenumbers region (3600–3700 cm
−1) a number of OH stretching bands (from 1 to 4) is present. The number and relative intensity of these bands depend on the X value. This is due to the fact that in amphiboles the OH groups are bonded to 3 sites indicated as C in the general chemical formula. Theses C-sites are usually occupied in nephrites by Mg
2+ and Fe
2+ ions. The frequency of the OH stretching vibrations is then influenced by the population of the 3 nearest C-sites [
11,
12,
20,
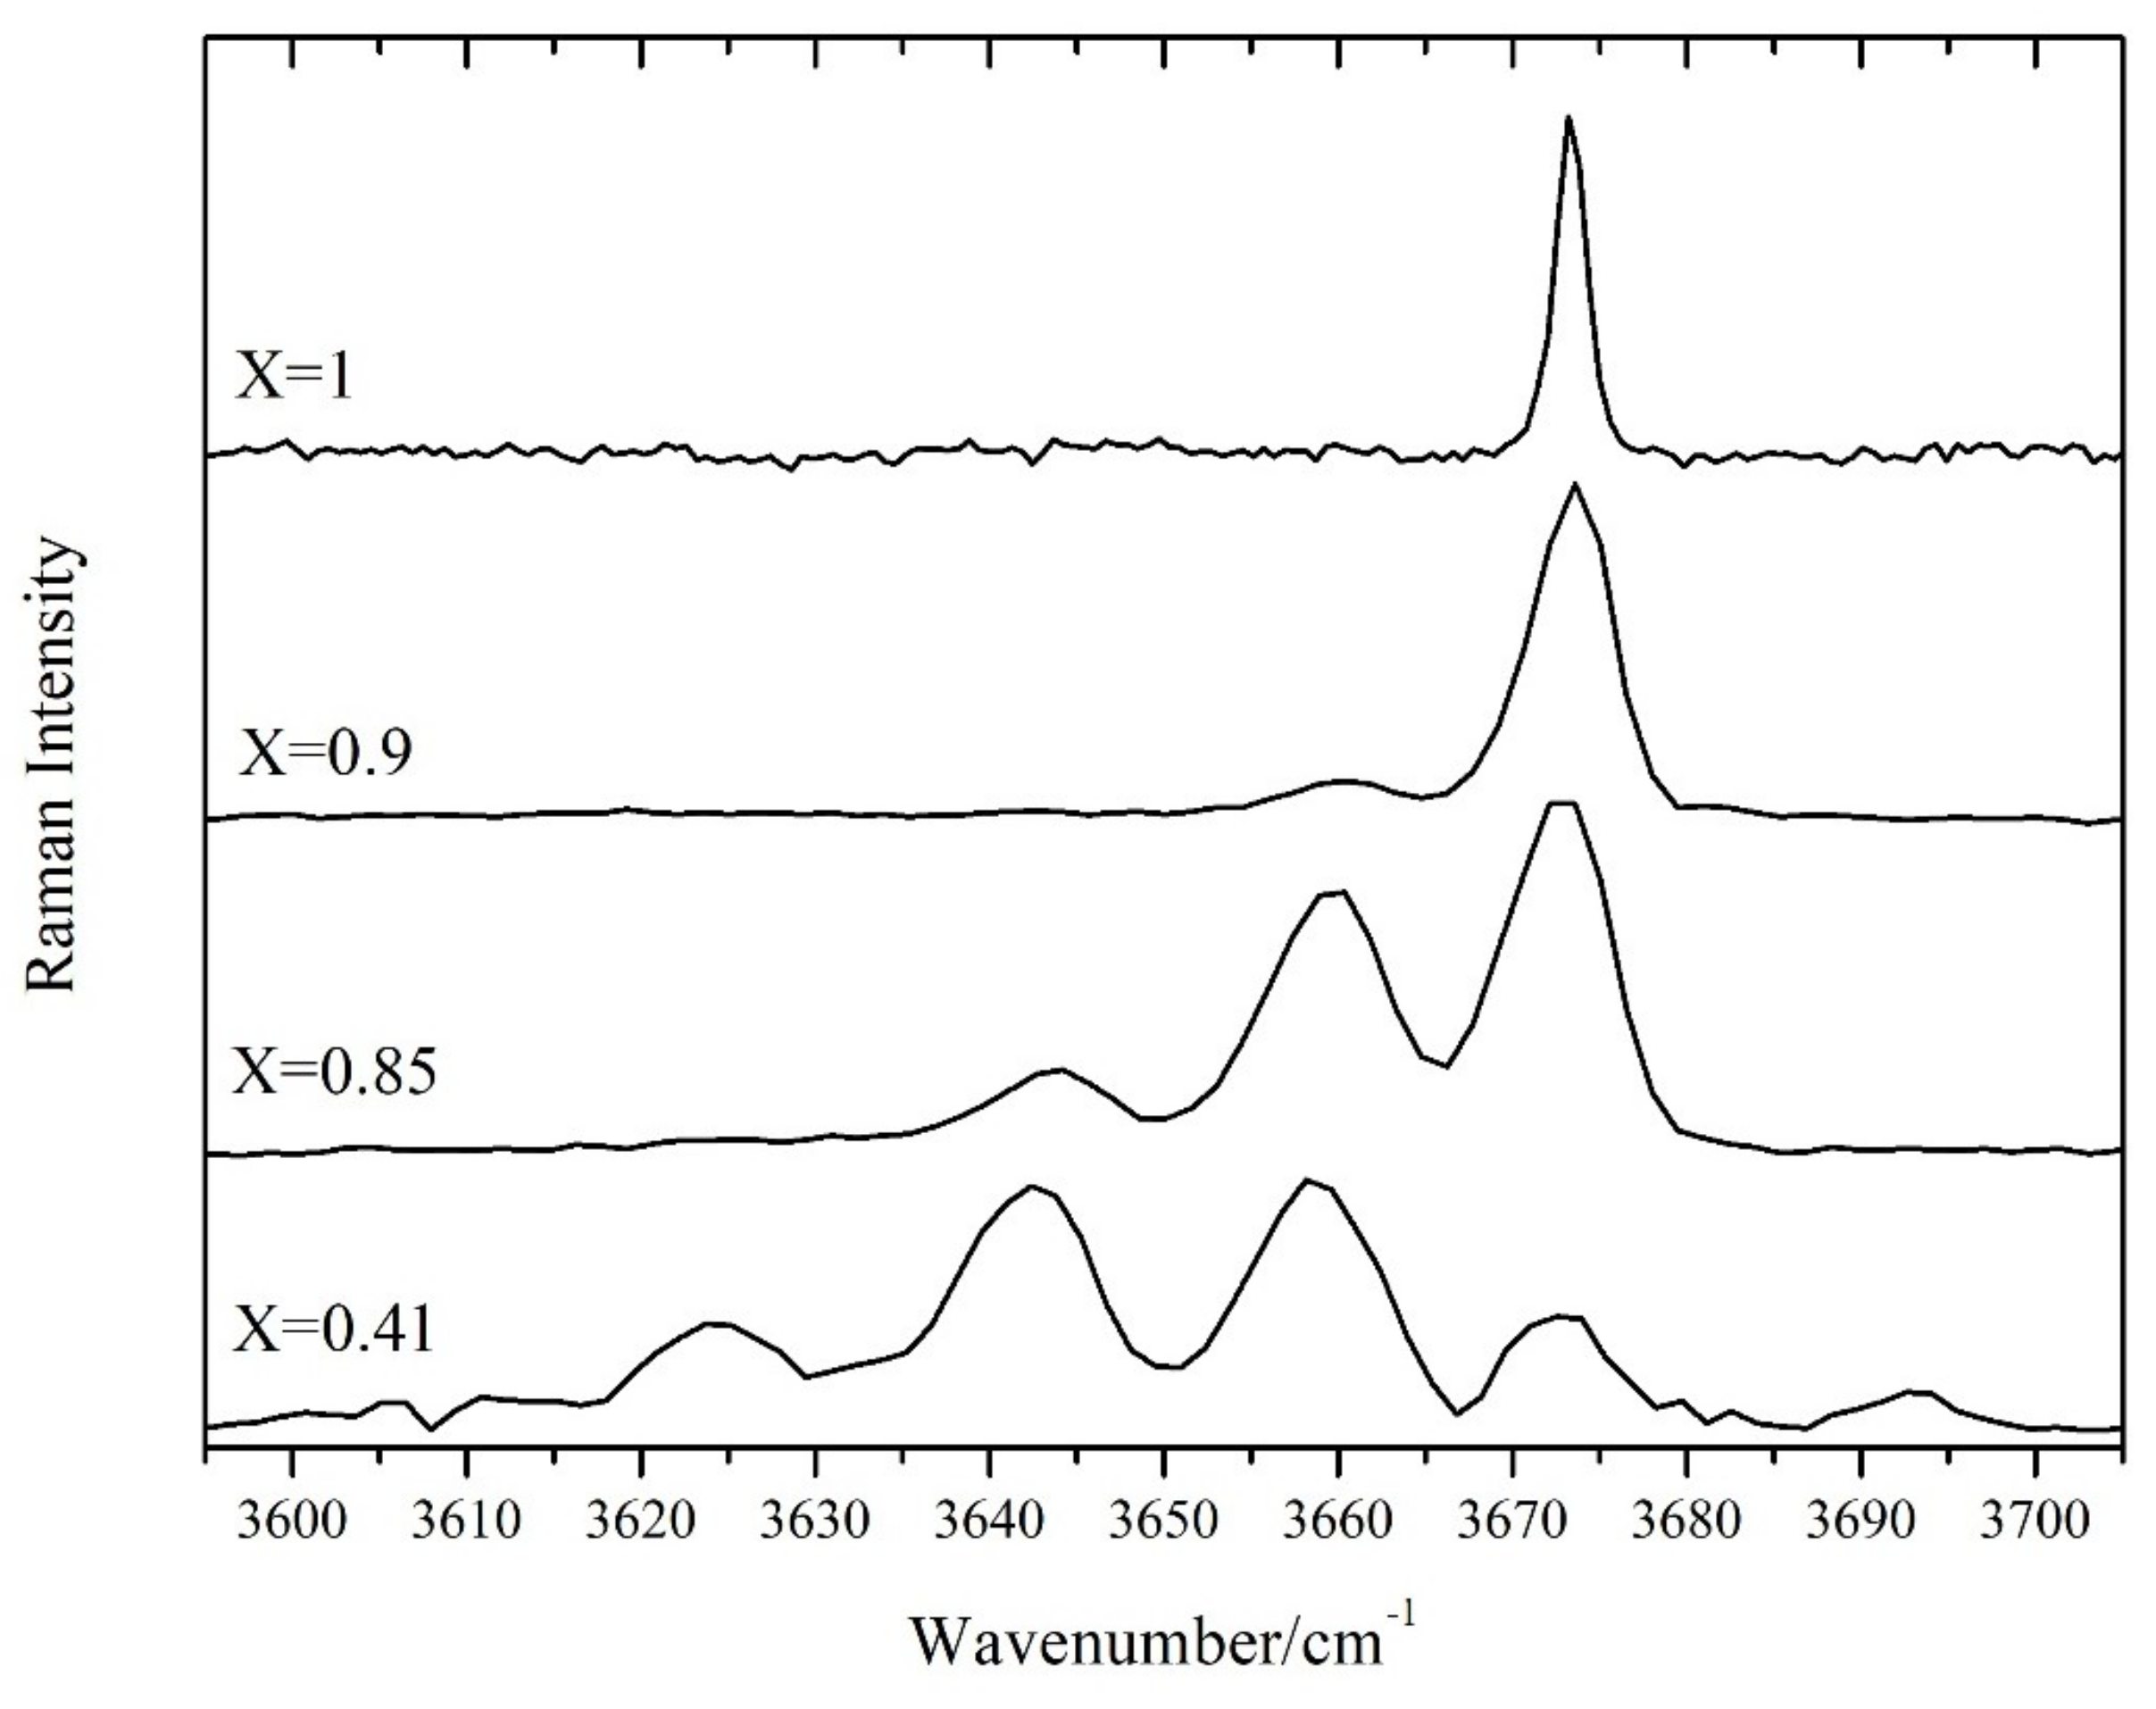
23]. The OH stretching mode shows a two-mode behaviour, meaning that for every different atomic configuration, a different Raman peak arises [
20]. When only Mg is present (as in pure tremolite), only one peak (at 3675 cm
−1) is observed. As the amount of iron increases, the other peaks, related to different combinations of Fe
2+ and Mg
2+ in the sites close to OH, arise at lower wavenumbers (
Figure 4). We built a simple statistical model, using the binomial distribution, based on the hypothesis that the 3 sites close to OH are randomly occupied by Fe
2+ and Mg
2+ ions, with a probability proportional to their relative amount. The area of the OH Raman bands at about 3675 cm
−1 (OH surrounded by 3 Mg
2+ ions) will be proportional to X
3, while the area of the band at 3660 cm
−1 (OH surrounded by 2 Mg
2+ and 1 Fe
2+ ions) will be proportional to 3
X2(1 −
X). The ratio between the two bands is then A
12 =
X/[3(1 −
X)]. In this way we obtain another relation useful to estimate the
X value from the Raman spectrum:
X = (A
12)/(1/3 + A
12).
In
Figure 5 the composition (
X value) estimated from the areas of the OH bands and that measured by SEM-EDS is shown: a good agreement is observed, with a very slight tendency of the “OH bands” method to underestimate
X. Only for a sample (#3), with composition far from ideal nephrite, with many extra ions, the obtained values differ more than 0.1. The standard error on X obtained with this method, calculated from the differences between Raman (OH bands) and SEM-EDS data is 0.04.
The simple equation
X = (A
12)/(1/3 + A
12), gives results comparable with those obtained by the equation proposed by Chen et al. [
11] but the latter is based on the intensity of all the OH features, while our calculation requires only the intensity of two peaks, usually the most intense ones in the Mg-rich samples and easy to measure. The choice to work with only two peaks was made in order to obtain compositional information even using noisy spectra, with just the most intense peaks emerging. This can be important when working on the field, with real samples, or maybe in a museum when the object can be analysed only with a contactless technique and for a short time. A disadvantage is that this method strongly relies on the hypothesis of a random distribution of the cations, that could be not true. However, the cross-check with the other methods (the low-wavenumber method presented before and the method proposed by Chen et al. [
11]) indicate that the possible deviations from the randomness are not relevant. The evaluation of the composition (X value) from the ratio of the intensities of the OH stretching bands is not affected by the wavenumber calibration of the instrument and can be made independently of that obtained from the position of the main A
g peak.
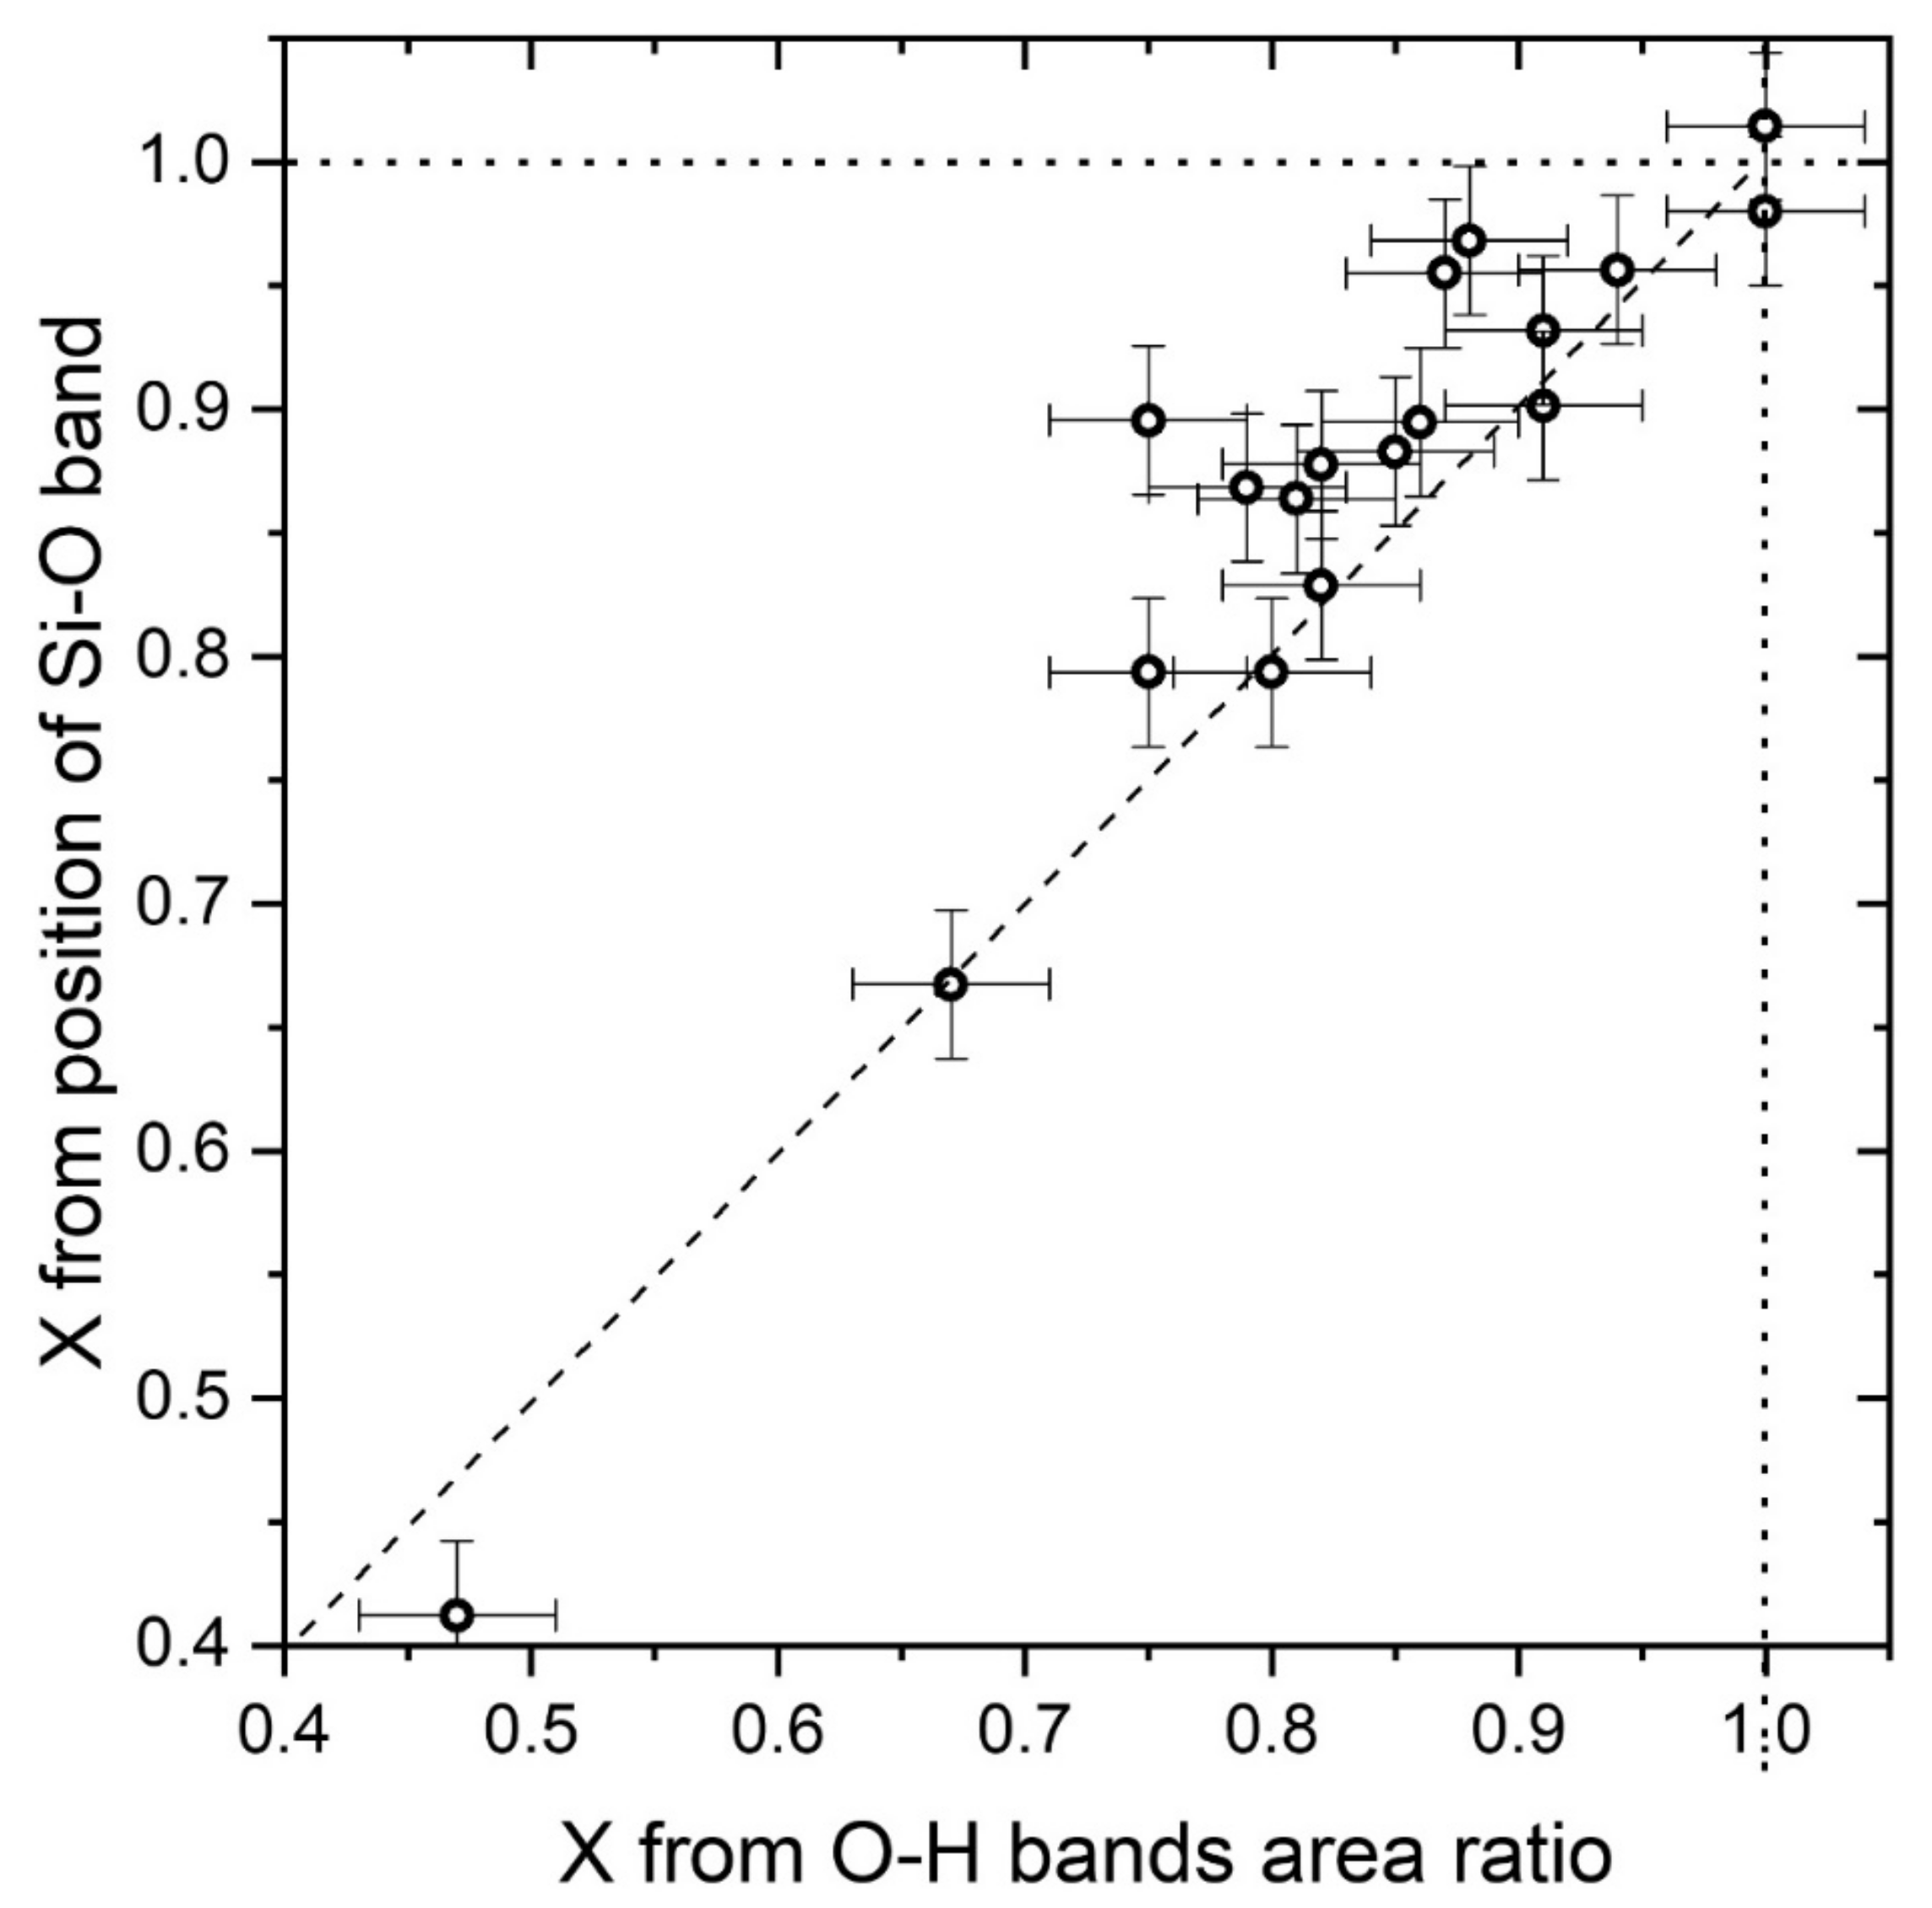
The comparison between the two proposed methods is shown by
Figure 6 where the
X values obtained starting from the position of the main Raman band at nearly 670 cm
−1 and from the area ratio of the OH Raman stretching bands are compared. The two methods give comparable results, but the
X values obtained with the “OH stretching” method are in most cases slightly lower (the average difference is 0.05) than those obtained by the “Si–O stretching” one. This difference is probably due to a slight underestimation provided by the “OH stretching” method, as already suggested by
Figure 5. Deviations of the real amphiboles from the theoretical behaviour expected by our statistical model as well as the non-flat spectral answer of the spectrometer can be between the causes of this difference. On the other hand,
X values obtained by the “Si–O stretching” method have a better dispersion (see
Figure 2), as expected from an empirical procedure. For that reason they can be considered more reliable, but only when a perfect calibration of the spectrometer is provided.
To evaluate the possible effect of Fe3+ on the position of the Si–O stretching main band and on the area of the OH stretching bands, we replotted the graphs and recalculated the parameters using the total amount of iron (Fetotal) instead of Fe2+. The obtained trends are very similar and the obtained parameters (including the estimated X values) show variations largely smaller than the calculated uncertainty. For that reason, and because the definition of tremolite and actinolite depends on the Mg/(Mg + Fe2+) ratio, we decided to not include Fe3+ in the calculations.
The possibility to obtain compositional information on the X value in situ, for example directly on the outcrops or in a museum environment, using a compact portable instrument, was then evaluated. Due to the impossibility to analyze micrometric crystals or very small felted clusters, a partly different set of minerals was used. Of course, due to the large spot, possible thin zonations are averaged.
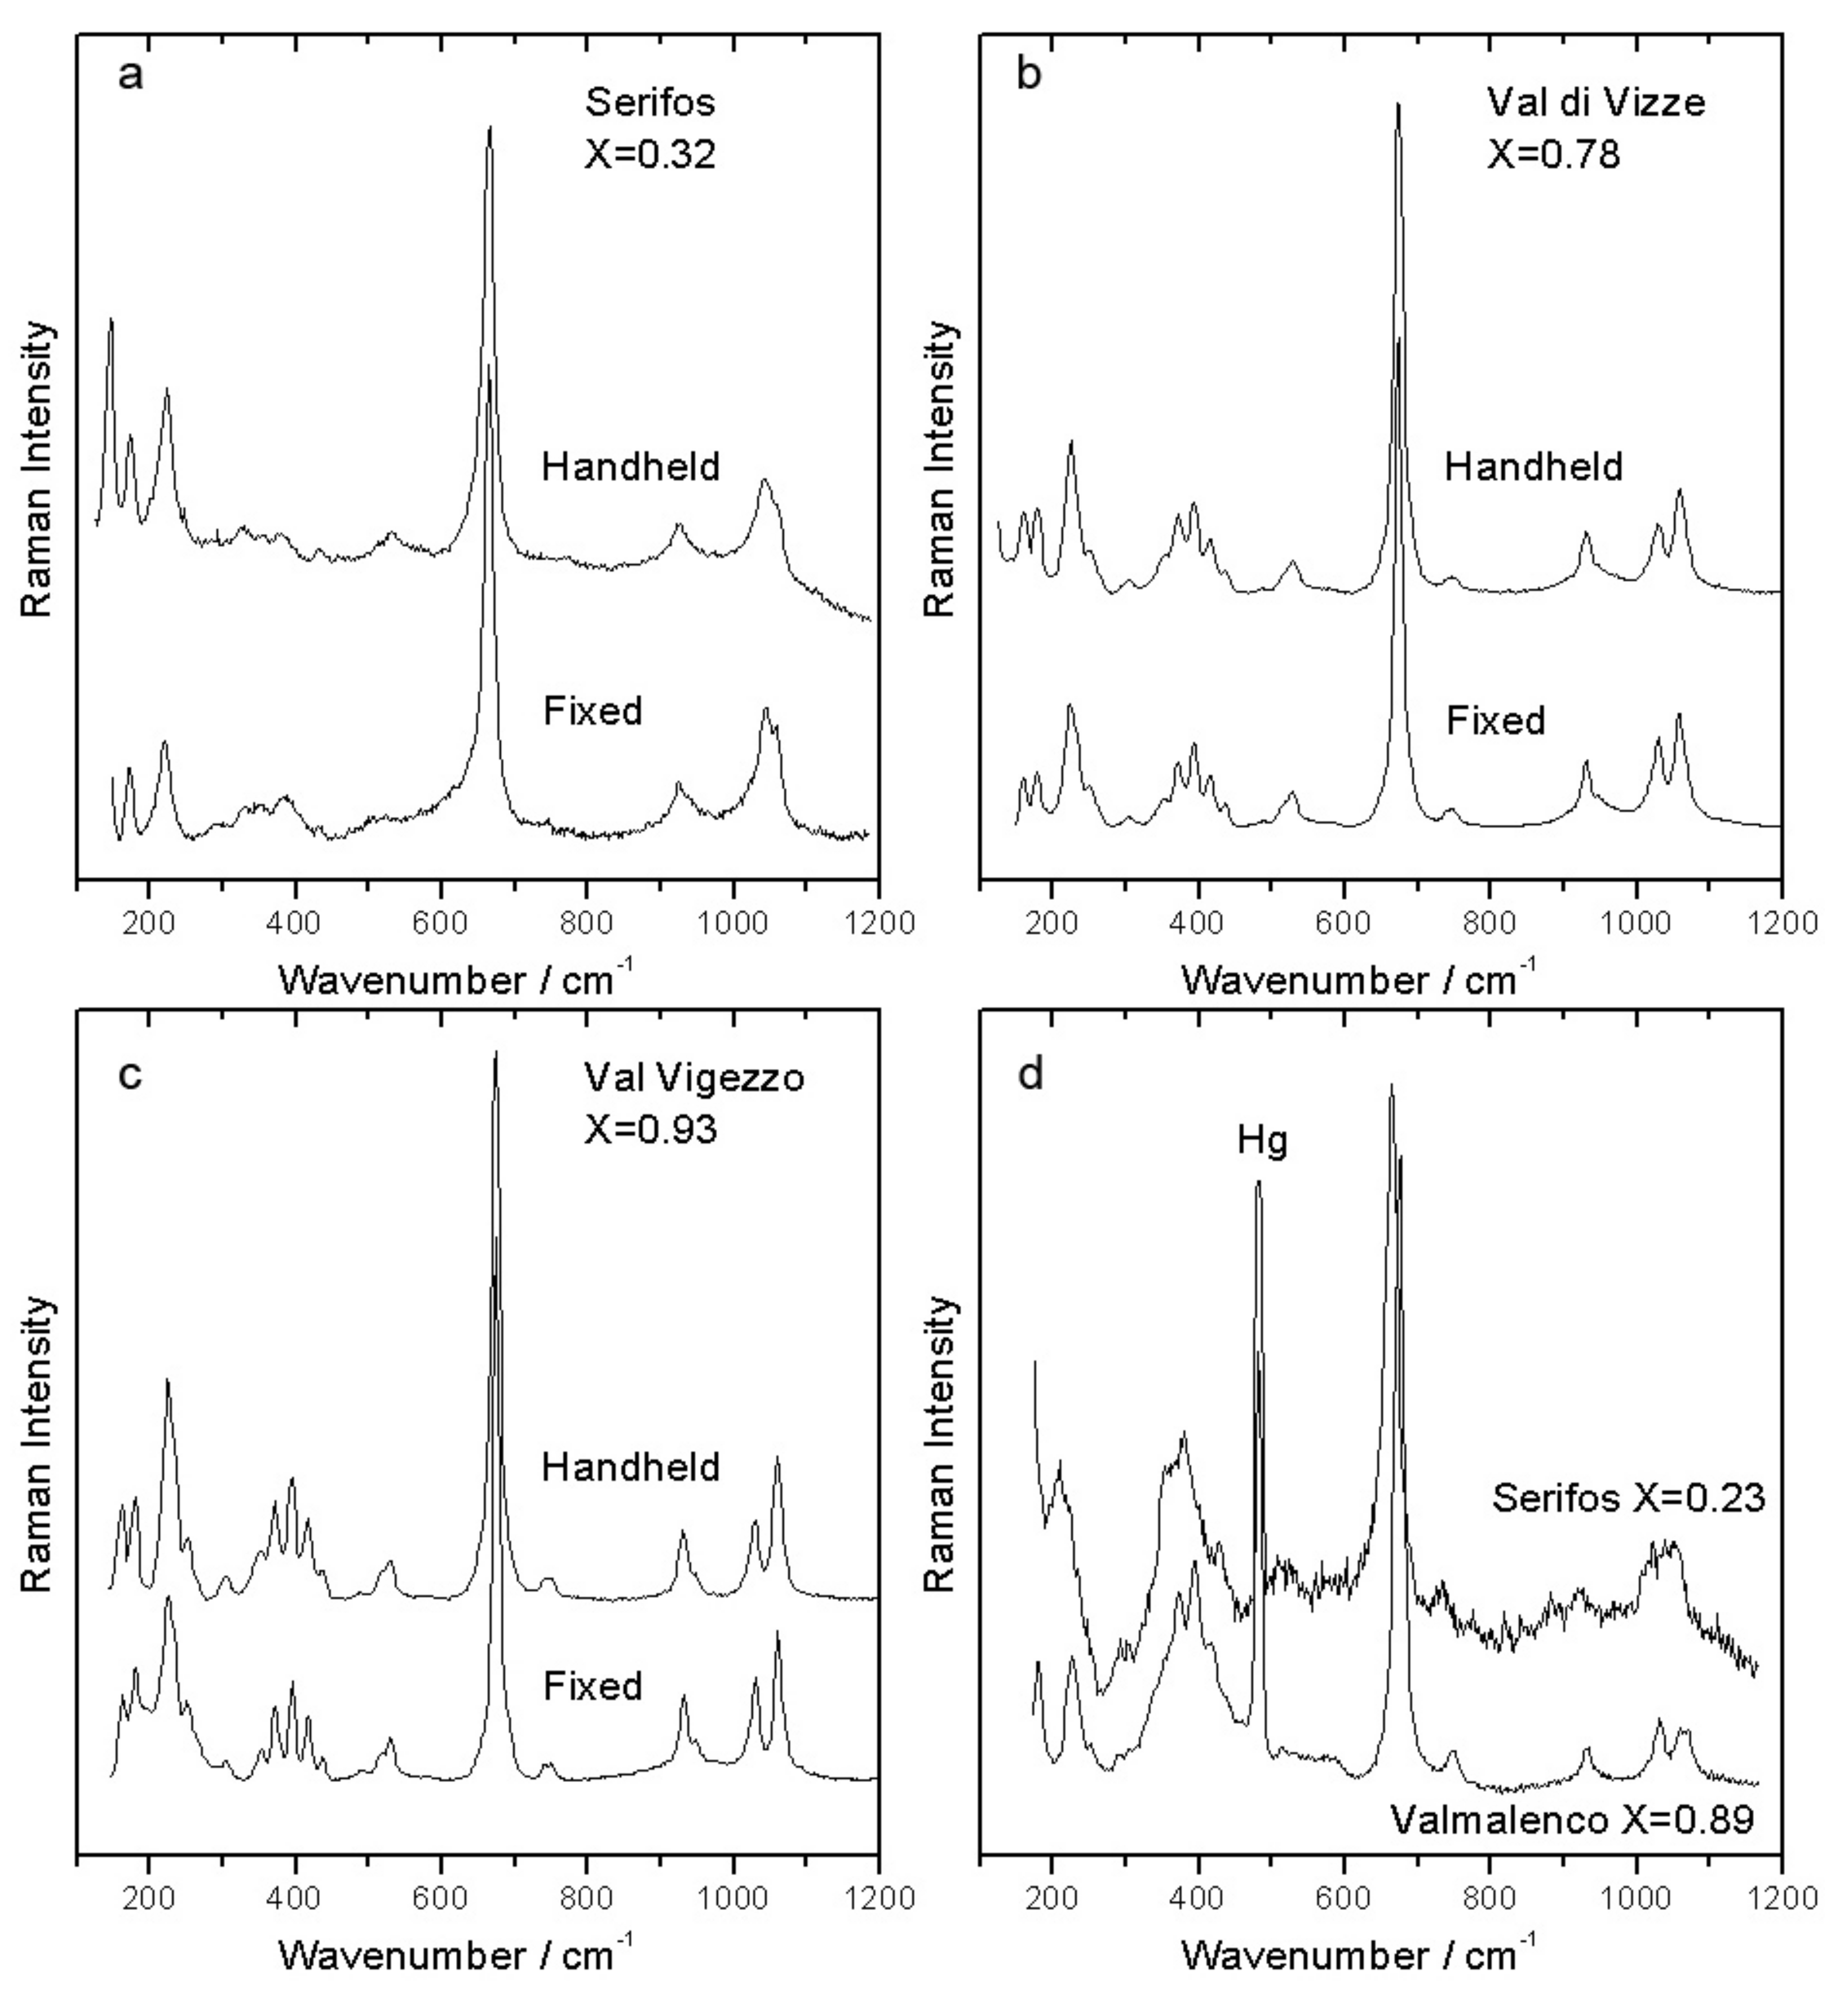
A comparison between some spectra obtained using the micro-Raman and the mobile Raman spectrometers is reported in
Figure 7 (low wavenumber range) and
Figure 8 (high wavenumber range).
It is clearly visible (
Figure 7a–c) that in the low wavenumber range the spectra obtained with the handheld spectrometer are of good quality, often comparable with those obtained with the micro-Raman apparatus, despite the lower spectral resolution. The mobile instrument has a fixed geometry and cannot be calibrated with the required precision. For this reason the position of the Raman bands is not enough accurate to obtain the X composition from the wavenumber of the main A
g mode. However, when a reference line is present (e.g. the strong 546 nm line of a common fluorescent tube, appearing at 485 cm
−1 in the spectrum), the difference in position of the main A
g mode between iron rich (“Serifos”) and iron poor (“Valmalenco”) terms is clearly detectable (
Figure 7d).
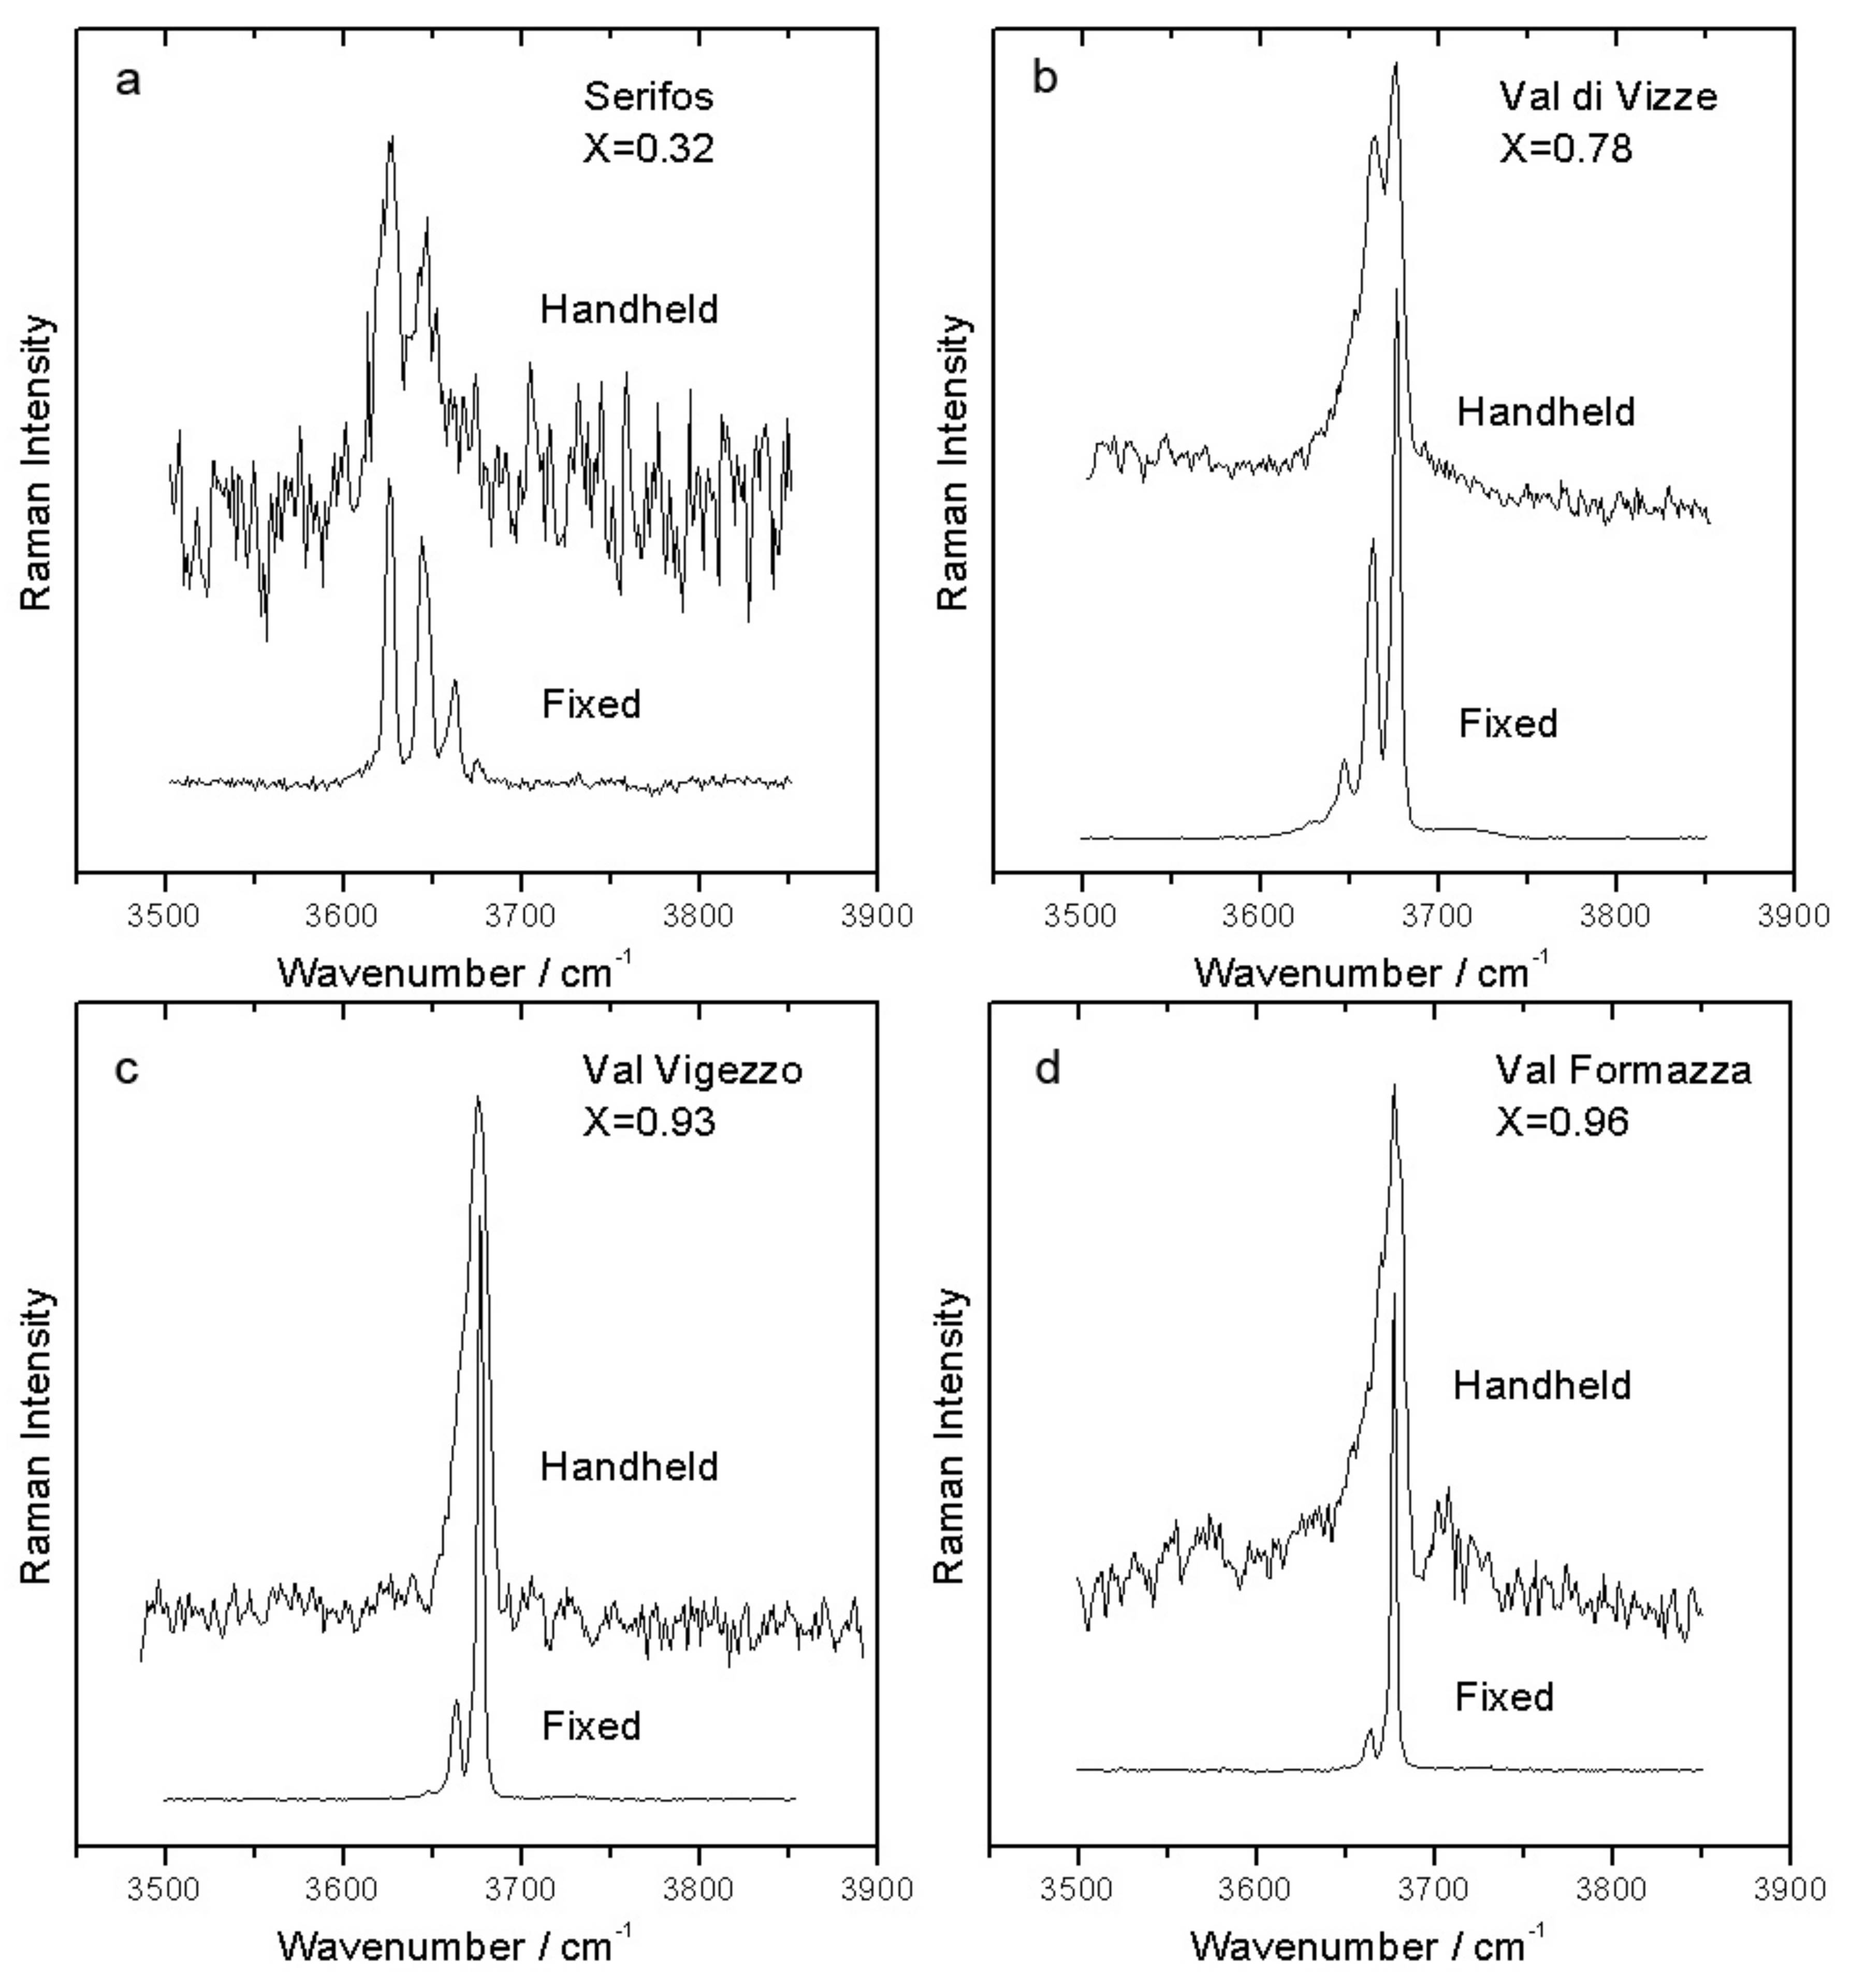
In the high wavenumber range (
Figure 8), the spectra obtained with the mobile spectrometer on the nephrite minerals are very weak and noisy, because the OH stretching bands are in a region near the limit of the spectral window measured by our handheld spectrometer, with a very bad signal to noise ratio. Even with very long acquisition times (several minutes) it is difficult to observe clean OH stretching peaks. Nevertheless, the distribution of the intensities between the various peaks well reflects that obtained with the micro-Raman spectrometer. Even if the quality of the spectra is not enough to give a quantitative estimation of
X, it is still possible to distinguish between iron-rich and magnesium-rich terms of the series.
One of the macroscopic samples (Serifos) used for the test of the mobile Raman spectrometer show the spectral features of a very Fe-rich ferro-actinolite. For that reason we decided to measure its composition even with SEM-EDS, obtaining X = 0.31. The X value calculated from the position of the main Si–O stretching band measured with a micro-Raman spectrometer (ν = 664.2 cm−1) is X = 0.32, in very good agreement with SEM-EDS. To estimate the X value from the areas of the OH stretching bands in Fe-rich samples, it is possible to use the ratio (A43) between the two strongest bands related to (Fe,Fe,Fe) and (Fe, Mg, Mg) configurations to calculate 1 − X = (A43)/(1/3 + A43). For the Serifos sample we obtained X = 0.25, not far from the value obtained by SEM-EDS. These results confirm the validity of both Raman-based methods in the Fe-rich region of the series.

 ,
, 


