Thermal Transport Properties of Olivine, Wadsleyite, and Ringwoodite—A Review

1
Key Laboratory for High-Temperature and High-Pressure Study of the Earth’s Interior, Institute of Geochemistry, Chinese Academy of Sciences, Guiyang 550081, China
2
University of Chinese Academy of Sciences, Beijing 100049, China
*
Author to whom correspondence should be addressed.
Minerals 2019, 9(9), 519; https://doi.org/10.3390/min9090519
Submission received: 21 June 2019
/
Revised: 20 August 2019
/
Accepted: 23 August 2019
/
Published: 29 August 2019
(This article belongs to the Special Issue Olivine and Its High-Pressure Polymorphs, with Applications in Earth Sciences)
Abstract
:Knowledge of the thermal diffusivity D and thermal conductivity κ of olivine and its high-pressure polymorphs, wadsleyite and ringwoodite, is crucial to understand the heat transfer efficiency and thermal structure of Earth’s mantle. In the last few decades, great progress has been made in measurement techniques and experimental results seeking to determine the thermophysical properties of geomaterials. The aim of this paper is to provide a systematic overview of the current knowledge of the thermal transport properties of olivine and its high-pressure polymorphs, their dependence on factors, such as pressure, temperature, and composition, and physical models to describe their variations. Some related geoscience applications and perspectives for the future are also suggested.
1. Introduction
Heat transfer is a common phenomenon in nature. Thermal diffusivity D and thermal conductivity κ, as the most basic parameters of heat transfer properties, are widely used in energy, the chemical industry, materials science, and other fields. The heat transfer properties of mantle minerals play an important role in Earth’s numerous geodynamic processes, such as its thermal evolution, thermal state, and mantle convection [1,2,3,4,5]. Understanding the D and κ of silicate minerals through experimental measurements or theoretical determinations allows us to assess various thermodynamic conditions in many natural environments where thermal transport is primarily controlled by major silicates.
Olivine (α-phase) and its high-pressure polymorphs, wadsleyite (β-phase) and ringwoodite (γ-phase), are believed to be the major constituent minerals (~60 vol. %) of Earth’s upper mantle and transition zone [6]. Thus, α→β and β→γ phase transitions are widely considered to be responsible for 410 km and 520 km discontinuities. The thermal model of the lithosphere and the thermal structures of the upper mantle and transition zone strongly depend on the heat-transport properties of olivine and its high-pressure polymorphs due to the volume fraction that is dominant in their respective stable fields [1,7,8,9,10,11,12].
Considerable efforts have been made over the last several decades to develop experimental measurement techniques and determine the D and κ of minerals and rocks. Bridgman [13] first used the steady-state radial heat flow method to measure the κ of several rocks under high pressure. Parker et al. [14] then proposed a laser-flash method to determine D, heat capacity, and κ. This method was further improved [15,16,17,18,19] and other techniques, such as the Ångström method [20,21,22], the plane heat source method [23,24,25], and the light pulse thermoreflectance technique [26], were developed using different high-pressure apparatuses. Large amounts of experimental results on the thermal properties of olivine group minerals obtained by using different experimental approaches have been reported [1,11,20,21,22,24,27,28,29,30]. The main purpose of this paper is to critically review the available data on the D and κ of olivine and its high-pressure polymorphs in the literature. We first describe basic principles, influencing factors, and experimental methods, and then discuss published data and their geoscientific applications. Finally, some empirical relationships and future research directions are suggested.
2. Basic Concepts and Experimental Techniques
2.1. D and κ
D is defined as the ratio of heat flowing across the face of a unit volume and the heat stored in the unit volume per unit time. Its value is expressed in units of mm2 s−1. κ, according to Fourier’s law, is defined as the heat passing through unit sections and lengths in unit temperature and unit time; its standard unit is Wm−1K−1. In homogeneous samples, D and κ are related by isobaric specific heat capacity and density [31]:
where ρ is the density and Cp is the heat capacity at a constant pressure. D and κ are nonlinearly related to temperature, which strongly affects the temperature distribution inside the Earth.
2.2. Heat Transfer Mechanism
The three main methods of heat transfer are steady-state conduction, advection, and radiation. Thermal conduction within solids can be transmitted by electron carriers (electrons), lattice waves (phonons), electromagnetic waves (photons), or other excitons. Scattering of electrons is only important for metals and may provide a third heat transfer mechanism in the metallic core. In general, heat conduction or diffusion dominates heat radiation within the lithosphere of Earth at temperatures below 1000 K. As the temperature rises, the average number of phonons increases and the probability of collision with one another increases, resulting in a decrease in the mean free path and in κ. Most of the heat transfer models have different temperature dependencies, as discussed in detail by Hofmeister et al. [28]. Although the proportion of radiative heat transfer (photons) gradually increases with increasing temperature [32,33], quantitative determination of the radiative transfer in the laboratory experiments is difficult because it involves frequency, temperature, and different types of length scales [11].
2.3. Influencing Factors of D and κ
2.3.1. Temperature
The heat transfer of a material is a function of temperature. According to traditional theory of solid physics, the lattice κ of silicate minerals is mainly determined by the collision between phonons and phonons [32]. At a relatively low temperature (<1200 K), heat transfer by phonons, which can be approximately expressed as D or κ ~ 1/T, is dominant [34]. However, radiative heat transfer by photons, which is approximately represented by T3, becomes more important with increasing temperature [35,36,37]. Hence, the total D or κ at high temperatures include the contributions of lattice and radiative components.
2.3.2. Pressure
Pressure promotes the efficiency of heat transfer because the porosity and crack of minerals and rocks tend to decrease with increasing applied pressure. The D and κ of minerals and rocks increase with increasing pressure due to decreases in phonon scattering probability. Previous studies have proposed a positive linear relationship to fit the pressure dependence of D and κ [20,24,38].
2.3.3. Porosity
Porosity greatly affects heat transfer. The ability to conduct heat at the void is very poor. Given that the internal temperature and heat flow distribution of porous materials are remarkably uneven, the internal temperature gradient is significantly increased. Substances with higher porosity have lower conductivity. κ is also affected by other impurities and fluids in natural minerals and rocks. More details can be found in discussions by Clauser [39].
2.3.4. Crystal Structure
Crystals are solids with lattice structures. In the same lattice structure, the arrangement of different particle points in different directions leads to the anisotropy of the physical and chemical properties of the crystal. The D or κ of single-crystal minerals in different crystallographic directions (e.g., [100], [010], [001]) was studied by several researchers [24,40,41,42,43,44]. For example, the D and κ values of single-crystal olivine show the order [100] > [001] > [010]. The ratio of D or κ of different orientations also reflects the degree of mineral anisotropy. Under natural crustal conditions, minerals preferentially align along different crystallographic directions to form cleavages and even cause some rocks to have different thermal transport characteristics in the horizontal and vertical directions [43]. The conditions for forming sedimentary and metamorphic rocks usually render the κ of these rocks anisotropic, and Clauser [39] presented this effect by summarizing the κ of samples parallel and perpendicular to the apparent direction of stratification and foliation. Moreover, by measuring the D of deformed mantle rocks and applying rock physics modeling, Tomassi et al. [45] confirmed that the deformation of mantle minerals may be the cause of significant thermal anisotropy at the uppermost mantle.
2.3.5. Water
Hydration in minerals and rocks reduces their κ [27]. OH is usually observed in mineral crystals in the form of point defects. Substitution of ions produces disorder, which lowers heat transport via vibrations. Chang et al. [29] measured the κ of dry and hydrous olivine with ~7000 wt ppm water at pressures of up to 15 GPa using an ultrafast optical pump-probe technique, and found that the water-bearing olivine had a κ value that was approximately two times smaller compared with that of anhydrous olivine. Since there are more phonons in the wet phase than in the dry phase, the number of scattering events per original unit increases, resulting in reduction in the mean free path and, in turn, heat transfer efficiency [27].
2.4. Measurement Technology
We divided the available measurement methods into two types, namely, steady-state and non-steady-state methods, depending on whether the temperature changed over time during the measurement.
As a traditional method, the steady-state method based on Fourier’s law derives the conduction equation of 1D (one-dimensional) heat flow and calculates the κ of the specimen. This method is characterized by the assumption that the sample temperature does not vary with time during measurement. Bridgeman [13] first applied the steady-state radial heat flow method to measure the κ of minerals at high pressure. This method features large thermal resistance, which results in lower values compared with actual measurements. Beck et al. [46] made some improvements to this method, and other types of steady-state methods have since been proposed [47,48]. The steady-state technology requires uniform heat to pass through the sample; hence, a stable temperature field and good heat dissipation from the heater and thermocouple are absolutely necessary. The analytical formulae for these technologies are relatively simple, but extremely long test cycles and the complexity of the assembly limit their use.
The non-steady-state method (i.e., transient method) is the most widely used experimental technique for measuring κ. The principle of this method involves the use of transient thermal differential equations to obtain the D or κ of the sample. An important feature of this method is that the temperature of the sample varies with time during the thermal property measurement. Specifically, it mainly includes the following approaches.
(1) An optical technique, picosecond transient grating spectroscopy, was developed by Chai et al. [49] to measure the D of silicate minerals. This technique had low experimental uncertainty and did not require any physical contact with the specimen. Zaug et al. [50] also discussed the possibility of using this technology in diamond anvil cell (DAC).
(2) A transient method was utilized to obtain the D of minerals [37,41,51]. However, since the measured sample was placed in contact with thermocouples in this single physical contact method, contact thermal resistance and spurious radiation transfer during the measurement process could greatly affect the experiment [37,41].
(3) Fujisawa et al. [20] first introduced the Ångström method to simultaneously measure the D and κ of materials under high temperatures and pressures. Katsura et al. [21,38,52,53] and Xu et al. [22] proposed some modifications to this method. The advantage of the Ångström method was that D and κ can be obtained simultaneously. However, contact thermal resistance was inevitable, and radiative heat transfer at high temperatures could affect results.
(4) A pulse heating method was proposed by Dzhavadov [23] to obtain D and κ. Osako et al. [24] modified this method and applied it to high-temperature and high-pressure fields. This method was also suitable for measuring anisotropic materials. However, the sample needed to be very thin (approximately 0.35 mm) to ensure that the axial temperature gradient was minimal; thus, the disks were often easily broken under high pressure. Osako et al. [24] used this modified method on cylindrical samples in a multi-anvil apparatus at high pressures and temperatures to achieve satisfactory results. Hofmeister et al. [11] demonstrated that the Ångström and pulse heating methods involving multiple physical contacts were the most accurate techniques available for hard solids and crystals at high pressures and temperatures.
(5) A laser-flash method with a nominal accuracy of 2% was first established by Parker et al. [14]. Graphite-coated samples were not in direct contact with the thermocouple, which could avoid unwanted radiation heat transfer and contact losses of heat. This mature and already commercialized technique was discussed in detail by Hofmeister et al. [54], Braeuer et al. [55], and Blumm and Lemarchand [19]. However, it has not yet been applied to high-pressure conditions.
(6) A light pulse thermoreflectance technique was recently developed by Yagi et al. to measure D in a diamond anvil cell (DAC) at high pressure [26]. The sample coating with sputtered Au film, together with a sapphire single crystal disk and KCl, were loaded into a sample chamber and a pulsed laser was used to heat the surface of the sample. This major breakthrough allowed the determination of the D or κ of minerals under deep mantle conditions through experimental means. However, technical limitations prevent its application to high-temperature conditions. The combination of synchrotron radiation technology and DAC may address the difficulty of heating to high temperatures under high pressures in the near future. In short, developing techniques to measure D and κ in situ under extreme conditions remains a challenge. The scope of application of several major measurement methods that emerged over the years is presented in detail in Table 1.
3. Summary of D and κ Data
Many studies on the D and κ of olivine have been conducted, but current experimental measurements of wadsleyite and ringwoodite were only reported by Xu et al. [22]. In the next section, we divide the olivine data into two categories—single crystal and polycrystalline. The key aspects of these results are illustrated and compared in Table 2.
3.1. Olivine
3.1.1. Single-Crystal Olivine
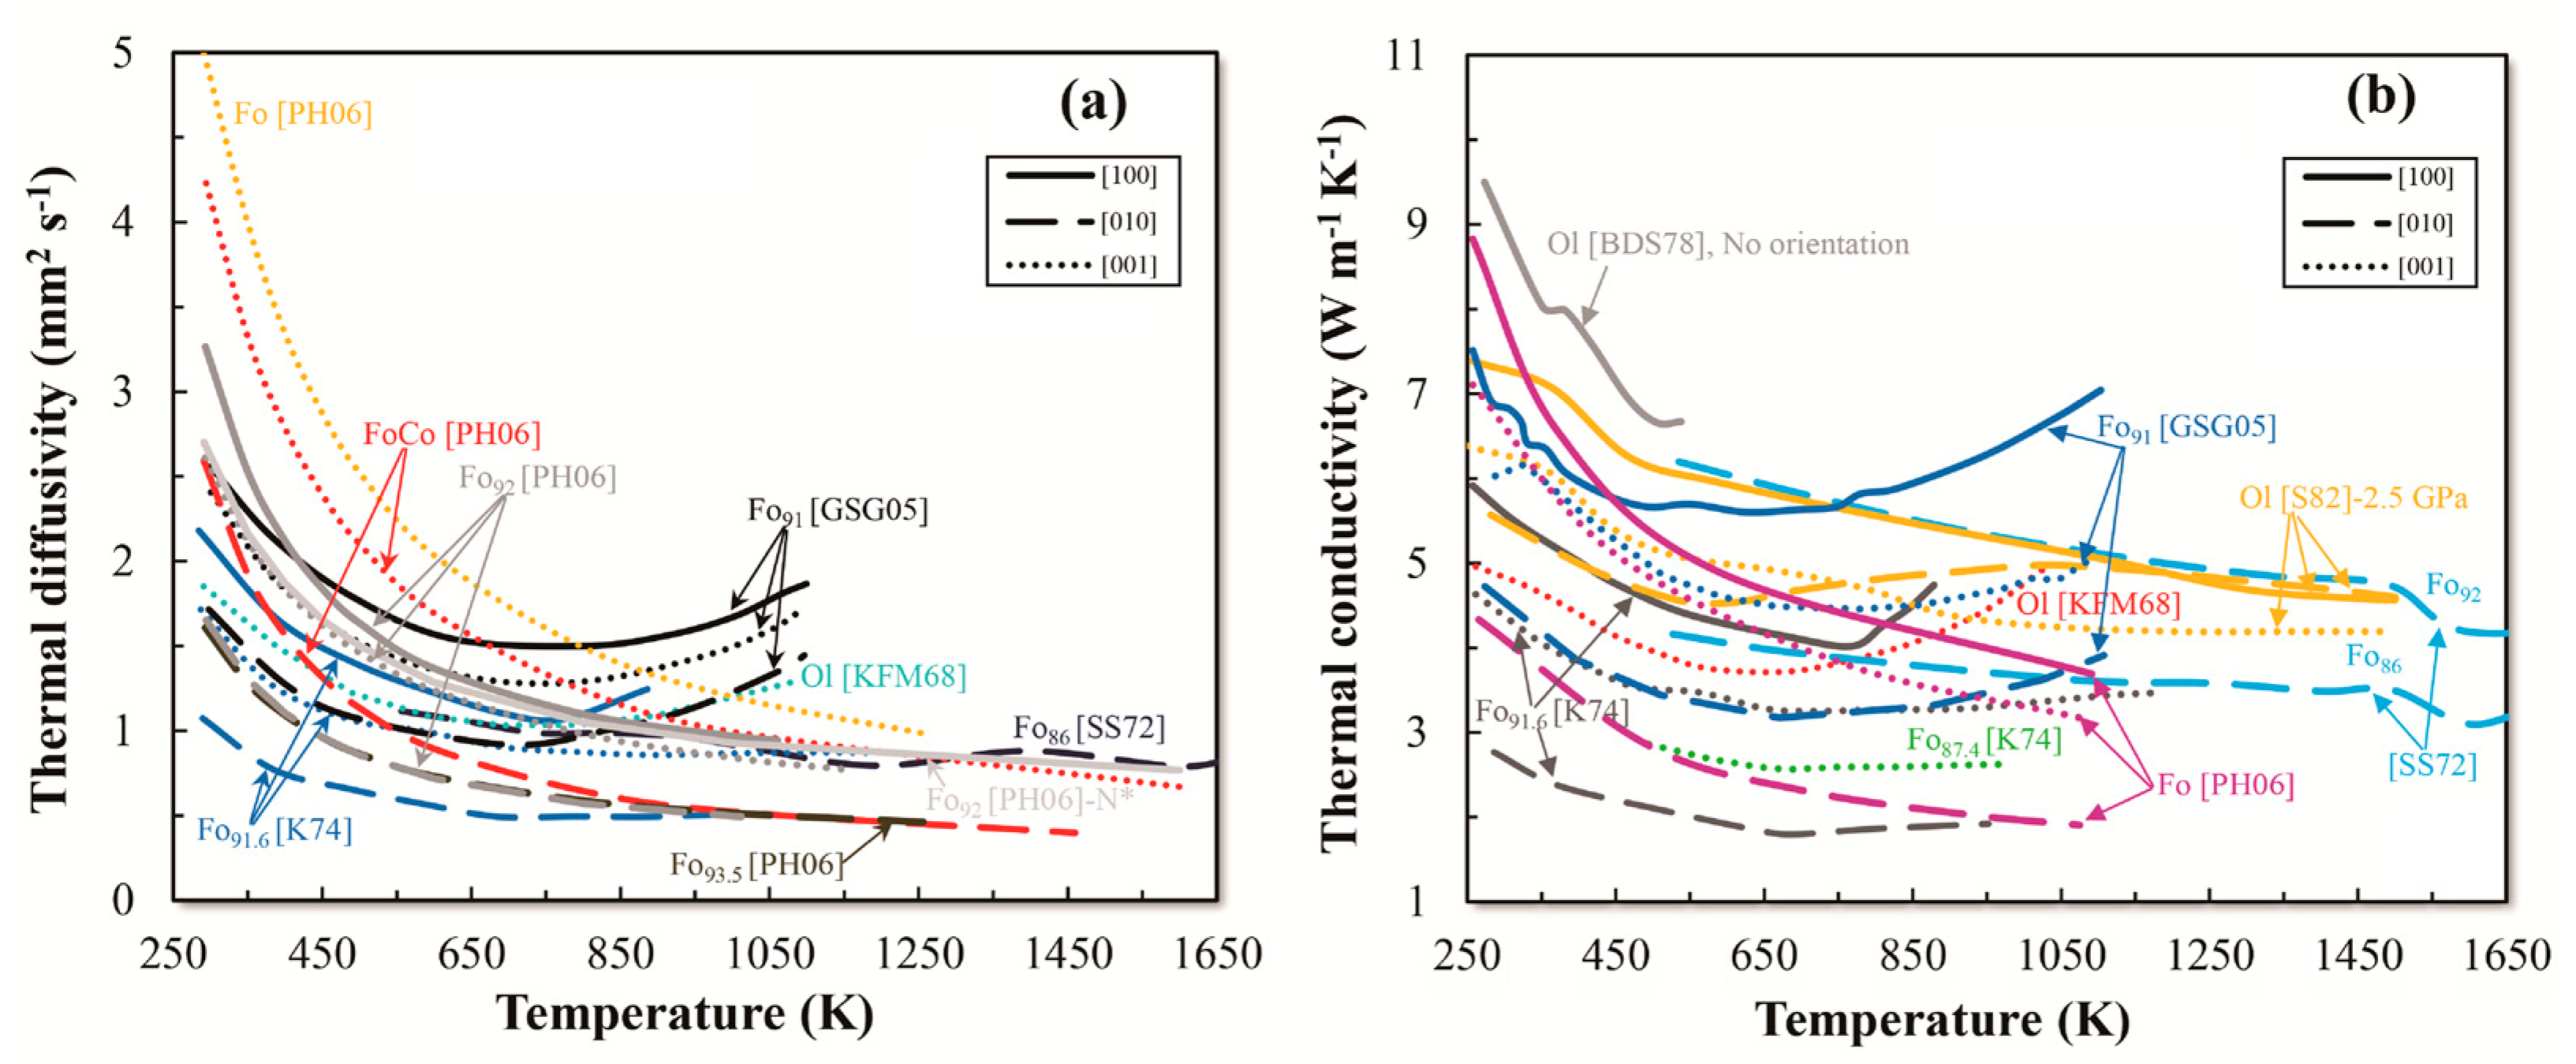
Olivine is the major constituent (approximately 60 vol. %) of Earth’s upper mantle, and knowledge of its thermal properties is crucial to understand the thermal state of the mantle. Kanamori et al. [61] reported the D and κ of single-crystal olivine in the [001] direction over the temperature range of 300–1100 K using the Ångström method. They revealed that D and κ decreased with increasing temperature at lower temperatures (<700 K), whereas D and κ increased at temperatures above 700 K due to the occurrence of radiative heat transfer in the crystal. Gibert et al. [37] used a transient method to measure the D and κ of Carlos single-crystal olivine in three directions at temperatures up to 1123 K. The authors distinguished the contributions of the crystal lattice and radiation to the total D and found that the D of phonons and photons could be approximated by the formulae Dphonon = 1/(A + BT) and Dphoton = CT3, respectively. They also found that the contribution of the radiative transfer relative to total heat diffusivity was up to 60% when the temperature reached 800 K, which implied that radiative heat transfer enhanced the heat transfer of the upper mantle (Figure 1a). However, Hofmeister et al. [11] revealed that the method of Gibert et al. [37] had large contact thermal resistance and spurious radiative transfer, which would contribute some uncertainty to considerations of heat radiation. The radiative transfer present in the values measured by Gibert et al. [37] did not represent what occurs in the mantle. Instead, this transfer was an experimental artifact, in which photons traveled directly from the heat source to the detector (or thermocouple). Schatz and Simmons [62] also obtained the D and κ of the single-crystal Fo86 and the κ of Fo92 in the [010] direction by adopting a laser-wave method [58]. Their results indicated that the D and κ of relatively pure large-grained crystals did not increase significantly at higher temperatures, thus suggesting that the particle size and purity of the single crystal affected the transmission of heat radiation; the authors also found that single crystals with high forsterite content had high κ. Kabayashi [40] reported the D and κ of single-crystal olivine Fo91.6 at three different orientations and the κ of single-crystal olivine Fo87.4 in the [001] direction by using the Ångström method, modified by Kanamori et al. [61,63]. The authors showed that the calculated κ of Fo87.4 in the [001] direction was lower than that of olivine Fo91.6 in the [001] direction (Figure 1b), consistent with the conclusion of Schatz and Simmons [62]. The Fo91.6 results of Kabayashi [40] revealed that the D and κ along the [100] direction increased significantly when the temperature was higher than 700 K, whereas those in the other two directions did not exhibit this phenomenon. Kobayashi [40] determined the anisotropy of D and κ in single-crystal olivine Fo91.6 along three orientations. The 70% and 90% anisotropies of D and κ were mainly attributed to the anisotropy of the mean free path of phonon (Figure 1a,b). Scharmeli [64] determined the 30% anisotropy of κ for olivine at 2.5 GPa and up to 1500 K and found that the κ values in different directions crossed at 750 K and above 1100 K, which differed from previous results. Pertermann and Hofmeister [42] determined the D of oriented single crystals at temperatures of up to 1800 K using the laser-flash method and the corresponding κ by using the measured D data, heat capacity, and density; the scholars found that the D and κ decreased rapidly with rising temperature and became nearly independent of temperature when the temperature exceeded 1000 K. In these experiments, the effect of heat radiation at high temperatures was eliminated by coating with platinum and then spray coating with graphite. The authors also confirmed that a small amount of impurities appeared to have little influence on D by comparing the [001] values of pure and co-doped samples at room and high temperatures, as shown in Figure 1a. Beck et al. [46] determined the lattice κ for unknown compositions and orientations olivine at temperatures of up to 650 K; their results were the highest compared to all other studies. Data on the κ of single-crystal olivine as a function of temperature are summarized in Figure 1b.
3.1.2. Polycrystalline Olivine
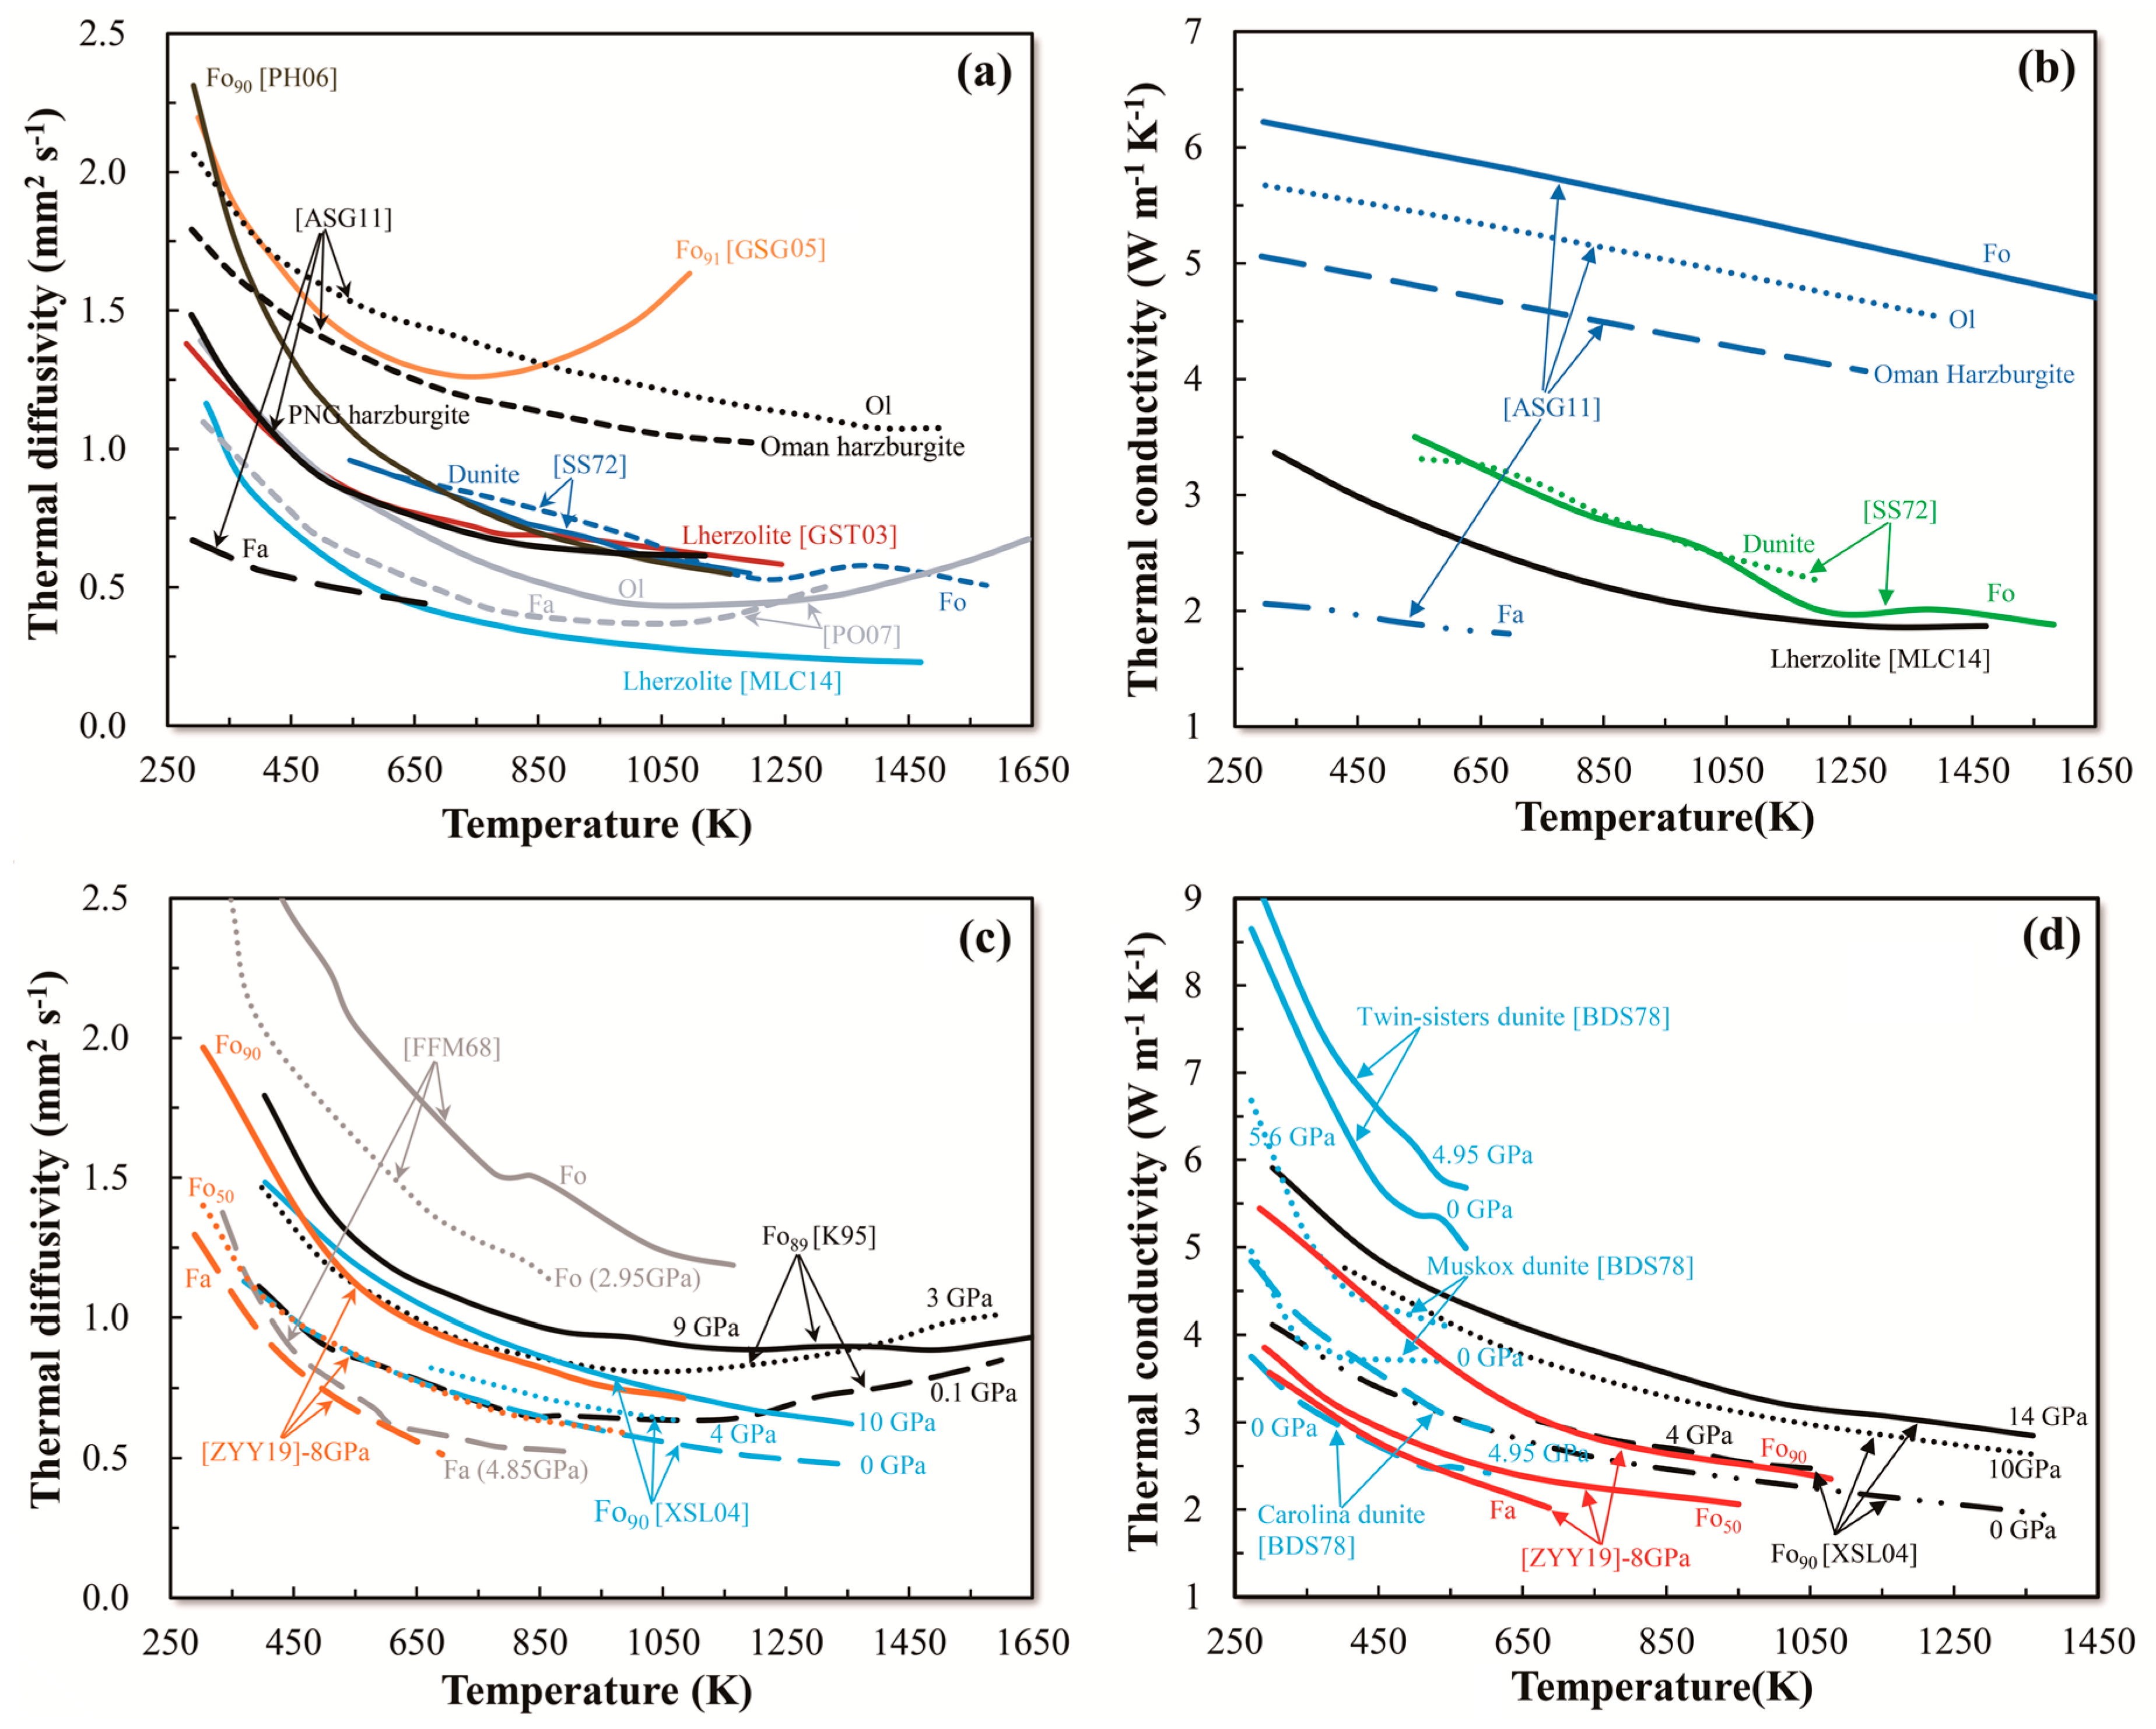
Schatz and Simmons [62] reported the D and κ results of Twin Sisters dunite and sintered forsterite in the temperature range of 500–1600 K via the laser-wave method. Their results showed that, in relatively pure large-grained minerals, radiative heat conduction did not increase rapidly with increasing temperature. The D of fine-grained natural dunite at temperatures of up to 1123 K was also measured by Gibert et al. [37], but their data were considerably higher than those of Schatz and Simmons [62] over the entire temperature range studied and exhibited more radiant heat transfer at high temperatures (Figure 2a). Gibert et al. [37] explained that this disagreement could be due to the fact that the Twin Sisters dunite evaluated by Schatz and Simmons [62] was serpentinized and, therefore, had enhanced porosity. Gibert et al. [52] also investigated the D of naturally deformed peridotites at temperatures of up to 1250 K and pressures of up to 1 GPa using a transient method; the authors found that the measured D was 20–30% lower than that of their model predictions, but close to those of Schatz and Simmons [62]. Later, Pertermann and Hofmeister [42] determined the D of dunite at 300–1100 K by the laser-flash method and did not find any radiative contribution to their results because the method separated unwanted direct radiative transfer. Miao et al. [66] reported the D and κ of lherzolite ranging from 300 K to 1500 K by the laser-flash method. These results were lower than those of the constituent crystals in Figure 2a,b. The ranges of D and κ were 1.25–0.5 mm2 s−1 and 3.3–2.0 W m−1 K−1, respectively. The authors believed that the lower results were due to the relatively lower olivine content (50%) in their samples and the phonon-scattering effect caused by the porosity of rocks. Petrunin and Orlik [65] developed a new experimental apparatus to obtain the D of several mantle minerals between room temperature and 1700 K. They confirmed that, when the temperature reached the melting point, the D of the samples of different porosities was close to the value corresponding to that of the dense sample (Figure 2a).
Based on thermoelastic and thermodynamic methods, Arafin et al. [67] first used theoretical formulas to evaluate the D and κ of harzburgite rock and olivine and their temperature dependences. Results indicated that the D of Oman hazburgite was in good agreement with the experimental values of PNG (Papua New Guinea) harzburgite at low temperatures, but differed at high temperatures. The formation of heat (ΔHD), which was an indicator of the energy required for chemical reactions, could also be determined by the Arrhenius-type relation of D with temperature. κ as a function of temperature could be determined using the empirical relationship (κ = 0.0164 × ӨD – 6.292) proposed by Horai and Simmons [68], where ӨD is the Debye temperature. The authors believed that their simple method could avoid the use of complex experimental instruments. However, the linear temperature dependence of κ was not consistent with the results of experimental observations (Figure 2a,b).
The D values of polycrystalline Fo and Fa at 2.4–5.0 GPa and 400–1100 K were measured by Fujisawa et al. [20] using the Ångström method, and the authors found that the D of Fa was considerably lower than that of Fo (Figure 2c). Katsura [38] used the same method to determine the D of Fo89 at 300–1700 K and pressures of up to 9 GPa. When the temperature exceeded 1300 K, D tended to be similar under different pressures. Xu et al. [22] determined the D and κ of polycrystalline Fo90 at temperatures of up to 1373 K and pressures of up to 20 GPa by using the Ångström method with a multi-anvil apparatus. Their observations suggested that the sample with good polycrystallinity (30–40 µm) inhibited radiative transfer; thus, the main heat transfer mode had a lattice vibration component [62]. The κ results of the authors were also extrapolated to 14 GPa (the wadsleyite-stable region) and revealed that the κ of wadsleyite increased by 30% compared with that of olivine. The D and κ of polycrystalline olivine with different Fe contents (Fo, Fo90, Fo70, Fo50, Fo31, and Fa) were measured simultaneously by Zhang et al. [30] at pressures and temperatures of up to 10 GPa and 1100 K, respectively, using the pulse heating method. Their results showed that the increase in Fe content reduced the efficiency of heat conduction in the olivine. D and κ gradually decreased with increasing Fe content under different pressures. For example, the D and κ values of Fo90 were 30% and 36% higher than those of Fa at 8 GPa and room temperature, respectively (Figure 2c,d). The authors thus believed that heat transfer was dominated by phonons at low temperatures and that atomic mass and configuration entropy affected the variation of κ as a function of Fe content. As the Fe content increased, the anharmonic effect caused by Fe substitution greatly shortened the mean free path of the phonon, eventually leading to a decrease in κ. Beck et al. [46] measured the lattice κ for several dunites, including Carolina dunite, Twin Sisters dunite, and Muskox dunite, using the steady-state radial heat flow method. The κ values of these three different types of dunite varied over a wide range at room temperature (3.7–9 Wm−1K−1). The κ of the Twin Sisters dunite was the highest among all of the measured samples (Figure 2d). Given that the author did not provide information on the composition of the samples, however, the reason behind the differences among these studies is unclear.
3.1.3. Pressure Dependence of D and κ in Olivine
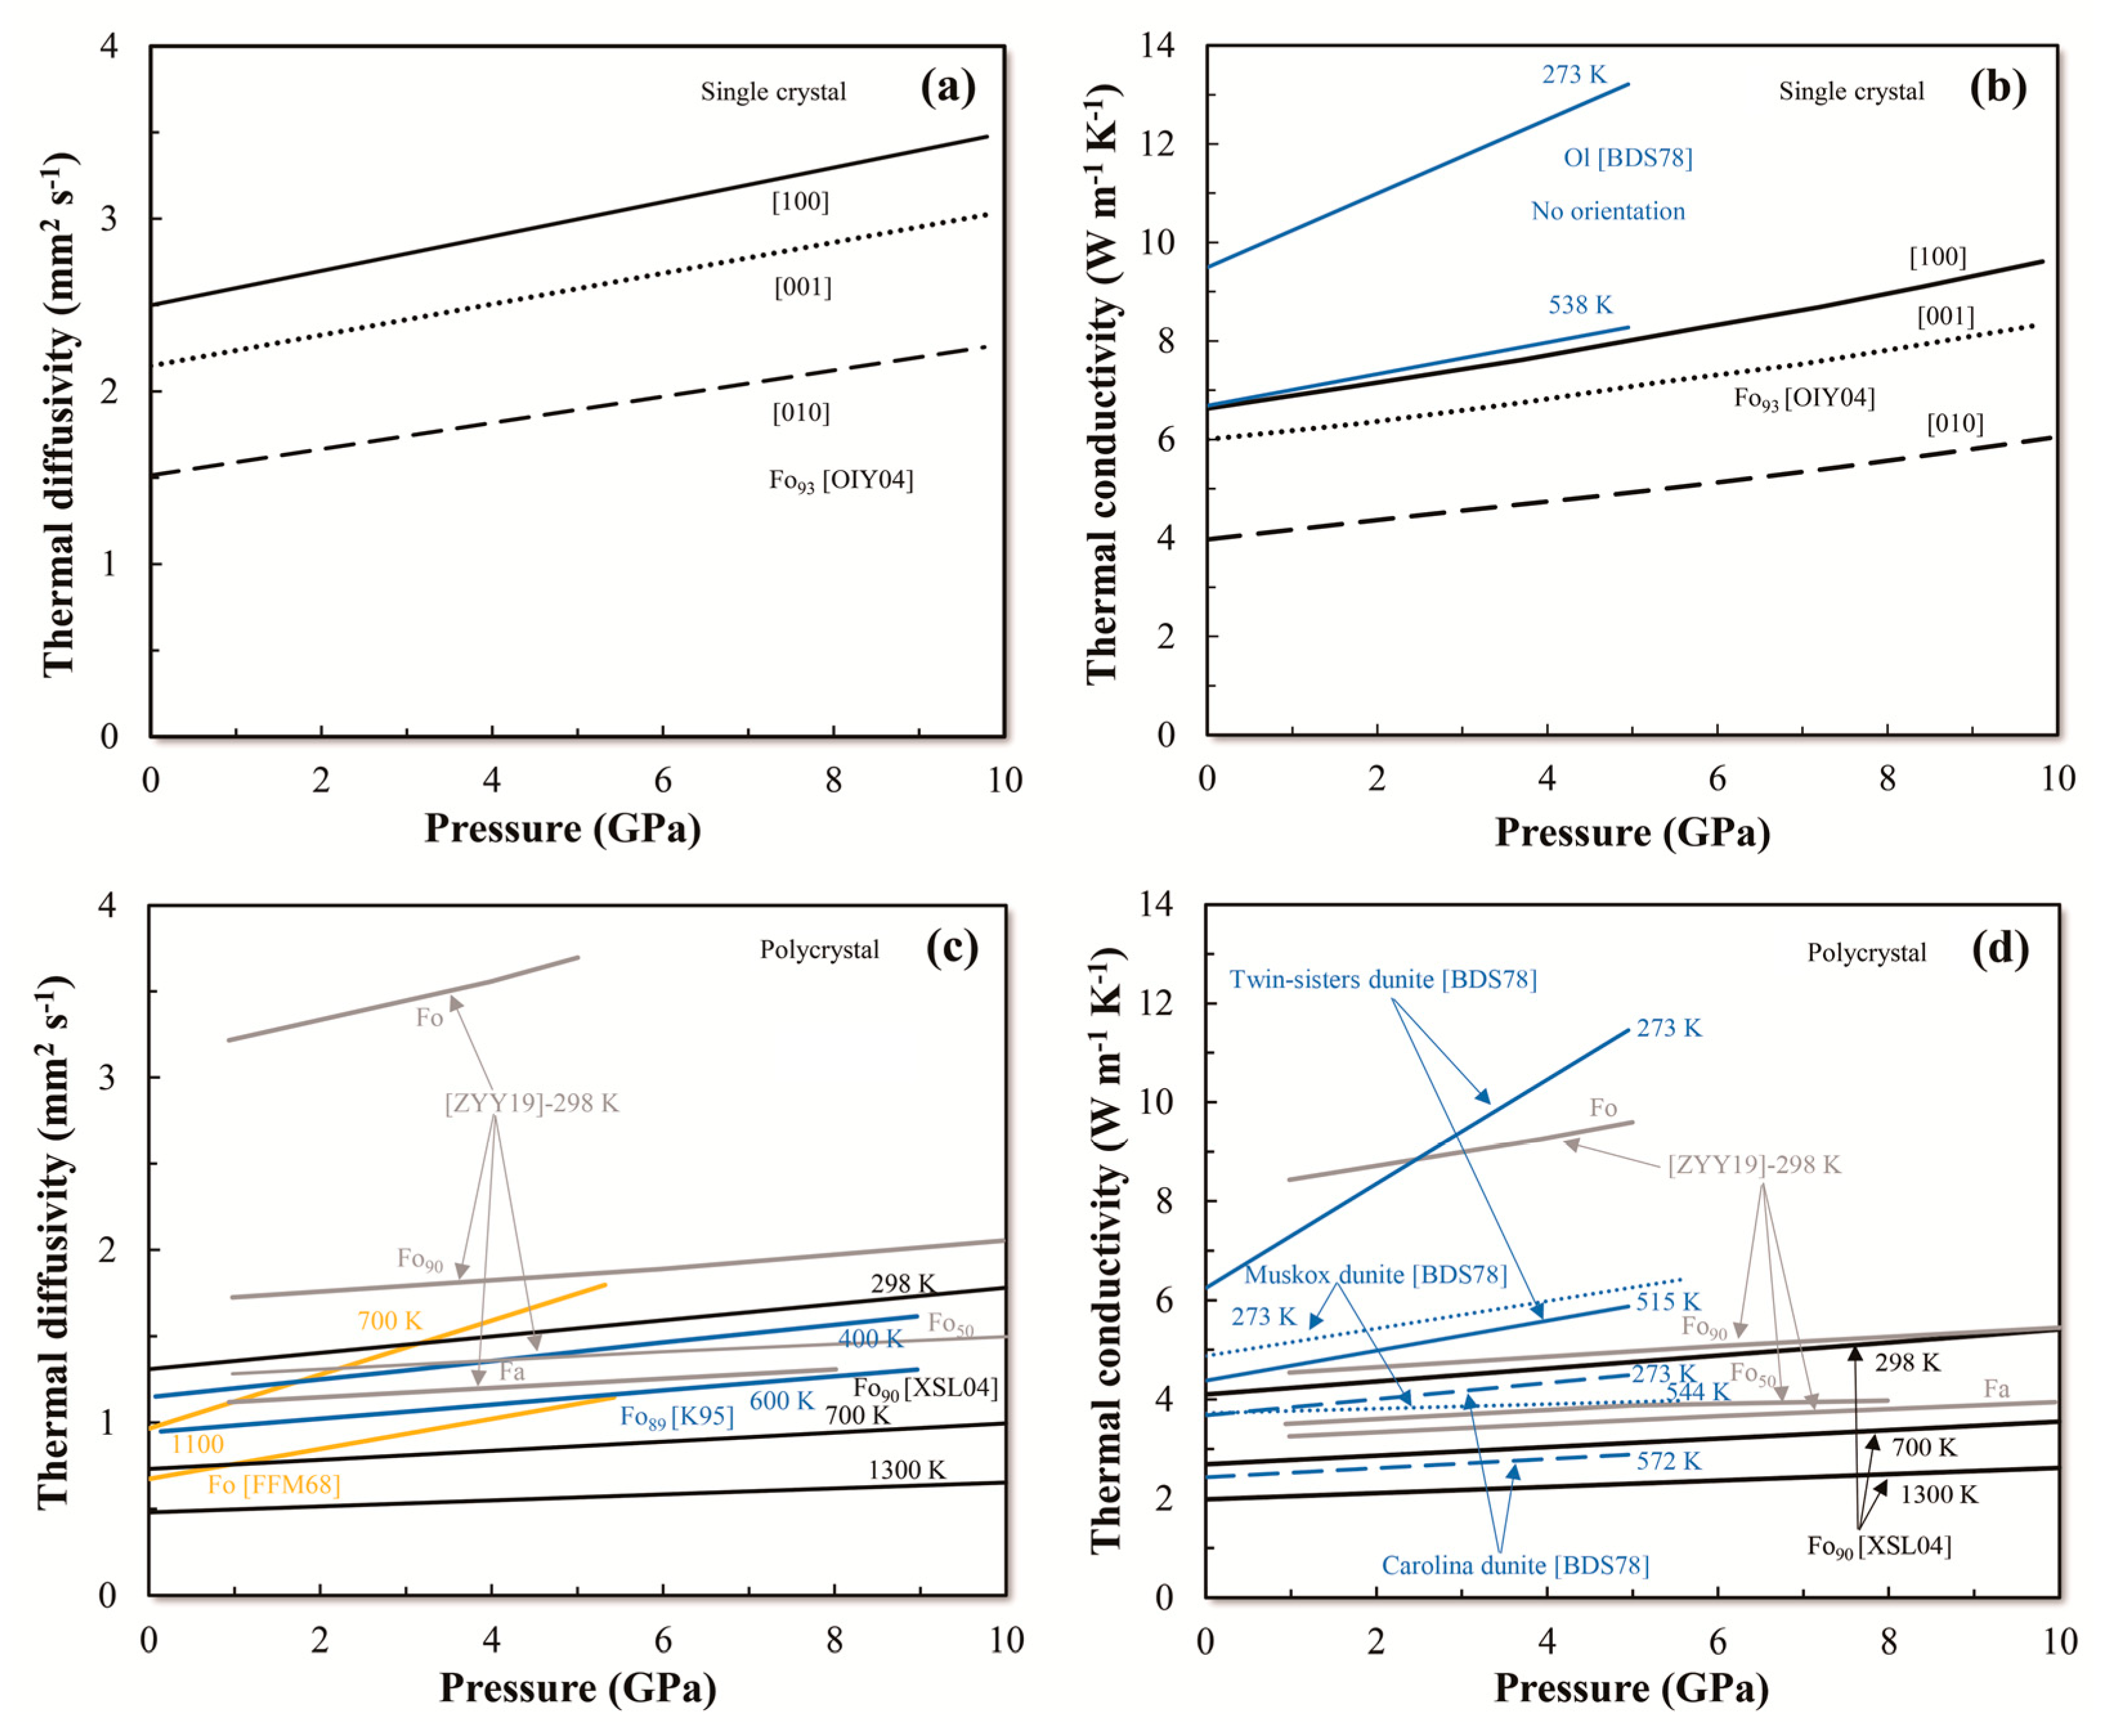
Osako et al. [24] investigated the pressure derivatives of D (dlnD/dP) and κ (dlnκ/dP) in single-crystal olivine Fo93. The data in three directions demonstrated a good linear relationship with pressure, as revealed in Figure 3a,b. The pressure derivative ranged from 0.03 GPa−1 to 0.04 GPa−1 for D and from 0.038 GPa−1 to 0.034 GPa−1 for κ. Although Beck et al. [46] reported κ as a function of pressure for single-crystal olivine at different temperatures, information about the crystal orientation was not provided. The results showed that the pressure dependence gradually decreased from 0.055 GPa−1 to 0.044 GPa−1 as the temperature rose from 300 K to 538 K. The related fitting formulae and pressure coefficients are summarized in Table 3.
The pressure dependences of the D and κ values of polycrystalline olivine were reported in many studies. Fujisawa et al. [20] measured the D of polycrystalline Fo in the range of 2.4–5.0 GPa and 400–1300 K and showed that the pressure derivatives of D at 700 and 1100 K as functions of pressure were relatively high, at 0.162 and 0.129 GPa−1, respectively (Figure 3c). Katsura [38] determined the pressure derivative (0.037–0.045 GPa−1) of D for the polycrystalline olivine Fo89 at pressures of up to 9 GPa and temperatures of up to 1700 K and obtained considerably lower results than those of Fujisawa et al. [20]. The pressure derivative of D for polycrystalline olivine Fo90 reported by Xu et al. [22] was roughly 0.036 GPa−1, which was close to the results of Katsura [38]. Zhang et al. [30] obtained the pressure dependence of D of olivine with different compositions at room temperature and obtained values between 0.015 and 0.04 GPa−1 (Figure 3c).
The pressure dependence of the κ of three dunites at a temperature range of room temperature to 650 K and a pressure range of 2–5.6 GPa was obtained by Beck et al. [46] (Figure 3d); however, the authors did not provide information on any of the components of the sample being tested. The pressure coefficient of the Twin Sisters dunite was somewhat high and peaked at 0.168 GPa−1 at room temperature. The remaining pressure coefficients were mainly in the range of 0.02–0.05 GPa−1. Xu et al. [22] reported the κ of polycrystalline olivine Fo90 as a function of pressure at three temperatures and obtained values between 0.033 and 0.058 GPa−1. The pressure coefficients of κ for olivine with different Fe contents under room temperature were calculated by Zhang et al. [30], and values between 0.018 and 0.036 GPa−1 were obtained. Moreover, the pressure dependence of κ decreased with increasing Fe content.
3.2. Wadsleyite and Ringwoodite
To date, only Xu et al. [22] determined the D and κ of wadsleyite and ringwoodite at 300–1373 K and 14 GPa using the Ångström method. The scholars showed that the D and κ of the wadsleyite gradually decreased from approximately 2.2 mm2/s to 0.8 mm2/s and from 7.2 Wm−1K−1 to 4 Wm−1K−1, respectively, with increasing temperature (Figure 4). By comparing the κ of olivine with that of the wadsleyite at 14 GPa [22], the authors suggested a discontinuity of κ occurring at 410 km.
The D and κ of ringwoodite also gradually decreased from approximately 2.6 mm2/s to 1.1 mm2/s and from 8.5 Wm−1K−1 to 4.7 Wm−1K−1, respectively, with increasing temperature [22]. As shown in Figure 4b, the κ of ringwoodite (γ-Mg2SiO4) calculated by Hofmeister [1], including lattice and radiative contributions, was considerably higher (approximately 20%) than that reported by Xu et al. [22]. Reports on the κ of ringwoodite are scarce; hence, determining which data are close to the true value under the transition zone condition is not feasible. Nonetheless, the existing κ data for wadsleyite and ringwoodite suggest a sudden increase in κ in the transition zone, as well as the presence of thermal discontinuities.
4. Effect of Fe Content on the D and κ of Olivine
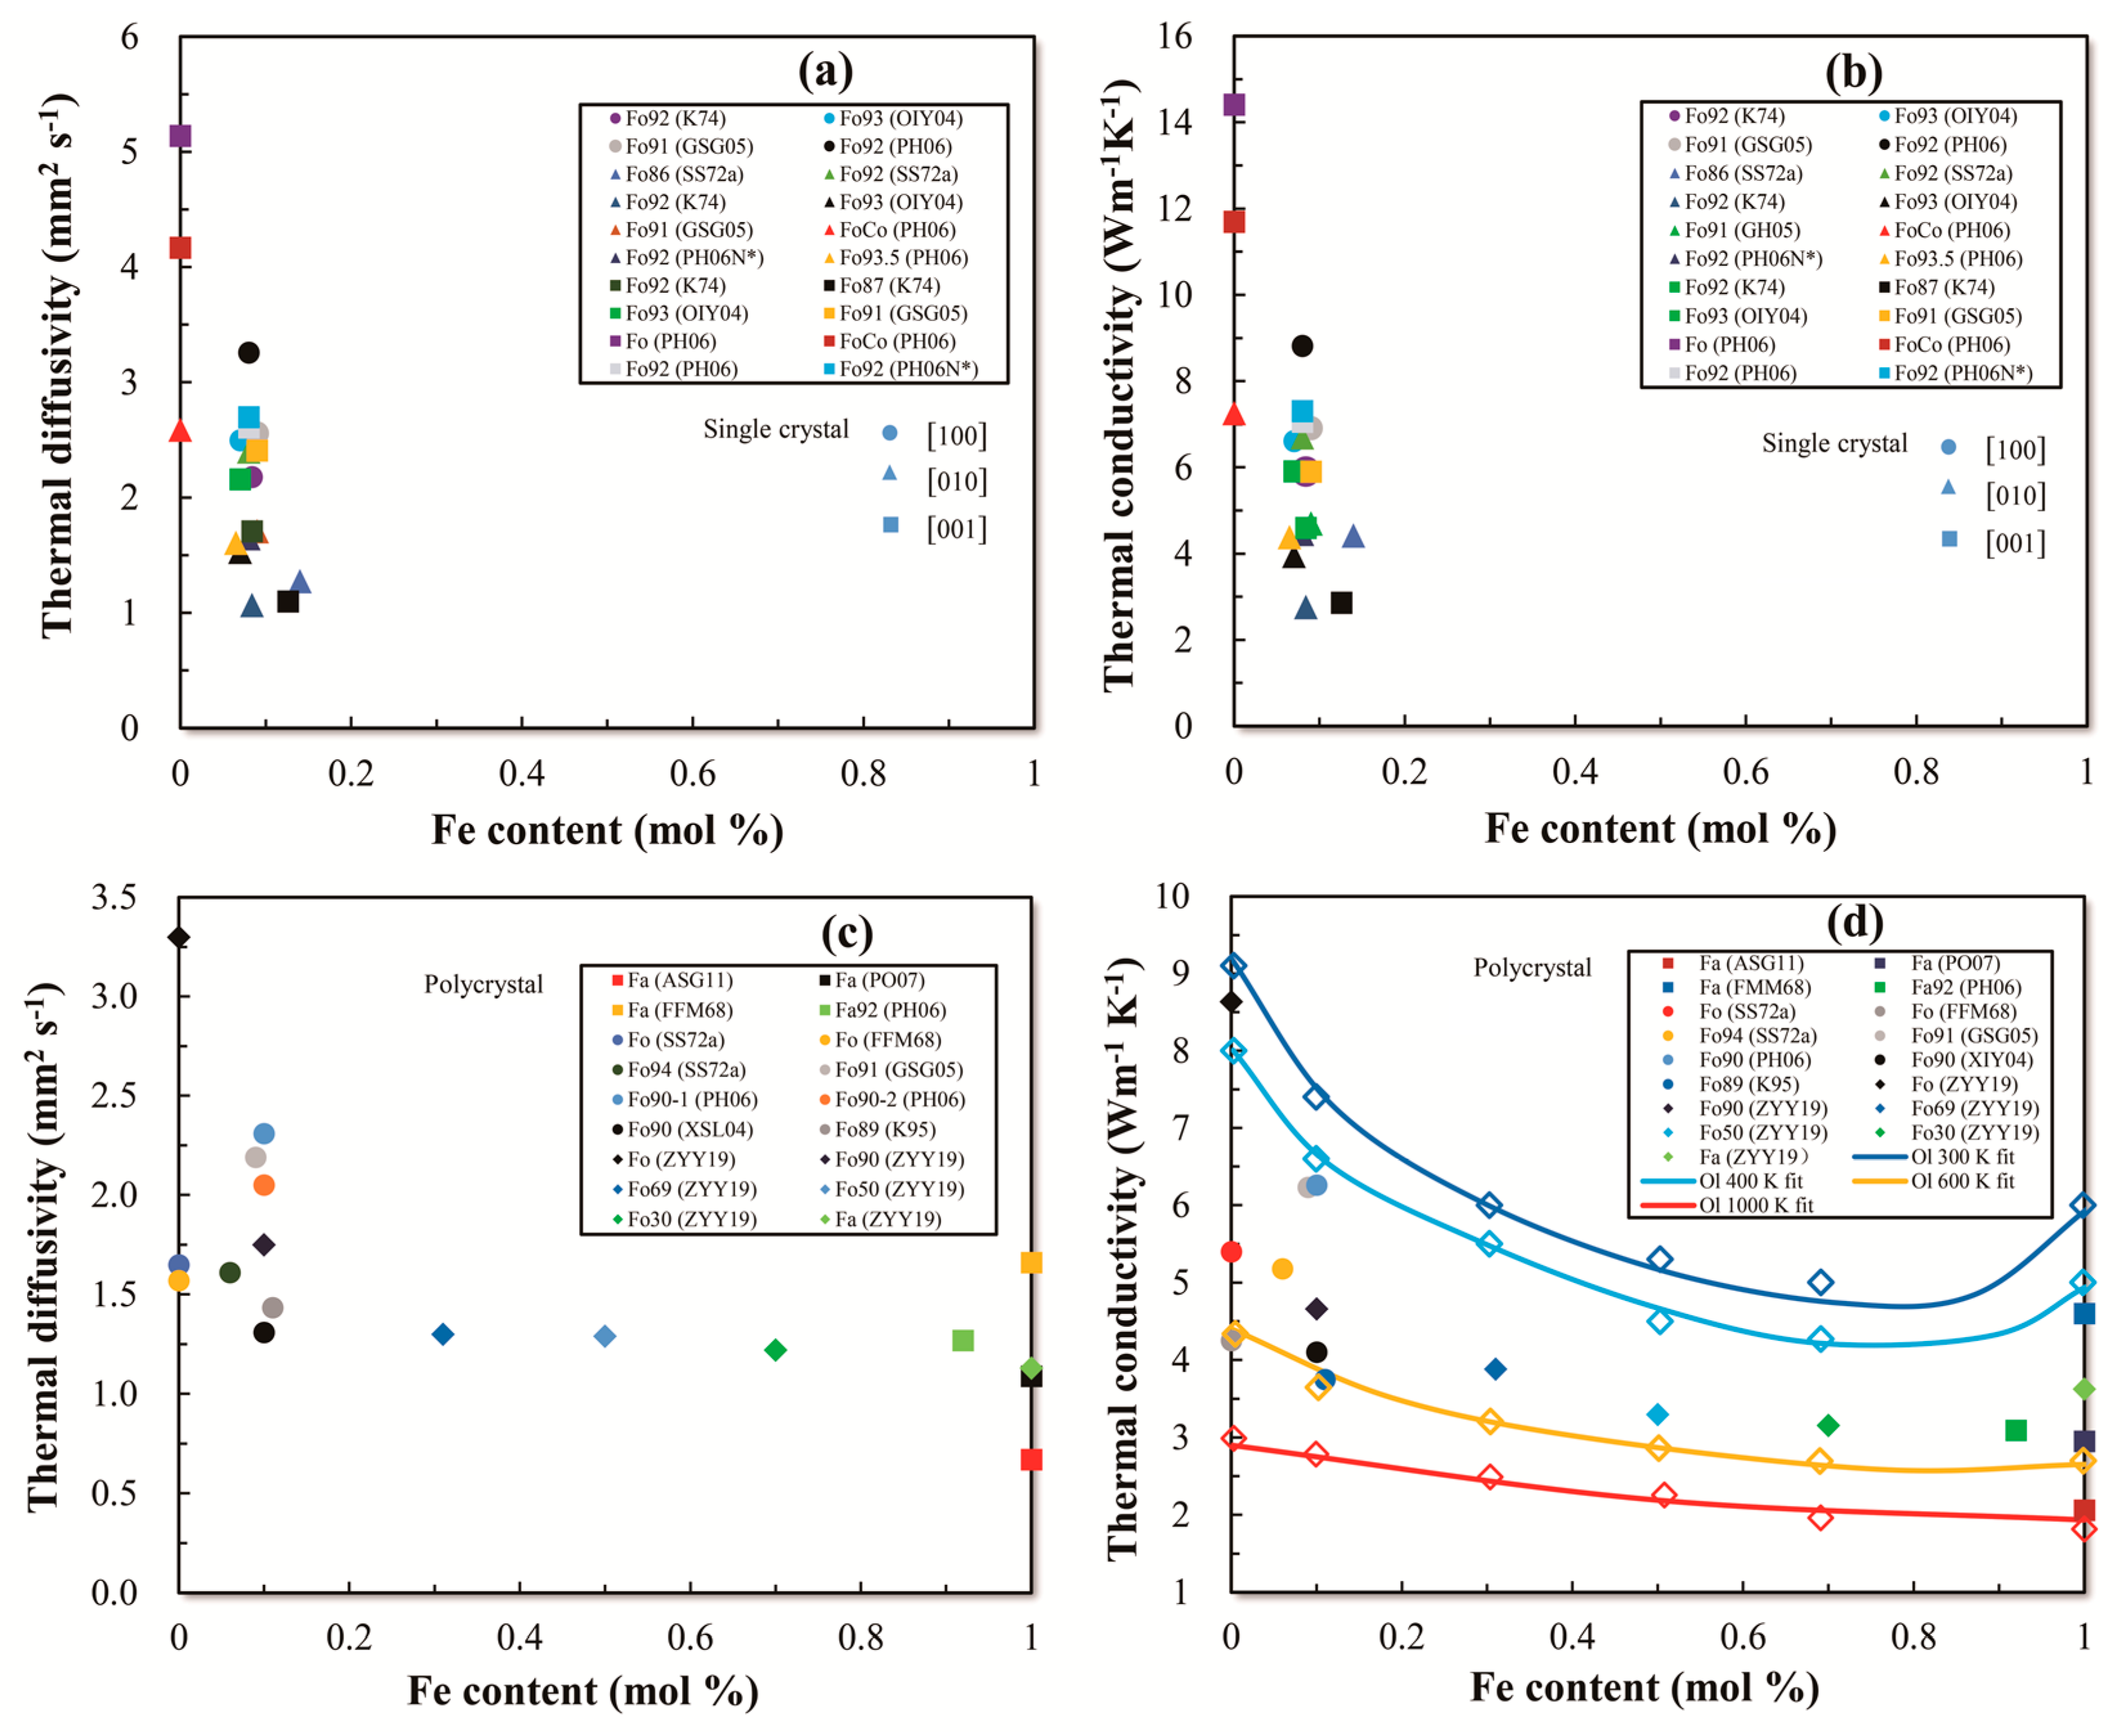
Olivine, (Mg,Fe)2SiO4, is one of the most important minerals in the upper mantle, in which Fe and Mg exist in a completely isomorphic form. The Mg content of olivine in the mantle varies minimally and its composition is about Fo90, which is why most olivine components were distributed between Fo87 and Fo93 in previous κ measurement experiments. The Fe content dependences of D and κ of single-crystal olivine are presented in Figure 5a,b, wherein the Fe mole percentage was less than 13%. The single-crystal olivine showed D values in the ranges of 2.2–3.2, 1.1–2.4, and 2.6–3.6 mm2 s−1 for the [100], [010], and [001] directions, respectively; the corresponding κ values showed ranges of 6–8.9, 2.7–6.8, and 2.8–7.3 Wm−1K−1, respectively. Pertermann et al. [42] suggested that small differences in olivine composition near Fo90–Fo93 may have little effect on the measured D values. Therefore, the deviation of the results in Figure 5 may be explained by the drawbacks of early immature experimental techniques affecting measurement accuracy. The pure single-crystal Fo usually shows peak D and κ in different crystal axis directions (e.g., D: [001] = 5.14 mm2 s−1, [010] = 2.59 mm2 s−1; κ: [001] = 14.41 Wm−1K−1, [010] = 7.21 Wm−1K−1), and the general rule is that increases in Fe content in olivine lead to a reduction in D and κ. The lack of data on Fe-rich single-crystal olivine prohibits further exploration of the nonlinear effect of cation substitution on thermal transport properties.
The effect of Fe content on D and κ in the polycrystalline olivine solid solution series was systematically reported by Zhang et al. [30]. With increasing Fe content, D decreases and exhibits a minimum value at Fa. Other studies are limited to one or two samples with different Fe contents and the results are not adequately contrasted (Figure 5c). The D and κ of olivine containing similar Fe contents (about Fo90) are 1.3–2.3 mm2s−1 and 3.8–6.3 Wm−1K−1, respectively. In Figure 5d, compositional dependences of κ under different temperatures (300, 400, 600, and 1000 K) at 1 bar were fitted to estimate the influence of scattering by solute atoms, based on the model of Padture and Klemens [70], which can be used as a rough guide to predict the thermal conductivities of intermediate compositions.
5. Geophysical Applications
In the present review, most studies show that the D and κ of minerals and rocks are greatly affected by temperature, pressure, composition, and crystal structure. Using a constant value of κ to discuss the kinetic problems of the mantle and subducting slabs is not appropriate. Experimental results on the D and κ of olivine, wadsleyite, and ringwoodite at high temperatures and pressures may strengthen our understanding of the geodynamic processes of the upper mantle and the transition zone. For example, deep earthquakes in the transition zone are suggested to be triggered by transformational faulting occurring along wadsleyite or ringwoodite in the slabs [70]. The thermal escape process induced by faults is consistent with the low rupture velocity and seismic efficiency of deep earthquakes [71]. The results in Figure 4b show that κ increases rapidly by approximately 30% at the depth where transformation of olivine to wadsleyite occurs. Marton et al. [72] used the variable κ data of olivine, wadsleyite, and ringwoodite from Xu et al. [22] in a thermodynamic subduction model; compared with a fixed-value conductivity model, the numerical simulations of these authors indicated that the maximum depth of metastable olivine in the subduction lithospheric plate was reduced by 50 km. Such a metastable olivine depth cannot explain the occurrence of deep earthquakes.
The temperature distribution on Earth largely depends on the thermal transport properties of minerals and rocks, surface heat flow, heat production, and mode of heat transfer. An additional purpose of measuring the thermal properties of these minerals and rocks is to establish the relationship between depth and temperature in the stable lithosphere area, in which heat conduction is the dominant transport process. Comparison of the calculated geothermal curve with the solidus line of water-rich minerals may explain whether melting inside the crust is obvious [66,73].
6. Concluding Remarks and Perspectives
In this study, we provide a comprehensive overview of the D and κ values of olivine and its high-pressure polymorphs, wadsleyite and ringwoodite. The D and κ of mantle minerals mainly depend on temperature, pressure, porosity, water content, crystal orientation, composition, and other parameters, such as oxygen fugacity and lattice defects. New advances in the applications of the laser-flash method to the field of DAC were recently made to explore the thermal properties of minerals in the lower mantle [26].
Although significant progress has been made in measuring the thermal properties of minerals and rocks over the past few decades, a number of important issues are yet to be addressed. Incorporation of water into mantle minerals significantly influences the D and κ [27,29]. However, hydration effects on the D and κ of some major mantle minerals, such as pyroxene, garnet, wadsleyite, and ringwoodite, have not been reported thus far. Quantitative studies on the hydration-reduced κ of these mantle minerals may change the traditional understanding of the temperature profile and dynamics of the mantle and subducting slabs. Moreover, we noted that oxygen fugacity plays an important role in the origin and evolution of Earth’s various layers [74,75]; whether this could affect κ has not been investigated. Many other unresolved issues require further exploration.
Author Contributions
Writing—original draft preparation, Z.X.; writing—review and editing, B.Z.
Funding
This study was supported by the 1000Plan Program for Young Talents, the Strategic Priority Research Program (B) of CAS (18010401), NSF of China (41973056, 41773056, 41303048), Science Foundation of Guizhou Province (2017-1196, 2018-1176).
Conflicts of Interest
The authors declare no conflict of interest.
References
- Hofmeister, A.M. Mantle values of thermal conductivity and the geotherm from phonon lifetimes. Science 1999, 283, 1699–1706. [Google Scholar] [CrossRef] [PubMed]
- Dubuffet, F.; Yuen, D.A.; Rainey, E.S.G. Controlling thermal chaos in the mantle by positive feedback from radiative thermal conductivity. Nonlinear Process. Geophys. 2002, 9, 311–323. [Google Scholar] [CrossRef]
- Van Den Berg, A.P.; Yuen, D.A.; Allwardt, J.R. Non-linear effects from variable thermal conductivity and mantle internal heating: Implications for massive melting and secular cooling of the mantle. Phys. Earth Planet. Inter. 2002, 129, 359–375. [Google Scholar] [CrossRef]
- Hofmeister, A.M.; Yuen, D.A. Critical phenomena in thermal conductivity: Implications for lower mantle dynamics. J. Geodyn. 2007, 44, 186–199. [Google Scholar] [CrossRef]
- Michaut, C.; Jaupart, C.; Bell, D.R. Transient geotherms in Archean continental lithosphere: New constraints on thickness and heat production of the subcontinental lithospheric mantle. J. Geophys. Res. 2007, 112, B04408. [Google Scholar] [CrossRef]
- Ringwood, A.E.; Major, A. The system Mg2SiO4-Fe2SiO4 at high pressures and temperatures. Phys. Earth Planet. Inter. 1970, 3, 89–108. [Google Scholar] [CrossRef]
- Schmeling, H.; Monz, R.; Rubie, D.C. The influence of olivine metastability on the dynamics of subduction. Earth Planet. Sci. Lett. 1999, 165, 55–66. [Google Scholar] [CrossRef]
- Emmerson, B.; McKenzie, D. Thermal structure and seismicity of subducting lithosphere. Phys. Earth Planet. Inter. 2007, 163, 191–208. [Google Scholar] [CrossRef] [Green Version]
- Maierová, P.; Chust, T.; Steinle-Neumann, G.; Čadek, O.; Čížková, H. The effect of variable thermal diffusivity on kinematic models of subduction. J. Geophys. Res. 2012, 117, B07202. [Google Scholar] [CrossRef]
- McKenzie, D.; Jackson, J.; Priestley, K. Thermal structure of oceanic and continental lithosphere. Earth Planet. Sci. Lett. 2005, 233, 337–349. [Google Scholar] [CrossRef]
- Hofmeister, A.M.; Branlund, J.M.; Pertermann, M. Properties of rocks and minerals-Thermal conductivity of the Earth. In Treatise on Geophysics; Elsevier: Amsterdam, The Netherlands, 2007; Volume 2, pp. 543–577. [Google Scholar]
- Furlong, K.P.; Chapman, D.S. Heat flow, heat generation, and the thermal state of the lithosphere. Annu. Rev. Earth Planet. Sci. 2013, 41, 385–410. [Google Scholar] [CrossRef]
- Bridgman, P.W. The thermal conductivity and compressibility of several rocks under high pressures. Am. J. Sci. 1924, 38, 81–102. [Google Scholar] [CrossRef]
- Parker, J.W.; Jenkins, J.R.; Butler, P.C.; Abbott, G.I. Flash method of determining thermal diffusivity, heat capacity, and thermal conductivity. J. Appl. Phys. 1961, 32, 1679–1684. [Google Scholar] [CrossRef]
- Cowan, D.R. Pulse method of measuring thermal diffusivity at high temperatures. J. Appl. Phys. 1963, 34, 926–927. [Google Scholar] [CrossRef]
- Heckman, R.C. Finite pulse-time and heat loss effects in pulse thermal diffusivity measurements. J. Appl. Phys. 1973, 44, 1455–1460. [Google Scholar] [CrossRef]
- Azumi, T.; Takahashi, Y. Novel finite pulse-width correction in flash thermal diffusivity measurement. Rev. Sci. Instrum. 1981, 52, 1411–1413. [Google Scholar] [CrossRef]
- Josell, D.; Warren, K.; Czairliyan, A. Correcting an error in Cape and Lehman’s analysis for determining thermal diffusivity from thermal pulse experiments. J. Appl. Phys. 1995, 78, 6867–6869. [Google Scholar] [CrossRef]
- Blumm, J.; Opfermann, J. Improvement of the mathematical modeling of flash measurements. High Temp. High Press. 2002, 34, 515–521. [Google Scholar] [CrossRef]
- Fujisawa, H.; Fujii, N.; Mizutani, H.; Kanamori, H.; Akimoto, S. Thermal diffusivity of Mg2SiO4, Fe2SiO4, and NaCl at high pressures and temperatures. J. Geophys. Res. 1968, 73, 4727–4733. [Google Scholar] [CrossRef]
- Katsura, T. Measurement of thermal diffusivity at high pressures and high temperatures. Proc. Jpn. Acad. B Phys. 1992, 68, 81–86. [Google Scholar] [CrossRef]
- Xu, Y.; Shankland, T.J.; Linhardt, S.; Rubie, D.C.; Langenhorst, F.; Klasinski, K. Thermal diffusivity and conductivity of olivine, wadsleyite and ringwoodite to 20 GPa and 1373 K. Phys. Earth Planet. Inter. 2004, 143, 321–336. [Google Scholar] [CrossRef]
- Dzhavadov, L.N. Measurement of thermophysical properties of dielectrics under pressure. High Temp. High Press. 1975, 7, 49–54. [Google Scholar]
- Osako, M.; Ito, E.; Yoneda, A. Simultaneous measurements of thermal conductivity and thermal diffusivity for garnet and olivine under high pressure. Phys. Earth Planet. Inter. 2004, 143, 311–320. [Google Scholar] [CrossRef]
- Yoneda, A.; Yonehara, M.; Osako, M. Anisotropic thermal properties of talc under high temperature and pressure. Phys. Earth Planet. Inter. 2012, 190–191, 10–14. [Google Scholar] [CrossRef]
- Yagi, T.; Ohta, K.; Kobayashi, K.; Taketoshi, N.; Hirose, K.; Baba, T. Thermal diffusivity measurement in a diamond anvil cell using a light pulse thermoreflectance technique. Meas. Sci. Technol. 2011, 22, 24011. [Google Scholar] [CrossRef]
- Hofmeister, A.M.; Pertermann, M.; Branlund, J.M.; Whittington, A.G. Geophysical implications of reduction in thermal conductivity due to hydration. Geophys. Res. Lett. 2006, 33, L11310. [Google Scholar] [CrossRef]
- Hofmeister, A.M.; Dong, J.; Branlund, J.M. Thermal diffusivity of electrical insulators at high temperatures: Evidence for diffusion of bulk phonon-polaritons at infrared frequencies augmenting phonon heat conduction. J. Appl. Phys. 2014, 115, 163517. [Google Scholar] [CrossRef]
- Chang, Y.Y.; Hsieh, W.P.; Tan, E.; Chen, J. Hydration-reduced lattice thermal conductivity of olivine in Earth’s upper mantle. Proc. Natl. Acad. Sci. USA. 2017, 114, 4078–4081. [Google Scholar] [CrossRef]
- Zhang, Y.Y.; Yoshino, T.; Yoneda, A.; Osako, M. Effect of iron content on thermal conductivity of olivine with implications for cooling history of rocky planets. Earth Planet. Sci. Lett. 2019, 519, 109–119. [Google Scholar] [CrossRef]
- Grigull, U.; Sandner, H. Wärmeleitung; Springer: Berlin, Germany, 1979. [Google Scholar]
- Kittel, C. Introduction to Solid State Physics, 8th ed.; Wiley: New York, NY, USA, 2004; p. 704. [Google Scholar]
- Hunt, S.A.; Walker, A.M.; McCormack, R.J.; Dobson, D.P.; Wills, A.S.; Li, L. The effect of pressure on thermal diffusivity in pyroxenes. Mineral. Mag. 2011, 75, 2597–2610. [Google Scholar] [CrossRef]
- Eucken, A. Über die Temperaturabhä ngigkeit der Wä rmeleitfä higkeit fester Nichtmetalle. Ann. Phys. (Leipzig) 1911, 34, 186–221. [Google Scholar]
- Shankland, T.J. Pressure shift of infrared absorption bands in minerals and the effect on radiative heat transport. J. Geophys. Res. 1970, 75, 409–413. [Google Scholar] [CrossRef]
- Reiss, H. Radiative Transfer in Nontransparent, Dispersed Media; Springer: Berlin/Heidelberg, Germany; New York, NY, USA, 1988. [Google Scholar]
- Gibert, B.; Schilling, F.R.; Gratz, K.; Tommasi, A. Thermal diffusivity of olivine single crystals and a dunite at high temperature: Evidence for heat transfer by radiation in the upper mantle. Phys. Earth Planet. Inter. 2005, 151, 129–141. [Google Scholar] [CrossRef]
- Katsura, T. Thermal diffusivity of olivine under upper mantle conditions. Geophys. J. Int. 1995, 122, 63–69. [Google Scholar] [CrossRef] [Green Version]
- Clauser, C. Geothermal energy. In Landolt-Börnstein, Group VIII: Advanced Materials and Technologies, Vol. 3: Energy Technologies, Subvol. C: Renewable Energies; Heinloth, K., Ed.; Springer: Heidelberg/Berlin, Germany, 2006; pp. 480–595. [Google Scholar]
- Kobayashi, Y. Anisotropy of thermal diffusivity in olivine, pyroxene and dunite. J. Phys. Earth 1974, 22, 359–373. [Google Scholar] [CrossRef]
- Hofmeister, A.M.; Schilling, F.R. Heat transfer in quartz, orthoclase, and sanidine at elevated temperature. Phys. Chem. Miner. 2002, 29, 571–584. [Google Scholar] [CrossRef]
- Pertermann, M.; Hofmeister, A.M. Thermal diffusivity of olivine-group minerals at high temperature. Am. Mineral. 2006, 91, 1747–1760. [Google Scholar] [CrossRef]
- Gibert, B.; Mainprice, D. Effect of crystal preferred orientations on the thermal diffusivity of quartz polycrystalline aggregates at high temperature. Tectonophysics 2009, 465, 150–163. [Google Scholar] [CrossRef]
- Branlund, J.M.; Hofmeister, A.M. Heat transfer in plagioclase feldspars. Am. Mineral. 2012, 97, 1145–1154. [Google Scholar] [CrossRef]
- Tommasi, A.; Gibert, B.; Seipold, U.; Mainprice, D. Anisotropy of thermal diffusivity in the upper mantle. Nature 2001, 411, 783–786. [Google Scholar] [CrossRef]
- Beck, A.E.; Darbha, D.M.; Schloessin, H.H. Lattice conductivities of single-crystal and polycrystalline materials at mantle pressures and temperatures. Phys. Earth Planet. Inter. 1978, 17, 35–53. [Google Scholar] [CrossRef]
- Yukutake, H.; Shimada, M. Thermal conductivity of NaCl, MgO, coesite and stishovite up to 40 kbar. Phys. Earth Planet. Inter. 1978, 17, 193–200. [Google Scholar] [CrossRef]
- Abdulagatov, I.M.; Emirov, S.N.; Abdulagatova, Z.Z. Effect of pressure and temperature on the thermal conductivity of rocks. J. Chem. Eng. Data. 2006, 51, 22–33. [Google Scholar] [CrossRef]
- Chai, M.; Brown, J.M.; Slutsky, L.J. Thermal diffusivity of mantle minerals. Phys. Chem. Miner. 1996, 23, 470–475. [Google Scholar] [CrossRef]
- Zaug, J.; Abramson, E.H.; Brown, J.M.; Slutsky, L.J. Elastic constants, equations of state and thermal diffusivity at high pressure. In High Pressure Research: Applications to Earth and Planetary Science; Syono, Y., Manghnani, M., Eds.; American Geophysical Union: Washington, DC, USA, 1992; pp. 157–166. [Google Scholar]
- Schilling, F.R. A transient technique to measure thermal diffusivity at elevated temperatures. Eur. J. Mineral. 1999, 11, 1115–1124. [Google Scholar] [CrossRef]
- Katsura, T. Thermal diffusivity of silica glass at pressures up to 9 GPa. Phys. Chem. Miner. 1993, 20, 201–208. [Google Scholar] [CrossRef]
- Katsura, T. Thermal diffusivity of periclase at high temperatures and high pressures. Phys. Earth Planet. Inter. 1997, 101, 73–77. [Google Scholar] [CrossRef]
- Hofmeister, A.M. Thermal diffusivity of garnets at high temperature. Phys. Chem. Miner. 2006, 33, 45–62. [Google Scholar] [CrossRef]
- Braeuer, H.; Dusza, L.; Schulz, B. New laser flash equipment LFA 427. Interceram. 1992, 41, 489–492. [Google Scholar]
- Gibert, B.; Seipold, U.; Tommasi, A.; Mainprice, D. Thermal diffusivity of upper mantle rocks: Influence of temperature, pressure, and the deformation fabric. J. Geophys. Res. 2003, 108, 2359. [Google Scholar] [CrossRef]
- Seipold, U. Simultaneous measurements of thermal diffusivity and thermal conductivity under high pressure using thermal pulse of finite length. High Temp. High Press. 1988, 20, 609–613. [Google Scholar]
- Schatz, J.F.; Simmons, G. Method of simultaneous measurement of radiative and lattice thermal conductivity. J. Appl. Phys. 1972, 43, 2586–2594. [Google Scholar] [CrossRef]
- Abramson, E.H.; Brown, J.M.; Slutsky, L.J. The thermal diffusivity of water at high pressures and temperatures. J. Chem. Phys. 2001, 115, 10461–10463. [Google Scholar] [CrossRef]
- Cahill, D.; Watson, S.K.; Pohl, R.O. Lower limit of thermal conductivity of disordered solids. Phys. Rev. B 1992, 46, 6131–6140. [Google Scholar] [CrossRef] [PubMed]
- Kanamori, H.; Fujii, N.; Mizutani, H. Thermal diffusivity measurement of rock-forming minerals from 300 to 1100 K. J. Geophys. Res. 1968, 73, 595–605. [Google Scholar] [CrossRef]
- Schatz, J.F.; Simmons, G. Thermal conductivity of Earth materials at high temperatures. J. Geophys. Res. 1972, 77, 6966–6983. [Google Scholar] [CrossRef] [Green Version]
- Kanamori, H.; Mizutani, H.; Fujii, N. Method of thermal diffusivity measurement. J. Phys. Earth. 1969, 17, 43–53. [Google Scholar] [CrossRef]
- Schärmeli, G.H. Anisotropy of olivine thermal conductivity at 2.5 GPa up to 1500 K measured on optically non-thick sample. In High-Pressure Researches in Geoscience; Schreyer, W., Ed.; Schweizerbart: Stuttgart, Germany, 1982; pp. 349–373. [Google Scholar]
- Petrunin, G.I.; Orlik, E.V. Thermal diffusivity of mantle (pyrolite) minerals at temperatures between room temperature and melting point (300–1700 K). Mosc. Univ. Phys. Bull. 2007, 62, 388–392. [Google Scholar] [CrossRef]
- Miao, S.; Li, H.; Chen, G. The temperature dependence of thermal conductivity for lherzolites from the North China Craton and the associated constraints on the thermodynamic thickness of the lithosphere. Geophys. J. Int. 2014, 197, 900–909. [Google Scholar] [CrossRef] [Green Version]
- Arafin, S.; Singh, R.N.; George, A.K. Thermal Diffusivity and Heat of Formation of Harzburgite and Its Major Constituent Minerals. Int. J. Thermophys. 2011, 32, 2139–2147. [Google Scholar] [CrossRef]
- Horai, K.; Simmons, G. Thermal conductivity of rock-forming minerals. Earth Planet. Sci. Lett. 1969, 6, 359–368. [Google Scholar] [CrossRef]
- Padture, N.; Klemens, P. Low thermal conductivity in garnets. J. Am. Ceram. Soc. 1997, 80, 1018–1020. [Google Scholar] [CrossRef]
- Green, H.W., II; Houston, H. The mechanics of deep earthquakes. Ann. Rev. Earth Planet. Sci. 1995, 23, 169–213. [Google Scholar] [CrossRef]
- Wiens, D.A. Seismological constraints on the mechanism of deep earthquakes: Temperature dependence of deep earthquake source properties. Phys. Earth Planet. Inter. 2001, 127, 145–163. [Google Scholar] [CrossRef]
- Marton, F.C.; Shankland, T.J.; Rubie, D.C.; Xu, Y. Effects of variable thermal conductivity on the mineralogy of subducting slabs and implications for mechanisms of deep earthquakes. Phys. Earth Planet. Inter. 2005, 149, 53–64. [Google Scholar] [CrossRef]
- Chapman, D.S. Thermal gradients in the continental crust. Geol. Soc. Spec. Publ. 1986, 24, 63–70. [Google Scholar] [CrossRef]
- Grant, K.; Brooker, R.A.; Kohn, S.C.; Wood, B. The effect of oxygen fugacity on hydroxyl concentrations and speciation in olivine: Implications for water solubility in the upper mantle. Earth Planet. Sci. Lett. 2007, 261, 217–229. [Google Scholar] [CrossRef]
- Kolzenburg, S.; Genova, D.D.; Giordano, D.; Hess, K.U.; Dingwell, D.B. The effect of oxygen fugacity on the rheological evolution of crystallizing basaltic melts. Earth Planet. Sci. Lett. 2018, 487, 21–32. [Google Scholar] [CrossRef]
Figure 1.
Temperature dependence of D and κ of single crystal olivine. The solid, dotted, and dashed lines denote measurement for the [100], [001], and [010] directions. Data source: KFM68, Kanamori et al. [61]; SS72, Schatz and Simmons [62]; K74, Kobayashi [40]; BDS78, Beck et al. [46]; S82, Scharmeli [64]; GSG05, Gibert et al. [37]; PH06, Pertermann and Hofmeister [42]. (a): D. (b): κ.

Figure 2.
Temperature dependence of D and κ of polycrystalline olivine. (a) and (c): D. (b) and (d): κ. Data source: FFM68, Fujisawa et al. [20]; SS72, Schatz and Simmons [59]; BDS78, Beck et al. [46]; K95, Katsura [38]; GST03, Gibert et al. [52]; XSL04, Xu et al. [22]; GSG05, Gibert et al. [37]; PH06, Pertermann and Hofmeister [42]; PO07, Petrunin and Orlik [65]; ASG11, Arafin et al. [67]; MLC14, Miao et al. [66]; ZYY19, Zhang et al. [30].
Figure 3.
Pressure dependence of D and κ of olivine. (a) and (c): D. (b) and (d): κ. Data source: FFM68, Fujisawa et al. [20]; BDS78, Beck et al. [46]; K95, Katsura [38]; OIY04, Osako et al. [24]; XSL04, Xu et al. [22]; ZYY19, Zhang et al. [30].

Figure 4.
Temperature dependence of D and κ of wadsleyite and ringwoodte, according to Xu et al. [22]. (a): D. (b): κ. The dotted line data were calculated by Hofmeister [1].

Figure 5.
Effect of Fe content on D and κ in single crystal and polycrystalline olivine. (a) and (c): D. (b) and (d): κ. The influence of scattering by solute atom on the κ under various temperatures is modeled using the model proposed by Padture and Klemens [69]. This model predicts the κ of olivine with any Fe content.


Table 1.
The scope of application of major measurement methods.
| Method | The Maximum T and P | Advantages | Disadvantages | References |
|---|---|---|---|---|
| An Ångström method | 1700 K, 20 GPa | Simultaneously obtains D or κ. | Contact thermal resistance; photon radiation may exist at high temperatures. | [20,22,52] |
| A pulse heating method | 1100 K, 8.3 GPa | Simultaneously obtains D or κ. | Contact thermal resistance; photon radiation may exist at high temperatures. | [23,24] |
| A transient method | 1200 K | Allows the separation of non-conductive radiative processes and purely diffusive mechanisms. | Only get the D; large sample sizes; thermal cracking; includes spurious radiative transfer and contact resistance effects. | [56,57] |
| A laser-wave method | 1900 K | Simultaneous measurement of κradiative and κlattice; contact-free for measurement. | Has not been applied to high pressure; thermal cracking. | [58] |
| Picosecond transient grating spectroscopy method | 40 GPa | Contact-free for measurement; small experimental error; separation of lattice and radiative contributions to transport. | Only get the D; higher technical requirement; application in DAC is not mature enough. | [49,59] |
| The laser-flash method | 2200 K | Avoids photon radiation; the most accurate method so far. | Only get the D; has not yet been applied to high pressure; thermal cracking. | [55] |
| Steady-state radial heat flow method | 650 K, 5.6 GPa | Simultaneously obtains D or κ. | Large contact thermal resistance; change in spacing between two thermocouples. | [46] |
| 3ω method | 30–300 K; 0.8 GPa | Insensitive to errors from black-body radiation. | Involves a single contact; Earth materials are less measured. | [60] |
| The light pulse thermoreflectance method | 144 GPa | Accurately obtains D at high pressure. | Only get D; has not yet been applied to high temperature. | [26] |
Note: D and κ: Thermal diffusivity and thermal conductivity. κradiative and κlattice: Radiative thermal conductivity and lattice thermal conductivity. Ac: Alternating current. DAC: Diamond anvil cell.
Table 2.
Characteristics of the reviewed olivine, wadsleyite, and ringwoodite.
| Sample | T (K) | P (GPa) | Test Method | Fitting Formula | Reference |
|---|---|---|---|---|---|
| Olivine | |||||
| Fo and Fa | 400–1300 | 2.4–5.0 | An Ångström method | D or κ = a + b/T + c/T2 + d/T3 | [20] |
| Single-crystal olivine | 300–1100 | 1 atm | An Ångström method | D or κ = a + b/T + c/T2 + d/T3 | [61] |
| Single-crystal olivine | 500–1900 | 1 atm | An laser-wave method | D or κ = a + b/T + c/T2 + d/T3 | [62] |
| Single-crystal olivine | 1250 | 1 atm | A modified Ångström method | D or κ = a + b/T + c/T2 + d/T3 | [40] |
| Single-crystal olivine | 350–650 | 0–5.6 | Steady-state radial heat flow method | κ = a + b/T + c/T2 + d/T3 | [46] |
| Dunite | 350–650 | 0–5.6 | Steady-state radial heat flow method | κ = a + b/T + c/T2 + d/T3 | [46] |
| Fo89 | 1700 | 9.0 | An Ångström method | D or κ = a + b/T + c/T2 + d/T3 | [38] |
| Peridotite | 1250 | 1.0 | A transient method | D = a + b/T + c/T2 + d/T3 | [52] |
| Single-crystal olivine | 1100 | 8.3 | A pulse heating method | D or κ = a + b/T | [24] |
| Fo90 | 1373 | 20 | An Ångström method | D = D298 (298/T)n × (1 + a × P) κ = κ298 (298/T)n × (1 + a × P) | [22] |
| Single-crystal olivine | 1123 | 1 atm | A transient method | D = a + b/T + c/T2 | [37] |
| Fo91 | 1123 | 1 atm | A transient method | D = a + b/T + c/T2 | [37] |
| Single-crystal olivine | 1500 | 1 atm | The laser-flash method | D = a + b/T + c/T2 | [42] |
| Fo90 | 1500 | 1 atm | The laser-flash method | D = a + b/T + c/T2 | [42] |
| Single-crystal olivine | 1100 | 1 atm | The temperature wave method | D–1 = a + b × T | [65] |
| Fo and Fa | 1700 | 1 atm | The temperature wave method | D–1 = a + b × T | [65] |
| Olivine | 1700 | 1 atm | The temperature wave method | D–1 = a + b × T | [65] |
| Lherzolite | 1473 | 1 atm | The laser-flash method | D or κ = a + b/T + c/T2 | [66] |
| Olivine | 1500 | 1 atm | A theoretical formulation | D = D0 exp (–ΔHD/R × T) κ = 0.0164 × ӨD – 6.292 | [67] |
| Harzburgite | 1300 | 1 atm | A theoretical formulation | D = D0 exp (–ΔHD/R × T) κ = 0.0164 × ӨD – 6.292 | [67] |
| Fo | 1700 | 1 atm | A theoretical formulation | D = D0 exp (–ΔHD/R × T) κ = 0.0164 × ӨD – 6.292 | [67] |
| Fa | 700 | 1 atm | A theoretical formulation | D = D0 exp (–ΔHD/R × T) κ = 0.0164 × ӨD – 6.292 | [67] |
| Fo, Fo90, Fo70, Fo31, Fa | 1100 | 10 | A pulse heating method | D = D298 (298/T)n × (1 + a × P) κ = κ298 (298/T)n × (1 + a × P) | [30] |
| Wadsleyite | |||||
| (Mg0.9Fe0.1)2SiO4 | 1373 | 14 | An Ångström method | D = D298 (298/T)n × (1 + a × P) κ = κ298 (298/T)n × (1 + a × P) | [22] |
| Ringwoodite | |||||
| (Mg0.9Fe0.1)2SiO4 | 1373 | 20 | An Ångström method | D = D298 (298/T)n × (1 + a × P) κ = κ298 (298/T)n × (1 + a × P) | [22] |
Note: D and κ represent thermal diffusivity and thermal conductivity and ӨD represents Debye temperature. Some articles did not give a fitting formula for their data. We fitted the data with the formula (D or κ = a + b/T + c/T2 + d/T
Table 3.
The summary of the pressure coefficients (dlnD/dP or dlnκ/dP) for olivine at normal pressure and temperature.
Table 3.
The summary of the pressure coefficients (dlnD/dP or dlnκ/dP) for olivine at normal pressure and temperature.
| Sample | T (K) | P (GPa) | Fitting Formula | Pressure Coefficient dlnD/dP or dlnκ/dP (GPa−1) | Reference |
|---|---|---|---|---|---|
| dlnD/dP | |||||
| Fo93 [100] | 293 | 0–8.3 | D = 2.5 × exp (0.033 × P) | 0.033 | [24] |
| Fo93 [010] | 293 | 0–8.3 | D = 1.53 × exp (0.04 × P) | 0.040 | [24] |
| Fo93 [001] | 293 | 0–8.3 | D = 2.16 × exp (0.035 × P) | 0.035 | [24] |
| Fo68 | 700 | 2.4–5.0 | D = 0.1563 × P + 0.966 | 0.162 | [20] |
| Fo68 | 1100 | 2.4–5.0 | D = 0.087 × P + 0.6742 | 0.129 | [20] |
| Fo89 | 400 | 0–9.0 | D = 0.052 × P + 1.1473 | 0.045 | [38] |
| Fo89 | 600 | 0–9.0 | D = 0.0315 × P + 0.8406 | 0.037 | [38] |
| Fo90 | 298–1300 | 0–20 | D = D298 (298/T)n (1 + a × P) | 0.036 | [22] |
| Fo | 298 | 0–10 | D = D298 (298/T)n (1 + a × P) | 0.040 | [30] |
| Fo90 | 298 | 0–10 | D = D298 (298/T)n (1 + a × P) | 0.024 | [30] |
| Fo50 | 298 | 0–10 | D = D298 (298/T)n (1 + a × P) | 0.016 | [30] |
| Fa | 298 | 0–10 | D = D298 (298/T)n (1 + a × P) | 0.025 | [30] |
| dlnκ/dP | |||||
| Fo93 [100] | 293 | 0–8.3 | κ = 6.61 × exp (0.038 × P) | 0.038 | [24] |
| Fo93 [010] | 293 | 0–8.3 | κ = 3.98 × exp (0.042 × P) | 0.042 | [24] |
| Fo93 [001] | 293 | 0–8.3 | κ = 5.91 × exp (0.034 × P) | 0.034 | [24] |
| Single-crystal olivine | 273 | 0–4.95 | κ = 0.7512 × P + 9.4932 | 0.079 | [46] |
| Single-crystal olivine | 538 | 0–4.95 | κ = 0.3209 × P + 6.6862 | 0.048 | [46] |
| Twin Sisters dunite | 273 | 0–4.95 | κ = 1.0529 × P + 6.2453 | 0.168 | [46] |
| Twin Sisters dunite | 515 | 0–4.95 | κ = 0.3022 × P + 4.3789 | 0.069 | [46] |
| Carolina dunite | 273 | 0–4.95 | κ = 0.1635 × P + 3.6785 | 0.044 | [46] |
| Carolina dunite | 572 | 0–4.95 | κ = 0.092 × P + 2.4294 | 0.037 | [46] |
| Muskox dunite | 273 | 0–5.6 | κ = 0.2765 × P + 4.8771 | 0.056 | [46] |
| Muskox dunite | 544 | 0–5.6 | κ = 0.0455 × P + 3.7220 | 0.012 | [46] |
| Fo90 | 298–1300 | 0–20 | κ = κ298 (298/T)n (1 + a × P) | 0.032 | [22] |
| Fo | 298 | 0–10 | κ = κ298 (298/T)n (1 + a × P) | 0.036 | [30] |
| Fo90 | 298 | 0–10 | κ = κ298 (298/T)n (1 + a × P) | 0.021 | [30] |
| Fo50 | 298 | 0–10 | κ = κ298 (298/T)n (1 + a × P) | 0.026 | [30] |
| Fa | 298 | 0–10 | κ = κ298 (298/T)n (1 + a × P) | 0.018 | [30] |
© 2019 by the authors. Licensee MDPI, Basel, Switzerland. This article is an open access article distributed under the terms and conditions of the Creative Commons Attribution (CC BY) license (http://creativecommons.org/licenses/by/4.0/).
Share and Cite
MDPI and ACS Style
Xiong, Z.; Zhang, B. Thermal Transport Properties of Olivine, Wadsleyite, and Ringwoodite—A Review. Minerals 2019, 9, 519. https://doi.org/10.3390/min9090519
AMA Style
Xiong Z, Zhang B. Thermal Transport Properties of Olivine, Wadsleyite, and Ringwoodite—A Review. Minerals. 2019; 9(9):519. https://doi.org/10.3390/min9090519
Chicago/Turabian StyleXiong, Zili, and Baohua Zhang. 2019. "Thermal Transport Properties of Olivine, Wadsleyite, and Ringwoodite—A Review" Minerals 9, no. 9: 519. https://doi.org/10.3390/min9090519
Note that from the first issue of 2016, this journal uses article numbers instead of page numbers. See further details here.