Ophiolitic Pyroxenites Record Boninite Percolation in Subduction Zone Mantle


1
Department of Geology and Geophysics, Woods Hole Oceanographic Institution, Woods Hole, MA 02543, USA
2
Department of Earth, Environmental, and Planetary Sciences, Brown University, Providence, RI 02912, USA
*
Author to whom correspondence should be addressed.
Minerals 2019, 9(9), 565; https://doi.org/10.3390/min9090565
Submission received: 27 August 2019
/
Revised: 6 September 2019
/
Accepted: 14 September 2019
/
Published: 18 September 2019
(This article belongs to the Special Issue Mineralogy, Petrology and Geochemistry of Ophiolitic Complexes)
Abstract
:The peridotite section of supra-subduction zone ophiolites is often crosscut by pyroxenite veins, reflecting the variety of melts that percolate through the mantle wedge, react, and eventually crystallize in the shallow lithospheric mantle. Understanding the nature of parental melts and the timing of formation of these pyroxenites provides unique constraints on melt infiltration processes that may occur in active subduction zones. This study deciphers the processes of orthopyroxenite and clinopyroxenite formation in the Josephine ophiolite (USA), using new trace and major element analyses of pyroxenite minerals, closure temperatures, elemental profiles, diffusion modeling, and equilibrium melt calculations. We show that multiple melt percolation events are required to explain the variable chemistry of peridotite-hosted pyroxenite veins, consistent with previous observations in the xenolith record. We argue that the Josephine ophiolite evolved in conditions intermediate between back-arc and sub-arc. Clinopyroxenites formed at an early stage of ophiolite formation from percolation of high-Ca boninites. Several million years later, and shortly before exhumation, orthopyroxenites formed through remelting of the Josephine harzburgites through percolation of ultra-depleted low-Ca boninites. Thus, we support the hypothesis that multiple types of boninites can be created at different stages of arc formation and that ophiolitic pyroxenites uniquely record the timing of boninite percolation in subduction zone mantle.
1. Introduction
A large variety of melts, such as tholeiitic, (calc-)alkaline, and boninitic magmas, percolates through the peridotite mantle wedge in active subduction zones. Constraining the relationship between the composition of erupted melts and that of exhumed residual mantle is critical to identify how melts interact with the peridotite wedge on their way to the surface. This study aims to decipher the nature and timing of melt percolation events that affect the arc mantle in subduction zones, using the geochemistry of peridotite-hosted pyroxenites in the Josephine ophiolite (USA).
The variable nature of arc melts comes from the fact that subduction zones host a large array of melting processes, variably influenced by addition of fluid-rich materials from the slab [1,2,3]. Primitive tholeiites may form during anhydrous melting of peridotite in the hot corner of the wedge [4,5]. Primitive calc-alkaline basalt and andesite may be produced during hydrous melting of peridotite [5,6,7,8] due to an influx of fluids [9] or fluid-rich mélange material from the subducting slab [10]. Boninites are believed to form during melting of variably depleted peridotite [11,12], or by re-equilibration with harzburgite or dunite during melt ascent [5,13,14,15,16]. In addition, highly alkaline melts in arcs have been linked to reaction of hydrous sediments with the mantle wedge [17], melting of phlogopite and amphibole-enriched domains [18,19], as well as partial melting of mélange diapirs [20]. In rare occurrences, carbonated potassic silicate melt can be found preserved in melt inclusions, which could reflect melting of phlogopite-bearing carbonated peridotite [21]. Although not exhaustive, these examples illustrate the diversity of melts that eventually reach the lithospheric mantle underneath arcs, forearcs, and back-arcs, where their signature can potentially be observed in veins and layers distributed throughout the host peridotite.
Peridotite and pyroxenite xenoliths from arc environments have been shown to record fluid fluxing during melting in the mantle wedge [1,22] and metasomatism from a large variety of melts [2,23]. For example, pyroxenite veins hosted in peridotite xenoliths have been interpreted to form after percolation of low-Ca boninites produced by low degrees of melting of harzburgite [11,15], or high-Ca boninites produced by high degrees of melting of hybrid silica-rich mantle sources [12]. However, it remains ambiguous whether arc xenoliths directly record metasomatism in the supra-subduction zone mantle, and/or are affected by syn-eruptive processes in the host magma [24]. Therefore, it is useful to compare pyroxenites in the xenolith record with samples that have broader tectonic context, such as in ophiolites.
Exhumed supra-subduction zone (SSZ) ophiolites are ideal places to study the composition of melts that have reacted through the peridotite wedge and reached the shallow lithospheric mantle. The peridotite portion of these ophiolites is often associated with pyroxenite layers and dykes, which include orthopyroxenites, websterites, wehrlites, and clinopyroxenites [25,26]. These pyroxenites usually reflect melt migration in the upper mantle, and subsequent melt-rock or solid-state reaction processes, where pyroxenes crystallize at the expense of olivine [27,28]. Supra-subduction zone pyroxenites have variable major and trace element chemistry and may record multiple series of melt percolation processes [11,15,16]. Therefore, constraining their origin and timing of formation provides unique constraints on melt infiltration processes that occur in active subduction zones. Here we present new trace and major element analyses of orthopyroxene and clinopyroxene in peridotite-hosted orthopyroxenite and clinopyroxenite veins from the Josephine ophiolite. Using a combination of major and trace element closure temperatures, elemental profiles, diffusion modeling, and equilibrium melt calculations, we discuss how and when the pyroxenites formed, and how that relates to the timing of melt percolation in the Josephine ophiolite.
2. Geological Context
The Josephine ophiolite (Oregon/California) is part of a ~165 Ma belt of ophiolites emplaced into the crust from ~150 to 140 Ma [29,30]. It consists of a sequence of basalt, sheeted dikes, gabbro, gabbro layered with wehrlite, and dunite, in fault contact with mantle peridotite [30,31,32,33,34,35,36,37]. This sequence likely represents a portion of subduction zone mantle and arc crust that once overlay a subduction zone [30]. The supra-subduction flavor of the Josephine ophiolite is supported by the presence of arc-like extrusive rocks such as andesites and boninites [32,38]. Several models have been suggested to explain the diversity of melts found in the Josephine massif (e.g., high-Ca boninites, mid-ocean ridge basalt—MORB, Fe-Ti basalts). Based on the similarity with erupted melts in the northernmost Lau basin, it has been suggested that the Josephine ophiolite may represent a back-arc spreading center that had propagated across the arc [34].
The mantle section of the Josephine ophiolite consists of ~640 km2 of variably depleted spinel harzburgites and lherzolites re-equilibrated at temperatures of ~900 °C [32,39]. Although portions of the peridotite are heavily sheared and altered to serpentinite, most of the massif is only partially serpentinized in static conditions. The peridotite mainly consists of harzburgites and clinopyroxene-poor lherzolites, cross-cut or layered by orthopyroxenites, clinopyroxenites, and olivine-websterites. Locally, dunites are found as tabular bodies subparallel to pyroxenite layers, or irregular anastomosing bodies that range from a few centimeter to tens of meters in width, sometimes associated with active shear zones [28]. Orthopyroxenites usually cross-cut the main harzburgite/lherzolite foliation, as well as the dunite bodies, and range from a centimeter to ~20 cm thick. Dunites and orthopyroxenites are often associated with each other, suggesting that they both may have formed through late-stage melt transport.
In the northern—and best-studied—portion of the Josephine ophiolite, multistage and multiscale fluid and melt percolation processes have already been observed. In particular, the following observations have been made [40]: (1) harzburgites gradually transition to clinopyroxene-poor lherzolites at the kilometer scale; (2) major and trace element compositions of the peridotite rocks can be explained by 10–23% melting of depleted MORB mantle, potentially past the exhaustion of clinopyroxene in some areas; (3) melting was accompanied by continuous addition of fluids or fluid-rich material throughout the ~70 km2 studied area; (4) lithological and chemical transitions are much sharper at the outcrop (meter) scale due to the local presence of pyroxenite and dunite bodies; (5) the most depleted harzburgites show variable degrees of light rare-earth element (LREE) enrichment that likely reflect partial re-equilibration with boninitic melts [40].
3. Sample Descriptions
We collected orthopyroxenite and clinopyroxenite veins in the peridotite section of the Josephine ophiolite (Figure 1 and Figure 2). After petrographic observations of the cut samples and associated thick sections, we selected three orthopyroxenites and two clinopyroxenites that displayed the least amount of alteration to perform detailed chemical profiles on adjacent orthopyroxene and clinopyroxene grains. Our selection contains orthopyroxenites hosted in harzburgite, and clinopyroxenites hosted in either dunite or harzburgite. All veins are 10 cm thick or less and typically have sharp margins.
The pyroxenites display a porphyroclastic to protogranular texture (Figure 3). In most pyroxenites, pyroxene grain size ranges from 1 to 5 mm in diameter, sometimes surrounded by recrystallized olivine neoblasts typically less than 0.5 mm in diameter. In one clinopyroxenite (LK12-6-1), clinopyroxene (CPX) grains reach up to 10 mm in diameter. Orthopyroxenes (OPX) are generally larger than clinopyroxenes, which are often anhedral and poikilitic, and crystallized at a late stage in orthopyroxenite (Figure 3b). Clinopyroxene is either subhedral or anhedral in clinopyroxenites. Some orthopyroxenes exhibit extensive irregularly shaped CPX-exsolutions (Figure 3d), while clinopyroxenes usually display narrow OPX-exsolution lamellae (Figure 3c). Exsolution lamellae within pyroxenes were mapped and avoided as much as possible during in-situ chemical analyses. The use of chemical maps and detailed chemical profiles provided a means to exclude data that were the most contaminated by exsolutions.
4. Materials and Methods
4.1. Electron Probe Microanalyses (EPMA)
Major element compositions of orthopyroxene and clinopyroxene grains were obtained in situ on five 150 µm thick polished sections. We performed spot analyses using a JEOL JXA-8200 Superprobe electron probe microanalyzer at the Massachusetts Institute of Technology (Table S1), and additional rim-to-rim profiles using a Cameca SX100 electron microprobe at Brown University (Table S2).
For spot analyses, the instrument operated at 15 kV accelerating potential with a 10 nA beam current and a beam diameter of 20 μm. The counting times used for the phase analyses ranged from 40 s on peak to 20 s on background. All phases were quantified using silicate and oxide standards and data reduction was performed using the CITZAF package [41]. A minimum of three spots were measured per pyroxene grain, carefully chosen to avoid cracks, inclusions, and exsolution lamellae.
For rim-to-rim profiles, the instrument also operated at 15 kV accelerating voltage with a 10 nA beam current, and a defocused beam of 10–20 μm diameter was used. Counting times of 30 s and 15 s were used for the peak and background, respectively. Data were standardized to natural mineral standards and reduced using an in-house ZAF (atomic number, absorption, and fluorescence excitation effects) correction program. In some cases, multiple transects were performed along different directions for a single grain to capture any compositional variability that may be otherwise undetected from a single transect. The locations of the profiles were chosen to avoid cracks, inclusions, and exsolution lamellae. For coexisting and adjacent pairs of orthopyroxene and clinopyroxene (as found in thick sections LK12-6-1, LK12-5-2B, and LK12-11-2A), transects within each grain were configured so that they began from the crystal interior and terminated at the shared grain boundary. Analyses that were closest to the grain boundary on each side of the OPX-CPX grain boundary will be referred to as “adjacent analyses” throughout this manuscript.
Finally, wavelength-dispersive spectroscopy (WDS) X-ray element maps were collected to detect small exsolutions that could compromise the quality of major and trace element analyses. An example of our analytical approach, which includes detailed profiles and spot analyses, is presented in Figure 4.
4.2. LASER Ablation Trace Element Analyses
Orthopyroxene and clinopyroxene trace element concentrations were analyzed in situ by LASER ablation inductively coupled plasma mass spectrometry (LA-ICP-MS) on five 150 μm thick sections and are reported in Tables S3 and S4, respectively. The locations of measurements were chosen to minimize potential contamination of cracks, inclusions, and exsolution lamellae. We performed spot analyses using a single-collector Thermo Finnigan Element 2 ICP-MS coupled with a 213 nm wavelength New Wave LASER at the Woods Hole Oceanographic Institution (WHOI) and additional rim-to-rim and core-to-rim profiles using a Thermo Scientific X-Series-2 ICP-MS at Brown University coupled with a 193 nm wavelength Photon-Machines Analyte G2 LASER.
For spot analyses at WHOI, an Ar–He gas mix was used for sample introduction. The laser was operated with a fluence of ~10–15 J/cm2, a pulse frequency of 10 Hz, and a spot size of 100 μm, and signal integration time was 0.01 s. Visible exsolutions were avoided for analyses. Trace elements were measured in low (m/Δm ~300) mass resolution mode. Raw counts were converted into final concentrations using the data reduction spreadsheet developed by C.-T. Lee at Rice University. Data reduction was performed by subtracting the average background from the ablation signal. Instrumental drift and ablation efficiency were accounted for by normalizing counts using an internal standard (Ca for CPX or Mg for OPX) previously analyzed by EPMA. Elemental concentrations were quantified by generating calibration curves from repeat analyses of the three USGS glass reference materials BIR-1G, BHVO-2G, and BCR-2G. For trace element profiles at Brown University, a gas mixture of 7% H2 in He was used for sample introduction. The laser was operated with a fluence of ~4 J/cm2 and a pulse frequency of 10 Hz. A rectangular aperture was used, allowing the laser to change the geometry of its beam, producing rectilinear ablation pits (Figure 2). The 150 µm × 50 µm spot size was chosen to approximate the area of pits excavated by circular spots at WHOI. Raw counts were converted to final concentrations using Ca or Mg as internal standard. The same USGS materials (BIR-1G, BHVO-2G, and BCR-2G) were used to generate calibration curves.
For all LA-ICP-MS data (both at WHOI and Brown University), errors were calculated by using the 2 standard errors (2SE) of either element/Mg ratio or element/Ca ratio in selected peak time intervals. Analyses that had a 2SE larger than 100%, or were below detection limit (3 times background), were discarded. When additional analyses of the standards were treated as unknowns, elemental concentrations were accurate within <5% of their published values, on both instruments. Data from spot (WHOI) and profile (Brown University) measurements are consistent within error and can be used together to discuss trace element variability in pyroxenes.
5. Results
5.1. Major Element Variability in Pyroxene Grains
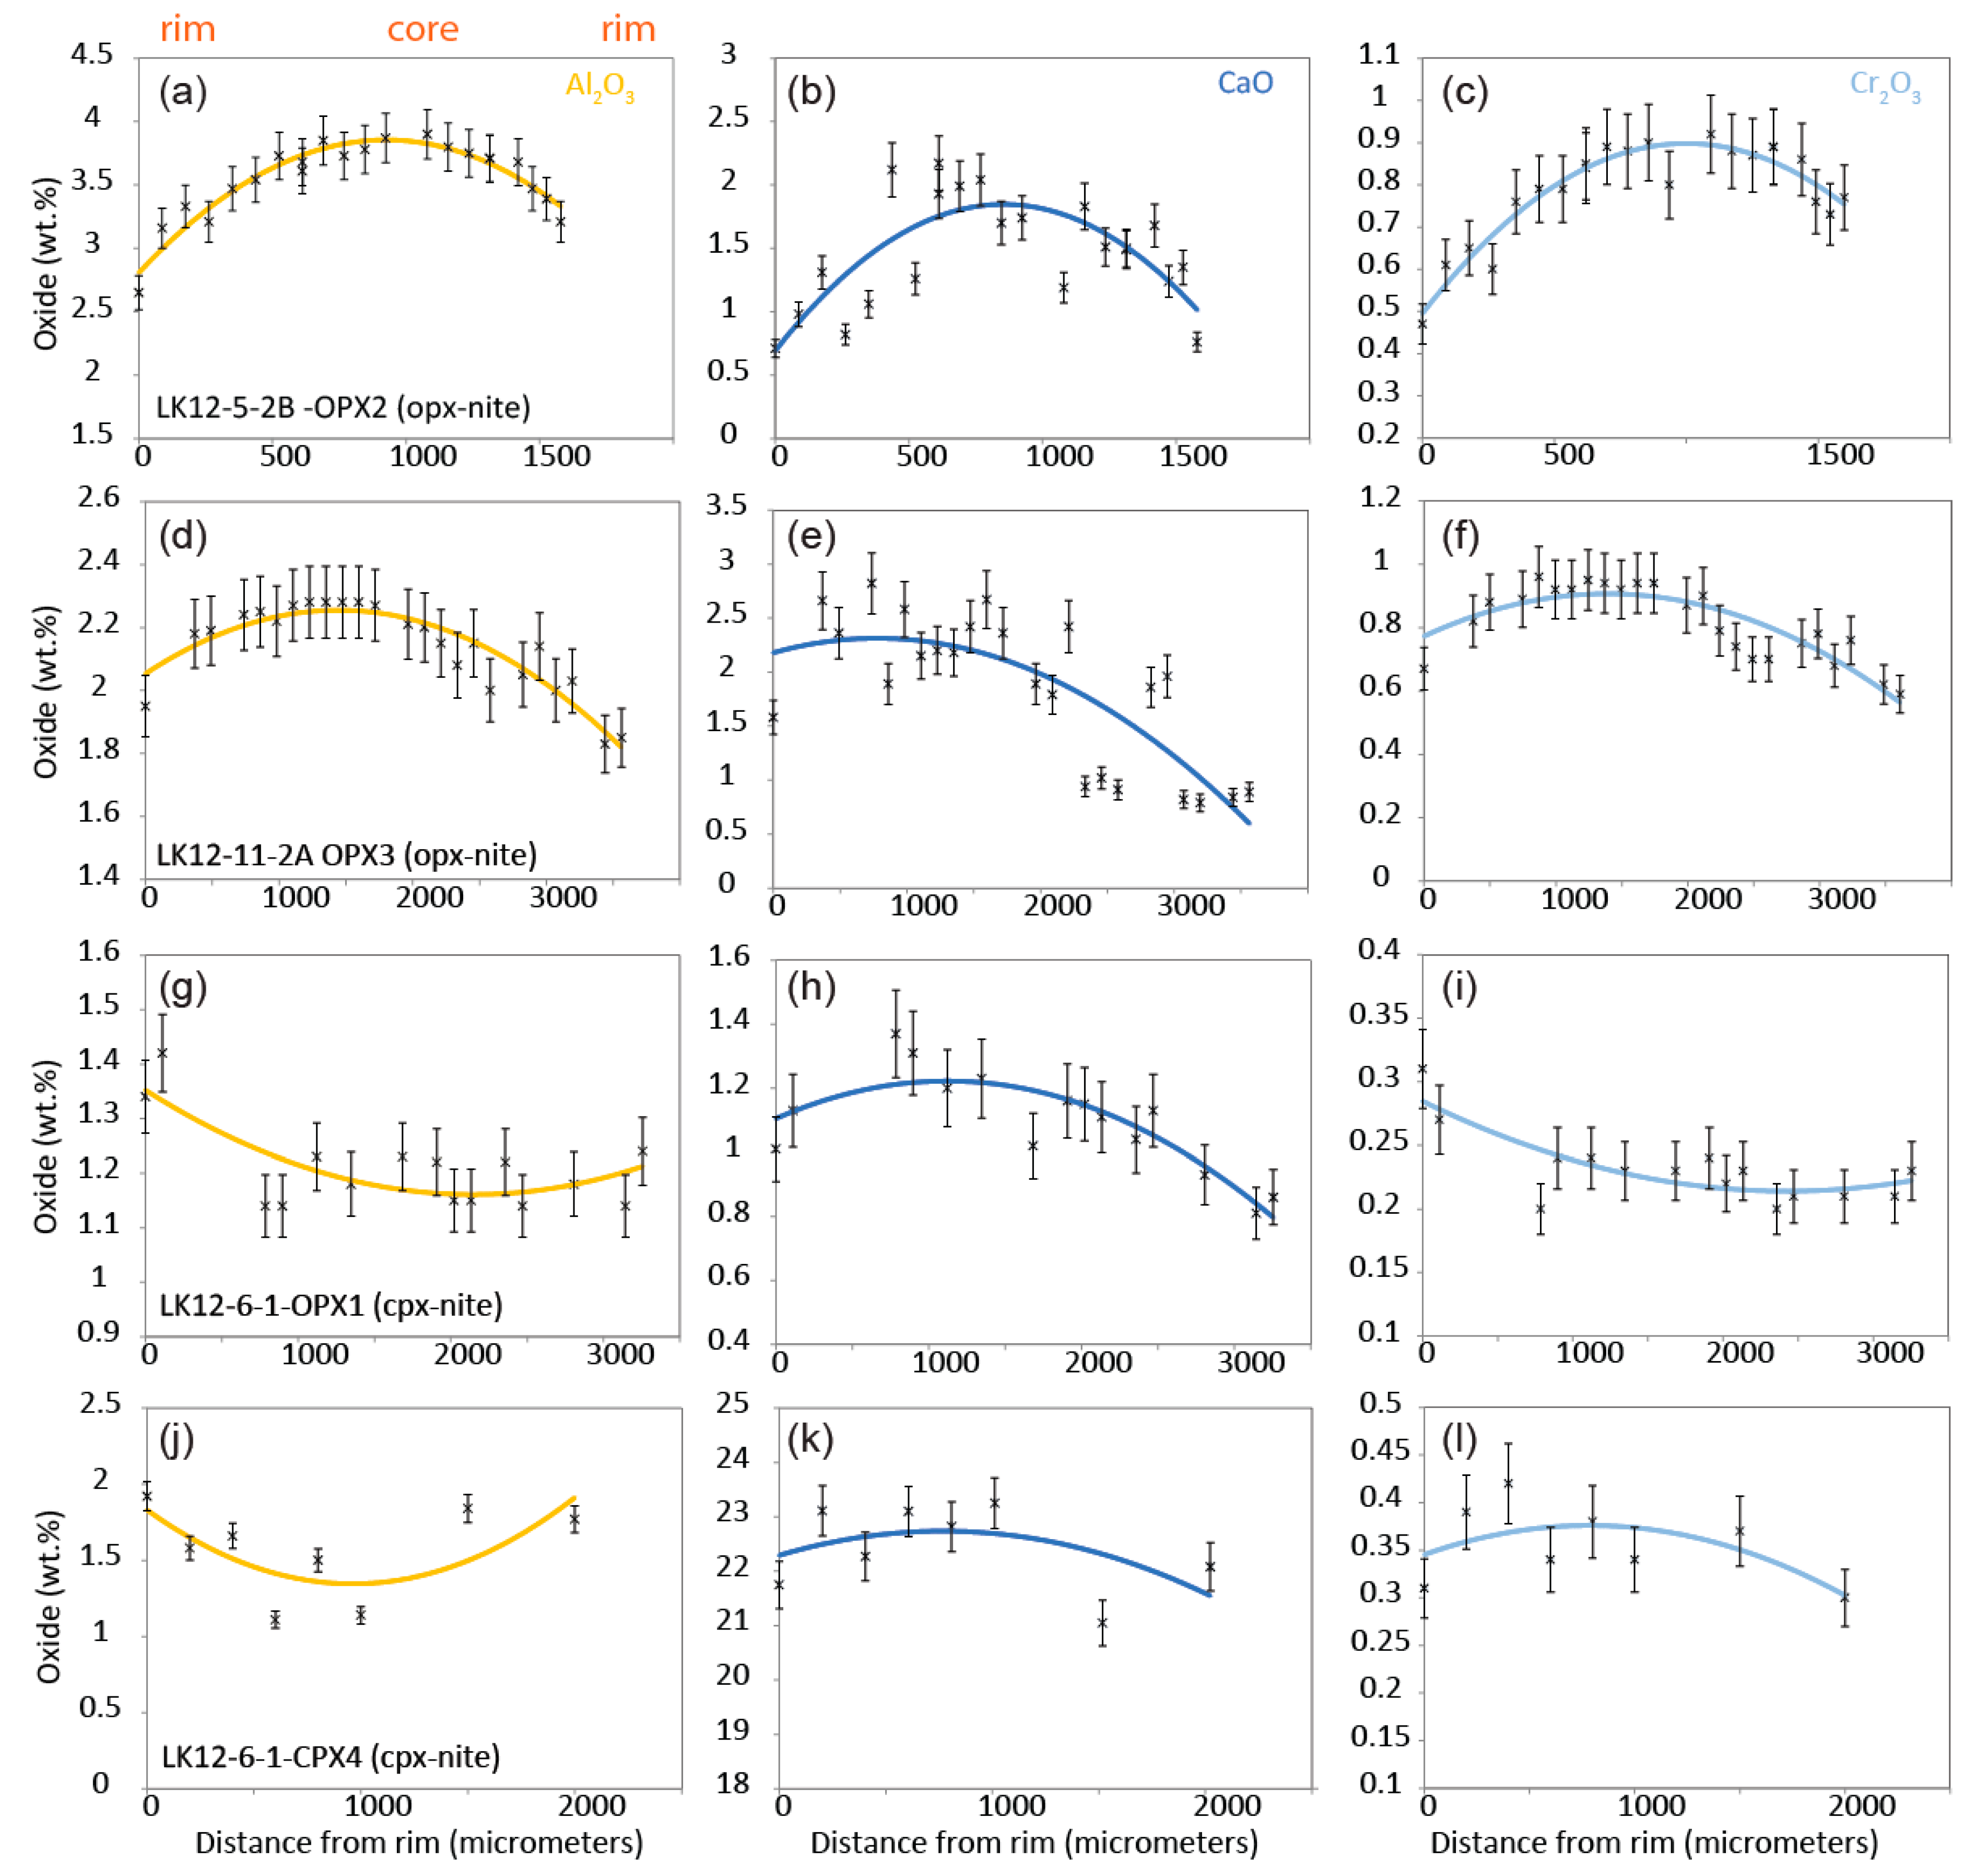
Rim-to-rim major element profiles were performed on nine selected grains (>2 mm). Four representative profiles are presented in Figure 5 to illustrate Al2O3, CaO, and Cr2O3 variations in three orthopyroxenes and one clinopyroxene from two orthopyroxenites and one clinopyroxenite. A couple of extreme outliers, such as high-CaO spikes in OPX (CaO > 5 wt.%), were discarded from these profiles and were attributed to previously undetected CPX exsolutions. In addition, MgO, FeO, and Mg# variations along grain profiles are presented in Figure S1. In both orthopyroxenites LK12-5-2B and LK12-11-2A, Al2O3, CaO, and Cr2O3 concentration in OPX decrease from core to rim. Although scattered, MgO and FeO generally increase from core to rim, while Mg# is roughly constant. The major element profiles are different in clinopyroxenite LK12-6-1. Orthopyroxene displays an increase of Al2O3 and Cr2O3 from core to rim and a decrease in CaO at the rims. Clinopyroxene in clinopyroxenite LK12-6-1 also shows an increase of Al2O3 from core to rim, but a slight decrease in CaO and Cr2O3 from core to rim. Although scattered, Mg# in both OPX and CPX slightly increases from core to rim.
5.2. Trace Element Variability in Pyroxene Grains
Individual rare-earth element (REE) patterns for orthopyroxene and clinopyroxene are presented in Figures S2 and S3, respectively. Averages of normalized trace element abundances are summarized in Figure 6. Extended spider diagrams of normalized trace element abundances in orthopyroxene and clinopyroxene are presented in Figure 6c–d, with individual patterns shown in Figures S4 and S5, respectively.
Clinopyroxenes REE patterns vary from depleted in LREE to nearly flat, while orthopyroxenes are consistently depleted in light REE compared to middle and heavy REE (MREE and HREE). In orthopyroxenites, both OPX and CPX are depleted in light REE compared to middle and heavy REE (MREE and HREE), show a slight positive La anomaly, and positive HFSE (Nb, Ta, Zr, Hf) and Ti anomalies. In clinopyroxenite LK12-10-2A, the CPX is depleted in LREE, mostly flat from MREE to HREE, and show negative HFSE anomalies. In clinopyroxenite LK12-6-1, CPX REE patterns are mostly flat with a small negative Eu anomaly. OPX shows positive HFSE and Ti anomalies, while CPX shows negative HFSE and Ti anomalies.
We now turn to intragrain trace element profiles. Rim-to-rim and core-to-rim profiles are presented in Figure 7 to illustrate Ti, Zr, Nb, Y, V, Yb, Er, and/or Th variability in three orthopyroxenes and two clinopyroxenes from two orthopyroxenites and two clinopyroxenites. Additional Ni and Co profiles are presented in Figure S6. These elements are chosen for display because Ti is particularly sensitive to subsolidus re-equilibration, Zr and Nb illustrate HFSE variability, Yb and Er are both used in temperature calculations presented in this study, V, Ni, and Co illustrate first-row transition element (FRTE) variability, and Th is the only fluid-mobile element to show detectable variability within error. In orthopyroxenite LK12-5-2B (¾ profile), Ti, Y, V, Yb, Ni, and Co systematically decrease from core to rim. In clinopyroxenite LK12-6-1 (half profile for CPX, full profile for OPX), Ti, Zr, Y, V, and Er increase from core to rim in both OPX and CPX, whereas Ni and Co decrease at the rim. In CPX from clinopyroxenite LK12-10-2A (full profile), Ti, Y, V, Ni, and Co show a decrease from core to rim, while Th shows an increase from core to rim. In orthopyroxenite LK12-11-2A, Ti, Y and Yb are roughly constant, while Ni and Co also decrease at the rim.
6. Discussion
6.1. Chemical Variability in Pyroxene Grains
Here we discuss how mineral-melt partitioning and subsolidus redistribution control the crystal chemistry and chemical zoning observed in the pyroxene grains (Figure 5 and Figure 7). In clinopyroxenites, we observed positive HFSE and Ti anomalies in OPX and complementary negative HFSE and Ti anomalies in CPX. These anomalies have been observed worldwide [43] and have been attributed to pyroxene-melt partitioning effects [44]. On the other hand, OPX and CPX in orthopyroxenites both show positive HFSE and Ti anomalies, which are inconsistent with a simple crystal-melt partitioning process. In addition, higher concentrations of HFSE in CPX compared to OPX rules out significant contamination of CPX analyses by OPX exsolutions, if the anomalies were in fact controlled by pyroxene-melt partitioning. Positive Zr–Hf anomalies in CPX can also be generated in reactive OPX-rich veins [16], but these veins typically have irregular margins, and CPX in these reactive veins present no positive Nb–Ta anomalies. Rather, the positive anomalies that we observe in orthopyroxenites may reflect subsolidus re-equilibration [45].
Intragrain profiles provide evidence for the role of subsolidus processes in the redistribution of HFSE and Ti between OPX and CPX. Diffusion of Ti between OPX and CPX results in characteristic reverse Ti zoning in orthopyroxene (depleted at the rim) and normal Ti zoning in diopside (enriched at the rim) [46]. In clinopyroxenite LK12-6-1, both OPX and CPX show an increase of Ti from core to rim, while CPX rims are depleted in Ti in clinopyroxenite LK12-10-2A. Therefore, Ti profiles in clinopyroxenite grains reflect re-equilibration with a melt, consistent with Al2O3 enrichments at the rims of both OPX and CPX (Figure 5g,j). High Th values at the rim of LK12-10-2A CPX could indicate that the vein re-equilibrated with a late, fluid-mobile element enriched melt. In orthopyroxenite LK12-11-2A (Figure 5d–f) and LK12-5-2B (Figure 5a–c), OPX displays Al2O3, CaO, Cr2O3, and TiO2 depletions at the rim that are consistent with subsolidus cooling effects. In addition, the presence of large CPX exsolutions in OPX from orthopyroxenites supports the hypothesis that chemical zoning is primarily related to subsolidus cooling. Finally, Ni and Co depletions in all pyroxene edges in all profiles (Figure S6) indicate that compatible FRTE were redistributed into minor olivine (Figure 3a) during cooling, as DNi and DCo olivine/pyroxene increase with decreasing temperature [47].
In summary, positive HFSE anomalies, OPX depletions (Ti, Al, Cr, Ni, and Ca), and numerous OPX and CPX exsolutions indicate that orthopyroxenites record subsolidus cooling effects, while crystal chemistry in clinopyroxenites records both crystal-melt partitioning (HFSE, Ti, Al) and subsolidus cooling effect (Ni, Co). Below, we determine the chronology of vein crystallization using OPX-CPX REE equilibrium, REE closure temperatures, and diffusion time-scales.
6.2. OPX-CPX REE Equilibrium
In order to determine whether REE concentrations in OPX are in equilibrium with REE concentrations in CPX, we plotted the apparent OPX/CPX partition coefficients of REE according to their ionic radii (Figure 8). Theoretical equilibrium Kds are calculated at 1000 °C and 1400 °C for comparison [48,49]. Well-equilibrated pyroxenes should plot on a nearly straight line in log space (dashed lines in Figure 8).
Using the average REE compositions of all analyzed grains (Figure 8a), we show that HREE from Ho to Lu plot on a linear trend that corresponds to a temperature of ~1000 °C or more. However, REE that are more incompatible than Ho (Dy to La) deviate from a straight line in all three samples that contain both OPX and CPX. Thus on average, only Lu, Yb, Tm, Er, and Ho are at equilibrium between OPX-CPX pairs. In clinopyroxene, incompatible elements with large ionic radii (e.g., LREE) diffuse ~35× slower than HREE, and LREE in CPX diffuse at slower rates than LREE in OPX [50]. REE disequilibrium could occur during crystallization of the veins if OPX crystallized first while CPX formed later as an interstitial phase (such as in orthopyroxenites) or during late percolation of small melt fractions through the wedge shortly before exhumation. In both cases, LREE in OPX may have time to partially re-equilibrate with the melt while LREE in CPX may not, resulting in apparent over-enrichment of LREE in OPX compared to CPX. Thus, we argue that equilibrium melts calculated from OPX chemistry are more reliable.
Using the trace element compositions of adjacent analyses only (i.e., performed at the very edge of both OPX and CPX in adjacent grains and in exsolutions if large enough for analysis), we observe that elements that diffuse at slower rates than Ho (e.g., Dy, Tb, Gd) [50] follow the trend established by the ~1000 °C isotherm of equilibrium partitioning between OPX and CPX (Figure 8b). In some cases (one adjacent pair in LK12-6-1), all REE up until Nd are in equilibrium between the two pyroxenes. Short diffusion distances at the grain edges likely favored equilibrium for most elements. However, in most cases, LREE are still disturbed and deviate from a theoretical equilibrium curve. These observations are important to select appropriate REE used to constrain closure temperatures.
6.3. Closure Temperatures
Major element and REE closure temperatures were calculated using a major-element based two-pyroxene thermometer [51] and REE-in-two-pyroxene thermometer [52]. Temperatures were calculated from two sets of data, namely from the average compositions of OPX and CPX (temperatures referred to as “averages”), and from adjacent analyses only (temperatures referred to as “adjacent grains”). For consistency, we performed all calculations by excluding REE more incompatible than Ho, which usually showed a significant deviation from an equilibrium partitioning curve (Figure 8). REE temperatures were inverted using a robust linear fit. Inversion diagrams are presented in Figures S7 and S8. REE and major element temperatures are presented in Figure 9.
Several observations can be noted. First, average closure temperatures for pyroxenites obtained from major elements are similar to the average peridotite temperature [53], whereas REE temperatures are systematically lower in pyroxenites compared to peridotites. This difference likely reflects different modal proportions in peridotites and pyroxenites and their effects on the diffusion process. In samples with more than 20% CPX, the re-equilibration time is mostly controlled by OPX, while for samples with less than 5% CPX (e.g., in some depleted peridotites), CPX would have greater controls on the diffusion time following the minor rule [54]. Thus, REE may have re-equilibrated more slowly in peridotites, thus recording higher REE temperatures. Second, temperatures derived from adjacent grains only are variable in clinopyroxenite LK12-6-1, consistent with heterogeneous percolation of melt at grain boundaries, largely overlooked when averaging concentrations in highly zoned samples. Finally, REE temperatures are higher than major-element based closure temperatures for all pyroxenites due to fastest diffusion of the major elements as shown by previous studies [53]. The closure temperatures of pyroxenites overlap with and extend outside of the field of MOR, abyssal, and SSZ ophiolites, pointing to a multistage thermal-magmatic history.
6.4. REE Diffusion and Minimum Ages
Similar to calculations presented in Le Roux et al. 2016 [55], we evaluate the minimum amount of time that pyroxenites should have had in order to re-equilibrate to the REE temperatures recorded by pyroxene pairs. We used the following Equation [54]:
where is the time scale for diffusive re-equilibration between mineral A and mineral B; and are the grain radii of mineral A and B, respectively; and are the diffusivities for the element of interest in mineral A and B, respectively; is mineral A–mineral B partition coefficient. is a geometric factor, accounting for crystal shape. Here, = 5 as grains are approximated as spheres.
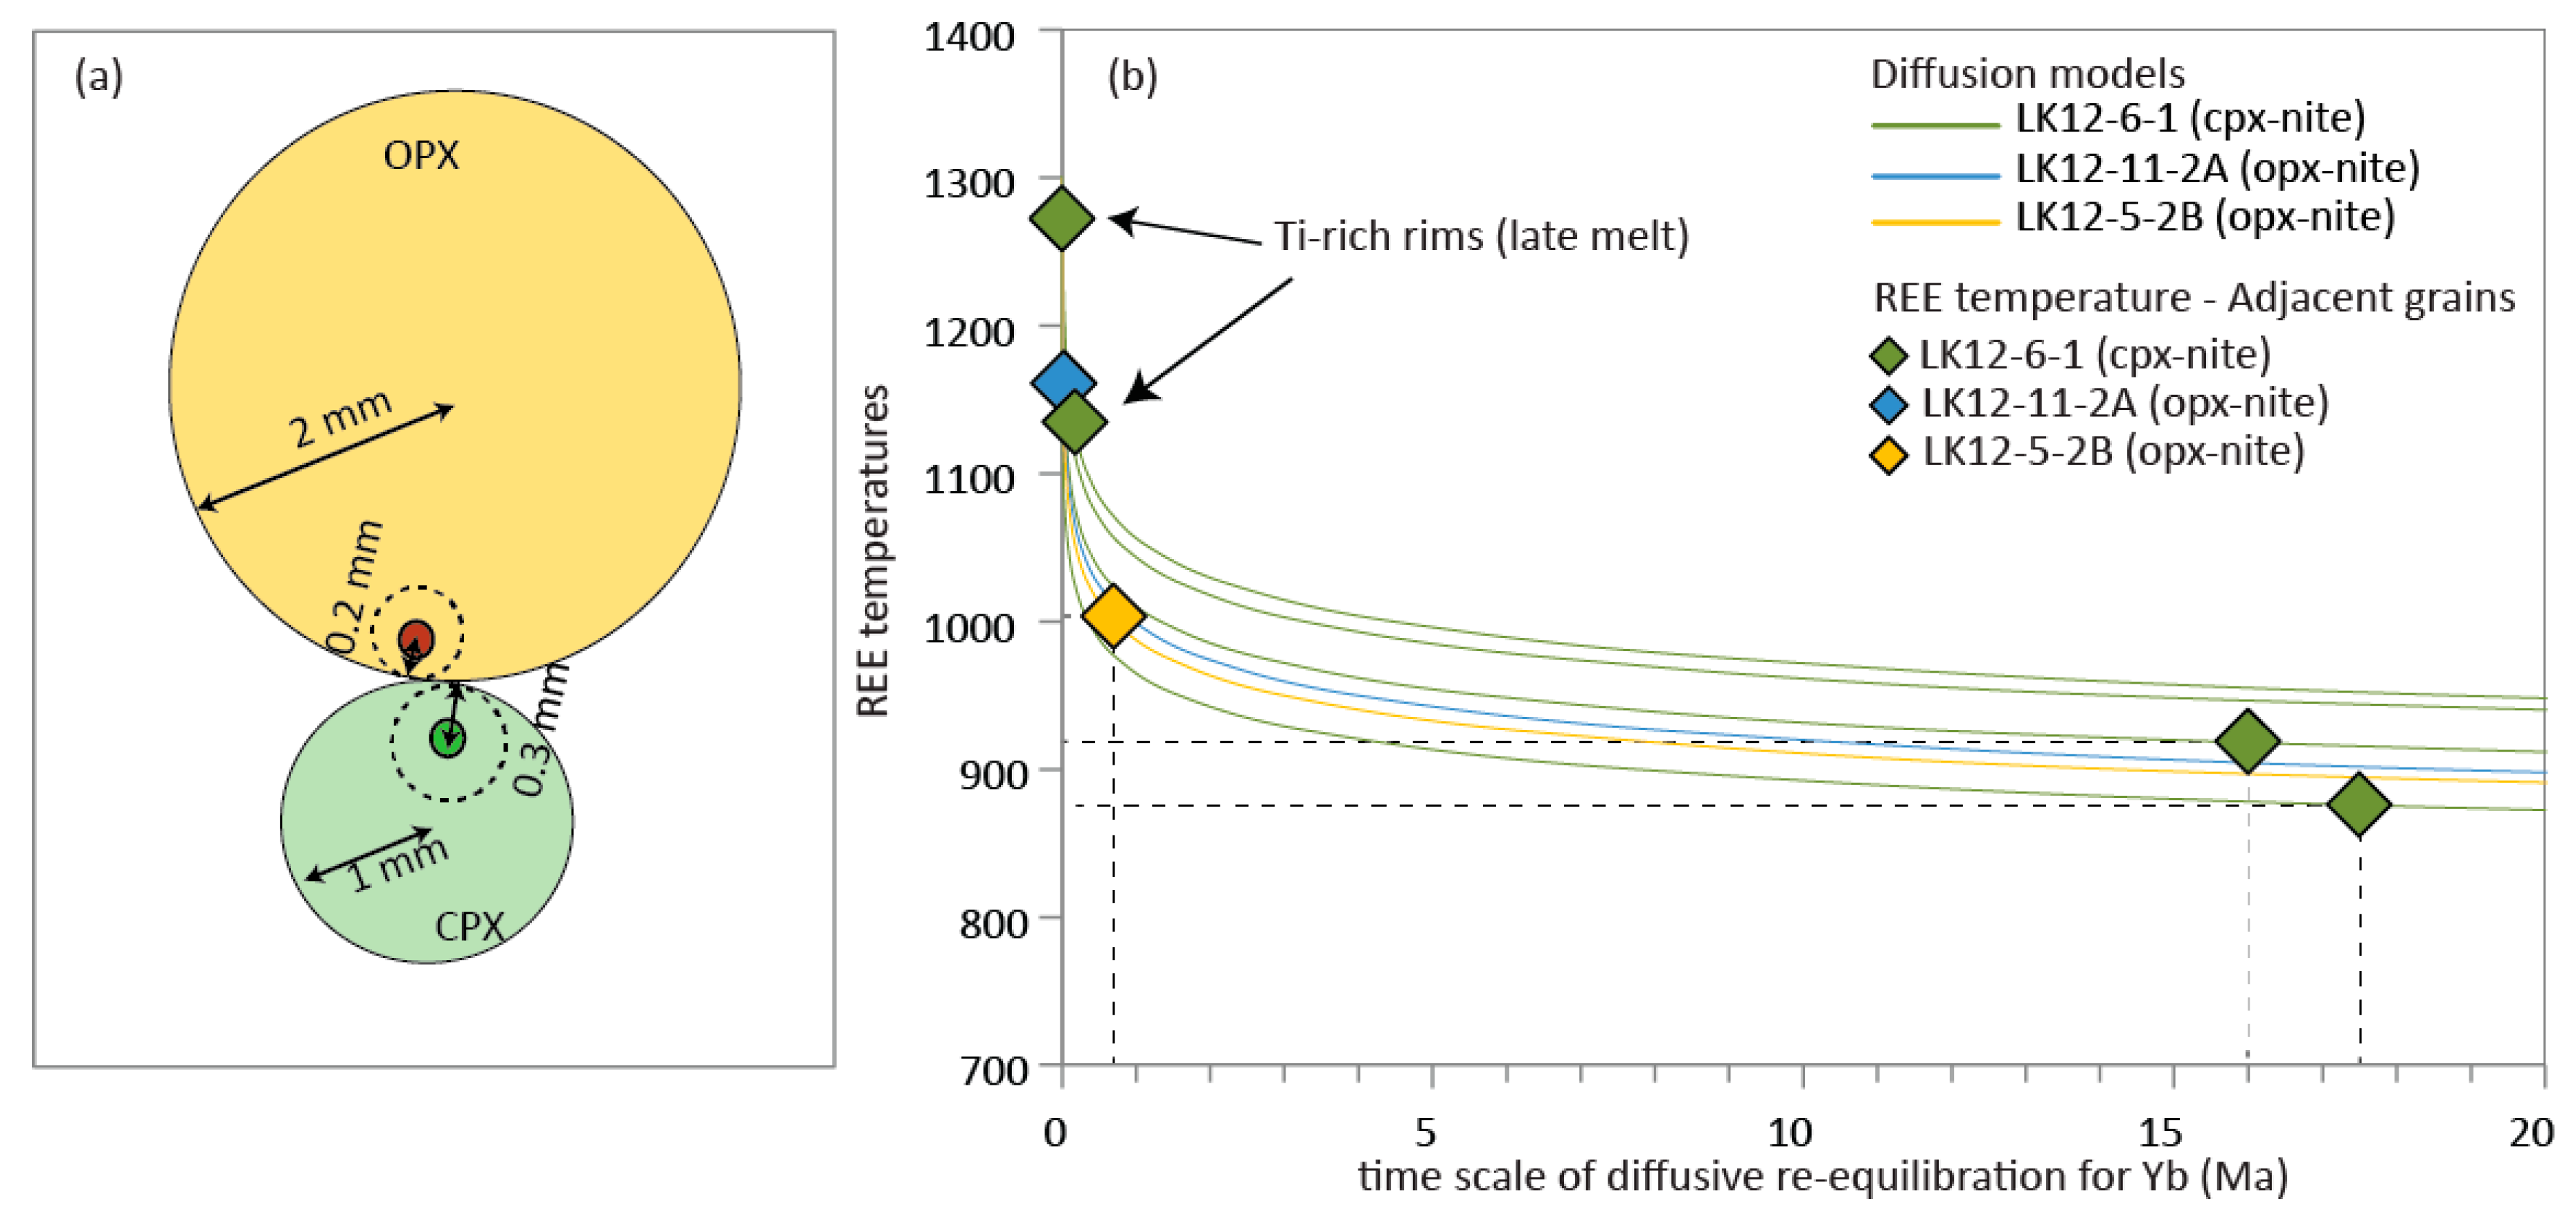
Instead of using average grain radii, we used the exact distances between OPX-CPX adjacent analyses to determine the minimum amount of time necessary to record a given temperature, at a given distance to the grain edge (Figure 10a). Because Yb diffusivity is intermediate between those of Lu and Ho (only HREE have been used to calculate closure temperatures), we illustrate the time scale of diffusive re-equilibration [54] between the two pyroxenes for Yb (Figure 10b). Two observations stand out. First, the minimum time-scale of diffusive re-equilibration in orthopyroxenite LK12-5-2B (~700,000 years) is longer than in orthopyroxenite LK12-11-2A (~30,000 years), indicating a longer minimum time at subsolidus conditions for LK12-5-2B. This suggests that all orthopyroxenites may not have formed simultaneously. Second, it took at least ~16–18 Ma to re-equilibrate the OPX-CPX pairs that record REE temperatures of 876–919 °C at the grain edges in clinopyroxenite LK12-6-1. Thus, the clinopyroxenite must have formed at least 15 Ma before exhumation of the peridotite. Third, it should take less than 1 million years to re-equilibrate HREE down to 1000 °C at the edge (<250 microns) of an OPX-CPX pair. Thus, the relatively high temperatures recorded by the orthopyroxenites (especially LK12-11-2A) and the Ti-rich pyroxene rims in clinopyroxenite LK12-6-1 suggest that the formation of orthopyroxenites, and the late metasomatic event in clinopyroxenite, may have occurred shortly before exhumation. Although there was not enough time for HREE to re-equilibrate to lower temperatures, Ti had enough time to develop a subsolidus diffusion profile in orthopyroxenites.
As the Josephine ophiolite started forming at ~165 Ma and was completely exhumed into the crust by ~140 Ma [56], our data are consistent with the formation of clinopyroxenites during an earlier stage of mantle section formation, while orthopyroxenites are related to a late melt percolation event that directly preceded exhumation. We propose that Ti and Al enrichments recorded at grain edges in clinopyroxenites were produced during late percolation of melt in the lithospheric mantle around the time of exhumation.
6.5. Source of Pyroxenites
The crystallization of highly depleted orthopyroxene-saturated veins has been observed in supra-subduction zone peridotites worldwide [11,15,16,40,57,58,59,60,61,62,63]. They could represent the last increment of melt produced by fractional melting during adiabatic upwelling of a MORB-like mantle, and subsequent reaction with overlying mantle [63], or they could be produced by remelting of previously depleted peridotites [11,61,64,65,66]. Pyroxenites represent a small fraction of rock lithologies recovered at mid-ocean ridge settings [67] but evidence for depleted melts there has also occasionally been found [68].
Here, the source of orthopyroxenite and clinopyroxenite veins can be evaluated from the chemistry of pyroxene minerals, as well as from calculations of equilibrium melts. We will first discuss the chemistry of pyroxenes. Pyroxenes in clinopyroxenites LK12-10-2A and LK12-6-1 have low Al2O3 (~1–2 wt.%) contents, indicating that these veins do not represent high-pressure cumulates from a MORB-like melt. LK12-10-2A clinopyroxenes are distinctly richer in TiO2 (~3 times more than LK12-6-1), suggesting that the two clinopyroxenites did not originate from the same melt, or that the LK12-6-1 melt underwent differentiation before crystallizing LK12-10-2A vein. The two veins are several kilometers apart (Figure 1) so it is uncertain whether they could be related through a deeper melt system. Pyroxenes hosted in orthopyroxenites have higher Al2O3 than in clinopyroxenites (especially LK12-5-2B), suggesting higher Al2O3 in the parent melt, while their average TiO2 content also remains too low to reflect a MORB-like melt [69].
REE contents in OPX and CPX in Josephine pyroxenites (Figure 11) are very similar to those of depleted peridotites from the Josephine ophiolite [40], indicating that the orthopyroxenite veins may have formed after melting of a harzburgitic residue, similar to what has been observed in hydrous melting/reaction experiments [70]. CPX in clinopyroxenite is usually more enriched in LREE than CPX in peridotite and could reflect equilibration with small fractions of percolating melts [71,72,73], consistent with our findings from intragrain profiles. Josephine pyroxenites are also broadly similar to orthopyroxenite and clinopyroxenite veins reported in the Oman [57] and Marum [58] ophiolites, which are believed to be in equilibrium with boninitic melts. We also compared our data to amphibole-bearing orthopyroxenite [15] and amphibole-bearing websterite [12] from Kamchatka, although our samples do not contain amphibole. The Kamchatka veins have been interpreted to form after percolation of low-Ca boninite and high-Ca boninite in the sub-arc lithospheric mantle, respectively. While not exactly similar, Kamchatka pyroxenes equilibrated with high-Ca boninites resemble the OPX and CPX patterns observed in the Josephine clinopyroxenites. CPX in Josephine orthopyroxenites is usually more depleted in LREE than in Kamchatka orthopyroxenites.
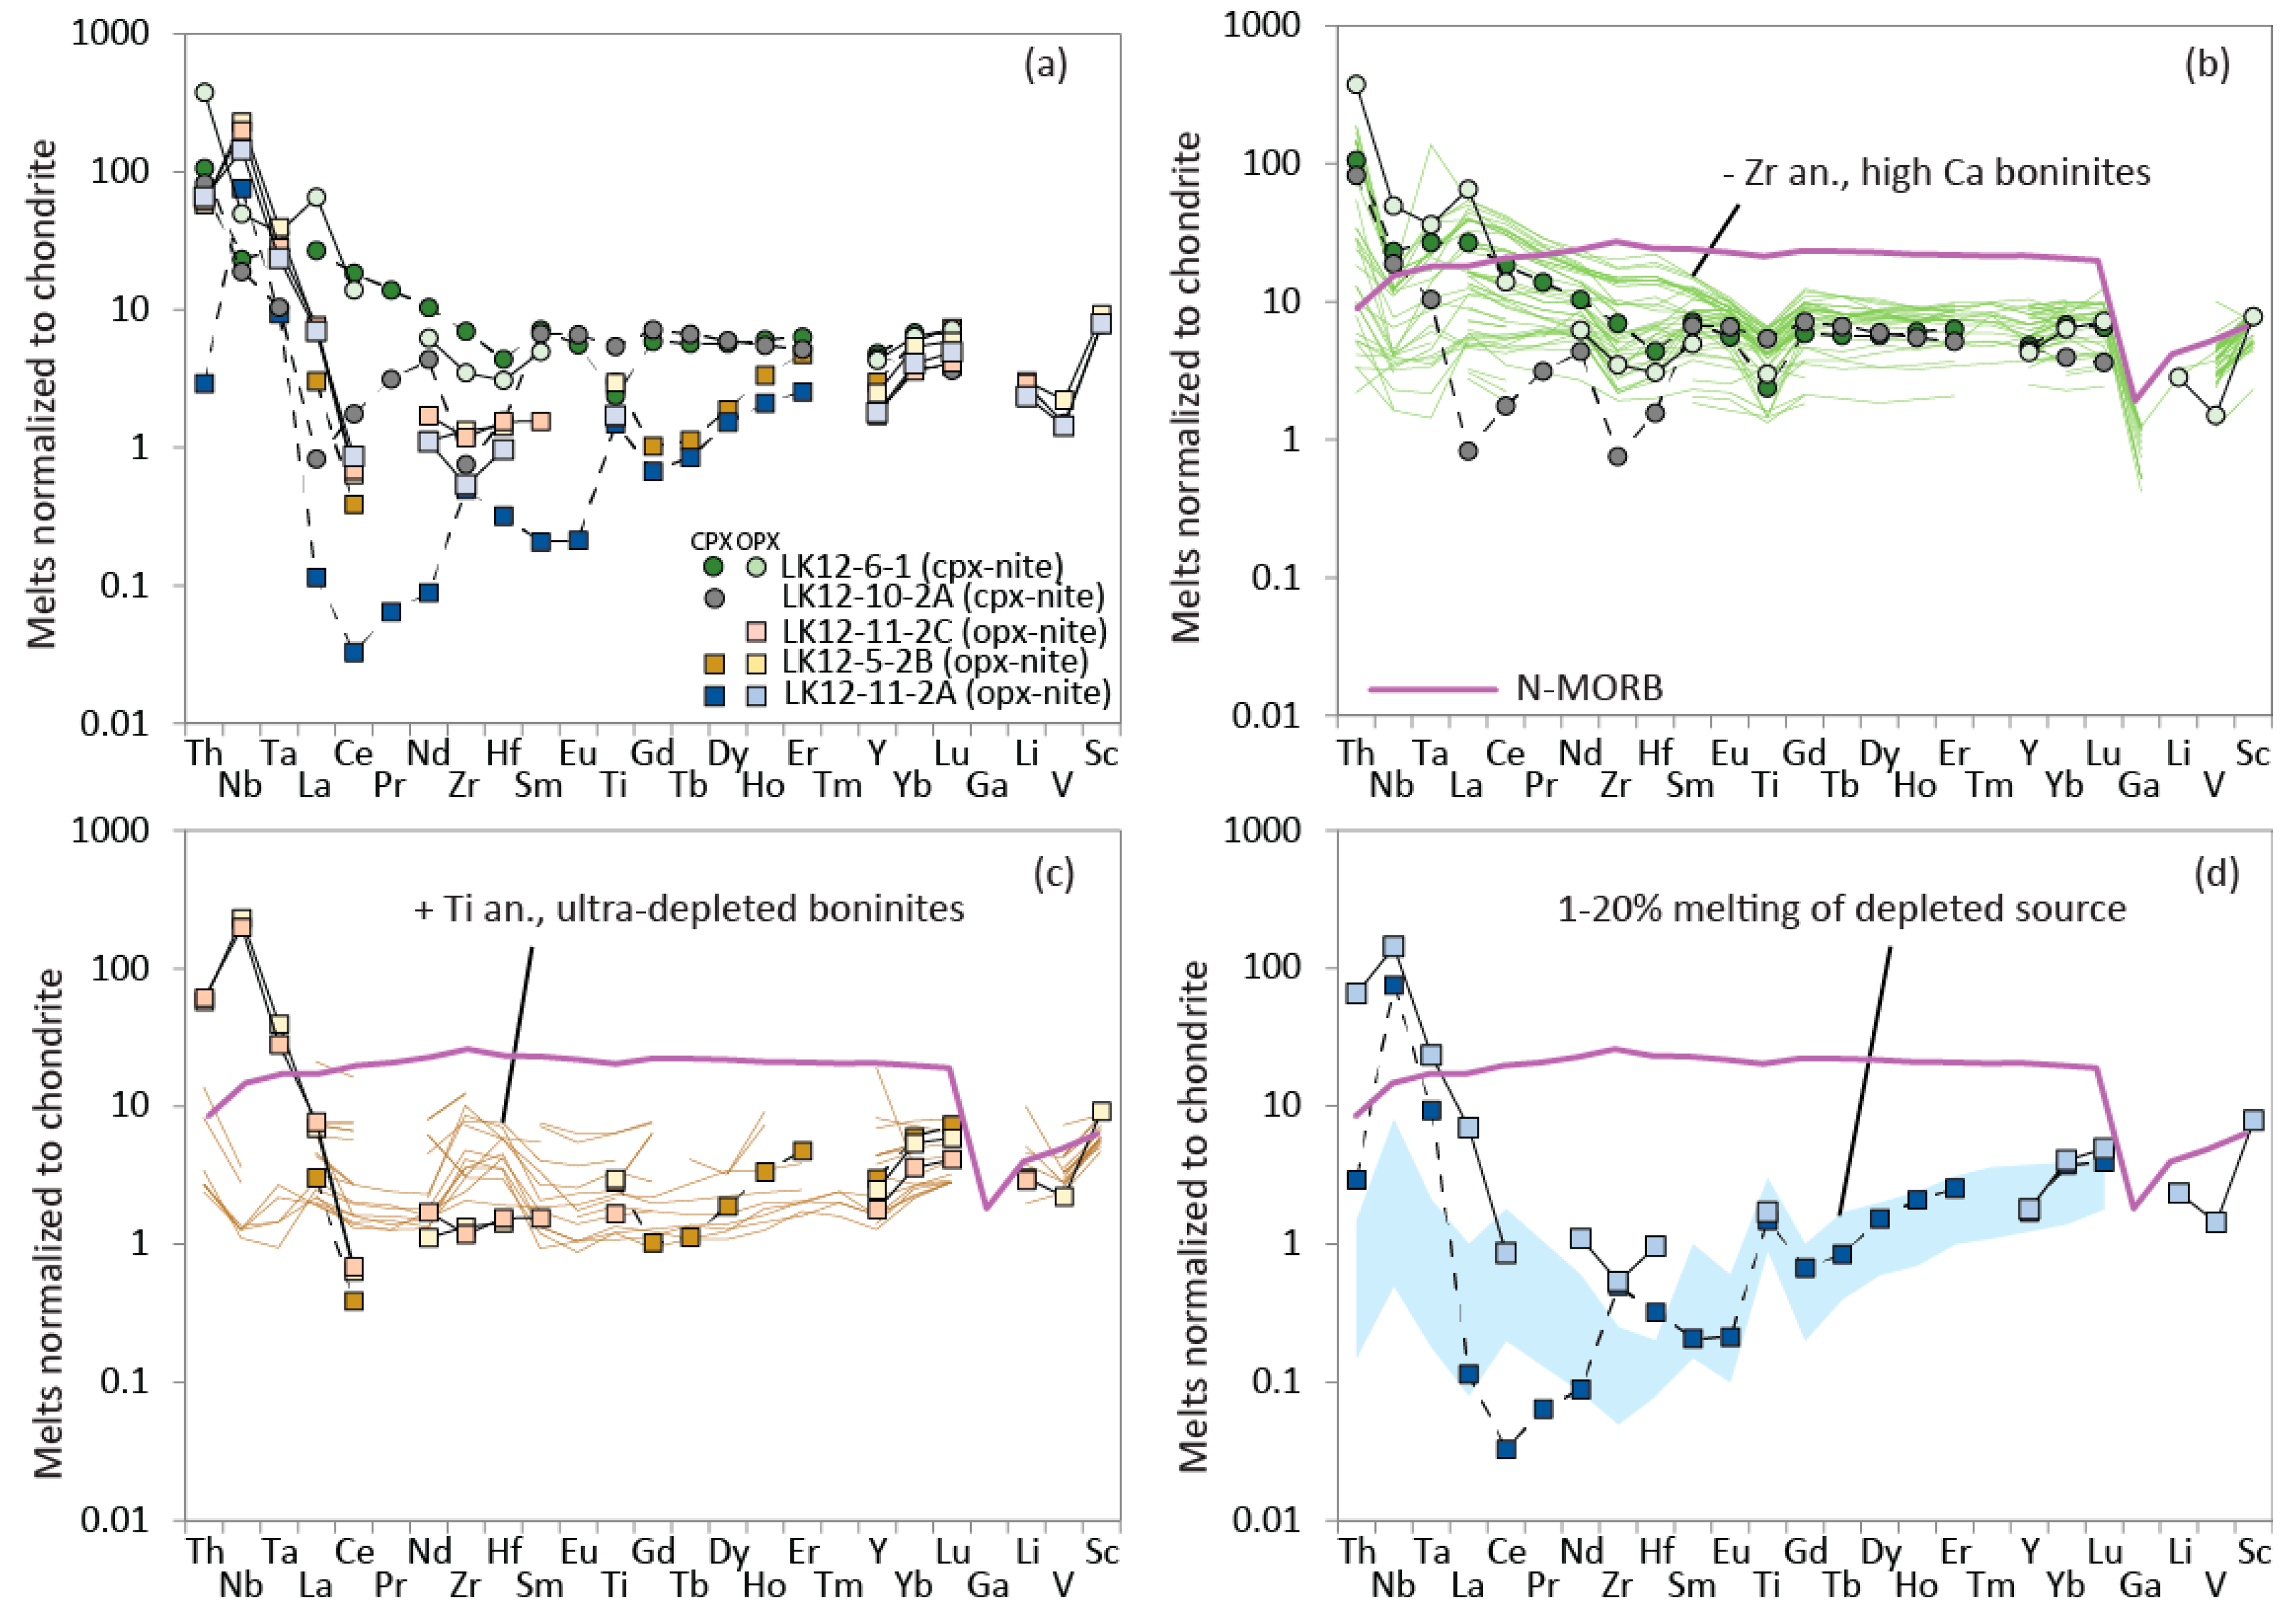
In order to place additional constraints on the source of Josephine pyroxenite veins, we turn to calculations of equilibrium melts (Figure 12). Highly fluid-mobile elements such as Cs, Rb, Ba, U, Pb, and Sr can easily be affected by late alteration and will not be considered in this section. We used partition coefficients between OPX-melt [74] and CPX-melt [75] to calculate the composition of the melts in equilibrium with the pyroxenites. These are estimates and do not reflect the complexities of melting or changes in partition coefficients during melt-rock reactions, and similar results can be obtained using other partitioning studies [44,76]. Several first-order observations can be noted. In pyroxenites where both OPX and CPX are present, the equilibrium melt derived from OPX has a similar composition as the one derived from CPX (Figure 12a), except for orthopyroxenite LK12-11-2A where CPX and OPX deviate more significantly from equilibrium for elements more incompatible than Ho (Figure 8). Regardless, several categories of equilibrium melts are identified, all significantly more depleted than N-MORB in most trace elements. The two clinopyroxenites are in equilibrium with a melt that displays HFSE negative anomalies (Figure 12b) and is similar to worldwide high-Ca (CaO/Al2O3 > 0.75; [13]) boninites that display a negative (or no) Zr anomaly. Thus, the crystal chemistry and equilibrium melt calculations derived from clinopyroxenites are consistent with equilibration with high-Ca boninites, similar to what has been observed in arc xenoliths [12]. The equilibrium melt also overlaps with erupted boninite compositions in the Josephine ophiolite, included in the compilation [34]. Melts in equilibrium with orthopyroxenites are even more depleted (Figure 12c). They resemble a subset of ultra-depleted boninites with positive to no Ti anomaly, no negative HFSE anomalies, and lower CaO/Al2O3 ratios (~0.6).
6.6. Chronology and Tectonic Setting
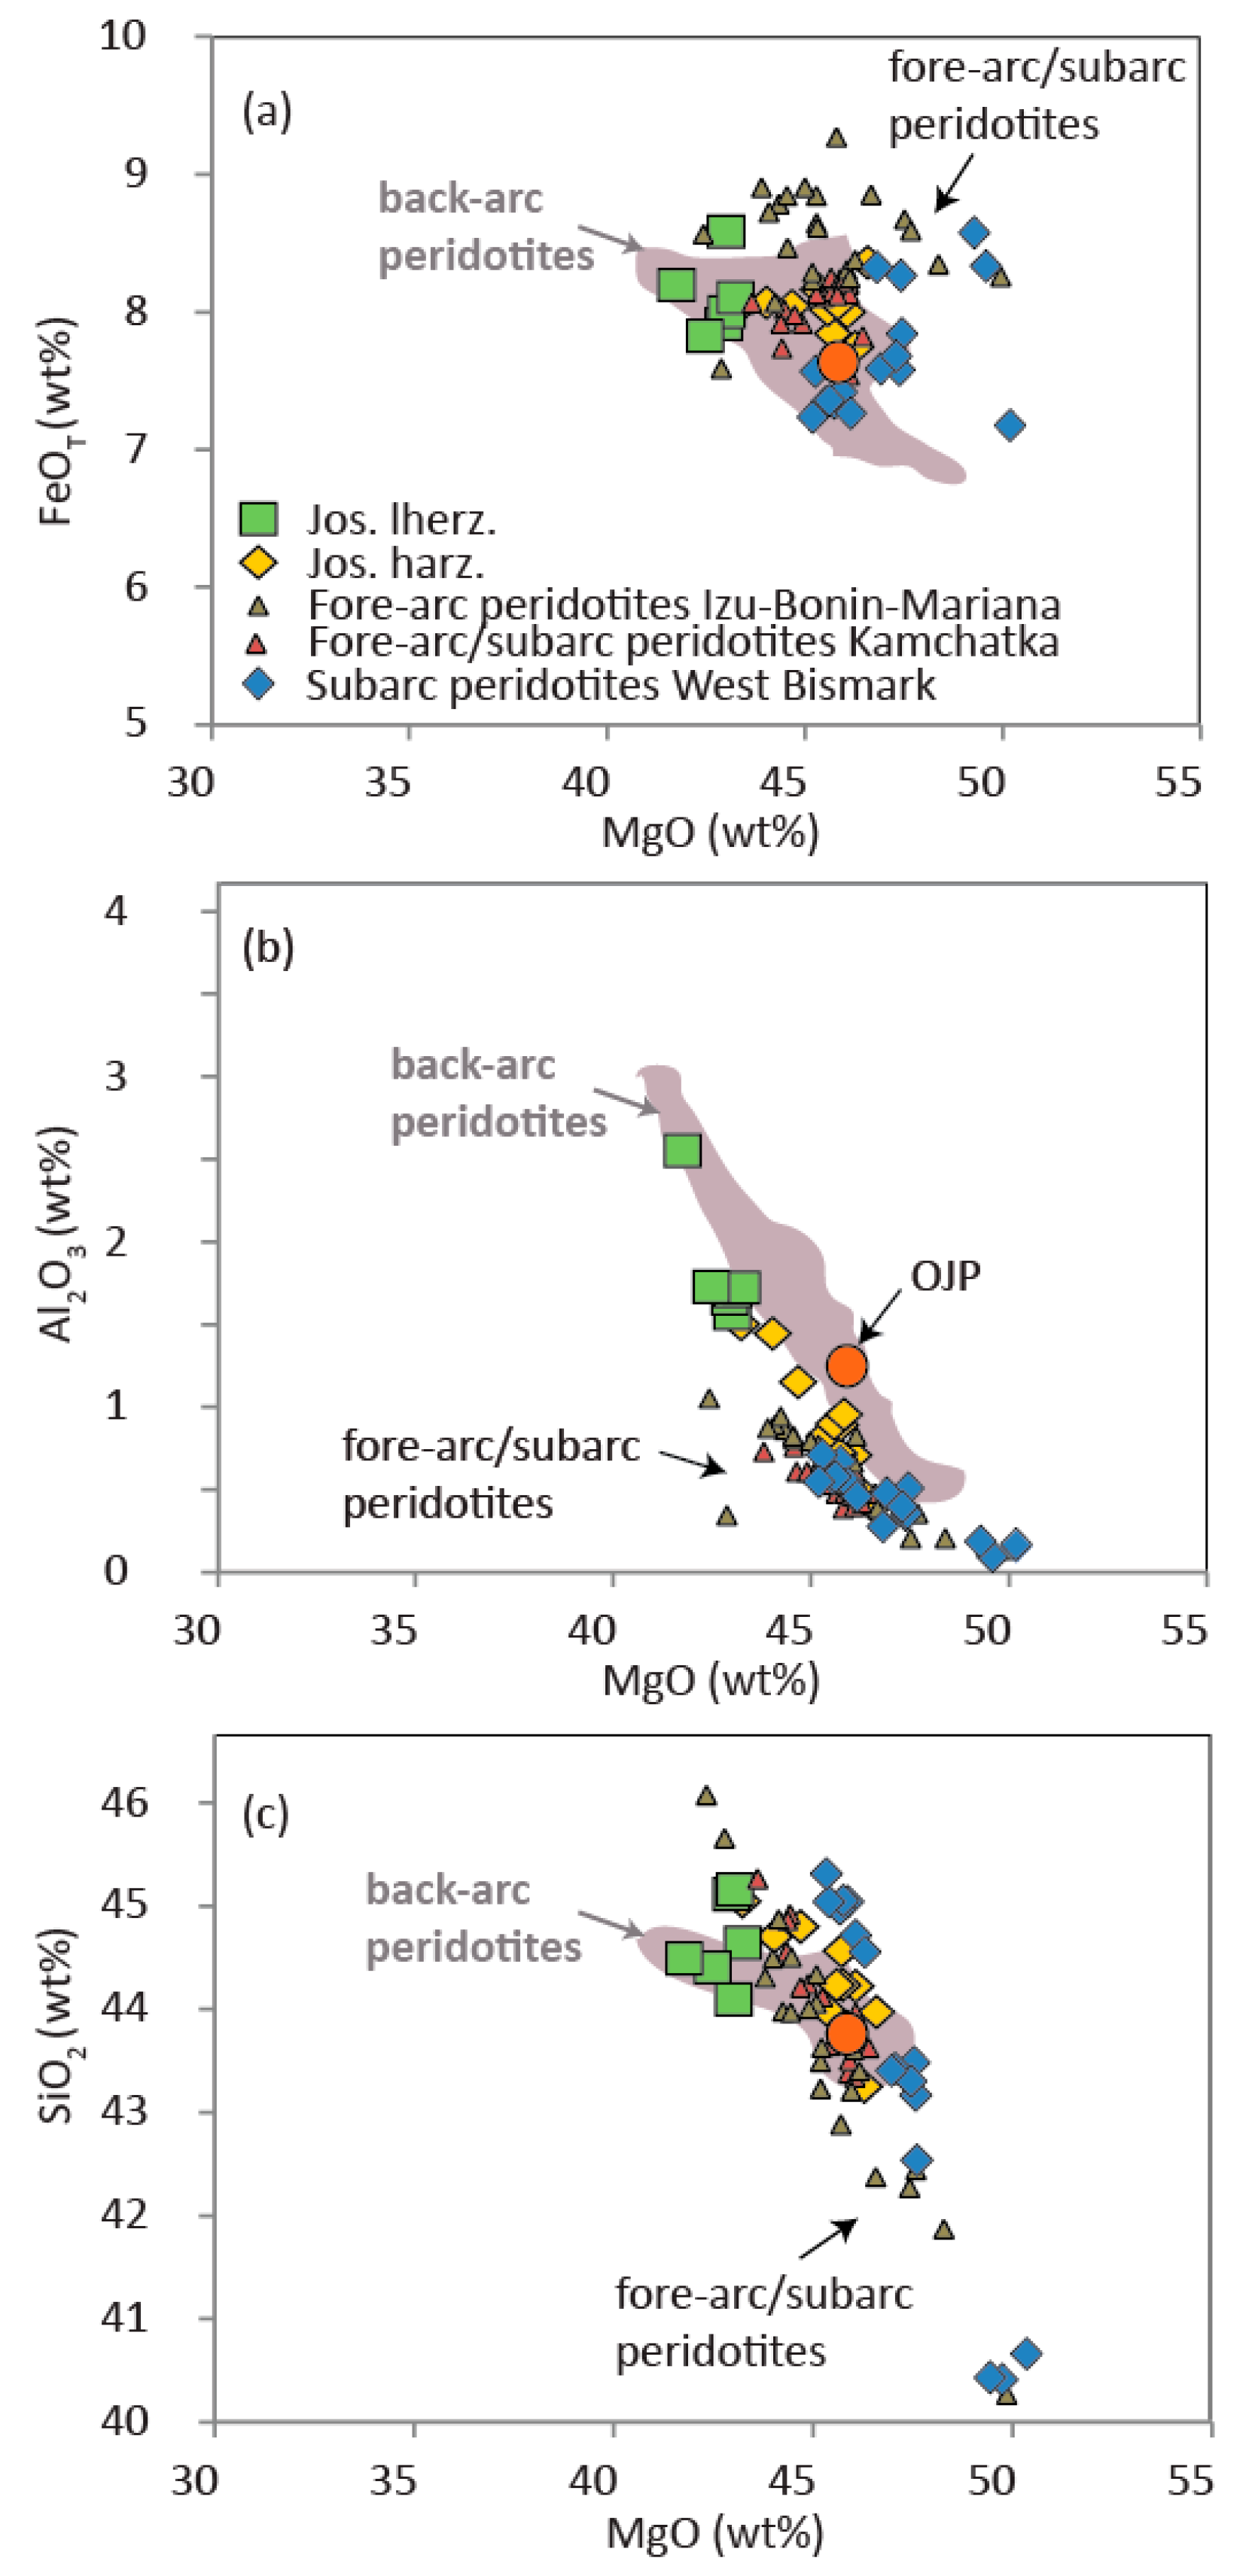
Based on REE temperatures and diffusion time-scales, we propose that clinopyroxenites crystallized at an early stage during formation of the mantle section of the ophiolite. Crystal chemistry and equilibrium melt calculations indicate that they were produced during percolation of high-Ca boninites, found in back-arc environments [78] and mature sub-arcs [12]. Although pyroxenites and surrounding peridotites may not have formed at the same time, the bulk-rock chemistry of peridotites supports initial formation of the Josephine ophiolite in a back-arc setting (Figure 13). Back-arc boninites also typically contain lower amounts of Al2O3 due to earlier crystallization of plagioclase, which is consistent with the low Al contents of pyroxenes in clinopyroxenites, small negative Eu anomaly in LK12-6-1 pyroxenes, and the presence of minor plagioclase in other Josephine ultramafics [28].
On the other hand, we find that orthopyroxenite veins formed shortly before exhumation, during percolation of low-Ca boninites. This late formation is supported by field observations whereby orthopyroxenite veins usually crosscut the dunites, harzburgites, and peridotites. The rarity of clinopyroxenite veins does not permit to conclude whether they are crosscut by orthopyroxenites. However, boninite-derived orthopyroxenites have been found to cross-cut websterite veins in sub-arc xenoliths, also supporting earlier percolation of high-Ca boninites, followed by low-Ca boninites [12]. Altogether, these observations indicate that remelting of refractory residues could be a widespread process in subduction zones, and particularly prevalent during exhumation.
Ultra-depleted boninites that resemble melts in equilibrium with orthopyroxenites have been reported in forearc environments [78] but can also develop their characteristics through fractionation and reaction with refractory peridotites beneath mature arcs [15]. In fact, it has been suggested that low-Ca boninites could be widespread and generated at various stages of arc formation [11]. Thus, it is possible that orthopyroxenites have been produced in sub-arc conditions similar to Kamchatka [15,16] and West Bismark orthopyroxenites [11]. Changes in tectonic transitions have been observed in some parts of the northern Tonga trench and Hunter ridge, where the young spreading center has propagated across the arc and into the forearc [35,78]. In the Josephine, such a transition could have occurred, leading to the formation of various types of boninites in conditions intermediate between back-arc and sub-arc.
7. Conclusions
Percolation of boninitic melts has been linked to the formation of pyroxenite veins in ophiolitic massifs and xenoliths worldwide and is characteristic of supra-subduction environments [11,12,15,16,59,60]. Here, we support the hypothesis that a large variety of boninitic melts infiltrate the lithospheric mantle in subduction zones [12,61,82,83]. We show that boninite percolation takes place at multiple stages of ophiolite formation, consistent with observations in mantle xenoliths [11]. In particular, we use REE temperatures, diffusion modeling, and composition of equilibrium melts to argue that the clinopyroxenites formed during the early stages of ophiolite formation at around 165 Ma and were produced during percolation of high-Ca boninites. We suggest that the orthopyroxenite veins formed several million years later during percolation of low-Ca ultra-depleted boninites shortly before exhumation. This chronology has also been observed in mantle xenoliths [12] and could point to a prevalent process in subduction zones.
Supplementary Materials
The following are available online at https://www.mdpi.com/2075-163X/9/9/565/s1, Figure S1: MgO (wt. %), FeO (wt. %), and Mg# (molar Mg/Mg + Fe) in OPX in orthopyroxenite LK12-5-2B (a–c), in orthopyroxenite LK11-2A (d, e, f) and in clinopyroxenite LK12-6-1 (g–i), and in CPX in clinopyroxenite LK12-6-1 (j–l). Trend lines are polynomial fits and error bars reflect typical 2SD, Figure S2: Individual and average REE concentrations normalized to chondrite [42] in OPX in three orthopyroxenites (a–c) and one clinopyroxenite (d). Error bars represent 2SE for each element, Figure S3: Individual and average REE concentrations normalized to chondrite [42] in CPX in two orthopyroxenites (a,c) and two clinopyroxenites (b,d). Error bars represent 2SE for each element, Figure S4: Individual and average trace element concentrations normalized to primitive mantle (PM) [42] in OPX in three orthopyroxenites (a–c) and one clinopyroxenite (d). Error bars represent 2SE for each element, Figure S5: Individual and average trace element concentrations normalized to primitive mantle (PM) [42] in CPX in two orthopyroxenites (a,c) and two clinopyroxenites (b,d). Error bars represent 2SE for each element, Figure S6: Chondrite-normalized [42] concentrations of Ni and Co in OPX or CPX grains in orthopyroxenite LK12-5-2B (a,b), clinopyroxenite LK12-6-1 (c–f), clinopyroxenite LK12-10-2A (g,h), and in orthopyroxenite LK12-11-2A (i,j). Note that LK12-5-2B is a ¾ profile, LK12-6-1 is a ½ profile, and all others are full rim-to-rim profiles. Trend lines are polynomial fits and error bars represent 2SE for each element, Figure S7: Inversion diagrams of REE temperatures using average major and trace element grain compositions, Figure S8: Inversion diagrams of REE temperatures using major and trace element compositions of adjacent analyses only, Table S1: Major element data, Table S2: Major element profile data, Table S3: OPX trace element data, Table S4: CPX trace element data.
Author Contributions
Conceptualization, V.L.R.; formal analysis, V.L.R.; funding acquisition, V.L.R.; methodology, V.L.R.; resources, V.L.R. and Y.L.; supervision, V.L.R. and Y.L.; writing—original draft, V.L.R.; writing—review and editing, V.L.R. and Y.L.
Funding
This study was supported by National Science Foundation grants EAR-1220440 to V.L.R. and EAR-1624516 to Y.L. We thank the reviewers for their helpful suggestions, as well as Taylor Hough, Gretchen Swarr, Alberto Saal, Soumen Mallick, and Nilanjan Chatterjee for help with LA-ICP-MS and EPMA analyses, and Mark Kurz for help with sample collection.
Conflicts of Interest
The authors declare no conflict of interest. The founding sponsors had no role in the design of the study; in the collection, analyses, or interpretation of data; in the writing of the manuscript, and in the decision to publish the results.
References
- Ionov, D.A. Petrology of Mantle Wedge Lithosphere: New Data on Supra-Subduction Zone Peridotite Xenoliths from the Andesitic Avacha Volcano, Kamchatka. J. Petrol. 2010, 51, 327–361. [Google Scholar] [CrossRef]
- Ionov, D.A.; Bénard, A.; Plechov, P.Y.; Shcherbakov, V.D. Along-arc variations in lithospheric mantle compositions in Kamchatka, Russia: First trace element data on mantle xenoliths from the Klyuchevskoy Group volcanoes. J. Volcanol. Geotherm. Res. 2013, 263, 122–131. [Google Scholar] [CrossRef]
- Bénard, A.; Arculus, R.J.; Nebel, O.; Ionov, D.A.; McAlpine, S.R.B. Silica-enriched mantle sources of subalkaline picrite-boninite-andesite island arc magmas. Geochim. Cosmochim. Acta 2017, 199, 287–303. [Google Scholar] [CrossRef]
- England, P.C.; Katz, R.F. Melting above the anhydrous solidus controls the location of volcanic arcs. Nature 2010, 467, 700. [Google Scholar] [CrossRef] [PubMed]
- Till, C.B. A review and update of mantle thermobarometry for primitive arc magmas. Am. Mineral. 2017, 102, 931–947. [Google Scholar] [CrossRef]
- Grove, T.L.; Till, C.B.; Krawczynski, M.J. The Role of H2O in Subduction Zone Magmatism. Annu. Rev. Earth Plan. Sci. 2012, 40, 413–439. [Google Scholar] [CrossRef]
- Grove, T.L.; Till, C.B.; Lev, E.; Chatterjee, N.; Medard, E. Kinematic variables and water transport control the formation and location of arc volcanoes. Nature 2009, 459, 694–697. [Google Scholar] [CrossRef]
- Till, C.B.; Grove, T.L.; Withers, A.C. The beginnings of hydrous mantle wedge melting. Contrib. Mineral. Petrolol. 2012, 163, 669–688. [Google Scholar] [CrossRef]
- Elliott, T.; Plank, T.; Zindler, A.; White, W.; Bourdon, B. Element transport from slab to volcanic front at the Mariana arc. J. Geophys. Res. B Solid Earth 1997, 102, 14991–15019. [Google Scholar] [CrossRef]
- Codillo, E.A.; Le Roux, V.; Marschall, H.R. Arc-like magmas generated by mélange-peridotite interaction in the mantle wedge. Nat. Commun. 2018, 9, 2864. [Google Scholar] [CrossRef] [PubMed]
- Bénard, A.; Le Losq, C.; Nebel, O.; Arculus, R.J. Low-Ca boninite formation by second-stage melting of spinel harzburgite residues at mature subduction zones: New evidence from veined mantle xenoliths from the West Bismarck Arc. Contrib. Mineral. Petrol. 2018, 173, 105. [Google Scholar] [CrossRef]
- Bénard, A.; Nebel, O.; Ionov, D.A.; Arculus, R.J.; Shimizu, N.; Métrich, N. Primary Silica-rich Picrite and High-Ca Boninite Melt Inclusions in Pyroxenite Veins from the Kamchatka Sub-arc Mantle. J. Petrol. 2016, 57, 1955–1982. [Google Scholar] [CrossRef]
- Crawford, A.J.; Falloon, T.; Green, D. Classification, Petrogenesis and Tectonic Setting of Boninites. In Boninites and Related Rocks; Unwin Hyman: London, UK, 1989; pp. 1–49. [Google Scholar]
- Bédard, J.H. Petrogenesis of Boninites from the Betts Cove Ophiolite, Newfoundland, Canada: Identification of Subducted Source Components. J. Petrol. 1999, 40, 1853–1889. [Google Scholar] [CrossRef]
- Bénard, A.; Ionov, D.A. A new petrogenetic model for low-Ca boninites: Evidence from veined sub-arc xenoliths on melt-mantle interaction and melt fractionation. Geochem. Geophys. Geosyst. 2012, 13. [Google Scholar] [CrossRef]
- Bénard, A.; Ionov, D.A. Melt– and Fluid–Rock Interaction in Supra-Subduction Lithospheric Mantle: Evidence from Andesite-hosted Veined Peridotite Xenoliths. J. Petrol. 2013, 54, 2339–2378. [Google Scholar] [CrossRef]
- Mallik, A.; Nelson, J.; Dasgupta, R. Partial melting of fertile peridotite fluxed by hydrous rhyolitic melt at 2–3 GPa: Implications for mantle wedge hybridization by sediment melt and generation of ultrapotassic magmas in convergent margins. Contrib. Mineral. Petrol. 2015, 169, 48. [Google Scholar] [CrossRef]
- Schmidt, M.W.; Vielzeuf, D.; Auzanneau, E. Melting and dissolution of subducting crust at high pressures: The key role of white mica. Earth Planet. Sci. Lett. 2004, 228, 65–84. [Google Scholar] [CrossRef]
- Foley, S. Vein-plus-wall-rock melting mechanisms in the lithosphere and the origin of potassic alkaline magmas. Lithos 1992, 28, 435–453. [Google Scholar] [CrossRef]
- Cruz-Uribe, A.; Marschall, H.R.; Gaetani, G.; Le Roux, V. Generation of alkaline magmas in subduction zones by partial melting of mélange diapirs—An experimental study. Geology 2018, 46, 343–346. [Google Scholar] [CrossRef]
- Naemura, K.; Hirajima, T.; Svojtka, M.; Shimizu, I.; Iizuka, T. Fossilized Melts in Mantle Wedge Peridotites. Sci. Rep. 2018, 8, 10116. [Google Scholar] [CrossRef] [PubMed]
- Arai, S.; Ishimaru, S. Insights into petrological characteristics of the lithosphere of mantle wedge beneath arcs through peridotite xenoliths: A review. J. Petrol. 2008, 49, 665–695. [Google Scholar] [CrossRef]
- Vannucci, R.; Tiepolo, M.; Defant, M.J.; Kepezhinskas, P. The metasomatic record in the shallow peridotite mantle beneath Grenada (Lesser Antilles arc). Lithos 2007, 99, 25–44. [Google Scholar] [CrossRef]
- Pearson, D.G.; Canil, D.; Shirey, S.B. 2.05-Mantle Samples Included in Volcanic Rocks: Xenoliths and Diamonds. In Treatise on Geochemistry; Heinrich, D.H., Karl, K.T., Eds.; Pergamon: Oxford, UK, 2003; pp. 171–275. [Google Scholar]
- Bodinier, J.L.; Godard, M. 3.4-Orogenic, Ophiolitic, and Abyssal Peridotites. In Treatise on Geochemistry, 2nd ed.; Holland, H.D., Turekian, K.K., Eds.; Elsevier: Oxford, UK, 2014; pp. 103–167. [Google Scholar]
- Batanova, V.G.; Suhr, G.; Sobolev, A.V. Origin of geochemical heterogeneity in the mantle peridotites from the Bay of Islands ophiolite, Newfoundland, Canada: Ion probe study of clinopyroxenes. Geochim. Cosmochim. Acta 1998, 62, 853–866. [Google Scholar] [CrossRef]
- Dick, H.J.B.; Sinton, J.M. Compositional layering in alpine peridotites—Evidence for pressure solution creep in the mantle. J. Geol. 1979, 87, 403–416. [Google Scholar] [CrossRef]
- Kelemen, P.B.; Dick, H.J.B. Focused melt flow and localized deformation in the upper mantle: Juxtaposition of replacive dunite and ductile shear zones in the Josephine peridotite, SW Oregon. J. Geophys. Res. 1995, 100, 423–438. [Google Scholar] [CrossRef]
- Saleeby, J.B.; Harper, G.D.; Snoke, A.W.; Sharp, W.D. Time Relations and Structural-Stratigraphic Patterns in Ophiolite Accretion, West Central Klamath Mountains, California. J. Geophys. Res. 1982, 87, 3831–3848. [Google Scholar] [CrossRef]
- Dick, H.J.B. Origin and Emplacement of the Josephine Peridotite of Southwestern Oregon. Ph.D. Thesis, Yale University, New Haven, CT, USA, 1976. [Google Scholar]
- Harper, G.D. The Josephine Ophiolite, Northwestern California. Geol. Soc. Am. Bull. 1984, 95, 1009–1026. [Google Scholar] [CrossRef]
- Dick, H.J.B. Partial melting in Josephine Peridotite.1. Effect on mineral composition and its consequence for geobarometry and geothermometry. Am. J. Sci. 1977, 277, 801–832. [Google Scholar] [CrossRef]
- Harper, G.D. A depositional contact between the Galice Formation and a Late Jurassic ophiolite in northwestern California and southwestern Oregon. Or. Geol. 1983, 45, 3–7. [Google Scholar]
- Harper, G.D. Fe-Ti basalts and propagating-rift tectonics in the Josephine Ophiolite. Geol. Soc. Am. Bull. 2003, 115, 771–787. [Google Scholar] [CrossRef]
- Harper, G.D. Tectonic implications of boninite, arc tholeiite, and MORB magma types in the Josephine Ophiolite, California-Oregon. Geol. Soc. Lond. Spec. Publ. 2003, 218, 207–230. [Google Scholar] [CrossRef]
- Loney, R.A.; Himmelberg, G.R. Structure of Vulcan peak alpine-type peridotite, Southwestern Oregon. Geol. Soc. Am. Bull. 1976, 87, 259–274. [Google Scholar] [CrossRef]
- Vail, S.G. Geology and geochemistry of the Oregon Mountain area, southwestern Oregon and northern California-an investigation of the origin and development of a Jurassic ophiolite in the Klamath Mountains. Ph.D. Thesis, Oregon State University, Corvallis, OR, USA, 1977. [Google Scholar]
- Pearce, J.A.; Lippard, S.J.; Roberts, S. Characteristics and tectonic significance of supra-subduction zone ophiolites. Geol. Soc. Lond. Spec. Publ. 1984, 16, 77–94. [Google Scholar] [CrossRef]
- Morgan, Z.; Liang, Y.; Kelemen, P. Significance of the concentration gradients associated with dunite bodies in the Josephine and Trinity ophiolites. Geochem. Geophys. Geosyst. 2008, 9. [Google Scholar] [CrossRef]
- Le Roux, V.; Dick, H.J.B.; Shimizu, N. Tracking flux melting and melt percolation in supra-subduction peridotites (Josephine ophiolite, USA). Contrib. Mineral. Petrol. 2014, 168, 1–22. [Google Scholar] [CrossRef]
- Armstrong, J.T. CITZAF-A package of correction programs for the quantitative electron microbeam X-ray analysis of thick polished materials, thin films, and particles. Microbeam Anal. 1995, 4, 177–200. [Google Scholar]
- McDonough, W.F.; Sun, S.-S. The composition of the Earth. Chem. Geol. 1995, 120, 223–253. [Google Scholar] [CrossRef]
- Rampone, E.; Bottazzi, P.; Ottolini, L. Complementary Ti and Zr anomalies in orthopyroxene and clinopyroxene from mantle peridotites. Nature 1991, 354, 518–520. [Google Scholar] [CrossRef]
- Green, T.H.; Blundy, J.D.; Adam, J.; Yaxley, G.M. SIMS determination of trace element partition coefficients between garnet, clinopyroxene and hydrous basaltic liquids at 2-7.5 GPa and 1080-1200 degrees C. Lithos 2000, 53, 165–187. [Google Scholar] [CrossRef]
- Rampone, E.; Piccardo, G.B.; Vannucci, R.; Bottazzi, P.; Ottolini, L. Subsolidus reactions monitored by trace element partitioning: The spinel- to plagioclase facies transition in mantle peridotites. Contrib. Mineral. Petrol. 1993, 115, 1–17. [Google Scholar] [CrossRef]
- Cherniak, D.J.; Liang, Y. Ti diffusion in natural pyroxene. Geochim. Cosmochim. Acta 2012, 98, 31–47. [Google Scholar] [CrossRef]
- Le Roux, V.; Dasgupta, R.; Lee, C.T.A. Mineralogical heterogeneities in the Earth’s mantle: Constraints from Mn, Co, Ni and Zn partitioning during partial melting. Earth Planet. Sci. Lett. 2011, 307, 395–408. [Google Scholar] [CrossRef]
- Yao, L.J.; Sun, C.G.; Liang, Y. A parameterized model for REE distribution between low-Ca pyroxene and basaltic melts with applications to REE partitioning in low-Ca pyroxene along a mantle adiabat and during pyroxenite-derived melt and peridotite interaction. Contrib. Mineral. Petrol. 2012, 164, 261–280. [Google Scholar] [CrossRef]
- Sun, C.G.; Liang, Y. Distribution of REE between clinopyroxene and basaltic melt along a mantle adiabat: Effects of major element composition, water, and temperature. Contrib. Mineral. Petrol. 2012, 163, 807–823. [Google Scholar] [CrossRef]
- Van Orman, J.A.; Grove, T.L.; Shimizu, N. Rare earth element diffusion in diopside: Influence of temperature, pressure, and ionic radius, and an elastic model for diffusion in silicates. Contrib. Mineral. Petrol. 2001, 141, 687–703. [Google Scholar] [CrossRef]
- Brey, G.P.; Kohler, T. Geothermobarometry in four-phase lherzolites II. New thermobarometers, and practical assessment of existing thermobarometers. J. Petrol. 1990, 31, 1353–1378. [Google Scholar] [CrossRef]
- Liang, Y.; Sun, C.G.; Yao, L.J. A REE-in-two-pyroxene thermometer for mafic and ultramafic rocks. Geochim. Cosmochim. Acta 2013, 102, 246–260. [Google Scholar] [CrossRef]
- Dygert, N.; Liang, Y. Temperatures and cooling rates recorded in REE in coexisting pyroxenes in ophiolitic and abyssal peridotites. Earth Planet. Sci. Lett. 2015, 420, 151–161. [Google Scholar] [CrossRef]
- Liang, Y. Time scales of diffusive re-equilibration in bi-mineralic systems with and without a fluid or melt phase. Geochim. Cosmochim. Acta 2014, 132, 274–287. [Google Scholar] [CrossRef]
- Le Roux, V.; Nielsen, S.G.; Sun, C.; Yao, L. Dating layered websterite formation in the lithospheric mantle. Earth Planet. Sci. Lett. 2016, 454, 103–112. [Google Scholar] [CrossRef] [Green Version]
- Harper, G.D.; Saleeby, J.B.; Heizler, M. Formation and emplacement of the Josephine ophiolite and the Nevadan orogeny in the Klamath Mountains, California-Oregon: U/Pb zircon and 40Ar/39Ar geochronology. J. Geophys. Res. B Solid Earth 1994, 99, 4293–4321. [Google Scholar] [CrossRef]
- Tamura, A.; Arai, S. Harzburgite-dunite-orthopyroxenite suite as a record of supra-subduction zone setting for the Oman ophiolite mantle. Lithos 2006, 90, 43–56. [Google Scholar] [CrossRef]
- Kaczmarek, M.-A.; Jonda, L.; Davies, H.L. Evidence of melting, melt percolation and deformation in a supra-subduction zone (Marum ophiolite complex, Papua New Guinea). Contrib. Mineral. Petrol. 2015, 170, 19. [Google Scholar] [CrossRef]
- Varfalvy, V.; Hébert, R.; Bédard, J.; Laflèche, M.R. Petrology and geochemistry of pyroxenite dykes in upper mantle peridotites of the North Arm Mountain massif, Bay of Islands Ophiolite, Newfoundland: Implications for the genesis of boninitic and related magmas. Can. Mineral. 1997, 35, 543–570. [Google Scholar]
- Batanova, V.G.; Belousov, I.A.; Savelieva, G.N.; Sobolev, A.V. Consequences of Channelized and Diffuse Melt Transport in Supra-subduction Zone Mantle: Evidence from the Voykar Ophiolite (Polar Urals). J. Petrol. 2011, 52, 2483–2521. [Google Scholar] [CrossRef] [Green Version]
- Marchesi, C.; Garrido, C.J.; Godard, M.; Belley, F.; Ferré, E. Migration and accumulation of ultra-depleted subduction-related melts in the Massif du Sud ophiolite (New Caledonia). Chem. Geol. 2009, 266, 171–186. [Google Scholar] [CrossRef]
- Rogkala, A.; Petrounias, P.; Tsikouras, B.; Hatzipanagiotou, K. New Occurrence of Pyroxenites in the Veria-Naousa Ophiolite (North Greece): Implications on Their Origin and Petrogenetic Evolution. Geosciences 2017, 7, 92. [Google Scholar] [CrossRef]
- Rampone, E.; Piccardo, G.B.; Vannucci, R.; Bottazzi, P. Chemistry and origin of trapped melts in ophiolitic peridotites. Geochim. Cosmochim. Acta 1997, 61, 4557–4569. [Google Scholar] [CrossRef]
- Python, M.; Ceuleneer, G. Nature and distribution of dykes and related melt migration structures in the mantle section of the Oman ophiolite. Geochem. Geophys. Geosyst. 2003, 4. [Google Scholar] [CrossRef]
- Benoit, M.; Ceuleneer, G.; Polvé, M. The remelting of hydrothermally altered peridotite at mid-ocean ridges by intruding mantle diapirs. Nature 1999, 402, 514–518. [Google Scholar] [CrossRef]
- Kelemen, P.B.; Hirth, G.; Shimizu, N.; Spiegelman, M.; Dick, H.J.B. A review of melt migration processes in the adiabatically upwelling mantle beneath oceanic spreading ridges. Philos. Trans. R. Soc. A-Math. Phys. Eng. Sci. 1997, 355, 283–318. [Google Scholar] [CrossRef]
- Warren, J.M. Global variations in abyssal peridotite compositions. Lithos 2016, 248–251, 193–219. [Google Scholar] [CrossRef]
- Sobolev, A.V.; Shimizu, N. Ultra-depleted primary melt included in an olivine from the Mid-Atlantic Ridge. Nature 1993, 363, 151–154. [Google Scholar] [CrossRef]
- Gale, A.; Dalton, C.A.; Langmuir, C.H.; Su, Y.; Schilling, J.-G. The mean composition of ocean ridge basalts. Geochem. Geophys. Geosyst. 2013, 14, 489–518. [Google Scholar] [CrossRef] [Green Version]
- Wang, C.; Liang, Y.; Dygert, N.; Xu, W. Formation of orthopyroxenite by reaction between peridotite and hydrous basaltic melt: An experimental study. Contrib. Mineral. Petrol. 2016, 171, 77. [Google Scholar] [CrossRef]
- Navon, O.; Stolper, E. Geochemical consequence of melt percolation: The upper mantle as a chromatographic column. J. Geol. 1987, 95, 285–307. [Google Scholar] [CrossRef]
- Le Roux, V.; Bodinier, J.L.; Tommasi, A.; Alard, O.; Dautria, J.M.; Vauchez, A.; Riches, A.J.V. The Lherz spinel lherzolite: Refertilized rather than pristine mantle. Earth Planet. Sci. Lett. 2007, 259, 599–612. [Google Scholar] [CrossRef] [Green Version]
- Bodinier, J.-L.; Vasseur, G.; Vernières, J.; Dupuy, C.; Fabriès, J. Mechanism of mantle metasomatism: Geochemical evidence from the Lherz orogenic peridotite. J. Petrol. 1990, 31, 597–628. [Google Scholar] [CrossRef]
- Frei, D.; Liebscher, A.; Franz, G.; Wunder, B.; Klemme, S.; Blundy, J. Trace element partitioning between orthopyroxene and anhydrous silicate melt on the lherzolite solidus from 1.1 to 3.2 GPa and 1230 to 1535 °C in the model system Na2O–CaO–MgO–Al2O3–SiO2. Contrib. Mineral. Petrol. 2008, 157, 473. [Google Scholar] [CrossRef]
- Kelemen, P.; Yogodzinski, G.; Scholl, D.W. Along-strike variation in the Aleutian Island Arc: Genesis of high Mg# andesite and implications for continental crust. Inside Subduction Fact. 2003, 138, 223–276. [Google Scholar]
- McDade, P.; Blundy, J.D.; Wood, B.J. Trace element partitioning between mantle wedge peridotite and hydrous MgO-rich melt. Am. Mineral. 2003, 88, 1825–1831. [Google Scholar] [CrossRef]
- Le Maitre, R.W. Igneous Rocks: A Classification and Glossary of Terms: Recommendations of the International Union of Geological Sciences Subcommission on the Systematics of Igneous Rocks, 2nd ed.; Streckeisen, A., Ed.; Cambridge University Press: Cambridge, UK, 2002. [Google Scholar]
- Meffre, S.; Aitchison, J.C.; Crawford, A.J. Geochemical evolution and tectonic significance of boninites and tholeiites from the Koh ophiolite, New Caledonia. Tectonics 1996, 15, 67–83. [Google Scholar] [CrossRef] [Green Version]
- Herzberg, C. Geodynamic Information in Peridotite Petrology. J. Petrol. 2004, 45, 2507–2530. [Google Scholar] [CrossRef] [Green Version]
- Parkinson, I.J.; Pearce, J.A. Peridotites from the Izu-Bonin-Mariana forearc (ODP leg 125): Evidence for mantle melting and melt-mantle interaction in a supra-subduction zone setting. J. Petrol. 1998, 39, 1577–1618. [Google Scholar] [CrossRef]
- Herzberg, C. Partial melting below the Ontong Java Plateau. Geol. Soc. Lond. Spec. Publ. 2004, 229, 179–183. [Google Scholar] [CrossRef]
- Sklyarov, E.V.; Kovach, V.P.; Kotov, A.B.; Kuzmichev, A.B.; Lavrenchuk, A.V.; Perelyaev, V.I.; Shchipansky, A.A. Boninites and ophiolites: Problems of their relations and petrogenesis of boninites. Russ. Geol. Geophys. 2016, 57, 127–140. [Google Scholar] [CrossRef]
- König, S.; Münker, C.; Schuth, S.; Luguet, A.; Hoffmann, J.E.; Kuduon, J. Boninites as windows into trace element mobility in subduction zones. Geochim. Cosmochim. Acta 2010, 74, 684–704. [Google Scholar] [CrossRef]
Figure 1.
(a) Regional map of the Josephine peridotite. The white rectangle indicates the location of (b) inset, and dotted orange line indicates the approximate contours of the Josephine peridotite. (b) Location of the pyroxenite samples, collected in the northeastern portion of the Josephine peridotite.

Figure 2.
Field photographs of Josephine pyroxenites. (a) Layers of orthopyroxenite LK12-11-2A, (b) single large vein of clinopyroxenite LK12-6-1, (c) dunite cross-cutting a clinopyroxenite vein in a harzburgite, illustrating multiple percolation events, (d) orthopyroxenite LK12-11-2C.
Figure 2.
Field photographs of Josephine pyroxenites. (a) Layers of orthopyroxenite LK12-11-2A, (b) single large vein of clinopyroxenite LK12-6-1, (c) dunite cross-cutting a clinopyroxenite vein in a harzburgite, illustrating multiple percolation events, (d) orthopyroxenite LK12-11-2C.

Figure 3.
Back-scattered electron photographs of two Josephine pyroxenites. Orthopyroxenes (OPX) and clinopyroxene (CPX) grains in (a) clinopyroxenite LK12-6-1 and (b) in orthopyroxenite LK11-2A. Minor olivine (OL) is also observed. Exsolutions are usually relatively narrow in CPX (c) and wider in OPX (d).

Figure 4.
Example of combined LASER ablation inductively coupled plasma mass spectrometry (LA-ICP-MS) and electron probe microanalyses (EPMA) approach on adjacent pyroxene grains in LK12-6-1. One wavelength-dispersive spectroscopy (WDS) map (green area is OPX; red area is CPX) is superimposed to illustrate how grain boundaries and exsolutions were precisely mapped.

Figure 5.
Al2O3, CaO, and Cr2O3 concentrations (wt.%) along with rim-to-rim profiles in OPX grains in LK12-5-2B (a–c), LK12-11-2A (d–f), LK12-6-1 (g–i), and in CPX grains in LK12-6-1 (j–l). Trend lines are polynomial fits and error bars reflect typical 2SD.
Figure 5.
Al2O3, CaO, and Cr2O3 concentrations (wt.%) along with rim-to-rim profiles in OPX grains in LK12-5-2B (a–c), LK12-11-2A (d–f), LK12-6-1 (g–i), and in CPX grains in LK12-6-1 (j–l). Trend lines are polynomial fits and error bars reflect typical 2SD.

Figure 6.
Average rare-earth element (REE) concentrations normalized to chondrite [42] in (a) CPX and (b) OPX in orthopyroxenites and clinopyroxenites. Average trace element concentrations normalized to primitive mantle (PM) [42] in (c) CPX and (d) OPX in the same pyroxenites. Error bars represent 2 standard error (2SE) for each element.

Figure 7.
Chondrite-normalized [42] concentrations of selected trace elements in OPX or CPX grains in orthopyroxenite LK12-5-2B (a–d), clinopyroxenite LK12-6-1 (e–l), clinopyroxenite LK12-10-2A (m–p), and in orthopyroxenite LK12-11-2A (q–s). Note that LK12-5-2B is a ¾ profile, LK12-6-1 is a ½ profile, and all others are full rim-to-rim profiles. Trend lines are polynomial fits and error bars represent 2SE for each element.

Figure 8.
Apparent partition coefficients between OPX and CPX versus ionic radii of REE for (a) average compositions of all grains, and (b) adjacent analyses only. When multiple adjacent OPX-CPX pairs are available, multiple lines are reported for the same sample (e.g., LK12-6-1). Theoretical equilibrium Kds are calculated at 1000 °C and 1400 °C for comparison [48,49].

Figure 9.
REE and major element equilibration temperatures derived from average grain compositions and adjacent analyses only in Josephine pyroxenites, compared to REE temperatures for Josephine peridotites, MOR ophiolitic peridotites, supra-subduction zone (SSZ) peridotites, and abyssal peridotites [53]. Error bars on TREE represent 1SD derived from regression diagrams [52], which indirectly reflects the number of analyses, analytical error, and internal variability. “Adjacent grains” temperatures usually have larger error because they are derived from a limited number of OPX-CPX analyses right next to the grain boundary.

Figure 10.
(a) Illustration of adjacent analyses in OPX and CPX grains, and the grain “radius” used for calculations, which corresponds to the exact distance to the grain edge (e.g., 0.2 mm, 0.3 mm). (b) time scale of diffusive re-equilibration of Yb versus REE equilibration temperatures derived for adjacent analyses only, using the exact distance to the grain edge (in 2-D) instead of average grain size in the sample.

Figure 11.
REE concentrations normalized to chondrite [42] in (a,c) CPX and (b,d) OPX from this study (same symbols as Figure 6), compared with pyroxene compositions in Oman pyroxenites [57], Marum orthopyroxenite [58], Josephine peridotites [40], Kamchatka amphibole-bearing websterites attributed to percolation of high-Ca boninites [12], and Kamchatka amphibole-bearing pyroxenite (type 1A; rapidly crystallized) attributed to percolation of low-Ca boninites [16]. Error bars represent 2SE for each element.

Figure 12.
(a) Chondrite-normalized [42] trace element compositions of melts in equilibrium with clinopyroxenites and orthopyroxenites from the Josephine ophiolite compared with (b) worldwide EarthChem compilation of boninites that display a negative Zr anomaly and CaO/Al2O3 > 0.75. Erupted Josephine boninites [34] are included in the compilation. (c) Worldwide EarthChem compilation of ultra-depleted boninites that display a slight positive Ti anomaly, and (d) 1–20% melting of a depleted peridotite source [59]. The boninite data was compiled from the EarthChem repository (http://www.earthchem.org/) and filtered to retain true boninite compositions (SiO2 > 52%, MgO > 8%, and TiO2 < 0.5%; [77]). Average N-MORB is also plotted for reference [69].

Figure 13.
MgO vs. FeOT (a), Al2O3 (b), and SiO2 (c) compositions of whole-rock peridotites from back-arc xenoliths from Japan, Patagonia, and Cascades (purple field) [79], fore-arc peridotites from the Izu-Bonin-Mariana trench [80], fore-arc/sub-arc peridotite xenoliths from Kamchatka [1], and sub-arc peridotite xenoliths from West Bismark [3]. For comparison, OJP is a model residue formed by fractional melting of a fertile peridotite in a modern plume situation [81]. Josephine peridotites plot closely to the back-arc xenolith field, while many fore-arc samples plot clearly outside of that field.

© 2019 by the authors. Licensee MDPI, Basel, Switzerland. This article is an open access article distributed under the terms and conditions of the Creative Commons Attribution (CC BY) license (http://creativecommons.org/licenses/by/4.0/).
Share and Cite
MDPI and ACS Style
Le Roux, V.; Liang, Y. Ophiolitic Pyroxenites Record Boninite Percolation in Subduction Zone Mantle. Minerals 2019, 9, 565. https://doi.org/10.3390/min9090565
AMA Style
Le Roux V, Liang Y. Ophiolitic Pyroxenites Record Boninite Percolation in Subduction Zone Mantle. Minerals. 2019; 9(9):565. https://doi.org/10.3390/min9090565
Chicago/Turabian StyleLe Roux, Véronique, and Yan Liang. 2019. "Ophiolitic Pyroxenites Record Boninite Percolation in Subduction Zone Mantle" Minerals 9, no. 9: 565. https://doi.org/10.3390/min9090565
Note that from the first issue of 2016, this journal uses article numbers instead of page numbers. See further details here.