
Symbolic Regression Approaches for the Direct Calculation of Pipe Diameter


1
Faculty of Electronic Engineering, University of Niš, 18000 Niš, Serbia
2
IT4Innovations, VSB—Technical University of Ostrava, 708 00 Ostrava, Czech Republic
*
Author to whom correspondence should be addressed.
Axioms 2023, 12(9), 850; https://doi.org/10.3390/axioms12090850
Submission received: 16 June 2023
/
Revised: 22 August 2023
/
Accepted: 28 August 2023
/
Published: 31 August 2023
(This article belongs to the Special Issue Methods and Applications of Advanced Statistical Analysis)
Abstract
:This study provides novel and accurate symbolic regression-based solutions for the calculation of pipe diameter when flow rate and pressure drop (head loss) are known, together with the length of the pipe, absolute inner roughness of the pipe, and kinematic viscosity of the fluid. PySR and Eureqa, free and open-source symbolic regression tools, are used for discovering simple and accurate approximate formulas. Three approaches are used: (1) brute force of computing power, which provides results based on raw input data; (2) an improved method where input parameters are transformed through the Lambert W-function; (3) a method where the results are based on inputs and the Colebrook equation transformed through new suitable dimensionless groups. The discovered models were simplified by the WolframAlpha simplify tool and/or the equivalent Matlab Symbolic toolbox. Novel models make iterative calculus redundant; they are simple for computer coding while the relative error remains lower compared with the solution through nomograms. The symbolic-regression solutions discovered by brute force computing power discard the kinematic viscosity of the fluid as an input parameter, implying that it has the least influence.
Keywords:
diameter; symbolic regression; pipe sizing; colebrook equation; moody diagram; pipeline hydraulics; Darcy–Weisbach equation; dimensionless numbersMSC:
62J02; 68W30; 68T20; 74P10; 76N251. Introduction
This study provides novel approximate, but relatively simple and accurate, solutions for the unknown pipe diameter D when other quantities from the Darcy–Weisbach Equation (1) [1] are known directly or indirectly. Symbolic regression is used in this study to achieve this goal.
The Darcy-Weisbach Equation (1) is typically used in hydraulic engineering to relate pressure drop Δp (or head loss Δh, where ), flow rate Q, diameter of pipe D, the Darcy flow friction factor λ, density of the fluid , and length of the pipe L (and two constants: π is the Ludolph’s number; π ≈ 3.1415 and g is acceleration due gravity; g = 9.81 m/s2):
The Darcy–Weisbach equation contains the Darcy flow friction factor λ which is not a constant and, among others, is a function of the unknown diameter of pipe D. For the turbulent flow regime, the Darcy flow friction factor λ is typically calculated through the empirical Colebrook equation, which is indirectly also a function of the unknown pipe diameter D through the relative roughness of the inner pipe surface ℇ/D and the Reynolds number Re ; where η and ν are dynamic and kinematic viscosity of the fluid. For the problem of the unknown diameter D, this makes the Colebrook equation practically useless in its classical form, as given in (2) [2,3] (a suitable form for solving for the unknown diameter D is given in Section 4.3):
Well-known nomograms, Moody’s [4] and Rouse’s [5], are based on the Colebrook equation and both are unsuitable for the calculation of the unknown diameter D due to the same reasons as explained for the Colebrook equation.
In summary, three main problems should usually be solved in hydraulic engineering practice: (1) unknown pressure drop Δp (head loss Δh), (2) unknown flow discharge Q, and (3) unknown pipe diameter D, while all of which equally occur in the practice of hydraulic engineering:
- Unknown pressure drop Δp (head loss Δh)
The Colebrook equation in its classical form, as given above, and its graphical interpretations in the form of Moody’s [4] (Rouse’s [5]) nomogram in combination with the Darcy-Weisbach equation, is suitable for the calculation of pressure drop Δp (head loss Δh) for the pipes when their diameter D is known. In such cases, the Darcy flow friction factor λ should be calculated using the Colebrook equation [6,7,8,9,10,11] where all other quantities from the Darcy–Weisbach equation should be known, with the exception of the unknown Δp (head loss Δh);
- 2.
- Unknown flow discharge Q
Combining the Colebrook’s and the Darcy–Weisbach equation together with the Reynolds number Re, the problem of the unknown flow discharge Q can be solved easily in a closed-form solution [12] (this closed-form solution is available together with related numerical example in [13]);
- 3.
- Unknown pipe diameter D
The solution to this problem is the main topic of this study.
A short overview of previous works for solving all three types of the described problems, together with numerical examples, is given in [13].
The flow-discharge problem Q can be easily solved because a closed-form solution exists [12] and, also, the unknown Δp (head loss Δh) can be solved relatively easily due to the suitable structure of the input parameters of the Colebrook equation. On the other hand, due to the unfavorable structure of the Colebrook equation, the problem of the unknown pipe diameter D, although very important, was not the main focus of researchers, but, nevertheless, many efforts have been made, such as Powell in 1950 [14], Rajaratnam in 1960 [15], Ranga Raju and Garde in 1966 [16], Lai and Lee in 1975 [17], Swamee and Jain in 1976 [12], Debler in 1977 [18], Swamee and Rathie in 2007 [19], Sakkas in 2014 [20], LaViolette in 2017 [21], Medina et al. in 2017 [22], Yetilmezsoy et al. in 2021 [23], Lamri and Easa in 2022 [24], Brkić and Praks in 2023 [25], etc. Many of them from the early years solve the problem through today’s obsolete nomograms [14,15,16,17,18].
This study uses symbolic regression either to improve already existing models for solving the unknown pipe diameter D where nomograms are replaced by formulas or to develop completely new methods. Three approaches are used: (1) brute force of computing power, which provides results based on raw input data; (2) an improved method where input parameters are transformed through the Lambert W-function; (3) a method where the results are based on a transformed Colebrook equation and its inputs through new suitable dimensionless groups. Consequently, the novel approximations are useful for the acceleration of everyday work of pipeline-system designers and also for novel piping grid simulation tools, such as Pandapipes [26], making the use of iterative calculus and nomograms redundant.
For this study, the symbolic regression tools Eureqa [27] and PySR [28,29] were forced to minimize the relative error of approximations, which were consequently simplified by WolfphramAlpha [30] and/or the equivalent Matlab Symbolic toolbox. Finally, numerical experiments were used for the simplification of constants in the newly discovered approximations.
The content of this article is as follows: Section 1 of this study gives this introduction, Section 2 provides a brief explanation of symbolic regression with a short overview of software tools used in this study, Section 3 gives input parameters and explains uncertainty and the possible nature and source of error, Section 4 gives the developed formulas for solving for the unknown diameter D, including sensitivity analysis, while Section 5 provides conclusions. A list of the used symbols, with remarks about their units, is also provided after the conclusion. This article is accompanied by the data as Supplementary Materials, which allows repetition of the entire process used to develop methods presented in this study. Two numerical examples are also given in the Supplementary Materials.
2. Background of Symbolic Regression
This section provides a brief theoretical background of regression and symbolic regression followed by a short overview of the used software.
A brief history of the mathematical background is given in this paragraph. Gerqonne’s 1815 paper [31] gives an overview of the history of regression analysis and mentions the experimental work of Galen and Avicenna and the 1805 paper of Legendre, who introduced the least squares method. Gauss discussed this method in 1809 and first linked the least squares method with the theory of probability. The role of Galton and Pearson is discussed in [32]. In 1877, Galton introduced the concept of regression, while Pearson developed the correlation coefficient during 1893–1904. In 1906, Arthur Bowley stressed the importance of random sampling, especially for the estimation of population parameters [33]. Box and Jenkins popularized time series analysis based on autoregressive integrated moving average (ARIMA) in 1970 [34]. Symbolic regression was first defined by Koza in 1994 [35] as a method to automatically find a functional relationship that describes the given data set by synthesizing computer programs using genetic programming [36].
This paper uses symbolic regression, Lambert-W function, and new suitable dimensionless groups to find simple but still accurate approximations. The other approaches were successfully tested as well, such as iterative methods [7,8], explicit solutions based on special functions [24,25], and neural networks [37]. Although the goodness of fit is a subject of intensive research [38,39,40,41], the goodness of fit methods are not widely used for flow friction modeling. Anyway, the goodness of fit methods were used to analyze the properties of non-Newtonian fluid samples [42].
2.1. Theory behind Symbolic Regression
Symbolic regression is a technique to find a mathematical formula or expression that fits a given data set [37,43,44]. The idea behind symbolic regression is to search through a space of mathematical expressions, looking for the one that best fits the data. This search is typically done using a genetic algorithm [35], which is a type of optimization algorithm inspired by the natural selection process where the best candidate for solutions is chosen using a fitness function [45], selecting the best solutions for reproduction and using genetic operators to generate new solutions for the next generation, and repeating this process until a satisfactory solution is found or a stopping criterion is met. The symbolic models that most fit the data are used to produce the next generation in a process of mutation and crossover. This is usually processed in expression trees, as shown in Figure 1. Mutations take existing parts of the tree and replace them with equivalent elements, while crossover takes random subtrees and creates new trees by swiping subtrees among existing trees [46,47].
The space of mathematical expressions is the set of all possible mathematical formulas that can be used to represent the relationship between the input variables and the output variable. This space can be represented as grammar, which defines the rules for building valid expressions [48]. Grammar is typically based on a subset of mathematical functions and operators, such as addition, subtraction, multiplication, division, and trigonometric functions. On the other hand, the fitness function is used to evaluate how well a given mathematical expression fits the dataset. It measures the difference between the predicted values of the expression and the actual values in the dataset. There are different ways to define the fitness function but the most common approach is to use a measure of the error, while, here, maximal relative error is used [49].
Symbolic regression can give very accurate results but it often contains a certain level of error.
2.2. Software Tools for Symbolic Regression
A variety of open-source tools for symbolic regression exist [50], such as Eureqa [27,51], PySR [28,52], AI Feynman [53], symbolic regression by uniform random search implemented in the pySRURGS package, gene expression programming, and sequential threshold ridge regression algorithms implemented in the Data-Driven Symbolic Regression package [54], etc. Although these software tools are free and open; some of them lack maintenance, which is essential, especially for high-performance algorithms. Consequently, in this article, High-Performance Symbolic Regression in Python and Julia implemented in the PySR package is tested together with the Eureqa software, which can be viewed, due to its popularity, as a golden standard for symbolic regression.
The quality of discovered solutions can be evaluated in Eureqa using various error metrics, for example, absolute error, correlation, and worst case (maximum error). The relative error, often described by a percentage, is widely used by the pipeline design research community [8,9,10,11] for evaluation of the quality of approximations and is of interest to this study. Unfortunately, the relative error metric is not implemented in Eureqa. Although Eureqa does not allow users to add or modify the given error metrics, happily there exists a general way to use software tools that handle only absolute error metrics to solve relative error metrics tasks [50].
For a symbolic regression task with two input parameters, which are represented by parameters A and B, and if the aim is to find a model of parameter C, which minimizes the relative error of a function f (A, B), the search of formula f() in Eureqa must satisfy the equation abs(f(A,B)−C)/C = 0, where the function abs() denotes the absolute value. As approximations should be robust for a variety of input parameters, such as Table 1 in this study, the worst case (maximum error), was used to evaluate the quality of the symbolic regression process in Eureqa. After the symbolic regression in Eureqa, the discovered function f() was extracted manually.
In contrast to Eureqa, the open-source PySR can be easily modified by the user to provide the required error metric. Thus, a big advantage of PySR is also that the symbolic regression process in PySR is fully automated and suitable for high-performance computing clusters, as PySR leverages high-performance properties of Julia language and uses all available computing cores of the given computer node naturally. This accelerates the symbolic regression process on high-performance computing architectures, as PySR works perfectly parallel.
After symbolic regression, the discovered models were analyzed in Matlab Symbolic Toolbox or the equivalent WolframAlpha online tool (by command “simplify”) [30,55] to provide simplified forms. Consequently, numerical experiments were used to simplify the constants of the regression models while maintaining the same relative error.
3. Input Parameters and Analysis of the Error
This section gives an explanation of a possible source of the error, which can be caused by the approximate nature of regression and by uncertainty caused by measurement, reading of diagrams, and the empirical nature of certain equations.
The nature and sources of the error related to the pipe-sizing problems can be as follows:
- Uncertainty of measurement: Some parameters, such as the roughness of the inner surface of pipes ℇ cannot be easily measured [56,57,58,59]. The values of physical roughness measured in dry pipes cannot always be used directly in hydraulic calculations under certain flow conditions due to the existence of a viscose sublayer near the inner wall of the pipe wall (e.g., all types of pipes, new or used, are treated as smooth during laminar flow [60]). Specific values for the absolute roughness ℇ of the inner pipe surface for different materials are given together with Moody’s [4] (Rouse’s [5]) and diagrams for flow friction factor λ; the minimal and maximal values for the parameters used in this article are given in Table 1;
- Empirical nature of used equations: The Colebrook equation is empirical, based on an experiment conducted by Colebrook and White with the flow of air through a set of pipes with different roughnesses of their inner surfaces [2]. It can be disputed whether this equation fits well the physical reality of the turbulent flow friction sufficiently [61,62,63,64]. Anyway, the Colebrook equation is treated as accurate for this study (i.e., the Colebrook equation is considered as an informal standard in hydraulic engineering);
- Error caused by the specific logarithmic structure of the Colebrook equation from which the unknown variable, which is given implicitly, can be evaluated only approximately. In addition, the Colebrook equation in its native form is not suitable for solving the problem of unknown diameter D. For this reason, Section 4.3 of this article proposes a novel, more suitable, relation based on the Colebrook equation.
The following iterative methods are considered in [6,7,8] as sufficiently accurate to be used as a standard for the evaluation of simplified approaches from engineering practice, such as nomograms and explicit approximations:
- Nomograms
The Moody diagram [4] is based on the Rouse diagram [5], while the turbulent part of both is drawn following the Colebrook equation. The Moody diagram introduces the relative error from 4% to 15% due to imprecise reading [66] (Rangu Raja and Garde [16] reported the error of reading of the Moody diagram as “very small” at ±3%, resulting in the final error from the unknown diameter D at ±5% and for Δh/L up to ±15%) causing relatively often consequent misleading interpretations [67,68]. Here, it is most important that both Rouse’s and Moody’s diagrams are suitable only for solving for the unknown Δp (or head loss Δh) and not for the problem of unknown diameter D (some diagrams suitable for solving the unknown diameter D are given in [14,15,16,17,18,20]);
- Explicit approximations
The variety of approximate formulas offered as an alternative to the implicitly given original Colebrook equation suitable for solving the unknown Δp (head loss Δh) can be expressed mathematically in a wide range of accuracy and complexity of their structure [9,10,11]. Explicit approximations for direct solutions of the unknown diameter D also exist [12,16,22,23,24,25]. The error caused by the symbolic regression approach also belongs to this type.
4. Solutions for the Unknown Diameter D
This section gives the developed formulas for solving for the unknown diameter D.
Three different approaches were tried in this article to solve the problem of the unknown diameter D while symbolic regression is used here in a threefold way: (1) brute force of computing power (a similar approach for flow friction factor λ is used in [69]), (2) one method based on the Lambert W-function is simplified [24,25] (details about the Lambert W-function can be seen in [70]), and (3) some old approaches associated with nomograph solutions based on suitable dimensionless groups were further developed and improved in a form suitable for the contemporary pipe-design community [14,16,20,21].
Pipe diameter D in real engineering projects should be selected from the list of nominal diameters [71] and, therefore, the relative error in the calculation of theoretical diameter D of a few percentages is acceptable (especially in pipe systems with pumps [72]).
4.1. Brute Force of Computing Power
The brute force of computing power, that is, the use of symbolic regression without any knowledge about the patterns of how to connect input and output variables; gives relatively acceptable results with a relative error from 5.9% to 6.7% (with respect to Sobol’s quasi-random sampling which was used to handle a large variety of Reynolds numbers Re in the development phase [73]).
Formulas developed using this approach rejected viscosity as an input parameter of influence.
4.1.1. Sensitivity Analysis—Rejection of Viscosity
A very interesting fact is that both symbolic regression tools, Eureqa and PySR, discovered relations without using viscosity (or temperature t through Equation (3) showing that the reason for rejection is not only numerical but rather with real physical meaning). Thus, artificial intelligence revealed that this parameter is of the least influence for all here discovered symbolic regression models (artificial intelligence, AI, can automatically reject less important variables or those that do not have a significant influence on the final result [74]). They can provide relatively accurate results for rough estimations even without using viscosity . Therefore, this behavior can be considered as a sensitivity analysis [75,76], as important parameters of the models are identified. Consequently, these novel approximations can be used not only for water but also for other fluids.
Both symbolic regression tools, Eureqa (in Equations (4) and (5)) and PySR (in Equation (6)), rejected viscosity as a factor of influence. Therefore, to prove this finding, viscosity is correlated with temperature t [23] using Equation (3) (valid for the viscosity of water) and, then, instead of ; (Eureqa in Equation (4), and PySR in Equation (6)), a new relation was tested; (Eureqa in Equation (5)). Using , both symbolic regression tools, Eureqa [9] and PySR [10], rejected temperature t in the same way as they did before for viscosity .
Viscosity is correlated with temperature t through Equation (3):
Equation (3) has two solutions for temperature t, so the solution with real physical meaning should be kept.
It is important that viscosity (or related temperature t) has been rejected by both software tools, Eureqa and PySR.
4.1.2. Symbolic Regression Approximations Discovered by Brute Computing Power
Data used for Equations (4) and (6), and for Equation (5) are given in Table S1 of the Supplementary Materials.
The obtained novel relations discovered with the software Eureqa are given in Equation (4) with a relative error of up to 5.9% and in Equation (5) with a relative error of up to 6.6% (both values of the error are estimated on data from Table S1 of the Supplementary Materials of this article).
where:
B = ln(Δh/L-0.0001),
The obtained relation discovered with the software PySR is given in Equation (6) with a relative error of up to 6.7% (the value of the error is estimated on data from Table S1 of the Supplementary Materials of this Article).
WolframAlpha [30] simplified the second part of Equation (6) by the “simplify” command while the relative error remains the same.
4.2. Method through the Lambert W-Function
Equation (7) was developed by Lamri and Easa [24] for solving the problem of the unknown diameter D and is based on the Lambert W-function, whereas, in the presented version, and was modified by Brkić and Praks [25] by symbolic regression.
Symbolic regression failed further to simplify this model and was not enabled directly to connect , where natural logarithm is used for normalization [37], see Table S2 of the Supplementary Materials. The maximum of the relative error is up to 60%, which is not expected because the approach with normalization usually reduces the error (normalization, in this case, means that the variables should be scalable to transform relatively small numbers to larger; e.g., = {0.0001, 0.0000015, 0.00000031, 50.0005}→{ℇ*, ν*} = {0.0000000785, 0.000000118} where normalization gives = {7.105164678, 15.94852572} and further {D} = {6.70350591}, avoiding direct connection {ℇ*, ν*}→{D}.
However, simplication is tried using the Symbolic Matlab Toolbox where the new equivalent model given in Equation (8) should be more computationally efficient. Equation (7) contains four noninteger powers, three integer powers, and two natural logarithmic functions, while the new model given in Equation (8) contains one noninteger power, one integer power, two exponential functions, and five natural logarithms, while the rest are only simple arithmetic operations. For coding, different functions demand the engagement of different hardware resources, explained as computational cost in [77], where is approximated with Z and with M.
4.3. Method Based on New Suitable Dimensionless Groups
The problem of unknown Δp (head loss Δh) is based on two dimensionless parameters [78]: Reynolds number Re, and relative roughness ε/D, where both contain diameter D, which makes them useless for solving the problem of unknown pipe diameter D. Based on the Buckingham-Π theorem [79,80], two new dimensionless parameters Π1 and Π2 are introduced in Equation (9):
The purpose of Π1 and Π2 is to eliminate the unknown diameter D from their structure, remaining in the rearranged Colebrook equation only in the Reynolds number Re, as given in Equation (10):
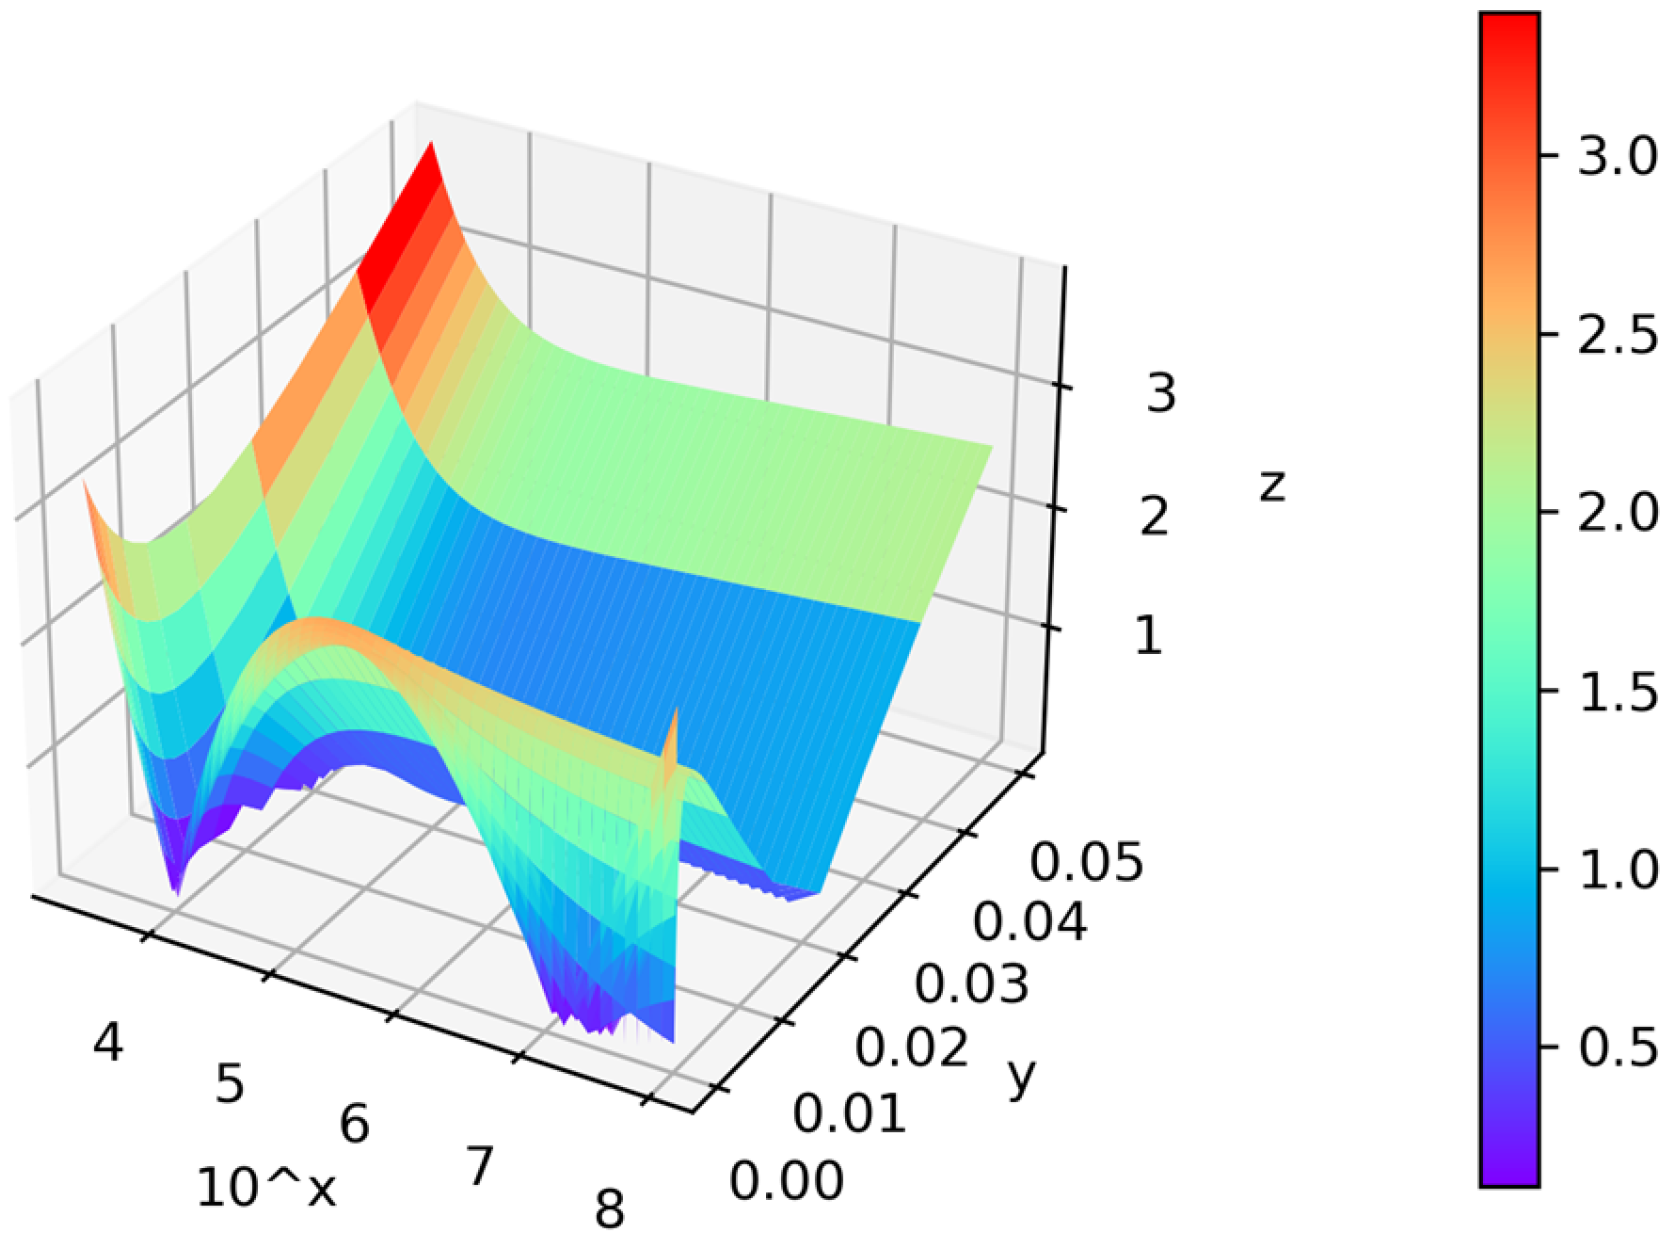
However, it is not easy to extract the Reynolds number Re from Equation (10). Due to the use of Sobol’s quasi-random sampling [73], a sufficient number of points for the Reynolds number Re and the relative roughness of the inner pipe surface ℇ/D were generated to cover the turbulent zone of flow (to cover the validity range of the Colebrook Equation (2) [2] and related Moody’s (Rouse’s diagram)). Then, knowing that , relation , where the values for can be calculated from Equation (10) using available iterative methods from [6,7,8]. Data are listed in Table S3 of the Supplementary Materials (used iterative method for is from [6] using 2048 quasi-random Sobol’s points [73]). Equation (11) is generated using the Eureqa symbolic regression tool and is further simplified in the Matlab Symbolic Toolbox. The maximal relative error of the Reynolds number calculated through Equation (11) is up to 2.68%.
Finally, the required unknown diameter D can be calculated from Equation (12):
Figure 2 shows the absolute relative error of Equation (11) in percentage as a function of the Reynolds number (x-axis) and the relative roughness (y-axis). To clearly present a wide interval of the Reynolds number (2320-108), values of the x-axis are transformed by the decadic logarithm; For example, x = 8 at the x-axis corresponds to the Reynolds number 108. The largest relative error, 3.86%, corresponds to the “corner” values Re = 2320 and ε/D = 0.05, see the red peak in Figure 2.
5. Conclusions
This article gives novel accurate symbolic regression-based approximations for the calculation of pipe diameter when flow rate, pressure drop, pipe length, absolute inner roughness, and fluid kinematic viscosity are known inputs, using three approaches:
- Brute force, in which symbolic regression is applied directly to the input data set;
- A method based on the special functions, in which the problem is transformed by the approximation of the Lambert W-function;
- A method based on new suitable dimensionless groups, which eliminates the unknown pipeline diameter from the input.
The PySR software works perfectly parallel to our high-performance computing architecture. The discovered models were simplified by Wolfram Alpha. The discovered models provide simple but still accurate approximations suitable for engineering practice. Thus, the time-consuming iterative calculation of the pipe diameter is not necessary.
It is necessary to emphasize regarding the findings:
- A very interesting fact is that both symbolic regression tools, Eureqa and PySR, using raw data and brute force of computing discovered relations without using the viscosity (or temperature t) of the conveying fluid—Equations (4)–(6) are with the relative error relative from 5.9% to 6.7%;
- Equations (7) and (8) leverage also the explicit solution provided by the Lambert W-function function by simplification and keeping the error, as reported by Lamri and Easa [24];
- Equation (10) gives the Colebrook Equation in a form suitable for solving the problem of the unknown diameter of pipe D where the novel approximation is based on the Buckingham-Π theorem through suitable nondimensional numbers Π1 and Π2 in Equation (9). Sobol’s quasi-random sampling [73] is used to provide data to feed the symbolic regression tool. Consequently, symbolic regression was used to construct the novel approximation of the Reynolds number Re in Equation (11). Although the novel approximation is very simple, it is accurate, as the relative error is bounded by 2.68%. On the contrary, references [16,65] report approximations bounded by a relative error larger than 20% when a similar method is used through nomograms.
Supplementary Materials
The following supporting information can be downloaded at: https://www.mdpi.com/article/10.3390/axioms12090850/s1, Tables S1–S3: Datasets used to feed symbolic regression tools, and Table S4: Numerical examples.
Author Contributions
Conceptualization, D.B. and P.P.; methodology, D.B.; software, D.B., P.P. and R.P.; validation, D.B. and P.P.; formal analysis, D.B.; investigation, D.B. and P.P.; resources, T.K.; data curation, D.B.; writing—original draft preparation, D.B.; writing—review and editing, D.B., P.P. and T.K.; visualization, D.B.; supervision, D.B.; projects administration, P.P. and T.K.; funding acquisition, D.B., P.P. and T.K. All authors have read and agreed to the published version of the manuscript.
Funding
Dejan Brkić received support from the Ministry of Science, Technological Development and Innovation of the Republic of Serbia through the institutional financing of the author 451-03-89647/2023-01/200102 from 3 February 2023, while Dejan Brkić, Pavel Praks, Renáta Praksová, and Tomáš Kozubek received support by the Ministry of Education, Youth and Sports of the Czech Republic through the e-INFRA CZ (ID: 90254) and also by the Technology Agency of the Czech Republic through the project CEET—“Center of Energy and Environmental Technologies” TK03020027.
Data Availability Statement
All data which are necessary to repeat this research are available in the text and in the Supplementary Materials.
Conflicts of Interest
The authors declare no conflict of interest.
Abbreviations
| Δp | the pressure drop in Pa |
| D | the inner diameter of the pipe in m |
| Q | the flow rate in m3/s |
| a dimensionless Darcy flow friction factor | |
| the density of the fluid in kg/m3 | |
| L | the length of the pipe in m |
| the Ludolph’s number; ≈ 3.1415 | |
| the head loss in m | |
| g | acceleration due to gravity in m/s2 (or N/kg); g = 9.81 m/s2 |
| the absolute roughness of the inner pipe surface in m | |
| a dimensionless Reynolds number | |
| V | the velocity of the fluid in m/s |
| the kinematic viscosity of the fluid in m2/s | |
| the dynamic viscosity of the fluid in Pa·s | |
| the density of the fluid in kg/m3 | |
| t | the temperature in °C |
| A and B | auxiliary parameters |
| * | related nondimensional versions of the related parameters |
| s | the index for smooth flow |
| r | index for rough hydraulic flow |
| N, Y, P, K, U, M, Z, and V | auxiliary |
| Π1 | a new-defined dimensionless number |
| a new-defined dimensionless number |
References
- Brown, G.O. The history of the Darcy-Weisbach equation for pipe flow resistance. In Proceedings of the Environmental and Water Resources History Sessions at ASCE Civil Engineering Conference and Exposition, Washington, DC, USA, 3–7 November 2002. [Google Scholar] [CrossRef]
- Colebrook, C.F.; White, C.M. Experiments with fluid friction in roughened pipes. Proc. R. Soc. A—Math. Phys. Sci. 1937, 161, 367–381. [Google Scholar] [CrossRef]
- Colebrook, C. Turbulent flow in pipes, with particular reference to transition region between smooth and rough pipe laws. J. Inst. Civ. Eng. 1939, 11, 133–156. [Google Scholar] [CrossRef]
- Moody, L.F. Friction factors for pipe flow. Trans. ASME 1944, 66, 671–678. [Google Scholar] [CrossRef]
- Rouse, H. Evaluation of boundary roughness. In Proceedings of the Second Hydraulics Conference, Iowa Institute of Hydraulic Research, Iowa City, IA, USA, 1–4 June 1942; pp. 105–116. [Google Scholar] [CrossRef]
- Brkić, D. Solution of the implicit Colebrook equation for flow friction using Excel. Spreadsheets Educ. 2017, 10, 4663. Available online: https://sie.scholasticahq.com/article/4663 (accessed on 26 May 2023).
- Praks, P.; Brkić, D. Advanced iterative procedures for solving the implicit Colebrook equation for fluid flow friction. Adv. Civ. Eng. 2018, 2018, 5451034. [Google Scholar] [CrossRef]
- Praks, P.; Brkić, D. Choosing the optimal multi-point iterative method for the Colebrook flow friction equation. Processes 2018, 6, 130. [Google Scholar] [CrossRef]
- Brkić, D. Review of explicit approximations to the Colebrook relation for flow friction. J. Pet. Sci. Eng. 2011, 77, 34–48. [Google Scholar] [CrossRef]
- Praks, P.; Brkić, D. Review of new flow friction equations: Constructing Colebrook’s explicit correlations accurately. Rev. Int. Metodos Numer. Calc. Diseño Ing. 2020, 36, 41. [Google Scholar] [CrossRef]
- Brkić, D.; Stajić, Z. Excel VBA-based user defined functions for highly precise Colebrook’s pipe flow friction approximations: A comparative overview. Facta Univ. Ser. Mech. Eng. 2021, 19, 253–269. [Google Scholar] [CrossRef]
- Swamee, P.K.; Jain, A.K. Explicit equations for pipe-flow problems. J. Hydraul. Div. 1976, 102, 657–664. [Google Scholar] [CrossRef]
- Brkić, D.; Stajić, Z.; Živković, M. Sizing pipes without iterative calculus: Solutions for head loss, flow discharge and diameter. In Proceedings of the 24th International Carpathian Control Conference, Szilvásvárad, Hungary, 12–14 June 2023. [Google Scholar] [CrossRef]
- Powell, R.W. A diagram for the direct determination of pipe sizes. Civ. Eng. ASCE 1950, 20, 595–596. [Google Scholar]
- Rajaratnam, N. Direct solution for diameter of pipe in rough turbulent flow. Houille Blanche 1960, 46, 714–719. [Google Scholar] [CrossRef]
- Rangu Raju, K.R.; Garde, R.J. Direct solution for problems in pipe friction. Houille Blanche 1966, 52, 917–919. [Google Scholar] [CrossRef]
- Lai, R.Y.; Lee, K.K. Moody diagram for direct pipe diameter calculation. J. Hydraul. Div. 1975, 101, 1377–1380. [Google Scholar] [CrossRef]
- Debler, W. Pipe sizes from modified Moody diagram. J. Hydraul. Div. 1977, 103, 81–85. [Google Scholar] [CrossRef]
- Swamee, P.K.; Rathie, P.N. Exact equations for pipe-flow problems. J. Hydraul. Res. 2007, 45, 131–134. [Google Scholar] [CrossRef]
- Sakkas, J.G. Generalized numerical and nomographic solutions of simple pipe flow problems. Water Util. J. 2014, 7, 51–64. Available online: https://www.ewra.net/wuj/pdf/WUJ_2014_07_06.pdf (accessed on 28 May 2023).
- LaViolette, M. On the history, science, and technology included in the Moody diagram. J. Fluids Eng. 2017, 139, 030801. [Google Scholar] [CrossRef]
- Medina, Y.C.; Fonticiella, O.M.; Morales, O.F. Design and modelation of piping systems by means of use friction factor in the transition turbulent zone. Math. Model. Eng. Probl. 2017, 4, 162–167. [Google Scholar] [CrossRef]
- Yetilmezsoy, K.; Bahramian, M.; Kıyan, E.; Bahramian, M. Development of a new practical formula for pipe-sizing problems within the framework of a hybrid computational strategy. J. Irrig. Drain. Eng. 2021, 147, 04021012. [Google Scholar] [CrossRef]
- Lamri, A.A.; Easa, S.M. Explicit solution for pipe diameter problem using Lambert W-function. J. Irrig. Drain. Eng. 2022, 148, 04022030. [Google Scholar] [CrossRef]
- Brkić, D.; Praks, P. Discussion of “Explicit solution for pipe diameter problem using Lambert W-function”. J. Irrig. Drain. Eng. 2023, 149, 07023016. [Google Scholar] [CrossRef]
- Lohmeier, D.; Cronbach, D.; Drauz, S.R.; Braun, M.; Kneiske, T.M. Pandapipes: An open-source piping grid calculation package for multi-energy grid simulations. Sustainability 2020, 12, 9899. [Google Scholar] [CrossRef]
- Dubčáková, R. Eureqa: Software review. Genet Program Evolvable Mach. 2011, 12, 173–178. [Google Scholar] [CrossRef]
- PySR. Available online: https://astroautomata.com/PySR/options/#loss (accessed on 9 June 2023).
- Cranmer, M. MilesCranmer/PySR v0.2 (v0.2) [Computer software]. Available online: https://doi.org/10.5281/ZENODO.4041459 (accessed on 28 August 2023).
- Wolfram Alfa Simplification. Available online: https://www.wolframalpha.com/input/?i=simplify (accessed on 9 June 2023).
- Stigler, S.M. Gergonne’s 1815 paper on the design and analysis of polynomial regression experiments. Hist. Math. 1974, 1, 431–439. [Google Scholar] [CrossRef]
- Stanton, J.M. Galton, Pearson, and the peas: A brief history of linear regression for statistics instructors. J. Stat. Educ. 2001, 9, 1–12. [Google Scholar] [CrossRef]
- Bethlehem, J. The Rise of Survey Sampling; Statistics Netherlands: The Hague, The Netherlands, 2009; Available online: https://hdl.handle.net/11245/1.312955 (accessed on 22 August 2023).
- Box, G.E.P.; Jenkins, G.M. Time Series Analysis: Forecasting and Control; Holden-Day: San Francisco, CA, USA, 1970. [Google Scholar]
- Koza, J.R. Genetic programming as a means for programming computers by natural selection. Stat. Comput. 1994, 4, 87–112. [Google Scholar] [CrossRef]
- Schmidt, M.; Lipson, H. Distilling free-form natural laws from experimental data. Science 2009, 324, 81–85. [Google Scholar] [CrossRef]
- Brkić, D.; Ćojbašić, Ž. Intelligent flow friction estimation. Comput. Intell. Neurosci. 2016, 2016, 5242596. [Google Scholar] [CrossRef] [PubMed]
- Arnastauskaitė, J.; Ruzgas, T.; Bražėnas, M. A New Goodness of Fit Test for Multivariate Normality and Comparative Simulation Study. Mathematics 2021, 9, 3003. [Google Scholar] [CrossRef]
- González-Albornoz, P.; Novoa-Muñoz, F. Goodness-of-Fit Test for the Bivariate Hermite Distribution. Axioms 2023, 12, 7. [Google Scholar] [CrossRef]
- Di Noia, A.; Barabesi, L.; Marcheselli, M.; Pisani, C.; Pratelli, L. Goodness-of-fit test for count distributions with finite second moment. J. Nonparametric Stat. 2023, 35, 19–37. [Google Scholar] [CrossRef]
- Erlemann, R.; Lindqvist, B.H. Conditional Goodness-of-Fit Tests for Discrete Distributions. J. Stat. Theory Pract. 2022, 16, 8. [Google Scholar] [CrossRef]
- Guo, J.; Yang, Y.; Zhang, D.; Wu, W.; Yang, Z.; He, L. A general model for predicting apparent viscosity of crude oil or emulsion in laminar pipeline at high pressures. J. Pet. Sci. Eng. 2018, 160, 12–23. [Google Scholar] [CrossRef]
- Towfighi, S. Symbolic regression by uniform random global search. SN Appl. Sci. 2020, 2, 34. [Google Scholar] [CrossRef]
- Angelis, D.; Sofos, F.; Karakasidis, T.E. Artificial intelligence in physical sciences: Symbolic regression trends and perspectives. Arch. Computat. Methods. Eng. 2023, 30, 3845–3865. [Google Scholar] [CrossRef] [PubMed]
- Jin, Y.; Olhofer, M.; Sendhoff, B. A framework for evolutionary optimization with approximate fitness functions. IEEE Trans. Evol. Comput. 2002, 6, 481–494. [Google Scholar] [CrossRef]
- Luke, S. Two fast tree-creation algorithms for genetic programming. IEEE Trans. Evol. Comput. 2000, 4, 274–283. [Google Scholar] [CrossRef]
- Hassanat, A.; Almohammadi, K.; Alkafaween, E.; Abunawas, E.; Hammouri, A.; Prasath, V.B.S. Choosing mutation and crossover ratios for genetic algorithms—A review with a new dynamic approach. Information 2019, 10, 390. [Google Scholar] [CrossRef]
- Cranmer, M.; Sanchez Gonzalez, A.; Battaglia, P.; Xu, R.; Cranmer, K.; Spergel, D.; Ho, S. Discovering symbolic models from deep learning with inductive biases. Adv. Neural Inf. Process. Syst. 2020, 33, 17429–17442. [Google Scholar]
- Gholamy, A.; Kreinovich, V. How to use absolute-error-minimizing software to minimize relative error: Practitioner’s guide. Int. Math. Forum 2017, 12, 763–770. Available online: https://scholarworks.utep.edu/cs_techrep/1174/ (accessed on 11 May 2023). [CrossRef]
- Orzechowski, P.; La Cava, W.; Moore, J.H. Where are we now? A large benchmark study of recent symbolic regression methods. In Proceedings of the Genetic and Evolutionary Computation Conference, Kyoto, Japan, 15–19 July 2018; pp. 1183–1190. [Google Scholar] [CrossRef]
- Schmidt, M.; Lipson, H. Symbolic Regression of Implicit Equations. In Genetic Programming Theory and Practice VII; Genetic and Evolutionary Computation; Riolo, R., O’Reilly, U.M., McConaghy, T., Eds.; Springer: Boston, MA, USA, 2010. [Google Scholar] [CrossRef]
- Cranmer, M.D. Interpretable Machine Learning for the Physical Sciences. Ph.D. Thesis, Princeton University, Princeton, NJ, USA, 2023. Available online: http://arks.princeton.edu/ark:/88435/dsp01sn00b201q (accessed on 30 July 2023).
- Udrescu, S.M.; Tegmark, M. AI Feynman: A physics-inspired method for symbolic regression. Sci. Adv. 2020, 6, eaay2631. [Google Scholar] [CrossRef] [PubMed]
- Vaddireddy, H. Data Driven Symbolic Regression. Available online: https://github.com/sayin/Data_Driven_Symbolic_Regression (accessed on 8 June 2023).
- Abramovich, S. Using Wolfram Alpha with Elementary Teacher Candidates: From More Than One Correct Answer to More Than One Correct Solution. Mathematics 2021, 9, 2112. [Google Scholar] [CrossRef]
- Lamont, P.A. Common pipe flow formulas compared with the theory of roughness. J.-Am. Water Work. Assoc. 1981, 73, 274–280. [Google Scholar] [CrossRef]
- Zhao, Q.; Wu, W.; Simpson, A.R.; Willis, A. Simpler Is Better—Calibration of Pipe Roughness in Water Distribution Systems. Water 2022, 14, 3276. [Google Scholar] [CrossRef]
- Muzzo, L.E.; Matoba, G.K.; Ribeiro, L.F. Uncertainty of pipe flow friction factor equations. Mech. Res. Commun. 2021, 116, 103764. [Google Scholar] [CrossRef]
- Sharp, W.W.; Walski, T.M. Predicting internal roughness in water mains. J.-Am. Water Work. Assoc. 1988, 80, 34–40. [Google Scholar] [CrossRef]
- Brkić, D. Can pipes be actually really that smooth? Int. J. Refrig. 2012, 35, 209–215. [Google Scholar] [CrossRef]
- Basse, N.T. Turbulence intensity and the friction factor for smooth- and rough-wall pipe flow. Fluids 2017, 2, 30. [Google Scholar] [CrossRef]
- Brownlie, W.R. Re-examination of Nikuradse roughness data. J. Hydraul. Div. 1981, 107, 115–119. [Google Scholar] [CrossRef]
- Yen, B.C. Dimensionally homogeneous Manning’s formula. J. Hydraul. Eng. 1992, 118, 1326–1332. [Google Scholar] [CrossRef]
- Diskin, M.H. The limits of applicability of the Hazen-Williams formula. Houille Blanche 1960, 46, 720–726. [Google Scholar] [CrossRef]
- Aiyesimoju, K.O. Accurate, explicit pipe sizing formula for turbulent flows. J. Sci. Technol. 2009, 29, 147–152. [Google Scholar] [CrossRef]
- Huang, S. Reading the Moody chart with a linear interpolation method. Sci. Rep. 2022, 12, 6587. [Google Scholar] [CrossRef]
- Yıldırım, G. Computer-based analysis of explicit approximations to the implicit Colebrook–White equation in turbulent flow friction factor calculation. Adv. Eng. Softw. 2009, 40, 1183–1190. [Google Scholar] [CrossRef]
- Zeghadnia, L.; Robert, J.L.; Achour, B. Explicit solutions for turbulent flow friction factor: A review, assessment and approaches classification. Ain Shams Eng. J. 2019, 10, 243–252. [Google Scholar] [CrossRef]
- Praks, P.; Brkić, D. Symbolic regression-based genetic approximations of the Colebrook equation for flow friction. Water 2018, 10, 1175. [Google Scholar] [CrossRef]
- Hayes, B. Why W? Am. Sci. 2005, 93, 104–108. Available online: https://www.americanscientist.org/article/why-w (accessed on 30 July 2023). [CrossRef]
- ISO 6708:1995—Pipework Components—Definition and Selection of DN (Nominal Size). Available online: https://www.iso.org/standard/21274.html (accessed on 28 May 2023).
- Moran, S. Pump sizing: Bridging the gap between theory and practice. Chem. Eng. Prog. 2016, 112, 38–44. Available online: https://www.aiche.org/sites/default/files/cep/20161238_r.pdf (accessed on 28 May 2023).
- Praks, P.; Brkić, D. Approximate flow friction factor: Estimation of the accuracy using Sobol’s quasi-random sampling. Axioms 2022, 11, 36. [Google Scholar] [CrossRef]
- Vaddireddy, H.; Rasheed, A.; Staples, A.E.; San, O. Feature engineering and symbolic regression methods for detecting hidden physics from sparse sensor observation data. Physics of Fluids 2020, 32, 015113. [Google Scholar] [CrossRef]
- Guimerà, R.; Reichardt, I.; Aguilar-Mogas, A.; Massucci, F.A.; Miranda, M.; Pallarès, J.; Sales-Pardo, M. A Bayesian machine scientist to aid in the solution of challenging scientific problems. Sci. Adv. 2020, 6, eaav6971. [Google Scholar] [CrossRef] [PubMed]
- Saltelli, A.; Aleksankina, K.; Becker, W.; Fennell, P.; Ferretti, F.; Holst, N.; Li, S.; Wu, Q. Why so many published sensitivity analyses are false: A systematic review of sensitivity analysis practices. Environ. Model. Softw. 2019, 114, 29–39. [Google Scholar] [CrossRef]
- Biberg, D. Fast and accurate approximations for the Colebrook equation. J. Fluids Eng. 2017, 139, 031401. [Google Scholar] [CrossRef]
- Ruzicka, M.C. On dimensionless numbers. Chem. Eng. Res. Des. 2008, 86, 835–868. [Google Scholar] [CrossRef]
- Polverino, P.; Bove, G.; Sorrentino, M.; Pianese, C.; Beretta, D. Advancements on scaling-up simulation of Proton Exchange Membrane Fuel Cells impedance through Buckingham Pi theorem. Appl. Energy 2019, 249, 245–252. [Google Scholar] [CrossRef]
- Rendón-Castrillón, L.; Ramírez-Carmona, M.; Ocampo-López, C.; Gómez-Arroyave, L. Mathematical model for scaling up bioprocesses using experiment design combined with Buckingham Pi theorem. Appl. Sci. 2021, 11, 11338. [Google Scholar] [CrossRef]
Figure 1.
Examples of (a) mutation and (b) crossover.
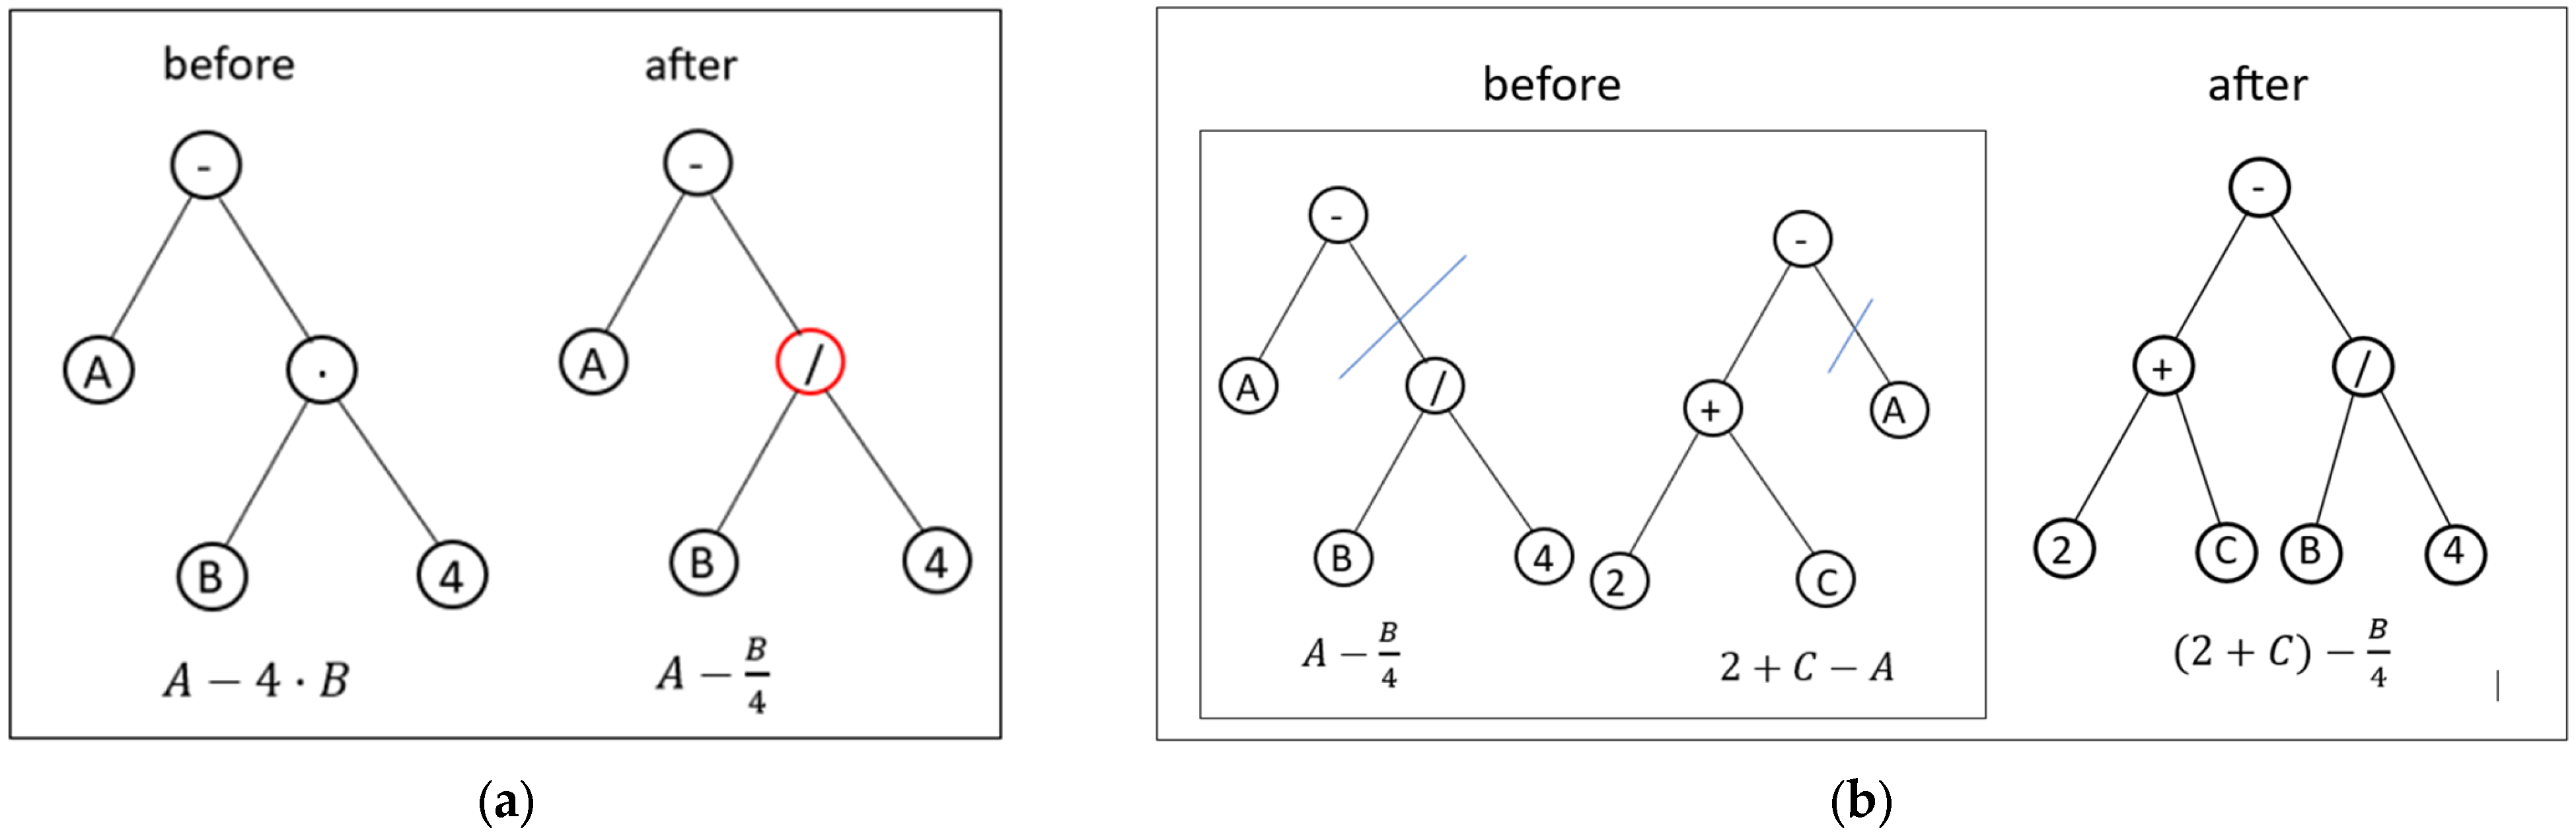
Figure 2.
The absolute relative error of Equation (11) (presented as a percentage at z-axis) as a function of Reynolds number (x-axis) and relative roughness (y-axis).
Figure 2.
The absolute relative error of Equation (11) (presented as a percentage at z-axis) as a function of Reynolds number (x-axis) and relative roughness (y-axis).

Table 1.
Minimal and maximal values for the parameters used for hydraulic calculation and pipe sizing.
Table 1.
Minimal and maximal values for the parameters used for hydraulic calculation and pipe sizing.
| Flow | Diameter | Hydraulic Slope | Kinematic Viscosity of Water | Absolute Roughness | Relative Roughness | |
|---|---|---|---|---|---|---|
| Q (m3/s) | D (m) | Δh/L (-) | ν (m2/s) | (m) | (-) | |
| Min | 0.001 | 0.01 | 0.0001 | 3.1 × 10⁻⁷ | 1.5 × 10⁻⁶ | 3 × 10⁻⁷ |
| Max | 100 | 5 | 0.1 | 1.5 × 10⁻⁶ | 9.1 × 10⁻³ | 5 × 10⁻² |
Disclaimer/Publisher’s Note: The statements, opinions and data contained in all publications are solely those of the individual author(s) and contributor(s) and not of MDPI and/or the editor(s). MDPI and/or the editor(s) disclaim responsibility for any injury to people or property resulting from any ideas, methods, instructions or products referred to in the content. |
© 2023 by the authors. Licensee MDPI, Basel, Switzerland. This article is an open access article distributed under the terms and conditions of the Creative Commons Attribution (CC BY) license (https://creativecommons.org/licenses/by/4.0/).
Share and Cite
MDPI and ACS Style
Brkić, D.; Praks, P.; Praksová, R.; Kozubek, T. Symbolic Regression Approaches for the Direct Calculation of Pipe Diameter. Axioms 2023, 12, 850. https://doi.org/10.3390/axioms12090850
AMA Style
Brkić D, Praks P, Praksová R, Kozubek T. Symbolic Regression Approaches for the Direct Calculation of Pipe Diameter. Axioms. 2023; 12(9):850. https://doi.org/10.3390/axioms12090850
Chicago/Turabian StyleBrkić, Dejan, Pavel Praks, Renáta Praksová, and Tomáš Kozubek. 2023. "Symbolic Regression Approaches for the Direct Calculation of Pipe Diameter" Axioms 12, no. 9: 850. https://doi.org/10.3390/axioms12090850
Note that from the first issue of 2016, this journal uses article numbers instead of page numbers. See further details here.