1. Introduction
The Performance Evaluation Matrix (PEM) is an outstanding evaluation and improvement tool for various service operating systems [
1,
2,
3,
4]. Many papers have been devoted to conducting research into the PEM, aiming to evaluate the performance of various service operating systems and determine whether they have reached the required level [
5,
6,
7]. The PEM method, mainly based on the service items provided by the service operating systems and then designed into questionnaire scales, can be employed to investigate customers’ or users’ satisfaction and importance for each service item as well as to set the Satisfaction Index and the Importance Index [
8,
9,
10].
Additionally, a few studies have used confidence intervals of indicators to create evaluation coordinate points of the Satisfaction Index and the Importance Index for each service item [
11,
12]. Observing where the evaluation coordinate points of all service items are located in the service quality zones of PEM can help determine which service item needs improvement or whether resource transfer is required [
13,
14]. The service item that falls into the service quality improvement zone has high customer importance and low customer satisfaction, so it needs improvement. The service item that falls into the service quality maintenance zone has equal customer importance and satisfaction, so it needs maintenance. The service item that falls into the resource transfer zone has low customer importance and high customer satisfaction, showing that customers are fully satisfied with the service item, but its importance is not high; therefore, this item must be reviewed, and a resource transfer must be considered to increase the overall satisfaction of the entire service operating system [
15,
16].
Yu et al. [
17] have indicated that the above-mentioned method of performance evaluation may fail to identify improvement points due to customers’ different cultures and mindsets. With the spirit of continuous improvement and total quality management, PEM is divided into four quadrants by the average values of the Satisfaction Index and the Importance Index. Service items in quadrants 2 and 4, in principle, are those whose values are lower than the average as well as the items which require improvement. It seems that the evaluation is directly conducted by statistics calculated from the sample data, but the evaluation method has taken sampling errors into account. To solve the problem of sampling errors, some studies have also made statistical inferences through the confidence intervals of the above two indices [
11,
12]. However, considering cost and effectiveness, Chen and Yu [
18] have suggested that the number of samples is usually not too large in practice for making decisions quickly and accurately in a short time, thereby affecting the accuracy of statistical inferences. Obviously, sampling errors, assessment accuracy, and limited resources are issues that need to be considered and solved in the development of PEM. Aiming to solve the problem concerning the maintenance of evaluation accuracy in the case of small samples, this study, based on Chen and Yu [
18] and the confidence interval proposed by some studies [
11,
12,
19], develops a complete fuzzy testing method to evaluate which service item needs improvement. Meanwhile, when resources are limited, this method helps decide which service item should be a top priority for improvement. Next, following the fuzzy testing rules, this study derives the fuzzy decision-making value for satisfaction improvement and the fuzzy decision-making value for improvement priority of importance, so as to facilitate managers’ decision-making [
18,
19].
In the PEM method, first, based on the service system which needs to be evaluated, we need to design a corresponding questionnaire and corresponding questions which are called service items by this study. In order not to lose generality, this study, like other studies, assumes that the number of service items provided by the service system is
k; then
k questions are designed to conduct a survey targeted at learners about satisfaction and importance for
k service items [
20].
Lin et al. [
19] let random variable
represent the
hth service item of satisfaction, then random variable
is distributed as a Beta distribution with the first parameter
and the second parameter
, denoted by
,
h 1, 2, …,
k. Furthermore, let random variable
indicate the
hth service item of importance, then random variable
is distributed with the first parameter
and the second parameter
, denoted by
; the Beta distribution, denoted by
, is also displayed. Thus, these two indices can be shown as follows:
For the convenience of explanation, according to the characteristics of the Beta distribution, we set the level of satisfaction higher than 50% as high satisfaction and the level of satisfaction lower than 50% as low satisfaction. When , we have , and then we make the conclusion , showing that the level of high satisfaction is equal to the level of low satisfaction. When , we have , and then we make the conclusion ; at this time, the level of high satisfaction is higher than that of low satisfaction. When , we have and then we make the conclusion , meaning that the level of high satisfaction is lower than that of low satisfaction. When the value of Satisfaction Index is lower, the level of high satisfaction is also lower. In addition, the Importance Index has the same property as the Satisfaction Index. The higher the value of Importance Index , the higher the level of high importance. Similarly, as the value of Importance Index is lower, the level of high importance is lower as well.
Obviously, Satisfaction Index and Importance Index are two important elements of the performance evaluation matrix. The purpose of this paper is to use the unilateral confidence intervals of these two important indicators to conduct a fuzzy test, so that the fuzzy evaluation criteria of the performance evaluation matrix can be developed. Next, according to the suggestion made by Lin et al. [
19], a fuzzy performance evaluation chart is created to assist businesses with their managment and decision-making.
The remainder of this paper is organized as follows. In
Section 2, we derive the 100
% confidence interval of Satisfaction Index and develop its fuzzy evaluation rules. In
Section 3, we derive the 100
% confidence interval of Importance Index and make its fuzzy evaluation rules. In
Section 4, we use a case study to illustrate an application of the model proposed by this study, demonstrating how to identify service items requiring improvement as well as how to prioritize them for improvement as resources are limited. In
Section 5, conclusions, research limitations, and future research directions are presented and explored.
2. Fuzzy Evaluation Rules for Satisfaction Index
As mentioned earlier, this study, built on existing literature, assumes that both distributions of customer satisfaction and importance follow the Beta distribution [
19]. Let
be the sample data of customer satisfaction for Service Item
h with a size of
n, where
h 1, 2,…,
k. Then, the unbiased estimator of Satisfaction Index
is expressed as follows:
The expected value of the unbiased estimator
is equal to
, denoted by
. Let random variable
be defined as follows:
where
is the sample standard deviation, given by:
Plenty of studies have revealed that the fuzzy test method based on the confidence interval must be able to derive the two-tailed confidence interval of the indicator, so that the subsequent fuzzy testing procedure can be completed [
11,
12,
17,
18]. Accordingly, if the two-tailed confidence interval of the indicator cannot be derived, then it must be completed by the Central Limit Theorem. Nevertheless, when the sample size is not large enough, it will lead to larger sampling errors. Considering the customer satisfaction questionnaire survey, the sample size is relatively large. Thus, in this paper, on the basis of the Central Limit Theorem, the distribution of random variable
approximates the standard normal distribution for large sample size
n [
21], expressed as follows:
Based on the above-mentioned, we have
, where
is the upper
quantile of the standard normal distribution. As noted by Lin et al. [
19], Satisfaction Index
is set as the
x-axis to form the PEM. Let
be the observed value of
. Then
is the observed value of
, written as follows:
The average of
is expressed as follows:
According to Yu et al. [
17], when the value of Satisfaction Index for Service Item
h is lower than the average value (
), then Service Item
h must be improved. The hypotheses of the statistical test for the Satisfaction Index of Service Item
h are written as follows:
The significance level of the test is
and the critical region can be defined as
. Therefore, the critical value of
is determined by
where
is the observed value of
, written as follows:
Thus, the critical value is denoted by
. Obviously, we have
. Let the observed value of
be
. Then
Thus, we can replace
with
as the testing statistic and replace
with
as the critical value. The
of the quasi-triangular fuzzy number
is expressed as follows:
Obviously, when
, then
and
. The fuzzy number is
. In fact, the fuzzy evaluation technique proposed by this study based on the atypical fuzzy evaluation method suggested by Buckley [
22] belongs to the type-2 of fuzzy sets [
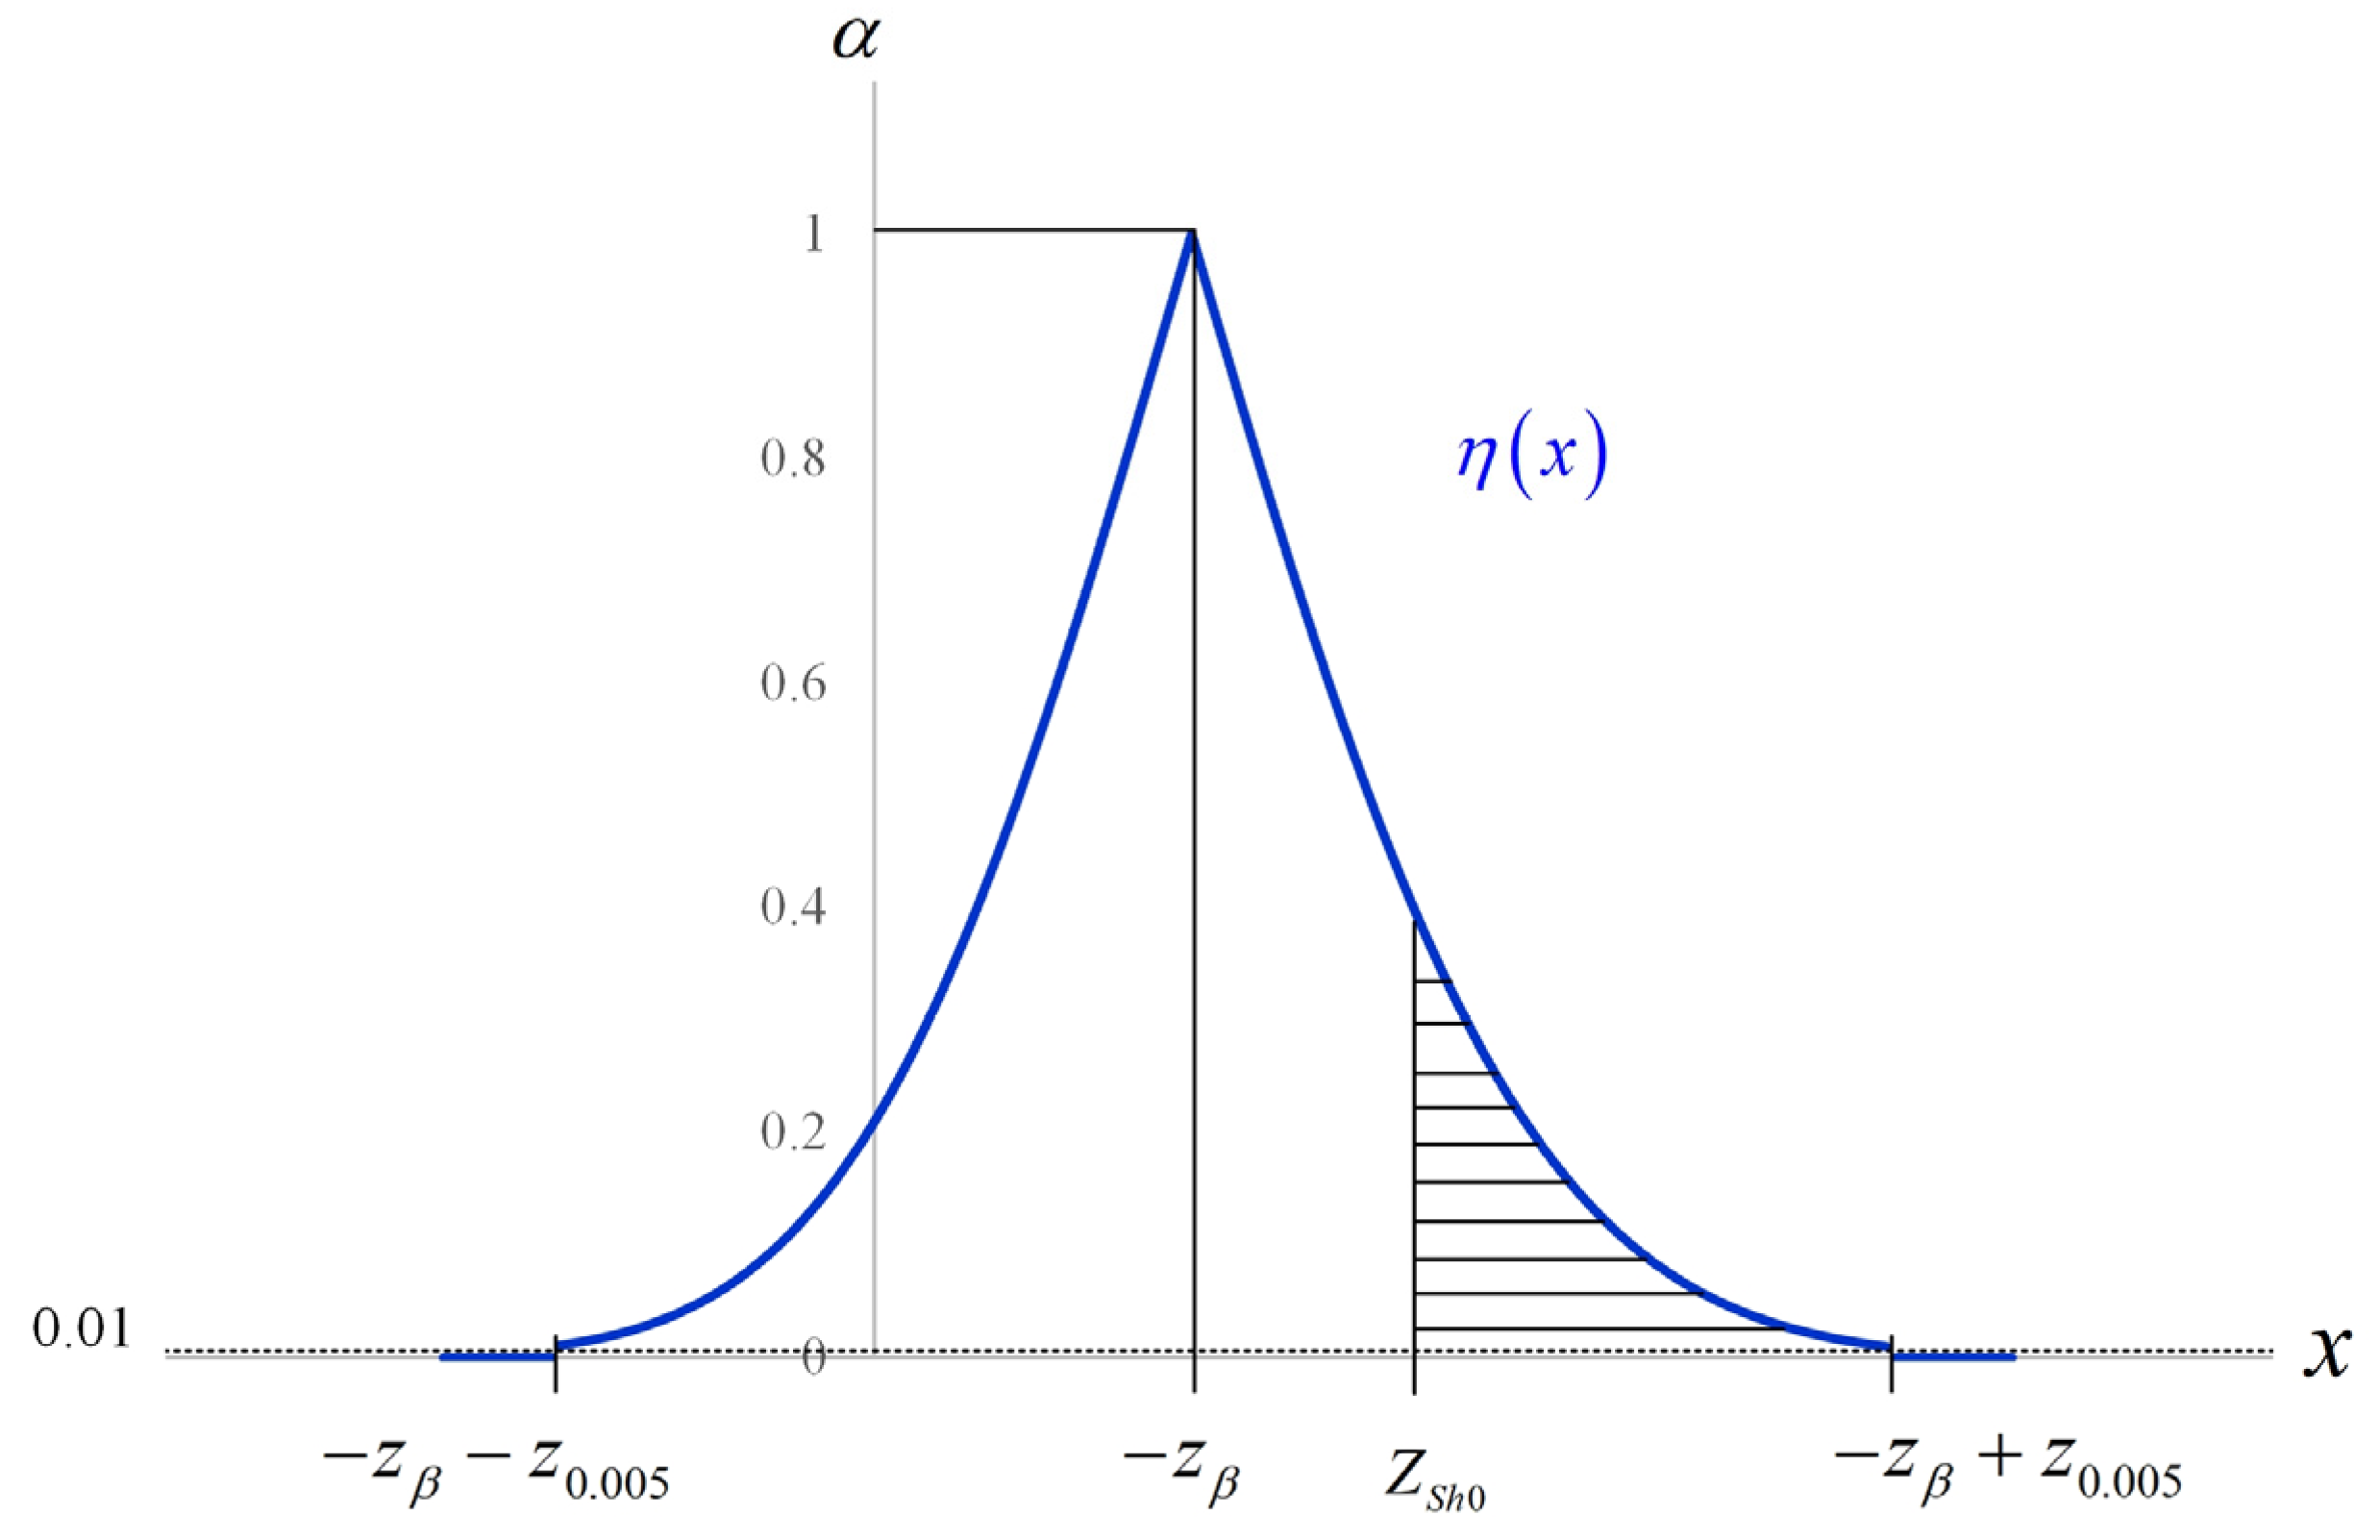
23]. A quasi-triangular fuzzy membership function is mainly constructed by the two-tailed confidence interval of the parameters that need to be evaluated. The quasi- triangular fuzzy membership function of
is as follows:
Based on Equation (15), membership function
with the vertical line of
is depicted in
Figure 1.
Based on the concept of Yu et al. [
24], let
and
. Then
is expressed as follows:
Let the decision value be
, such that
According to Chen et al. [
25], we let 0
0.5, and the decision rules of the fuzzy two-tailed testing model are listed below:
- (1)
If , then . Therefore, we reject and draw the conclusion . Thus, Service Item h needs to be improved.
- (2)
If , then . Thus, we do not reject and draw the conclusion . Thus, Service Item h does not need to be improved.
3. Fuzzy Evaluation Rules for Importance Index
Let
be the sample data of customer importance for Service Item
h with a size of
n, where
h 1, 2,…,
k. Then, the unbiased estimator of Important Index
is defined below:
The expected value of unbiased estimator
, equal to
, is denoted by
. Let random variable
be defined as:
where
is the sample standard deviation, written as:
According to the Central Limit Theorem, the distribution of the random variable
approximates the standard normal distribution, expressed as follows:
Based on the above-mentioned, we have
. Similarly, the Important Index
is set as the
y-axis to form the PEM. Let
be the observed value of
. Then
is the observed value of
, expressed as follows:
Then, the average of
is defined as follows:
According to Yu et al. [
17], when the Importance Index of Service Item
h is smaller than the average value (
), the improvement priority of Service Item
h is low. On the contrary, when the Importance Index of Service Item
h is greater than the average value (
), the improvement priority of Service Item
h is high. Then, the hypotheses of the statistical test for Important Index
h are written as follows:
The significance level of the test is
, and the critical region is defined as
, where
is determined by
Therefore, the critical value is written as
. Obviously,
. Let the observed value of
be
, written as follows:
where
is the observed value of
as follows:
Thus, we can then replace
with
as the testing statistic and replace
with
as the critical value. The
of the triangular fuzzy number
is
As noted by Chen and Yu [
18], when
, then
. Therefore, the fuzzy number is
, and the membership function of
is
Following Equation (31), the diagram of membership function
with the vertical line
of is presented in
Figure 2.
According to Yu et al. [
24], let
and
. Then
is defined as follows:
On the basis of the study of Chen et al. [
25], we let 0
0.5, and the decision-making rules of the fuzzy two-tailed testing model are displayed below:
- (1)
If , then . Therefore, we reject and draw the conclusion . Consequently, Service Item h has a high priority for improvement.
- (2)
If , then . Therefore, we do not reject and draw the conclusion . Consequently, Service Item h has a low priority for improvement.
4. An Application Example
In order to explain the application of the above model, this paper adopted a foreign language teaching satisfaction questionnaire made by Yu et al. [
26], including five dimensions to reflect the services provided by foreign language teaching. Among them, Dimension 1 is Teaching Preparation, containing 4 teaching service items; Dimension 2 is Teaching Attitude, including 5 teaching service items; Dimension 3 is Teaching Capability, containing 2 teaching service items; Dimension 4 is Teaching Management, containing 3 teaching service items; finally, Dimension 5 is Coursework and Evaluation, containing 2 teaching service items. These five dimensions include a total of 16 question items, and each question item has two subquestions about importance and satisfaction. Therefore, the entire questionnaire has a total of 32 questions that need to be answered. A total of 16 questions (
k = 16) in these 5 dimensions are depicted as follows:
Dimension 1: Teaching Preparation
The course material that the teacher has prepared is at an adequate level of complexity (X1, Y1).
The quantity of the material is appropriate (X2, Y2).
The content of the material helps improve my foreign language proficiency (X3, Y3).
The teacher has prepared thoroughly for the class (X4, Y4).
Dimension 2: Teaching Attitude
- 5.
The teacher emphasizes conversation practice in a foreign language (X5, Y5).
- 6.
The teacher values the opinions of students (X6, Y6).
- 7.
Student-teacher interaction in class is intensive (X7, Y7).
- 8.
The teacher is happy to help students solve problems (X8, Y8).
- 9.
The teacher treats all students fairly (X9, Y9).
Dimension 3: Teaching Capability
- 10.
The teacher speaks the foreign language clearly (X10, Y10).
- 11.
The teacher expresses himself/herself logically (X11, Y11).
Dimension 4: Teaching Management
- 12.
The teacher uses a variety of teaching methods (X12, Y12).
- 13.
The teacher interests me in learning the foreign language (X13, Y13).
- 14.
The teacher adequately controls the pace of teaching (X14, Y14).
Dimension 5: Coursework and Evaluation
- 15.
The coursework or evaluation helps me improve my foreign language proficiency (X15, Y15).
- 16.
Evaluation is at an adequate level of complexity (X16, Y16).
As mentioned above, the performance of running foreign language learning curriculums is the foundation for students who intend to increase their foreign language proficiency since foreign language proficiency is often one of the key indicators for recruitment in the corporate world [
27,
28,
29]. It can not only help students improve their learning efficiency in other professional subjects but also enhance their competitiveness for more advanced studies or employment. Therefore, foreign language learning curriculums are listed in important teaching enhancement plans promoted by various universities [
26].
Based on the above-mentioned 16 questions in the foreign language teaching satisfaction questionnaire, a total of 350 copies of questionnaire were given to students in the case-study school and returned on the spot; in total, 324 copies of questionnaire were collected, yielding a response rate of 92.5%.
First, we calculate observed values
and
for each service item according to Equations (7) and (12). Following Equation (8), we calculate the average of
as follows:
Therefore, the hypotheses of the fuzzy test for Satisfaction Index
h are written as follows:
This study sets the significance level
as 0.05, then the membership function
with significance level
0.05 is expressed as follows:
Let
0.4. Then the decision value is
0.6
2.576
1.645
0.10. Following Equation (15), the values of
for all service items are calculated and shown in
Table 1.
Similar to the Satisfaction Index, we calculate observed values
and
for each service item according to Equations (23) and (29). Following Equation (24), we calculate the average of
as follows:
Therefore, the hypotheses of the fuzzy test for Important Index of Service Item
h are written as follows:
This study sets the significance level
as 0.05 and
0.4, then the decision value is
0.6
2.576
1.645
0.10. According to Equation (28), the values of
for all service items are calculated and displayed in
Table 2.
In the fuzzy improvement decision table for satisfaction of service items, the five service items requiring improvement are as follows: “The teacher has prepared thoroughly for the class” (Item 4), “The teacher values the opinions of students” (Item 6), “The teacher is happy to help students solve problems” (Item 8), “The teacher interests me in learning a foreign language” (Item 13), and “The teacher adequately controls the pace of teaching” (Item 14). In the fuzzy decision list of improvement prioritization, improvement priority of Service Items 4, 8, and 13 is low, whereas that of Service Items 6 and 14 is high. Improvement involves various concerns, such as the cost of hiring high-quality teachers, teaching training time and methods, expenses related to formulating various reward and punishment systems, and other associated costs. Consequently, it is recommended that Service Items 6 and 14 should be listed in as the top priority for improvement within the constraints of limited resources and time to enhance the effectiveness of improvement efforts.
As highlighted by a number of studies, the fuzzy test based on the confidence interval tends to be more practical than the statistical test in real-world scenarios [
11,
12]. The value of
for Service Item 13 is
0.11 in the above-mentioned case, which exceeds the critical value
. Had the statistical test been employed, then null hypothesis would not have been rejected, potentially leading us to miss opportunities for improvement. Furthermore, this model takes the prioritization of service item improvements into account, offering a basis for decision making when resources are limited. Lastly, with standardized decision-making values and critical values, compared with other existing methods based on fuzzy tests and confidence intervals, this model is more convenient for decision makers [
30,
31].
5. Conclusions, Research Limitations and Future Research
The performance evaluation matrix can evaluate all service items of the service operating system simultaneously. The Importance Index and Satisfaction Index of the service items serve as two significant evaluation indicators of the performance evaluation matrix. To cater to enterprises’ needs for rapid decision-making, this paper initially derived the expected value and standard deviation of the Satisfaction Index estimation formula and set the random variable equal to the standardized statistic of Satisfaction Index for Service Item h. According to the Central Limit Theorem, followed the standard normal distribution, and then the lower quantile of the standard normal distribution was used as the critical value to establish the fuzzy test of the Satisfaction Index. Given the complexity of the fuzzy test, this paper obtained the fuzzy critical value following the fuzzy testing rules. Managers only need to compare the value and fuzzy critical value of Service Item h to make decisions on whether to make improvements. Subsequently, this paper derived the expected value and standard deviation of the Important Index estimate and set the random variable equal to the standardized statistic of the Important Index. Similarly, following the Central Limit Theorem, also followed the standard normal distribution, and then the fuzzy test of the Important Index was established using the upper quantile of the standard normal distribution as the critical value. Since the fuzzy test was relatively complex, this paper received the fuzzy critical value following the fuzzy testing rules. Managers only need to compare the values of and for each service item to determine whether the service item should be prioritized for improvement. In fact, the fuzzy evaluation model proposed in this paper can maintain evaluation accuracy in cases of small samples by incorporating past accumulated data experience. In addition, the fuzzy critical value can be derived by the fuzzy testing rules, and the decision-making rules can be established by the fuzzy critical value, which can facilitate industrial applications.
The fuzzy evaluation model presented in this paper is built on the confidence intervals of indices. Moreover, its importance lies in its ability to integrate past accumulated data and experts’ experiences to make the evaluation more authentic in practical settings [
18,
24]. However, this study has its limitations, including insufficient accumulation of past data and immature analysis techniques for experts’ experiences. In future research, we can focus on the management’s need for sophisticated techniques of data analysis as well as develop analysis and decision-making models based on the accumulated data. Additionally, the method proposed in this paper must be capable of deriving the two-tailed confidence interval of the indicator to complete the subsequent fuzzy testing process. If the two-tailed confidence interval of the indicator cannot be obtained, it may require a larger sample size and application of the Central Limit Theorem to reduce sampling errors caused by insufficient sample size. Therefore, future research could also explore the incorporation of other decision-making methods, such as the Multi-Criteria Decision-Making Fuzzy Methods proposed by Al-shami and Mhemdi [
32].


 and
and 

