Article

A Study on the Cavitation and Pressure Pulsation Characteristics in the Impeller of an LNG Submerged Pump

1
National Research Center of Pumps, Jiangsu University, Zhenjiang 212013, China
2
Institute of Fluid Engineering Equipment Technology, Jiangsu University, Zhenjiang 212009, China
3
College of Mechanical Engineering, Nantong University, Nantong 226019, China
4
Department of Mechanical Engineering & Materials Science, Washington University in St. Louis, St. Louis, MO 63130, USA
5
College of Hydraulic Science and Engineering, Yangzhou University, Yangzhou 225009, China
*
Author to whom correspondence should be addressed.
Machines 2022, 10(1), 14; https://doi.org/10.3390/machines10010014
Submission received: 11 November 2021 / Revised: 14 December 2021 / Accepted: 21 December 2021 / Published: 24 December 2021
(This article belongs to the Special Issue Optimization and Flow Characteristics in Advanced Fluid Machinery)

Abstract

:
Based on CFD analysis technology, this paper studies the cavitation performance of an LNG submerged pump and the pressure pulsation characteristics under cavitation excitation. The variation laws of the waveform, amplitude and frequency of the pressure pulsation in the impeller of the LNG submerged pump under different flow rates and NPSHa are also analysed. By calculating the root mean square of the pressure coefficient of the low-frequency pulsation, the influence of the aggravation process of cavitation on the low-frequency pulsation in the LNG submerged pump is quantitatively analysed, and the characteristics of the pressure pulsation in the LNG submerged pump under the cavitation condition are revealed. The results show that with the increase in flow rate, the pressure pulsation in the impeller becomes stronger, periodically, and the amplitude decreases. The influence of cavitation on the pressure pulsation in the primary impeller is greater than that in the secondary impeller. When critical cavitation occurs, the low-frequency signal amplitude of pressure pulsation in the primary impeller increases and exceeds the blade frequency, becoming the main frequency.

1. Introduction

As the core power transmission equipment of the LNG transmission industry chain, the LNG submerged pump’s performance affects the pump’s service life and affects the safety and economy of the LNG station. Due to the low temperature and flammable characteristics of the LNG, the submersible pump should be able to withstand the efficient operation performance at low temperatures and have higher requirements for the airtightness and reliability of the pump. Therefore, it is important to develop the key design technology of high-efficiency LNG submerged pumps, master the cavitation characteristics and pressure pulsation characteristics under cavitation conditions, and solve the key scientific problems in the process of developing LNG storage tank technology and auxiliary device design technology for the effective utilisation of natural gas resources and alleviating the energy crisis.
Cavitation occurs when the liquid pressure is less than the saturation pressure at the corresponding temperature. The liquid changes to gas and destroys the flow passage parts to varying degrees [1]. Since the low-temperature medium LNG transported by the LNG submerged pump is often saturated, the low-temperature medium LNG is very easy to vaporise [2]. Cavitation will cause cavitation damage to the surface of overflow parts and cause the vibration and noise of the pump. When the cavitation range becomes larger, the performance parameters of the pump will be seriously reduced. Rayleigh takes spherical symmetric cavitation as the research object and puts forward the famous Rayleigh equation [3]. Plesset et al. [4,5] considered that the effects of gas, fluid viscosity and surface tension contained in the cavitation improved the cavitation dynamics theory and formed the Rayleigh Plesset equation. The derived cavitation models of Singhal, Kunz and Merkle have been integrated into commercial software, such as fluent, CFX and Pumplinx, which provides a theoretical and technical basis for the research of cavitation numerical simulation [6]. Therefore, it is a trend to predict the cavitation region and evolution process using the hydrodynamic method based on CFD technology. In order to improve the accuracy of the calculation results and better predict the occurrence and evolution of cavitation, some scholars have tried to modify the cavitation model in numerical calculations [7,8,9,10,11,12,13].
Jun Li et al. [14] used the improved cavitation model coupled with RANS equation solving technology to simulate the internal flow of the centrifugal pump, and studied the effect on the shape of the cavitation bubbles attached to the surface centrifugal pump blades with the change of the cavitation coefficient. Yong Wang [15], Rakibuzhaman [16] and others analysed the centrifugal pump’s three-dimensional turbulent cavitation flow field using the steady numerical simulation method and the two-phase flow mixing model, which improved the accuracy of the numerical simulation. Jian Wang et al. [17] studied the cavitation phenomenon of centrifugal pumps at room temperature, improved the cavitation model on this basis, and put forward the prediction method of centrifugal pump cavitation according to the research results. Huili Jiang [18], Naijian Liao [19], Dongping Shen [20] and Wei Li [21,22] analysed the cavitation performance of engine cooling water pumps, discussed the causes of the cavitation of engine cooling water pumps under different working conditions and put forward measures to improve the cavitation performance of the automobile engine and cooling system of the water pump.
Compared with high-temperature cavitation, there are few numerical studies on low-temperature cavitation, at this stage. Hucan Hou et al. [23] used Reynold’s stress turbulence equation and energy equation model to simulate the LNG submersible pump and evaluated its energy consumption using local entropy production. Haitao Cao [24] simulated hydrofoil cavitation using liquid hydrogen as a medium and the two-dimensional axisymmetric steady numerical simulation method. Then, the influence of flow field parameters, such as temperature and pressure on the cavitation performance, was analysed. Xiangfu Ma [25] and Hord [26] studied the cavitation characteristics of a two-dimensional hydrofoil and symmetrical rotating bodies in different liquid nitrogen and liquid hydrogen media. Franc et al. [27,28] experimentally studied the cavitation phenomenon of inducers under thermodynamic effect with low-temperature R-114 and low-temperature water as a flow medium. Gustavsson et al. [29] studied the cavitation flow characteristics of NACA0015 airfoils at different speeds and angles of attack in fluoroketone.
Scholars at home and abroad have carried out extensive research on the pressure pulsation induced by dynamic and static interference in centrifugal pumps. Guo S.J. et al. [30] studied the centrifugal pump with a guide vane structure, collected the pressure pulsation signal by arranging pressure pulsation sensors in the impeller and guide vane channel, analysed the pressure pulsation spectrum characteristics at different positions under different working conditions and systematically and comprehensively revealed the dynamic and static interference excitation characteristics. Parrondo J.W. et al. [31] studied the pressure pulsation of a centrifugal pump under different working conditions by numerical calculation. Through the analysis of the calculation results, the frequency spectrum characteristics of the pressure pulsation were obtained, and the circumferential distribution characteristics of the pressure pulsation with an amplitude near the blade frequency under different working conditions were predicted. Jianping Yuan et al. [32] analysed the flow in the centrifugal pump, based on the unsteady numerical calculation method of large eddy simulation. The results show that the pressure pulsation changes periodically, due to the dynamic and static interference between the impeller and the guide vane. The amplitude at the blade frequency is the largest and becomes the main frequency of the pressure pulsation spectrum. Fujun Wang et al. [33] pointed out that the blade frequency of hydraulic machinery plays a dominant role in the pressure fluctuation spectrum, through the large eddy simulation method. Compared with the pressure pulsation induced by dynamic and static interference, few reports on the pressure pulsation were induced by cavitation. Yongyan Ni et al. [34] used pressure mean square deviation to describe the pulsation characteristics of outlet pressure and analysed the relationship between NPSHa and outlet pressure pulsation through experiments. Ning Zhang [35] studied the cavitation excitation characteristics of centrifugal pumps and considered that cavitation-induced vibration and noise can be an effective criterion for cavitation monitoring. Cheng et al. [36] summarise the research progress of cavitation, including numerical methods, cavitation characteristics, the influence of cavitation on flow field and cavitation control strategies, and some frontier topics are suggested, which is of great significance to promote the research of cavitation and deepen the understanding of cavitation.
In previous studies, there has been little research on the low-temperature cavitation performance of the submersible pump. In this paper, the cavitation performance and cavitation-induced pressure pulsation characteristics of an LNG submerged pump are analysed based on the numerical calculation method. By understanding the influence of the cavitation on low-frequency pulsation and radial force in LNG submersible pumps, building the internal relationship between the cavitation performance and pressure fluctuation characteristics, the present study provides a theoretical basis for the cavitation monitoring of an LNG submersible pump.

2. Simulation Model

2.1. Computational Model
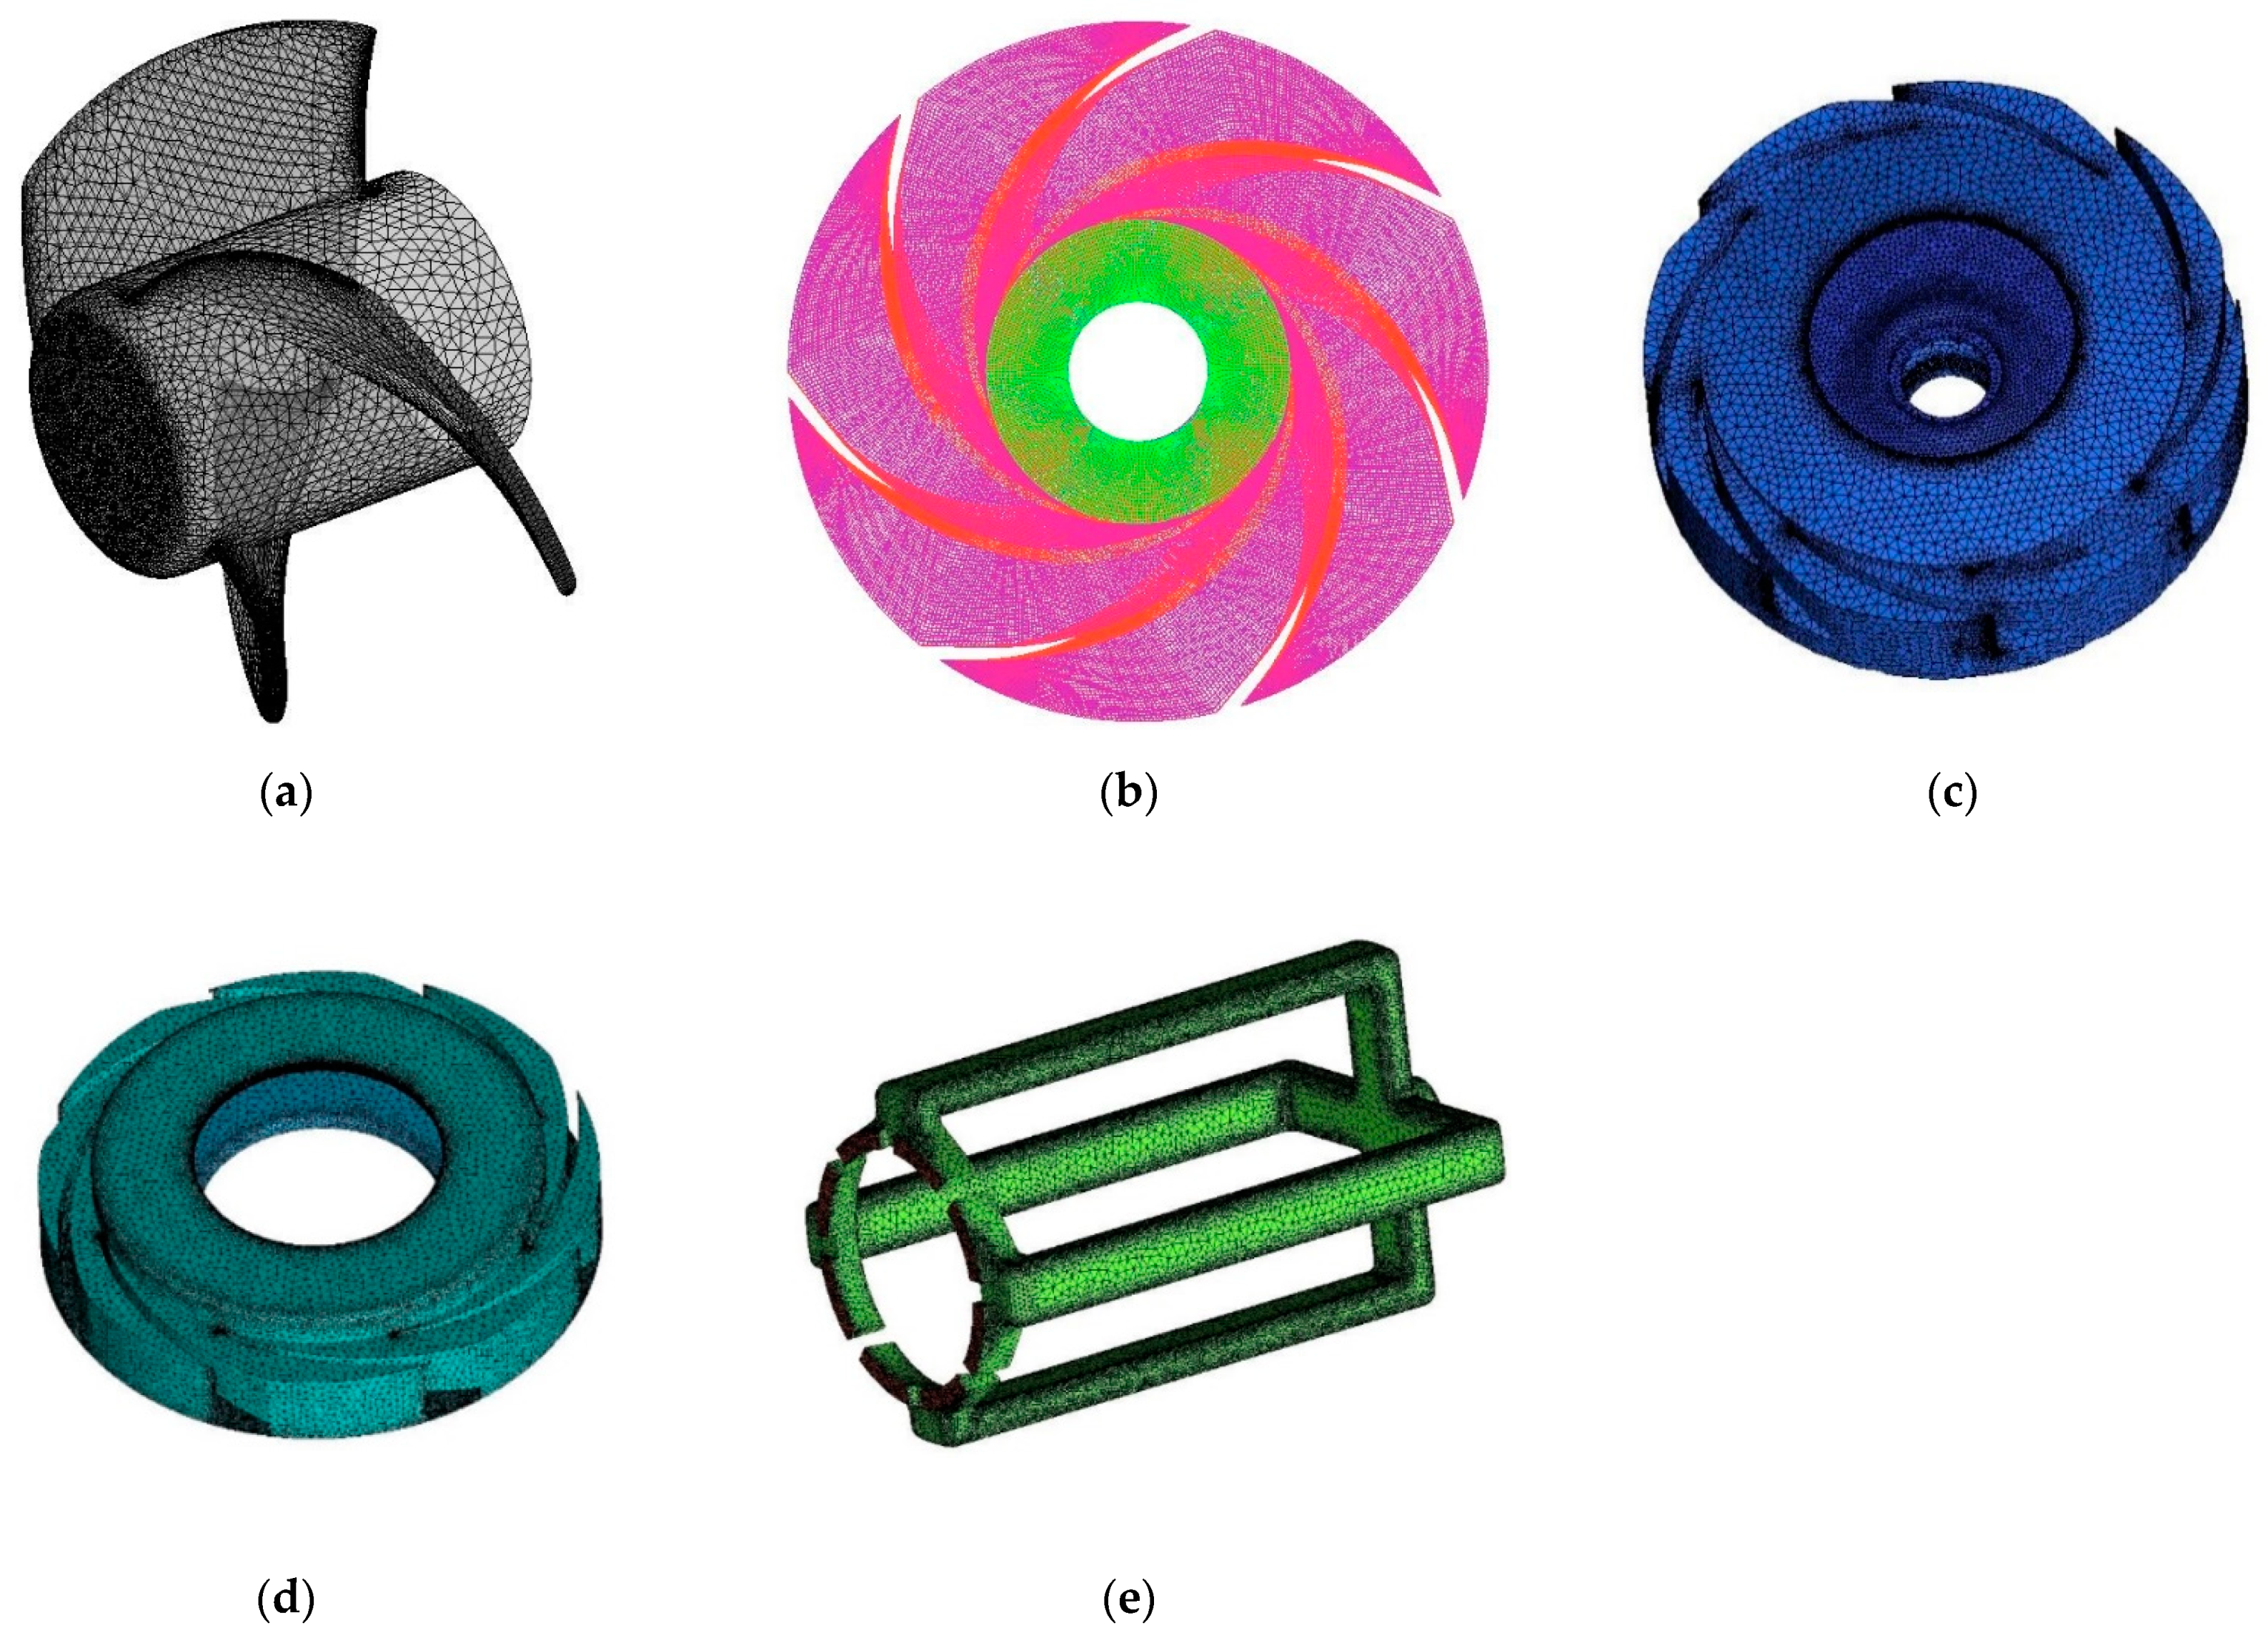
The main components of the LNG submerged pump studied in this paper are inducer, impeller and guide vane, and their geometric parameters directly determine the pump’s performance. Considering the performance of the pump and the rationality of the structure, the model of a low-temperature LNG submerged pump is designed, and three-dimensional modelling is carried out. The main design parameters of the LNG submerged pump studied in this paper are shown in Table 1. The impeller design parameters are shown in Table 2. The overall structure of the LNG submerged pump is shown in Figure 1.
The impeller inlet and the low-pressure area in the channel are where cavitation easily occurs, and the near-wall flow is complex. Numerical simulation can better simulate the flow in the main flow area of the channel, and accurately capture the distribution characteristics of pressure pulsation. Therefore, in order to analyse the pressure pulsation characteristics in the impeller during the transient cavitation flow of the LNG submerged pump, six monitoring points are set in the middle of the primary impeller and the secondary impeller channel, respectively. Since cavitation mostly occurs near the centreline of the flow channel [37], the monitoring points are evenly arranged along the centreline, from the inlet to the outlet of the impeller flow channel, and the distribution is shown in Figure 2.

2.2. Meshing

The overflow area of the LNG submersible pump is taken as the calculation domain, generated in blocks according to different fluid domains by using ICEM software. When meshing, the blades can be separated from the impeller according to the blade streamline, and the meshes of each part can be processed respectively. The entire division process generates lines from points, and then the surface is composed of lines. Finally, the volume is divided by surface, and the divided impeller grid adopts a structural grid. The calculation domain of the impeller, inlet section and outlet section adopts a structural grid, while other calculation domains adopt an unstructured tetrahedral grid. The y+ on the blade wall is lower than 50, which meets the requirements of the turbulence model for y+ near the wall. The grid is shown in Figure 3 [38,39].

2.3. Grid Independence Verification

In numerical calculations, the number of grid nodes greatly impacts the calculation of the time and accuracy. The main reason is that the conversion of the differential equation into a discrete equation will produce discrete errors in numerical calculations. The denser the grid under the same discrete format, the smaller the discrete error will be. Usually, the more grids, the higher the calculation accuracy of simulation, but too many grids will increase the calculation cost. With the increase in the grid density, when the performance parameters of the pump fluctuate stably, it can be considered that the numerical calculation results become stable, which is called the grid independence in theory [40,41,42].
In order to determine the grid independence under the design flow condition (Q = 60 m3/h), the grid quality is changed by encrypting the grid, and the numerical calculation of four grid schemes is carried out for the entire pump. Table 3 shows the LNG submerged pump head calculated using different grid numbers, but using the same boundary conditions, fluid control equation and turbulence model.
It can be seen from Table 3 that when the number of global grids is around 4.06 million, the change of the calculation head obtained by increasing the number of grids by encrypting the grid is small, and the error is less than 3%. It shows that its hydraulic efficiency and head tend to be stable and meet the requirements of grid independence. For convergence analysis, four different grids are calculated; the ratio of the difference between them is greater than zero and less than one. Therefore, monotonic convergence can be achieved [43]. In order to ensure the calculation accuracy and save the calculation cost, scheme 3, with a grid number of about 4.06 million, is finally selected for calculation.

2.4. Boundary Conditions and Turbulence Model

In order to study the distribution position of cavitation, the unsteady numerical simulation of cavitation performance is carried out. The initial conditions are the results of steady cavitation calculation, and the boundary conditions of the total pressure inlet and mass flow outlet are adopted. The dynamic and static interface between the inducer and impeller, impeller and guide vane, is set as a “transient rotor–stator” interface. Set the calculation attribute to instantaneous calculation and set the total time and time step of its calculation. The simulation takes the impeller rotation of 360° as a calculation cycle T, which can be calculated as T = 0.01 s. Take the impeller rotation of 2° in each step and 180 steps in a cycle. When simulating the cavitation performance, liquid phase LNG and gas phase LNG at −162 °C are used for calculation and a homogeneous multiphase model is used. The pump inlet adopts the total pressure inlet and the initial inlet pressure is set to 1.38 times the atmospheric pressure. The NPSHa is controlled by continuously changing the inlet pressure, that is, the occurrence and development process of cavitation, the reference pressure is set to 0 and the outlet adopts a mass flow outlet. The inlet boundary condition with the volume fraction of the initial medium is set as 1 and the volume fraction of the bubble is set as 0; the smooth wall is selected, the standard wall function is adopted near the wall and the adiabatic non-slip wall boundary condition is adopted [44,45,46,47,48,49].
According to Li’s research results, the standard k-ε turbulence model is used as the turbulence model [50]. The governing equation is:
( ρ m k ) t + ( ρ m u j k ) x j = P t ρ m ε + x j [ ( μ + μ t σ k ) k x j ]
( ρ m ε ) t + ( ρ m u j ε ) x j = C ε 1 ε k P t C ε 2 ε 2 k ρ m + x j [ ( μ + μ t σ ε ) ε x j ] .
μ t = C μ ρ m k 2 ε .
where Pt is the turbulent kinetic energy generation term; μt is the turbulent viscosity coefficient, which is a function of k and ε; K is the turbulent kinetic energy; ε is the turbulent dissipation rate and Cμ is the empirical coefficient. Constant coefficient: Cs1 = 1.44, Cs2 = 1.92, σs = 1.3, σk = 1.0, Cμ = 0.09.
According to Li’s research results, the cavitation model adopts the Zwart model [50], and its evaporation term and condensation term are:
m + = C v a p 3 α a u c ( 1 α v ) ρ v R B 2 3 | p v p | ρ l .
m = C c o n d 3 α v ρ v R B 2 3 | p v p | ρ l .
where anuc is the initial vapor core volume fraction, usually taken as 5 × 10⁴; RB is the bubble radius, taken as 1 × 10⁶; pv is the vaporisation pressure; p is the pressure of the liquid around the bubble and the evaporation and condensation coefficient Cvap = 50; Ccond = 0.01.

3. External Characteristic Test

The external characteristic test of the LNG submerged pump is carried out on a closed test bench. The medium is constant temperature water. The external characteristic experimental system comprises of a water tank, inlet valve, inlet pressure transmitter, submerged pump, outlet pressure transmitter, electromagnetic flowmeter, outlet valve, vacuum pump, speed and torque measuring instrument and cavitation tank. The distance between the inlet and outlet pressure transmitter and the inlet and outlet of the submersible pump is twice the inlet and outlet pipe diameter of the submersible pump. In order to measure the stable flow, the electromagnetic flowmeter is more than 20 times the outlet pipe diameter from the adjacent flange. The model used in the experiment is shown in Figure 4a. In the figure, 1 is the inlet valve; 2 is the inlet pressure transmitter; 3 is the submerged pump; 4 is the outlet pressure transmitter; 5 is the electromagnetic flowmeter; 6 is the outlet valve; 7 is the cavitation tank; 8 is the extraction valve; 9 is the vacuum pump; 10 is the exhaust valve and 11 is the water tank. The pressure sensor is used to measure the pressure at the inlet and outlet of the pump, the measurement range of the pressure sensor at the inlet is −0.1 MPa to 0.1 MPa, and the measurement range of the pressure sensor at the outlet is 0 MPa to 1.6 MPa; the measurement accuracy of both sensors is grade 0.1. Change the pump’s flow through the flow regulating valve, and use the electromagnetic flowmeter to measure the flow in the pump. The measurement accuracy of the electromagnetic flowmeter is grade 0.5.

4. Analysis of Numerical Results

4.1. External Characteristic Test Verification

It can be seen from the external characteristic curve of the pump in Figure 5, that the test head and efficiency of the submerged pump under the design working condition are 205.56 m and 72.93%, respectively. The numerical calculation head and efficiency are 211.09 m and 71.12%, respectively, so the errors were 2.56 % and 2.48%. The highest efficiency point is near the working condition of 1.1 Qdes, and the head and efficiency are 197.2 m and 73.52%, respectively. Under the condition of small flow, the head and efficiency of numerical simulation are lower than those measured by the test, and the simulation results are between 0.4 Qdes and 0.8 Qdes. There is a “hump area” in the head due to the rotating stall. With the increase in flow, the simulated head becomes highter than the test head from the working condition of 0.9 Qdes; from the 1.2 Qdes working condition, the simulation efficiency is higher than the test efficiency, and the simulation value is same as the test value as a whole. The head and efficiency of the pump under 0.8 Qdes~1.4 Qdes are high, which is the high-efficiency area of the pump. In conclusion, this numerical calculation can accurately simulate the actual performance of the pump.

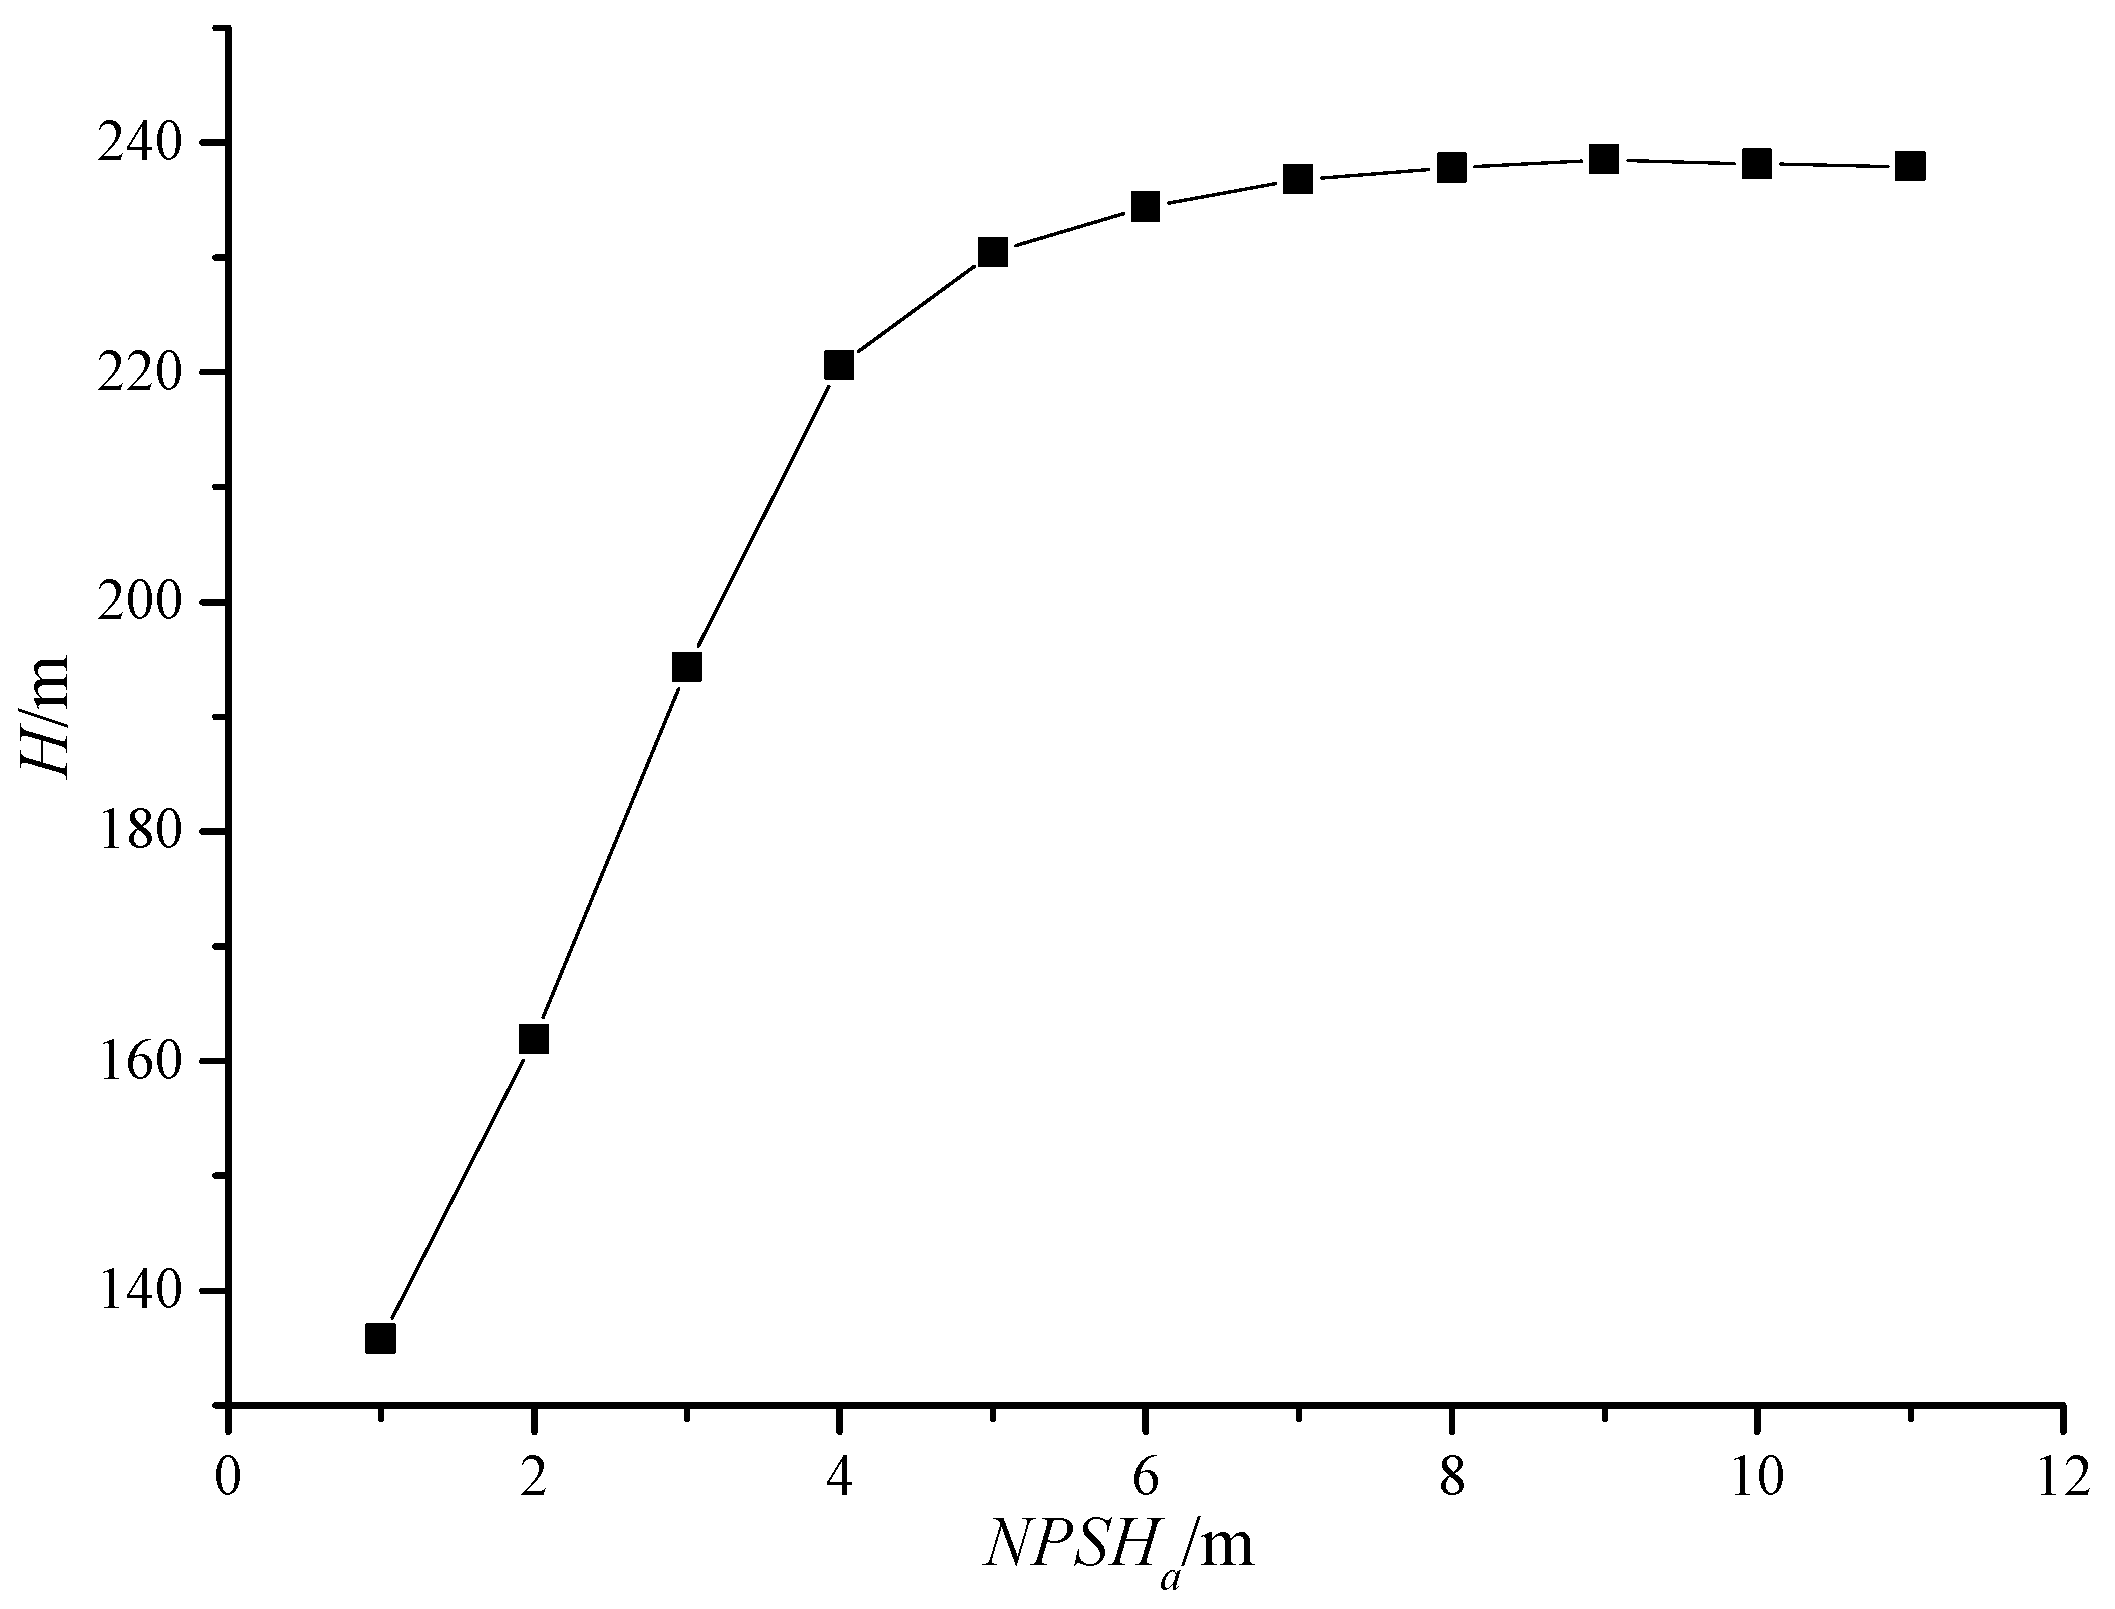
4.2. Cavitation Characteristic Curve

The cavitation performance curve of the LNG submerged pump is obtained by adjusting NPSHa under different inlet total pressure. The NPSHa expression of the pump is:
N P S H a = P i n P v ρ g
The cavitation performance prediction curve of the LNG submerged pump under design conditions, is shown in Figure 6. As with ordinary centrifugal pumps, the critical NPSH is defined as NPSHa when the head decreases by 3%. It can be seen from the figure that the critical NPSH of the LNG submersible pump is NPSHc = 4.92 m.

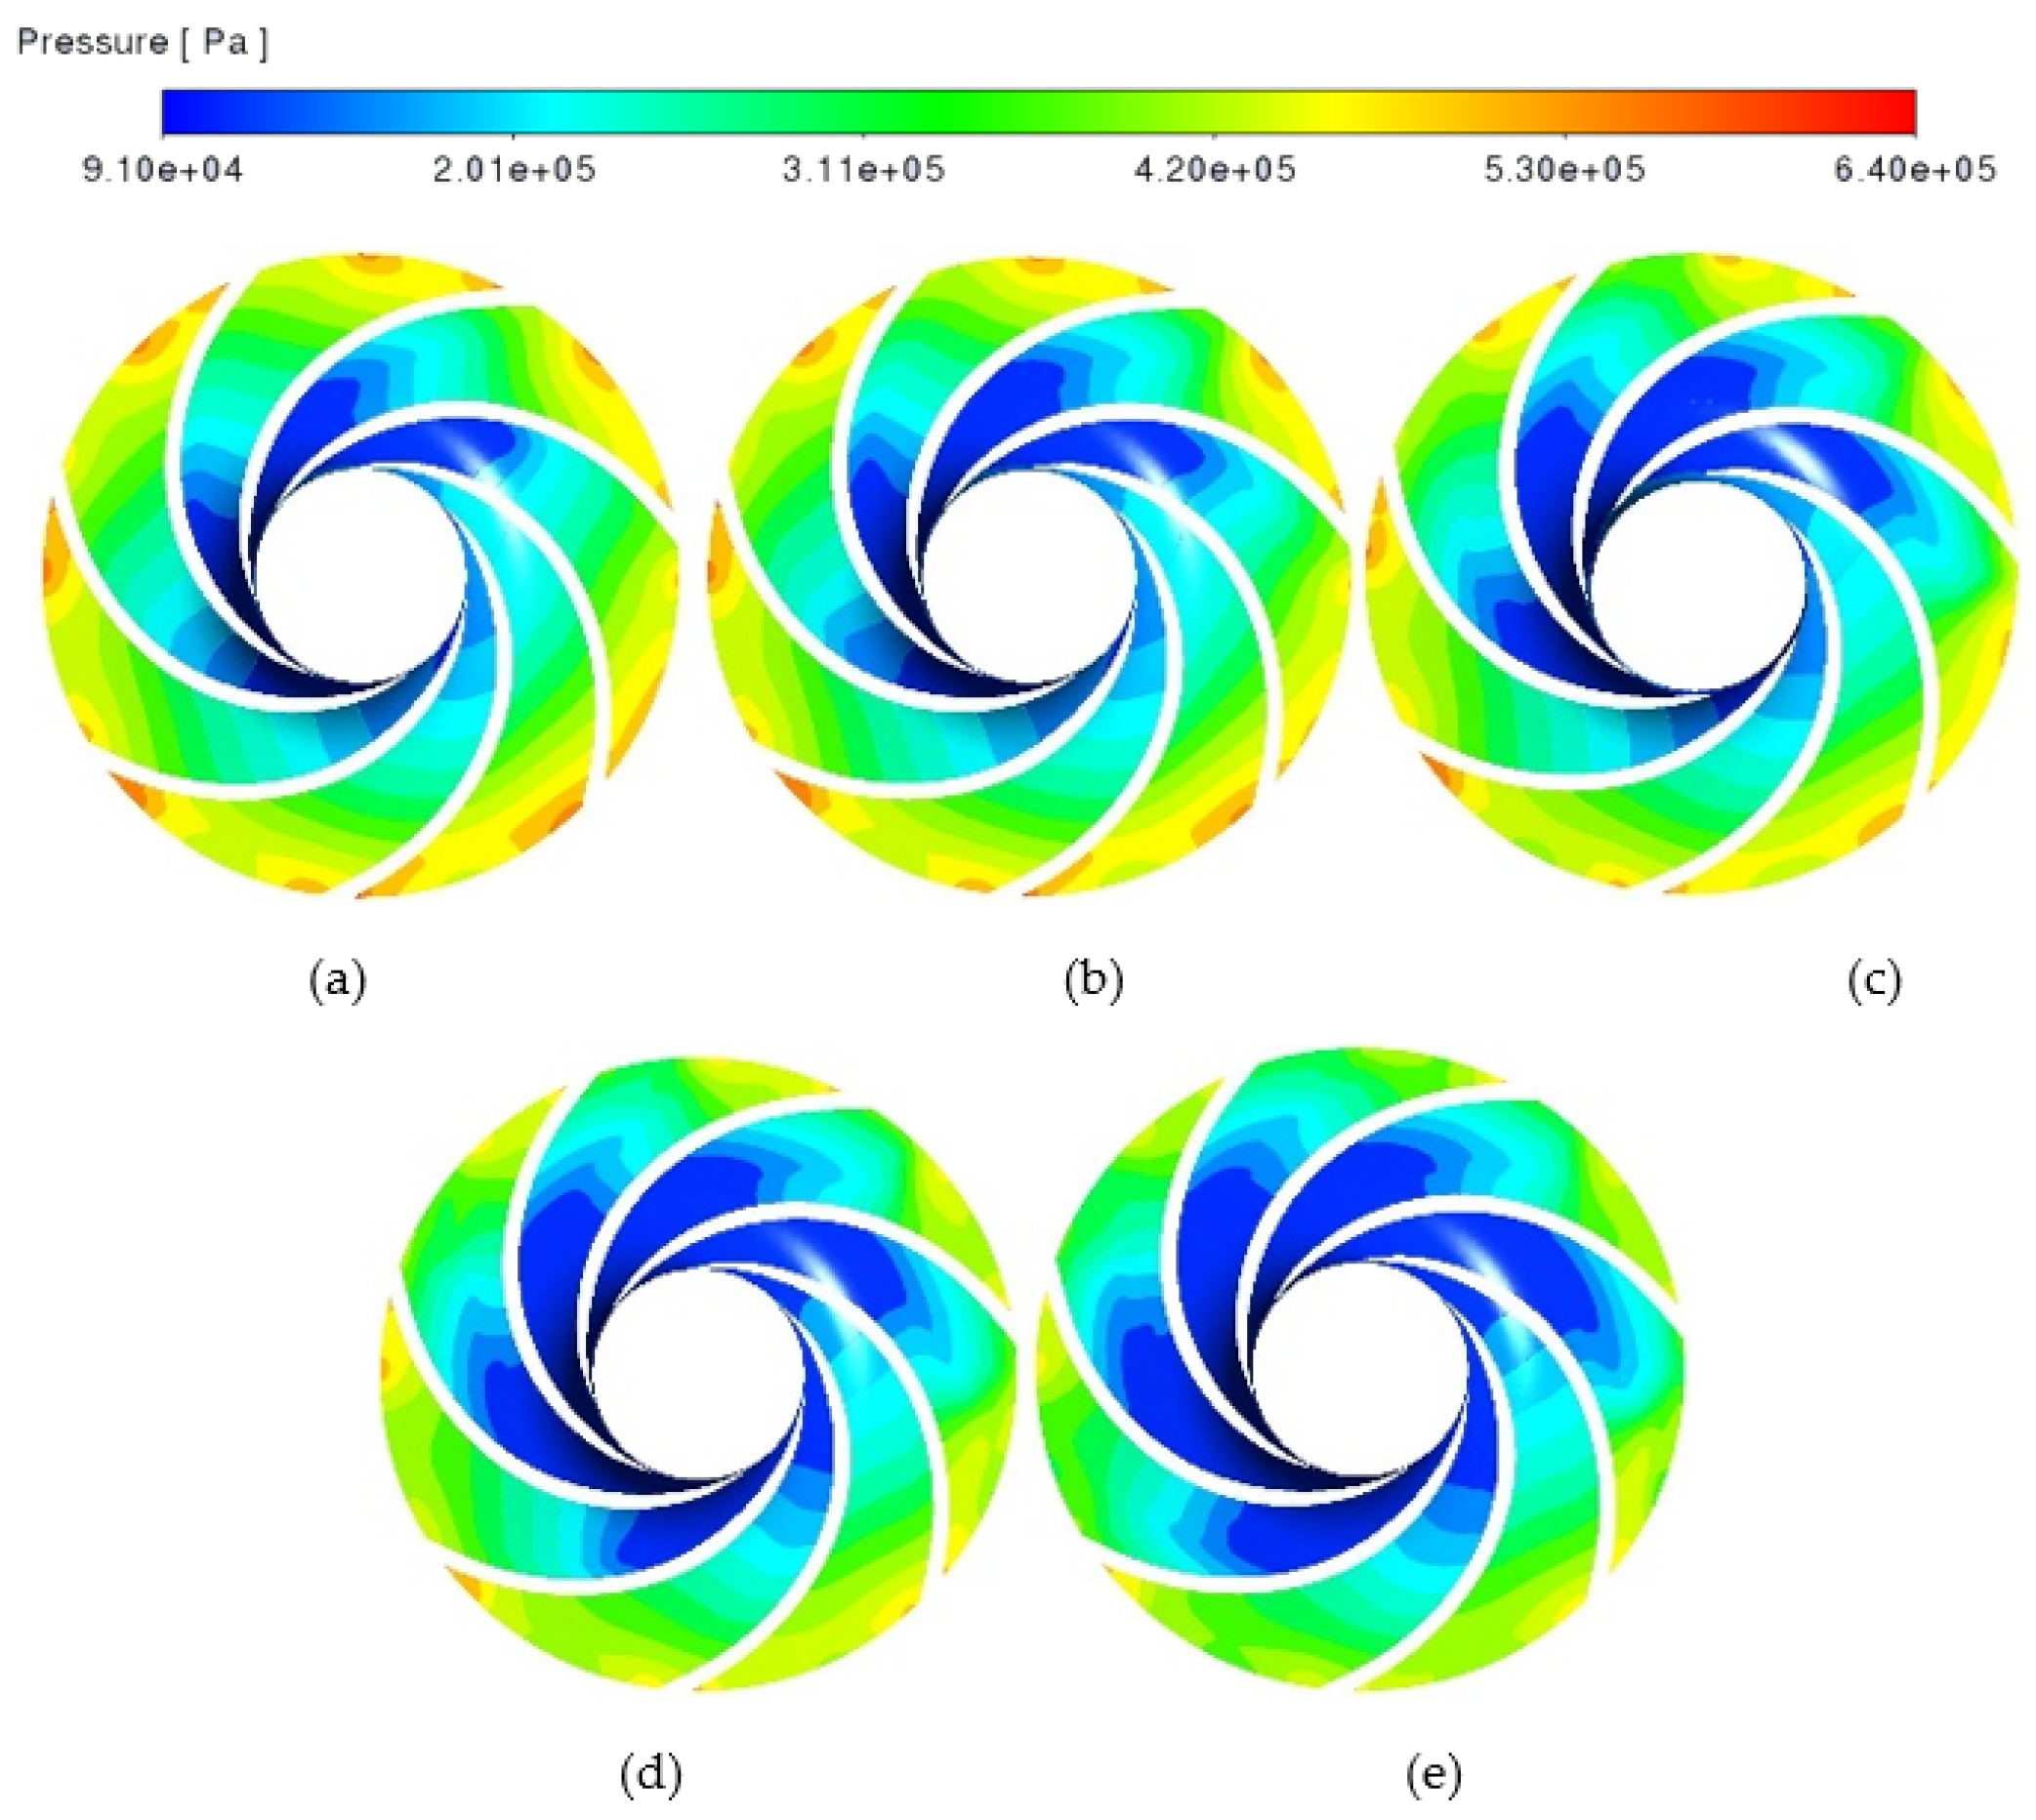
4.3. Analysis of the Cavitation in the Impeller

Figure 7 shows the pressure distribution of the primary impeller under different NPSHa. It can be seen from the figure that the pressure in the impeller presents a gradient distribution. With the decrease in NPSHa, the low-pressure area first appears on the suction surface of the blade at the inlet end, and the circumferential distribution is asymmetric. With the decrease in the inlet pressure, the low-pressure area gradually expands. With the further decrease in the inlet pressure, the low-pressure inlet zone gradually develops into the flow channel. A high-pressure area is evenly distributed along the circumferential direction at the junction of the blade outlet and rim. With the decrease in the inlet pressure, the uniformity of the circumferential distribution gradually decreases, and the area of the high-pressure area gradually decreases. When NPSHa = 4 m, the high-pressure area disappears.
Table 4 shows the distribution of the cavitation volume in different flow surfaces of the impeller under different NPSHa, where S is the dimensionless distance from the front cover plate to the rear cover plate. When S = 0, the position is the rear cover plate, and when S = 1, the position is the front cover plate. It can be seen from the figure, that the distribution position of cavitation in the impeller is consistent with the pressure distribution. With the decrease in NPSHa, cavitation gradually occurs at the inlet of the impeller. Under the four NPSHa, there is a high void volume fraction on the section with the dimensionless distance, S = 0.75. With the decrease in NPSHa, the cavitation gradually develops towards the rear cover plate of the impeller. It shows that cavitation always occurs first at the inlet end of the blade suction surface and diffuses along with the blade suction towards the outlet, gradually blocking the entire flow channel. Under the same NPSHa, the void volume fraction in the flow surface of the front cover plate is the greatest. With the decrease in the dimensionless distance, the volume fraction of the cavitation gradually decreases. At the same time, the cavitation in each channel of the impeller is asymmetrically distributed. The reason can be the dynamic and static interference between the number of the asymmetric impeller and guide vane, resulting in the asymmetric pressure distribution on the surface of the impeller blade.
Figure 8 shows the distribution and evolution law of transient cavitation in the impeller channel under the design flow rate and NPSHa = 7 m; the time interval between the adjacent pictures is 10. It can be seen from the numerical calculation results that, due to the existence of the inducer, there is not much bubble distribution in the impeller under the same NPSHa, which shows that the internal cavitation performance of the impeller is good at this time. A small number of bubbles first appear at the inlet of the leading edge of the impeller. With the rotation of the impeller, the bubbles gradually diffuse along the working surface of the blade. The bubble distribution in each impeller channel is not uniform, which can be caused by the dynamic and static interference between the impeller and the guide vane.

4.4. Analysis of the Pressure Fluctuation Characteristics in the Impeller

In order to facilitate the comparative analysis of the pressure pulsation, the pressure pulsation data obtained by numerical calculation are processed to dimensionless, in this paper. The pressure fluctuation coefficient CP is introduced, which is defined as:
C P = p p ¯ 1 2 ρ u 2 2
where p is the pressure at the monitoring point; p ¯ is the mean value of the pressure at the monitoring point during one cycle of impeller rotation; ρ is the density of the conveying medium and u2 is the circumferential speed of the impeller outlet.

4.4.1. Pressure Pulsation under Non-Cavitation Conditions

(1)
Time Domain analysis
Figure 9 shows the time domain distribution of pressure pulsations at each monitoring point in the primary and secondary impellers, under three different flow conditions. It can be seen from the figure that, under various working conditions, the amplitude of pressure pulsation in the primary and secondary impeller increases from inlet to outlet, and the pulsation at the outlet is biger than that in the impeller channel. Under the same flow rate, the amplitude of pressure fluctuation of the primary impeller and secondary impeller is close, but the waveform is quite different. When the impeller rotates for one circle, the pressure pulsation in the impeller presents eight similar waveforms, and The higher of the flow rate, the more similar of the waveform. In addition to the eight similar waveforms, the pressure pulsation in the secondary impeller also contains a long-period low-frequency waveform, which can be caused by the uneven incoming flow of the secondary impeller. The low-frequency waveform weakens with the flow increase and disappears under high flow rate conditions.
The above analysis shows that the number of waveforms of pressure pulsation in each stage of the impeller, is related to the number of blades of the positive guide vane. The closer to the inlet edge of the positive guide vane, the higher the pulsation amplitude, indicating that the pulsation source of pressure pulsation in each stage of the impeller mainly comes from the dynamic and static interference between the impeller and the positive guide vane. The absolute pressure difference between the primary impeller and the secondary impeller is great, but the pressure fluctuation amplitude is close under the same flow, indicating that there is no absolute correlation between the pressure fluctuation intensity in the impeller and the ambient pressure.
(2)
Frequency Domain Analysis
Figure 10 shows the frequency domain diagram of the pressure pulsation of the impellers at all levels under non-cavitation conditions. It can be seen from the figure that the main frequency of the pressure pulsation in the primary impeller and secondary impeller is always the blade frequency of the guide vane, the amplitude of the main frequency gradually attenuates from the impeller outlet to the impeller inlet, and the deceleration rate of the main frequency in the secondary impeller is much higher than that in the primary impeller. The low-frequency component of pressure pulsation in the secondary impeller is significantly greater than that in the primary impeller, and the low-frequency signal amplitude of the pressure pulsation in the two impellers decreases with the increase in flow. Due to the pre-rotation of the outlet flow of the primary anti-guide vane, the flow field in the secondary impeller is smoother than that in the primary impeller, indicating that the low-frequency signal in the secondary impeller does not come from its internal vortex, but is caused by the instability of the upstream flow.

4.4.2. Pressure Pulsation under Cavitation Condition

(1)
Time Domain Analysis
Figure 11 shows the time domain distribution of the pressure pulsation in the primary and secondary impellers under different NPSHa. It can be seen from the figure that, during one revolution of the impeller, the pressure pulsation at each monitoring point under different NPSHa still presents eight complete peaks and troughs, indicating that the dynamic and static interference under different cavitation conditions is still the main pulsation source of pressure fluctuation in the impeller. With the decrease in NPSHa, the pressure fluctuation waveform at the monitoring points in the primary impeller and secondary impeller is almost unchanged. Only the amplitude of low-frequency fluctuation at the monitoring points P7, P8 and P9 in the primary impeller increases.
(2)
Frequency Domain Analysis
Figure 12 shows the frequency spectrum of pressure pulsation in each impeller stage under different NPSHa. It can be seen from the figure that the amplitude of guide vane frequency (800 Hz) and its harmonic frequency hardly changes with the change of NPSHa. The pulsating low-frequency signal at each monitoring point is affected by NPSHa. This is because the falling off of cavitation on the blade surface will produce low-frequency disturbance in the flow channel. At the same time, the cavitation group near the blade will form a local blockage to the flow channel and change the flow state in the impeller flow channel. The frequency domain characteristics of pulsation in the primary impeller are affected by NPSHa, and the signal lower than the impeller axial frequency (100 Hz) increases significantly with the decrease in NPSHa, especially at the monitoring points P7, P8 and P9 in the middle of the flow channel. The amplitude of the low-frequency signal when NPSHa = 7 m is five times that when NPSHa = 11 m, due to the high ambient pressure; therefore, the pressure pulsation hardly changes under different NPSHa. Nonetheless, the low-frequency signal becomes more concentrated with the decrease in NPSHa.
Figure 13 shows the variation process of the pulsating root mean square value, CRMS, of a low-frequency signal (0~700 Hz), at the monitoring points in the primary impeller and secondary impeller with NPSHa. It can be seen from the figure, that the influence of cavitation on the low-frequency pulsation intensity in the primary impeller is greater than that in the secondary impeller. At the middle and rear of the primary impeller (P8 and P9), the CRMS value during critical cavitation increases from 0.004 to 0.02, under non-cavitation conditions, an increase of about five times. At the first half of the impeller channel (P5, P6 and P7) and the outlet (P10), the CRMS value of the low-frequency pressure pulsation shows a slow growth trend. This is because cavitation mainly starts from the suction surface of the impeller blade close to the inlet edge. With the influence of the mainstream, it extends downstream along the suction surface of the blade and begins to fall off when it is close to the middle. Therefore, the pressure pulsation at the middle and rear of the impeller channel is affected by the falling off of the cavitation and generates a low-frequency signal. It can be seen from Figure 13b that, under the non-cavitation condition, the pressure pulsation intensity of the secondary impeller in the low-frequency band is higher than that of the primary impeller, and the flow in the secondary impeller is relatively disordered at this time. With the decrease in NPSHa, the intensity of the low-frequency pulsation at each monitoring point slowly increases. Among them, the upper incoming pulsation affects the inlet monitoring point, P23, and the increase in CRMS is the greatest.

5. Conclusions

The distribution and evolution of cavitation in the impeller of the LNG submersible pump are analysed through unsteady calculation. The variation laws of the pressure pulsation waveform, amplitude and frequency in the impeller of the LNG submersible pump, under different flow rates and NPSHa, are studied by calculating the root mean square of the pressure coefficient of the low-frequency pulsation. The influence of the aggravation process of cavitation on the low-frequency pulsation in the LNG submersible pump is quantitatively analysed, and the internal pressure pulsation characteristics of the LNG submersible pump under cavitation state are revealed.
(1)
The cavitation in the impeller is first generated near the inlet edge at the back of the blade. With the decrease in NPSHa, the cavitation diffuses along the back of the blade to the outlet, and with the increase in impeller channel area, the bubble gradually expands to the blade working surface. Due to the dynamic and static interference between the impeller and guide vane, the distribution of cavitation in each impeller channel is asymmetric.
(2)
The pressure pulsation in the impeller of the LNG submerged pump is greatly affected by the flow. With the increase in flow, the pressure pulsation in the impeller becomes periodically stronger, the amplitude decreases, and the low-frequency and broadband signals gradually disappear. The pulsation source of the internal pressure of the impeller is in the inlet edge of the positive guide vane. The amplitude of the internal pressure pulsation of the impeller is the largest at the dynamic and static interface, and the pulsation amplitude decreases gradually with the distance away from the pulsation source.
(3)
The time domain and frequency domain characteristics of pressure pulsation in the primary impeller and secondary impeller are the same. The channel pressure does not affect the amplitude of pressure pulsation. Due to the uneven inflow of the primary guide vane, the low-frequency component of the pressure fluctuation spectrum in the secondary impeller is greater than that in the primary impeller.
(4)
The occurrence of cavitation greatly influences the frequency domain distribution of pressure pulsation in the impeller of the LNG submerged pump. With the decrease in NPSHa, a low-frequency signal appears in the frequency domain of the pressure pulsation in the impeller, and the amplitude of the low-frequency signal continuously increases. The influence of cavitation on the pressure pulsation in the primary impeller is greater than that in the secondary impeller. When critical cavitation occurs in the pump, the amplitude of the low-frequency signal in the frequency domain of the pressure pulsation in the primary impeller increases and exceeds the blade frequency, becoming the main frequency.

Author Contributions

Conceptualization, W.L.; formal analysis, L.J.; data curation, X.Z.; writing—original draft preparation, S.L.; writing—review and editing, S.L., W.L., M.A., Y.Y., W.S. and R.K.A. All authors have read and agreed to the published version of the manuscript.

Funding

The work was sponsored by the Key International Cooperative research of the National Natural Science Foundation of China (No.52120105010), the National Natural Science Foundation of China (No.52179085), the National Key R&D Program Project (No.2020YFC1512405), the Fifth “333 High Level Talented Person Cultivating Project” of Jiangsu Province and the funded projects of “Blue Project” in Jiangsu colleges and universities.

Data Availability Statement

The data used to support the findings of this study are included within the article.

Conflicts of Interest

The authors declare no conflict of interest.

References

  1. Guan, X.F. Modern Pump Theory and Design; China Aerospace Publishing House: Beijing, China, 2011. [Google Scholar]
  2. Gu, A. LNG Technical Manual; Machinery Industry Press: Beijing, China, 2010. [Google Scholar]
  3. Lindsay, R.B. On the pressure developed in a liquid during the collapse of a spherical cavity. In Men of Physics Lord Rayleigh—The Man & His Work; Elsevier: Amsterdam, The Netherlands, 1970; pp. 221–226. [Google Scholar]
  4. Plesset, M.S.; Devine, R.E. Effect of exposure time on cavitation damage. ASME J. Basic Eng. Trans. 1965, 88, 31. [Google Scholar] [CrossRef]
  5. Plesset, M.S.; Prosperetti, A. Bubble dynamics and cavitation. Annu. Rev. Fluid Mech. 1977, 9, 145–185. [Google Scholar] [CrossRef]
  6. Huang, B.; Wang, G.; Zhang, B.; Yu, Z. Evaluation of cavitation model for numerical simulation of cloud cavitation flow. J. Beijing Inst. Technol. 2009, 29, 785–789. [Google Scholar]
  7. Avdeev, A.A. Laws of vapor bubble growth in the superhearted liquid volume (Thermal growth scheme). High Temp. 2014, 52, 588–602. [Google Scholar] [CrossRef]
  8. Zhang, Y.; Luo, X.; Xu, H.; Wu, Y. Improvement of thermodynamic cavitation model and its numerical application. J. Eng. Thermophys. 2010, 31, 1671–1674. [Google Scholar]
  9. Ji, B.; Luo, X.; Wu, Y.; Zhang, Y.; Xu, H. Simulation of high temperature water cavitation considering thermodynamic effect. J. Tsinghua Univ. 2010, 50, 262–265. [Google Scholar]
  10. Wang, W.; Lin, Y.; Wang, X.; Wang, Y. Influence of thermodynamic effect on cavitation at high temperature. J. Drain. Irrig. Mech. Eng. 2014, 32, 835–839. [Google Scholar]
  11. Shi, S.; Wang, G.; Hu, C.; Gao, D. Experimental study on hydrodynamic pulsation characteristics of cavitation in water at different temperatures. J. Mech. Eng. 2014, 8, 174–181. [Google Scholar] [CrossRef]
  12. Shi, S.; Wang, G.; Ma, R. Numerical study on cavitation characteristics of low temperature fluid. Eng. Mech. 2012, 5, 61–67. [Google Scholar]
  13. Shi, S.; Wang, G.; Chen, G. Application evaluation of mass transfer model in cavitation flow calculation considering thermodynamic effects. J. Appl. Mech. 2011, 6, 589–594+672. [Google Scholar]
  14. Li, J.; Liu, L.; Li, G.; Feng, Z. Numerical prediction of cavitation flow in centrifugal pump impeller. J. Eng. Thermophys. 2007, 28, 948–950. [Google Scholar]
  15. Wang, Y.; Liu, H.; Liu, D.; Yuan, S.; Wang, J.; Jiang, L. Application of the two-phase three-component computational model to predict cavitating flow in a centrifugal pump and its validation. Comput. Fluids 2016, 131, 142–150. [Google Scholar] [CrossRef]
  16. Rakibuzzaman, M.; Kim, K.; Suh, S.H. Numerical and experimental investigation of cavitation flows in a multistage centrifugal pump. J. Mech. Sci. Technol. 2018, 32, 1071–1078. [Google Scholar] [CrossRef]
  17. Wang, J. Numerical Calculation and Experimental Study on Cavitation Erosion of Hydraulic Equipment. Master’s Thesis, Jiangsu University, Zhenjiang, China, 2015. [Google Scholar]
  18. Jiang, H. Research on assembly height detection method of engine cooling water pump impeller. Intern. Combust. Engine Parts 2018, 8, 40–42. [Google Scholar]
  19. Liao, N.; Xie, D. Discussion on cavitation of water pump of lj465q series engine. Equip. Manuf. Technol. 2010, 2, 177–179. [Google Scholar]
  20. Shen, D. CFD Numerical Simulation of Engine Cooling Water Pump. Master’s Thesis, Jilin University, Changchun, China, 2014. [Google Scholar]
  21. Li, W.; Shi, W.; Pei, B.; Zhang, H.; Lu, W. Numerical simulation and improvement of cavitation characteristics of engine cooling water pump. Trans. Csice 2013, 2, 165–170. [Google Scholar]
  22. Li, W.; Shi, W.; Zhang, H.; Pei, B.; Lu, W. Prediction of cavitation performance of engine cooling water pump based on CFD. J. Drain. Irrig. Mach. Eng. 2012, 30, 176–180. [Google Scholar]
  23. Hou, H.; Zhang, Y.; Li, Z.; Jiang, T.; Zhang, J.; Xu, C. Numerical analysis of entropy production on a LNG cryogenic submerged pump. J. Nat. Gas Sci. Eng. 2016, 36, 87–96. [Google Scholar] [CrossRef]
  24. Cao, H. Numerical Study on Cavitation Flow Characteristics at Low Temperature. Master’s Thesis, Harbin Institute of Technology, Harbin, China, 2010. [Google Scholar]
  25. Ma, X.; Wei, Y.; Wang, C.; Huang, W. Numerical simulation of low temperature cavitation flow of liquid nitrogen around hydrofoil. J. Ship Mech. 2012, 12, 1345–1352. [Google Scholar]
  26. Hord, J. Cavitation in Liquid Cryogenics III—Ogive; Technical Report No. NASA-CR-2242; NASA: Washington, DC, USA, 1973; pp. 10–60. [Google Scholar]
  27. Franc, J.P.; Rebattet, C.; Coulon, A. An experimental investigation of thermal effects in a cavitating inducer. J. Fluids Eng. 2004, 126, 716–723. [Google Scholar] [CrossRef]
  28. Franc, J.P.; Pellone, C. Analysis of thermal effects in a cavitating inducer using rayleigh equation. J. Fluids Eng. 2007, 129, 974–983. [Google Scholar] [CrossRef]
  29. Gustavsson, J.P.R.; Denning, K.C.; Segal, C. Hydrofoil cavitation under strong thermodynamic effect. J. Fluids Eng. 2008, 130, 091303. [Google Scholar] [CrossRef]
  30. Guo, S.; Maruta, Y. Experimental investigations on pressure fluctuations and vibration of the impeller in a centrifugal pump with vaned diffusers. JSME Int. J. 2005, 48, 136–143. [Google Scholar] [CrossRef] [Green Version]
  31. Fernández, J.; Marcos, A.; Barrio, R.; Blanco, E.; Parrondo, J. Studies of the flow of air in a mixed-flow pump using numerical simulations. Proc. Inst. Mech. Eng. Part A J. Power Energy 2011, 225, 647–654. [Google Scholar] [CrossRef]
  32. Yuan, J.; Fu, Y.; Liu, Y.; Zhang, J.; Pei, J. Analysis of pressure fluctuation characteristics in volute of centrifugal pump based on large eddy simulation. J. Drain. Irrig. Mech. Eng. 2010, 28, 310–314. [Google Scholar]
  33. Wang, F.; Zhang, L.; Zhang, Z. Study on pressure fluctuation characteristics of unsteady flow field in axial flow pump. J. Hydraul. Eng. 2007, 38, 1003–1009. [Google Scholar]
  34. Ni, Y.; Pan, Z.; Li, H.; Yuan, J. Application of outlet pressure fluctuation characteristics in cavitation monitoring of centrifugal pump. J. Drain. Irrig. Mech. Eng. 2006, 24, 40–43. [Google Scholar]
  35. Zhang, N. Study on Excitation Characteristics of Unsteady Flow in Centrifugal Pump. Master’s Thesis, Jiangsu University, Zhenjiang, China, 2016. [Google Scholar]
  36. Cheng, H.Y.; Ji, B.; Long, X.P.; Huai, W.; Farhat, M. A review of cavitation in tip-leakage flow and its control. J. Hydrodyn. 2021, 33, 226–242. [Google Scholar] [CrossRef]
  37. Deng, Z.; Jiang, J.; Liu, X. Analysis of unsteady cavitation in the internal flow field of a centrifugal pump. Water Resour. Power 2021, 39, 166–170. [Google Scholar]
  38. Li, W.; Ji, L.; Li, E.; Shi, W.; Agarwal, R.; Zhou, L. Numerical investigation of energy loss mechanism of mixed-flow pump under stall condition. Renew. Energy 2020, 167, 740–760. [Google Scholar] [CrossRef]
  39. Ji, L.; Li, W.; Shi, W.; Chang, H.; Yang, Z. Energy characteristics of mixed-flow pump under different tip clearances based on entropy production analysis. Energy 2020, 199, 1–15. [Google Scholar] [CrossRef]
  40. Feng, J.; Tang, X.; Wang, W.; Ying, R.; Zhang, T. Verification method of numerical simulation reliability based on grid independence and time independence. J. Shihezi Univ. 2017, 35, 52–56. [Google Scholar]
  41. Li, W.; Li, E.; Ji, L.; Zhou, L.; Shi, W.; Zhu, Y. Mechanism and propagation characteristics of rotating stall in a mixed-flow pump. Renew. Energy 2020, 153, 74–92. [Google Scholar] [CrossRef]
  42. Ji, L.; Li, W.; Shi, W.; Tian, F.; Agarwal, R. Effect of blade thickness on rotating stall of mixed-flow pump using entropy generation analysis. Energy 2021, 236, 121–381. [Google Scholar] [CrossRef]
  43. Kang, S.; Shi, L.; Dai, L.; Fan, F. Error analysis and grid convergence of CFD simulation. J. Eng. Thermophys. 2010, 31, 2009–2013. [Google Scholar]
  44. Wang, H.; Hu, Q.; Yang, Y.; Wang, C. Performance differences of electrical submersible pump under variable speed schemes. Int. J. Simul. Model. 2021, 20, 76–86. [Google Scholar] [CrossRef]
  45. Zhou, J.; Zhao, M.; Wang, C.; Gao, Z. Optimal design of diversion piers of lateral intake pumping station based on orthogonal test. Shock. Vib. 2021, 2021, 6616456. [Google Scholar] [CrossRef]
  46. Zhang, L.; Wang, C.; Zhang, Y.; Xiang, W.; He, Z.; Shi, W. Numerical study of coupled flow in blocking pulsed jet impinging on a rotating wall. J. Braz. Soc. Mech. Sci. Eng. 2021, 43, 508. [Google Scholar] [CrossRef]
  47. Shi, L.; Zhu, J.; Tang, F.; Wang, C. Multi-Disciplinary optimization design of axial-flow pump impellers based on the approximation model. Energies 2020, 13, 779. [Google Scholar] [CrossRef] [Green Version]
  48. Wang, H.; Long, B.; Wang, C.; Han, C.; Li, L. Effects of the impeller blade with a slot structure on the centrifugal pump performance. Energies 2020, 13, 1628. [Google Scholar] [CrossRef]
  49. Zhu, Y.; Li, G.; Wang, R.; Tang, S.; Su, H.; Cao, K. Intelligent fault diagnosis of hydraulic piston pump combining improved lenet-5 and pso hyperparameter optimization. Appl. Acoust. 2021, 183, 108336. [Google Scholar] [CrossRef]
  50. Li, W. Study on Cavitation Mechanism of Engine Cooling Water Pump under Thermodynamic Effect. Master’s Thesis, Jiangsu University, Zhenjiang, China, 2016. [Google Scholar]
Figure 1. Water body assembly drawing of the LNG submersible pump.
Machines 10 00014 g001
Figure 2. Distribution of the monitoring points in the impeller. (a) Primary impeller and (b) secondary impeller.
Machines 10 00014 g002
Figure 3. Grid diagram of the computing domain. (a) Inducer; (b) impeller; (c) primary pump chamber; (d) secondary guide vane and (e) outlet pipeline.
Machines 10 00014 g003
Figure 4. Experimental images of the submerged pump characteristics. (a) Physical model and (b) schematic diagram of the experimental system.
Machines 10 00014 g004
Figure 5. The characteristic curve of the LNG submerged pump.
Machines 10 00014 g005
Figure 6. Cavitation performance curve of the LNG submersible pump.
Machines 10 00014 g006
Figure 7. Pressure distribution of the primary impeller. (a) NPSHa = 9 m; (b) NPSHa = 7 m; (c) NPSHa = 6 m; (d) NPSHa = 5 m and (e) NPSHa = 4 m.
Machines 10 00014 g007
Figure 8. Bubble distribution at the impeller inlet (NPSHa = 7 m).
Machines 10 00014 g008
Figure 9. Time domain diagram of the pressure pulsation of impellers at all levels under non-cavitation conditions: (a) 0.6 Qdes−primary impeller; (b) 0.6 Qdes−secondary impeller; (c) 1.0 Qdes−primary impeller; (d) 1.0 Qdes−secondary impeller; (e) 1.4 Qdes−primary impeller and (f) 1.4 Qdes−secondary impeller.
Machines 10 00014 g009
Figure 10. Frequency domain diagram of pressure pulsation of the impellers at all levels under non-cavitation conditions: (a) 0.6 Qdes−primary impeller; (b) 0.6 Qdes−secondary impeller; (c) 1.0 Qdes−primary impeller; (d) 1.0 Qdes−secondary impeller; (e) 1.4 Qdes−primary impeller and (f) 1.4 Qdes−secondary impeller.
Machines 10 00014 g010
Figure 11. Time domain diagram of the pressure pulsation of the impellers at all levels under cavitation conditions. (a) Primary impeller (NPSHa = 11 m); (b) secondary impeller (NPSHa = 11 m); (c) primary impeller (NPSHa = 9 m); (d) secondary impeller (NPSHa = 9 m); (e) primary impeller (NPSHa = 7 m); (f) secondary impeller (NPSHa = 7 m); (g) primary impeller (NPSHa = 4 m) and (h) secondary impeller (NPSHa = 4 m).
Machines 10 00014 g011aMachines 10 00014 g011b
Figure 12. Frequency domain diagram of pressure pulsation of the impellers at all levels under cavitation conditions. (a) Primary impeller (NPSHa = 11 m); (b) secondary impeller (NPSHa = 11 m); (c) primary impeller (NPSHa = 9 m); (d) secondary impeller (NPSHa = 9 m); (e) primary impeller (NPSHa = 7 m); (f) secondary impeller (NPSHa = 7 m); (g) primary impeller (NPSHa = 4 m) and (h) secondary impeller (NPSHa = 4 m).
Machines 10 00014 g012aMachines 10 00014 g012b
Figure 13. Low-frequency pulsation intensity of the impellers at all levels under different cavitation conditions. (a) Primary impeller and (b) secondary impeller.
Machines 10 00014 g013
Table 1. Overall design parameters of the LNG submerged pump.
ContentParameters
StructuralSubmerged centrifugal pump
SeriesTwo-stage
Design speed n6000 r/min
Specific speed ns89.4
Flow at design operating point Q60 m3/h
Head at design operating point H200 m
NPSH at design operating point NPSHa≤5.5 m
Conveying mediumLiquified natural gas (LNG)
Table 2. Main parameters of the LNG submersible pump impeller.
ContentParameters
Impeller inlet diameter Ds68 mm
Hub diameter dh30 mm
Blade inlet diameter D168 mm
Blade outlet diameter D2150 mm
Impeller outlet width b210 mm
Blade inlet angle β1 24°
Blade outlet angle β2 30°
Number of blades Z7
Blade wrap angle φ120°
Table 3. Comparison of the calculated head under different grid numbers.
SchemeTotal Number of GridsHead (m)
12,439,179227.8
23,252,239228.2
34,065,299236.7
44,878,358236.2
Table 4. Bubble volume fraction in the primary impeller.
NPSHaS = 0.1S = 0.25S = 0.5S = 0.75
9 m Machines 10 00014 i001 Machines 10 00014 i002 Machines 10 00014 i003 Machines 10 00014 i004
6 m Machines 10 00014 i005 Machines 10 00014 i006 Machines 10 00014 i007 Machines 10 00014 i008
5 m Machines 10 00014 i009 Machines 10 00014 i010 Machines 10 00014 i011 Machines 10 00014 i012
4 m Machines 10 00014 i013 Machines 10 00014 i014 Machines 10 00014 i015 Machines 10 00014 i016
Publisher’s Note: MDPI stays neutral with regard to jurisdictional claims in published maps and institutional affiliations.

