
In-Process Chatter Detection Using Signal Analysis in Frequency and Time-Frequency Domain


Department of Mechanical, Energy and Management Engineering, University of Calabria, 87036 Rende, Italy
*
Author to whom correspondence should be addressed.
Machines 2022, 10(1), 24; https://doi.org/10.3390/machines10010024
Submission received: 2 December 2021
/
Revised: 20 December 2021
/
Accepted: 24 December 2021
/
Published: 28 December 2021
(This article belongs to the Special Issue Feature Papers to Celebrate the First Impact Factor of Machines)
Abstract
:All machining processes involve vibrations generated by structural sources such as a machine’s moving parts or by the interaction between cutting tools and work-pieces. Relative vibrations between the work-pieces and the cutting tool are the most relevant from the point of view of the regenerative chatter phenomenon. In fact, these vibrations can lead to a chip yregeneration effect, which results in unwanted consequences, rapidly degenerating towards a very poor quality of surface finishing or, in case of severe chatter conditions, to machine-tool or work-piece damage. In the past decades, two different approaches for chatter avoidance were proposed by the scientific community, and they are commonly referred to as Out-of-Process (OuP) and in-Process (iP) solutions. The OuP solutions are off-line approaches, which allow to properly set the working parameters before machining starts. Ip solutions are on-line techniques, which allow to dynamically change the working parameters during machining by using single or multiple sensors. By monitoring the machining process, iP algorithms try to keep the machining process in stable working conditions while keeping high productivity levels. This study dealt with a novel iP chatter-detection strategy based on the Power Spectral Density (PSD) analysis and on the Wavelet Packet Decomposition (WPD) of different sensor signals. The preliminary results demonstrate the stability and feasibility of proposed indicators for chatter detection in industrial application.
1. Introduction
Metal-cutting processes, such as milling, turning, and drilling, are subject to vibration phenomena, originating not only from their transient and unpredictable nature but also from the limited—although usually very high—stiffness of the machine structure, including the work-piece fixture [1]. Among all machining vibrations, chatter identifies the ones causing unwanted relative motion between the work-piece and the cutting tool, which may lead to a degradation of the surface finish quality and, in some cases, also to damage of the cutting tool. In fact, under particular cutting conditions, relative vibrations between the work-piece and the cutting tool lead to a chip regeneration effect, which results in unstable conditions, rapidly degenerating towards very poor quality and dangerous cutting conditions [2].
In the last decades, many studies focused on the development of analytical and numerical algorithms for the prediction of chatter [3,4,5]. The scientific community has widely accepted that the spindle speed, the feed rate, and the depth of cut may be tuned in order to control machining vibrations, as their combined effect determines the resulting phase shift between successive marks left on the work-piece by the tool, hence the magnitude of the cutting forces [6,7]. However, it is very common to achieve the stability of the machining process by tuning opportunely only the depth of cut and the spindle speed. In practice, the easier solution to obtain a stable process can be a reduction in the depth while using conservative values to guarantee proper machining down conditions. However, the unnecessary reduction in cutting depth may slow the material removal with a consequent increase in the processing time and related production costs. Avoiding chattering conditions while maximising machining volumes and process productivity represents a very challenging problem but also a very active field of research. The different approaches, proposed by the scientific community, can be divided in two categories: Out-of-Process (OuP) and in-Process (iP) methods.
OuP methods rely on predicting the dynamic behaviour of the process, by means of some analysis of the machine-tool-work-piece system, accomplished before the machining starts. The results of the analysis are condensed in the form of the stability-lobe diagrams (SLDs), which are used to capture the dynamic behaviour of a machining system. In practice, the SLDs allow to distinguish between the stable and the unstable working condition zones, where chatter may arise [8,9]; thus, their knowledge allows to avoid the more chatter-prone cutting conditions. Although OuP methods are effective in avoiding vibrations, especially when the SLDs are properly estimated, their application is limited because they demand a deep understanding of the machine dynamics, of the geometrical and physical properties of the tool and work-piece, as well as a very accurate and extensive experimental campaign. In fact, the frequency response of the entire machine-spindle-tool system is needed in order to produce reliable SLD-based predictions. The huge complexity and costs of this necessary preliminary analysis phase make OuP methods’ adoption very hard.
Conversely, iP approaches rely on online analysis algorithms, as they act during the cutting process to actively adjust the machining parameters, while monitoring other measurable quantities such as accelerations, forces, and noise [10,11]. The basic idea is to adjust the process parameters, such as the spindle speed, the depth of the cut, and the feed rate, to ensure stable working conditions while guaranteeing the highest possible productivity levels. In the last decades, several iP algorithms have been proposed, spanning from single-sensor to multi-sensor approaches.
Munoa et al. [12] proposed a single-sensor chatter suppression method for a milling machine relying only on the combined knowledge of the machine tool feed rate and the vibration sensed through a low-cost accelerometer. Tangjitsitcharoen et al. [13] developed an iP chatter-detection method using force measurements for the milling processes on a five-axis CNC: their method operates a binary classification between the chatter and the non-chatter working conditions, using opportunely tuned force-threshold values. Schmitz et al. [14] presented a once-per-turn sampling method for vibration detection, exploiting the ciclo-stationarity of the stable-cutting-process-induced noise as opposed to non-stationary noise induced by chatter phenomena. Similarly, relying just on one microphone, Huda [15] proposed a methodology where the measured sound signals were analysed by means of the Fast Fourier Transform (FFT) and the Wavelet Transform (WT), hence exploiting the fact that significant magnitude spikes are present in both frequency and time-frequency domains, whenever chatter conditions arise.
Regarding the multi-sensor approaches, a first comparative analysis of the chatter-detection performance of different sensors dates back to 1992 [16], when Delio et al. considered dynamometers, accelerometers, and microphones. Their results indicated that microphones could be excellent cost-effective sensors for achieving chatter detection and control in case of unstable milling. Later on, Kuljanic et al. [17] investigated the usage of different sensor configurations mixing among rotating dynamometers, accelerometers, acoustic emission, and electrical power sensors. In their seminal work, they investigated which signal combination was the most sensitive for the scope of chatter detection in industrial conditions, looking to time, frequency, and time-frequency domains. Upon their findings, they strongly recommend to use multi-sensor combinations of three or four sensors, since it is possible to achieve not only higher levels of accuracy but also robustness against malfunctions. In contrast, Faassen [18] highlighted that the usage of accelerometers is preferable to other sensors for practical reasons, as the use of a multi-sensor approach could be difficult for industrial application in terms of costs and integration with existing machines.
As discussed, different and controversial conclusions were drawn by the researchers about best type and amount of sensors to be used for chatter detection. More importantly, iP chatter-detection strategies suffer from two major drawbacks. On the one hand, many strategies presented so far require a clear signal of chatter vibrations; so, chatter must fully develop to be detected. On the other hand, the few strategies theoretically able to early detect chatter are so computationally heavy that their evaluation cannot be used to avoid chatter in short time using high values of the sampling rate [19,20]. In the context of a novel iP chatter-detection strategy, this study proposes two chatter indicators, based on the Power-Spectral-Density (PSD) analysis and on the Wavelet Packet Decomposition (WPD) of the monitored signals: hence, we propose the PSD-based in-process chatter indicator (PSD-iP-CI) and the WPD-based iP chatter indicator (WPD-iP-CI). The corresponding chatter-detection strategies were designed to be computationally efficient but also stable enough to be used for chatter avoidance right from the early stage in which the phenomenon is not fully developed. Validation of the proposed methods is supported by means of an experimental milling machining campaign, where we also investigated their efficacy upon usage of different sensors, such as three-axial accelerometers, a free-field microphone, and a three-component force sensor. A schematic diagram of the face milling operation is shown in Figure 1.
The article is organised as follows: Section 2 describes the proposed algorithms for Chatter Indicator (CI) computation, whereas Section 3 illustrates the experimental validation setup and discusses the results and the effectiveness of proposed CIs. Section 4 provides concluding remarks and an overview of future developments.
2. In-Process Chatter-Identification Strategies
2.1. Basic Principles of Chatter Dynamics
Chatter is broadly classified in two categories, depending on the inducing physical principles, distinguishing between primary and secondary chatter [21]. Primary chatter generally arises from the friction between the tool and the work-piece, hence being intrinsic to the cutting process itself. Moreover, it tends to diminish with the increase in spindle speed; thus, it does not pose limits to the process productivity. A more detailed sub classification of the primary chatter types can be made by considering the underlying mechanism responsible for generating the vibrations, leading to the following chatter categories: frictional, thermo-mechanical, and mode coupling.
In frictional chatter, friction interaction between cutter and workpiece surfaces leads to a sudden instantaneous separation of the cutting edges from the workpiece, which in turn produces a variation in their relative speed, thus altering the chip thickness. Under certain conditions, these effects can lead to chaotic movements and vibrations [22,23].
Thermo-mechanical chatter is generated by changes in the mechanical behaviour of the tool–work-piece interaction. Indeed, by considering thermal softening and deformation hardening, vibrations can arise due to the instability of some materials to withstand constant stress during chip formation in specific temperature ranges [24]. However, it is important to point out that these two types of vibrations have small magnitude and do not influence the overall dynamics of the process. Mode coupling is the major primary chatter during machining. It occurs when the shearing force excites movements in the direction of the feed force and vice versa, resulting in simultaneous oscillations in both directions [25,26]. The coupling of these two movements causes an elliptical trajectory of the tool in the workpiece with a consequent difference in the depth of the cut. Various causes can be identified for this vibration, such as friction on the cutting surfaces, oscillations in the cutting angle, or the regenerative effect.
Secondary chatter results from the dynamic coupling of the cutting process and the piece–tool–machine structural chain. In fact, under particular cutting conditions, relative vibrations between the workpiece and the cutting tool lead to a self-sustained chip self-regeneration effect, which results in unwanted consequences, rapidly degenerating towards very poor quality cutting conditions [2].
Within the secondary chatter category, the regenerative chatter is due to the interaction between the dynamic properties of the machine with the cutting process. This kind of chatter is considered the most significant cause of machining instability [27]. Under stable working conditions, the tool vibrations, surface marks, and chip thickness variation can be considered periodic, with the periodicity being the function of the spindle speed. However, during particular combinations of the spindle speed and the feed rate, it may happen that the relative vibration between the cutting tool and the work-piece will create a chip thickness modulation synchronised, hence in phase, between two successive cutter passages causing the chip thickness alterations at every tool passage. This self-sustained mechanism leads to regenerative chatter, resulting in repetitive and very structured marks affecting the final surface quality, as visible in Figure 2. Due to the rapidly escalating phenomena, regenerative chatter causes typically loud noise and excessive tool wear, which in extreme cases can lead to severe damages of the cutter tool or even the machine.
Summarising, during a chatter-free process, when the above-mentioned regenerative phenomena have not been triggered, the cutting system process is dominated by a periodic dynamic behaviour, in which the fundamental frequency is given by the cutting tooth passing frequency, , and related to the tool rotation speed, , according to the following relation:
with quantified in revolutions per minute (RPM) and the resulting frequency expressed in Hertz. Conversely, whenever chatter occurs, other dynamic events will prevail, leading to a dominance of a set of aperiodic components, meaning that the vibrations sparking the chatter phenomena are not resulting from the cutting process periodicity itself but mostly to a dynamic interaction in the machine–tool–workpiece structural chain.
This considerations motivate the well-established approach [17,28,29] according to which a generic signal , irrespective of the sensor type and of the location on the machine or its vicinity, results from the superposition of a periodic component , an aperiodic component , and noise :
Equation (3) reflects a marginal approximation made within the scope of this works, which consists in having considered the noise contribution, , to be negligible.
After all, although noise usually spans over the full frequency spectrum, its effect is mostly marginal as compared with both the fundamental harmonics of the periodic components as well as the other harmonics characterising the aperiodic component.
The remainder of the section describes the two iP chatter-identification approaches proposed in this work, namely, iP-PSD and iP-WPD, which aim to detect chatter by constantly estimating the ratio between the periodic component and the aperiodic components, labelling as a chatter-free process the one dominated by purely periodic components.
To obtain necessary spectral information, each monitoring signal, , is sampled at a constant sampling rate, . The analysis is repeatedly accomplished considering a sliding finite time interval, , thus generating a corresponding finite discrete sequence, , each containing samples, where:
In practice, chatter indexes are evaluated at each moment in time by performing the analysis on a moving rectangular window, thus considering only the last samples of the acquired digital signal, .
Although the proposed methods operate by exploiting different mathematical approaches, whose details are given in the corresponding subsections, they both share the fundamental limits of digital-sampling processing and spectral analysis. Therefore, the sampling frequency, , need to be at least twice as large as the higher frequency content known to be present in the process under investigation, in order to comply with the well-known Shannon theorem. Moreover, the length of the processing Window, , may be chosen accurately mitigating between the need of achieving an adequate frequency resolution,
which would require to increase the duration window, and the approximation errors due to the transient, hence not-stationary, nature of the signals, which would demand to make the processing window as short as possible.
The above-expressed challenge is related to the Heisenberg–Gabor limit, also referred to as the uncertainty principle, which poses a fundamental limitation to simultaneously sharply localise a function in both the time domain and the frequency domain. Since for chatter identification it is crucial to extract information regarding both stationary and transient events, the wavelet transform represents a very promising solution because it exhibits the highest possible time-frequency resolution. In fact, for a vast number of applications concerning transient phenomena analysis, wavelet decomposition has been successfully adopted as a more effective replacement of the more conventional short-time Fourier transform [30].
Within the scope of this work, we used for both the analysis approaches a window of a half second, corresponding to a frequency resolution of 2 Hz.
2.2. Power-Spectral-Density-Based In-Process Chatter Index: PSD-iP-CI
The iP-PSD based chatter detection strategy operates in the frequency domain. It relies on the use of well-established spectral analysis tools, such as the Fast Fourier Transform and the Power Spectral Density.
Given the general signal, , and the corresponding digital sequence, , sampled over the moving processing window as explained in the previous section, the first step of the analysis consists in performing a Fast Fourier Transform (FFT),
which consists in a fast computation of the well-known Discrete Fourier Transform:
where i is the imaginary unity. The obtained sequence, , contains the complex valued harmonics of the original signal and thus fully represents the spectrum of the signal in the interval , being the Nyquist frequency, spanned with the frequency resolution, as resulting from Equation (5).
The obtained spectrum is analysed further, and, in particular, it is split in two parts, so as to distinguish between the periodic and aperiodic spectrum components. This is achieved by convolving the signal spectrum with two opportunely defined binary spectral masks: and :
As depicted in Figure 3, the periodic mask, , selects all frequency components, , falling in the intervals centred around the fundamental tooth-cutting frequency, , and all its harmonics falling within the dynamic range of interest, , with the number of harmonics derived according to:
The value of can be fixed at least to be equal to defined in Equation (5). Higher values of could result in less-robust chatter indices due to possible misidentification of periodic and aperiodic signal components. In practice, the frequency-domain mask is designed to comprise specifically the contributions of all the periodic components related to the repeating its following harmonics. The aperiodic mask, , is derived imposing to be complimentary to the other.
The periodic spectral components, , as well as the aperiodic ones, , are obtained by multiplication with the signal spectrum:
As already stated in Section 1, when the system process is stable the energy related to the aperiodic components is negligible, whereas it increases as soon as the system becomes unstable. Therefore, the chatter-identification problem reduces to correctly evaluate whether the periodic or the aperiodic components are dominating the machining dynamics. The task is achieved assessing the associated energy content and then evaluating the energy ratio between periodic and aperiodic signal parts. This requires computation of the Power Spectral Density (PSD) of the signals:
Then, the energies of the corresponding signals and , indicated as and , respectively, are estimated by integrating their PSD over the full frequency range:
Finally, the chatter index is obtained as the ratio between the aperiodic component energy and the total energy E:
When the system works under stable conditions, the value of this index is expected to be very close to zero; whereas, whenever unstable conditions arise during machining, the index value asymptotically increases up to one when the chatter is fully developed. By monitoring the value of this chatter index, the machining parameters can be modified in order to ensure stable conditions during the machining process.
2.3. Wavelet-Packet-Decomposition-Based In-Process Chatter Index: WPD-iP-CI
The iP WPD-based chatter detection strategy relies on the Wavelet Packet Decomposition; hence, it operates in the time-frequency domain.
As depicted in Figure 4, a wavelet decomposition of a signal consists in performing recursively a split of the signal into two contributions, corresponding to the low-frequency and high-frequency components. Each of the obtained signals is decomposed further using an opportunely re-sampled version of the same kernel filter used to perform the signal splitting. Several variants of wavelet decomposition are possible, depending on the the different filter used and the amount and type of information stored at each level.
In this work, we relied on an undecimated discrete wavelet transform (UDWT), which exhibits a complete and undistorted representation of the energy content of the original signal, at the expense of increased computational and spatial complexity compared to the more commonly used decimated wavelet decomposition variants. Moreover, we used the Daubechies (DB8) kernel, obtaining a three-level shift-invariant UDWT decomposition, which maintains all cascading layers of the time-synchronised wavelet representation [31], while featuring an optimal time-frequency resolution. The proposed approach differs from other methods presented in the literature, such as the Discrete Wavelet Transform (DWT), because the UDWT is a shift-invariant transform, avoids down-sampling and, consequently, is more appropriate for time-series analysis.
For each level j of the UDWT decomposition, the generic signal is divided among a set of wavelet packets, , each of them embracing a different absolute bandwidth, , of the original signal:
As exemplified in Figure 4, at the third level, the input signal is decomposed in eight packets, corresponding to different non-overlapping segments of the overall original signal bandwidth.
The periodic component is estimated by looking to the past non-overlapping signal blocks of the signal in time domain. The duration of each block,
is related to the tooth-passing frequency, . Each block refers to a specific time interval, :
with being the last elapsed block. As a result, the signal is processed over a window of duration .
Assuming the periodic part of the signal to be stationary within the chosen window, is estimated by considering the average signal computed among all the considered blocks, as follows:
For each of the wavelet packets, we can apply the hypothesis already stated in Equation (2), thus splitting as the sum of the aperiodic and periodic components, and . As a result, the aperiodic component is computed subtracting the estimated periodic component from each block of the original signal:
Finally, the WPD-based in-process chatter index (WPD-ip-CI) can be estimated at each moment in time and for each wavelet packet, , as the ratio between the aperiodic signal energy and the total signal energy, within the frequency band of the analysed packet:
The formula expressed in Equation (24) is in agreement with other approaches already presented in the literature [17,32], all showing that good chatter identification results are obtained when considering the proper wavelet packet. This is motivated from the finding that most of the chatter energy is frequency bounded, thus not affecting more than one packet at a time. Such an approach lacks robustness as it requires the a priori knowledge of the chatter frequency band.
This motivated the usage of a more-robust, blind approach, where all the packet contributions are considered together:
3. Experimental Validations
The validity of the proposed chatter-detection strategies was assessed by means of two opportunely designed experimental campaigns, both related to a face-milling process. In the first campaign, we varied the process parameters until finding two sets of parameters corresponding to very distinct and opposed behaviours. As depicted in Figure 5, for the sake of the validation purposes, we selected a scenario exhibiting very clear chatter conditions and another scenario that resulted in an extremely polished surface quality, which corresponded to high stability, during the whole process.
For the second experimental scenario, we used a particular working configuration resulting in a process that exhibited a very stable starting behaviour, which degenerated into chatter towards the end of the passage, as depicted in Figure 5, right. To cause a transition from stable to unstable conditions while keeping constant cutting parameters, the work-piece was fixed in such a way that the dynamic stiffness of the machine–tool–work-piece system changes during the milling process.
Figure 5 depicts the surface finishing for the three experiments.
As depicted in Figure 5, in the “always stable” case, no significant chatter marks appeared on the surface. Conversely, the “always chatter case” exhibited very pronounced chatter marks diffused on the overall work-piece surface, thus indicating very high levels of chatter. In Experiment 2, severe chatter marks appeared at the end of the machining, which happened from the top-to-bottom direction as appearing in the pictures.
Similarly to [11,16,17], for each validation campaign, we also performed a comparative analysis, in order to assess the performance of the methods obtained when using different sensors. Details on the used experimental setup, as well as the results for each experiment, are discussed in the remainder of this section.
3.1. Experimental Setup
In order to verify the effectiveness of proposed chatter indexes, we performed several tests, all concerned with a face-milling process. Tests were carried out in dry milling using a Mazak nexus 410A milling machine with eight-tooth shell-type indexable shoulder milling cutters of the 90° type Meusburger WZT2116/11/50/8. The reference frame for signals is illustrated in Figure 6.
The machine was equipped with a set of sensors, as detailed in Table 1, which were all required to monitor the most-relevant quantities for the scope of identifying the chatter condition.
For both test-case scenarios, we used a workpiece made of steel A216WCB. For monitoring the forces, only two components were considered: the x-component of the cutting force directed along the feed direction and the normal component . Both force components were measured by means of a Kistler 9257B dynamometer, placed between the workpiece fixture and the machine structure, as depicted in Figure 6.
All signals were sampled at 25,600 Hz and acquired using a LMS SCADAS Recorder SCR205, which allows data acquisition of different input signal types with 16 input channels and a transfer rate of 14 Msamples/s.
3.2. Case 1. A Multi-Sensor Comparative Benchmark in Chatter-Free and in Chatter Conditions
In this section, we focus on the validation of the proposed chatter indexes. We considered two working conditions, for which the cutting parameters are detailed in Table 2. The time-domain signals of each monitored signal are reported in Figure 7 and Figure 8.
As already discussed in the previous section, in this case study, we expected very extreme values for chatter indexes: near to zero in the chatter-free case and close to one in the chatter case. The two cases are referred to as “Always in chatter” and “Always stable.”
Due to the mathematical formulation of wavelet-based chatter indexes, the first value can be obtained only after seconds. In order to make a correct match for the two types of chatter indices, those based on PSD calculation were computed in the same time intervals.
Both types of indices for all sensors, except for signal, show trends coherent with the expected results. All chatter indexes were much higher for the “Always in chatter” than the “Always stable” cutting process. With reference to the PSD-iP-CI in Figure 9, the blue line, referred to stable cutting conditions, shows that chatter indexes of all sensors assumed values in the range of 0.1–0.4, indicating that the cutting process dynamics were dominated by the periodic component at frequency . Conversely, in case of the “Always in chatter” experiment, apart from the signal, the aperiodic component represents more than 70 percent of the energy content of acquired signals, indicating a highly unstable working condition. As visible in Figure 9, all signals analysis allowed to obtain a clear identification of stable working conditions when the chatter index value was below 0.4 and of the chatter-dominated process when the chatter index was in the range 0.7 to 1. For a robust identification of threshold levels discriminating chatter-free conditions from mild chatter and chatter, which would enable an appropriate modification of the working parameters in order to prevent damage and bring the process back to stable conditions, a wider experimental dataset is needed. Although, in the case of the stable process, the chatter index of signal seems to behave as the other indicators, and, in the case of the unstable cutting process, the PSD-iP-CI seems to be less sensitive to the aperiodic component, making it not disposable for chatter detection using the PSD approach.
To give a more-detailed analysis of the process characteristic parameters, Figure 11 and Figure 12 illustrate the frequency content of , , and for the two analysed cases.
For the “always stable” experiment, it is possible to observe that the dominant frequency is the cutting frequency for the signal and its 67th harmonic for and , which is likely due to a near resonance of the machining system in that frequency range. The dominant frequency at of the aperiodic component results to be always lower than the periodic ones. This analysis explains the low values of the related chatter indices.
Conversely, for the “always in chatter” experiment, it is possible to observe that, for the and the signals, the dominant frequency and its related harmonics amplitudes of the aperiodic components grow with respect to the “always stable” experiment. This leads to high values of chatter indices. It is to be mentioned that, in the signal, the periodic harmonic at keeps the higher value in the spectrum, but it is possible to observe a significant reduction in amplitude of its successive harmonics.
As shown in Figure 10, the WPD-iP-CI algorithm calculates chatter higher indices for the “always in chatter” cutting process than for the “always stable” cutting process, which is also true in the case of the signal. The WPD approach seems to give more-robust chatter indices giving clear indications about the unstable working conditions with a value of CI closer to 1. However, for the “Always stable” experiment, WPD chatter indices assume higher values than in the case of PSD chatter indices, indicating that the machining, considered as a chatter-free process, is not perfectly stable but appears to evolve in a condition lying on the border between a stability and an instability condition.The PSD-iP-CI algorithm seems to calculate more consistent results as expected based on a visual analysis of the surface finishing of the work-pieces illustrated in Figure 5.
3.3. Case 2. CI Calculation in Transition Scenario from Chatter-Free to Chatter
The cutting parameters of the considered scenario are summarized in Table 3.
This experiment was designed to analyse the capability of the proposed algorithms for chatter detection in situations involving the transition from stable to chatter conditions.
It is to be underlined that, in case of Experiment 2, the process parameters were fixed to the value indicated in the previous table. The instability conditions were obtained by clamping the work-piece with a lower clamping stiffness in the last part of the cutting area as illustrated in Figure 13.
In Experiment 2, the cutting process was performed along the X direction as illustrated in Figure 13. Differently from Experiment 1, in this case, the workpiece was fixed in such a way that the last part of the workpiece behaves like a cantilever beam along the cutting direction, with a consequent lower stiffness. Thanks to this solution we were able to create a transition from a stable to an unstable process without changing any cut parameters. As a result, in this case, we expected to obtain a transition of the chatter indices from low to high values.
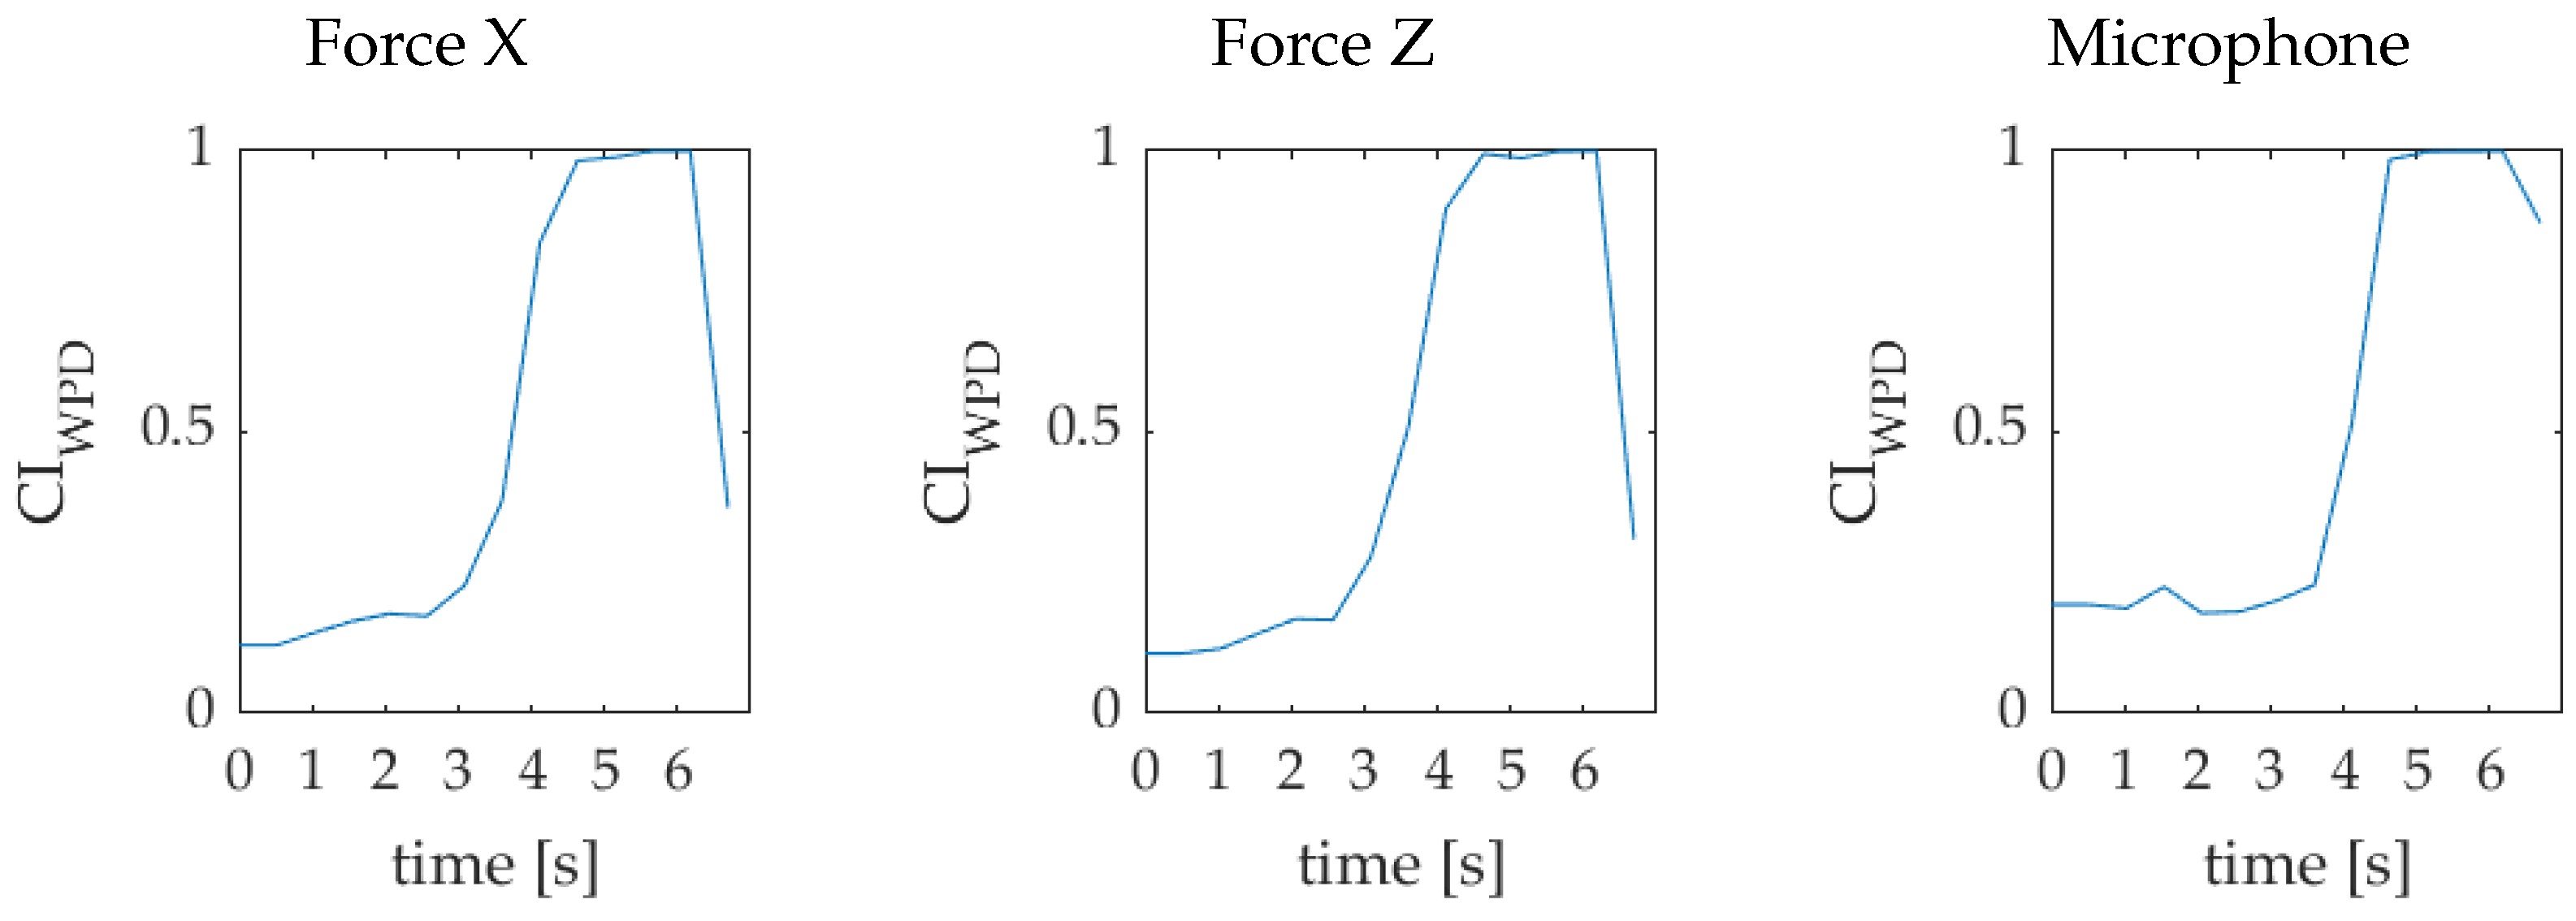
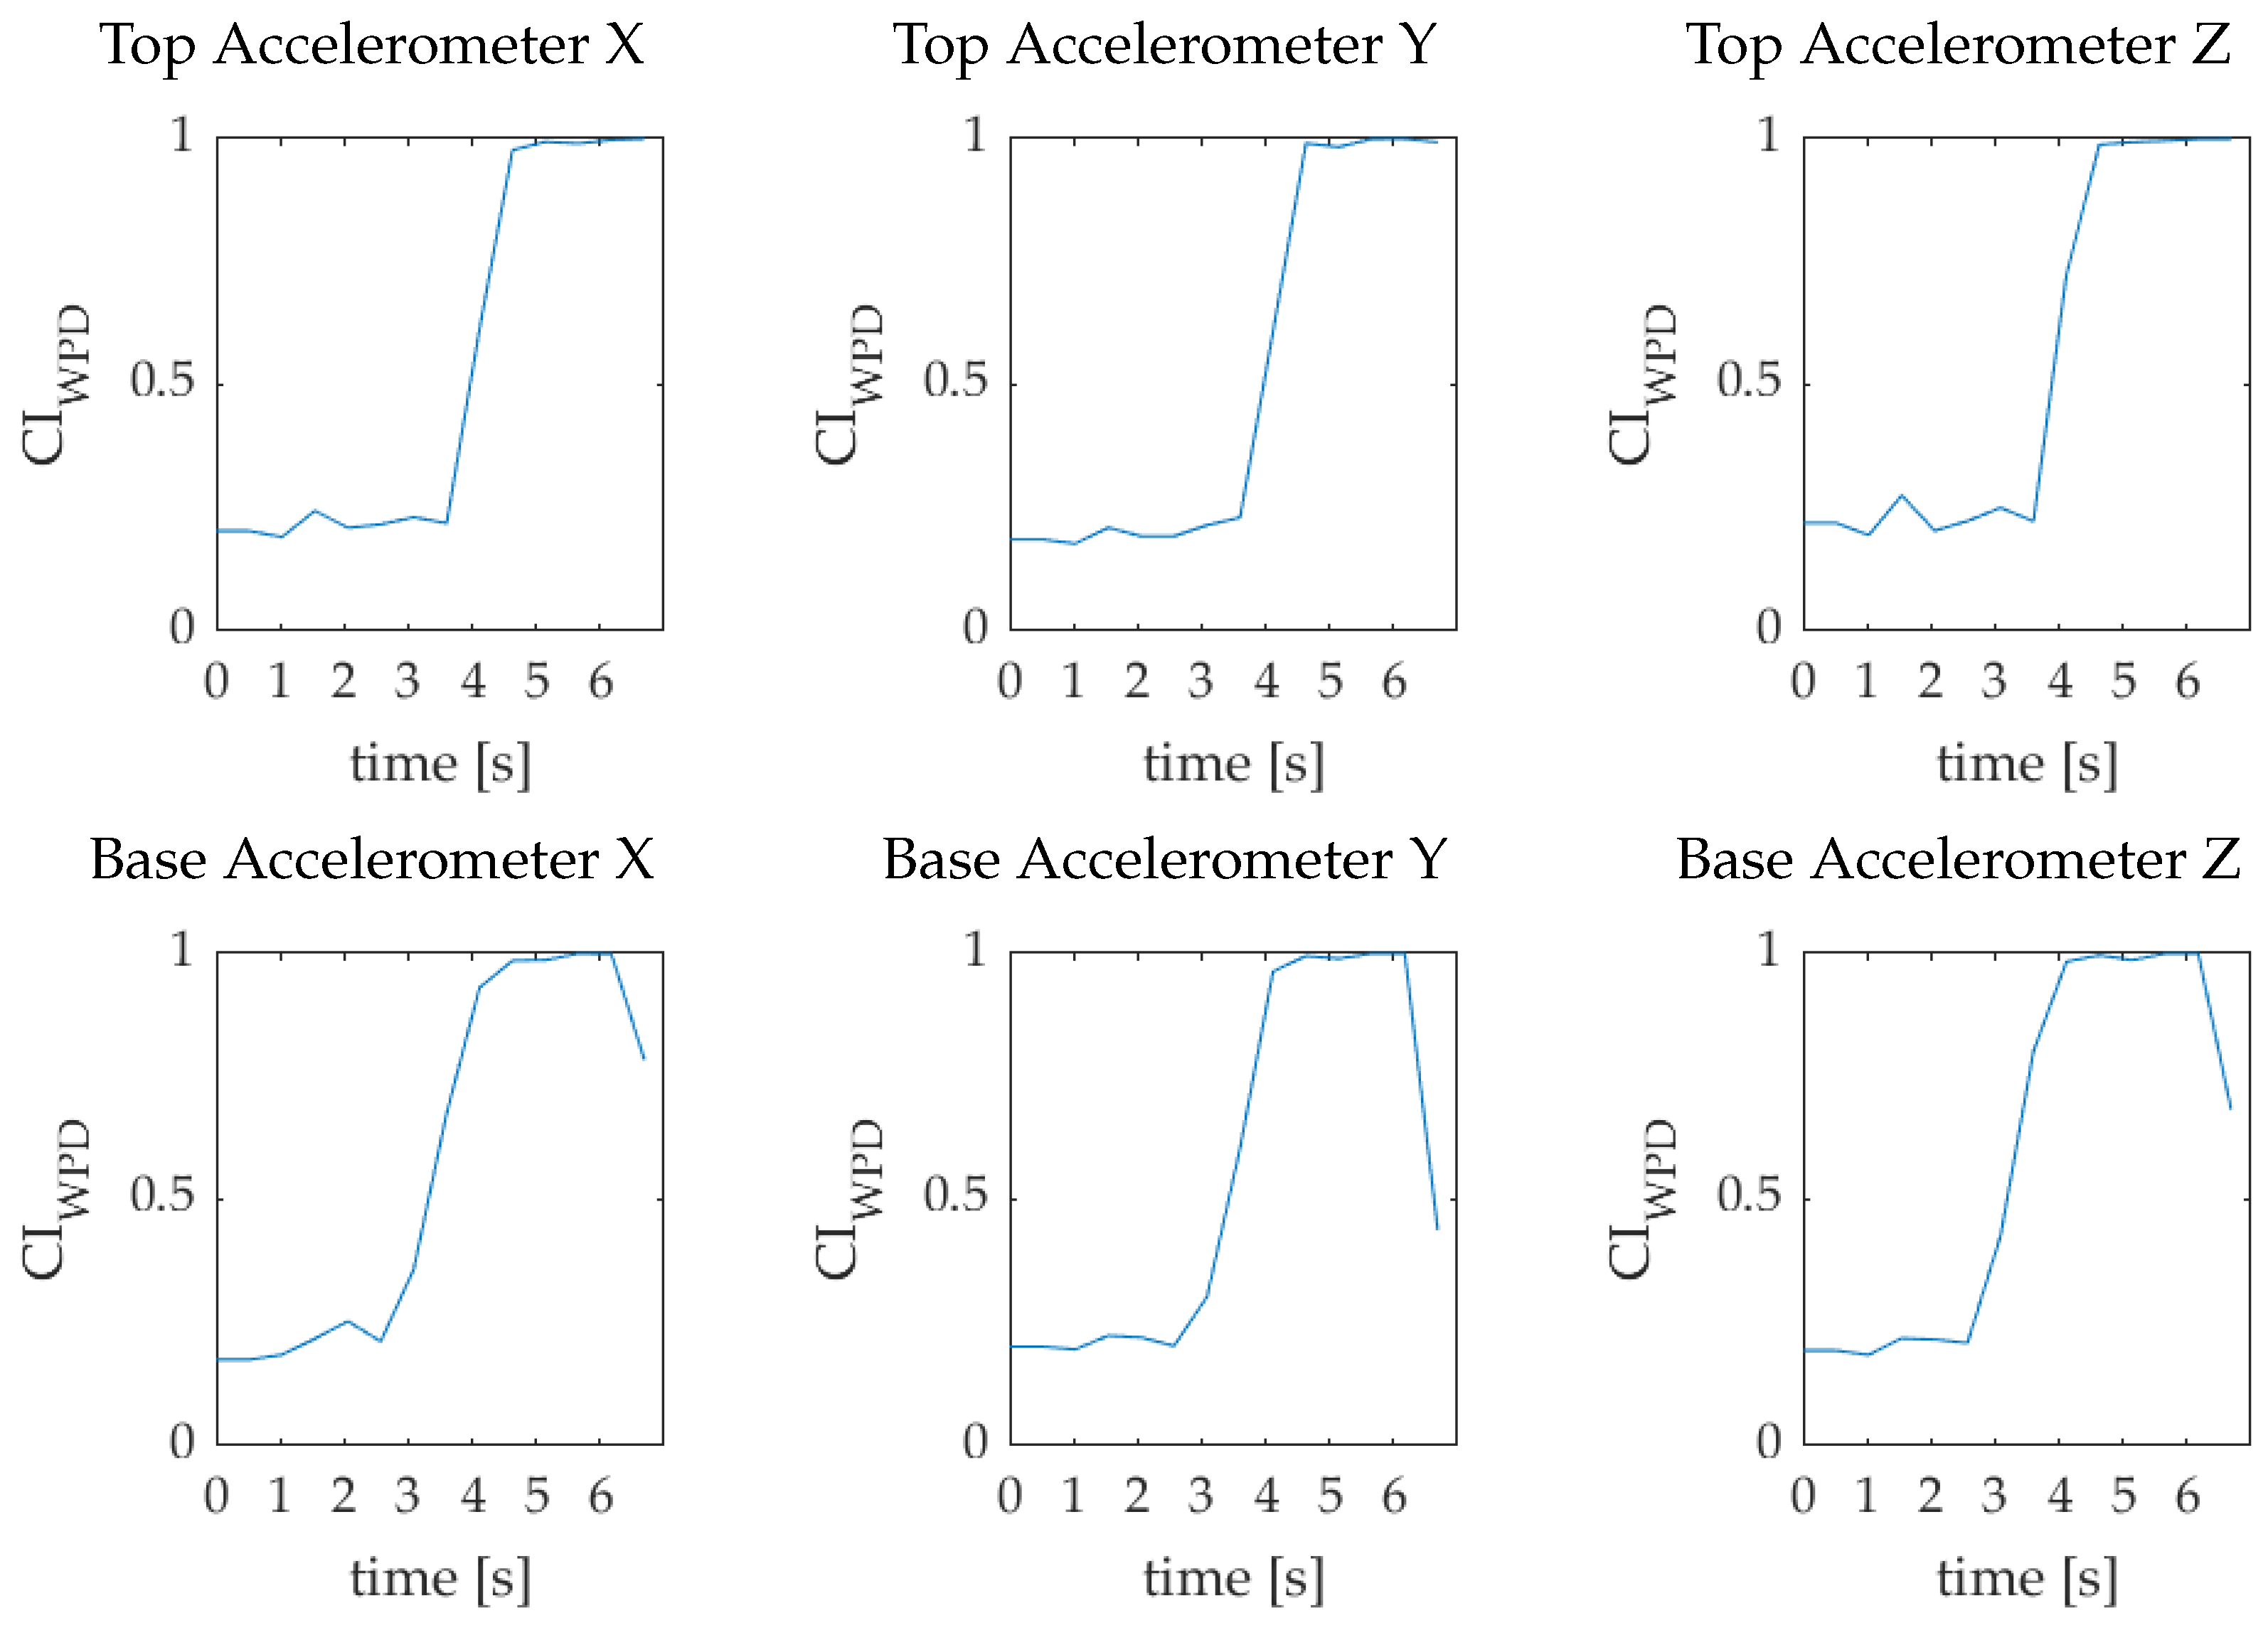
The time history of the considered signals is shown in Figure 14.
As expected, observing the trend of the signals reported in Figure 14, it is possible to appreciate that after about 3 s of machining, the lower clamping stiffness leads to an unstable situation for which all sensor signals show an increasing magnitude, which decreases again only when the cutting tool moves out of the work-piece.
Results of the proposed chatter indices are reported in Figure 15 and Figure 16, for the PSD-iP-CI and WPD-iP-CI indicators, respectively. These results further clarify the robustness of the proposed algorithms and demonstrate the capabilities of the proposed approaches for the detection of transitions between stable and unstable working conditions during the machining.
4. Conclusions
In this study, we proposed two iP algorithms for chatter detection based on the calculation of two chatter indicators, based on the Power Spectral Density (PSD-iP-CI) and the Wavelet Packet Decomposition (WPD-iP-CI) analysis of the monitored signals, respectively. These strategies were designed to be computationally efficient but also robust enough to be used for chatter avoidance already in the early stage, in which the phenomenon is not fully developed. For all presented experiments, the proposed chatter indices allow to obtain consistent results while elaborating signals coming from different kinds of sensors. This capability in signal analysis represents a promising feature of industrial applicability of the proposed approach. The PSD-iP-CI algorithm seems to calculate more consistent results. The use of spectrum masks represents the main innovation in the proposed approach. By defining these masks as a function of the actual spindle speed, it is possible to obtain a fast analysis of periodic and aperiodic components without the need for a precise identification of the dominant frequency and its harmonics, for the subsequent determination of energy contents. Moreover, after the effectiveness of the method is proved, a possible improvement of the computational efficiency is achievable by calculating the inverse Fourier transform of the periodic masks to filter, by a convolution operation, directly in the time domain the signal for periodic and aperiodic component separation. This feature could represent a promising approach for real-time chatter detection using an embedded platform for industrial applications. The WPD-iP-CI algorithm requires further investigation to verify if the intermediate values of CI, obtained during the “Always stable” process, are related to a high sensitivity of this index, which also detects slight discontinuities in the machining process. To evaluate the applicability of the proposed approaches for real-time chatter detection, a preliminary evaluation of computational time was performed for both chatter indices. PSD-iP-CI and WPD-iP-CI need a time of 0.051 s and 3.7 s, respectively, in case of signals sampled at = 25,600 kHz. The PSD-iP-CI calculation algorithm is faster than WPD-iP-CI and can be used in real-time application. Future work is planned to further validate the proposed approaches and to evaluate the computational efficiency, with a different sample rate, in order to investigate the possibility of their implementation in embedded platforms for industrial application.
Author Contributions
Conceptualization, M.P., F.C., F.G. and D.M.; methodology, M.P. and D.M.; software, M.P.; validation, M.P., F.C., D.M.; formal analysis, M.P., F.C. and D.M.; investigation, M.P., F.C. and D.M.; experimental setup design, M.P., F.G. and D.M.; resources, D.M.; data curation, M.P., F.C. and D.M.; writing—original draft preparation, M.P.; writing—review and editing, M.P., F.C., D.M. and F.G.; visualization, M.P., F.C., D.M. and F.G.; supervision, D.M.; project administration, D.M.; funding acquisition, D.M. All authors have read and agreed to the published version of the manuscript.
Funding
This work was supported by the industrial research project “SMILE—Smart Tools and Methods for the Digital Enterprise” (European Regional Development Fund, Italy Ministry of Economic Development “PON Imprese e Competitività” Grant B21B19000530008, Italy, 2020-in progress.
Institutional Review Board Statement
Not applicable.
Informed Consent Statement
Not applicable.
Data Availability Statement
Data are available upon reasonable request of sharing.
Conflicts of Interest
The authors declare no conflict of interest.
References
- Galloro, A.; Capalbo, C.; Cosco, F.; Ambrogio, G.; Filice, L.; Mundo, D. On the influence of the tool holder on chatter predictions in CNC milling processes. In Proceedings of the International Conference on Machine Design MD2021, Porto, Portugal, 7–8 September 2021. [Google Scholar]
- Siddhpura, M.; Paurobally, R. Experimental Investigation of Chatter Vibrations in Facing and Turning Processes. Int. J. Mech. Mechatronics Eng. 2013, 7, 968–973. [Google Scholar]
- Budak, E.; Altintaş, Y. Analytical prediction of chatter stability in milling—Part I: General formulation. J. Dyn. Syst. Meas. Control. Trans. ASME 1998, 120, 22–30. [Google Scholar] [CrossRef]
- Altintas, Y.; Stépán, G.; Budak, E.; Schmitz, T.L.; Kilic, Z.M. Chatter Stability of Machining Operations. J. Manuf. Sci.-Eng.-Trans. Asme 2020, 142, 110801. [Google Scholar] [CrossRef]
- Altintas, Y. Analytical Prediction of Three Dimensional Chatter Stability in Milling. JSME Int. J. Ser. Mech. Syst. Mach. Elem. Manuf. 2001, 44, 717–723. [Google Scholar] [CrossRef] [Green Version]
- Wang, J.J.; Uhlmann, E.; Oberschmidt, D.; Sung, C.F.; Perfilov, I. Critical depth of cut and asymptotic spindle speed for chatter in micro milling with process damping. CIRP Ann. 2016, 65, 113–116. [Google Scholar] [CrossRef]
- Yamato, S.; Nakanishi, K.; Suzuki, N.; Kakinuma, Y. Development of Automatic Chatter Suppression System in Parallel Milling by Real-Time Spindle Speed Control with Observer-Based Chatter Monitoring. Int. J. Precis. Eng. Manuf. 2021, 22, 227–240. [Google Scholar] [CrossRef]
- Altintaş, Y.; Budak, E. Analytical Prediction of Stability Lobes in Milling. CIRP Ann. 1995, 44, 357–362. [Google Scholar] [CrossRef]
- Grossi, N.; Sallese, L.; Scippa, A.; Campatelli, G. ScienceDirect Chatter stability prediction in milling using speed-varying cutting force coefficients review under responsibility of the International Scientific Committee of the 6th CIRP International Conference on High Performance Cutting. Procedia CIRP 2014, 14, 170–175. [Google Scholar] [CrossRef] [Green Version]
- Quintana, G.; Ciurana, J. Chatter in machining processes: A review. Int. J. Mach. Tools Manuf. 2011, 51, 363–376. [Google Scholar] [CrossRef]
- Siddhpura, M.; Paurobally, R. A review of chatter vibration research in turning. Int. J. Mach. Tools Manuf. 2012, 61, 27–47. [Google Scholar] [CrossRef]
- Munoa, J.; Beudaert, X.; Erkorkmaz, K.; Iglesias, A.; Barrios, A.; Zatarain, M. Active suppression of structural chatter vibrations using machine drives and accelerometers. CIRP Ann. 2015, 64, 385–388. [Google Scholar] [CrossRef]
- Tangjitsitcharoen, S.; Pongsathornwiwat, N. Development of chatter detection in milling processes. Int. J. Adv. Manuf. Technol. 2013, 65, 919–927. [Google Scholar] [CrossRef]
- Schmitz, T.L.; Davies, M.A.; Medicus, K.; Snyder, J. Improving High-Speed Machining Material Removal Rates by Rapid Dynamic Analysis. CIRP Ann. 2001, 50, 263–268. [Google Scholar] [CrossRef]
- Huda, F.; Darman, D.; Rusli, M. Chatter detection in turning process using sound signal and simple microphone. IOP Conf. Ser. Mater. Sci. Eng. 2020, 830, 042027. [Google Scholar] [CrossRef]
- Delio, T.; Tlusty, J.; Smith, S. Use of audio signals for chatter detection and control. J. Manuf. Sci. Eng. Trans. ASME 1992, 114, 146–157. [Google Scholar] [CrossRef]
- Kuljanic, E.; Sortino, M.; Totis, G. Multisensor approaches for chatter detection in milling. J. Sound Vib. 2008, 312, 672–693. [Google Scholar] [CrossRef]
- Faassen, R.; Doppenberg, E.; van de Wouw, N.; Oosterling, J.; Nijmeijer, H. Online detection of the onset and occurrence of machine tool chatter in the milling process. In Proceedings of the CIRP 2nd International Conference on High Performance Cutting, Vancouver, BC, Canada, 12–13 June 2006. [Google Scholar]
- Vashisht, R.K.; Peng, Q. Online Chatter Detection for Milling Operations Using LSTM Neural Networks Assisted by Motor Current Signals of Ball Screw Drives. J. Manuf. Sci. Eng. 2020, 143, 011008. [Google Scholar] [CrossRef]
- Dong, X.; Tu, G.; Wang, X.; Chen, S. Real-time chatter detection via iterative Vold-Kalman filter and energy entropy. Int. J. Adv. Manuf. Technol. 2021. [Google Scholar] [CrossRef]
- Obinna, N.N.; Ugochukwu, O.C.; Christian, O.E.; Imhade, O.P. Evaluation of chatter vibration frequency in cnc turning of 4340 alloy steel material. Int. J. Sci. Eng. Res. 2017, 8, 487–495. [Google Scholar]
- Wang, A.; Jin, W.; Chen, W.; Feng, R.; Xu, C. Bifurcation and chaotic vibration of frictional chatter in turning process. Adv. Mech. Eng. 2018, 10, 1687814018771262. [Google Scholar] [CrossRef]
- Rusinek, R.; Wiercigroch, M.; Wahi, P. Modelling of frictional chatter in metal cutting. Int. J. Mech. Sci. 2014, 89, 167–176. [Google Scholar] [CrossRef]
- Hajmohammadi, M.S.; Movahhedy, M.R. Investigation of thermal effects on machining chatter using FEM simulation of chip formation. Procedia CIRP 2012, 1, 50–55. [Google Scholar] [CrossRef]
- Yuan, L.; Pan, Z.; Ding, D.; Sun, S.; Li, W. A Review on Chatter in Robotic Machining Process Regarding Both Regenerative and Mode Coupling Mechanism. IEEE/ASME Trans. Mechatron. 2018, 23, 2240–2251. [Google Scholar] [CrossRef]
- Gasparetto, A. Eigenvalue Analysis of Mode-Coupling Chatter for Machine-Tool Stabilization. J. Vib. Control. 2001, 7, 181–197. [Google Scholar] [CrossRef]
- Yue, C.; Gao, H.; Liu, X.; Liang, S.Y.; Wang, L. A review of chatter vibration research in milling. Chin. J. Aeronaut. 2019, 32, 215–242. [Google Scholar] [CrossRef]
- Li, K.; He, S.; Li, B.; Liu, H.; Mao, X.; Shi, C. A novel online chatter detection method in milling process based on multiscale entropy and gradient tree boosting. Mech. Syst. Signal Process. 2020, 135, 106385. [Google Scholar] [CrossRef]
- Kim, J.D.; Chin, D.H.; Kim, K.H.; Yoon, M.C. Monitoring of Tooth Passing and Chatter Properties in End-Milling. In Proceedings of the International Conference on Advanced Engineering Theory and Applications, Ho Chi Minh, Vietnam, 7–9 December 2017; pp. 509–519. [Google Scholar] [CrossRef]
- Wirsing, K. Time Frequency Analysis of Wavelet and Fourier Transform. In Wavelet Theory; IntechOpen: London, UK, 2020. [Google Scholar] [CrossRef]
- Tiwari, V.K.; Sandhibigraha, H.B.; Umarikar, A.C.; Jain, T. Undecimated Wavelet Packet Transform Based Visualization of Time-Varying Power Quality Disturbance. In Proceedings of the 2018 20th National Power Systems Conference, NPSC 2018, Tiruchirappalli, India, 14–16 December 2018. [Google Scholar] [CrossRef]
- Yesilli, M.C.; Khasawneh, F.A.; Otto, A. On transfer learning for chatter detection in turning using wavelet packet transform and ensemble empirical mode decomposition. CIRP J. Manuf. Sci. Technol. 2020, 28, 118–135. [Google Scholar] [CrossRef]
Figure 1.
Face milling.

Figure 2.
Workpiece surface finishing: (a) chatter; (b) no chatter.
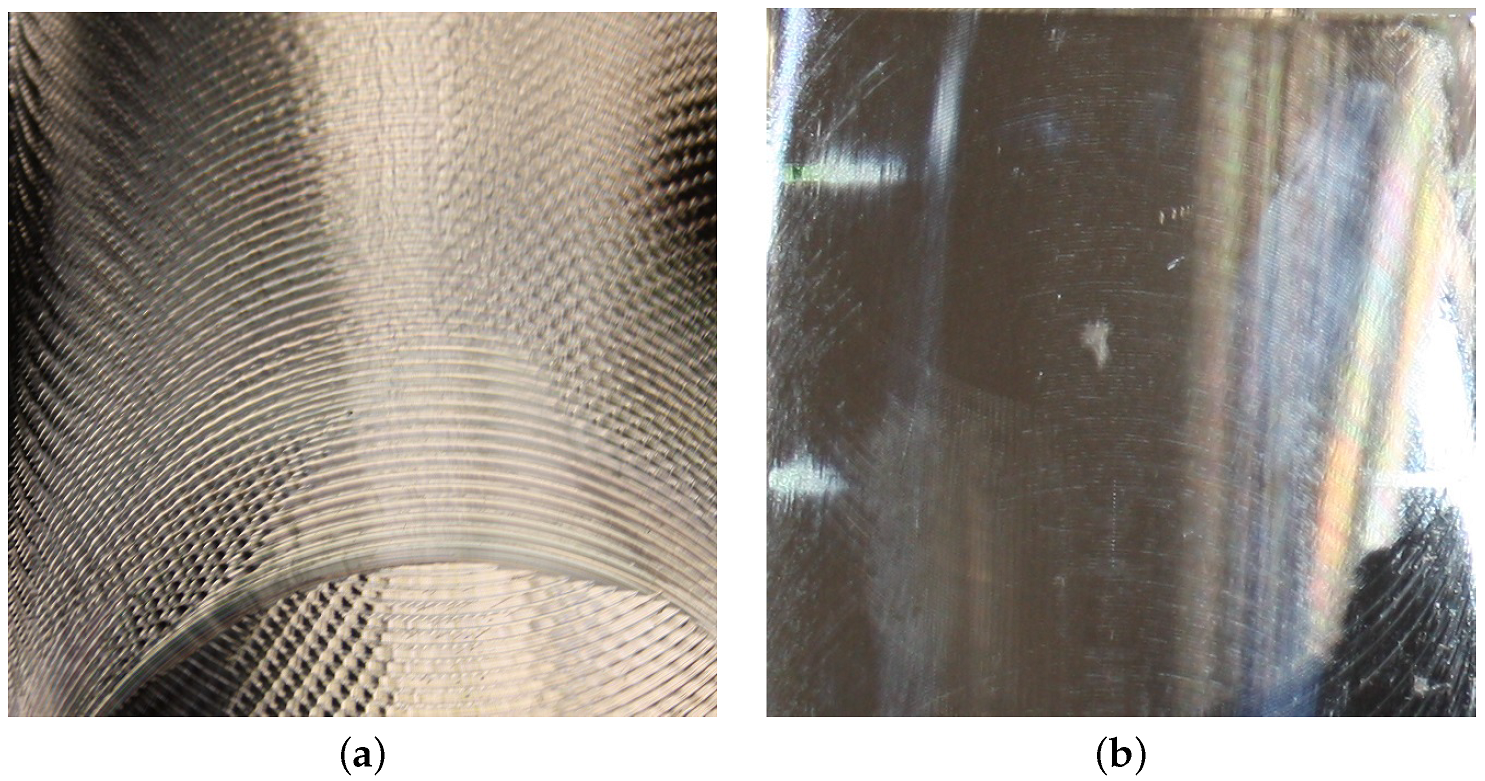
Figure 3.
Separation of spectrum components.

Figure 4.
UWPT decimation tree.
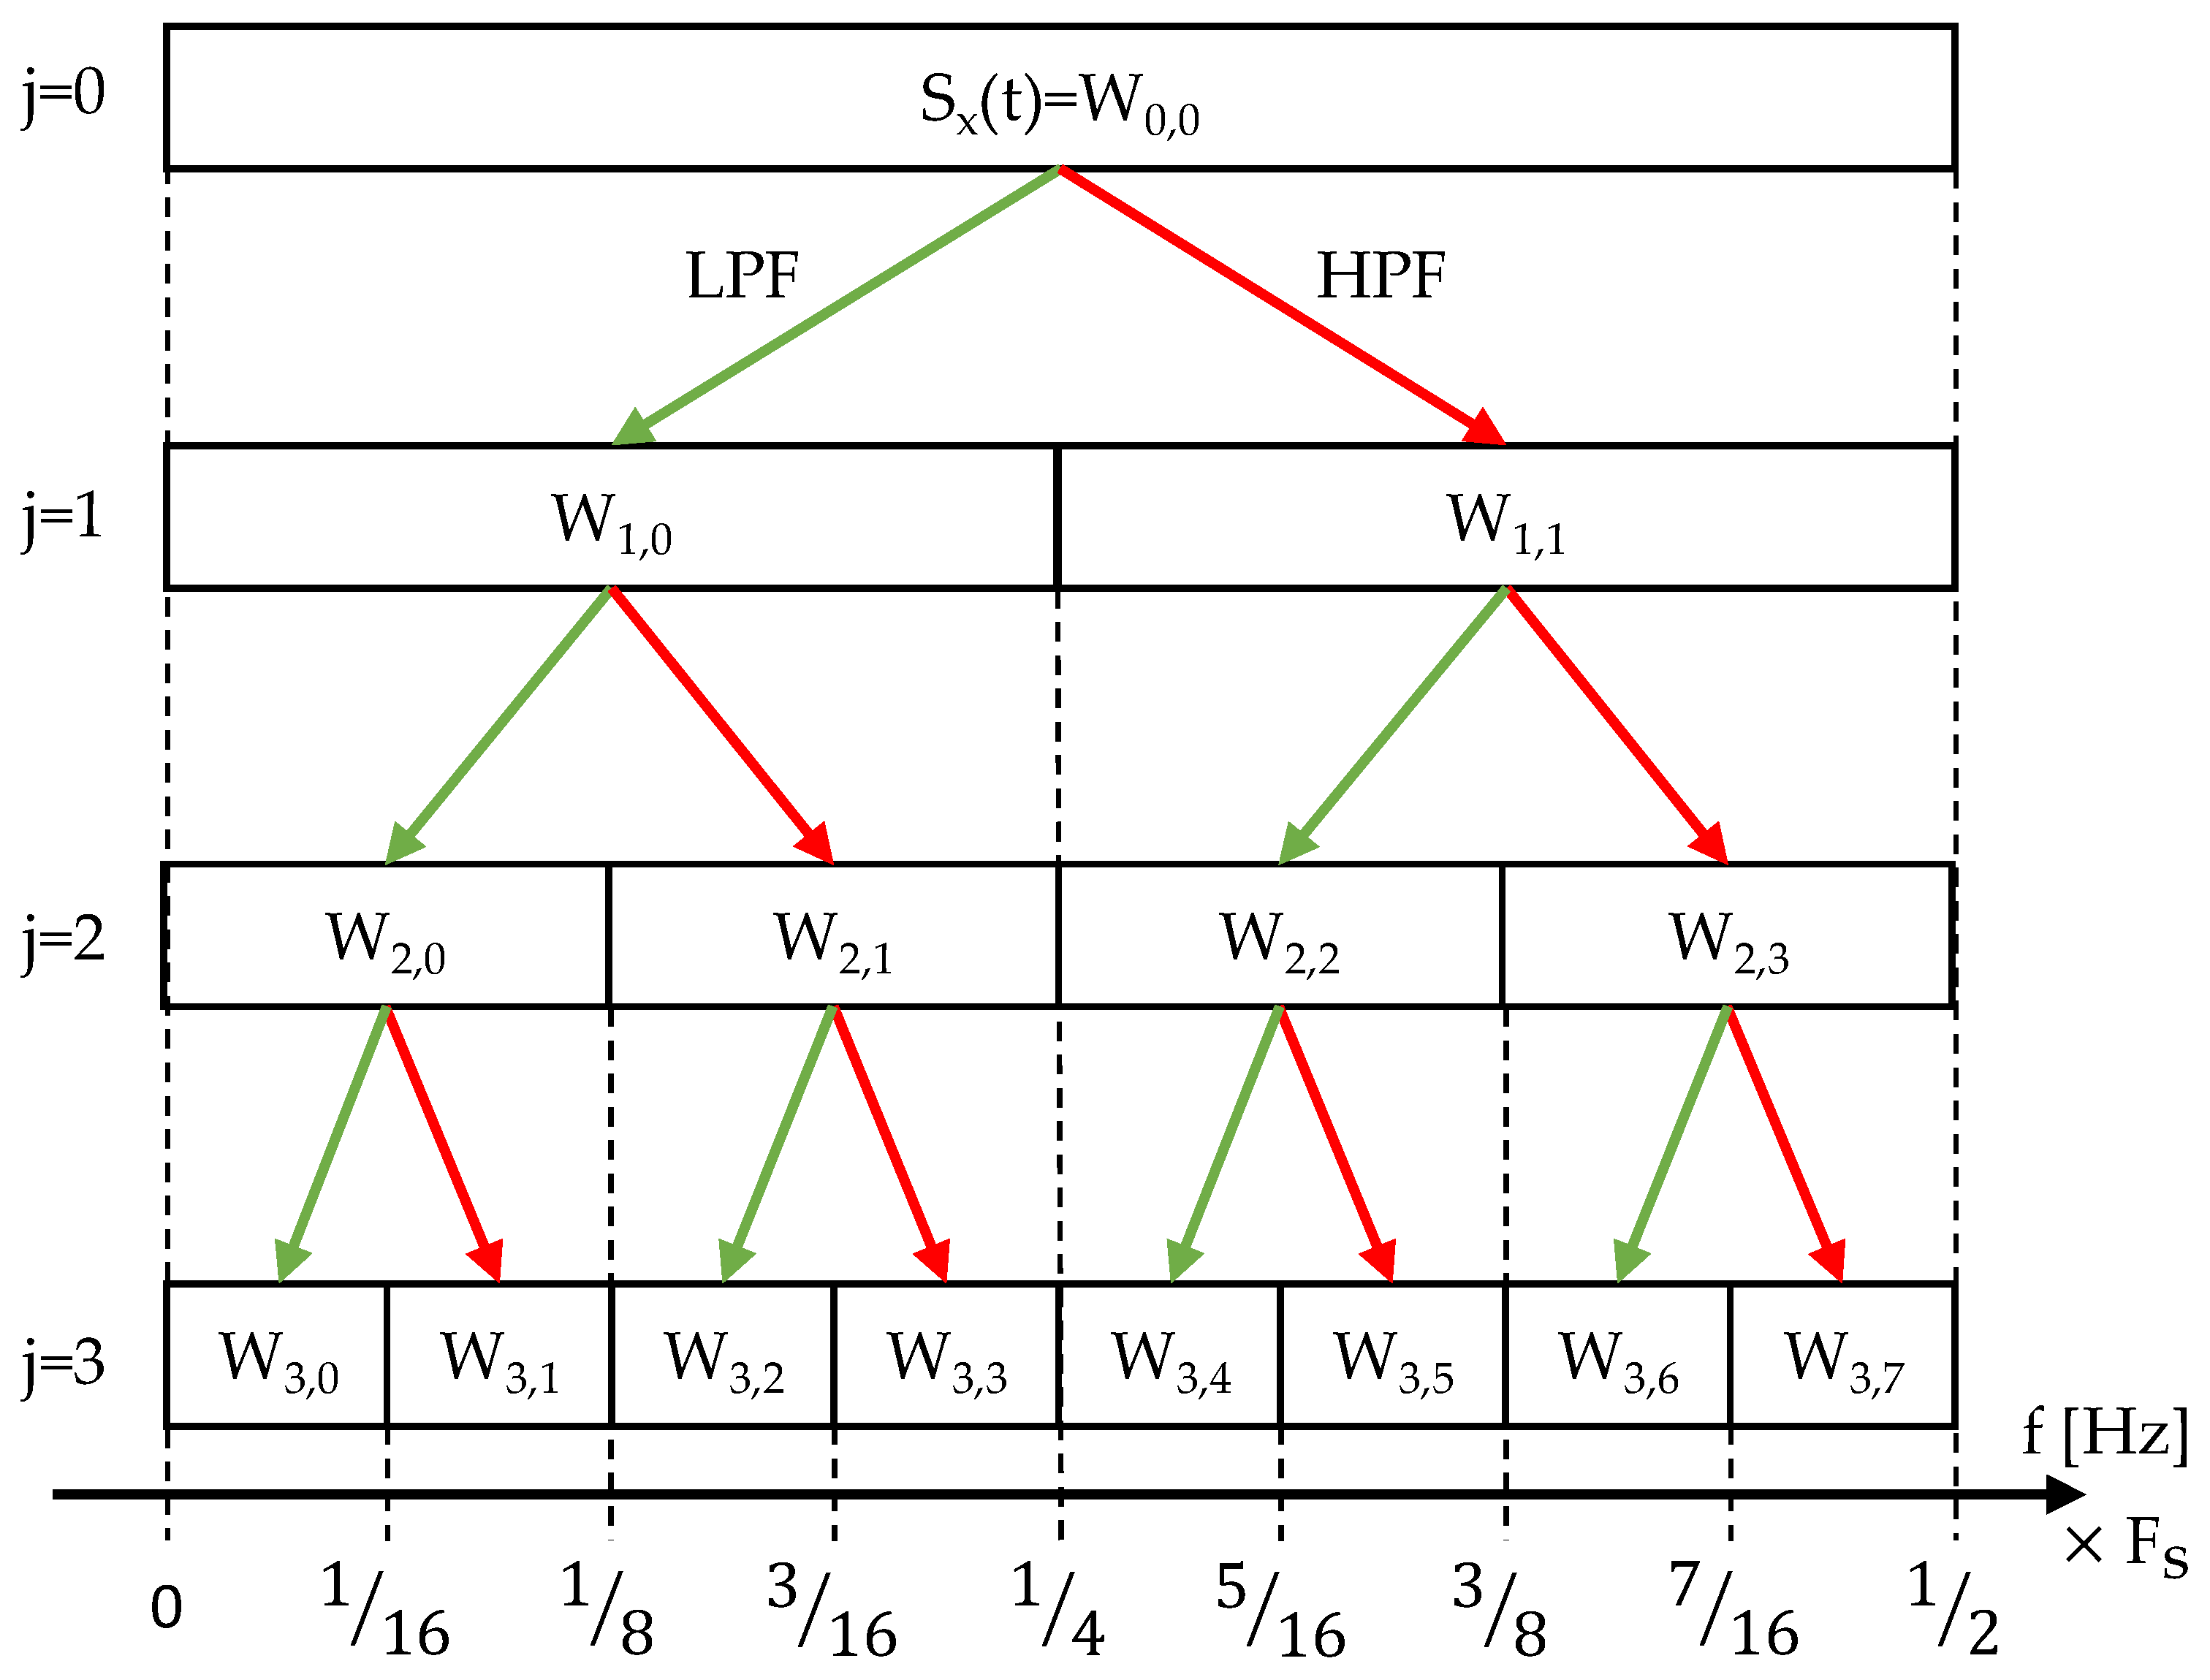
Figure 5.
Workpiece surface finishing.
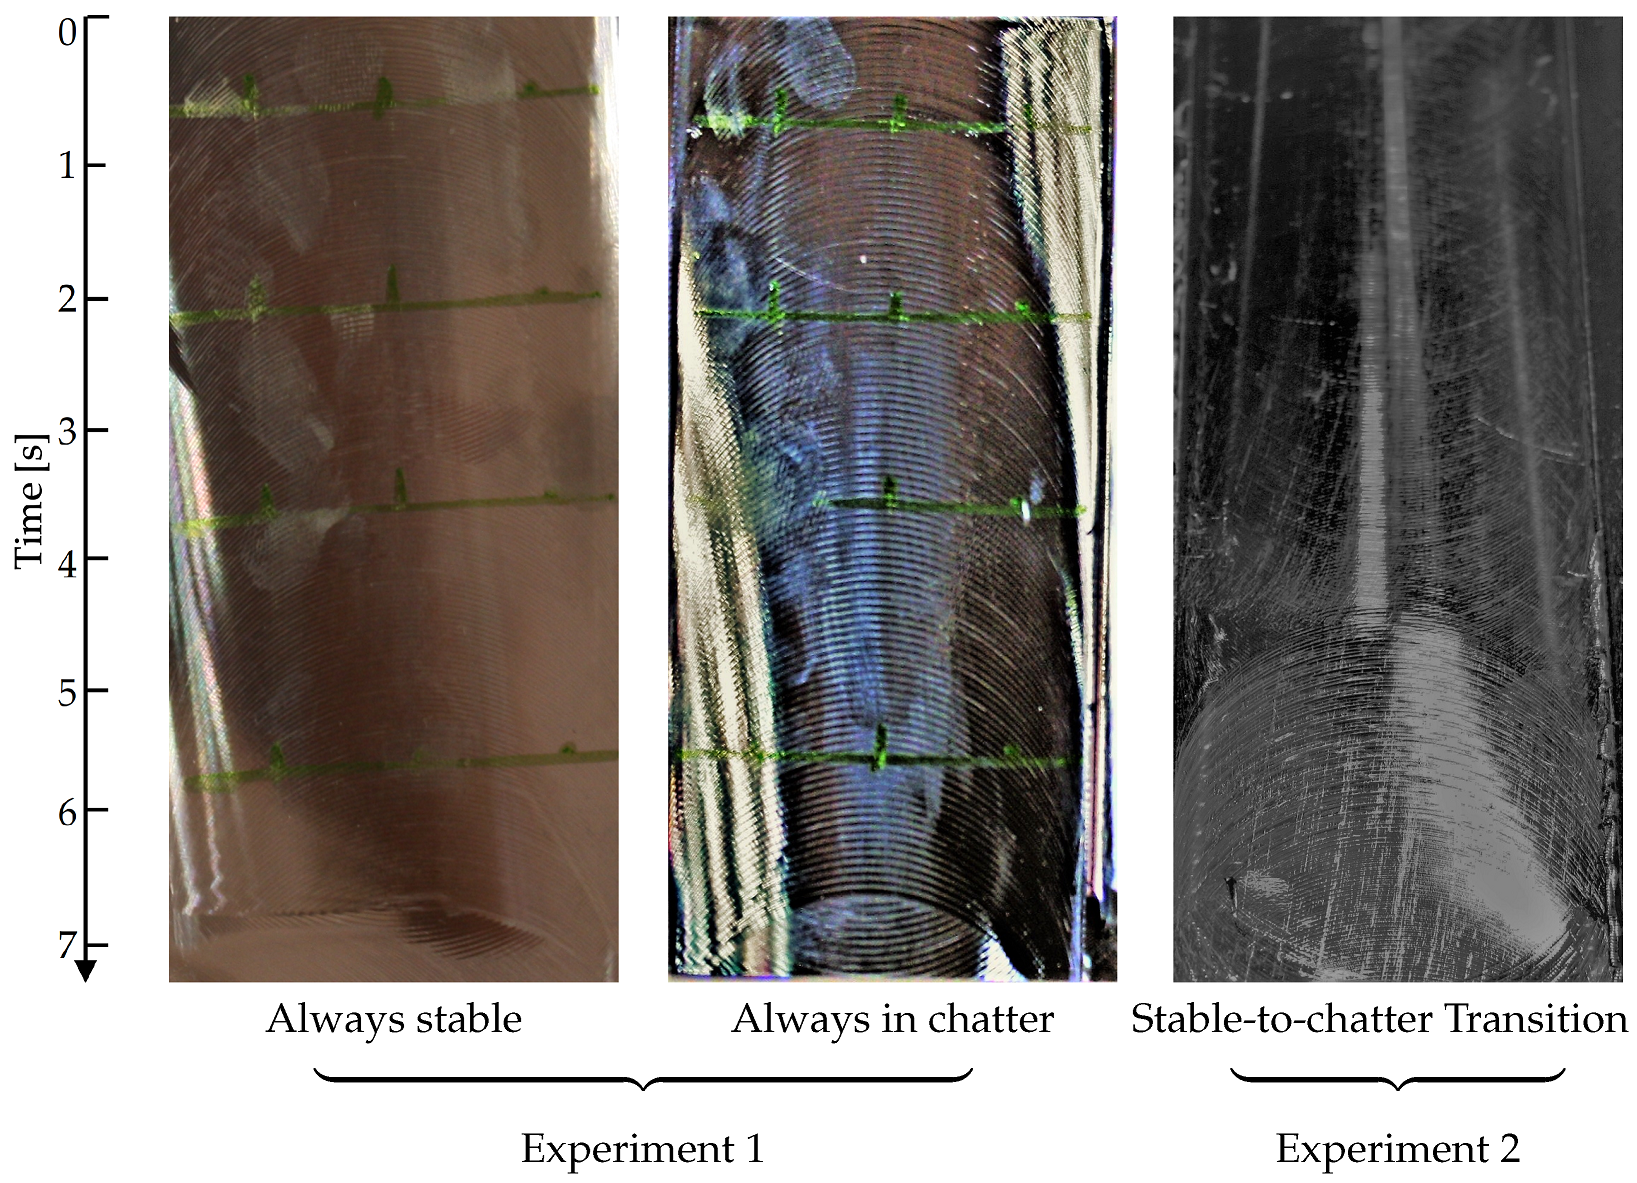
Figure 6.
Experimental setup for Experiment 1.

Figure 7.
Signals acquired during chatter-free conditions.

Figure 8.
Signals acquired during chatter conditions.
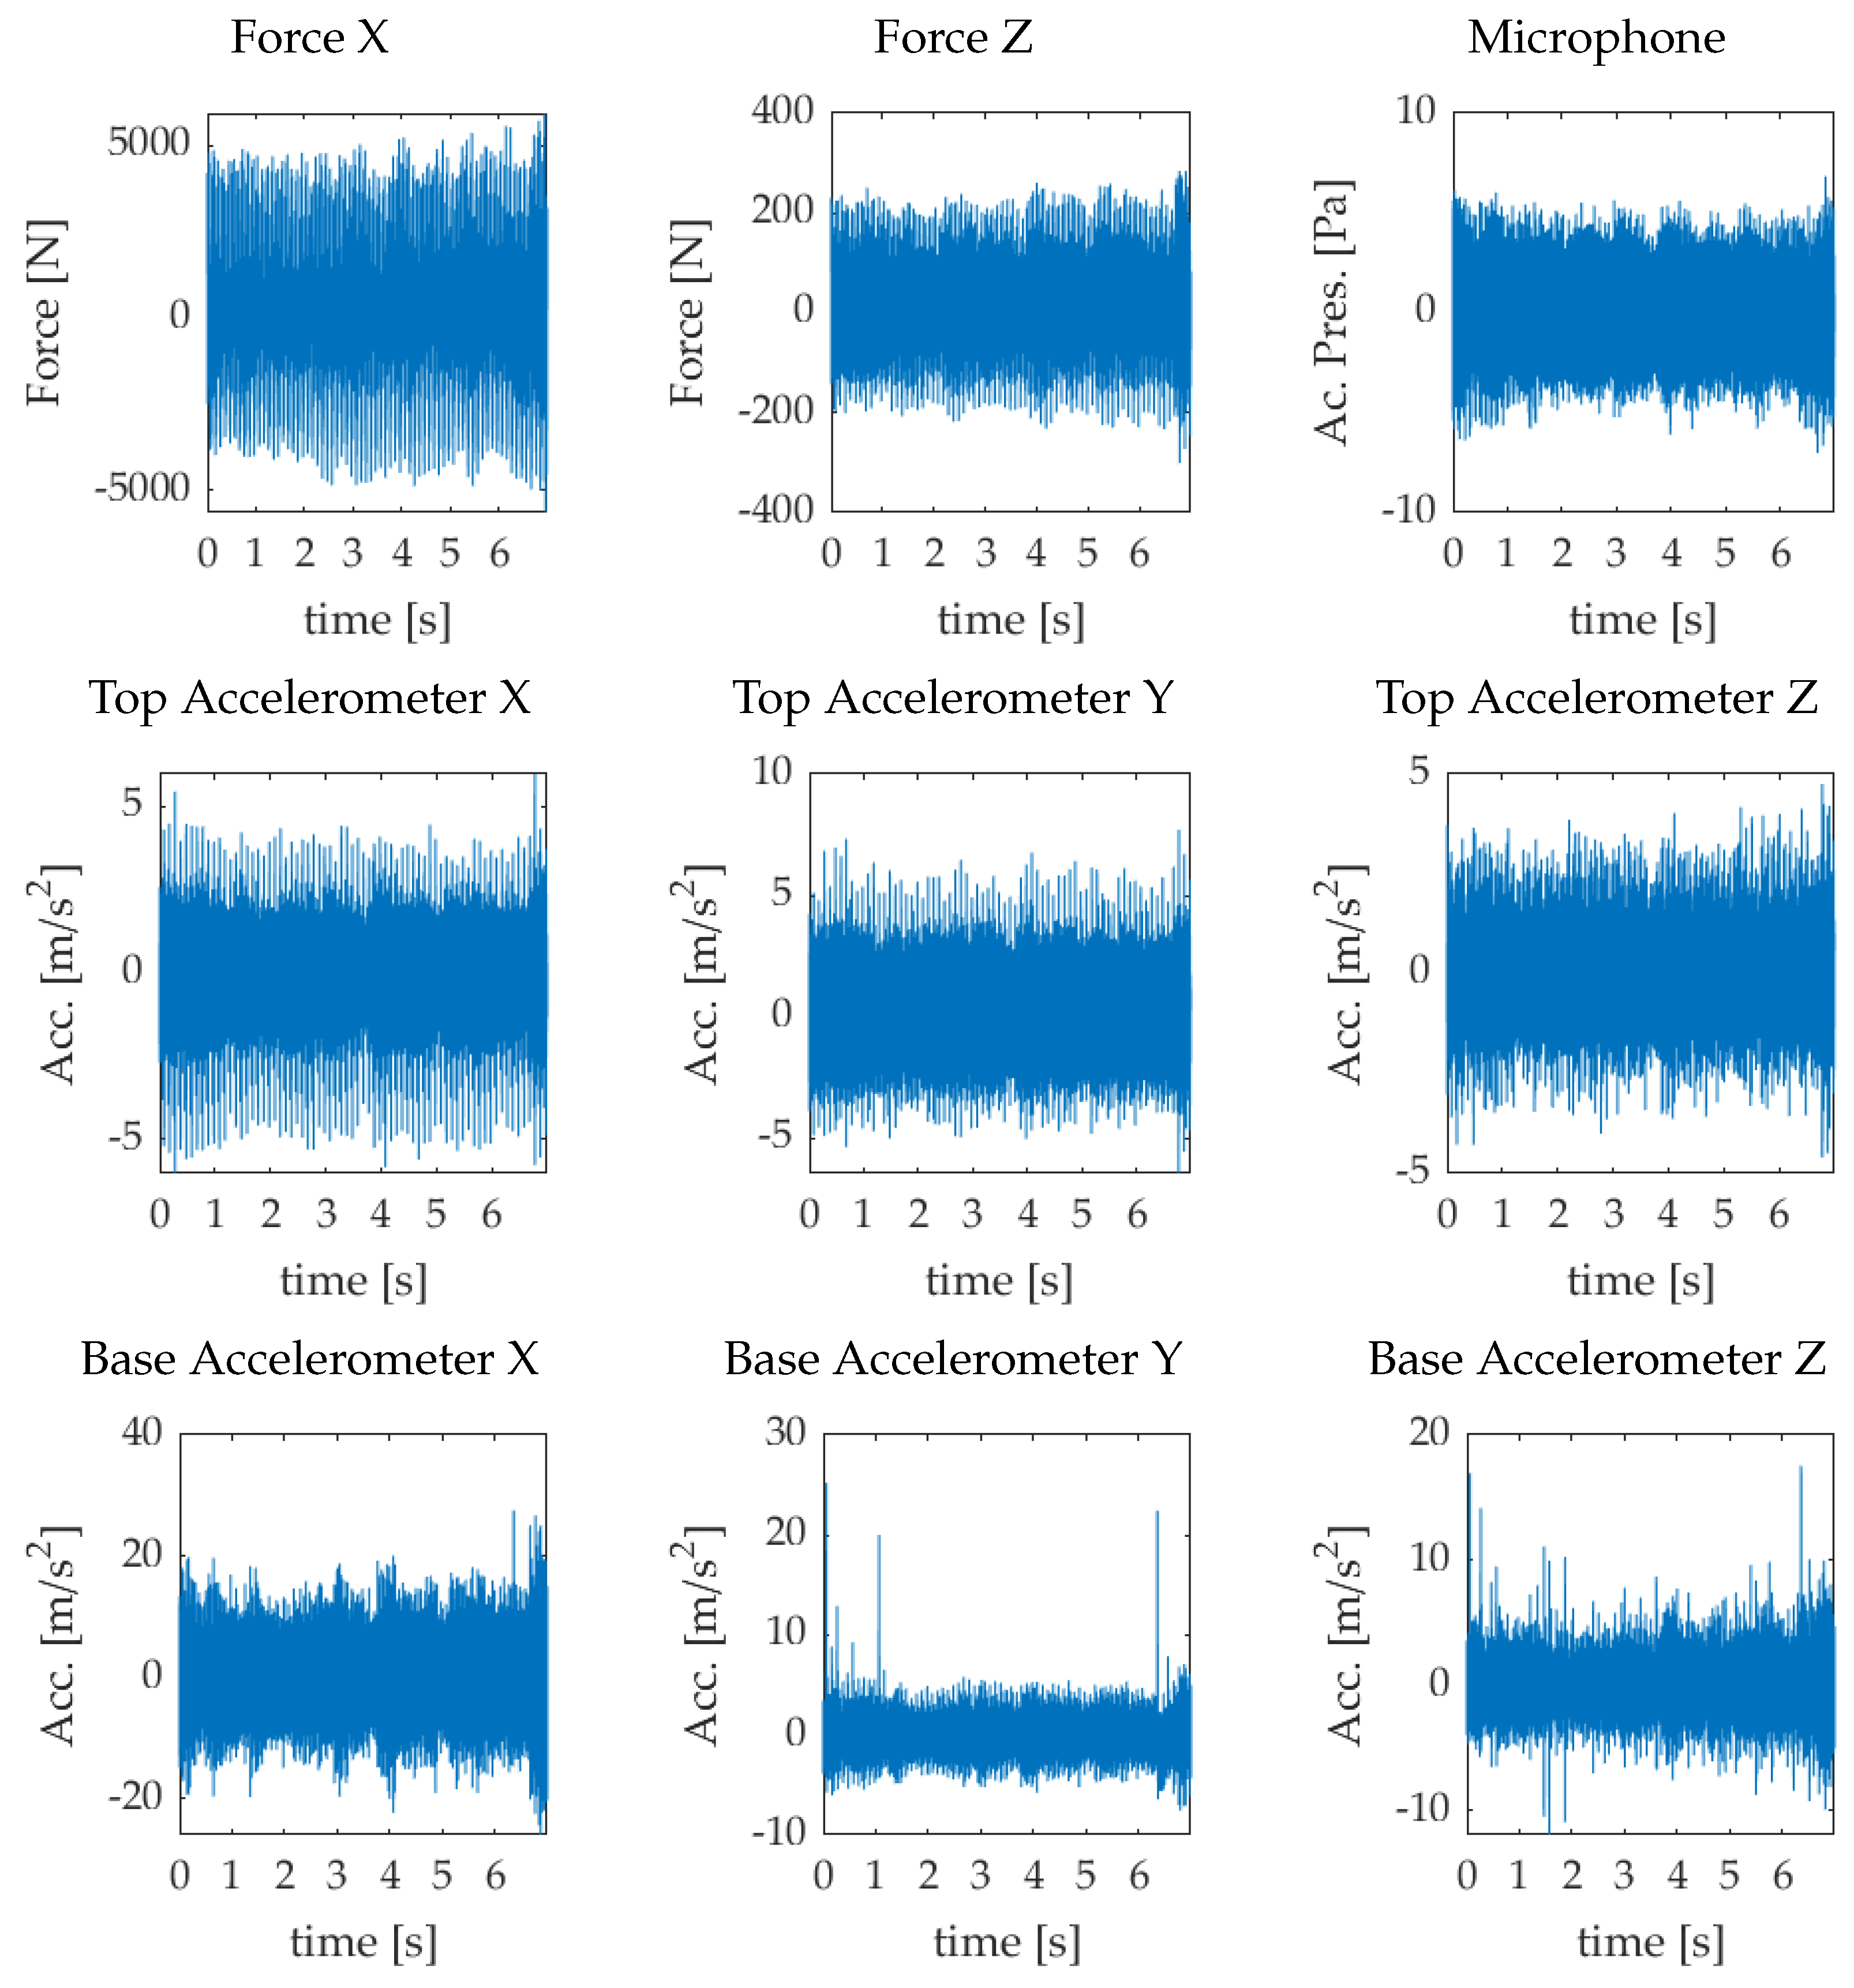
Figure 9.
PSD chatter indices: Blue for stable process—red for unstable process.

Figure 10.
Wavelet chatter indices: blue “always stable” process—Red “always in chatter” process.

Figure 11.
Signal spectra for “always stable” experiment.

Figure 12.
Signal spectra for “Always in chatter” experiment.
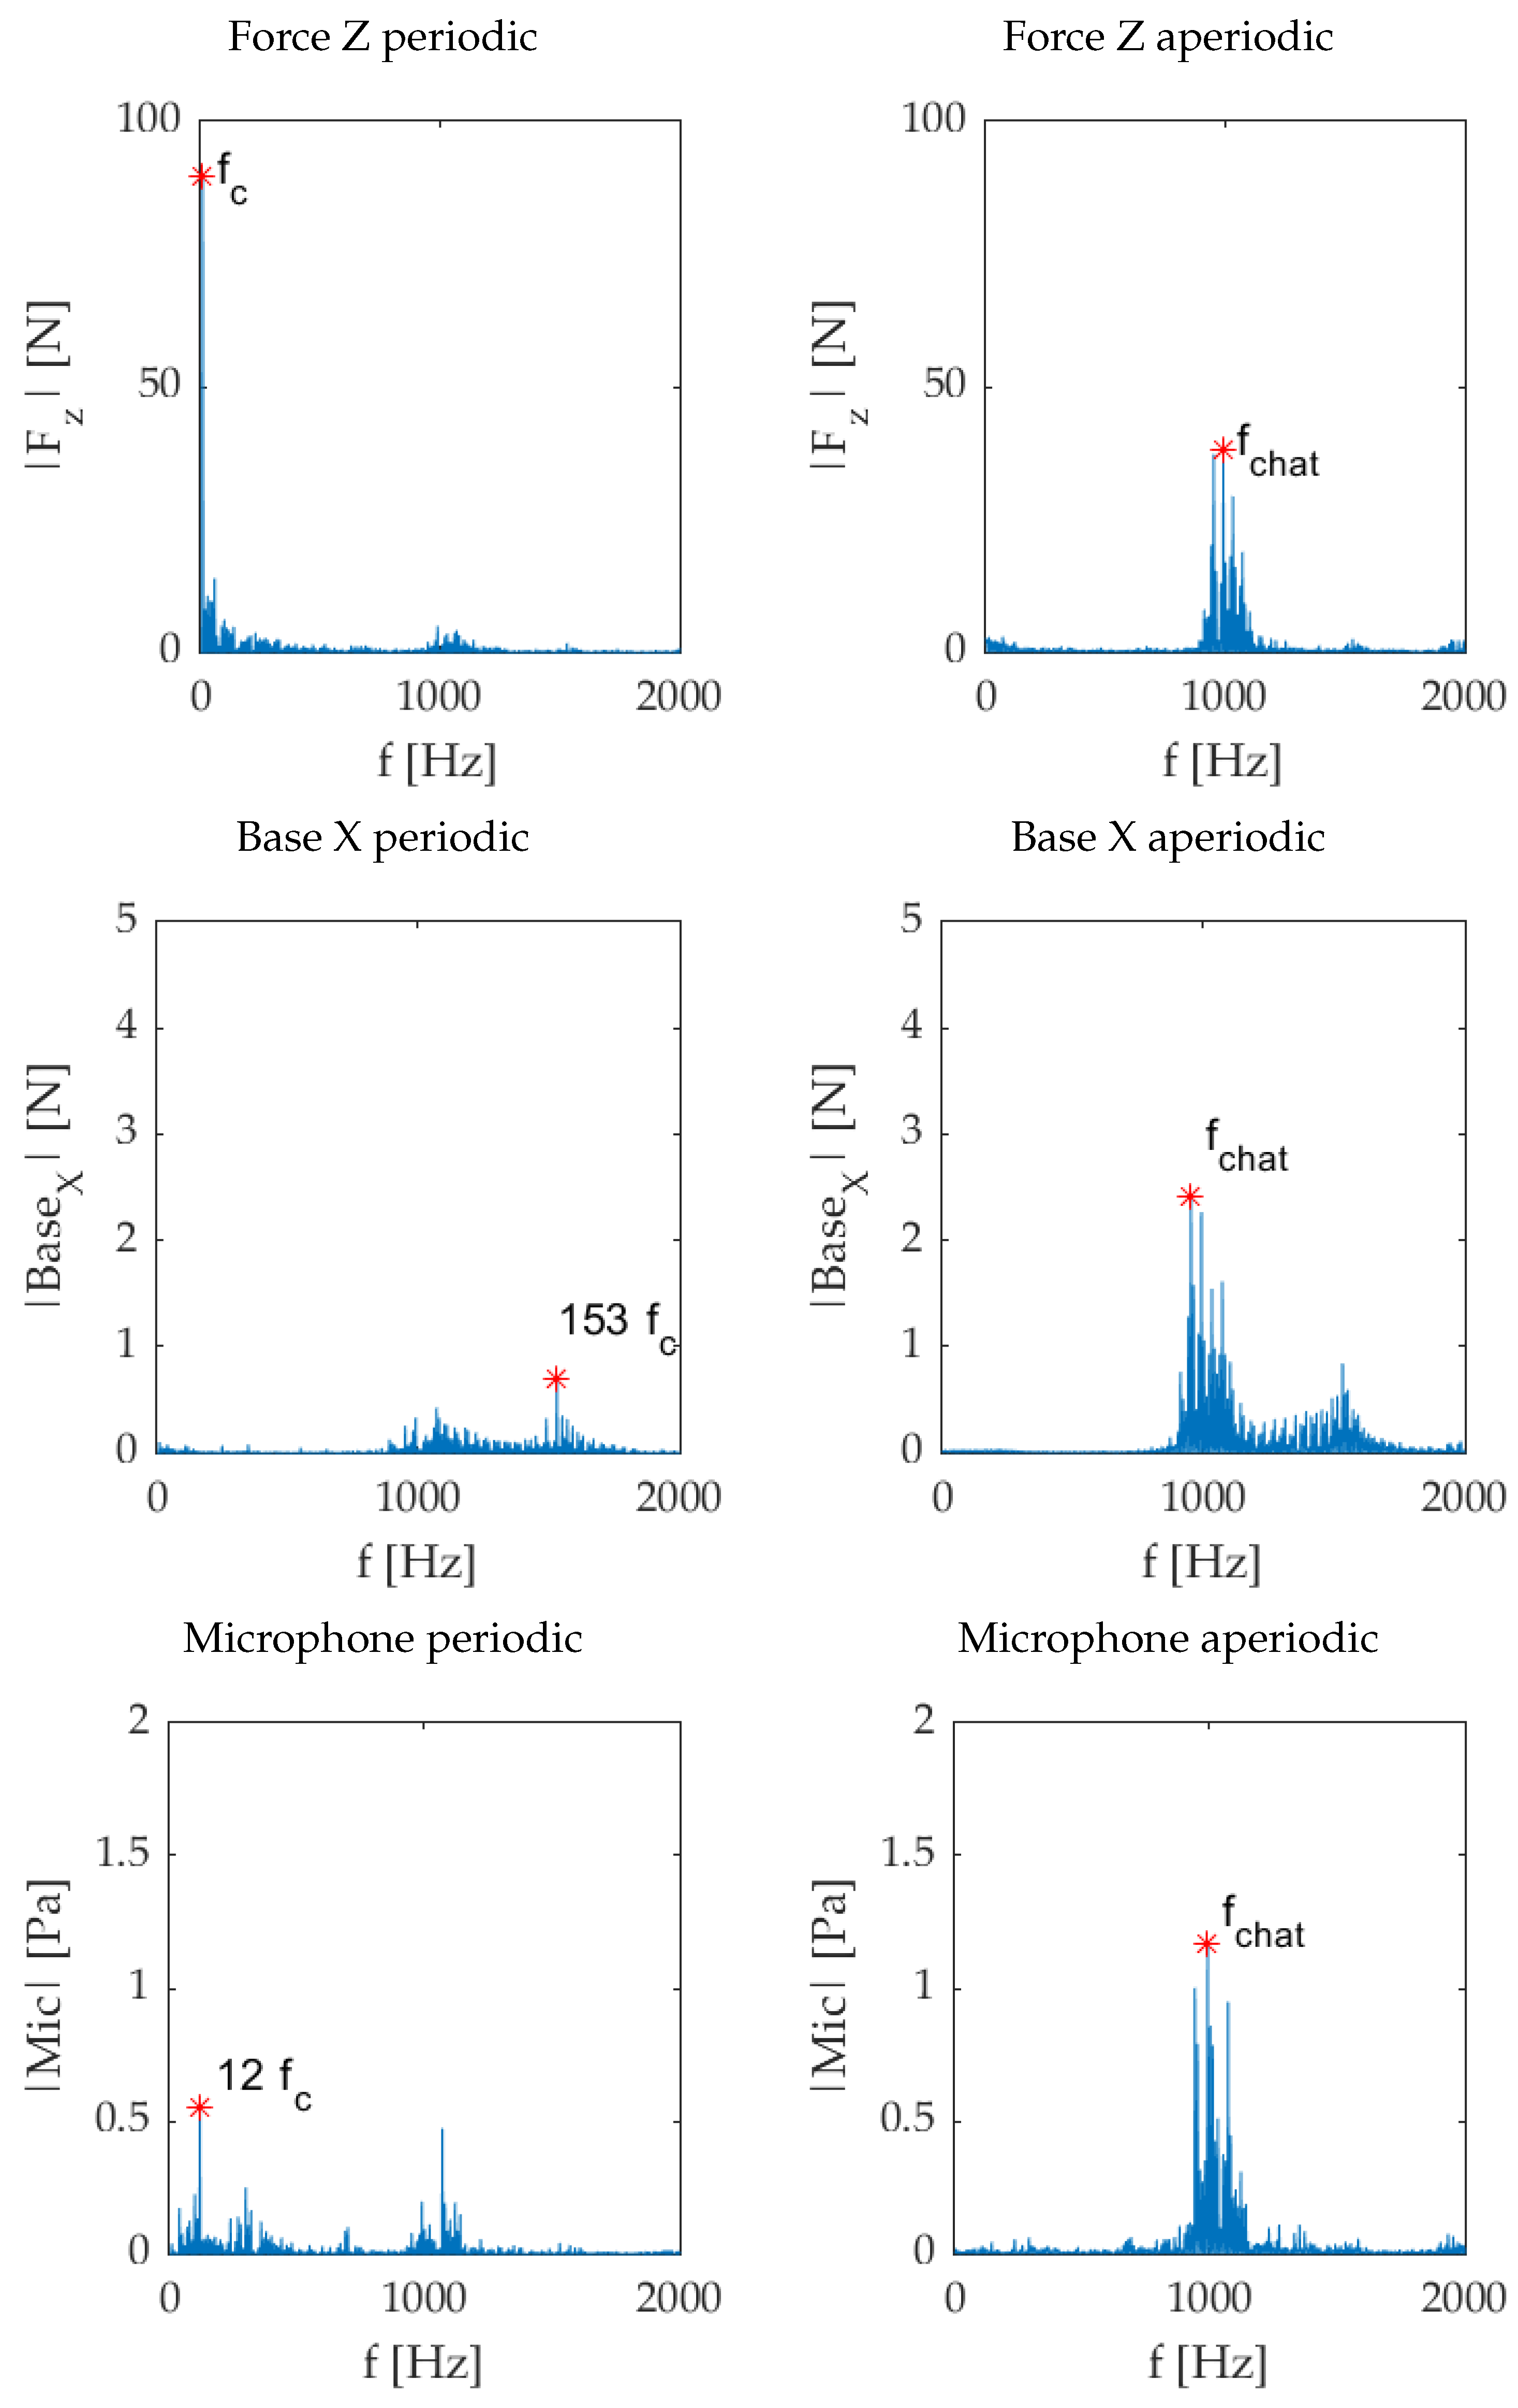
Figure 13.
Experimental setup for Experiment 2.
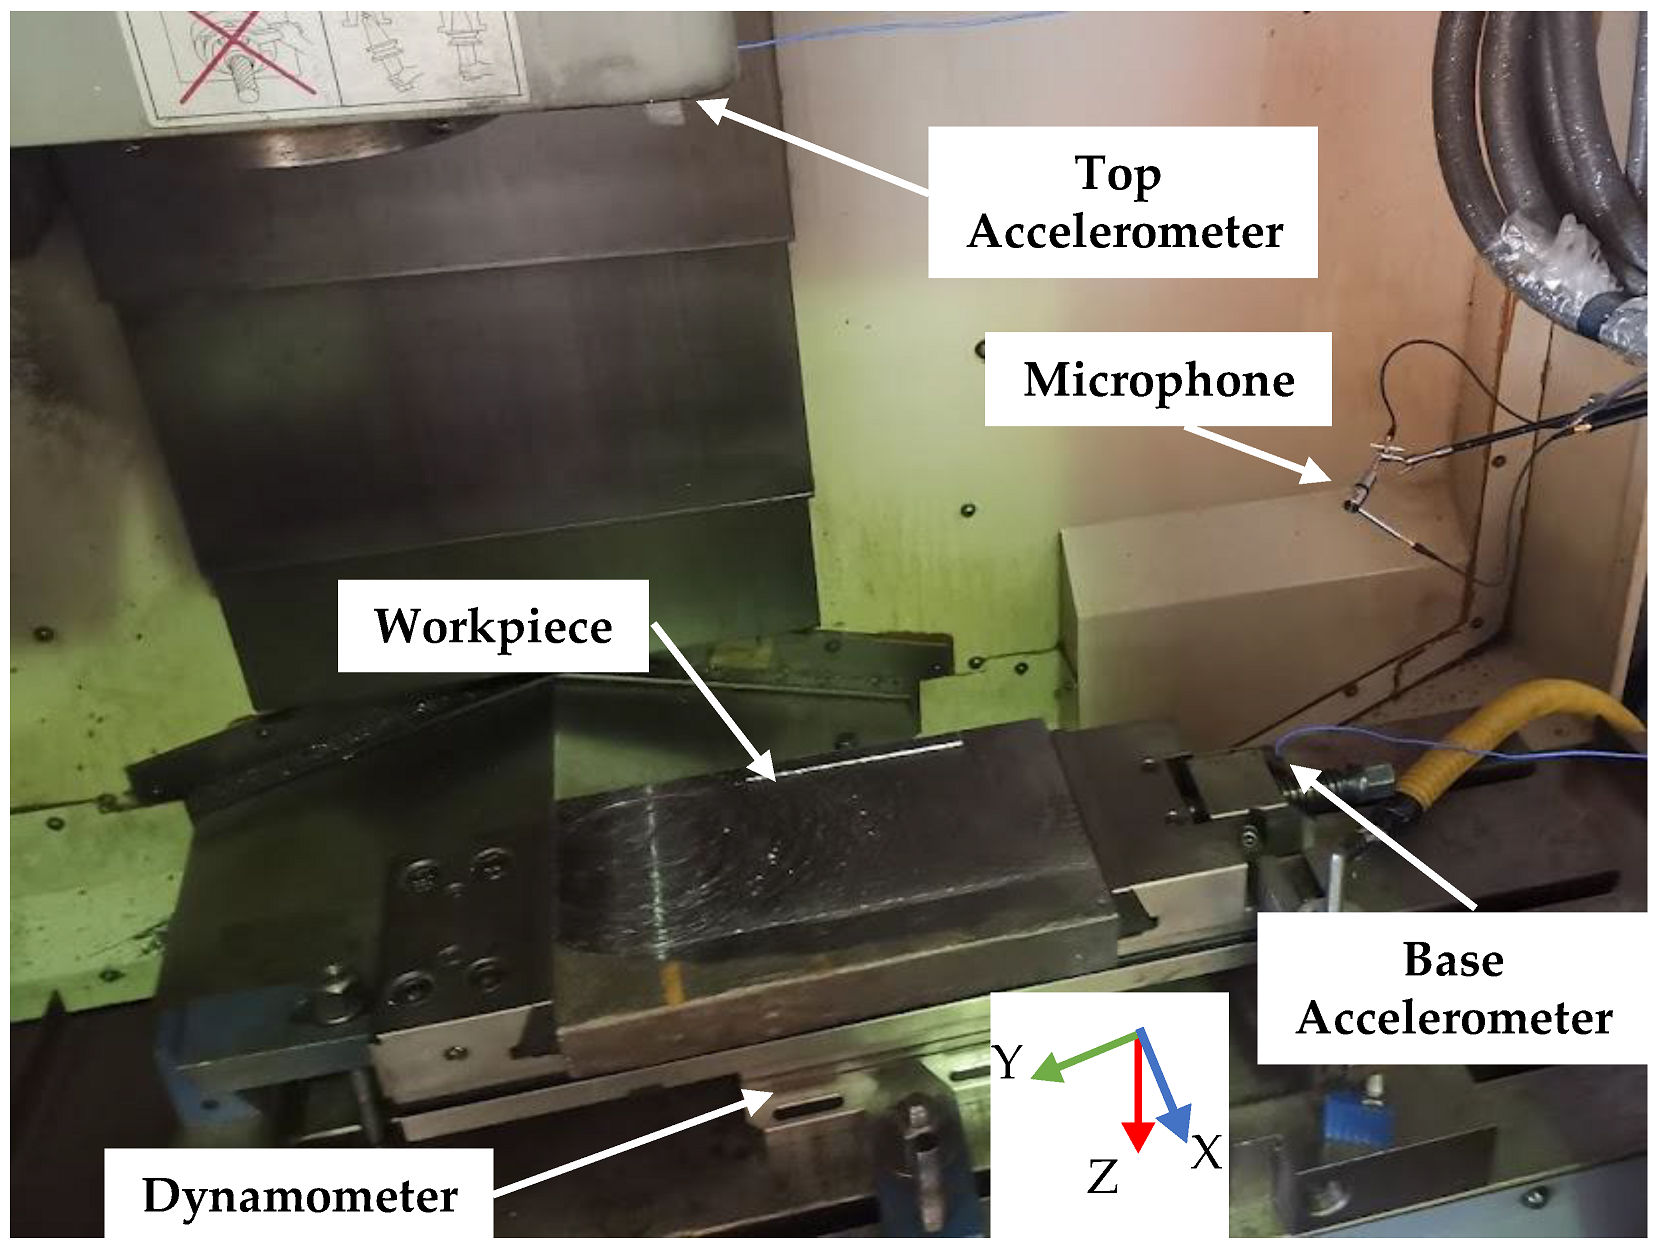
Figure 14.
Signals acquired in Case 2.
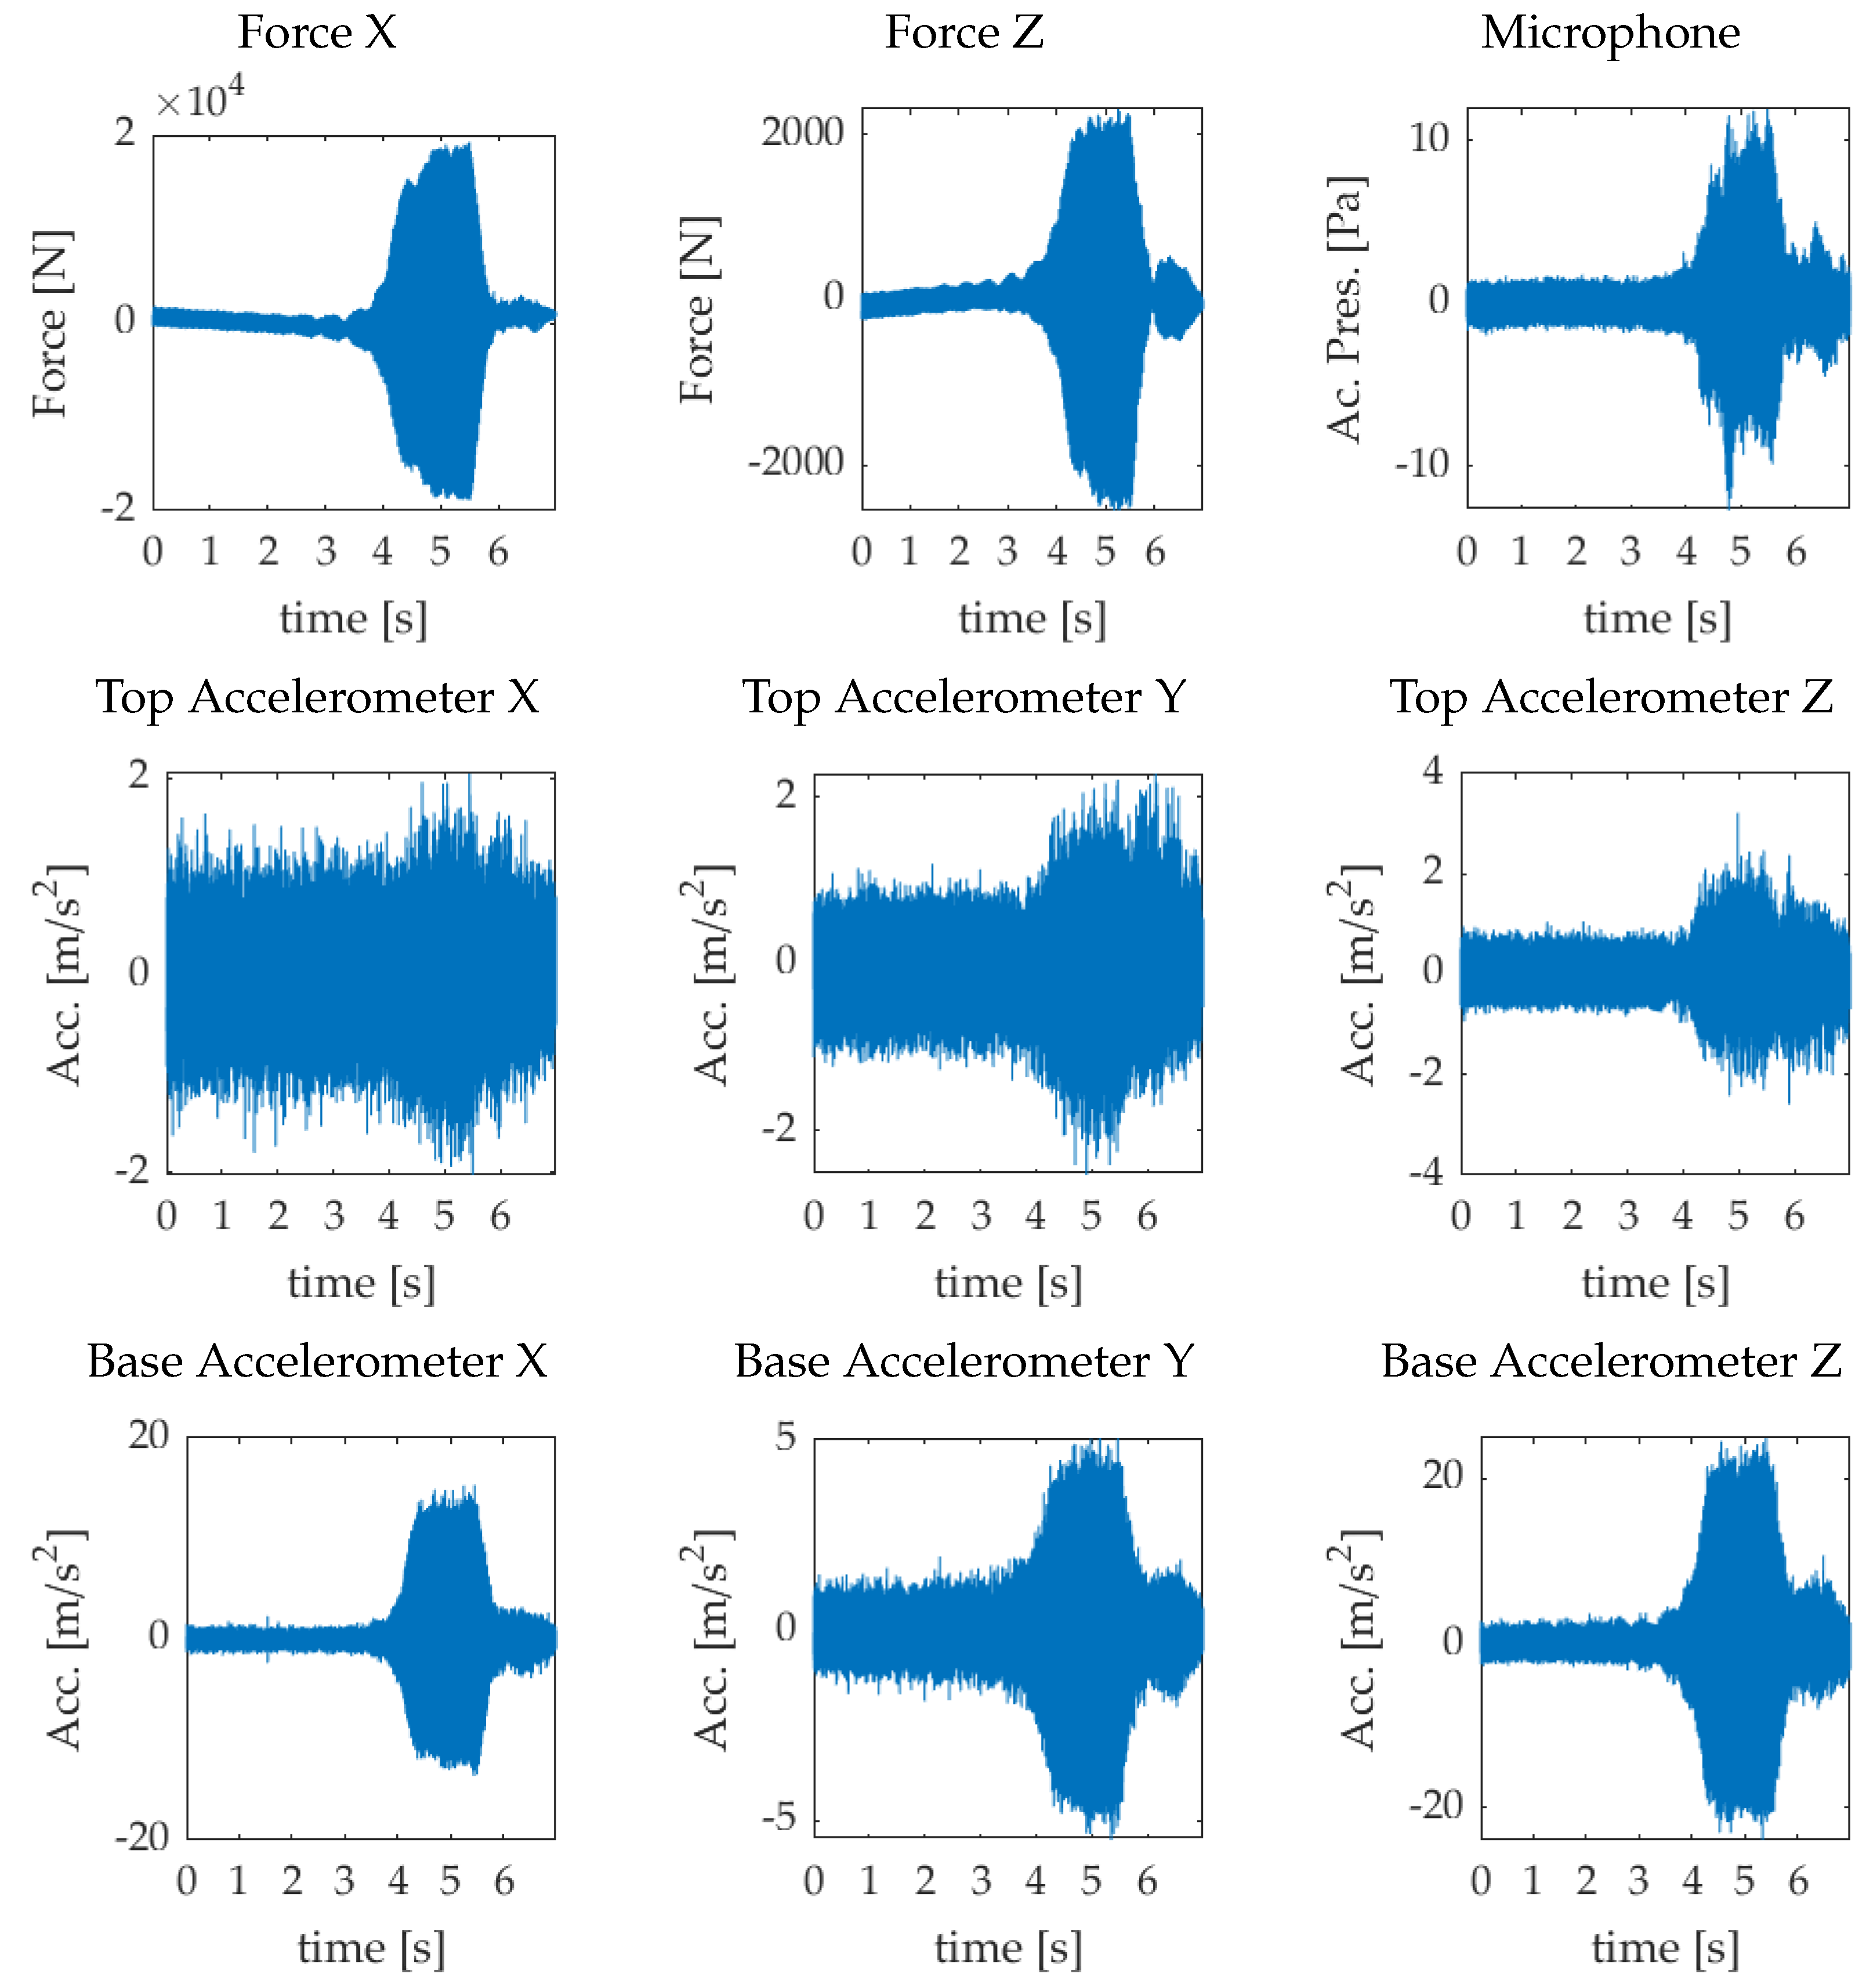
Figure 15.
PSD chatter indices for Experiment 2.
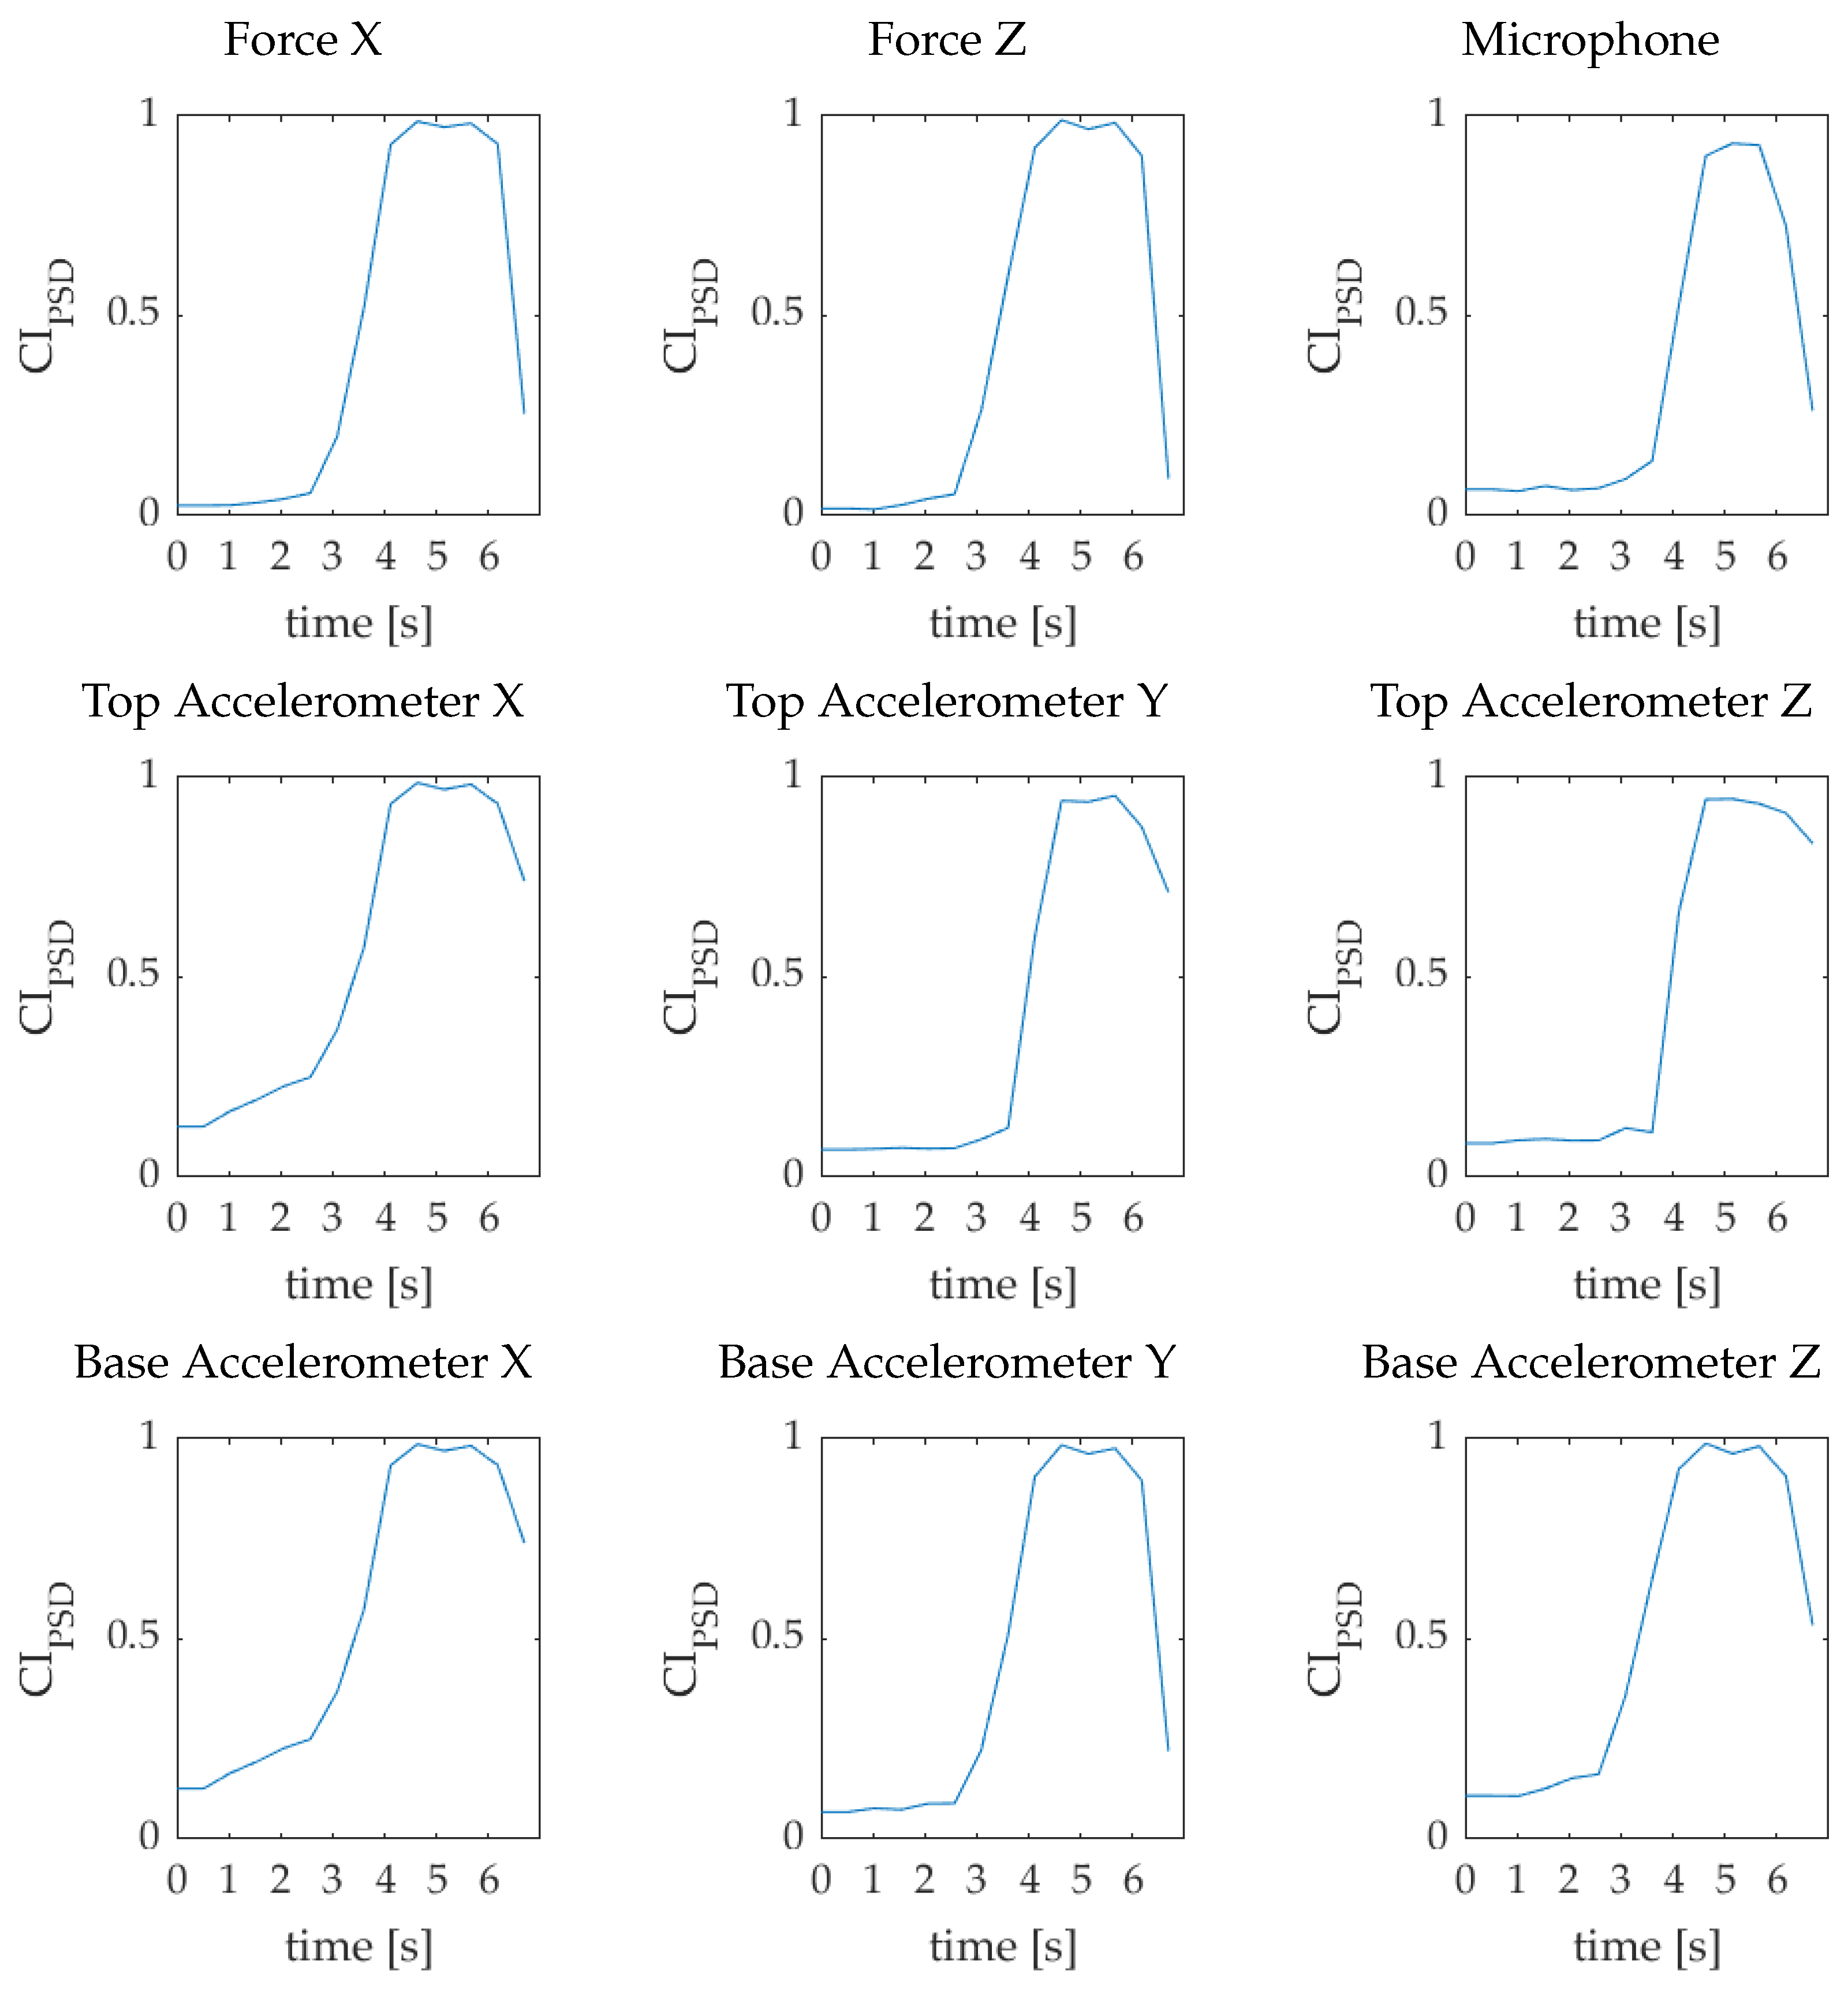
Figure 16.
Wavelet chatter indices for Experiment 2.

Table 1.
Sensors details.
| Sensor Name | Sensor Model | Details |
|---|---|---|
| Multicomponent Dynamometer | Kistler model 9257B | Three-axial force sensors Fx, Fy, Fz measuring range kN Clamping area 100 × 170 mm |
| Top and Base Accelerometer | PCB Piezotronics model 356A32 | Tri-axial ICP sensor Sensitivity 100 mV/g Measuring range ± 50 g |
| Microphone | GRAS microphone model 40GI | Free-field microphone Sensitivity 12.5 mV/Pa Frequency range 30 to 10 kHz |
Table 2.
Case 1: Experiment parameters.
| Experiment ID | Spindle Speed (rpm) | Depth pf Cut (mm) | Feed (mm/m) |
|---|---|---|---|
| Chatter-free | 900 | 4.5 | 500 |
| Chatter | 600 | 4.5 | 500 |
Table 3.
Cutting parameters for case 2.
| Experiment ID | Spindle Speed (rpm) | Depth pf Cut (mm) | Feed (mm/m) |
|---|---|---|---|
| Stable-to-chatter transition | 1750 | 2 | 1000 |
Publisher’s Note: MDPI stays neutral with regard to jurisdictional claims in published maps and institutional affiliations. |
© 2021 by the authors. Licensee MDPI, Basel, Switzerland. This article is an open access article distributed under the terms and conditions of the Creative Commons Attribution (CC BY) license (https://creativecommons.org/licenses/by/4.0/).
Share and Cite
MDPI and ACS Style
Perrelli, M.; Cosco, F.; Gagliardi, F.; Mundo, D. In-Process Chatter Detection Using Signal Analysis in Frequency and Time-Frequency Domain. Machines 2022, 10, 24. https://doi.org/10.3390/machines10010024
AMA Style
Perrelli M, Cosco F, Gagliardi F, Mundo D. In-Process Chatter Detection Using Signal Analysis in Frequency and Time-Frequency Domain. Machines. 2022; 10(1):24. https://doi.org/10.3390/machines10010024
Chicago/Turabian StylePerrelli, Michele, Francesco Cosco, Francesco Gagliardi, and Domenico Mundo. 2022. "In-Process Chatter Detection Using Signal Analysis in Frequency and Time-Frequency Domain" Machines 10, no. 1: 24. https://doi.org/10.3390/machines10010024
Note that from the first issue of 2016, this journal uses article numbers instead of page numbers. See further details here.