
Research on a Measurement Method for Middle-Infrared Radiation Characteristics of Aircraft


1
Shanghai Institute of Technical Physics, Chinese Academy of Sciences, Shanghai 200083, China
2
University of Chinese Academy of Sciences, Beijing 100049, China
*
Author to whom correspondence should be addressed.
Machines 2022, 10(1), 44; https://doi.org/10.3390/machines10010044
Submission received: 1 December 2021
/
Revised: 28 December 2021
/
Accepted: 4 January 2022
/
Published: 7 January 2022
(This article belongs to the Special Issue Precision Measurement and Machines)
Abstract
:Aiming at the problem wherein temperature inversion accuracy is unstable due to the major differences in atmospheric transmittance under various observation paths, a method for measuring radiation characteristics of an aircraft engine’s hot parts and skin using a cooled middle-wave infrared camera is proposed. Based on the analysis of the aircraft’s infrared radiation characteristics, the atmospheric transmission model of any observation path was revised, the absolute radiation correction model was established, and the temperature inversion equation was calculated. Then, we used the quasi-Newton method to calculate the skin temperature and discussed uncertainty sources. After the theoretical study, an outfield test was carried out. A middle-wave infrared camera with a wavelength of 3.7–4.8 μm was applied to the actual experimental observation of the turbofan civil aviation aircraft. The ground observation distance was 15 km, and the flying height was 3 km. When implementing temperature inversion with the method presented in this paper, the surface temperature of the aircraft engine hot parts was 381 K, the correction uncertainty was ±10 K, the surface temperature of the skin was 296 K, and the correction uncertainty was ±6 K. As the experiment showed, the method in this paper can effectively implement infrared target temperature inversion and provide a reference for the quantification of infrared data.
1. Introduction
The infrared radiation characteristics of highly maneuverable targets and their information interpretation are an important basis for target detection, recognition, and tracking [1]. The technical tackling of stealth materials on the surface of aircraft and the precise strike of suspicious targets in the air are in a great need of the real radiation characteristics of aircraft targets [2,3]. Therefore, measuring the infrared radiation characteristics of aircraft targets is not only conducive to infrared early warning and night reconnaissance of enemy flying targets, but also serves as an important reference value for improving the maneuverability and concealment of one’s own aircraft [4]. Infrared radiation data contain a large number of target characteristics, electromagnetic characteristics, and background information. With the explosive demand for infrared technology and infrared systems in the aviation field, many experts have increasingly conducted in-depth research on the infrared radiation characteristics of targets, showing a trend of blooming flowers. The past decades have seen the rapid development of target infrared radiation characteristic measurement in many methods. Based on the principles of thermodynamics and aerodynamics, the radiation intensity characteristic model of the aircraft skin, tail nozzle, and plume was established [5,6,7]. The authors of [8] made important contributions to the construction of the ground-to-space radiometric model of space targets. In the absence of external field test conditions, infrared target simulation data are widely used in the simulation measurement of aircraft radiation characteristics [9,10,11,12]. Taking into account the actual influencing factors, the real-time calibration and correction target infrared radiation measurement methods are proposed [13,14]. However, there are generally few measurements of aircraft radiation characteristics under high-speed navigation, and most experiments ignore the problem of atmospheric correction on the observation path in actual measurements.
In this paper, we set up a refrigerated middle-wave infrared camera to observe turbofan civil aircraft under high-speed navigation. A refrigerated area array middle-wave infrared camera is set up on the ground, for which the lens can be adjusted in elevation and azimuth directions. As the observation target of a civil aircraft in the air navigation state, the observation distance of the two can be calculated by using the horizontal and vertical distances between the imaging camera and the aircraft. By learning the infrared radiation source of aircraft targets and considering the difference in atmospheric transmittance at different observation angles from ground to air, the atmospheric transmission model of any observation path is revised. Based on the establishment of the absolute radiation calibration model, the inversion formula for the surface temperature of the fuselage is calculated; then, the factors that may induce temperature errors in the actual measurement process are discussed. In addition, on the basis of theoretical analysis, a radiation measurement experiment is carried out on a civil aviation aircraft in a flight state, collecting the measured radiation characteristic data of the flying target, inverting the target temperature, and calculating the temperature measurement error.
2. Infrared Radiation Characteristics of Aircraft
As shown in Figure 1, the infrared radiation sources of an aircraft flying in the atmosphere include the skin radiation heated by the engine’s hot parts, the thermal radiation of the tail flame high-temperature gas, the skin radiation of the fuselage, the reflection of the ground radiation and the reflection of sky radiation. Among them, the reflection of sky radiation is mainly composed of the reflection of solar radiation and the reflection of atmospheric background radiation [15].
The high-altitude aircraft target can be regarded as flying parallel to the ground; along the side observation direction of the infrared camera, the high-temperature gas at the tail of the aircraft is blocked to a certain extent. Thus, for the various thermal radiations of the aircraft itself, the skin radiation of the engine hot parts and the skin radiation of the aircraft fuselage will be focused on in the observation. The ground radiation is mostly dominated by long-wave radiation, and the solid angle of the ground radiation received by the side of the aircraft is small so that the skin radiation of the aircraft itself is much larger than the ground object radiation reflected by the aircraft [16]. The atmospheric radiation reflected by the aircraft has a low emissivity and a small amount of radiation, which is lower than that of the aircraft skin itself [17]. In short, the skin radiation can be approximated as the skin’s own thermal radiation.
Any object whose temperature is not equal to absolute zero is a heat source that spontaneously emits infrared radiation. When the temperature is T, the spectral radiance of blackbody radiation is given by the blackbody radiation law [18].
where denotes the first radiation constant, denotes the second radiation constant, denotes the wavelength, and denotes the thermodynamic temperature.
The aircraft skin is regarded as both a Lambert reflector with uniform radiance in all directions and a gray body. According to the Lambertian radiation relationship, the radiance of the aircraft skin is:
where denotes the aircraft surface emissivity, denotes the starting wavelength of the camera, and denotes the ending wavelength of the camera.
2.1. Aircraft Skin Infrared Radiation
An aircraft flying at high speed in the atmosphere will rub against the gas flowing over the surface of the fuselage in the air, generating a large amount of thermal energy to increase the temperature of the aircraft skin and emit a quantity of infrared radiation. The temperature of the aircraft skin has a connection to the flight parameters, aerodynamic shape, and atmospheric conditions of the aircraft. The aircraft skin temperature is approximated by the stagnation temperature of the static point on the aircraft skin surface [19], which can be expressed as:
where denotes the thermodynamic temperature of the atmosphere around the aircraft skin; denotes the temperature recovery coefficient, generally taken as 0.82; denotes the ratio of the air constant pressure heat capacity to the constant volume heat capacity, usually 1.3; and denotes the Mach number of the aircraft.
2.2. Engine Hot Parts’ Infrared Radiation
Figure 2 demonstrates a schematic diagram of the general structure of the turbofan engine ordinarily used in civil aviation aircraft. The fan is located at the forefront, followed by the part surrounding the turbine shaft and wrapped in the bypass air duct. From front to back, they are the high-pressure compressor, the combustion chamber, the high-pressure turbine, the low-pressure turbine, and finally, connection to the exhaust nozzle [20].
As the three important components at the core of turbofan engines, the high-pressure compressor, combustion chamber, and high-pressure turbine provide the main heat radiation for the entire engine and are the predominant positions for observing the engine’s hot parts. The test conducted by engineer Yumei Wang of the Chinese Flight Test Establishment on the wall temperature of the engine’s hot parts can roughly determine that when the ground temperature is 34–35 °C and the engine is in the state of low non-afterburning on the ground, the wall temperature of aircraft’s hot parts is about 70–100 °C, can reach a maximum of 170 °C in the state of a large afterburner, and can reach 190 °C in the state of a large afterburner in the air [21]. Since the core of the aircraft engine is wrapped in an outer duct full of cold air, and the aircraft skin is constantly exchanging heat with the high-altitude cold air during the high-speed flight, the aircraft skin temperature of the hot parts of the engine is much lower than the working temperature of the inner core machine [22].
This means that the aircraft skin’s infrared radiation of the engine hot parts in the air flight is affected by the heat transfer of the high-temperature core engine and the external airflow.
2.3. Reflected Solar Radiation
Solar radiation is consistent with the absolute blackbody radiation of 5900 K, and its radiation energy is projected onto the Earth’s surface after being absorbed by the atmosphere by about 35%. The solar radiation reflected by the aircraft skin also belongs to graybody radiation [23], which can be expressed as:
where denotes the effective radiant illuminance of the sun, and denotes the surface emissivity of the aircraft. If the aircraft is sailing at night, it will not be considered. If the aircraft is working at night, is not considered.
3. Atmospheric Transmission Model
During the propagation of infrared radiation in the atmosphere, radiation is absorbed and scattered by gas molecules and aerosol particles in the atmosphere, which leads to the attenuation of infrared radiation energy [24]. The relationship between the attenuation coefficient and transmittance in the atmosphere is:
where denotes the length of the transmission path, denotes the atmospheric transmittance, and denotes the attenuation coefficient.
As the uniformity of the atmosphere in the horizontal direction is greater than that in the vertical direction [25], to conveniently calculate the attenuation of infrared radiation from the atmosphere, the atmosphere between the aircraft target and the ground is divided vertically into multiple layers with a height of , as given in Figure 3. The aircraft’s flying height is , and the ground distance is . The total transmission path length in the line-of-sight direction can be obtained by the transmission path length of each layer.
where denotes the total transmission path length; denotes the transmission path length of each layer; denotes the total number of divided layers; denotes the number of layers, where the first layer is closest to the ground; and denotes the transmission path length of layer .
The atmospheric temperature and pressure in each layer are uniform and constant, and the molecules are in a state of local thermal equilibrium. Furthermore, the total atmospheric transmittance is the product of the atmospheric transmittance of each layer.
where denotes the total atmospheric transmittance, and denotes the atmospheric transmittance of layer .
3.1. Absorption of H2O Molecules
The ozone in the atmosphere is mainly concentrated at an altitude of 20–50 km, and the content of methane is low. Therefore, water vapor and carbon dioxide are dominant in the absorption of infrared radiation in the troposphere [26]. Generally, the amount of water vapor in the atmosphere is expressed by the amount of precipitation. As shown in Figure 4, assuming that the atmosphere is a cylinder with a bottom surface ΔS equal to the camera aperture and a length x equal to the transmission distance, the height w at which water vapor condenses into liquid water in the cylinder is called precipitable water vapor [27].
where denotes the amount of precipitable water vapor, denotes the relative humidity at altitude , denotes the saturated water vapor content related to the temperature , and denotes the infrared radiation transmission distance.
We can fit the data between the amount of precipitable water vapor at sea level and the average atmospheric transmittance between 3.7 and 4.8 μm with Equation (10) [27].
where denotes the atmospheric transmittance of , denotes the multiple factor, and denotes the index coefficient.
At the same time, the root mean square error (RMSE) is used as the standard for evaluating the fitting accuracy. The closer the fitted curve fits the real original data points, the smaller the RMSE, and the higher the fitting accuracy. The fitting coefficients are presented in Table 1.
where denotes the total number of samples, denotes the number of sample sequences, denotes the original value, and denotes the fitted value.
The atmospheric transmittance of in the line-of-sight observation direction needs to be corrected by the correction factor before it can be used.
where denotes the correction factor, denotes the atmospheric pressure at altitude , denotes the atmospheric pressure at sea level, denotes the temperature at altitude , denotes the temperature at sea level, and denotes the infrared radiation transmission distance.
The atmospheric transmittance of in the line-of-sight observation direction needs to be corrected by the correction factor before it can be used.
3.2. Absorption of CO2 Molecules
Similar to , we use Equation (14) to fit the transmittance data at different distances from sea level in each band [28]. Table 2 illustrates the fitting coefficients.
where denotes the atmospheric transmittance of , denotes the multiple factor, denotes the index coefficient, and denotes the infrared radiation transmission distance.
The correction factor is utilized to correct the data that are only applicable to sea level to obtain the atmospheric transmittance of CO2 under any observation path.
where denotes the atmospheric pressure at altitude , denotes the atmospheric pressure at sea level, denotes the temperature at altitude , denotes the temperature at sea level, and denotes the correction factor.
3.3. Scattering of Aerosols and Particles
Suspended particles, aerosols, etc., contained in the atmosphere will change the original transmission direction of infrared radiation, resulting in scattering attenuation, including Rayleigh scattering and Mie scattering. For atmospheric transmittance caused by scattering, the meteorological range is generally used as the reference [29].
where the scattering transmittance at sea level, denotes the meteorological optical range, denotes the correction factor, and there is the following relationship:
Taking into account the influence of altitude on aerosol and other particles, the scattering transmittance is corrected.
where denotes the feature height, usually .
Therefore, the scattering transmittance of different heights can be described as:
To summarize, the total atmospheric transmittance of each band can be obtained as:
4. Theoretical Model of Temperature Measurement
4.1. Background Radiation
Figure 5 demonstrates the process of the infrared camera receiving radiation signals. While aerial targets are imaged on the middle-wave infrared camera through the atmosphere, the background radiation of non-targets is also imaged on the infrared camera. The radiance of the non-target background pixel in the infrared image consists of the atmospheric background radiation after atmospheric attenuation and the thermal detector radiation . The radiance of the target pixel in the infrared image is composed of the target actual radiation through the atmosphere and the background pixel radiation .
where denotes the background pixel radiation received by the infrared camera, denotes the atmospheric background radiation, denotes the atmospheric transmittance, denotes the thermal radiation of the detector itself, denotes the target pixel radiance received by the infrared camera, and denotes the actual radiation of target.
Therefore, the radiance of the target signal received by the camera at the entrance pupil can be obtained by subtracting the entrance pupil radiance of the target pixel and the entrance pupil radiance of the background pixel.
4.2. Absolute Radiometric Calibration Model
There is a corresponding relationship between the radiation response collected by the detector and the intensity of the radiation source [30]. The purpose of absolute radiometric calibration is to obtain the linear relationship between the digital number of the radiometric response and the radiance of the entrance pupil.
where is the radiation response value collected by the middle-wave camera, denotes the detector responsivity, denotes the fixed offset of the infrared detector at a dark level, and denotes the radiance at the optical entrance pupil of the detection system.
By collecting two sets of (,) values at different blackbody temperatures, the coefficient (,) in Equation (23) can be calculated to obtain the relationship between the radiation response and the entrance pupil radiance. During the blackbody calibration process, the camera lens is placed close to the blackbody to reduce the attenuation. It is considered that the radiance at the optical entrance pupil is equivalent to the radiance of the blackbody, and the radiance of the blackbody can be calculated by Equation (2) using the blackbody temperature and the blackbody emissivity.
4.3. Temperature Inversion Model
The radiation response value of the target signal received at the entrance pupil of the mid-wave infrared camera can be obtained by subtracting the radiation response of the background pixel from the collected radiation response of the target pixel. Therefore, the collected target signal radiation response value can be represented as:
It can be seen from Equation (2) that when the system parameters and atmospheric transmittance are known, the radiance of the target signal reaching the entrance pupil is only related to the target’s own temperature . Then the variable , which is only related to , is used to represent the radiance of the target signal reaching the entrance pupil.
In an ideal state, the radiance of the target signal arriving at the entrance pupil should be equal to the radiance of the entrance pupil received by the camera. Therefore, the objective function is established.
We can solve the optimal parameter to minimize the objective function.
There must be a maximum value of for the skin temperature of the aircraft in the air flight state, which is roughly estimated to be 443 K in [22], and the temperature must be higher than the atmospheric temperature at the flight altitude . Therefore, is continuous in the closed interval and , so is continuous on the closed interval of and . We can take the partial derivative of with respect to :
Each factor of is continuous in the closed interval of and . It can be deduced that the product of each continuous factor is also continuous in the closed interval of and . Similarly, and are continuous in the closed interval of and , so has a continuous derivative in the closed interval of .
Therefore, the partial derivative of the objective function with respect to exists.
Similarly, also exists as the second partial derivative of the objective function with respect to .
In this paper, the quasi-Newton method is used to iterate to find the local minimum of the objective function through a given initial value. This process is illuminated in Figure 6. To realize the optimization of the one-dimensional unconstrained objective function, it is approximated by the second-order Taylor expansion, and the extreme point is obtained.
where denotes the number of iterations, denotes the temperature of the th iteration, denotes the partial derivative of the objective function, and denotes the second partial derivative of the objective function.
Equation (31) is used as an iterative formula. According to the given initial temperature and allowable error , by measuring the gradient value change, if the absolute value is less than the allowable error, the point is considered the extreme point, and the iteration output result is ended. Otherwise, the iteration is continued.
5. Radiation Characteristic Measurement and Analysis
5.1. Experimental Conditions
The observation site is the rooftop on the eighth floor of Building One, the Shanghai Institute of Technical Physics, the Chinese Academy of Sciences, Shanghai. The longitude of the geographical coordinates is 121.4917, and the latitude is 31.2859. The test time was 21:00 on June 5, 2021, the meteorological sight distance of that day was 12 km, and the ground temperature was 27 °C, which is 300 K. The observation target was MU8427 flying from Baotou Donghe Airport to Shanghai Pudong Airport. The aircraft type was BOEING737-800, the fuselage was 39.5 m, the flying height was 3 km, the ground distance was 15 km, and the flying speed was 588 km/h, which is 0.47 Ma. The observation site mainly observes aircraft flying at night, so the influence of solar radiation was not considered. According to the information, this material on the surface of the civil aviation aircraft skin was mainly a coating of aluminum powder and phenolic resin [31], so the emissivity ε = 0.9.
5.2. Temperature Inversion
After the analysis of the above characteristics, the main steps of temperature inversion included:
- We first calculated the atmospheric transmittance of each band and substituted it into the objective function ;
- Second, we calculated the entrance pupil radiance of the target signal by the absolute radiometric calibration model;
- Third, the quasi-Newton method was used to find the optimal solution of the objective function .
We stratified the atmosphere with a height of 3 km and took the height of a single layer ; then, the length of the single-layer observation path was , which was divided into 29 layers. According to the hourly data of ERA5 released by the European Centre for Medium-Range Weather Forecasts, the detailed meteorological data at the time of camera imaging were acquired. The atmospheric parameters of each layer are detailed in Table 3.
We can substitute the parameters of Table 3 into Equations (12), (15), (18) and (19) to obtain the atmospheric transmittance of each band (see Table 4 for details).
We can perform an absolute radiation correction experiment 15 min before the imaging experiment to minimize the error caused by the excessive difference from the observation experiment environment. In the experiment, a surface source blackbody with a temperature range of 0–100 °C (273–373 K), a temperature accuracy of ±0.02, and an emissivity of 0.99 produced by Electro Optical Industries was selected. The blackbody temperature starts at 273 K and ends at 308 K in steps of 5 K, with a total of eight calibration points. The medium wave camera collects 100 frames of radiation response data for each calibration point and obtains the average value. At the same time, the blackbody radiance at the corresponding temperature of each calibration point is calculated.
The coefficient of the linear relationship in Equation (23) is obtained by fitting the radiation response data of the detector at each calibration point and the blackbody’s entrance pupil radiance.
The calibration result is displayed in Figure 7. It can be seen that the relationship between the two has good linearity and can be used for linear calibration.
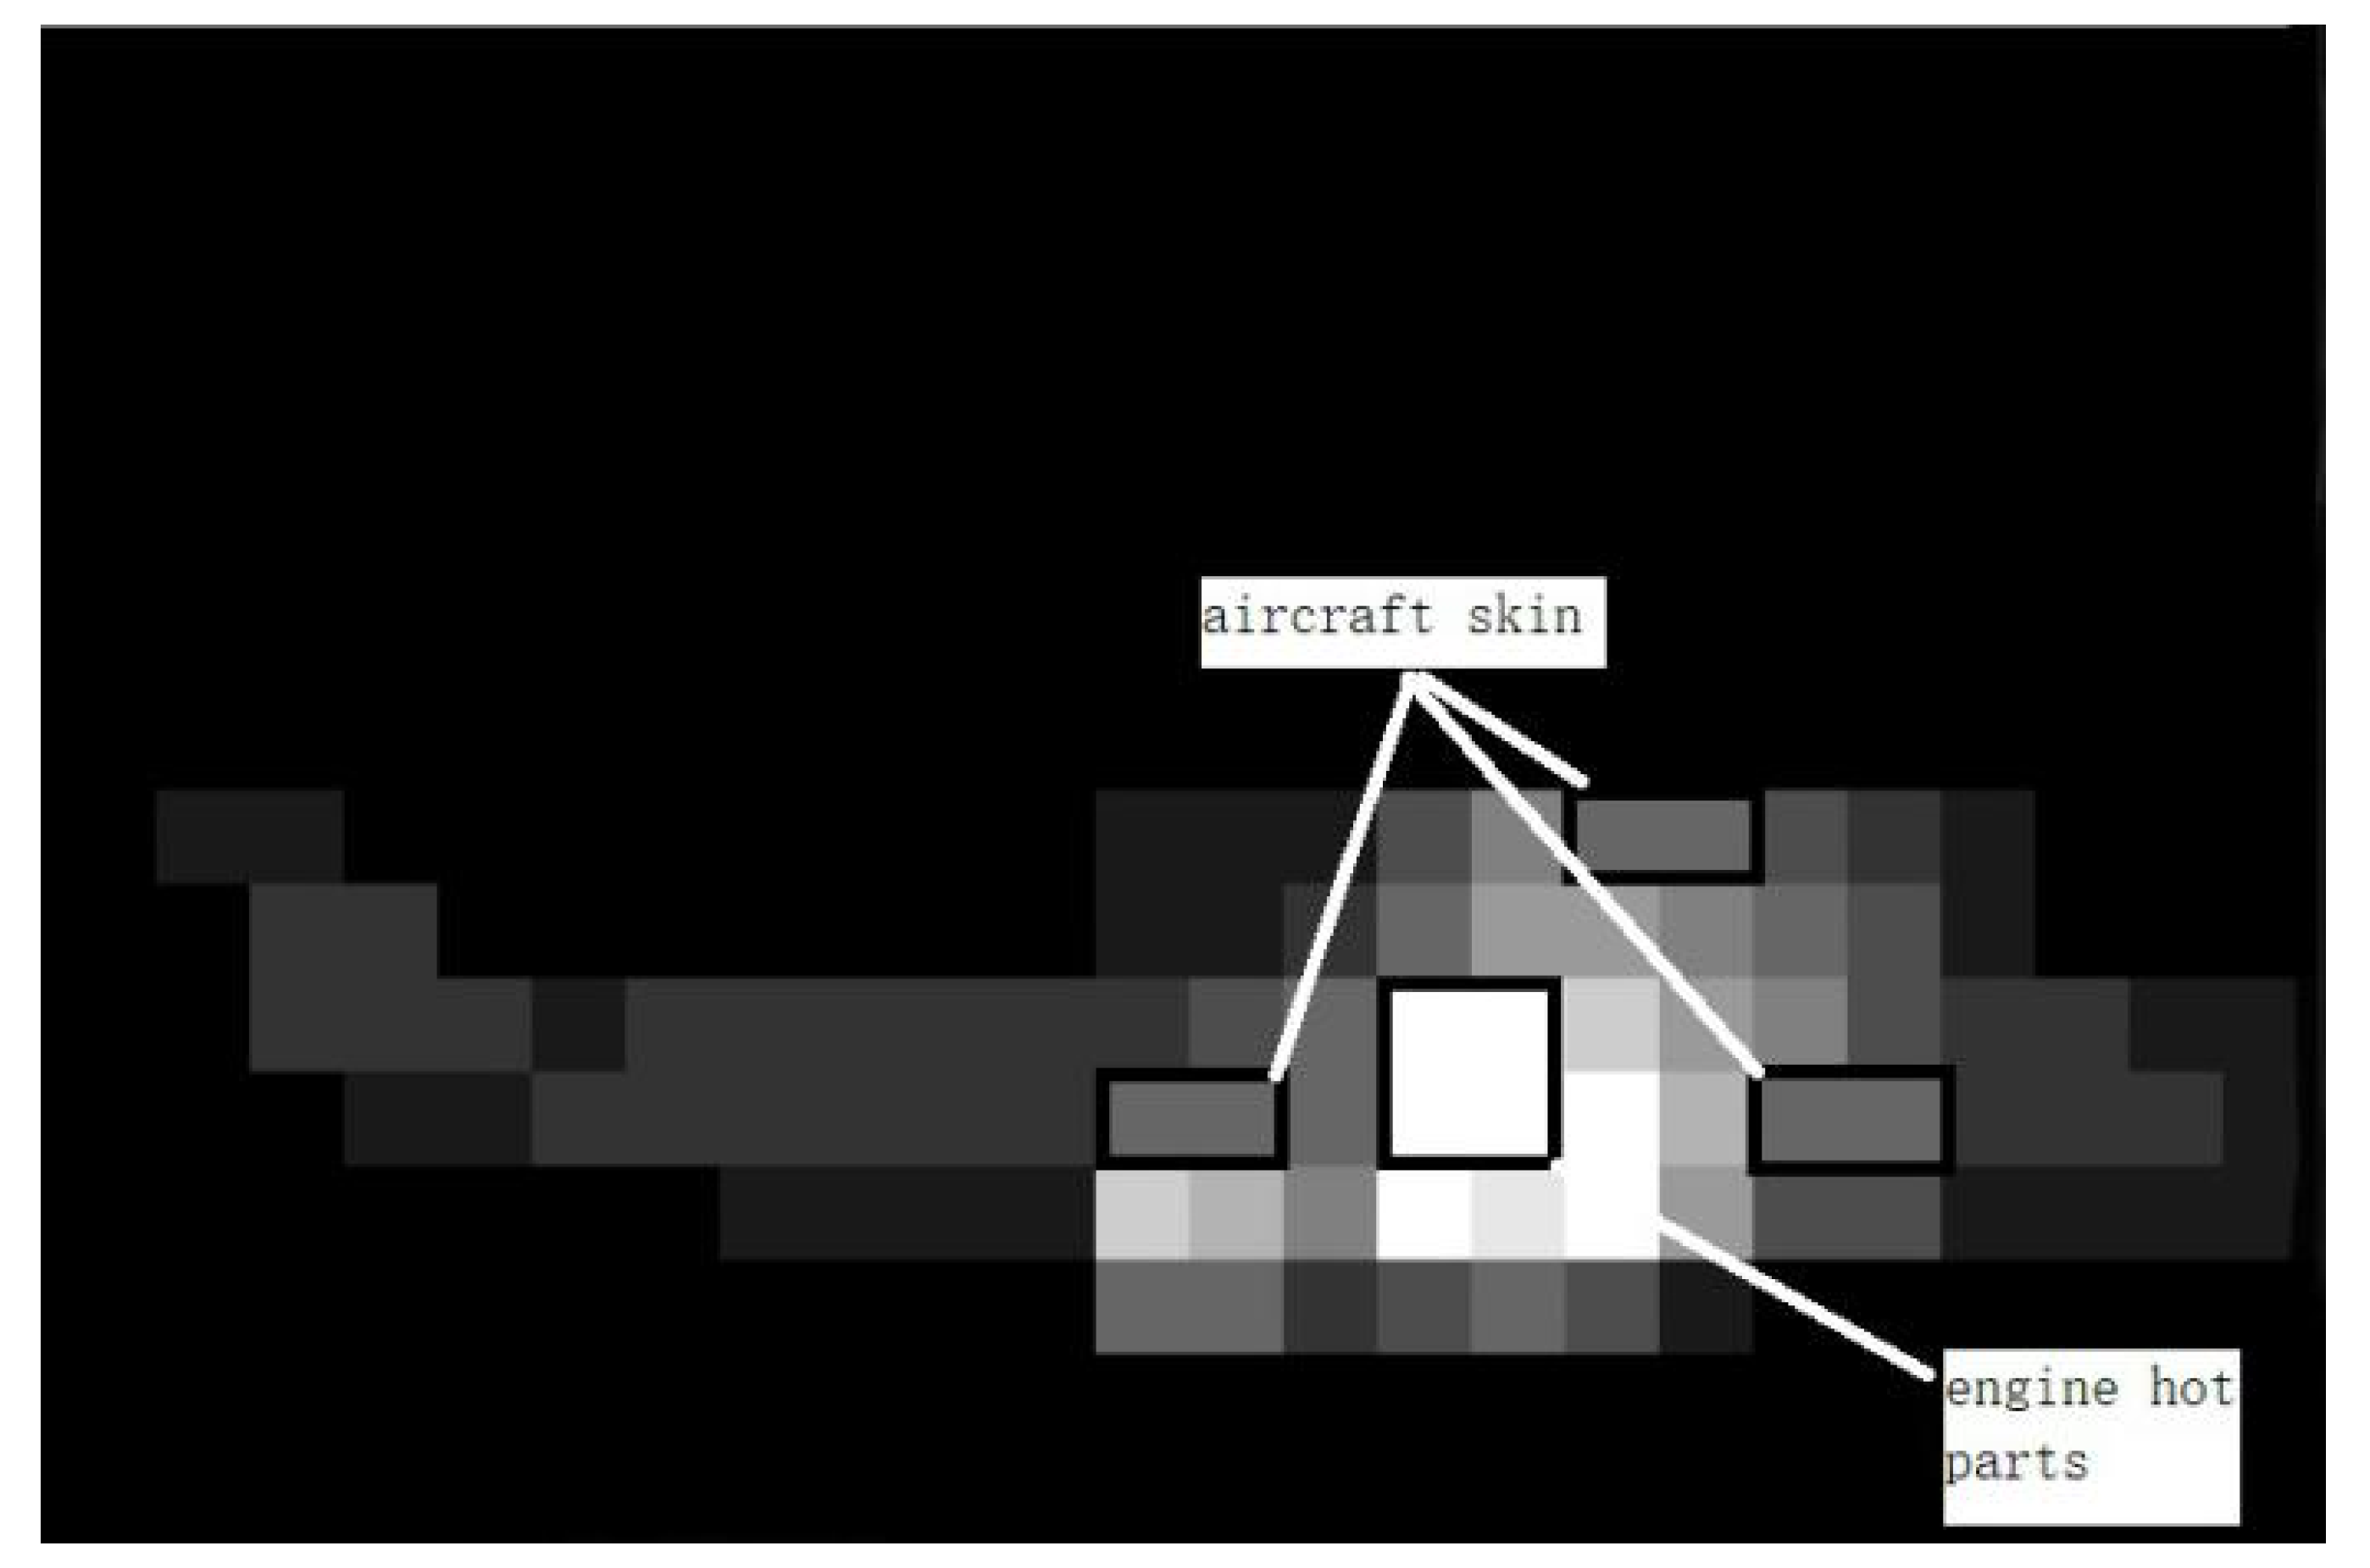
The image obtained by the middle-wave infrared camera on the civil aviation aircraft in the test is shown in Figure 8. The side profile of the aircraft is obvious. The pixels near the high hot spots in the middle of the aircraft side are selected as the signal pixels of the engine thermal components, and the pixels near the head, tail, and top of the aircraft are selected as the signal pixels of the hot parts of the engine.
The radiation response digital number value of the target pixel , , and the digital number values of the background pixel are substituted into Equations (22) and (32) to obtain the entrance pupil radiance of the target signal , . The stagnation point temperature of the skin is calculated by substituting the relevant atmospheric data into Equation (3), and it is set as the initial value of the skin temperature , and the wall temperature of the engine’s hot parts under the ground non-afterburner state is set as the initial value .
Then, we can use the quasi-Newton method to bring and into the objective function for iterative calculations to solve the optimal solutions and , respectively. As the values of and are too small, to simplify the calculation of the quasi-Newton method, and are multiplied by , respectively, and the in the objective function is also multiplied by .
Finally, the optimal solution is solved , .
5.3. Measurement Uncertainty Analysis
According to the uncertainty caused by different reasons, there are two types of evaluation methods: uncertainty Type A evaluation and uncertainty Type B evaluation [32].
Uncertainty Type A evaluation is used to evaluate the standard uncertainty by statistical analysis of the observation sequence, and it is characterized by the experimental standard deviation.
where denotes uncertainty Type A, denotes the average of the th observation result , and denotes the number of statistics.
Uncertainty Type B evaluation is used to estimate the uncertainty by experiment or other information [32], which contains subjective identification components.
where denotes uncertainty Type B, denotes the half-width of the uncertainty of identification, and denotes the inclusion factor. Generally, the confidence probability is 95%, and the inclusion factor is 1.96.
Comparing the atmospheric transmittance calculated using the atmospheric transmission model in the article with the Modtran calculation result, a relative uncertainty of 5.64% is obtained. The atmospheric transmittance is calculated by using the atmospheric transmittance of the 12 bands calculated in Table 4, and the atmospheric transmittance of the other fine bands is calculated using a cubic spline function with a 1 μm spectrum. The interval is obtained as input interpolation. Combining the cubic spline function, it can be found [33] that the Newton tangent method is used in each interval to find the point of the longest bow height, that is, the point with the largest error, so as to obtain a calculation error with a relative uncertainty of 2.84%. A comprehensive introduction of relative uncertainty was found for atmospheric transmittance.
Due to the year-round flight takeoff and landing, the surface of the aircraft has different oxidation levels due to the difference in material composition and service life, and its actual emissivity has a certain deviation from the emissivity obtained from the data query. It is known from [31] that the half-width of the uncertainty of the emissivity of the skin is 0.05. Generally, the uncertainty inclusion factor of 1.96 is taken, and the relative uncertainty is , where denotes the uncertainty of emissivity.
Solar radiation is consistent with the absolute blackbody radiation of 5900 K, which is a popular assumption. However, for wavelengths exceeding 3 μm, the blackbody approximation is still applicable, but at longer wavelengths, the corresponding blackbody temperature will change [34,35]. For non-night imaging, to ensure that the influence of changes in these parameters can be fully considered when calculating the solar radiation reflected by the aircraft skin, we use the maximum approximate deviation of the solar radiation and the absolute radiation of the 5900 K blackbody to calculate the uncertainty. The relative uncertainty of the solar radiation reflected by the aircraft skin is .
When the blackbody is calibrated with absolute radiation, the temperature stability and emissivity error of the blackbody itself will bring about an uncertainty of about 0.9% [36]. At the same time, under different external conditions, the stability of the infrared camera will also change due to environmental changes. The uncertainty of the available radiation calibration of 0.96% is obtained by performing multiple absolute radiation calibration experiments on the blackbody. The total relative uncertainty of the available radiation calibration is .
We can combine the above uncertainties to calculate the temperature uncertainty [32].
Equation (35) can be simplified [37].
where denotes Boltzmann’s constant, denotes Planck’s constant, and denotes the speed of light.
We can substitute each parameter into the calculation to obtain the temperature uncertainty of the aircraft skin and the temperature uncertainty of the engine thermal component skin . Taking into account the accuracy of the actual measurement, the results are rounded to obtain the temperature of the engine’s hot parts and skin, and , respectively.
6. Conclusions
This paper proposes a method to measure the infrared radiation characteristics of aircraft for mid-wave infrared cameras. It is verified through experiments that the atmospheric path of the target observation visual range is layered, and the atmospheric transmittance is calculated in sections, which can effectively be based on the actual situation. Obtaining the atmospheric transmittance under any observation path is more practical than simply using simulated atmospheric data to calculate the atmospheric transmittance. Secondly, a civil aviation aircraft with a ground distance of 15 km and a flying height of 3 km was observed in the field. Using the temperature inversion model and uncertainty analysis method proposed in this paper, the surface temperature of the hot parts of the aircraft engine was 381 K, and the estimated uncertainty was ±10 K; for the aircraft skin’s surface, the temperature was 296 K, and the estimated uncertainty was ±6 K.
Author Contributions
Conceptualization, Y.W.; Investigation, X.D.; Methodology, X.D.; Software, X.D.; Formal analysis, X.D.; Writing—original draft, X.D.; Supervision, Y.W.; Project administration G.H. and Y.W.; Visualization, G.H.; Resources, Y.W., G.H. and T.X.; Writing—review and editing, T.X. All authors have read and agreed to the published version of the manuscript.
Funding
This research received no external funding.
Conflicts of Interest
The authors declare no conflict of interest.
References
- Kou, T.; Zhou, Z.; Liu, H.; Yang, Z. Correlation between infrared radiation characteristic signals and target maneuvering modes. Acta Opt. Sin. 2018, 38, 37–45. [Google Scholar]
- Du, S.; Yang, J.; Zeng, K.; Gao, Y.; Chen, S. Discussion on the infrared stealthy technique of aircraft. Electron. Warf. 2010, 133, 41–45. [Google Scholar]
- Wang, C. Detecting and tracking technology about IR stealth target. Infrared Laser Eng. 2006, 35 (Suppl. S1), 127–132. [Google Scholar]
- Li, W.; Yan, S.; Hu, L.; Wu, Y.; Wang, C.; Ouyang, Y. A review of false alarm suppression technology for infrared early warning satellite. Infrared Technol. 2020, 42, 115–120. [Google Scholar]
- Mao, X.; Hu, H.; Huang, K.; Liang, X. Calculation method for airplane IR radiation and atmospheric transmittance. J. Beijing Univ. Aeronaut. Astronaut. 2009, 35, 1228. [Google Scholar]
- Kang, L.Z.; Zhao, J.S.; Li, Z.H. The overview of the research work developments on infrared signature of aircraft. Infrared Technol. 2017, 39, 105–115. [Google Scholar]
- Zong, J.; Zhang, J.; Liu, D. Infrared Radiation Characteristics of the Stealth Aircraft. Acta Photonica Sin. 2011, 40, 289–294. [Google Scholar] [CrossRef]
- Liu, Y.; Liu, X. Research on technology of ground-based infrared radiation feature measurement for space target. Acta Opt. Sin. 2014, 34, 123–129. [Google Scholar]
- Wang, X.; Gao, S.; Jin, L.; Li, Z.; Li, F. Multi-band Infrared Radiation Characterization and Simulation Analysis for Aerial Target. Acta Photonica Sin. 2020, 49, 511002. [Google Scholar] [CrossRef]
- Han, Y.; Xuan, Y. Effect of atmospheric transmission on IR radiation of feature target and background. J. Appl. Opt. 2002, 4, 8–11. [Google Scholar]
- Liu, J.; Gong, G.; Han, L.; Gao, D. Modeling and simulation of airplane infrared characteristic. Infrared Laser Eng. 2011, 40, 1209–1213. [Google Scholar]
- Yang, C.; Cao, L.; Zhang, J. Measurement of infrared radiation for target airplane based on real-time atmospheric correction. Opt. Precis. Eng. 2014, 22, 1751–1759. [Google Scholar] [CrossRef]
- Yang, C.; Zhang, J.; Cao, L. Infrared radiation measurement based on real-time correction. J. Infrared Millim. Waves 2011, 30, 284–288. [Google Scholar] [CrossRef]
- Sun, Z.; Chang, S.; Zhu, W. Radiometric calibration method for large aperture infrared system with broad dynamic range. Appl. Opt. 2015, 54, 4659–4666. [Google Scholar] [CrossRef]
- Huang, W.; Ji, H. Effect of reflected background radiation by skin on infrared signature of subsonic aircraft (I): Methodology. Infrared Laser Eng. 2015, 44, 1699–1703. [Google Scholar]
- Huang, W.; Ji, H. Effect of reflected background radiation by skin on infrared signature of subsonic aircraft (II): Application. Infrared Laser Eng. 2015, 44, 2039–2043. [Google Scholar]
- Li, J.; Tong, Z.; Wang, C.; Chai, D.; Zhang, Z.B. IR radiation characteristics analysis and vulnerability assessment of aircraft. Laser Infrared 2013, 43, 180–185. [Google Scholar]
- Chen, B.; Fang, Y.; Xu, X. Study on the IR radiation of aeroplane. Aero Weapon. 2005, 4, 30–32. [Google Scholar]
- Wang, C.; Tong, Z.; Lu, Y.; Chai, D. Study on airplane’s infrared radiation characteristics. Laser Infrared 2011, 41, 996–1001. [Google Scholar]
- Chen, G. The development of civil high-bypass turbofans. J. Aerosp. Power 2019, 3, 56–61. [Google Scholar]
- Xia, J.; Yang, Q.; Wang, H.; Wu, Y. Development analysis to after burner combustion technology of turbofan. J. Aerosp. Power 2020, 4, 17–21. [Google Scholar]
- Wang, Y.; Chen, Z.L. Analysis of temperature field in nacelle for a turbofan engine. Eng. Test 2015, 55, 35. [Google Scholar]
- Zhang, Z.; Tong, Z.; Wang, C.; Li, J. Modeling and simulation of airplane infrared characteristic along the sight line. Laser Infrared 2013, 43, 890–895. [Google Scholar]
- Wu, H. Research in to theoretical calculation method on engineering of transmittance of infrared radiation through atmosphere. Opt. Precis. Eng. 1998, 6, 120–125. [Google Scholar]
- Kang, D.; Cheng, B.; Gao, J. Different algorithm method of ground-air infrared detection range. Electro-Opt. Technol. Appl. 2009, 24, 29–32. [Google Scholar]
- Zhang, J.; Fang, X. Infrared Physics; Xidian University Press: Xi’an, China, 2004. [Google Scholar]
- Liu, L.; Dong, S.; Yu, Q.; Tan, H. Atmospheric mean transmittance in wavelength interval 0.1 μm from infrared 1 to 14 μm, (II) transmittance of water vapor. J. Harbin Inst. Technol. 1999, 6, 75–78. [Google Scholar]
- Liu, L.; Dong, S.; Yu, Q.; Tan, H. Atmospheric mean transmittance in wavelength interval 0.1 μm from infrared 1 to 14 μm (II) transmittance of carbon dioxide. J. Harbin Inst. Technol. 1998, 5, 9–13. [Google Scholar]
- Lu, Y. Simple method to calculate the atmosphere transmittance of infrared radiation on slanting route. Infrared Laser Eng. 2007, 4 (Suppl. S2), 423–426. [Google Scholar]
- Li, N.; Yang, C. Radiation calibration for 3–5μm infrared detector. Infrared Laser Eng. 2012, 41, 858–864. [Google Scholar]
- Liu, B.; Zheng, W.; Li, H. Research progress in measurement technology of material surface emissivity. Infrared Technol. 2018, 40, 725–732. [Google Scholar]
- Wang, Z.; Liu, Z.; Xia, X. Measurement Error and Uncertainty Evaluation; Science Press: Beijing, China, 2008. [Google Scholar]
- Sun, Z.; Wu, H.; Yuan, W.; Wen, Z. Calculation Method and Practice; Southeast University Press: Nanjing, China, 2011. [Google Scholar]
- Pierce, A.K.; Allen, R.G. The Solar Spectrum Between 0.3 and 10 μm. In The Solar Output and Its Variation; Colorado Associated University Press: Boulder, CO, USA, 1977. [Google Scholar]
- Jursa, A.S. Handbook of Geophysics and the Space Environment, 4th ed.; Air Force Systems Command; U.S. Department of Commerce National Technical Information Service: Springfield, VA, USA, 1985.
- Yuan, Z. The effect and correction of blackbody radiation emissivity on the accuracy for radiation thermometry. Acta Metrol. Sin. 2007, 28, 19–22. [Google Scholar]
- Ma, J.; Wen, M. Skin Radiation Measurement Method of High Altitude Aircraft Based on Long Wave Infrared Light. Infrared Technol. 2021, 43, 284–291. [Google Scholar]
Figure 1.
Distribution of infrared radiation sources of civil aircraft flying at high speed in the air.
Figure 1.
Distribution of infrared radiation sources of civil aircraft flying at high speed in the air.

Figure 2.
Schematic diagram of turbofan engine structure.

Figure 3.
Schematic diagram of turbofan engine structure.

Figure 4.
Precipitable water vapor (PWV).

Figure 5.
Process of camera receiving infrared radiation.

Figure 6.
Flow chart of quasi-Newton method.

Figure 7.
Corresponding relationship between digital response value and blackbody radiance at different temperatures.
Figure 7.
Corresponding relationship between digital response value and blackbody radiance at different temperatures.

Figure 8.
Middle-wave infrared image of civil aviation aircraft.


Table 1.
Fitting coefficient of PWV and atmospheric transmittance.
| K | B | RMSE | |
|---|---|---|---|
| 3.7 | −0.009342 | 0.9394 | 0.0001799 |
| 3.8 | −0.005108 | 0.9747 | 0.0003843 |
| 3.9 | −0.002059 | 0.9672 | 0.0002266 |
| 4.0 | −0.001522 | 1.046 | 0.0002771 |
| 4.1 | −0.001672 | 1.033 | 0.0002825 |
| 4.2 | −0.001967 | 1.008 | 0.0001799 |
| 4.3 | −0.003412 | 1.024 | 0.0003843 |
| 4.4 | −0.006245 | 0.9621 | 0.0004364 |
| 4.5 | −0.01069 | 0.8924 | 0.0006834 |
| 4.6 | −0.03198 | 0.7301 | 0.002214 |
| 4.7 | −0.05147 | 0.6721 | 0.002514 |
| 4.8 | −0.1096 | 0.5430 | 0.003284 |
Table 2.
Fitting coefficient of CO2 and atmospheric transmittance.
| A | D | RMSE | |
|---|---|---|---|
| 3.7 | −0.0001819 | 0.5540 | 0.0002727 |
| 3.8 | −0.0004674 | 0.6484 | 0.0005531 |
| 3.9 | −0.0002748 | 1.254 | 0.0001910 |
| 4.0 | −0.002860 | 1.035 | 0.0002863 |
| 4.1 | −0.2080 | 0.3545 | 0.005455 |
| 4.2 | −0.9906 | 0.0080 | 0.01117 |
| 4.3 | −0.9786 | 0.0637 | 0.02359 |
| 4.4 | −0.5363 | 0.2544 | 0.05889 |
| 4.5 | −0.005162 | 0.9883 | 0.0004551 |
| 4.6 | −0.001919 | 0.9714 | 0.0002216 |
| 4.7 | −0.009497 | 0.9446 | 0.001027 |
| 4.8 | −0.009232 | 0.5967 | 0.003324 |
Table 3.
Atmospheric parameters of each layer.
| Number of Layer | Atmospheric Pressure/hpa | Temperature/K | Relative Humidity/% | Saturated Water Vapor Content/g·(cm3)−1 |
|---|---|---|---|---|
| 29 | 685.2222 | 278.1854 | 29.7408 | 7.0809 |
| 28 | 696.3333 | 279.1531 | 30.5621 | 7.5911 |
| 27 | 707.4444 | 280.2053 | 30.7385 | 8.2073 |
| 26 | 718.5556 | 281.3268 | 30.3619 | 8.7861 |
| 25 | 729.6667 | 282.4782 | 29.6096 | 9.4842 |
| 24 | 740.7778 | 283.6197 | 28.6605 | 10.2182 |
| 23 | 751.8889 | 284.7116 | 27.6929 | 11.0661 |
| 22 | 763.0000 | 285.7376 | 26.7791 | 11.8898 |
| 21 | 774.1111 | 286.7389 | 25.7333 | 12.6950 |
| 20 | 785.2222 | 287.7575 | 24.3524 | 13.4914 |
| 19 | 796.3333 | 288.7984 | 22.5393 | 14.4903 |
| 18 | 807.4444 | 289.8520 | 20.2653 | 15.5576 |
| 17 | 818.5556 | 290.8794 | 17.8935 | 16.5653 |
| 16 | 829.6667 | 291.8237 | 16.0223 | 17.7032 |
| 15 | 840.7778 | 292.6548 | 14.7151 | 18.5310 |
| 14 | 851.8889 | 293.3754 | 13.3739 | 19.3996 |
| 13 | 863.0000 | 293.975 | 12.2206 | 20.2660 |
| 12 | 874.1111 | 294.4066 | 13.5674 | 20.8110 |
| 11 | 885.2222 | 294.6472 | 19.2452 | 21.0906 |
| 10 | 896.3333 | 294.8249 | 27.0594 | 21.2951 |
| 9 | 907.4444 | 295.1062 | 33.7232 | 21.6279 |
| 8 | 918.5556 | 295.5460 | 38.0968 | 22.2015 |
| 7 | 929.6667 | 296.1275 | 40.4114 | 23.1203 |
| 6 | 940.7778 | 296.8157 | 40.8428 | 24.2205 |
| 6 | 951.8889 | 297.5547 | 39.4749 | 24.6124 |
| 5 | 963.0000 | 298.1789 | 37.5592 | 25.3487 |
| 4 | 974.1111 | 298.260 | 39.1968 | 25.5416 |
| 3 | 985.2222 | 299.3304 | 48.9127 | 28.2848 |
| 2 | 996.3333 | 299.9225 | 71.2322 | 29.1840 |
| 1 | 1007.444 | 300.0181 | 88.5324 | 29.3277 |
Table 4.
Atmospheric transmittance of each band.
| 3.7 | 0.7929 | 4.3 | 1.8464 × 10⁻³ |
| 3.8 | 0.8235 | 4.4 | 2.5026 × 10⁻⁷ |
| 3.9 | 0.8515 | 4.5 | 0.1697 |
| 4.0 | 0.8359 | 4.6 | 0.6249 |
| 4.1 | 0.7080 | 4.7 | 0.4523 |
| 4.2 | 0.1334 | 4.8 | 0.3880 |
Publisher’s Note: MDPI stays neutral with regard to jurisdictional claims in published maps and institutional affiliations. |
© 2022 by the authors. Licensee MDPI, Basel, Switzerland. This article is an open access article distributed under the terms and conditions of the Creative Commons Attribution (CC BY) license (https://creativecommons.org/licenses/by/4.0/).
Share and Cite
MDPI and ACS Style
Deng, X.; Wang, Y.; Han, G.; Xue, T. Research on a Measurement Method for Middle-Infrared Radiation Characteristics of Aircraft. Machines 2022, 10, 44. https://doi.org/10.3390/machines10010044
AMA Style
Deng X, Wang Y, Han G, Xue T. Research on a Measurement Method for Middle-Infrared Radiation Characteristics of Aircraft. Machines. 2022; 10(1):44. https://doi.org/10.3390/machines10010044
Chicago/Turabian StyleDeng, Xuan, Yueming Wang, Guicheng Han, and Tianru Xue. 2022. "Research on a Measurement Method for Middle-Infrared Radiation Characteristics of Aircraft" Machines 10, no. 1: 44. https://doi.org/10.3390/machines10010044
Note that from the first issue of 2016, this journal uses article numbers instead of page numbers. See further details here.