
Hybrid Feature Selection Framework for Bearing Fault Diagnosis Based on Wrapper-WPT


1
Department of Electrical, Electronics, and Computer Engineering, University of Ulsan, Ulsan 44610, Republic of Korea
2
PD Technology Cooperation, Ulsan 44610, Republic of Korea
*
Author to whom correspondence should be addressed.
Machines 2022, 10(12), 1204; https://doi.org/10.3390/machines10121204
Submission received: 14 November 2022
/
Revised: 8 December 2022
/
Accepted: 9 December 2022
/
Published: 12 December 2022
(This article belongs to the Special Issue 10th Anniversary of Machines—Feature Papers in Fault Diagnosis and Prognosis)
Abstract
:A framework aimed to improve the bearing-fault diagnosis accuracy using a hybrid feature-selection method based on Wrapper-WPT is proposed in this paper. In the first step, the envelope vibration signal of the roller bearing is provided to the Wrapper-WPT. There, it is initially decomposed into several sub-bands using Wavelet Packet Transform (WPT), and a set out of nineteen time and frequency domain features are individually extracted from each sub-band of the decomposed vibration signal forming a wide feature pool. In the following step, Wrapper-WPT constructs a final feature vector using the Boruta algorithm, which selects the most discriminant features from the wide feature pool based on the important metric obtained from the Random Forest classifier. Finally, Subspace k-NN is used to identify the health conditions of the bearing, thus forming a hybrid signal processing and machine learning-based model for bearing fault diagnosis. In comparison with other state-of-the-art methods, the proposed method showed higher classification performance on two different bearing-benchmark vibration datasets with variable operating conditions.
1. Introduction
Bearings are the most common machine element in industry that serve to facilitate rotational motion by minimizing friction between moving parts. They have a broad area of application from industrial specialized machines, electrical machines, turbines, on-road vehicles, air- or spacecraft to various home appliances. When used for supporting the rotating parts in heavy machinery, bearings are often the parts that are the most affected by the heavy loads and thus are prone to becoming a reason for machine failure. For example, according to the statistics on electric motor exploitation, bearing faults are responsible for 45% of all electrical machine failures, together with stator winding faults—35%, rotor bar faults—10% and 10% of other faults. This fact states the reason for a profound study of the techniques for bearing condition monitoring (CM) and fault diagnosis (FD) [1]. At the current moment, with wide access to sensing technologies and computers, CM is performed by real-time or close to real-time methods. Recent advances in Big Data and Internet of Things (IoT) technologies pave the way for the construction of extensive condition-monitoring system environments, which operate with massive amounts of plant data, making the development of new data-driven fault diagnosis methods an extremely important task [2]. Utilization of vibration data is prevalent in this field due to the ability to transfer intrinsic information of mechanical systems and immediately react to changes. This allows bearing-fault vibration data to be used for permanent and intermittent monitoring [3]. Apart from this, vibration data utilization is the industry standard in the bearing-fault diagnosis field [4]. From the existing corpus of papers on FD of industrial equipment with the application of machine learning, it may be concluded that all of the methods can be roughly divided into two main steps: feature extraction/selection and fault classification [5,6,7]. The early bearing-fault diagnosis methods in the field utilized statistical features of the time-based signal such as mean, variance, skewness, kurtosis and third-order statistical moment [5,8,9]. Later Fast Fourier Transform gained popularity to extract the features from the frequency domain [10]. Feature extraction from the time-frequency domain became available thanks to the signal decomposition methods such as short time Fourier transform (STFT), empirical mode decomposition (EMD) and wavelet transform [11]. In recent years, Deep Learning (DL) techniques have proven extremely useful for automatic feature learning in the bearing-fault diagnosis field, allowing for the analysis of data without the insights from human experts. DL techniques based on Convolutional Neural Networks, such as the novel multiscale convolutional capsule network for discriminative feature learning proposed by Long et al., have proven to be very powerful feature extractors [12,13]. Another powerful feature extractor based on Deep Learning is the Deep Autoencoder, which can be also be used for denoising [14] and feature extraction, including feature extraction from different physical domains using a deep learning-based model supported by stacked autoencoder as proposed by Saucedo-Dorantes et al. [15,16,17]. The main disadvantage of DNNs is that they are used as a black box algorithm and the features extracted by them cannot be fully understood, which leads to obstacles in improving the performance of these models in subsequent research [11]. Therefore, this research focuses on the traditional feature extraction approach.
Wavelet Packet Transform (WPT) can map non-stationary signals to a set of basic functions composed of wavelet expansion and contraction [18]. Unlike Discrete Wavelet Transform, it has a full decomposition tree, thus it further decomposes the detailed information of the signal, which allows for achieving equally high resolution throughout all frequency regions. In recent literature on bearing Fault Diagnosis, WPT is widely used for vibration signal processing and feature extraction. Chen et al. used WPT to decompose the vibration signal of a roller bearing and used energy–entropy values calculated from the coefficients as the features. The features were provided to the Multiclass Relevance Vector Machine for classification [19]. Li et al. applied WPT to capture low-frequency information of bearing vibration signals. To obtain features appropriate for a CNN, WPT coefficients are transformed to gray-scale images [20]. In Ref. [21], Li et. al used WPT for signal decomposition and calculated the normalized energy eigenvector from all reconstructed sub-bands to use it as a feature vector. Zhu et al. used WPT to extract time-frequency features forming a time-frequency characteristic matrix and then sorting out insensitive features by Multi-Weight Singular Value Decomposition [22]. Bastami et al. [23] used WPT for bearing-vibration signal feature-extraction. At the optimal decomposition level, only one optimal node was selected based on the kurtosis value. Along with the utilization of WPT for signal decomposition before feature selection, it has been used inside the hybrid feature selection methods. Guo et al. [24] proposed a hybrid feature selection method, which combined the extraction of the statistical features from the WPT reconstructed coefficients and the EMD modes with minimum redundancy and maximum relevance filter feature-selection together with analytic hierarchy process feature ranking. A hybrid feature-selection method proposed by Lu et al. [25] uses de-noised wavelet coefficients in combination with a distance correlation filter method and recursive feature elimination with a cross-validation (RFECV) estimator based on Support Vector Regression.
After an intensive screening of the publications by keywords “Wavelet Packet Transform” and “Feature extraction” the authors found several common pattern approaches in the use of WPT for feature extraction irrespective of the field of application. The first pattern approach uses energy or entropy of the decomposition nodes as features in various configurations: obtaining a feature vector that would contain plain energy, entropy or standard deviation values for each node or contain energy distribution in the decomposition level [19,25,26,27,28,29,30,31,32,33,34]. This pattern of approach apparently allows the achievement of good classification performance and estimates the localization of the component of interest in the signal spectrum. However, its disadvantage is that it only contains homogeneous features and will inevitably struggle to maintain its classification performance in the case when two different classes have their main components of interest within the spectrum range of one WPT node. The second less popular approach implies selection of the certain WPT decomposition nodes—usually one—based on various parameters [35,36,37,38]. The most significant WPT node can be selected either based on the calculated energy distribution in the decomposition level when the selected node is the one with the highest energy/kurtosis of the reconstructed signals or certain nodes at different levels are just hand-picked. Thereby, selection of the data parts for further processing is completed using techniques which have no ability to evaluate the selected node regarding the presence of discriminant information and overall usability for classification. Nor do these techniques consider the rest of the signal information anywhere in the future, thus arbitrarily ignoring large chunks of information, which can reach 50% or more in the energy equivalent of the whole signal—highest energy node does not imply it contains the absolute majority of the total signal energy. Eventually, this pattern of approach leads to decision-making based on partial data, which can omit less energy components, that could highly benefit the classification performance. The third approach implies decomposition of the signal to a certain level and utilizing reconstructed signals from all coefficients [39,40,41,42,43,44]. This approach is mainly used together with Deep Learning methods. However, even though this pattern approach can achieve very high levels of classification performance, the sheer quantity of data under operation increases with the power of two for each following decomposition level, which makes the pattern approach slow and computationally expensive. Additionally, DNNs lack feature interpretability and intuitive understanding; thus, can hardly be explained by human experts.
The proposed method, however, is trying to alleviate the above-mentioned typical disadvantages. Unlike pattern approach one, the proposed framework initially extracts time and frequency-domain features from all eight WPT nodes at the third decomposition level. The presence of heterogeneous features benefits the wide feature pool by its variety of sensitivities to different fault signatures in the vibration signal. Secondly, unlike pattern approach two, no premature decisions about exclusion of major chunks of data are made. The features are extracted from each WPT node and combined into the wide feature pool which compactly preserves all the relationships inside the original data, thus, no valuable information is lost during the feature extraction step. Instead of the simple metrics for node selection, the proposed method is using Boruta feature selection to precisely find the most discriminant features from the wide feature pool. Thirdly, in contrast to pattern approach three, the proposed method operates with the vibration data in an optimized way, accessing each reconstructed signal solely for feature extraction, after which that reconstructed signal is abolished and does not require any storage or computational resources for further processing as only its features are stored. Furthermore, unlike pattern approach three, here the extraction of the statistical features allows for total feature interpretability and the ability to trace each extracted feature to its origin node.
Considering the above discussion, the contributions of the proposed framework can be listed as follows:
- (1)
- the proposed bearing feature-selection method based on Wrapper-WPT is constructed to avoid the common disadvantage of homogeneous energy feature extraction from the reconstructed signals by extracting a variety of heterogenous features with various sensitivities;
- (2)
- the proposed method allows the most discriminant information from the whole WPT decomposition level to be obtained, without any premature decisions on the usability of certain nodes for inter-class data separation based on various metrics at the signal processing stage.
The rest of the paper is structured as follows: Section 2 presents the theoretical background on bearing faults; Section 3 describes the experimental setup and the process of data collection, the datasets used for this work and their arrangement; Section 4 presents the proposed methodology together with the technical background; the results and performance evaluation for fault identification are presented in Section 5; and the conclusions are made in Section 6.
2. Bearing Faults Theoretical Background
The four basic parts of the bearing are inner race, outer race, bearing cage and rolling elements. Among the reasons for bearing faults, the most common are considered to be: flawed installations; heavy duty cycles; harsh working environment; improper loads; and improper lubrication as well as the issues related to the manufacturing process [4].
When there is damage on the bearing race in the form of a crack or indentation, rolling elements pass this damaged area and generate periodical impulses with a certain rate called a fundamental defect frequency. Each of the main bearing parts has its own fundamental frequency named the ball-pass frequency of the outer race (BPFO), ball-pass frequency of the inner race (BPFI), ball spin frequency (BSF) and fundamental train frequency (FTF). Fundamental frequencies depend on the bearing geometric parameters and can be calculated using Equations (1)–(4):
where Ssh is a shaft speed expressed in revolutions per minute (RPM); db is the diameter of the rolling element and Dp states for the pitch diameter; Nb is the number of rolling elements and theta is the angle of the load from the radial plane [45].
3. Experimental Setup and Data Collection
For the better evaluation of the proposed method, three different public bearing-fault datasets were used. The first two datasets were obtained from the KAt-DataCenter of the Chair of Design and Drive Technology, Paderborn University, Germany [46]—referred to as the PU Real fault dataset and the PU Artificial fault dataset. The Case Western Reserve University (CWRU) bearing dataset was used as a third dataset for evaluation of the proposed method [47].
3.1. Paderborn University Bearing Dataset
The vibration data for PU dataset were collected from the modular test rig shown in Figure 1, which consists of an electric motor, a measuring shaft, a bearing module, a flywheel and a load motor.
The electric motor installed in the test rig is a 425 W synchronous type (Type SD4CDu8S-009; Hanning Elektro-Werke GmbH & Co. KG, Oerlinghausen, Germany) with a permanent magnet rotor. It is operated by a KEB Combivert 07F5E 1D-2B0A, which is an industrial inverter with a 16 kHz switching frequency. The bearing module is a device that allows for quick replacement of ball bearings with different types of damage. It serves to create vibration data for bearings with various fault types without the necessity for tedious machine disassembly and assembly for each experiment.
The generated vibration data can be divided into two major groups by the attribute of inflicted damage types: artificial damage and damage caused by the accelerated lifetime tests (real damage). In total, the dataset contains signals for 32 bearings. Out of them, six bearings are healthy with different run-in periods from one to over 50 h. Out of the 12 bearings with artificial damage inflicted by drilling, manual electric engraving and an electric discharge machine (EDM), 7 have these damages seeded in the outer ring and 5 in the inner ring. The drilled holes in the bearing rings have diameters of 0.9 mm, 2 mm and 3 mm. The trenches created by using the EDM are 0.25 mm in length in the rolling direction with a depth of 1–2 mm. The damages inflicted by the manual electric engraver have lengths of 1–4 mm. A very abrupt sharp transition between the damaged and undamaged raceway is apparent in the first two methods, hence these faults can hardly be correlated to the real bearing faults. Nevertheless, the third type of artificial damage caused by a manual electric engraver has an irregular surface structure and lower depth and thus can resemble bearing pitting damage which occurs in the real environment. Out of the rest of the 14 bearings damaged by accelerated lifetime tests, 5 have damage seeded in the outer ring, 6 in the inner ring and 3 on both the outer and inner rings. Accelerated lifetime tests are performed in the specifically developed apparatus with a spring-screw mechanism for applying extensive radial load. Together with improper lubrication due to low viscosity oil use, the special apparatus guarantees the quick appearance of the damages. The main symptoms of these damages are described as fatigue which arises in the form of pitting in 70% of cases. The other damages are plastic deformations in the form of indentations. The damages are combined as single, repetitive and multiple damages, arranged at random or with no repetition and characterized as a single point or distributed. The extent of damage was measured by the length of the damaged ring surface in the rolling direction. Based on the ratio of damage length to pitch circumference, the damages were ranked into level one (0–2%), level two (2–5%) and level three (5–15%). The bearings with the single damage present on one ring are labeled according to the location of that damage as outer ring or inner ring damage. The bearings with damages on both rings are labeled as inner + outer ring damage. No damage was observed at the rolling elements.
The experiments for each bearing were performed in four different conditions with varying rotational speed, load torque and radial force. These different conditions contained in the dataset allow us to build robust condition-monitoring methods invariant to rotational speed and load changes. The characteristics of every condition are displayed in Table 1. To collect the vibration data, the dataset authors used a piezoelectric accelerometer (Model No. 336C04; PCB Piezotronics, Inc., Depew, NY, USA), attached at the top end of the testbed bearing module and a charge amplifier (Type 5015A; Kistler Group Winterthur, Switzerland) with a 30 kHz low-pass filter. After that, the signal was converted from analog to digital with a sampling rate of 64 kHz. In this work, both signals with artificially induced faults and faults induced by accelerated lifetime tests were used. They were arranged into two sets: one three-class set, and one four-class set. The detailed dataset compositions with the numbers of used bearings and class labels are displayed in Table 2 and Table 3.
In both datasets, one sample is a one-second vibration signal. The dimensions of the dataset with artificially inflicted faults are 5760 × 64,000 and the dimensions of the dataset with accelerated lifetime faults are 6400 × 64,000. Time-domain plots for the artificial bearing damage dataset and the real bearing damage dataset are displayed in Figure 2.
3.2. Case Western Reserve University Bearing Dataset
The experimental setup for this dataset includes a 2 hp motor, accelerometers attached to the motor and motor base, SKF6205 bearings installed at the drive end and fan end of the motor and a torque transducer/encoder for speed and horsepower data collection. The constructed testbed is shown in Figure 3. Vibration signals were collected using a 16-channel DAT recorder at 12,000 and 48,000 samples per second. The faults at the bearing inner race, outer race and rolling element were seeded using electric-discharge machining technology. The fault diameters range from 0.007 inches to 0.040 inches. Faults inflicted upon the outer bearing ring have a stationary nature and the placement of the fault in relation to the load zone of the bearing affects the vibration response of the system. To quantify this effect, the experiments with faults located at 3 o’clock, 6 o’clock and 12 o’clock were conducted for both fan and drive end bearings. Bearings with seeded faults were reinstalled in the test motor. Not more than one faulty bearing with one faulty component was installed in the motor during any of the experiments. Vibration data were collected from the motor running at the speeds of 1720 to 1797 RPM with loads of 0 to 3 horsepower. For this study, only 12,000 samples per second data were used. The recorded signals were cut into one second segments and each segment was used as a sample in the final dataset. The dimensions of the final CRWU dataset for this study are 1920 × 12,000. The arrangement of the data for the evaluation of the proposed method is shown in Table 4.
4. Proposed Methodology
The workflow of the proposed methodology is depicted in Figure 4. The whole implementation can be divided into three major steps, each step is described in a separate subsection. In the bearing vibration signal preprocessing step, raw vibration signals are fed across the envelope analysis for demodulation. Following that, the signals are provided to the Wrapper-WPT framework input, where first the signals are decomposed to the third WPT level, and then discriminant features are extracted from each reconstructed WPT coefficient, forming a wide feature pool. Following that, the dimensionality of the wide feature pool is reduced by selecting the best features using the Boruta feature-selection algorithm and a final feature vector is obtained as an output of the Wrapper-WPT framework. Selected features are further provided to the Subspace kNN to complete the bearing-fault diagnosis task.
4.1. Bearing Vibration Signal Preprocessing
Hilbert Transform Envelope
Since the raw bearing-vibration signal usually contains insufficient diagnostic information, applying the envelope analysis became a traditional approach in bearing fault diagnosis [45,48]. The Hilbert transform method used in this work mainly converts the actual signal into an analytical signal as a first step. Then, the envelope is obtained by taking the modulus. The vibration signal is expressed in Equation (5), where the amplitude modulation envelope is and the phase modulation function is :
The Hilbert transform of the signal is expressed as a 90-degree phase shift of :
Then, the analytical signal is derived as a complex number:
The envelope of the signal is obtained by calculating the modulus of :
4.2. Wrapper-WPT
4.2.1. Wavelet Packet Transform Base Theory
In contrast with the frequency-localized Fast Fourier Transform (FFT) that is traditionally used for signal processing, the Wavelet Transform (WT) creates a representation of the signal in both the time and frequency domains [19,30]. Here, the more generalized Wavelet Packet Transform (WPT) has even more advantages since, unlike the WT, it can decompose the signal in both low-frequency and high-frequency bands. This makes it possible to characterize the non-stationary information about bearing faults in the initial step of the Wrapper-WPT framework.
During the signal analysis, the input signal is decomposed into a set of wavelet packet nodes, which have the form of a full binary tree. Each WPT tree node is indexed as , and the corresponding wavelet packet tree coefficient is , where is the decomposition level and is the number of nodes in the decomposition level.
The original signal is located in the root node of the tree with index . In the first decomposition level , the original signal splits into two branches. The branch on the left goes through low-pass filtering and the branch on the right goes through high-pass filtering, resulting in a vector of approximation coefficients and a vector of detail coefficients . In the same manner, at every WPT decomposition levels there are WPT nodes. The WPT tree structure is displayed in Figure 5.
The Wavelet Packet Transform consists of decomposition and reconstruction algorithms. The relation between the orthogonal scaling function and wavelet function can be expressed as follows:
where k is a transformation parameter and and are conjugate filters which are low-pass filters and high-pass filter coefficients.
The following recurrence relationship defines the decomposition algorithm wavelet filter formed by high-pass and low-pass filters in a pair:
where are wavelet packet coefficients; are the approximation coefficients; are the detail coefficients; and and are the low-pass filter coefficients for decomposition, respectively.
After decomposition by the wavelet packet, the reconstruction algorithm for the wavelet packet coefficients is deduced as:
The result of the Wavelet Packet Transform primarily depends on the choice of decomposition level and mother wavelet which would be the best suited for signal analysis.
The common convention for the WPT decomposition level based on the sampling frequency and characteristic frequency of interest can be expressed as:
where L denotes the level of WPT decomposition. The essential target of the decomposition level selection is to find such an L that would be able to contain characteristic frequency between the Low Border Frequency (LBF) and High Border Frequency (HBF) of a particular node. For the dataset used in this paper, the BPFO at Stage 1 is calculated to be at 45.81 Hz. Thus, in order to isolate this characteristic frequency in the node, for a signal with a 64 kHz sampling rate the decomposition level L will be equal to 11 with LBF = 31.2 Hz and HBF = 62.5 Hz [49].
It is important to note that this convention works best only when several specific nodes are implied to be selected for further analysis, which contradicts the idea of this paper. The method developed in this work utilizes all WPT nodes with the aim to provide information about the whole spectrum. However, a high number of nodes on the deeper levels of decomposition would require excessive amounts of memory. For example, after decomposing the artificial damages dataset to level 11, all signals in 2048 nodes will require 5.14 Tb storage memory, which would render the proposed method inexecutable. Thence, in this work, the decomposition level L is set to 3, which allows the original signal to be decomposed into eight nodes and will require 20.08 Gb of storage memory, making it the compromise solution in the given circumstances.
4.2.2. Mother Wavelet Selection
The existing mother-wavelet selection approaches are usually categorized as qualitative or quantitative. Qualitative methods investigate the properties of wavelets such as orthogonality, symmetry, compact support, regularity, vanishing moment, explicit expression, etc., to select the wavelet most suitable for the tasks [50]. Nevertheless, the investigation of wavelet properties for mother wavelet selection can be intricate since a number of different wavelets can have identical properties and parameters. Shape matching is the alternative qualitative approach that was developed thanks to the analysis of the geometric shape of the wavelets. It was discovered that signal components can be extracted more effectively when the mother wavelet has a similar shape as the target signal feature component. However, matching the shape of the signal with the mother wavelet is a mundane and time-consuming task since it lacks automatization and is performed by visual comparison; thus, it is generally complicated.
Quantitative methods were intensively studied in an effort to evade the deficiencies of qualitative methods. To select the best mother wavelet, these methods use quantitative measures that can be based on Shannon entropy, Fishlow’s measure, Emlen’s modified entropy measure, cross-correlation, distribution error criterion, etc. The wavelet selection is completed based on the wavelet’s output quantitative measure score.
In this work, the mother wavelet was chosen with the help of a quantitative method based on the Maximum Energy to Shannon Entropy Ratio Criterion, which is widely used in current time research works [19,36,51,52].
The energy contained in the signal can serve as a criterion for mother wavelet selection. For fault diagnosis applications, it is evident that the efficient wavelet transform of the signal would have a higher energy content extracted from the defect-induced transient vibrations. For the discrete-time signal x(i), its energy is expressed as:
However, it is important to mention that the signals with the same energy can have different frequency distributions in the way that one of the signals will have clear major frequency components with a high value for feature selection, while the second signal will have a wide spectrum that is virtually useless for feature selection. Shannon entropy allows us to quantitatively describe the energy distribution of the signal and is calculated as follows:
where is the energy probability distribution of the wavelet coefficients, which is given as follows:
Thus, the Energy to Shannon Entropy ratio can be defined as:
This ratio is calculated for every candidate wavelet, using all the nodes in the third decomposition level. A candidate mother wavelet that achieves the highest R(s) value is selected as the most appropriate for successful fault diagnosis.
In this work, mother wavelets were chosen individually for each of the two datasets. As described previously, the R(s) ratio was computed for the bearing vibration dataset with artificially inflicted damages and the bearing vibration dataset with damages inflicted by accelerated lifetime tests. The decompositions necessary for the experiments were performed using MATLAB. The R(s) ratio was calculated for each mother wavelet provided in the Wavelet Packet Decomposition library. The R(s) ranking plots of the mother wavelets for each dataset are shown in Figure 6 and Figure 7. According to these plots, the biorthogonal 3.1 wavelets were chosen as the mother wavelet for the decomposition of signals contained in the dataset with artificial damages. Similarly, biorthogonal 2.2 was chosen as a mother wavelet for the dataset with real damages.
4.3. Feature Extraction and Selection
Real-life data for bearing fault diagnoses, such as vibration, acoustic emission or current data, are collected for a prolonged time with very high sampling rates, resulting in a complex dataset with a high number of variables, which requires additional memory and computation power. Thus, the application of machine learning techniques to the raw data is impractical.
Feature extraction (FE) serves to resolve this predicament. It is a process of data dimensionality reduction by which an initial raw dataset is reduced to one of a smaller size, reducing the number of resources necessary to describe the given data. Extracting quality features helps to achieve better generalization and avoids overfitting of the classification algorithm. The dataset obtained as a result of feature extraction is called the feature vector.
For the second step of the Wrapper-WPT framework, 19 significant statistical features were extracted from the vibration data: 16 were extracted from the time domain and 3 were extracted from the frequency domain. These statistical features are omnipresent in the bearing fault diagnosis field and are used in different combinations to create a compressed representation of the vibration data. It is challenging to predict the importance of certain features for fault diagnosis prior to feature selection. Thus, the list of features assembled for this research work is meant to encompass as many statistical features as can be found in the literature. The names of these features are: peak value; root-mean-square; kurtosis; crest factor; clearance factor; impulse factor; shape factor SMR; entropy; skewness; square mean root; fifth normalized moment; sixth normalized moment; mean; shape factor RMS; peak-to-peak value; kurtosis factor; the energy of the signal; frequency center; RMS frequency and root variance frequency. The set of 19 features is extracted individually from each reconstructed WPT coefficient forming a wide feature pool of 152 features. The equations for each of the features are presented in Table 5.
4.3.1. Boruta Feature Selection
Feature selection is a crucial step in the building of machine learning classification algorithms. It is a process of selecting the most significant and relevant features that would be the best description of the vast set of original features in the dataset. Feature selection allows for faster training of the ML algorithm, reduction in model complexity and reduction in overfitting. Thus, this step is present as a final step of the Wrapper-WPT framework for bearing fault diagnosis.
Wrapper-based feature selection methods are generally considered to be the most efficient for their ability to extract correlations and dependencies between the features. They utilize a certain classification algorithm as a black box, which then returns the ranking of the features. Usually, it is preferable to use computationally efficient and simple classification algorithms without user-defined parameters for higher practicality.
The main kinds of wrapper feature-selection algorithms are forward selection and backward elimination. The forward selection wrapper method is an iterative method that starts with zero features and with each iteration adds a feature that best improves the model until any new additional features do not improve the performance of the model. Backward elimination starts with the whole set of features and with each iteration removes the least significant feature enhancing the model performance until removing any more of the remaining features brings no further improvement. Recursive feature selection is a backward elimination subcategory method that aims to find the subset of features with the best performance. It iteratively fits a supervised model with the given set of features and performs a greedy search by evaluating all the random feature combinations against the evaluation criterion. Finally, it selects the best performing set with the optimal result for the specifically chosen machine-learning algorithm [27].
Boruta is a recursive wrapper feature-selection method built on the Random Forest classification algorithm. It is a quick classification algorithm that can yield a numerical estimate of the importance of a certain feature. Random Forest is an ensemble method, which means that it operates by creating a multitude of unbiased weak decision trees and the classification result depends on individual voting of each decision tree, with each of these trees being developed on different bagged samples of the training set [53,54].
Prior to running Boruta feature selection, all the features are normalized between zero and one using min–max scaling. It subtracts the minimum value in the feature and divides it by the range. The range is the difference between the original maximum and original minimum. The scaled features are calculated using Equation (17) to alleviate possible feature scaling sensitivity problem during classification:
The Boruta algorithm working steps are as follows:
- The Boruta algorithm creates several copies of all original attributes—Shadow Attributes (SA);
- Then, the attributes are shuffled and permutated to remove their correlation with the response. The obtained randomized feature set is added to the original feature set to bring randomness to the feature attributes, constructing the Extended Information System (EIS);
- The Random Forest classifier is fitted to the EIS several times. The SA within the EIS is randomized for each run. Thus, every SA part of the EIS is unique for every iteration;
- The importance of every feature attribute, called the Z score, is computed for each run. In order to compute the Z scores, the EIS is divided into several bootstrapped sets of samples (BSSs) equal to the number of decision trees used for training the Random Forest algorithm. Accordingly, the same number of the out of the bag samples (OBSs) are used for testing the performance of each corresponding decision tree. The number of votes for the correct class is recorded for every attribute from the EIS. After that, the values of the OBSs are permutated and the class votes of the DTs are recorded once again. The importance value for the attribute for each DT—mean decrease in accuracy (MDA) is calculated as follows:The importance of the attribute values for the whole Random Forest are calculated as follows:The final importance score is calculated as:
- The maximum Z score among shadow attributes (MZSA) is found. A hit is assigned to every real attribute with a Z score higher than MZSA;
- The real attributes that scored significantly lower than MZSA are deemed as non-important and eliminated;
- The real attributes that scored significantly higher than MZSA are deemed as important;
- All Shadow Attributes are removed;
- The procedure is repeated until the importance is assigned to each attribute or the algorithm has reached the user-defined limit of Random Forest runs.
The overall Boruta feature-selection algorithm scheme is shown in Figure 8.
4.3.2. Selected Feature Set Analysis
Since Boruta is the wrapper feature-selection algorithm, all the selected features can be justified by a Random Forest classifier which makes them easily interpretable. Analysis of the set of features selected by the Boruta algorithm for their WPT node affiliation shows that the extracted features belong to different nodes of the Wavelet Packet Transform, which can be seen in Figure 9.
In [4], the authors calculated the fundamental frequencies for these data using Equations (1) and (2) and showed that the bearing fault components from the first to tenth harmonic, recognizable with human eye in the envelope spectrum, can be contained within the 0–1250 Hz frequency range. Thus, the conclusion can be made that in this research, the WPT node (3,0) contains all bearing fundamental frequencies due to its frequency range of 0–8000 Hz. For that reason, the majority of the selected features belong to the node W(3,0). However, as can be concluded from the plot of feature affiliation to the WPT nodes after feature selection, the other nodes that represent higher frequency bands also contain components significant for fault diagnosis. These components discovered by the Boruta feature-selection algorithm would have been omitted when using methods with low-pass filtering or methods that precisely target the fault characteristics frequencies [4]. The diagrams in Figure 9 show the number of features selected by Boruta and their node affiliation.
The score of each feature category on the diagram in Figure 10 shows the number of nodes in which this certain feature was selected by the Boruta algorithm for the final dataset. The features which are shown in Table 5, but not present here, were not selected. Some feature families proved to be sensitive for both datasets. However, there is not enough evidence to claim any inherent higher sensitivity properties of certain features.
The above explanation means that, based on the feature distribution in the nodes, it is possible to find frequency bands that are the most useful for fault diagnosis with precision doubling with every deeper WPT decomposition level. Here, considering that the signal under analysis is 1 s long with a sampling frequency of 64 kHz, each of the WPT decomposition nodes represents 8 kHz wide bands, in particular: W(3,0) is 0–8 kHz; W(3,1) is 8–16 kHz; W(3,2) is 24–32 kHz; W(3,3) is 16–24 kHz; W(3,4) is 56–64 kHz; W(3,5) is 48–54 kHz; W(3,6) is 48–56 kHz; W(3,7) is 56–64 kHz. The number of features affiliated with the nodes arranged in ascending frequency order are shown in Figure 11.
As an output from the Wrapper-WPT feature-selection framework, twenty-three features were obtained for the artificial damage dataset and twenty for the real damage dataset. The selected feature sets are labeled according to the fault types and provided to the Subspace k-NN classifier.
Additionally, the authors performed feature selection using a filter Chi-square test method. The Chi-square test was used to extract the same number of features from artificial and real fault datasets as Boruta. For both datasets, the most popular feature was the energy of signal: six out of 22 for artificial faults and six out of 20 for real faults. Other features for the artificial damage dataset were: root mean square—three features; square mean root—three; frequency center—four; RMS frequency—four and root variance frequency—three features. For real faults: root mean square —three; square mean root—three; frequency center—four; RMS frequency—four and root variance frequency—three. The main difference between the sets selected by Boruta and Chi-squared test is the predominance of entropy feature in the first case and energy of signal in the latter case. Configuration of the proposed method with Chi-squared test feature-selection was tested and the results are shown and discussed in Section 4.1.
4.4. Subspace k-NN
For the final step of the proposed bearing fault diagnosis method, the Subspace k-NN classifier was selected.
Generally, the nearest neighbors algorithm is a supervised learning classifier that finds a group of k objects in the training set that are the closest to the object in the testing set and assigns the same label to this object as the majority of the closest k objects in the training set. The k-NN algorithm is an instance-based non-parametric classifier with conceptual simplicity, easily understandable and interpretable output, and the assertion that the classification error of the general k-NN method is bounded above by twice the optimal Bayes error, which makes it the best choice when it is necessary to evaluate a new feature engineering approach [55].
The main principles of this algorithm can be explained using Figure 12. First, the algorithm calculates the distances between the test object example and the training samples . Second, it sorts out all the calculated distances and takes only k into consideration. Lastly, majority voting is applied to decide which label to assign to the test example. Figure 12 shows the importance of choosing the correct k: if , the test example would be assigned to Class 2, however, if , the test example would be assigned to Class 1.
However, despite being a rather simple algorithm, k-NN is costly to calculate on large data and high-dimensional data. Additionally, with the growing number of dimensions, the ratio of the closest distance to the average distance approaches 1, which significantly decreases the predictive capabilities of the algorithm [56].
Subspace k-NN, however, uses high dimensionality to its advantage by systematically constructing and combining a set of mutually semi-independent classifiers. To construct each classifier, it uses a stochastic process that randomly selects components from a given feature vector. So, when a test example object is compared to the prototype, only selected features have a non-zero contribution to the distance.
The algorithm computes a new set of k nearest neighbors each time a random subspace is selected. Then, in each subspace, these k nearest neighbors are assembled for majority voting on test example object-class membership. The same training sample may appear in more than one subspace if it happens to be one of the k nearest neighbors.
Described formally, when given a set of N points in an n-dimensional feature space:
only m-dimensional subspaces are considered:
where I is a subset of m-elements of , and . To choose a subspace in every iteration, I is randomly selected from choices. All points are projected onto the chosen subspace. Using Euclidean distance, for each testing point, the k nearest neighbors are found among the projected training points. The class labels of those k neighbors are appended to a list C. The test point is assigned to the class that has the most frequent occurrences in list C [57]. In this work, Subspace k-NN was set to use 20 learners and 7 subspace dimensions as the most optimal set of parameters. The number of neighbors was set to .
5. Results and Performance Evaluation for Fault Identification
In this section, the performance of the proposed method is evaluated using the data from the testbed described in Section 2. The evaluation is performed using three described datasets: a PU dataset with artificial bearing damages labeled in three classes; a PU dataset with real bearing damages labeled in four classes and CWRU dataset labeled in four classes. The datasets are split into training and testing sets in 80/20 manner. For validation of the proposed method performance, the 10-fold cross-validation method was used. It is executed by randomly shuffling and splitting the dataset into 10 groups. One group is held out as test data, while the others are used to train the model. In such a way, 10 experiments are performed each time using the next holdout set for testing with a rule that each data sample can only be used for one holdout set.
Then, the trained model is tested on unseen data using the testing set. Equations (23)–(26) show the expressions used to calculate recall, precision, F1-score and total fault identification accuracy (FIA). The confusion matrices are shown in Figure 13.
The class labels for the confusion matrices are set as follows: H—Healthy bearing; OR—Bearing with outer ring fault; IR—Bearing with inner ring fault; OR + IR—Outer + Inner ring bearing fault; B—ball fault. The labels are encoded using Scikit Learn Label Encoder. The precision, recall, F1-score and FIA performance metrics shown in Table 6 describe the performance of the proposed method on the three datasets—two from PU set and CWRU set. Table 6 contains comparisons of the performance accuracy metrics of the proposed model with published methods using the same PU bearing real-fault vibration dataset.
Performance Comparison
The method proposed in this study was compared with six established methods. The paragraphs in this section are numerated and correspond to the number of the comparison methods presented in Table 7. The classification accuracies from lowest to highest correspond to the color spectrum from green to red. Each method was tested on three datasets used for this paper:
- (1)
- Yan et al. [18] extracted energy features from a WPT decomposed signal and used the Random Forest algorithm for classification. After extracting the same energy features from the decomposed signal using the PU experimental data and applying Random Forest, we obtained a 99.70% accuracy result for the real fault data and 94.10% for the artificial data, which is less than the proposed method, though this method has the closest performance levels among the comparison methods. This can be explained by the fact that both the proposed method and the method developed by Yan et al. utilized a powerful Random Forest algorithm, inside the Boruta feature selection for the first and as a classifier for the latter. However, the drawback of the comparison method is that there is no feature variability. The single energy feature compared to a set of different statistical features from time and frequency domain lacks sensitivity and thus yields less discriminant information;
- (2)
- For the second comparison, as demonstrated in the method developed by Surti et al. [58], the bearing vibration signal from the PU experiment data was decomposed using WPT and the statistical features from Table 5 were extracted. Classification was completed using k-NN with five nearest neighbors. The method yielded 92.12% accuracy for real fault data and 90.19% for artificial fault data. The underperformance of this method in comparison with the proposed method can be attributed to the absence of feature selection and thus presence of the less discriminant or possibly junk features detrimental for classification performance in the method’s feature vector. Additionally, the simple k-NN algorithm is known as a weaker classifier compared with Subspace k-NN;
- (3)
- The method developed by Yadavar Nikravesh [30] et al. decomposed the bearing vibration signal using WPT, extracted energy features and forwards the feature set to a Gaussian kernel SVM for classification. To make a correct comparison, the energy features were extracted from WPT decomposed experimental data bearing vibration signal and classification was executed by the Gaussian kernel SVM classifier. Accuracy yielded by the comparison method with real fault data is 89.96% and accuracy with the artificial fault data is 90.76%, which is lower than the proposed method for the reason of low feature variability similarly to the method developed by Yan et al, meaning that this comparison method is likely to show a better performance on the feature vector that would contain features of different domains;
- (4)
- For the fourth comparison method, the best energy node out of the third decomposition level was selected, then statistical features from Table 5 were extracted and the resulting feature set was forwarded to the Subspace k-NN for classification. The accuracy result for the real fault data is 93.07% and 91.58% for the artificial fault data. The lower accuracy in comparison with the proposed method can be explained by not utilizing the whole WPT decomposition level, which means leaving a significant amount of fault-related information untouched. Then, for the same reason, utilization of the whole WPT decomposition level by the proposed method becomes an advantage and is considered as a part of the proposed method contribution;
- (5)
- The proposed method together with Chi-Squared test for feature selection instead of Boruta algorithm showed slightly lower accuracies for two PU datasets; however, it performed better on the CWRU dataset. This close performance can be explained by the fact that this comparison method shares most of the structure with the proposed method and only differs in the feature selection step; however, we observed that the feature pools created by this algorithm for all datasets contain energy of signal feature as a predominant one which strongly resembles the feature pools of comparison method one and three, which utilized only energy of signal features;
- (6)
- The last comparison method is the Deep Learning Attention Stream Network. This method showed very high classification performance without any signal preprocessing. However, the authors believe that if WPT signal processing had been considered, the accuracy of this method on given data would have reached 100%.
6. Conclusions
In this paper, a hybrid feature-selection framework for bearing fault diagnosis based on Wrapper-WPT was proposed. The authors have addressed the problem of diagnosis of the roller element bearing under variable rotational speed. Using WPT to automatically detect the most significant frequency nodes for fault diagnosis may lead to the neglect of other important bands, which have smaller amplitudes. To ensure reliable fault-feature extraction without premature conclusions on the significance of fault information contained in the node at the signal processing stage, the Wrapper-WPT framework utilized the whole WPT decomposition level in contrast to optimal node selection with the intention of not losing any fault-related information prior to feature extraction. Furthermore, a compound of WPT and the Boruta feature-selection algorithm allowed the extraction of the highly discriminant features from the wide feature pool, forming a novel hybrid feature-selection technique. The analysis of the feature distribution obtained from the Wrapper-WPT framework allows us to find the vibration frequency bands that are the most useful for fault diagnosis. After obtaining the discriminant features, the bearing condition was identified by subspace k-NN. The proposed framework was tested with two different datasets obtained from real-world bearing testbeds. The results obtained from the proposed method showed excellent classification performance in comparison with the reference methods in terms of classification accuracy.
As a main disadvantage of this work, the authors can mention that the proposed method lacks the baseline consensus on how deeply the dimensionality of the wide feature pool should be reduced and what should be the optimal number of features in the final feature vector. In other words, the max depth Boruta parameter is a hand-picked hyperparameter with the intention of maximizing the classification performance on the validation set. Future work will focus on overcoming this drawback using various optimization techniques such as a deeper analysis of WPT decomposition capabilities and increasing the precision of the frequency bands with meaningful components, together with the incorporation of complex ensemble feature-selection methods for the Wrapper-WPT feature-selection framework performance enhancement.
Author Contributions
Conceptualization, A.S.M., Z.A. and J.-M.K.; methodology, A.S.M., Z.A. and J.-M.K.; validation, A.S.M., Z.A. and J.-M.K.; formal analysis, A.S.M., Z.A. and J.-M.K.; resources, A.S.M., Z.A. and J.-M.K.; writing—original draft preparation, A.S.M. and Z.A.; writing—review and editing, J.-M.K.; visualization, A.S.M. and Z.A.; supervision, J.-M.K.; funding acquisition, J.-M.K. All authors have read and agreed to the published version of the manuscript.
Funding
This research was funded by the Ministry of Trade, Industry and Energy (MOTIE) and supported by the Korea Evaluation Institute of Industrial Technology (KIET) (RS-2022-00142509, The development of simulation stage and digital twin for Land Based Test Site and hydrogen powered vessel with fuel cell). This work was also supported by a National IT Industry Promotion Agency (NIPA) grant funded by the Korean government Ministry of Science and ICT (MSIT), Grant No. S1712-22-1001, for development of a smart mixed reality technology for improving the pipe installation and inspection processes in the offshore structure fabrication and by the Technology Development Program (S3106236) funded by the Ministry of SMEs and Startups (MSS, Republic of Korea).
Institutional Review Board Statement
Not applicable.
Informed Consent Statement
Not applicable.
Data Availability Statement
Data will be provided upon request.
Conflicts of Interest
The Authors declare no conflict of interest.
References
- Bazurto, A.J.; Quispe, E.C.; Mendoza, R.C. Causes and failures classification of industrial electric motor. In Proceedings of the 2016 IEEE ANDESCON, Arequipa, Peru, 19–21 October 2016; pp. 1–4. [Google Scholar] [CrossRef]
- Xu, G.; Liu, M.; Jiang, Z.; Shen, W.; Huang, C. Online Fault Diagnosis Method Based on Transfer Convolutional Neural Networks. IEEE Trans. Instrum. Meas. 2020, 69, 509–520. [Google Scholar] [CrossRef]
- Randall, R.B. Vibration-Based Condition Monitoring: Industrial, Aerospace, and Automotive Applications; Wiley: Chichester, UK; Hoboken, NJ, USA, 2011. [Google Scholar]
- Maliuk, A.S.; Prosvirin, A.E.; Ahmad, Z.; Kim, C.H.; Kim, J.-M. Novel Bearing Fault Diagnosis Using Gaussian Mixture Model-Based Fault Band Selection. Sensors 2021, 21, 6579. [Google Scholar] [CrossRef] [PubMed]
- Tandon, N. A comparison of some vibration parameters for the condition monitoring of rolling element bearings. Measurement 1994, 12, 285–289. [Google Scholar] [CrossRef]
- Sun, J.; Yan, C.; Wen, J. Intelligent Bearing Fault Diagnosis Method Combining Compressed Data Acquisition and Deep Learning. IEEE Trans. Instrum. Meas. 2018, 67, 185–195. [Google Scholar] [CrossRef]
- Huang, J.; Liu, J.; Gong, H.; Deng, X. Multimodal loosening detection for threaded fasteners based on multiscale cross fuzzy entropy. Mech. Syst. Signal Process. 2023, 186, 109834. [Google Scholar] [CrossRef]
- Honarvar, F.; Martin, H.R. New Statistical Moments for Diagnostics of Rolling Element Bearings. J. Manuf. Sci. Eng. 1997, 119, 425–432. [Google Scholar] [CrossRef]
- Martin, H.R.; Honarvar, F. Application of statistical moments to bearing failure detection. Appl. Acoust. 1995, 44, 67–77. [Google Scholar] [CrossRef]
- Skora, M.; Ewert, P.; Kowalski, C.T. Selected Rolling Bearing Fault Diagnostic Methods in Wheel Embedded Permanent Magnet Brushless Direct Current Motors. Energies 2019, 12, 4212. [Google Scholar] [CrossRef] [Green Version]
- Chen, L.; Xu, G.; Tao, T.; Wu, Q. Deep Residual Network for Identifying Bearing Fault Location and Fault Severity Concurrently. IEEE Access 2020, 8, 168026–168035. [Google Scholar] [CrossRef]
- Hoang, D.T.; Kang, H.J. A Motor Current Signal-Based Bearing Fault Diagnosis Using Deep Learning and Information Fusion. IEEE Trans. Instrum. Meas. 2020, 69, 3325–3333. [Google Scholar] [CrossRef]
- Long, J.; Qin, Y.; Yang, Z.; Huang, Y.; Li, C. Discriminative feature learning using a multiscale convolutional capsule network from attitude data for fault diagnosis of industrial robots. Mech. Syst. Signal Process. 2023, 182, 109569. [Google Scholar] [CrossRef]
- Pang, S.; Yang, X. A Cross-Domain Stacked Denoising Autoencoders for Rotating Machinery Fault Diagnosis Under Different Working Conditions. IEEE Access 2019, 7, 77277–77292. [Google Scholar] [CrossRef]
- Cui, M.; Wang, Y.; Lin, X.; Zhong, M. Fault Diagnosis of Rolling Bearings Based on an Improved Stack Autoencoder and Support Vector Machine. IEEE Sens. J. 2021, 21, 4927–4937. [Google Scholar] [CrossRef]
- Toma, R.N.; Piltan, F.; Kim, J.-M. A Deep Autoencoder-Based Convolution Neural Network Framework for Bearing Fault Classification in Induction Motors. Sensors 2021, 21, 8453. [Google Scholar] [CrossRef] [PubMed]
- Saucedo-Dorantes, J.J.; Arellano-Espitia, F.; Delgado-Prieto, M.; Osornio-Rios, R.A. Diagnosis Methodology Based on Deep Feature Learning for Fault Identification in Metallic, Hybrid and Ceramic Bearings. Sensors 2021, 21, 5832. [Google Scholar] [CrossRef] [PubMed]
- Yan, H.; Mu, H.; Yi, X.; Yang, Y.; Chen, G. Fault Diagnosis of Rolling Bearing with Small Samples Based on Wavelet Packet Theory and Random Forest. In Proceedings of the 2019 International Conference on Sensing, Diagnostics, Prognostics, and Control (SDPC), Beijing, China, 15–17 August 2019; pp. 305–310. [Google Scholar] [CrossRef]
- Chen, Y.; Zhang, T.; Luo, Z.; Sun, K. A Novel Rolling Bearing Fault Diagnosis and Severity Analysis Method. Appl. Sci. 2019, 9, 2356. [Google Scholar] [CrossRef] [Green Version]
- Li, G.; Deng, C.; Wu, J.; Chen, Z.; Xu, X. Rolling Bearing Fault Diagnosis Based on Wavelet Packet Transform and Convolutional Neural Network. Appl. Sci. 2020, 10, 770. [Google Scholar] [CrossRef] [Green Version]
- Li, X.; Zhang, Y.; Wang, F.; Sun, S. A Fault Diagnosis Method of Rolling Bearing Based on Wavelet Packet Analysis and Deep Forest. Symmetry 2022, 14, 267. [Google Scholar] [CrossRef]
- Zhu, H.; He, Z.; Wei, J.; Wang, J.; Zhou, H. Bearing Fault Feature Extraction and Fault Diagnosis Method Based on Feature Fusion. Sensors 2021, 21, 2524. [Google Scholar] [CrossRef]
- Bastami, A.R.; Aasi, A.; Arghand, H.A. Estimation of Remaining Useful Life of Rolling Element Bearings Using Wavelet Packet Decomposition and Artificial Neural Network. Iran. J. Sci. Technol. Trans. Electr. Eng. 2019, 43, 233–245. [Google Scholar] [CrossRef]
- Guo, W.; Wu, C.; Ding, Z.; Zhou, Q. Prediction of surface roughness based on a hybrid feature selection method and long short-term memory network in grinding. Int. J. Adv. Manuf. Technol. 2021, 112, 2853–2871. [Google Scholar] [CrossRef]
- Lu, P.; Sorathiya, V.; Lavadiya, S.; Luo, Y.; Nguyen, T.K.; Dhasarathan, V. A hybrid feature selection combining wavelet transform for quantitative analysis of heat value of coal using laser-induced breakdown spectroscopy. Appl. Phys. B 2021, 127, 19. [Google Scholar] [CrossRef]
- Hussein, A.M.; Obed, A.A.; Zubo, R.H.; Al-Yasir, Y.I.; Saleh, A.L.; Fadhel, H.; Sheikh-Akbari, A.; Mokryani, G.; Abd-Alhameed, R.A. Detection and Diagnosis of Stator and Rotor Electrical Faults for Three-Phase Induction Motor via Wavelet Energy Approach. Electronics 2022, 11, 1253. [Google Scholar] [CrossRef]
- Rapur, J.S.; Tiwari, R. Experimental fault diagnosis for known and unseen operating conditions of centrifugal pumps using MSVM and WPT based analyses. Measurement 2019, 147, 106809. [Google Scholar] [CrossRef]
- Wang, X.; Lu, Z.; Wei, J.; Zhang, Y. Fault Diagnosis for Rail Vehicle Axle-Box Bearings Based on Energy Feature Reconstruction and Composite Multiscale Permutation Entropy. Entropy 2019, 21, 865. [Google Scholar] [CrossRef] [Green Version]
- Feng, H.; Chen, R.; Wang, Y. Feature extraction for fault diagnosis based on wavelet packet decomposition: An application on linear rolling guide. Adv. Mech. Eng. 2018, 10, 168781401879636. [Google Scholar] [CrossRef] [Green Version]
- Nikravesh, S.Y.; Rezaie, H.; Kilpatrik, M.; Taheri, H. Intelligent Fault Diagnosis of Bearings Based on Energy Levels in Frequency Bands Using Wavelet and Support Vector Machines (SVM). J. Manuf. Mater. Process. 2019, 3, 11. [Google Scholar] [CrossRef] [Green Version]
- Liu, Y.; Yang, Y.; Feng, T.; Sun, Y.; Zhang, X. Research on Rotating Machinery Fault Diagnosis Method Based on Energy Spectrum Matrix and Adaptive Convolutional Neural Network. Processes 2020, 9, 69. [Google Scholar] [CrossRef]
- Wu, C.-S.; Peng, Y.-X.; Zhuo, D.-B.; Zhang, J.-Q.; Ren, W.; Feng, Z.-Y. Energy Ratio Variation-Based Structural Damage Detection Using Convolutional Neural Network. Appl. Sci. 2022, 12, 10220. [Google Scholar] [CrossRef]
- Qian, H.; Zhang, Y.; Li, Y.; Gao, J.; Song, J. Damage Monitoring of Engineered Cementitious Composite Beams Reinforced with Hybrid Bars Using Piezoceramic-Based Smart Aggregates. Sensors 2022, 22, 7184. [Google Scholar] [CrossRef]
- Yuan, X.; Fan, Y.; Zhou, C.; Wang, X.; Zhang, G. Fault Diagnosis of Check Valve Based on KPLS Optimal Feature Selection and Kernel Extreme Learning Machine. Coatings 2022, 12, 1320. [Google Scholar] [CrossRef]
- Zhang, X.; Zhao, Z.; Wang, Z.; Wang, X. Fault Detection and Identification Method for Quadcopter Based on Airframe Vibration Signals. Sensors 2021, 21, 581. [Google Scholar] [CrossRef] [PubMed]
- Al Tobi, M.; Bevan, G.; Wallace, P.; Harrison, D.; Okedu, K.E. Using MLP-GABP and SVM with wavelet packet transform-based feature extraction for fault diagnosis of a centrifugal pump. Energy Sci. Eng. 2022, 10, 1826–1839. [Google Scholar] [CrossRef]
- Zhang, X.; Zhu, J.; Wu, Y.; Zhen, D.; Zhang, M. Feature Extraction for Bearing Fault Detection Using Wavelet Packet Energy and Fast Kurtogram Analysis. Appl. Sci. 2020, 10, 7715. [Google Scholar] [CrossRef]
- Gao, L.; Yang, Z.; Cai, L.; Wang, H.; Chen, P. Roller Bearing Fault Diagnosis Based on Nonlinear Redundant Lifting Wavelet Packet Analysis. Sensors 2010, 11, 260–277. [Google Scholar] [CrossRef] [PubMed]
- Ma, S.; Cai, W.; Liu, W.; Shang, Z.; Liu, G. A Lighted Deep Convolutional Neural Network Based Fault Diagnosis of Rotating Machinery. Sensors 2019, 19, 2381. [Google Scholar] [CrossRef] [PubMed] [Green Version]
- Huang, D.; Zhang, W.-A.; Guo, F.; Liu, W.; Shi, X. Wavelet Packet Decomposition-Based Multiscale CNN for Fault Diagnosis of Wind Turbine Gearbox. IEEE Trans. Cybern. 2021, 1–11. [Google Scholar] [CrossRef]
- Zhao, M.; Kang, M.; Tang, B.; Pecht, M. Deep Residual Networks With Dynamically Weighted Wavelet Coefficients for Fault Diagnosis of Planetary Gearboxes. IEEE Trans. Ind. Electron. 2018, 65, 4290–4300. [Google Scholar] [CrossRef]
- Zhao, M.; Kang, M.; Tang, B.; Pecht, M. Multiple Wavelet Coefficients Fusion in Deep Residual Networks for Fault Diagnosis. IEEE Trans. Ind. Electron. 2019, 66, 4696–4706. [Google Scholar] [CrossRef]
- Xiong, S.; Zhou, H.; He, S.; Zhang, L.; Xia, Q.; Xuan, J.; Shi, T. A Novel End-To-End Fault Diagnosis Approach for Rolling Bearings by Integrating Wavelet Packet Transform into Convolutional Neural Network Structures. Sensors 2020, 20, 4965. [Google Scholar] [CrossRef]
- Huang, H.; Tang, B.; Luo, J.; Pu, H.; Zhang, K. Residual Gated Dynamic Sparse Network for Gearbox Fault Diagnosis Using Multisensor Data. IEEE Trans. Ind. Inform. 2022, 18, 2264–2273. [Google Scholar] [CrossRef]
- Randall, R.B.; Antoni, J. Rolling element bearing diagnostics—A tutorial. Mech. Syst. Signal Process. 2011, 25, 485–520. [Google Scholar] [CrossRef]
- Lessmeier, C.; Kimotho, J.K.; Zimmer, D.; Sextro, W. Condition Monitoring of Bearing Damage in Electromechanical Drive Systems by Using Motor Current Signals of Electric Motors: A Benchmark Data Set for Data-Driven Classification. In Proceedings of the PHM Society European Conference, Bilbao, Spain, 5–8 July 2016; p. 17. [Google Scholar]
- Welcome to the Case Western Reserve University Bearing Data Center Website|Case School of Engineering|Case Western Reserve University. Case School of Engineering. 10 August 2021. Available online: https://engineering.case.edu/bearingdatacenter/welcome (accessed on 20 October 2022).
- Yang, J.; Zhou, C. A Fault Feature Extraction Method Based on LMD and Wavelet Packet Denoising. Coatings 2022, 12, 156. [Google Scholar] [CrossRef]
- Gao, R.X.; Yan, R. Wavelets; Springer: Boston, MA, USA, 2011. [Google Scholar] [CrossRef]
- Gao, R.X.; Yan, R. Selection of Base Wavelet. In Wavelets; Springer: Boston, MA, USA, 2011; pp. 165–187. [Google Scholar] [CrossRef]
- Agrawal, P.; Jayaswal, P. Diagnosis and Classifications of Bearing Faults Using Artificial Neural Network and Support Vector Machine. J. Inst. Eng. India Ser. C 2020, 101, 61–72. [Google Scholar] [CrossRef]
- Strömbergsson, D.; Marklund, P.; Berglund, K.; Saari, J.; Thomson, A. Mother wavelet selection in the discrete wavelet transform for condition monitoring of wind turbine drivetrain bearings. Wind Energy 2019, 22, 1581–1592. [Google Scholar] [CrossRef]
- Kursa, M.B.; Rudnicki, W.R. Feature Selection with the Boruta Package. J. Stat. Softw. 2010, 36, 1–13. [Google Scholar] [CrossRef]
- Hasan, M.J.; Sohaib, M.; Kim, J.-M. An Explainable AI-Based Fault Diagnosis Model for Bearings. Sensors 2021, 21, 4070. [Google Scholar] [CrossRef]
- Cover, T.; Hart, P. Nearest neighbor pattern classification. IEEE Trans. Inf. Theory 1967, 13, 21–27. [Google Scholar] [CrossRef] [Green Version]
- Grus, J. Data Science from Scratch: First Principles with Python, 1st ed.; O’Reilly: Sebastopol, CA, USA, 2015. [Google Scholar]
- Nearest Ho, T.K. Nearest neighbours in random subspaces. In Advances in Pattern Recognition. SSPR/SPR 1998; Amin, A., Dori, D., Pudi, P., Freeman, H., Eds.; Lecture Notes in Computer Science; Springer: Berlin, Germany, 1998. [Google Scholar] [CrossRef] [Green Version]
- Surti, K.V.; Naik, C.A. Bearing Condition Monitoring of Induction Motor Based on Discrete Wavelet Transform & K-nearest Neighbor. In Proceedings of the 2018 3rd International Conference for Convergence in Technology (I2CT), Pune, India, 6 April 2018; pp. 1–5. [Google Scholar] [CrossRef]
- Karnavas, Y.L.; Plakias, S.; Chasiotis, I.D. Extracting spatially global and local attentive features for rolling bearing fault diagnosis in electrical machines using attention stream networks. IET Electr. Power Appl. 2021, 15, 903–915. [Google Scholar] [CrossRef]
Figure 1.
Modular test rig used for PU data collection.
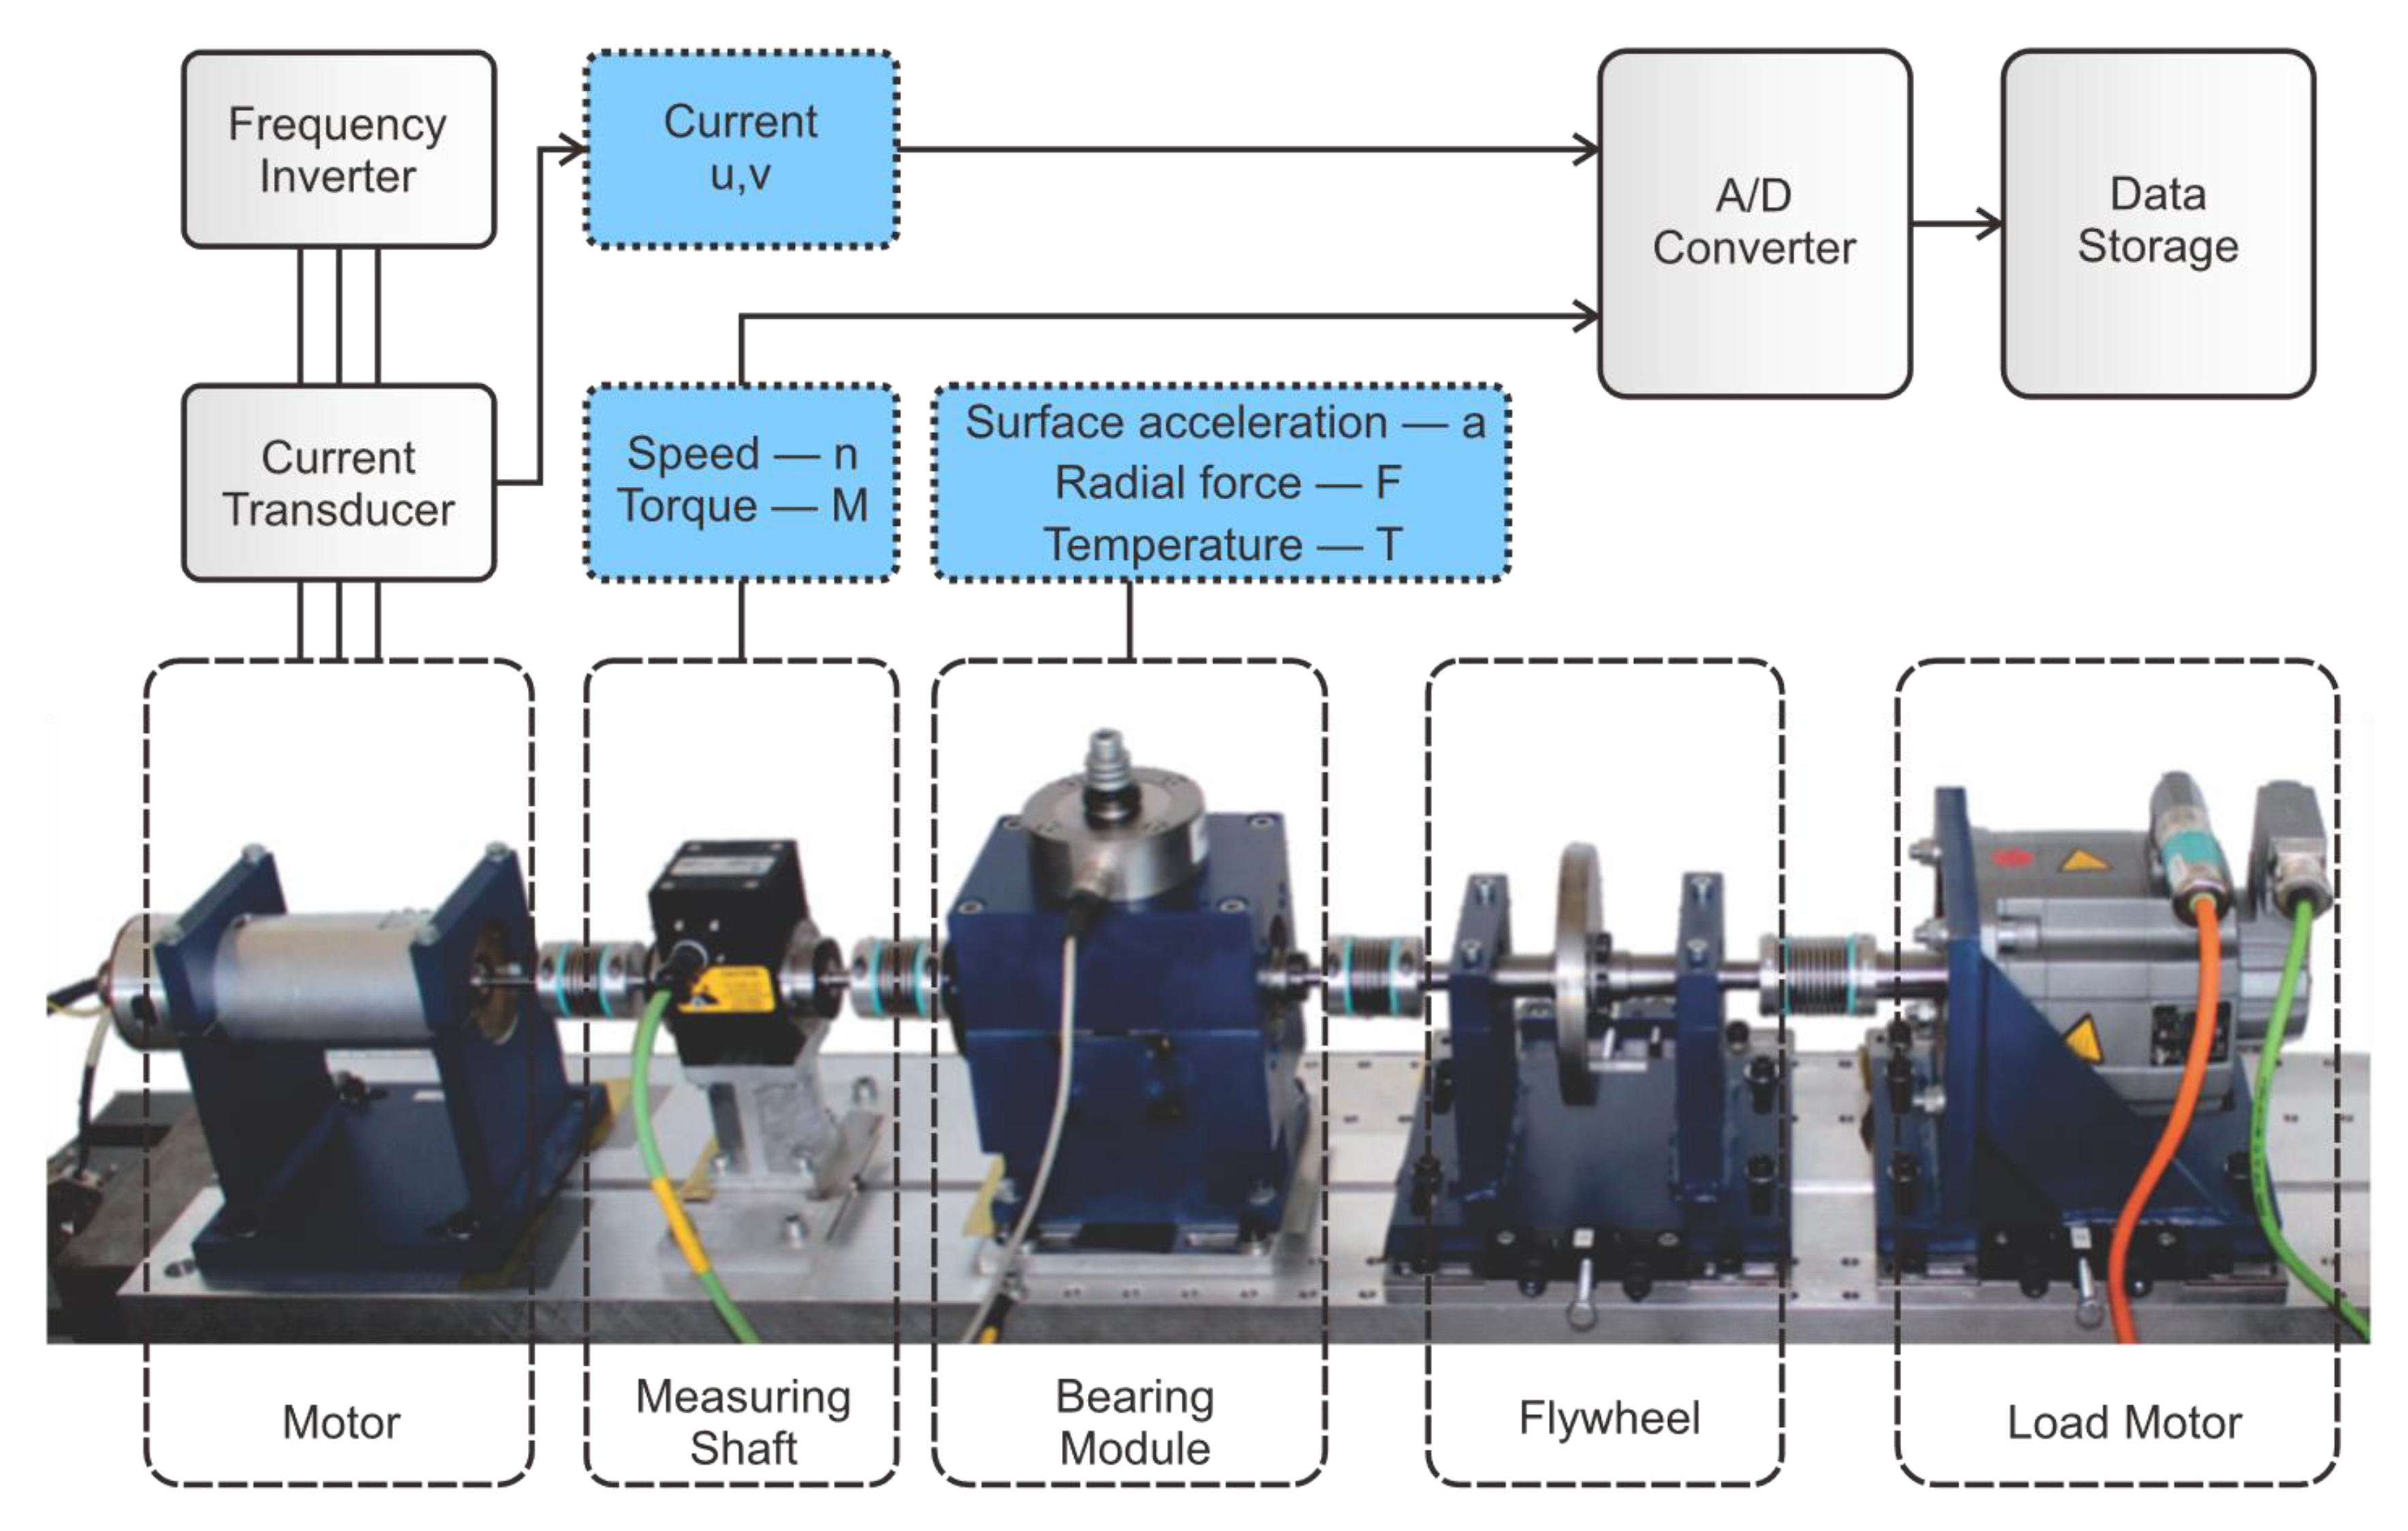
Figure 2.
Time-domain raw vibration signal plots.

Figure 3.
Case Western Reserve University testbed.
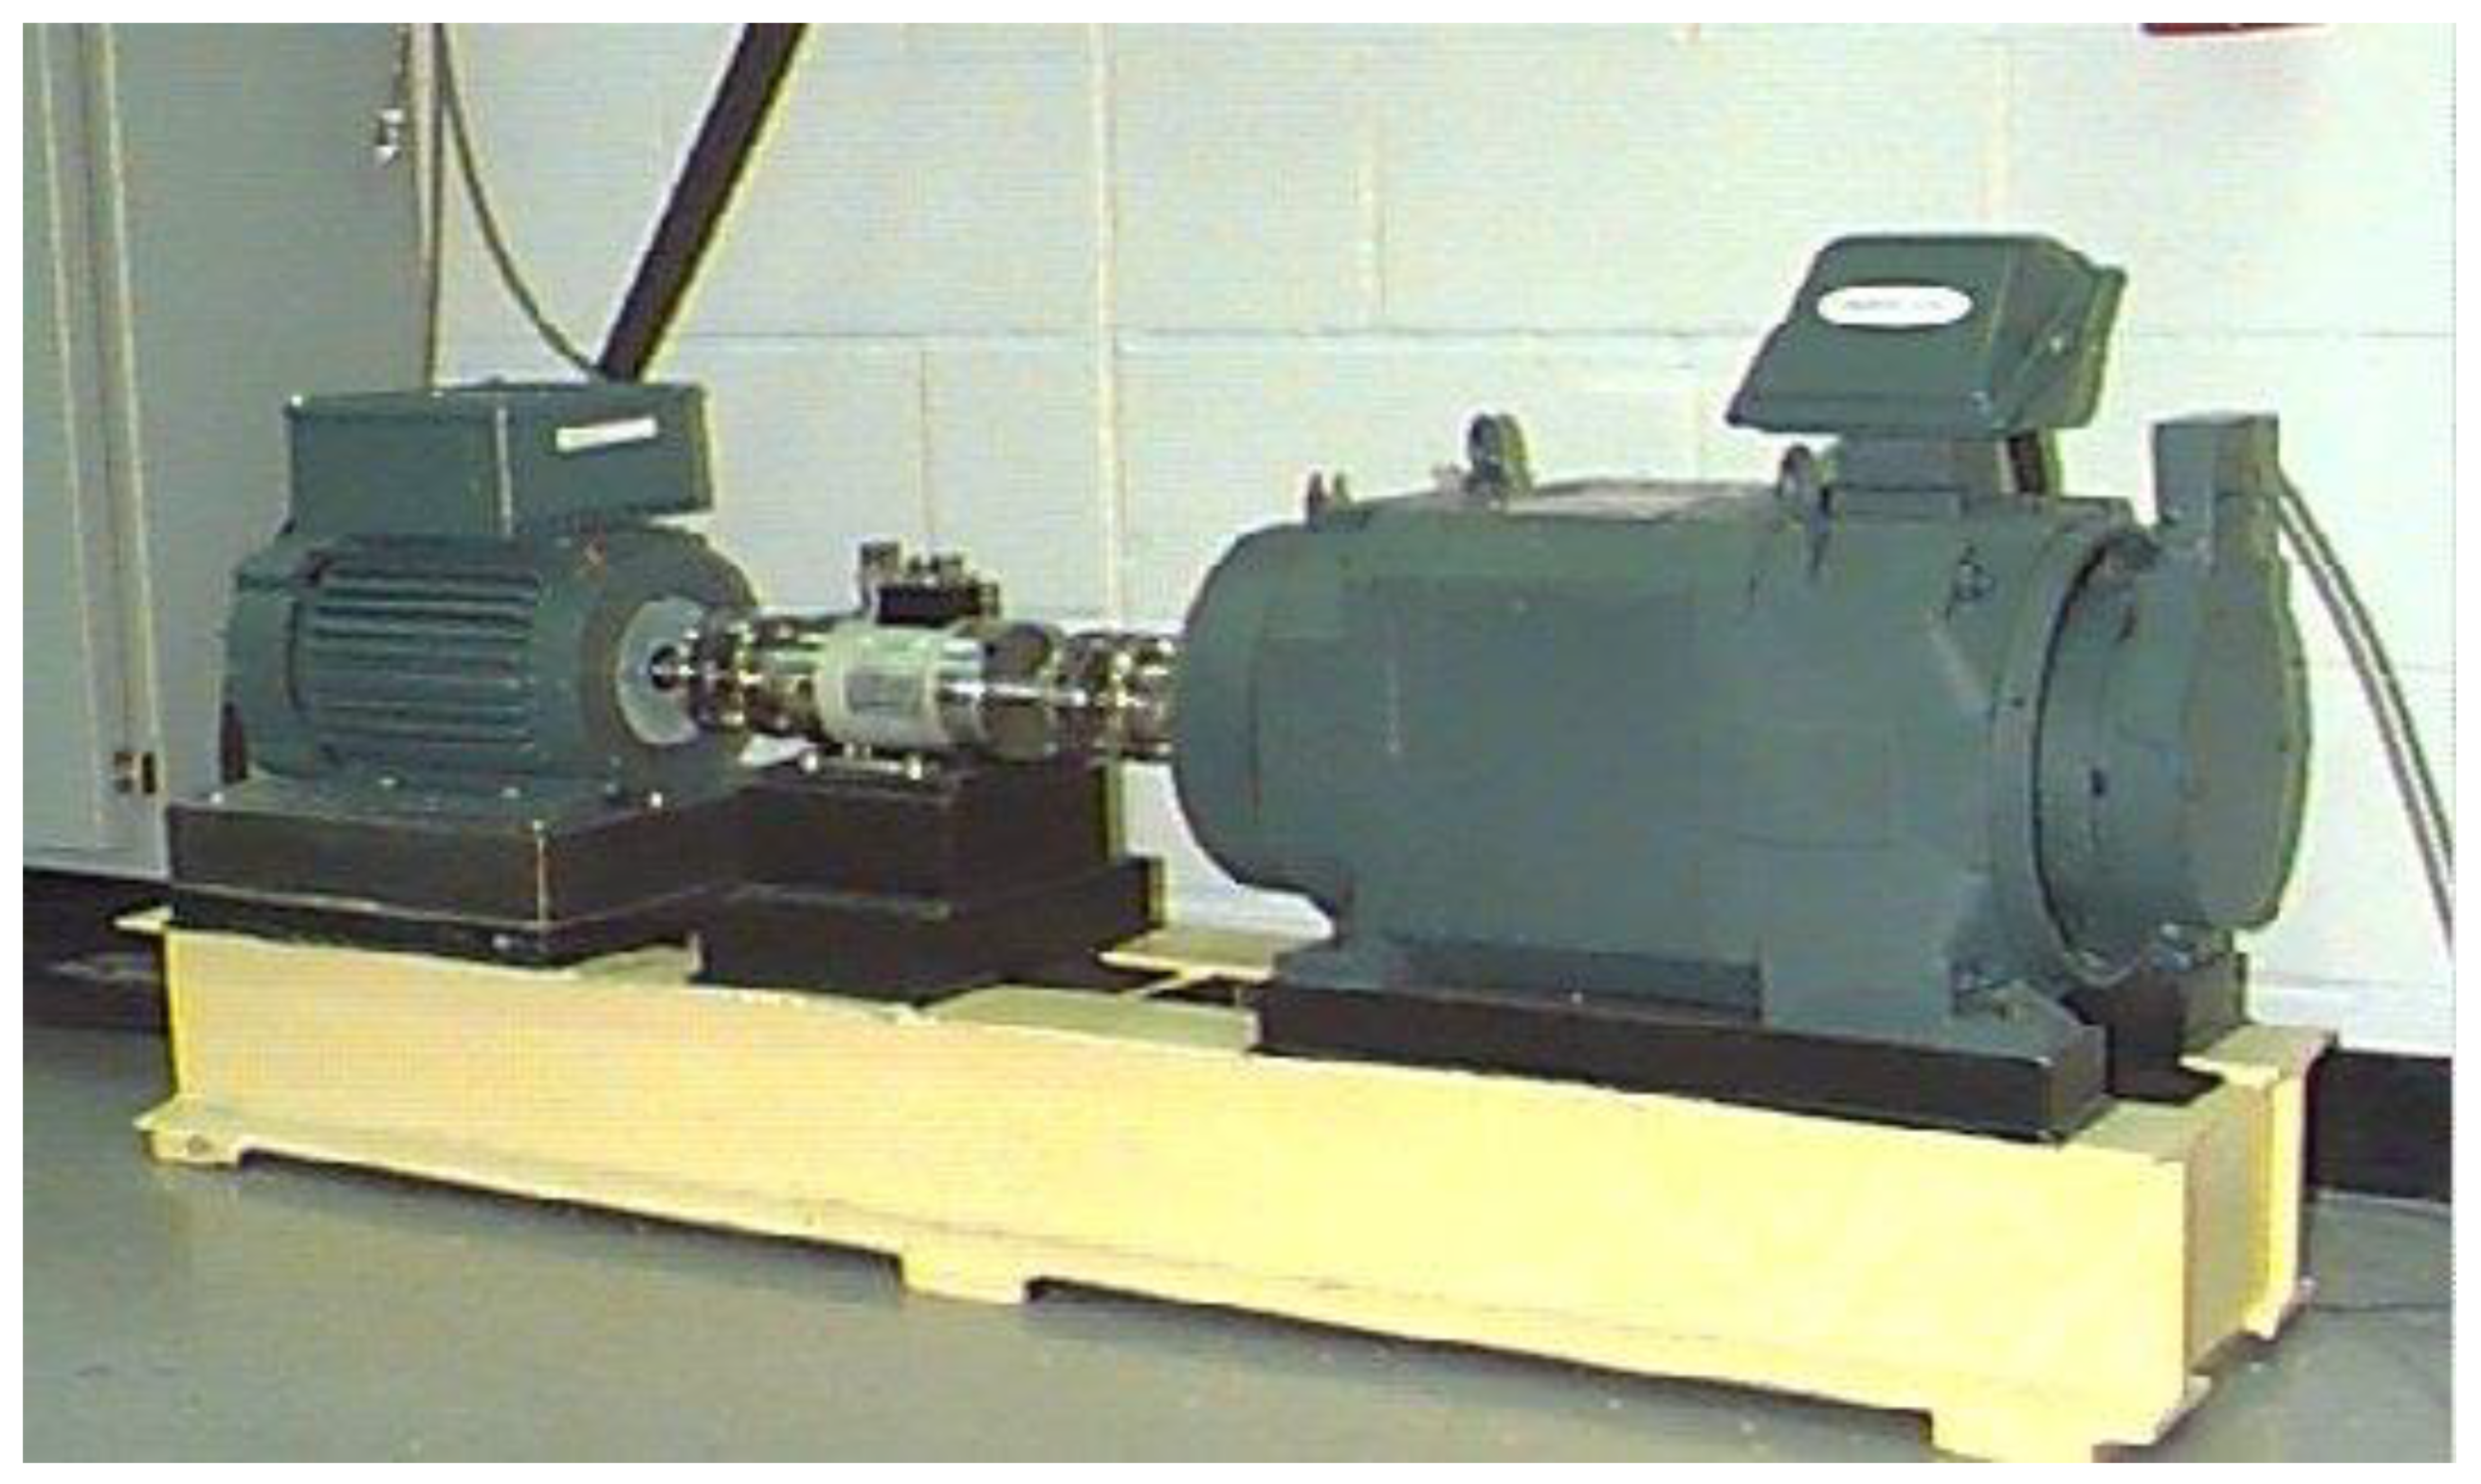
Figure 4.
The pipeline of the proposed methodology.

Figure 5.
WPT tree scheme.
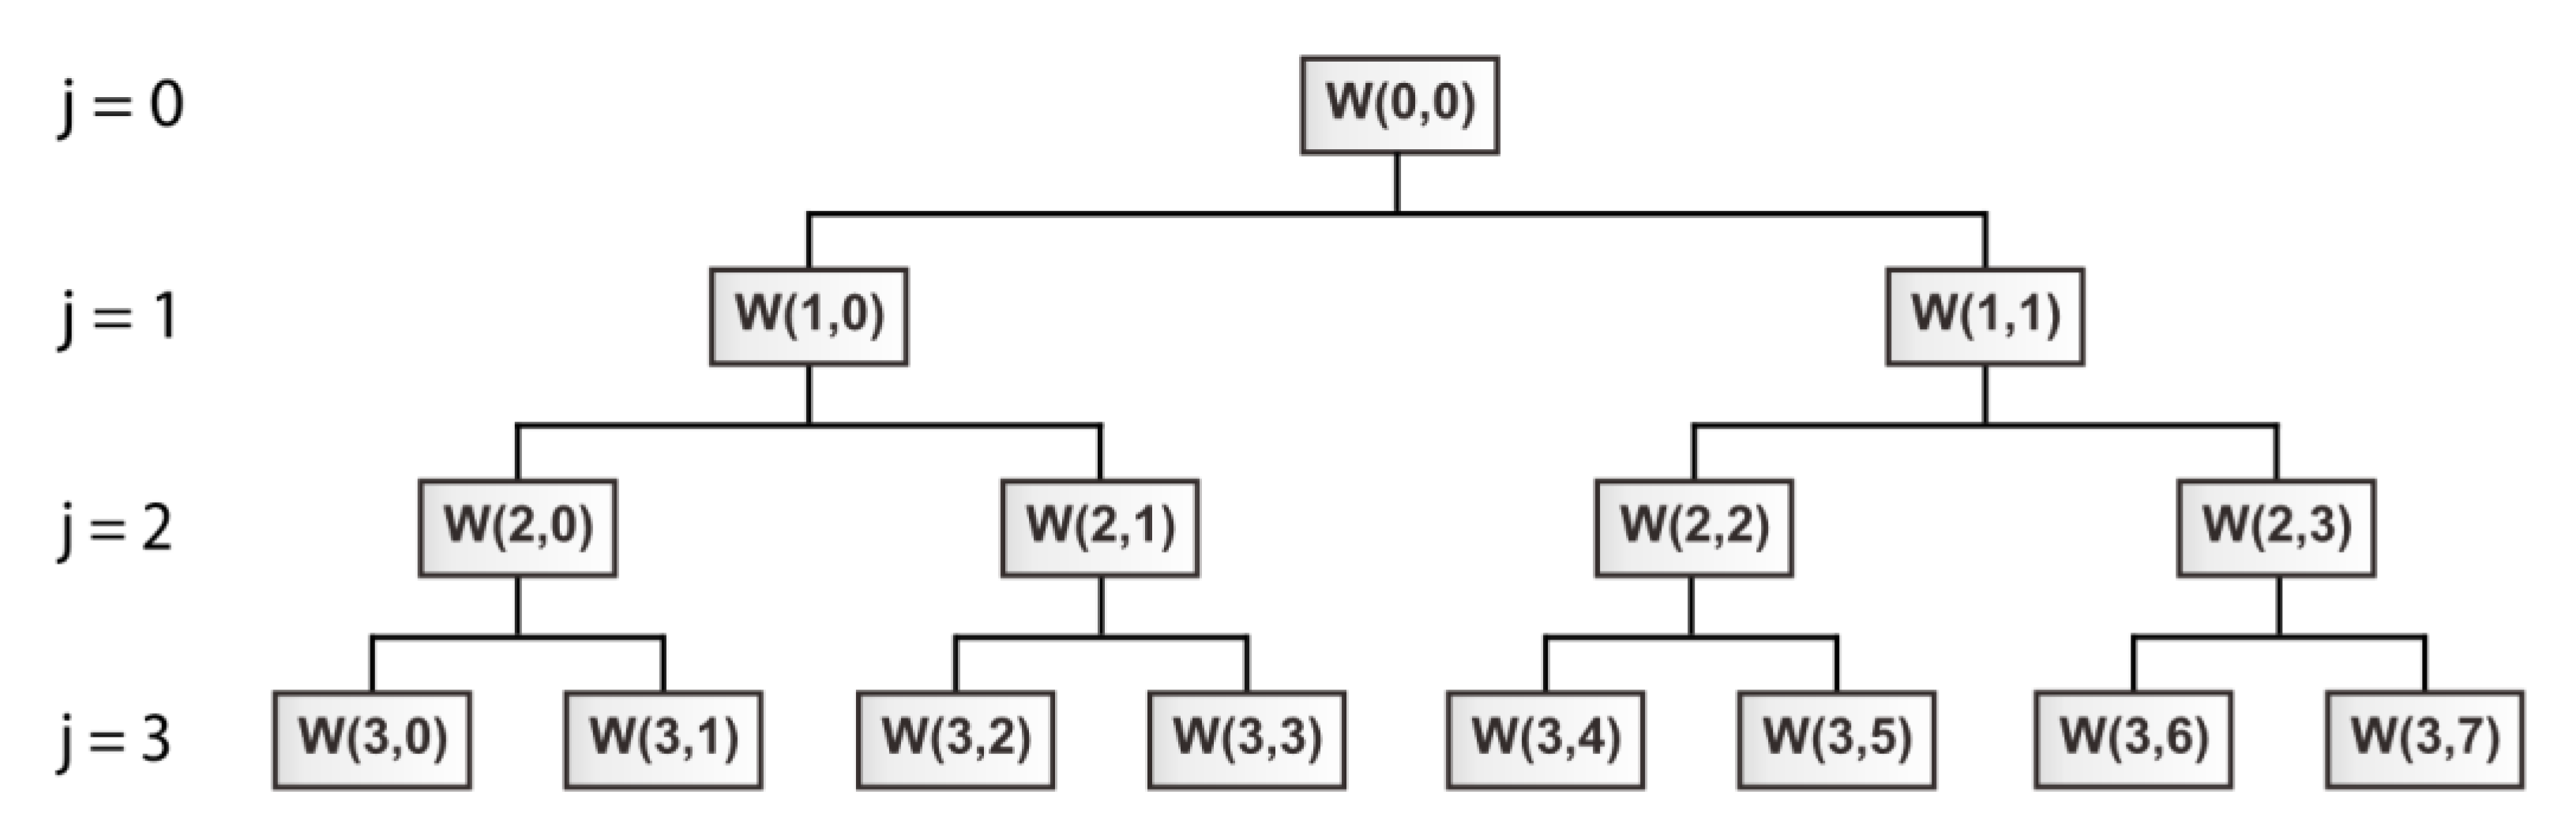
Figure 6.
Energy to Entropy ratio for artificial damage data.

Figure 7.
Energy to Entropy ratio for real damage data.

Figure 8.
The Boruta feature selection scheme.

Figure 9.
Number of features selected by the Boruta algorithm from each WPT node: (a) Dataset with artificial damages; (b) Dataset with real damages.
Figure 9.
Number of features selected by the Boruta algorithm from each WPT node: (a) Dataset with artificial damages; (b) Dataset with real damages.
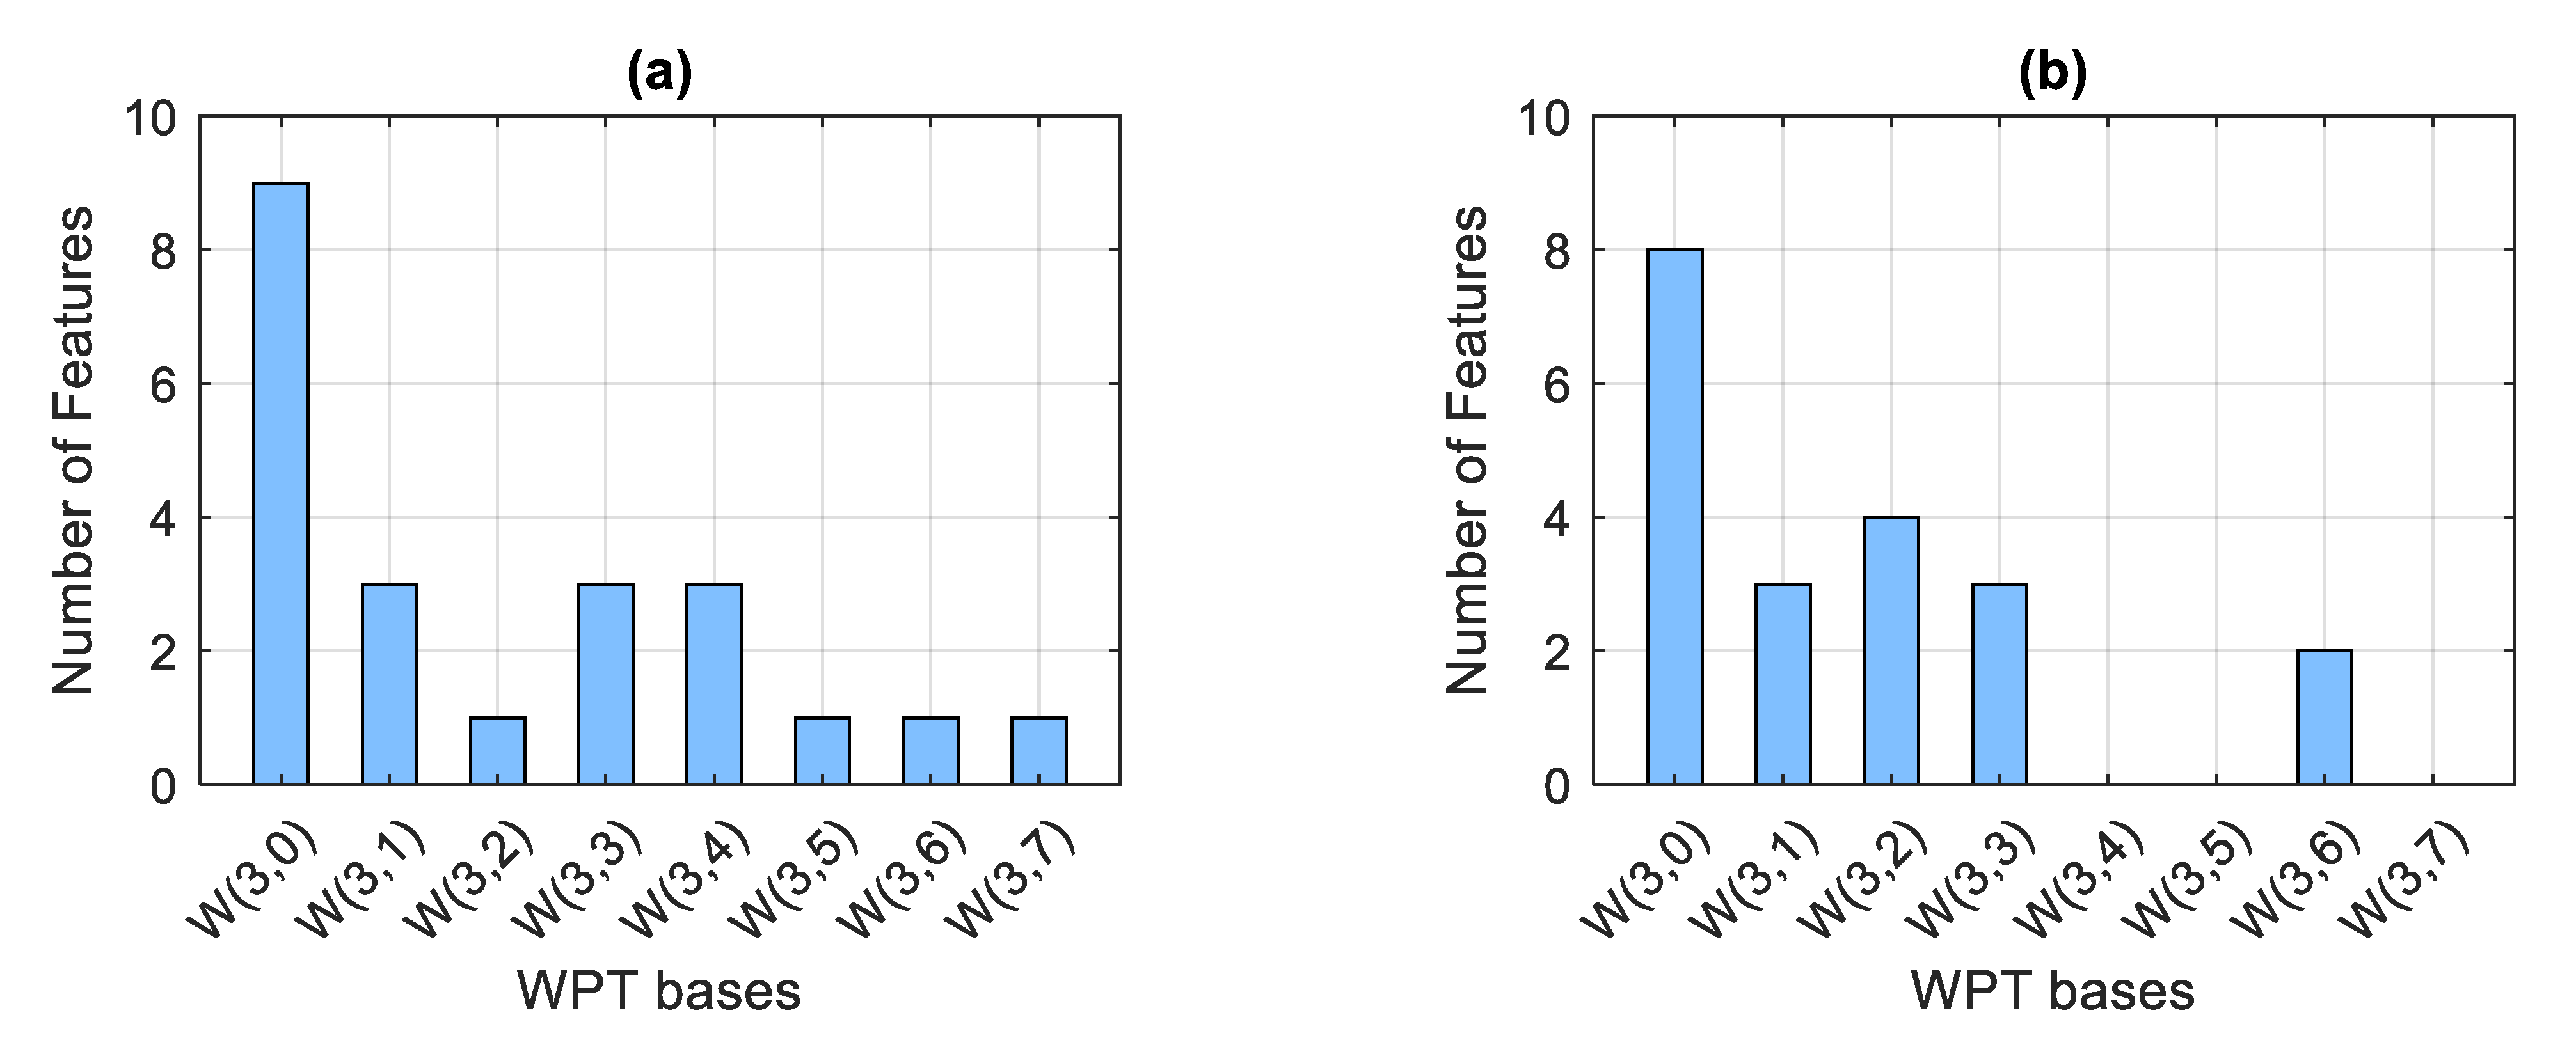
Figure 10.
The number of nodes in which the given features were selected by Boruta: (a) Dataset with artificial damages; (b) Dataset with real damages.
Figure 10.
The number of nodes in which the given features were selected by Boruta: (a) Dataset with artificial damages; (b) Dataset with real damages.
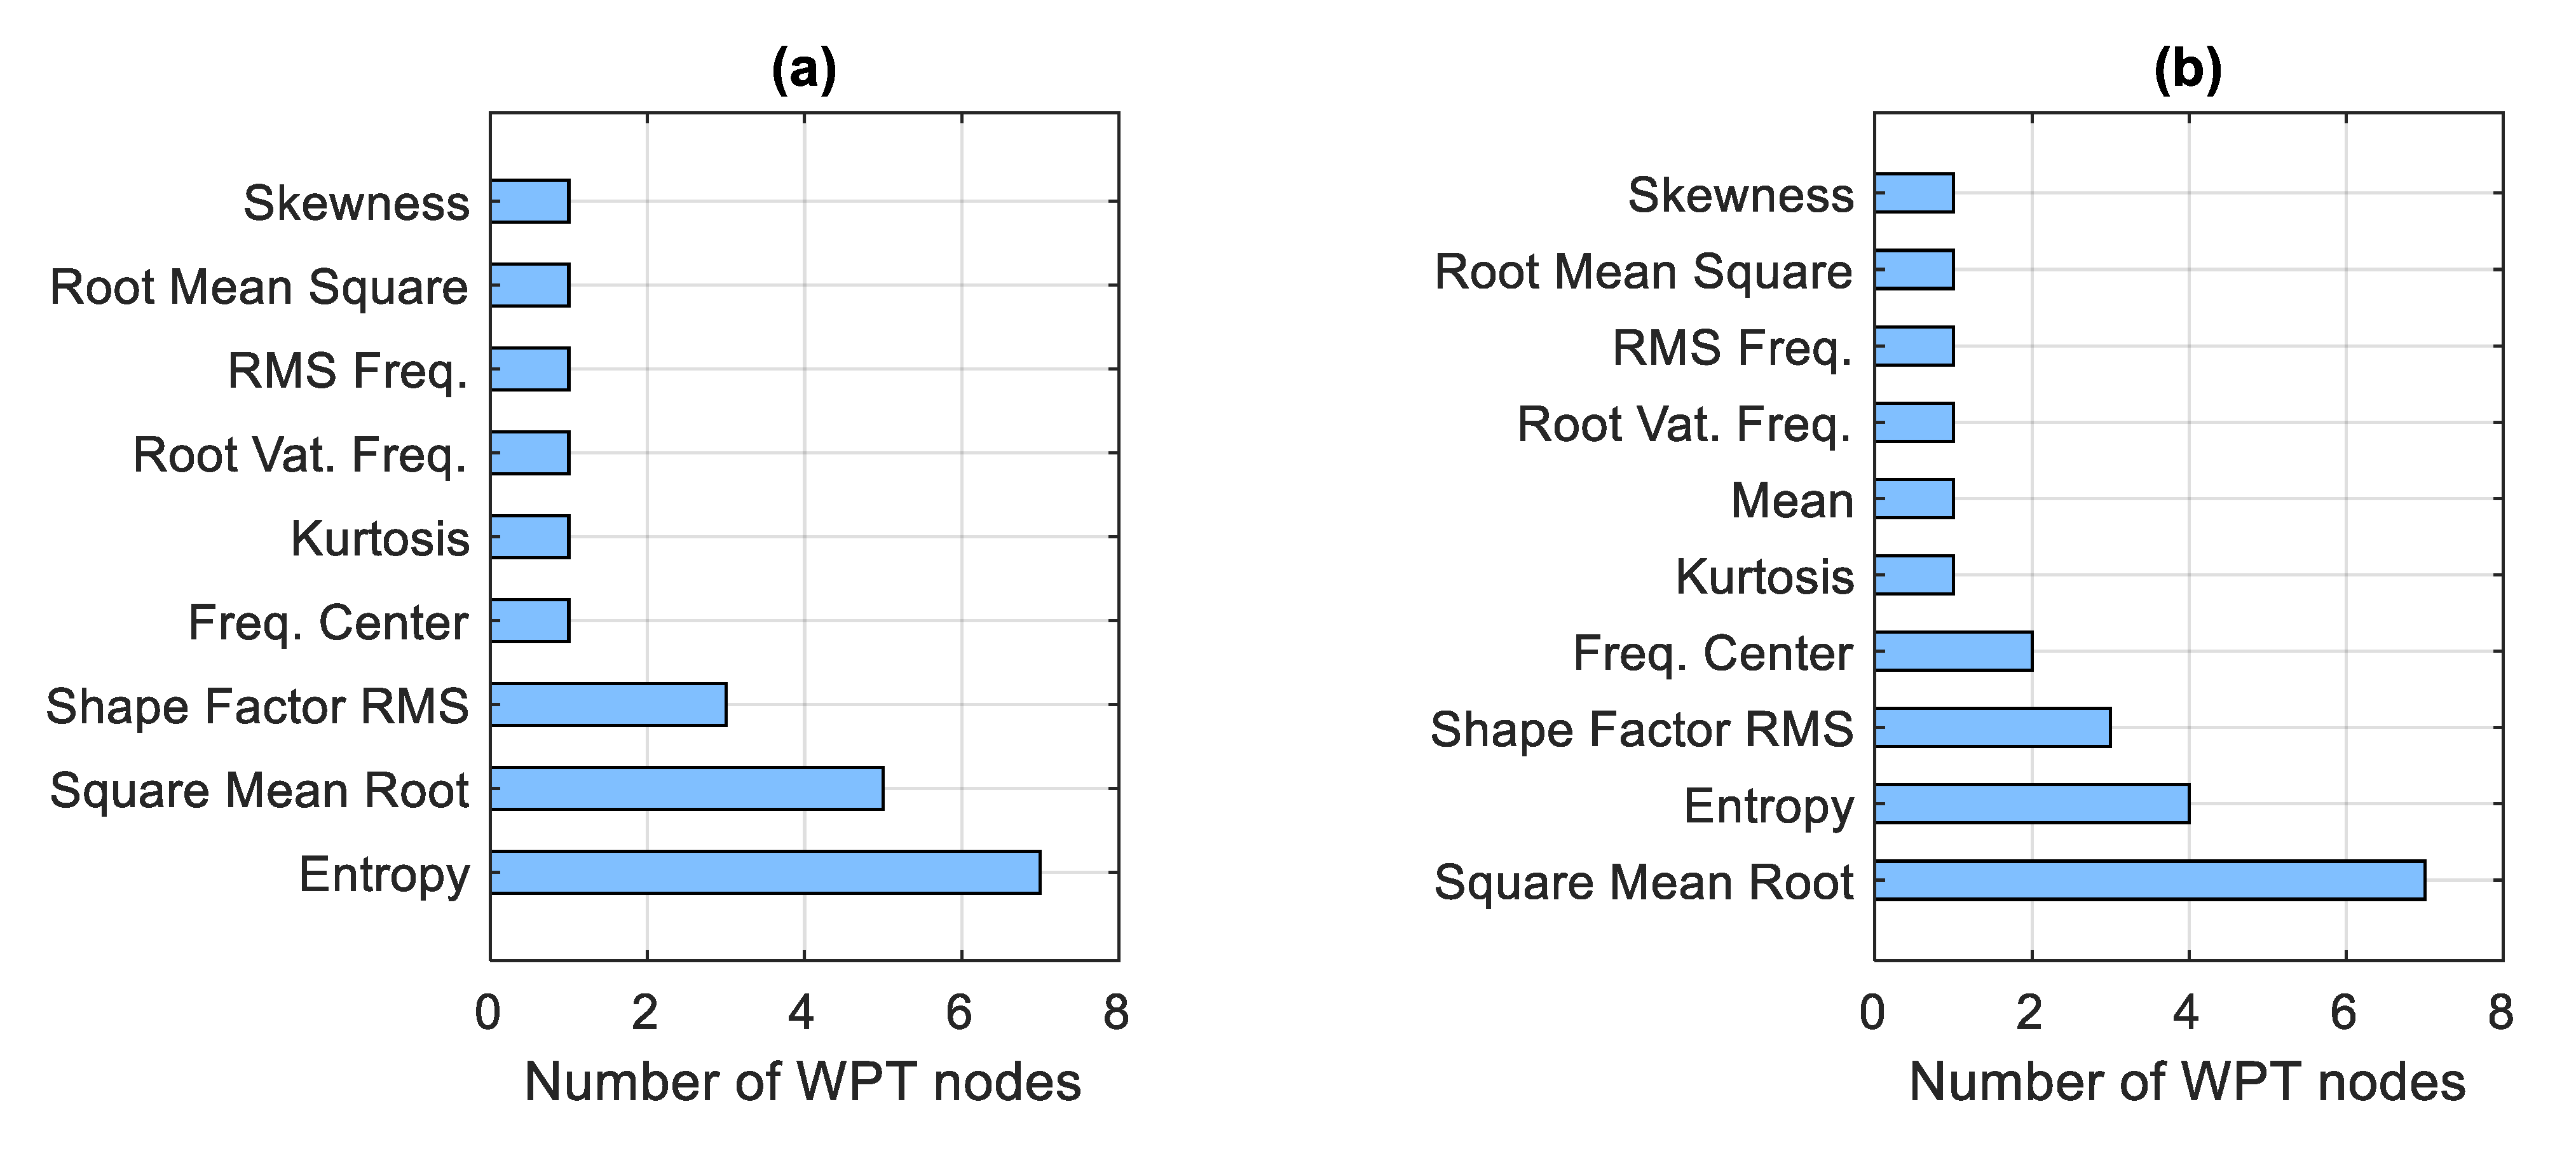
Figure 11.
Number of features selected by the Boruta algorithm from each WPT node (in the ascending order): (a) Dataset with artificial damages; (b) Dataset with real damages.
Figure 11.
Number of features selected by the Boruta algorithm from each WPT node (in the ascending order): (a) Dataset with artificial damages; (b) Dataset with real damages.
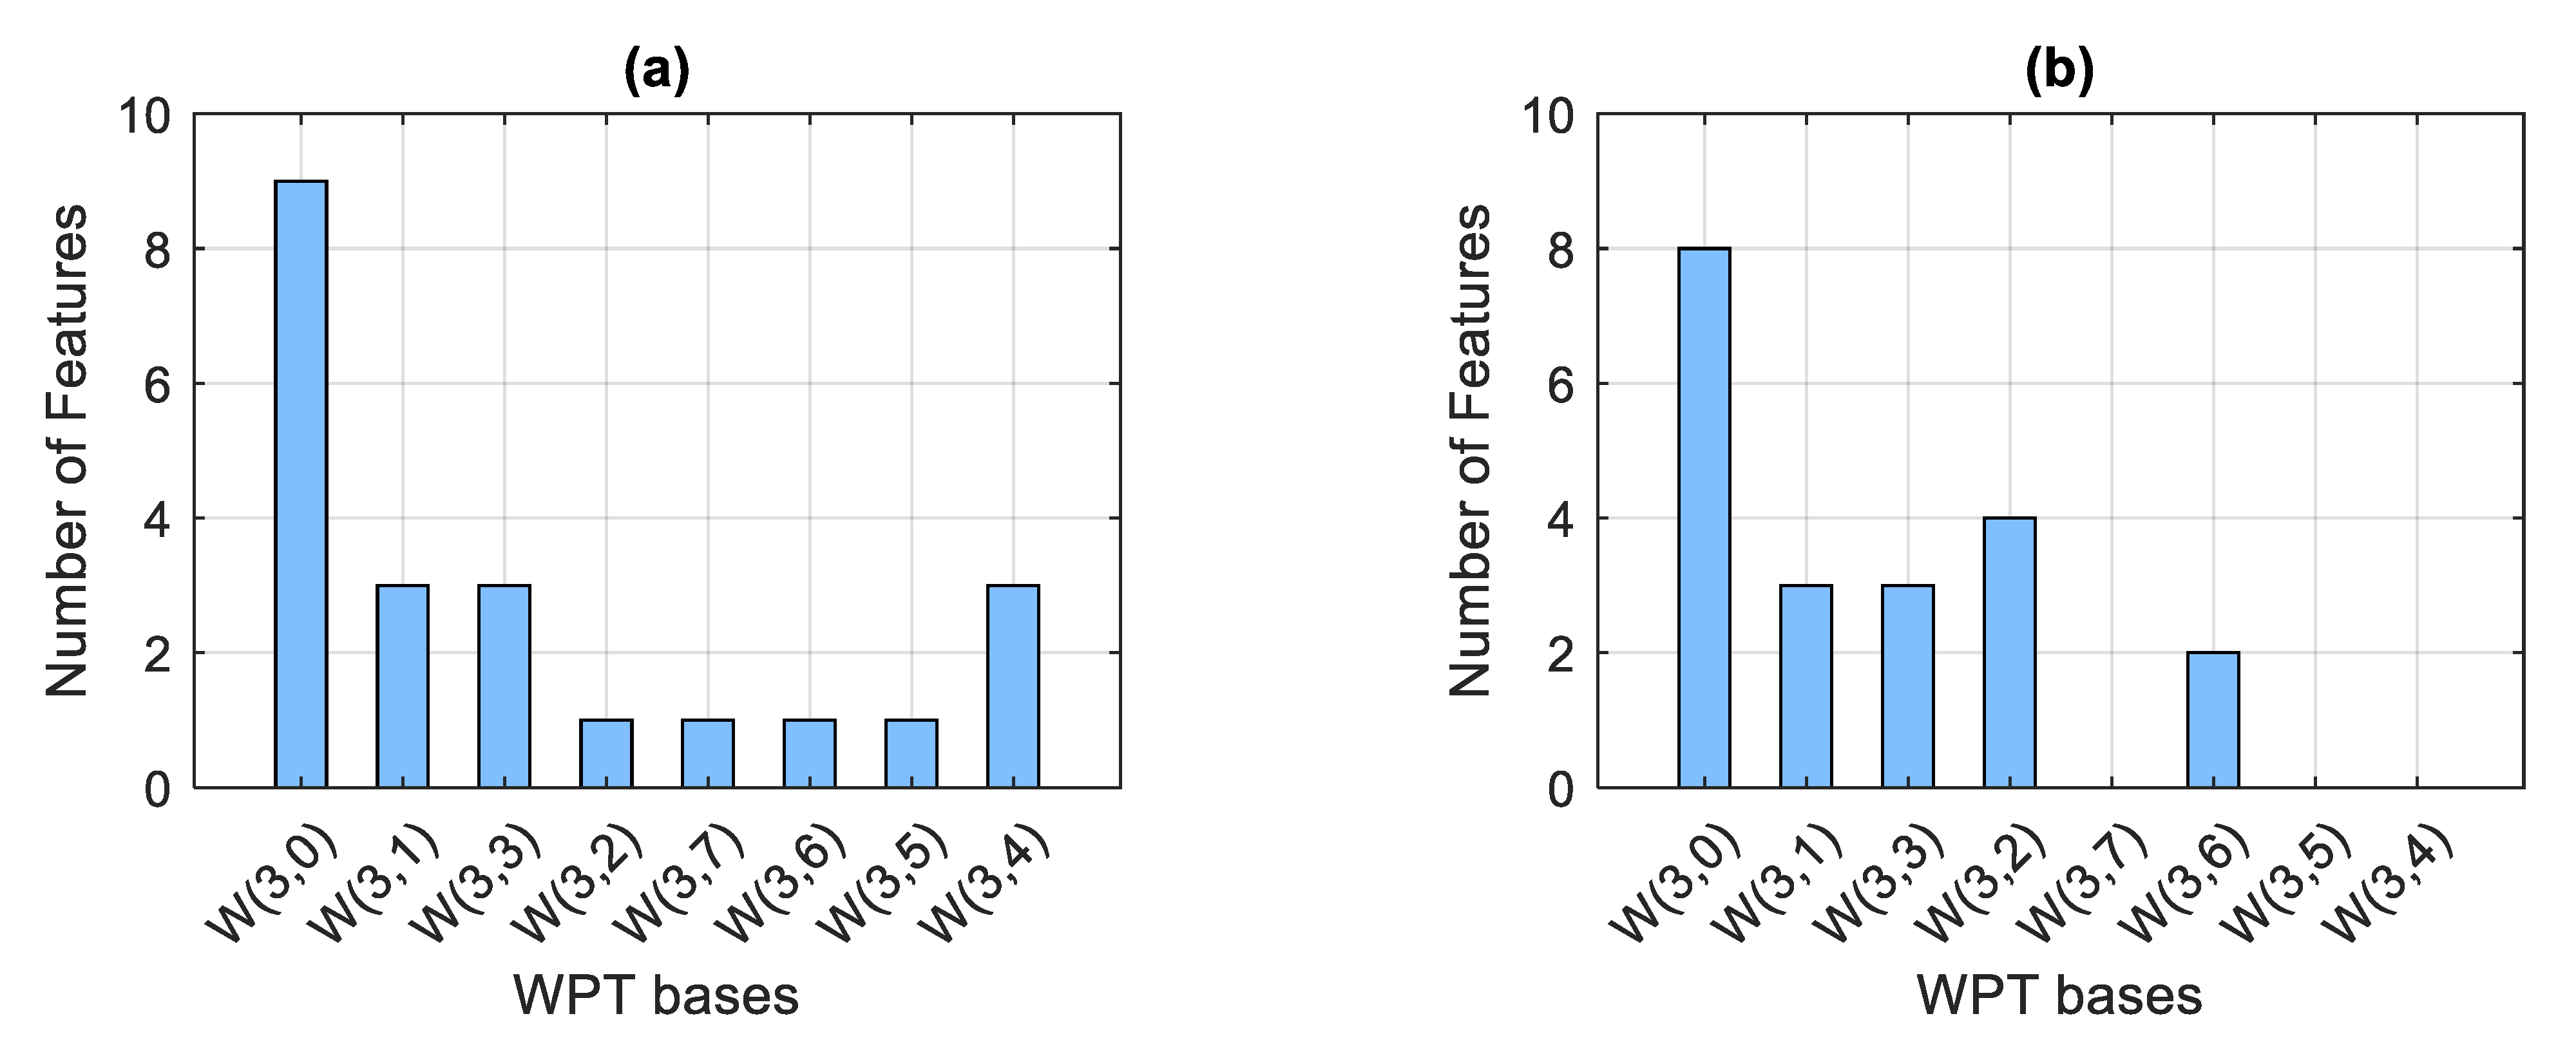
Figure 12.
Schematic explanation of the k-NN algorithm.
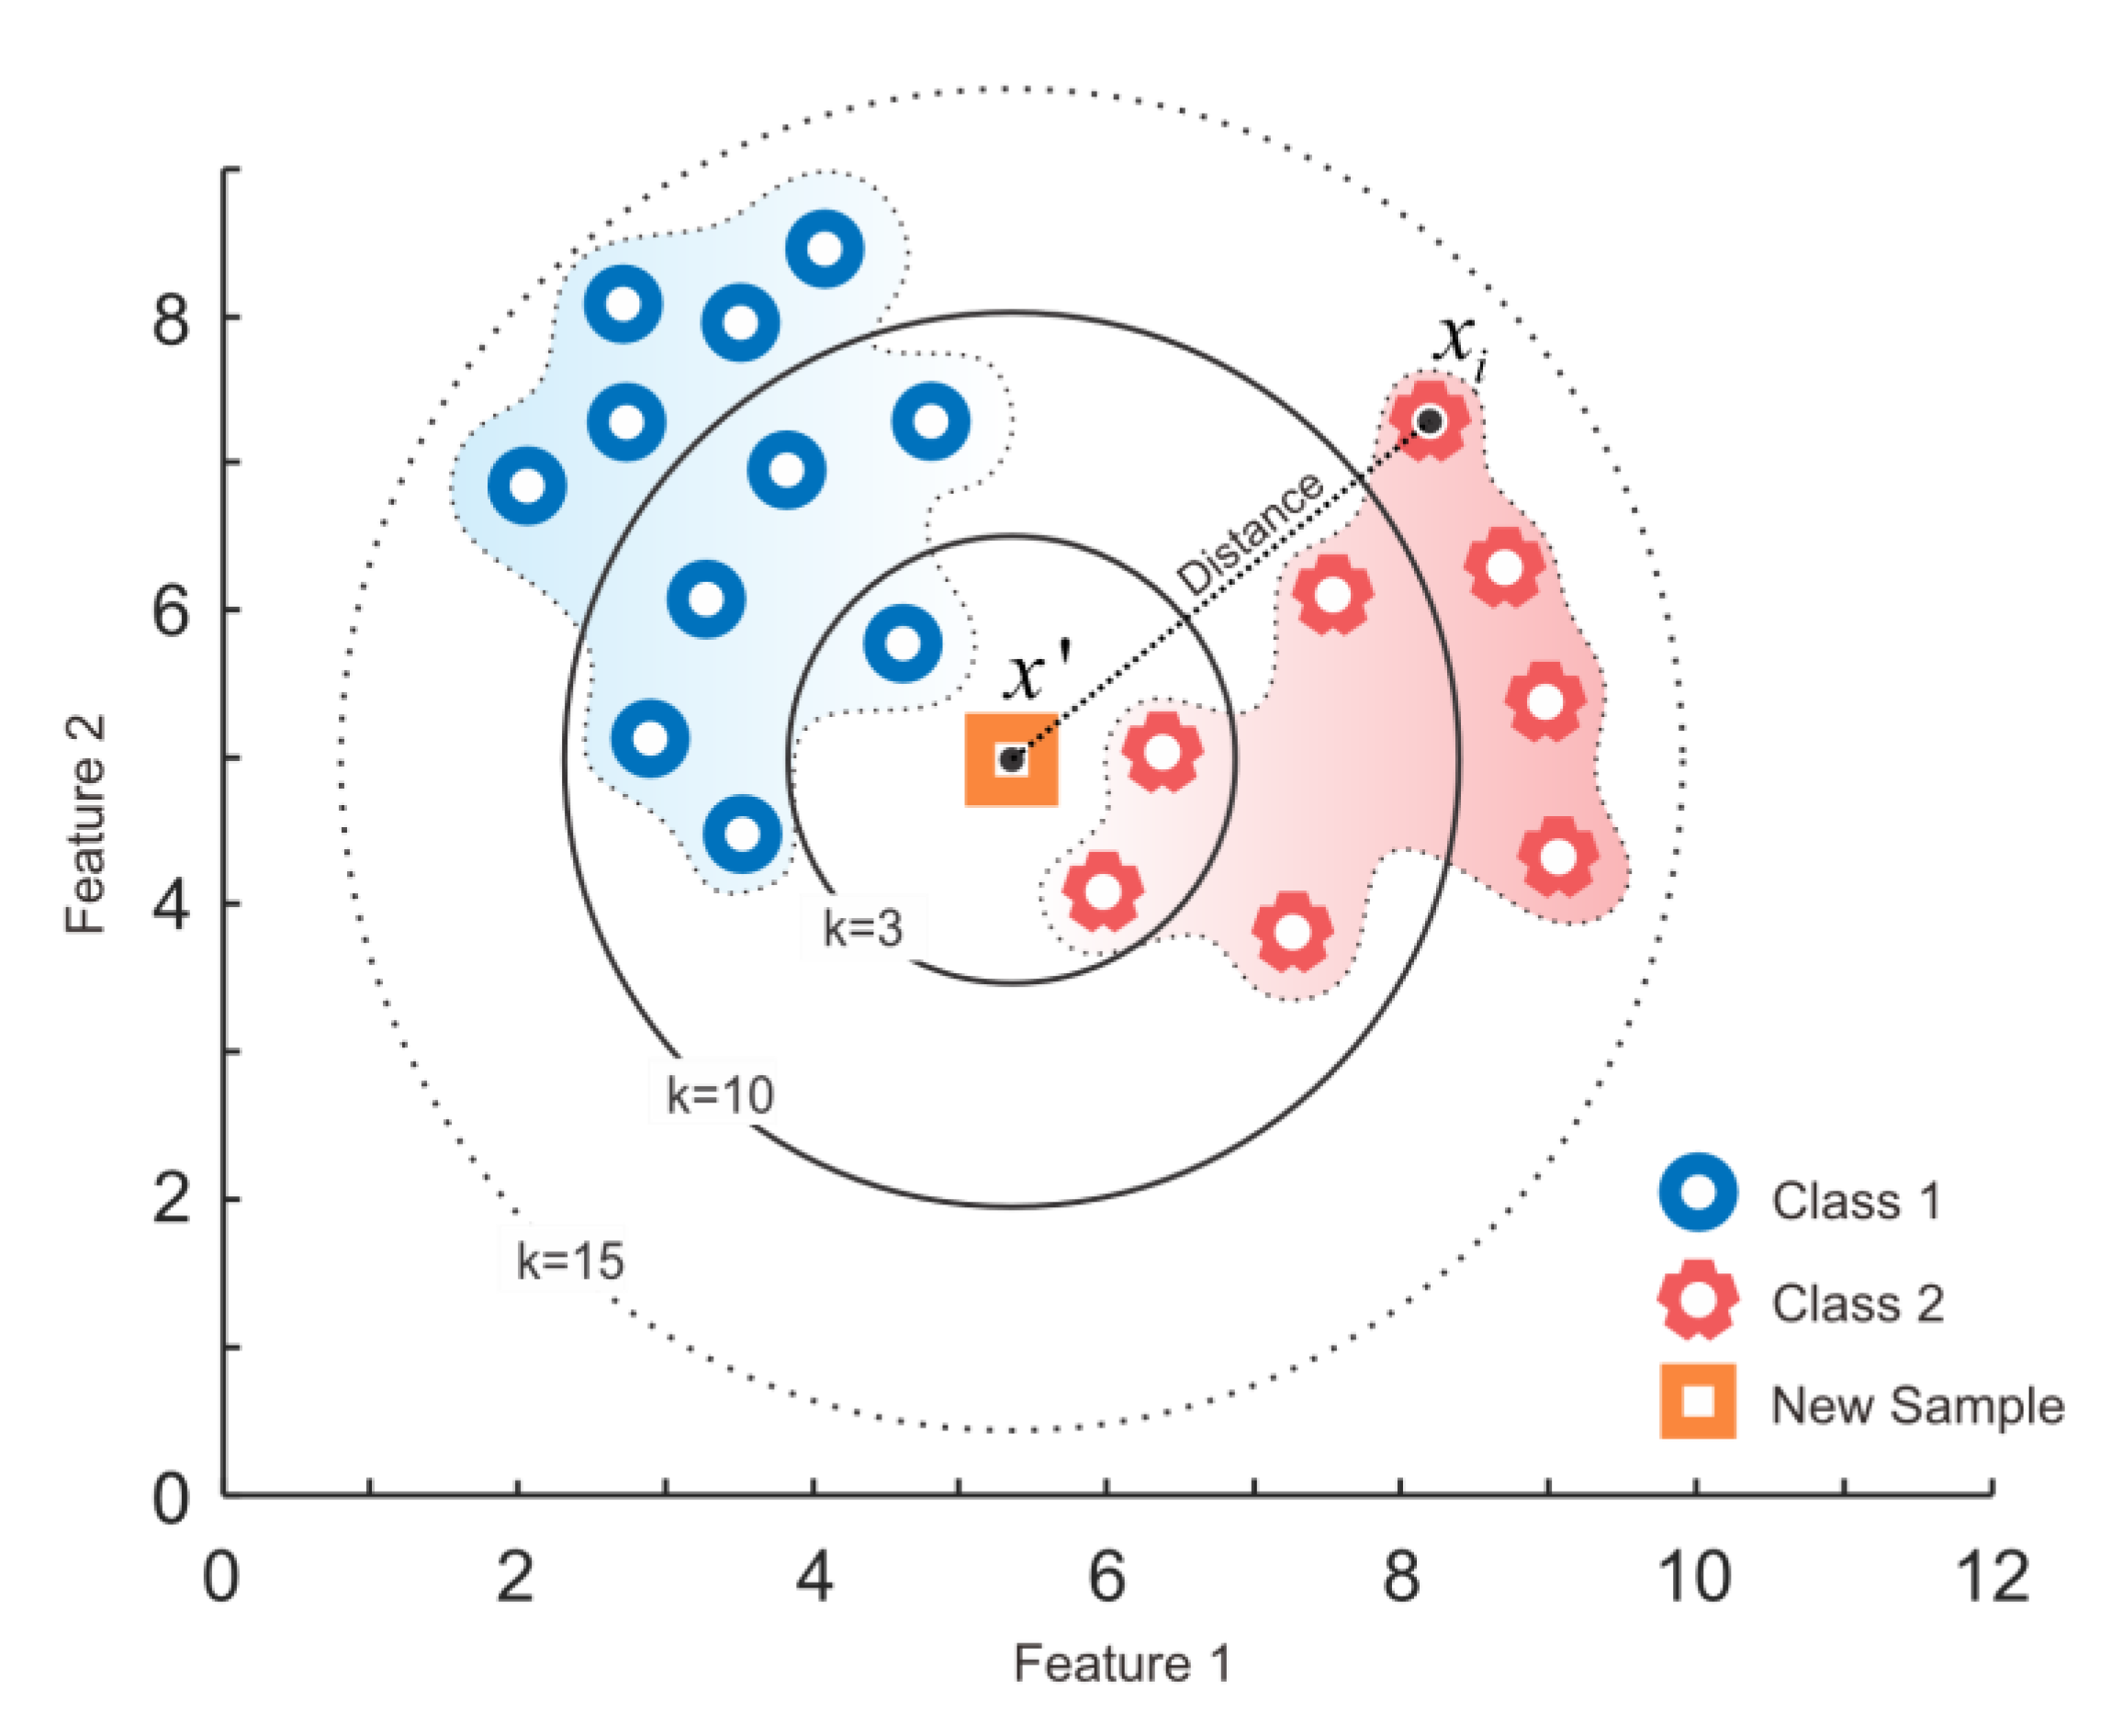
Figure 13.
Confusion matrix for fault classification: (a) PU dataset with artificial damages; (b) PU dataset with real damages; (c) CWRU dataset.
Figure 13.
Confusion matrix for fault classification: (a) PU dataset with artificial damages; (b) PU dataset with real damages; (c) CWRU dataset.


Table 1.
Test rig operating conditions.
| No. | Rotational Speed (rpm) | Load Torque (Nm) | Radial Force (N) |
|---|---|---|---|
| 0 | 1500 | 0.7 | 1000 |
| 1 | 900 | 0.7 | 1000 |
| 2 | 1500 | 0.1 | 1000 |
| 3 | 1500 | 0.7 | 400 |
Table 2.
Arrangement of the PU dataset with artificially induced faults.
| Bearing Type | Bearing Code | Class Label |
|---|---|---|
| Healthy | K001 | H |
| K002 | ||
| K003 | ||
| K004 | ||
| K005 | ||
| K006 | ||
| Outer Ring Damage | KA01 | OR |
| KA03 | ||
| KA05 | ||
| KA06 | ||
| KA07 | ||
| KA08 | ||
| KA09 | ||
| Inner Ring Damage | KI01 | IR |
| KI03 | ||
| KI05 | ||
| KI07 | ||
| KI08 |
Table 3.
Arrangement of the PU dataset with faults inflicted by accelerated lifetime tests.
| Bearing Type | Bearing Code | Class Label |
|---|---|---|
| Healthy | K001 | H |
| K002 | ||
| K003 | ||
| K004 | ||
| K005 | ||
| K006 | ||
| Outer Ring Damage | KA04 | OR |
| KA15 | ||
| KA16 | ||
| KA22 | ||
| KA30 | ||
| Inner Ring Damage | KI04 | IR |
| KI14 | ||
| KI16 | ||
| KI17 | ||
| KI18 | ||
| KI21 | ||
| Outer + Inner Ring Damage | KB23 | |
| KB24 | OR + IR | |
| KB27 |
Table 4.
Arrangement of the CWRU dataset.
| Bearing Type | Bearing Code | Class Label |
|---|---|---|
| Healthy | 97–100 | H |
| Outer Ring Damage | 130–133 | OR |
| 144–147 | ||
| 156–160 | ||
| 197–200 | ||
| 234–237 | ||
| 246–249 | ||
| 258–261 | ||
| Inner Ring Damage | 056–059 | IR |
| 105–108 | ||
| 169–172 | ||
| 209–212 | ||
| Ball Damage | 048–051 | B |
| 118–121 | ||
| 185–188 | ||
| 222–225 |
Table 5.
Formulas of statistical features extracted from the vibration signal.
| Statistical Feature | Formula | Statistical Feature | Formula |
|---|---|---|---|
| Peak value | Fifth normalized moment | ||
| Root-mean square | Sixth normalized moment | ||
| Kurtosis | Skewness | ||
| Crest factor | Shape factor RMS | ||
| Clearance factor | Peak-to-peak value | ||
| Impulse factor | Energy of signal | ||
| Shape factor SMR | Frequency center | ||
| Entropy | RMS frequency | ||
| Mean | Root variance frequency | ||
| Square mean root |
Table 6.
Performance metrics for each dataset.
| Dataset | Precision | Recall | F1-Score | FIA |
|---|---|---|---|---|
| PU Artificial faults | 99.39% | 99.39% | 99.39% | 99.39% |
| PU Real faults | 99.92% | 99.92% | 99.92% | 99.92% |
| CWRU | 98.77% | 98.77% | 98.77% | 98.77% |
Table 7.
Classification accuracy comparison with other methods. The classification accuracies from lowest to highest correspond to the color spectrum from green to red.
Table 7.
Classification accuracy comparison with other methods. The classification accuracies from lowest to highest correspond to the color spectrum from green to red.
| Number | Method | Accuracy (PU Real Fault Data) | Accuracy (PU Artificial Fault Data) | Accuracy (CWRU Data) |
|---|---|---|---|---|
| Proposed | 99.92% | 99.39% | 98.77% | |
| 1 | WPT Energy Feature + Random Forest [18] | 98.70% | 94.10% | 98.62% |
| 2 | WPT + k-NN [58] | 92.12% | 90.19% | 91.51% |
| 3 | WPT Energy Feature + Gaussian kernel SVM [30] | 89.96% | 90.76% | 88.87% |
| 4 | Best Energy WPT Node + Subspace k-NN | 93.07% | 91.58% | 94.71% |
| 5 | Proposed + Chi-Squared test | 99.35% | 98.35% | 99.02% |
| 6 | Attention Stream Network [59] | 99.37% | 99.28% | 99.60% |
Publisher’s Note: MDPI stays neutral with regard to jurisdictional claims in published maps and institutional affiliations. |
© 2022 by the authors. Licensee MDPI, Basel, Switzerland. This article is an open access article distributed under the terms and conditions of the Creative Commons Attribution (CC BY) license (https://creativecommons.org/licenses/by/4.0/).
Share and Cite
MDPI and ACS Style
Maliuk, A.S.; Ahmad, Z.; Kim, J.-M. Hybrid Feature Selection Framework for Bearing Fault Diagnosis Based on Wrapper-WPT. Machines 2022, 10, 1204. https://doi.org/10.3390/machines10121204
AMA Style
Maliuk AS, Ahmad Z, Kim J-M. Hybrid Feature Selection Framework for Bearing Fault Diagnosis Based on Wrapper-WPT. Machines. 2022; 10(12):1204. https://doi.org/10.3390/machines10121204
Chicago/Turabian StyleMaliuk, Andrei S., Zahoor Ahmad, and Jong-Myon Kim. 2022. "Hybrid Feature Selection Framework for Bearing Fault Diagnosis Based on Wrapper-WPT" Machines 10, no. 12: 1204. https://doi.org/10.3390/machines10121204
Note that from the first issue of 2016, this journal uses article numbers instead of page numbers. See further details here.