
A Unified Constitutive Model of Stress Relaxation of Ti-6Al-4V Alloy with Different Temperatures from Elastic to Plastic Loading

School of Mechanical Engineering & Automation, Beihang University, Beijing 100191, China
*
Author to whom correspondence should be addressed.
Machines 2022, 10(6), 437; https://doi.org/10.3390/machines10060437
Submission received: 17 May 2022
/
Revised: 28 May 2022
/
Accepted: 30 May 2022
/
Published: 1 June 2022
(This article belongs to the Section Material Processing Technology)
Abstract
:The effects of temperature and pre-strain levels on the stress relaxation behavior and corresponding microstructural evolutions of Ti-6Al-4V alloys have been investigated experimentally and numerically in this study. A series of tests (stress relaxation (SR) and repeated stress relaxation (RSR)) and microstructural observations (scanning electron microscope) have been performed, based on which the deformation-related variables, i.e., stress component and activation energy, as a function of the testing time are calculated according to the classical thermal activation theories. The experimental SR behavior and the obtained thermal related variables show that at lower temperatures (700 °C and 750 °C), a large number of dislocations introduced by plastic loading enhance dislocation slip/climb creep, giving rise to rapid relaxation compared with those with elastic loading conditions at the same temperature. At higher temperatures (800 °C and 850 °C), a similar SR phenomenon has been observed at both elastic and plastic loading conditions, which is due to the severe interaction between diffusion creep and dislocation creep after the loading stage. Based on these results, a unified constitutive equation has been proposed to successfully predict the behavior of the whole stress relaxation process composed of the loading stage and subsequent SR stage. The model considering the continuous evolution of internal variables, e.g., dislocation density and lamellar width, in two stages can predict the stress response and microstructure variation with different temperatures from elastic to plastic loading and provide a foundation to effectively optimize the hot forming process combining pre-deformation and stress relaxation.
1. Introduction
Components made of titanium alloys are very attractive in the aviation industry due to their extraordinary mechanical properties, including high strength, outstanding corrosion resistance [1]. Typical processes composed of high-temperature forming and subsequent stress relaxation have been proposed to form these titanium alloy components with high accuracy recently, such as hot stamping, hot gas forming and hot stretch bending [2,3,4]. These hot processes utilize the stress relaxation (SR) stage after the forming process to achieve low residual stress levels in the formed components, guaranteeing high performance and forming accuracy, even after subsequent machining. Previous studies have revealed that the alloys are generally loaded with a wide range of strain levels from purely elastic to plastic strains in the forming stage [5], and the initial stress or strain levels and resulting dislocation densities directly affect the evolution of subsequent SR behavior and microstructures.
The creep or stress relaxation behavior of titanium alloys with various microstructures have been investigated. A full lamellar structure has high creep resistance at high temperature, followed by bimodal and equiaxed structure [6,7,8,9]. Luo et al. [10] have reported that the relaxation rate of a Ti-6Al-4V alloy with an equiaxed structure in the plastic region increases with the decrease in grain size, and the threshold stress in stress relaxation, i.e., constant stress after relaxation reaches steady state, decreases due to the fine grain rotation mechanism. Jia et al. [11] have revealed that the relaxation behavior of lamellar titanium alloys after severe plastic compression deformation (>0.7) is accompanied by significant lamellar spheroidization. Wang et al. [12] have considered that the interaction between dislocation and α lamella caused by plastic loading in titanium alloys with a lamellar structure is the reason for the slow relaxation rate. In recent years, it has been found that the relaxation mechanism and behavior of various alloys in the elastic region are significantly different from those in the plastic region [13,14]. Zhang et al. [15] have found that a large number of dislocations introduced by plastic loading at 700~750 °C contribute to the rapid relaxation of stress in Ti-6Al-4V alloys with a lamellar structure, and the enhanced diffusion creep promoted by dislocations accumulated at the α/β interface at higher temperature leads to similar relaxation behavior in the elastic and plastic regions.
The thermally activated deformation parameters related to the stress relaxation mechanism under different temperatures and pre-strain levels can be obtained by repeated stress relaxation (RSR) with transient tests, such as stress component and activation energy [16,17]. The thermal activation parameters for different temperatures in the elastic and plastic regions can be introduced into the constitutive model to reveal the effects of temperature and pre-strain on the relaxation behavior.
Hence, in this paper, the loading behavior and subsequent SR response of Ti-6Al-4V alloy with different temperatures and pre-strain levels are investigated, and a unified constitutive model considering the continuous evolution of macro/micro internal variables in the whole stress relaxation process is proposed for the first time. Firstly, the SR behavior and thermally activated variables are studied and determined based on a set of relaxation experiments (SR and RSR) and related theories, which is helpful to understand the detailed deformation mechanism. This new constitutive model has been proposed to successfully predict SR behavior, providing a favorable tool to support the application of the hot forming process.
2. Experimental Method
2.1. Materials
The as-received material used in this study is a Ti-6Al-4V alloy profile with a fully lamellar structure provided by BaoTi Group of China. The billet was heated to 1050 °C for 1.5 h and air-cooled to 750 °C for 2 h of annealing treatment, as shown in Figure 1. During the cooling process, the gradually growing α phase and β phase form several colonies with specific Berger orientation relationship (BOR), i.e., and , in the single grain to allow the dislocation slip through the α/β interface [18]. A dog bone specimen with a gauge length of 35 mm is cut from the extrusion direction of the profile.
2.2. Experimental Process
In order to avoid significant changes in microstructure during deformation, the temperature used in the SR process is usually lower than β-transus temperature (995 °C) [19]. Therefore, 700 °C, 750 °C, 800 °C and 850 °C were selected to investigate the detailed effect of temperature on the relaxation behavior of the alloy. Firstly, uniaxial tensile tests, listed as test Group 1 in Table 1, under quasi-static loading conditions (10−3 s−1) were carried out at different temperatures to obtain the basic high temperature mechanical properties of Ti-6Al-4V and provide a design basis for subsequent SR and RSR experiments. The yield points (0.2% offset) were determined in the tensile curves at four temperatures.
A set of SR experiments are designed, as shown in Figure 2a, to investigate the evolution of SR related variables at different temperatures and pre-strain levels. The SR experiment is also loaded to the designed strain at a quasi-static rate (10−3 s−1) and then maintained at a constant position. Two strains, i.e., 0.3% and 0.5%, in the elastic region and two strains, i.e., 1.5% and 10%, in the plastic region were selected. The long-term stress relaxation time in the forming process is usually recommended to be 300~2400 s [19]. In order to obtain more general research results and models, the relaxation time of SR includes 0 s, 1200 s and 2400 s. The detailed experimental plan is listed in the Group 2 in Table 1.
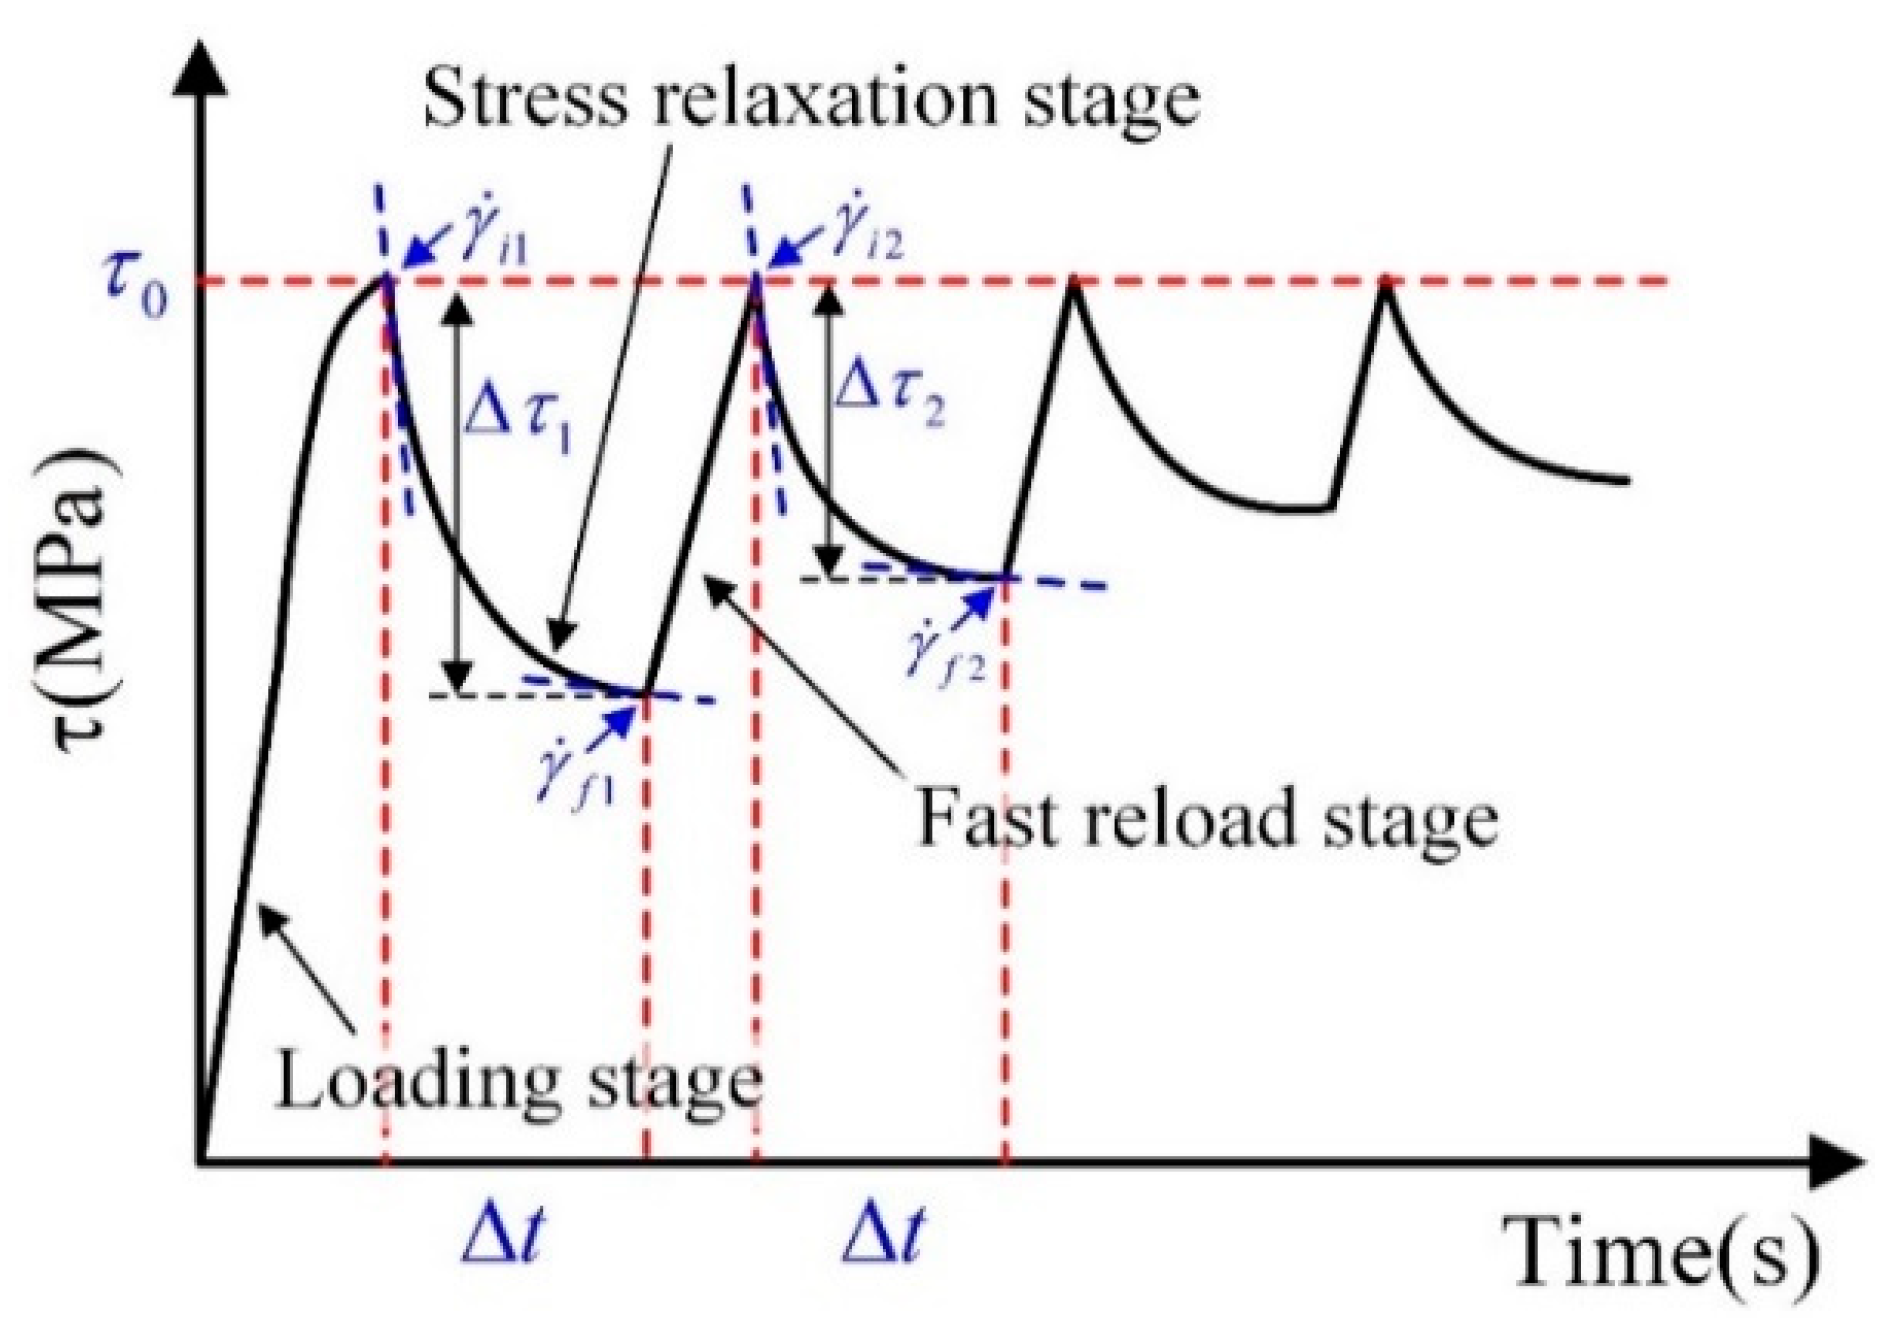
In order to determine the thermal activation variables for SR modeling, a set of RSR experiments at different temperatures and pre-strain levels were designed. The five strains in elastic region, including 0.3%, 0.4%, 0.5%, 0.7% and 0.9%, and three strains in plastic region, including 2%, 6% and 11%, were selected. The recommended time of repeated stress relaxation tests is usually 20~60 s [20]. The RSR tests consist of four SR and reloading cycles, with each single SR stage lasting 40 s. In each of these cycles, fast reloading is performed after each stress-relaxation stage, with a strain rate of about 10−3 s−1 to ensure a quasi-elastic state, as shown in Figure 2b. The detailed plan is shown in Group 3 in Table 1. The theories of obtaining thermally activated deformation related variables, e.g., stress components and activation energy, have been well developed and presented in Appendix A.
All experiments were performed on the DDL-100 mechanical testing machine. Three pairs of thermocouples are tied to the specimen coated with high-temperature antioxidants, i.e., upper, middle and lower positions, to measure the temperature. The specimen was heated to the target temperature in a furnace with an accuracy of ±3 °C, and the high-temperature ceramic extensometer Epsilon-3549-025M-050-ST was applied to measure the strain.
2.3. Microstructure Characterization
The microstructure was observed using a scanning electron microscope (SEM). The samples to be characterized were cut from the gauge section along the extrusion direction, mechanically ground, and electropolished in a mixed solution of 6% HClO4: 34%C4H9OH: 60%CH3OH (−25 °C and 20 V).
3. Experimental Results and Discussion
3.1. Loading Deformation and Long-Term Stress Relaxation Behavior
The elastic modulus and yield strength of the elastic and plastic regions that help to distinguish the loading deformation were calculated from the tensile tests, as shown in Table 2. Figure 3 shows the true stress–strain curve of Ti-6Al-4V at different temperatures. All curves began to fall slowly after reaching the stress peak, which is usually attributed to the competition between hardening caused by dislocation accumulation and softening caused by dislocation recovery [21]. Obviously, a higher temperature increases the ability of dislocation movement, which alleviates dislocation accumulation and reduces the flow stress contributed by dislocation hardening, resulting in the flow stress decreasing with the increase in deformation temperature. In addition, dislocation annihilation, dislocation slip transmission along the α/β interface and the destruction of the lamellar structure with the increase in deformation are considered to be the reasons for stress softening [1,22,23].
Figure 4 shows the normalized SR behavior at four temperatures with different initial loading levels from elastic to plastic regions. The normalized stress is defined as the ratio of the current stress to the load stress. It is obvious that all curves show logarithmic attenuation, which can be divided into two stages. During the first stage, the stress caused by loading begins to drop rapidly at the beginning of relaxation. In the second stage, the stress continues to decline slowly in the remaining time and gradually reaches equilibrium. At lower temperatures (700 °C and 750 °C), the higher the pre-strain level in the elastic region, the faster the relaxation rate and the smaller the threshold stress. At higher temperatures (800 °C and 850 °C), the relaxation rate of the curve and the threshold stress with different pre-strain levels is similar, which makes it difficult to distinguish the difference between elasticity and plasticity. For example, the threshold stresses of 700 °C/0.5% and 700 °C/10% are 31 and 25 MPa, respectively, and the threshold stresses of 800 °C/0.5% and 800 °C/10% are 5 and 7.6 MPa, respectively. Dislocation creep is dominant at lower temperatures, and the creep mechanism gradually changes to dislocation creep and diffusion creep at higher temperatures [15]. The loading in elastic and plastic regions causes different dislocation movements at lower temperatures, resulting in significantly different relaxation behavior. The enhanced diffusion creep may promote sufficient relaxation behavior in both elastic and plastic regions at higher temperatures. The higher the temperature, the more difficult it is to distinguish the difference in relaxation behavior.
3.2. Repeated Stress Relaxation Behavior
Figure 5 shows the four RSR behaviors at different temperatures and pre-strain levels. The normalized relaxed stress is defined as , i.e., the ratio of relaxation stress to pre-stress at a transient state. In general, a larger normalized relaxed stress appears with the increase in pre-strain level and temperature. In the elastic region, normalized relaxed stress decreases with the increase in the number of cycles, which is more obvious at a lower pre-strain level and temperature. For example, at 700 °C/0.3%, the relaxed stress decreased from 32.6% in the first cycle to 19.2% in the fourth cycle, with a variation range of 13.4%. The relaxed stress of 700 °C/0.4% decreased from 26.5% in the first cycle to 22.8% in the fourth cycle, with a variation range of 3.7%. This may be due to the dislocations accumulated due to creep deformation in the material in the previous relaxation cycle, which will increase the stress required for further deformation, resulting in the continuous reduction in stress at a lower temperature and pre-strain level. However, the relaxed stress in the plastic region is not only more significant with the increase in temperature and pre-strain, but also does not change significantly in several cycles. The normalized relaxed stress of 800 °C/6% is always maintained at about 67% during the four cycles. With the increase in temperature and pre-strain level, the combined effect of dislocation behavior introduced by severe deformation and diffusion behavior promoted by higher temperatures may lead to an increase in relaxed stress and non-attenuation in cycles.
Based on the thermally activated theories presented in Appendix A, the deformation related variables, e.g., stress components and activation energy, can be calculated according to the RSR curve results in Figure 5. The total applied stress is equal to the sum of the effective stress (), causing plastic deformation, and the internal stress (), hindering plastic deformation. The variation in calculated and of Ti-6Al-4V with the initial strain ratio, which is defined as the ratio of the pre-strain to the strain corresponding to the yield point, is shown in Figure 6. The elastic and plastic regions can be divided by initial strain ratio of 1. Obviously, the higher the initial strain ratio, the higher the temperature and the higher . According to the relationship between and , the decreases with the decrease in pre-strain and temperature. As described in Appendix A, the is the stress component associated with thermally activated deformation, which is directly related to the creep strain generated. Hence, the increase in the shown in Figure 6a is the origin of the high relaxation rate caused by plastic loading at lower temperatures and the relaxation rate similar to all regions at higher temperatures observed in Section 3.1.
The apparent activation energy strongly affected by temperature and stress conditions can be used to speculate the evolution trend of the creep mechanism in the SR process. Figure 7 shows the evolution behavior of the apparent activation energy calculated by the method in Appendix A. The constant in the elastic region and the rapid attenuation behavior of from the elastic region to plastic region can well capture the relaxation mechanism of Ti-6Al-4V alloy at different pre-strain levels, which is expected to provide a basis for the parameter calibration of the model.
3.3. Microstructural Evolution
The microstructural morphology of Ti-6Al-4V alloys under different deformation conditions are shown in Figure 8. The distortion of β phases in Figure 8b,e is caused by the loading of the plastic region at 700 °C and 800 °C, which is attributed to the uncoordinated deformation of the lamella during the loading stage [15]. At higher temperatures (800 °C), deformation gives rise to the complicated interaction of dislocation creep and diffusion creep in Figure 8c–f. With the increase in temperature, pre-strain level and relaxation time, β phase becomes gradually fragmented and granulated, resulting in an increase in the width of α phase in Figure 8d,f. Some deformation bands introduced by the plastic loading shear β phase, and diffusion creep in the loading stage and stress relaxation stage will make the V element in the β phase diffuse to the α phase, which promotes the formation of a more granular β phase [15].
4. Mechanisms-Based Constitutive Modeling
4.1. Constitutive Modelling
The unified constitutive model developed in this study connects the macro mechanical behavior with the corresponding microstructure evolution through the rate-related internal micro variables and thermal activation energy. The stress in the loading stage is determined by the internal stress, dislocation and Hall–Petch effect. The relaxation behavior of the alloy in the SR stage is affected by the apparent activation energy and the dislocation caused by loading. The construction, evaluation and evolution of these variable models will be introduced and discussed.
4.1.1. Stress–Strain Model in Loading Stage
According to Hooke’s law, the deformation flow stress of the material in the loading stage can be expressed as [24]:
where is the temperature dependent Young’s modulus, and are the total strain and plastic strain caused by deformation, respectively.
The internal stress in the loading stage reflects the strain hardening caused by dislocation interaction [25]. Due to the specific BOR relationship between the lamellae, the colony usually behaves like a grain [26]. The internal stress is described as:
where is the hardening stress (dislocation strengthening and Hall–Petch strengthening), represents initial yield stress. is the temperature related constant, is the normalized dislocation density, and is the width of lamellar. is the Hall–Petch coefficient, which is related to microstructure, such as dislocation accumulation, stress concentration and lamellar. The flow softening of two-phase titanium alloys with a lamellar structure during high temperature tensile deformation is determined by Hall–Petch strengthening loss caused by lamellar deflection [27,28]. can be expressed as:
where is the Berger vector (). The temperature related shear modulus is calculated as [28]:
The variable considering the transformation of slip transmission mode caused by lamellar deflection is given by:
where is temperature dependent constant, is the coefficient dependent on deformation rate. Due to the BOR relationship of α/β, the local stress concentration caused by high dislocation density at the interface after loading to plasticity makes the thin β layer deflect gradually to the “soft” direction to adapt to the strain compatibility [29]. is a normalized internal variable describing the transition from hard slip mode to soft slip mode, representing the deflection behavior of lamellae with different orientation angles. The rate of the internal variable can be expressed as:
where and are temperature dependent constants.
Dislocation interaction shows a strong dependence on strain rate and temperature for high temperature deformation. The Sellars–Tegart–Garofalo (STG) hyperbolic sinusoidal model can be used to describe the stress relationship [30]:
where , , and are temperature dependent constants. The plastic strain rate can be derived from Equations:
4.1.2. Creep Strain Model in Stress Relaxation Stage
The overall strain remains constant during the SR stage, and part of the overall strain converts to creep strain [19]. The relaxation stress rate can be determined by the creep strain rate :
where and are the total strain and elastic strain caused by deformation stress, respectively.
The relaxation degree is affected by the temperature. At lower temperature (700 °C and 750 °C), dislocation entanglement in α phase and at α/β interface is easier to observe with the increase in pre-strain. The inconspicuous dislocation recovery is not conducive to the growth of relaxation rate, resulting in the retention of a high level of threshold stress. As the temperature rises to 800~850 °C, the combined effect of diffusion creep and dislocation creep caused by loading in elastic and plastic regions increases the relaxation rate and reduces the threshold stress. Hyperbolic sine function is widely used to describe the evolution of creep strain rate [31]. In conclusion, microstructure, dislocation density and threshold stress determine the pre-strain dependent SR behavior. In order to describe the SR behavior of Ti-6Al-4V alloys, the dislocation density and threshold stress need to be considered in the model:
where and are temperature related constants, is the temperature related constant exponential coefficient controlling the averaged dislocation density , and is the temperature related threshold stress. is the effective stress acting on dislocation activity. The creep strain tends to 0 rapidly with the decline in applied stress.
The apparent activation energy is the important variable required for the creep strain rate modeling as a function of temperature in the SR stage. Li et al. [32] have found that the in the elastic region remains almost constant during the RSR experiments of AA7B04 aluminum alloy. The activation energy in elastic region is described as follows:
where is the melting temperature of the titanium alloy (1387 °C), is the material constant and is the reference activation energy. With the increase in the strain level in the plastic region, the began to decrease rapidly. The in plastic region tends to be stable, and the evolution of can be expressed as [33]:
where is the material constant.
4.1.3. Continuous Microstructures in Multi-Stages
The two key microstructures affecting the loading and subsequent SR behavior are dislocations and β phase, according to the results shown in Section 3, whose evolutions are modelled in this section.
The dislocation activity closely related to the strain level in the loading stage also plays a key role in the subsequent stress relaxation stage. The evolution of dislocation density is mainly composed of two parts: one is the accumulated in the loading stage, and the other is the in the SR stage. The total dislocation density can be described as:
The concept of normalized dislocation density is used [34]:
where is the current dislocation density and is the maximum saturated dislocation density in the whole stress relaxation process. varies from 0 to 1 throughout the deformation process.
The plastic deformation of metals is strongly affected by dislocations as a defect in the crystal structure. According to previous studies, the evolution of the dislocation density rate with loading strain depends on two competing processes: dislocation accumulation and dislocation recovery, which can be written as [35]:
where , , and are temperature related constants characterizing dislocation generation and dislocation recovery in the loading stage. The competition between dislocation accumulation and dislocation static/dynamic recovery is gradually balanced.
The dislocation density rate in the SR stage is also determined by two factors, including the rapid dislocation propagation caused by creep deformation and static recovery during long-time relaxation [36]. Here, Equation can be rewritten as
where , and are the temperature related constants characterizing dislocation propagation and dislocation recovery in the SR stage, and , is the constant and creep strain rate, respectively.
The dislocation accumulation introduced by deformation at the interface hinders the slip of adjacent dislocations, which is helpful to the emergence of deformation bands. β phase dissolution and deformation shear caused by high temperature diffusion contribute to the width increase in α phase. Lamellar width is an important part of Hall–Petch strengthening, which significantly affects the flow stress of materials in the loading stage. Therefore, this effect needs to be coupled into the constitutive model. The evolution of lamellar is mainly composed of two parts [24]. simulates the evolution of lamellar caused by loading, and represents the evolution caused by SR. The normalized total width can be described by the equation:
The width of α lamellar is normalized similar to the dislocation density
where is the current α lamellar width and is the initial α lamellar width (8.05 × 10⁻⁴ mm). The evolution rate of lamellar width in the loading stage can be expressed as:
The first term is the static evolution of lamellar width caused by bulk diffusion, and the second term is the dynamic width evolution caused by deformation. and are coefficients related to volume diffusion and interface energy. , and are deformation coefficients. and are the temperature related constants.
Since the microstructure evolution results caused by the loading stage are transmitted to the SR stage, the previous strain level needs to be considered in the lamellar evolution. Equation is rewritten as:
where is the strain level introduced by loading, , , , and are material constants. and are the temperature related constants.
4.2. Model Calibration and Results
The commonly used particle swarm optimization (PSO) algorithm is used to calibrate the model parameters in the established constitutive model. The objective function is as follows:
where x is all the material parameters of the model, and are the number of curves to be fitted and the number of experimental data on the th curve, respectively; and are the th experimental data point of the th curve. and represent experimental data, respectively. These model parameters are determined by minimizing the value of the objective function by PSO.
In order to simulate the stress and microstructure evolution in the two stages, the model in Figure 9 is divided into two related sub-modules, namely loading module and SR module. The values of stress, i.e., strain level, dislocation density and lamellar width, experienced in the loading history will be transferred into the SR module as the initial state in the SR stage. Subsequently, these parameters will further evolve in the SR stage and contribute to the relaxation behavior.
Based on the above method, the parameters in the constitutive model are determined by the following two steps. Firstly, the tensile stress curves in Figure 3 are calibrated by the loading modules. Secondly, the activation energy is calibrated using the curve in Figure 7, and the relaxation curves (700 °C, 800 °C and 850 °C) in Figure 4 are calibrated by the stress relaxation module. Finally, the relaxation curve (750 °C) in Figure 4 is used to verify the constructed model. All temperature related parameters can be calculated by , where is constant, is activation energy, R is constant (J/mol) and T is temperature. The calibrated material parameters in the model are shown in Table 3 and Table 4.
4.3. Verification and Discussion
4.3.1. Verification of Stress Relaxation Behavior
Figure 3 compares the flow stress curves calculated by the development model with the experimental data. It can be found that the flow stress predicted at 850 °C is slightly lower, which may be that a small amount of α phase transformation behavior is not considered. The dislocation recovery softening and the Hall–Petch strengthening loss caused by lamellar deflection and dislocation slip transmission can be predicted by the established loading module, which proves the effectiveness of the model.
Figure 10 shows the calculated and experimental relaxation curves with different pre-strains and temperatures, where 700 °C, 800 °C and 850 °C are the fitting data and 750 °C is the verification data. The relaxation curves obtained by substituting the internal variables predicted in the loading module, including dislocation density and lamellar, into the SR module are in good coincidence with the experimental results. The prediction accuracy of the proposed model is evaluated by the average absolute relative error (ARRE) , where represents experimental result, represents the predicted result, represents the total number of data points. Figure 11 shows the correlation between experimental and predicted stress at 750 °C, and average ARRE is 8.07%. The intersection of curves in elastic and plastic regions at lower temperatures (700 °C and 750 °C) and the overlap of curves in elastic and plastic regions at higher temperatures (800 °C and 850 °C) were successfully captured by the developed SR module. However, there is an error in the prediction accuracy of the relaxation curve at 850 °C in the beginning of SR stage, which may be attributed to the small deviation in the estimation of the considering the creep mechanism. The characterization method of activation energy will be further improved in the SR module in the future for the prediction accuracy of the model.
In addition, the dislocation density results predicted by the developed model in the whole stress relaxation process are compared with the measured results of EBSD [15]. As shown in Figure 12, the predicted results are in good agreement with the experimental results, which indicates that the modeling method of using internal variables is helpful to understand and predict the evolution of dislocation density in the whole stress relaxation process.
4.3.2. Internal Variable Evolution under Different Thermomechanical Conditions
Figure 13 shows the dislocation density evolution during the whole stress relaxation process predicted by the model. At lower temperatures (700 °C and 750 °C), the lower strain level in the elastic region causes the weaker dislocation propagation, which increases the time for the dislocation density to reach equilibrium. However, after plastic loading, a large number of dislocations propagated and entangled in the α phase promote the dislocation recovery. These different dislocation movement phenomena led to obvious differences in the relaxation rate and threshold stress between the elastic and plastic regions. At higher temperatures (800 °C and 850 °C), more significant high-temperature dislocation recovery led to the faster saturation of dislocation density with all pre-strain levels. The β layer damaged by plastic deformation was gradually granulated and broken with the progress of SR process. Zheng et al. [37] revealed that the disappearance of the α/β interface facilitates a longer dislocation activity distance, which may be the reason for dislocation recovery and the gradual reduction in dislocation density. The combined effect of bulk diffusion and dislocation activity leads to similar relaxation rate and threshold stress at a higher temperature. As mentioned in Section 3.1, the change in creep mechanisms, such as the transformation from the dislocation creep dominant mechanism at a low temperature to the diffusion creep dominant mechanism at a high temperature, is considered to be the main reason for the difference in SR behavior with different temperatures [5,10,15].
Figure 14 shows the predicted normalized α lamellar width evolution during the whole stress relaxation process. At lower temperatures (700 °C and 750 °C), the lamellar structure remains intact after loading in the elastic region, while a large number of dislocations and deformation bands introduced by plastic deformation promote the deflection and shear of β phase, resulting in damaged to the β layer [15]. In the subsequent SR stage, the evolution of the fragmented β layer by thermomechanical driven led to the expansion of the spacing of the α phase. The local fragmentation and granulation of the β phase at 800 °C and 850 °C were more likely caused by the combined action of dislocation and serious diffusion activities. The concentrated stress accumulated at the interface increased the potential energy required for element diffusion and contributed to the further deterioration of the β phase structure [38]. Therefore, lamellar width changes more obviously in two stages for 800 °C and 850 °C compared with 700 °C and 750 °C.
5. Conclusions
In this study, the deformation behavior and microstructure evolution mechanism in the whole stress relaxation (loading and relaxation stages) has been revealed through specially designed stress relaxation (SR) and repeated stress relaxation (RSR) experiments and microstructure observations. A mechanism-based model considering the continuous evolution of internal variables has been proposed to characterize the SR behavior with different temperatures and strains. The following conclusions can be drawn:
- (1)
- The difference in SR behavior between the elastic and plastic regions is attributed to the transformation of the creep mechanism at an elevated temperature. At lower temperatures (700 °C and 750 °C), the dislocation creep caused by the gradually obvious dislocation activity from the elastic region to plastic region leads to a rapid increase in effective stress (), which promotes different SR behavior. At a higher temperature (800 °C and 850 °C), the complicated interaction between diffusion creep and dislocation creep does not change the significantly, resulting in similar relaxation behavior after different loading.
- (2)
- Considering the underlying deformation mechanism and continuous evolution of the microstructure in the two stages of stress relaxation, a set of unified constitutive models are proposed. The microstructure models, incorporating dislocation recovery, lamellar growth and Hall–Petch strengthening loss, are integrated into the loading module. Based on the thermal activation theory, the microstructure related parameters, i.e., dislocation density and lamellar, and the deformation related parameters, i.e., apparent activation energy and threshold stress, are coupled to the SR module. These crucial internal variables, i.e., dislocation density and lamellar width, are used as the transmission media between the loading stage and the relaxation stage.
- (3)
- The temperature, pre-strain and time-dependent relaxation behaviors of Ti-6Al-4V alloys, including loading and subsequent SR stages, are successfully predicted under a wide range of temperatures (700~850 °C) and pre-strains (0.3~10%). The model eliminates the limitations of the traditional model in the prediction of the continuous evolution of parameters in multi-stages and can provide a basis for the effective prediction of springback in the hot forming process.
Author Contributions
Conceptualization, D.L. and Y.L.; Formal analysis, Y.Z. and Y.L.; Methodology, Y.Z. and Y.L.; Resources, D.L. and X.L.; Writing—original draft, Y.Z.; Writing—review and editing, Y.L.; Literature search, X.L. All authors have read and agreed to the published version of the manuscript.
Funding
The financial support from the National Natural Science Foundation of China (No. 51975032 and No. 51775023) and Commercial Aircraft Corporation of China (COMAC-SFGS-2020-3227).
Institutional Review Board Statement
Not applicable.
Informed Consent Statement
Not applicable.
Data Availability Statement
The raw/processed data required to reproduce these findings cannot be shared at this time as the data also forms part of an ongoing study.
Acknowledgments
The authors special thanks to Liu Xiaochun, Changsha University of Science & Technology, for his support in microstructure characterization.
Conflicts of Interest
The authors declare no conflict of interest.
Appendix A. Thermally Activated Theoretical Background
Martin et al. [39] have proposed a repeated stress relaxation (RSR) test to provide an insight in the thermally activated processes taking place during high temperature deformation. The shear stress () applied during stress relaxation can be expressed as effective stress component and internal stress component :
where represents the long-range internal stress hindering plastic deformation, which is related to the plastic shear strain . is the effective shear stress leading to plastic deformation, which explains the need to overcome the short-range obstacles related to absolute temperature and plastic shear strain rate .
It is generally believed that , which remains unchanged during a single transient relaxation, can be extracted from the single relaxation curve using the following equation [17]:
where is a constant. can be obtained by subtracting from the flow stress.
The physical activation volume of a material widely used to characterize the properties of stress sensitivity can be obtained by RSR tests. According to the definition of :
where represents the strain rate at the end of the first relaxation cycle, represents the strain rate at the beginning of the first relaxation cycle, and is the total stress drop in the first relaxation cycle. As shown in Figure A1, of the material can be determined by RSR tests. Considering that the SR curve is obtained under uniaxial tension, the relationship between stress and strain rate can be transformed using , , , based on Mises criterion [40].
Figure A1.
Schematic showing the repeated stress relaxation (RSR) test process.
The components of and representing creep deformation and representing the influence of dislocation velocity can be obtained according to RSR curve. These data can be used to characterize and analyze the deformation behavior and mechanism of materials during SR. The creep strain rate of titanium alloy can be modeled using the following equation [32]:
where is the material constant, mainly represents the creep strain caused by overcoming long-range resistance, represents the thermal activation effect to overcome the short-range barrier, and R is the gas constant. is the apparent activation energy of materials, which is strongly affected by temperature and stress conditions. is the Gibbs activation free energy required to overcome the short-range obstacle at 0 K, which can be fitted and calculated by equation , where represents the constant at 0 K [41]. Based on the and calculated by Equations (A2) and (A3) and fitted by RSR curves, the value of can be derived, which can be used to predict the creep deformation of materials as a function of stress and temperature conditions.
References
- Gao, P.; Fu, M.; Zhan, M.; Lei, Z.; Li, Y. Deformation behavior and microstructure evolution of titanium alloys with lamellar microstructure in hot working process: A review. J. Mater. Sci. Technol. 2020, 39, 56–73. [Google Scholar] [CrossRef]
- Wang, K.; Kopec, M.; Chang, S.; Qu, B.; Liu, J.; Politis, D.J.; Wang, L.; Liu, G. Enhanced formability and forming efficiency for two-phase titanium alloys by Fast light Alloys Stamping Technology (FAST). Mater. Des. 2020, 194, 108948. [Google Scholar] [CrossRef]
- Guo, G.; Li, D.; Li, X.; Deng, T.; Wang, S. Finite element simulation and process optimization for hot stretch bending of Ti-6Al-4V thin-walled extrusion. Int. J. Adv. Manuf. Technol. 2017, 92, 1707–1719. [Google Scholar] [CrossRef]
- Chen, Y.; Li, S.; Li, Y.; Wang, Y.; Li, Z.; Lin, Z. Constitutive modeling of TA15 alloy sheet coupling phase transformation in non-isothermal hot stamping process. J. Mater. Res. Technol. 2021, 12, 629–642. [Google Scholar] [CrossRef]
- Zong, Y.; Liu, P.; Guo, B.; Shan, D. Investigation on high temperature short-term creep and stress relaxation of titanium alloy. Mater. Sci. Eng. A 2015, 620, 172–180. [Google Scholar] [CrossRef]
- Zheng, Z.; Xiao, S.; Wang, X.; Guo, Y.; Yang, J.; Xu, L.; Chen, Y. High temperature creep behavior of an as-cast near-α Ti–6Al–4Sn–4Zr-0.8Mo–1Nb–1W-0.25Si alloy. Mater. Sci. Eng. A 2021, 803, 140487. [Google Scholar] [CrossRef]
- Peng, H.; Hou, Z.; Chen, X.; Li, T.; Luo, J.; Li, X. Effect of temperature and cyclic loading on stress relaxation behavior of Ti–6Al–4V titanium alloy. Mater. Sci. Eng. A 2021, 824, 141789. [Google Scholar] [CrossRef]
- Pan, S.; Liu, H.; Chen, Y.; Chi, G.; Yi, D. Lamellar α fencing effect for improving stress relaxation resistance in Ti-55511 alloy. Mater. Sci. Eng. A 2021, 808, 140945. [Google Scholar] [CrossRef]
- Nie, X.; Liu, H.; Zhou, X.; Yi, D.; Huang, B.; Hu, Z.; Xu, Y.; Yang, Q.; Wang, D.; Gao, Q. Creep of Ti–5Al–5Mo–5V–1Fe–1Cr alloy with equiaxed and lamellar microstructures. Mater. Sci. Eng. A 2016, 651, 37–44. [Google Scholar] [CrossRef]
- Luo, J.; Xiong, W.; Li, X.; Chen, J. Investigation on high-temperature stress relaxation behavior of Ti-6Al-4V sheet. Mater. Sci. Eng. A 2019, 743, 755–763. [Google Scholar] [CrossRef]
- Jia, C.L.; Kou, H.C.; Chen, N.N.; Liu, S.B.; Fan, J.K.; Tang, B.; Li, J.S. Stress relaxation induced spheroidization of the lamellar α phase in Ti-7333 alloy. J. Alloys Compd. 2019, 781, 674–679. [Google Scholar] [CrossRef]
- Wang, Z.; Stoica, A.D.; Ma, D.; Beese, A.M. Stress relaxation behavior and mechanisms in Ti-6Al-4V determined via in situ neutron diffraction: Application to additive manufacturing. Mater. Sci. Eng. A 2017, 707, 585–592. [Google Scholar] [CrossRef]
- Rong, Q.; Li, Y.; Shi, Z.; Meng, L.; Sun, X.; Sun, X.; Lin, J. Experimental investigations of stress-relaxation ageing behaviour of AA6082. Mater. Sci. Eng. A 2019, 750, 108–116. [Google Scholar] [CrossRef]
- Lyu, F.; Li, Y.; Shi, Z.; Huang, X.; Zeng, Y.; Lin, J. Stress and temperature dependence of stress relaxation ageing behaviour of an Al–Zn–Mg alloy. Mater. Sci. Eng. A 2020, 773, 138859. [Google Scholar] [CrossRef]
- Zhang, Y.; Li, D.; Li, X.; Liu, X.; Zhao, S.; Li, Y. Creep deformation and strength evolution mechanisms of a Ti-6Al-4V alloy during stress relaxation at elevated temperatures from elastic to plastic loading. J. Mater. Sci. Technol. 2022, 126, 93–105. [Google Scholar] [CrossRef]
- Varma, A.; Krishnaswamy, H.; Jain, J.; Lee, M.-G.; Barlat, F. Advanced constitutive model for repeated stress relaxation accounting for transient mobile dislocation density and internal stress. Mech. Mater. 2019, 133, 138–153. [Google Scholar] [CrossRef]
- Mishra, S.; Beura, V.K.; Singh, A.; Yadava, M.; Nayan, N. Effect of Temper Condition on Stress Relaxation Behavior of an Aluminum Copper Lithium Alloy. Metall. Mater. Trans. A 2018, 49, 2631–2643. [Google Scholar] [CrossRef]
- Chong, Y.; Bhattacharjee, T.; Yi, J.; Zhao, S.; Tsuji, N. Achieving bi-lamellar microstructure with both high tensile strength and large ductility in Ti–6Al–4V alloy by novel thermomechanical processing. Materialia 2019, 8, 100479. [Google Scholar] [CrossRef]
- Cui, X.; Wu, X.; Wan, M.; Ma, B.; Zhang, Y. A novel constitutive model for stress relaxation of Ti-6Al-4V alloy sheet. Int. J. Mech. Sci. 2019, 161–162, 105034. [Google Scholar] [CrossRef]
- Lu, L.; Zhu, T.; Shen, Y.; Dao, M.; Lu, K.; Suresh, S. Stress relaxation and the structure size-dependence of plastic deformation in nanotwinned copper. Acta Mater. 2009, 57, 5165–5173. [Google Scholar] [CrossRef]
- Yasmeen, T.; Zhao, B.; Zheng, J.-H.; Tian, F.; Lin, J.; Jiang, J. The study of flow behavior and governing mechanisms of a titanium alloy during superplastic forming. Mater. Sci. Eng. A 2020, 788, 139482. [Google Scholar] [CrossRef]
- Zherebtsov, S.; Murzinova, M.; Salishchev, G.; Semiatin, S.L. Spheroidization of the lamellar microstructure in Ti–6Al–4V alloy during warm deformation and annealing. Acta Mater. 2011, 59, 4138–4150. [Google Scholar] [CrossRef]
- Jha, J.S.; Toppo, S.P.; Singh, R.; Tewari, A.; Mishra, S.K. Flow stress constitutive relationship between lamellar and equiaxed microstructure during hot deformation of Ti-6Al-4V. J. Mater. Process. Technol. 2019, 270, 216–227. [Google Scholar] [CrossRef]
- Xiao, W.; Wang, B.; Wu, Y.; Yang, X. Constitutive modeling of flow behavior and microstructure evolution of AA7075 in hot tensile deformation. Mater. Sci. Eng. A 2018, 712, 704–713. [Google Scholar] [CrossRef]
- Yang, L.; Wang, B.; Liu, G.; Zhao, H.; Xiao, W. Behavior and modeling of flow softening and ductile damage evolution in hot forming of TA15 alloy sheets. Mater. Des. 2015, 85, 135–148. [Google Scholar] [CrossRef]
- Dang, N.; Liu, L.; Maire, E.; Adrien, J.; Cazottes, S.; Xiao, W.; Ma, C.; Zhou, L. Analysis of shear stress promoting void evolution behavior in an α/β Ti alloy with fully lamellar microstructure. Mater. Sci. Eng. A 2018, 737, 27–39. [Google Scholar] [CrossRef] [Green Version]
- Park, C.H.; Kim, J.H.; Hyun, Y.-T.; Yeom, J.-T.; Reddy, N.S. The origins of flow softening during high-temperature deformation of a Ti–6Al–4V alloy with a lamellar microstructure. J. Alloys Compd. 2014, 582, 126–129. [Google Scholar] [CrossRef]
- Gao, P.; Yang, H.; Fan, X.; Zhu, S. Unified modeling of flow softening and globularization for hot working of two-phase titanium alloy with a lamellar colony microstructure. J. Alloys Compd. 2014, 600, 78–83. [Google Scholar] [CrossRef]
- Semiatin, S.L. An Overview of the Thermomechanical Processing of α/β Titanium Alloys: Current Status and Future Research Opportunities. Metall. Mater. Trans. A 2020, 51, 2593–2625. [Google Scholar] [CrossRef] [Green Version]
- Tang, X.; Wang, B.; Huo, Y.; Ma, W.; Zhou, J.; Ji, H.; Fu, X. Unified modeling of flow behavior and microstructure evolution in hot forming of a Ni-based superalloy. Mater. Sci. Eng. A 2016, 662, 54–64. [Google Scholar] [CrossRef]
- Wang, K.; Zhan, L.-H.; Yang, Y.-L.; Ma, Z.-Y.; Li, X.-C.; Liu, J. Constitutive modeling and springback prediction of stress relaxation age forming of pre-deformed 2219 aluminum alloy. Trans. Nonferrous Met. Soc. China 2019, 29, 1152–1160. [Google Scholar] [CrossRef]
- Li, Y.; Shi, Z. A New Method to Characterize and Model Stress-Relaxation Aging Behavior of Aluminum Alloys under Age Forming Conditions. Metall. Mater. Trans. A 2022, 53, 1345–1360. [Google Scholar] [CrossRef]
- El Mehtedi, M.; Musharavati, F.; Spigarelli, S. Modelling of the flow behaviour of wrought aluminium alloys at elevated temperatures by a new constitutive equation. Mater. Des. (1980–2015) 2014, 54, 869–873. [Google Scholar] [CrossRef]
- Li, H.; Zhan, L.; Huang, M.; Zhao, X.; Zhou, C.; Qiang, Z. Effects of pre-strain and stress level on stress relaxation ageing behaviour of 2195 Al–Li alloy: Experimental and constitutive modelling. J. Alloys Compd. 2021, 851, 156829. [Google Scholar] [CrossRef]
- Rong, Q.; Shi, Z.; Li, Y.; Lin, J. Constitutive modelling and its application to stress-relaxation age forming of AA6082 with elastic and plastic loadings. J. Mater. Process. Technol. 2021, 295, 117168. [Google Scholar] [CrossRef]
- Li, Y.; Shi, Z.; Lin, J.; Yang, Y.-L.; Rong, Q.; Huang, B.-M.; Chung, T.-F.; Tsao, C.-S.; Yang, J.-R.; Balint, D.S. A unified constitutive model for asymmetric tension and compression creep-ageing behaviour of naturally aged Al-Cu-Li alloy. Int. J. Plast. 2017, 89, 130–149. [Google Scholar] [CrossRef] [Green Version]
- Zheng, Z.; Waheed, S.; Balint, D.S.; Dunne, F.P.E. Slip transfer across phase boundaries in dual phase titanium alloys and the effect on strain rate sensitivity. Int. J. Plast. 2018, 104, 23–38. [Google Scholar] [CrossRef]
- Huang, S.; Zhang, J.; Ma, Y.; Zhang, S.; Youssef, S.S.; Qi, M.; Wang, H.; Qiu, J.; Xu, D.; Lei, J.; et al. Influence of thermal treatment on element partitioning in α+β titanium alloy. J. Alloys Compd. 2019, 791, 575–585. [Google Scholar] [CrossRef]
- Martin, J.L.; Kruml, T. Characterizing thermally activated dislocation mobility. J. Alloys Compd. 2004, 378, 2–12. [Google Scholar] [CrossRef]
- Kruml, T.; Coddet, O.; Martin, J.L. About the determination of the thermal and athermal stress components from stress-relaxation experiments. Acta Mater. 2008, 56, 333–340. [Google Scholar] [CrossRef]
- Trojanová, Z.; Máthis, K.; Lukáč, P.; Németh, G.; Chmelík, F. Internal stress and thermally activated dislocation motion in an AZ63 magnesium alloy. Mater. Chem. Phys. 2011, 130, 1146–1150. [Google Scholar] [CrossRef]
Figure 1.
Schematic of the thermomechanical history of the as-received material.
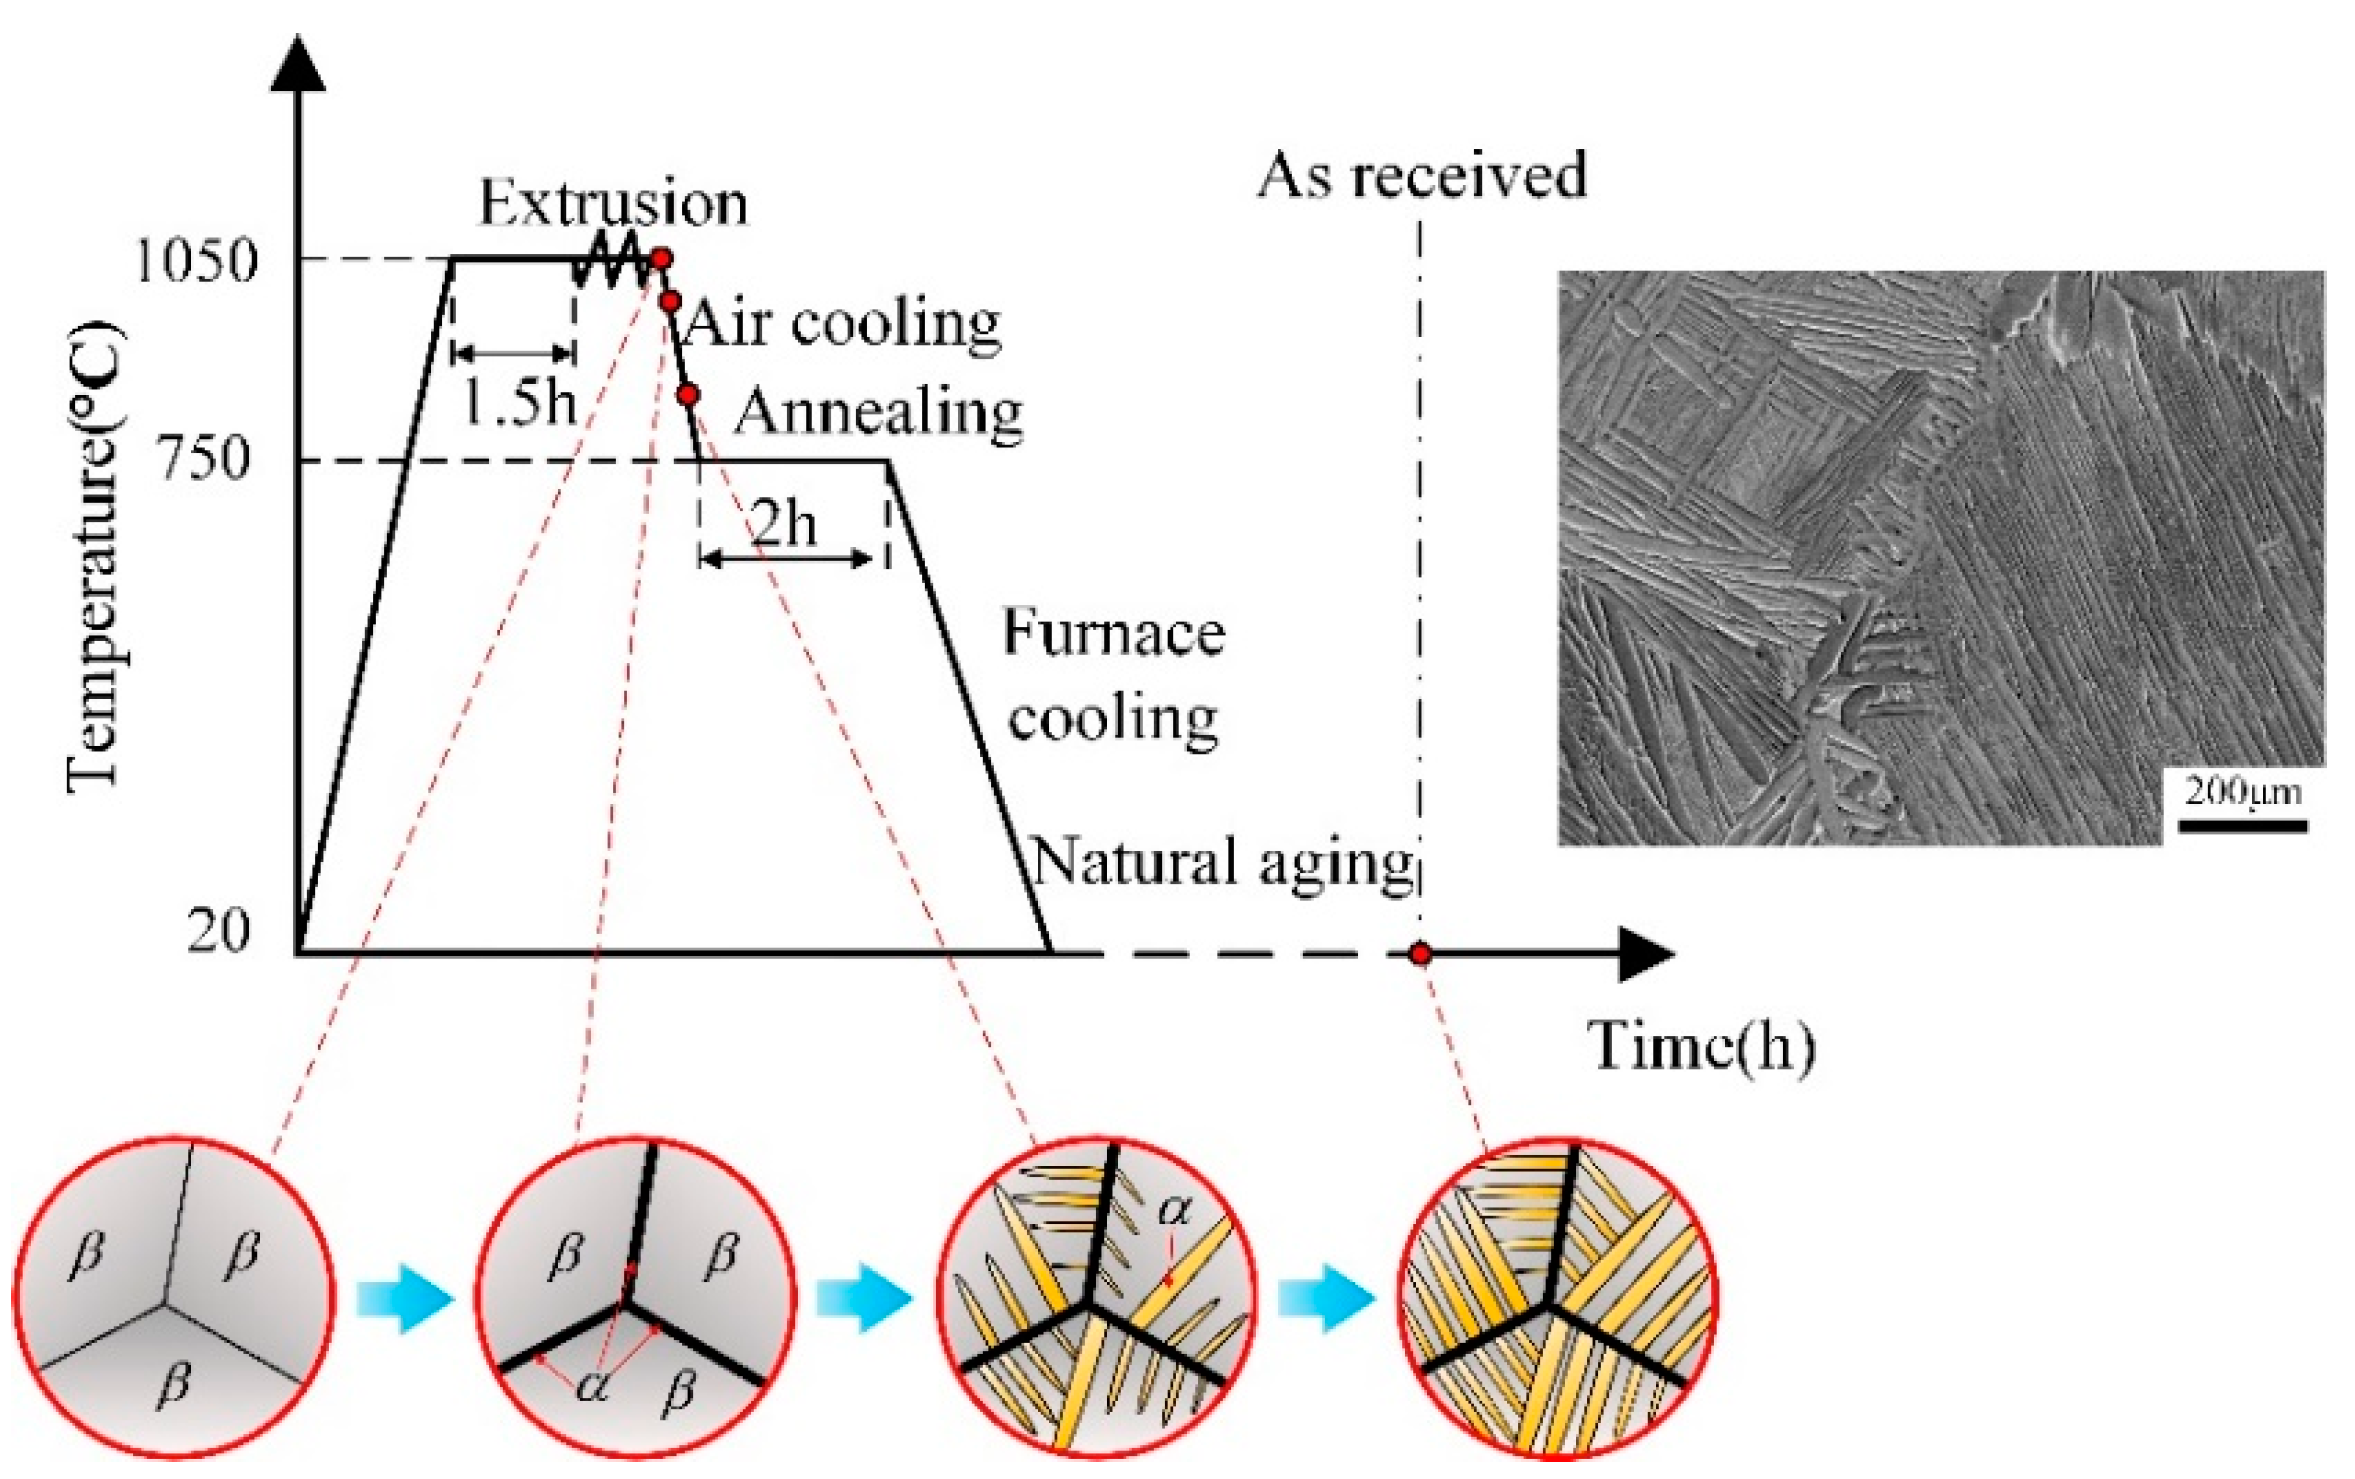
Figure 2.
Schematic of the mechanical testing procedures, (a) the whole stress relaxation process consists of loading stage and stress relaxation (SR) stage, (b) repeated stress relaxation (RSR).
Figure 2.
Schematic of the mechanical testing procedures, (a) the whole stress relaxation process consists of loading stage and stress relaxation (SR) stage, (b) repeated stress relaxation (RSR).

Figure 3.
Comparisons of the experimental (symbols) and computed (solid curves) results at different temperatures with the same strain rate (10−3 s−1).
Figure 3.
Comparisons of the experimental (symbols) and computed (solid curves) results at different temperatures with the same strain rate (10−3 s−1).
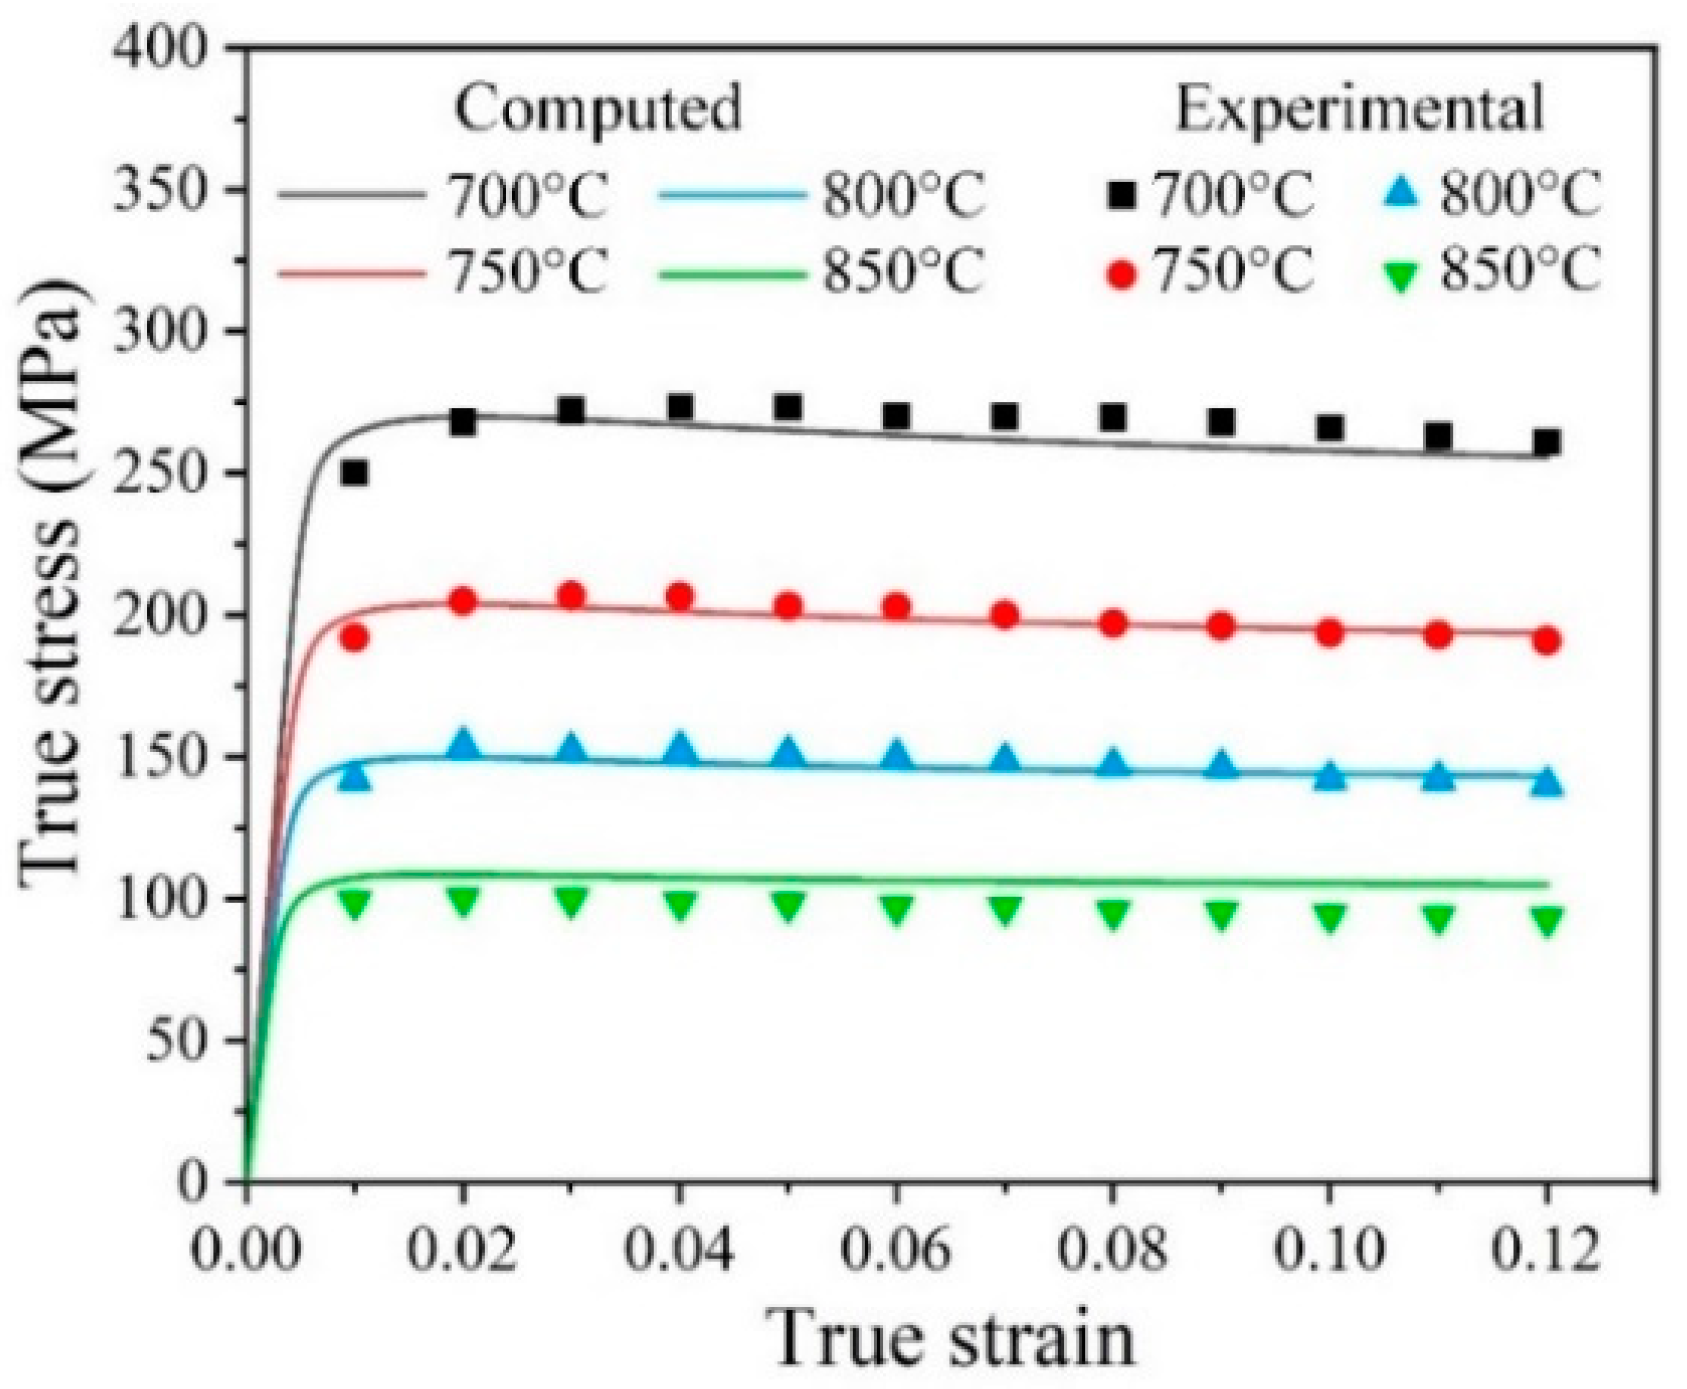
Figure 4.
Normalized stress relaxation curves of Ti-6Al-4V alloy at different temperatures for 2400 s, (a) 700 °C, (b) 750 °C, (c) 800 °C and (d) 850 °C.
Figure 4.
Normalized stress relaxation curves of Ti-6Al-4V alloy at different temperatures for 2400 s, (a) 700 °C, (b) 750 °C, (c) 800 °C and (d) 850 °C.
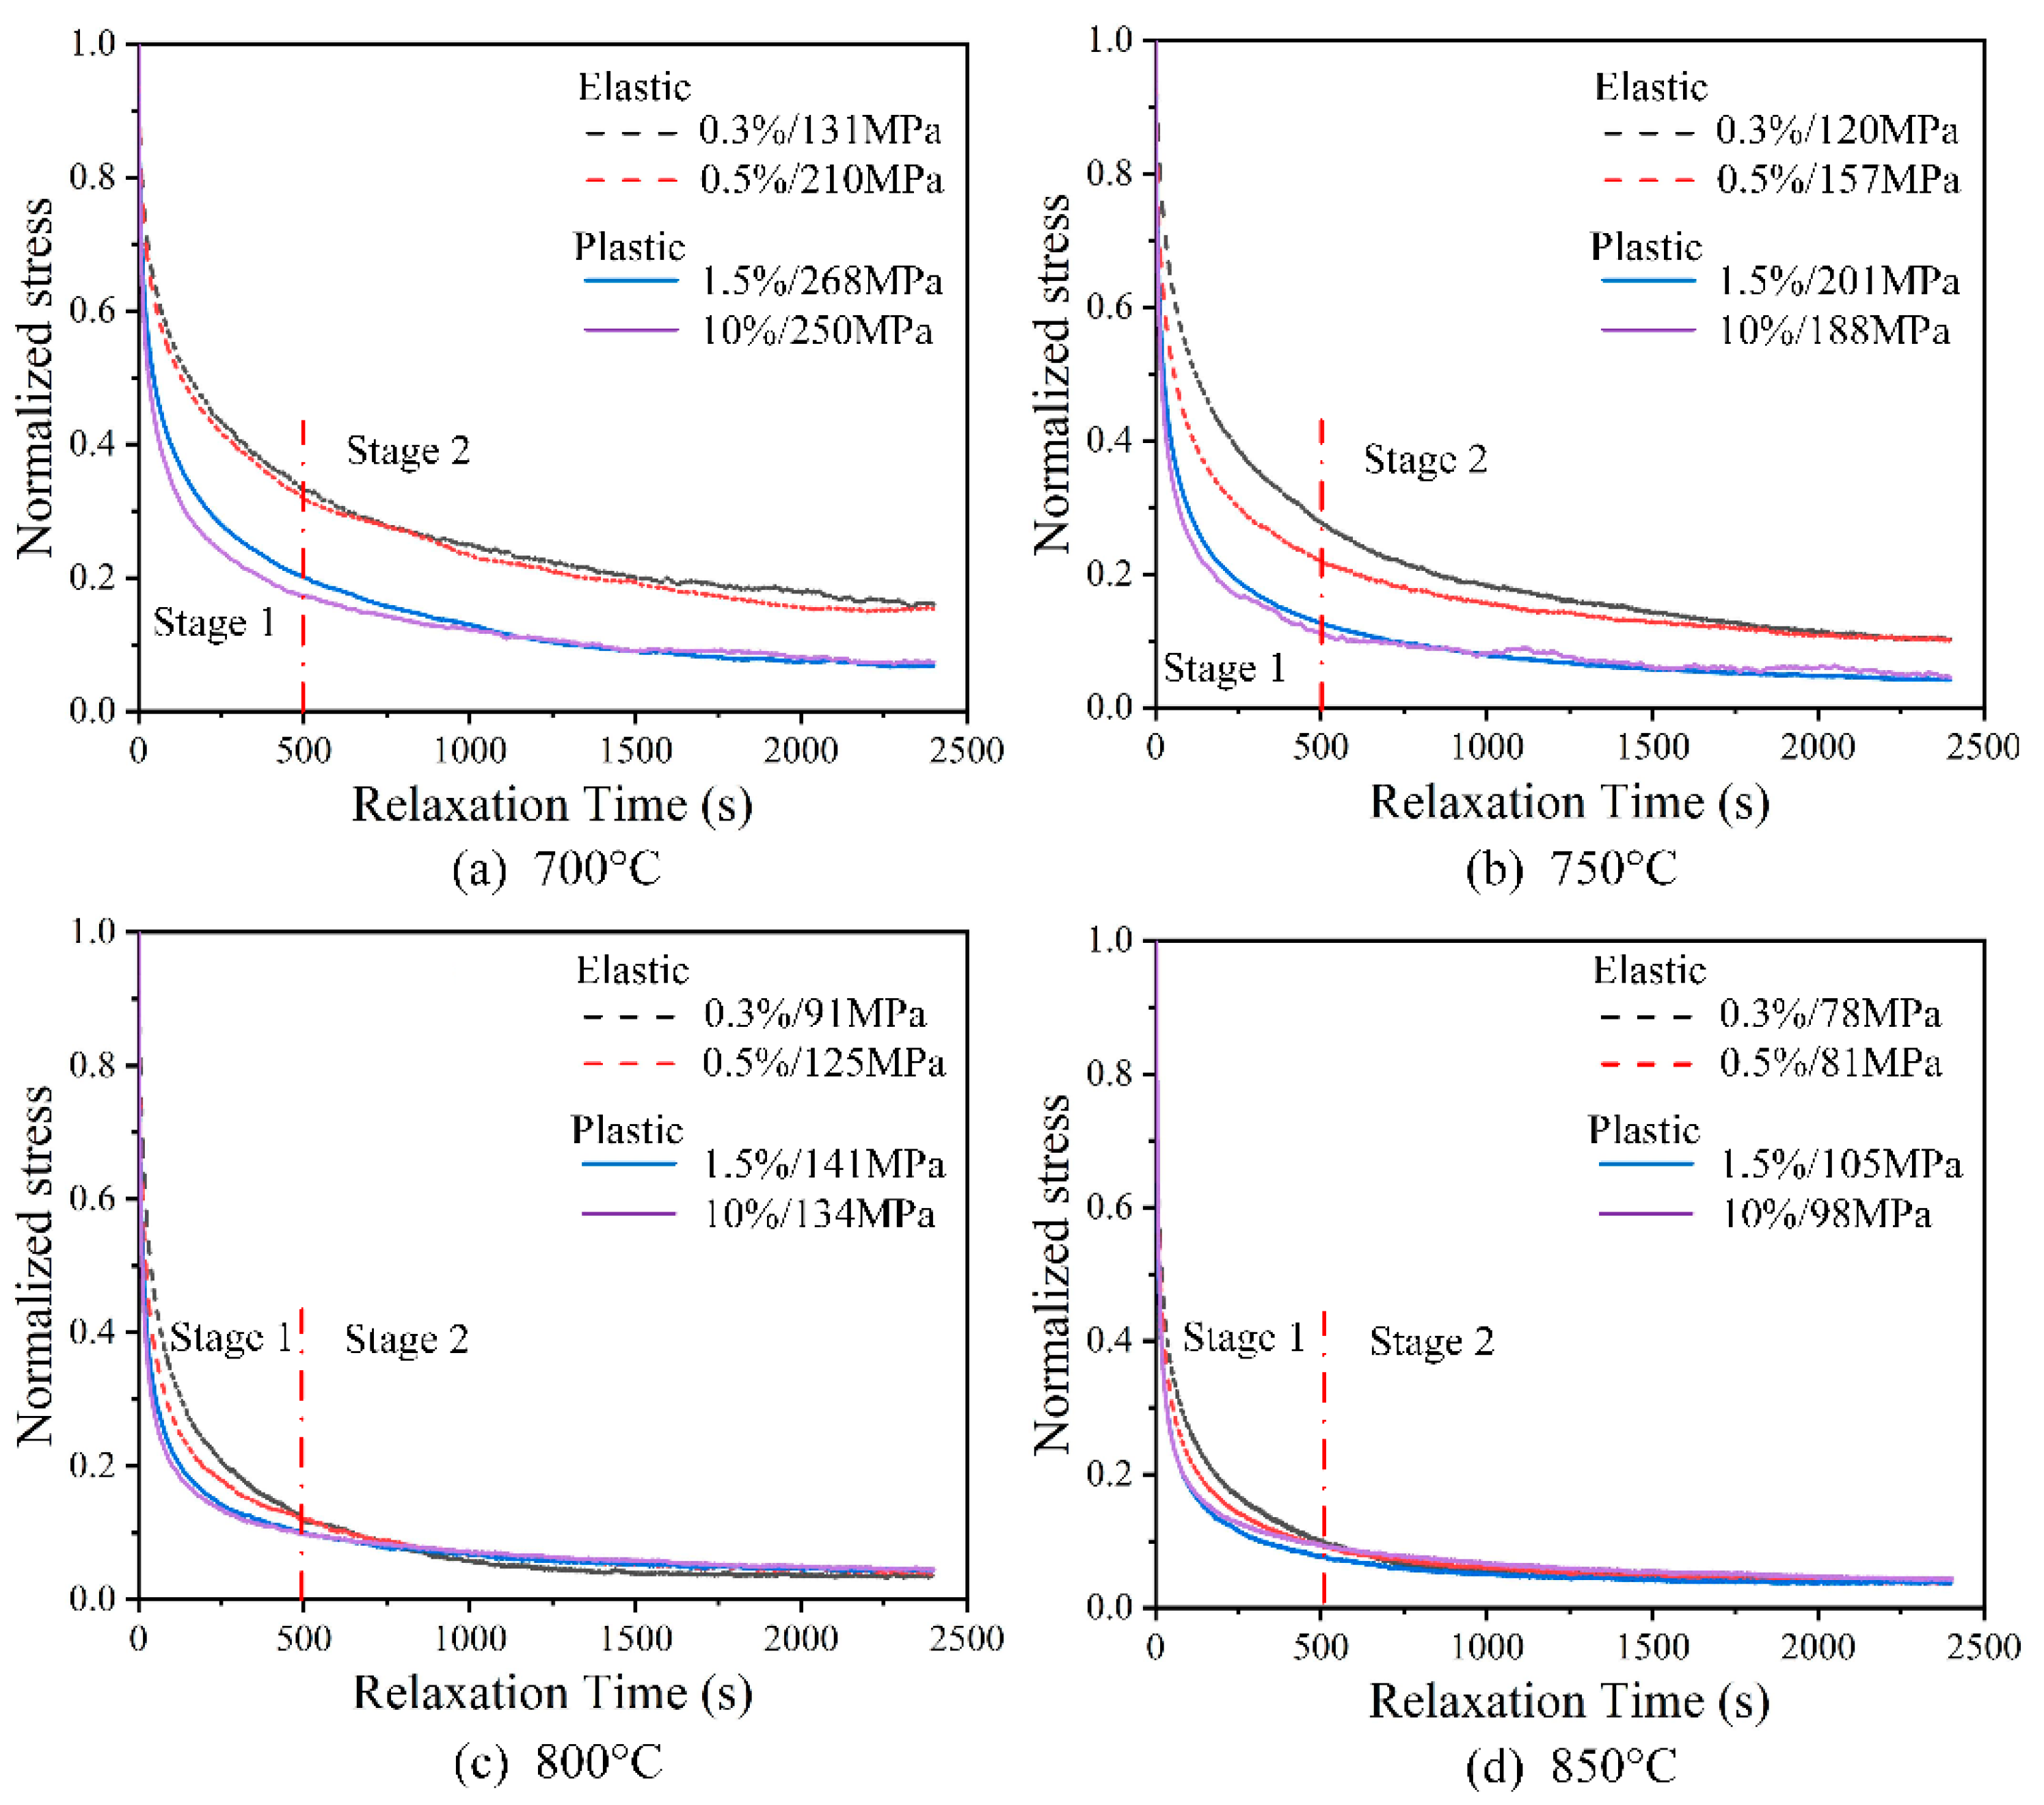
Figure 5.
Normalized repeated stress relaxation behavior of Ti-6Al-4V alloy at indicated temperatures, (a) 700 °C, (b) 750 °C, (c) 800 °C and (d) 850 °C.
Figure 5.
Normalized repeated stress relaxation behavior of Ti-6Al-4V alloy at indicated temperatures, (a) 700 °C, (b) 750 °C, (c) 800 °C and (d) 850 °C.

Figure 6.
Variations in stress components of Ti-6Al-4V alloys with different initial strain ratios at indicated temperatures, (a) percentage of effective stress (defined as the ratio of effective stress to flow stress), (b) percentage of internal stress (defined as the ratio of internal stress to flow stress).
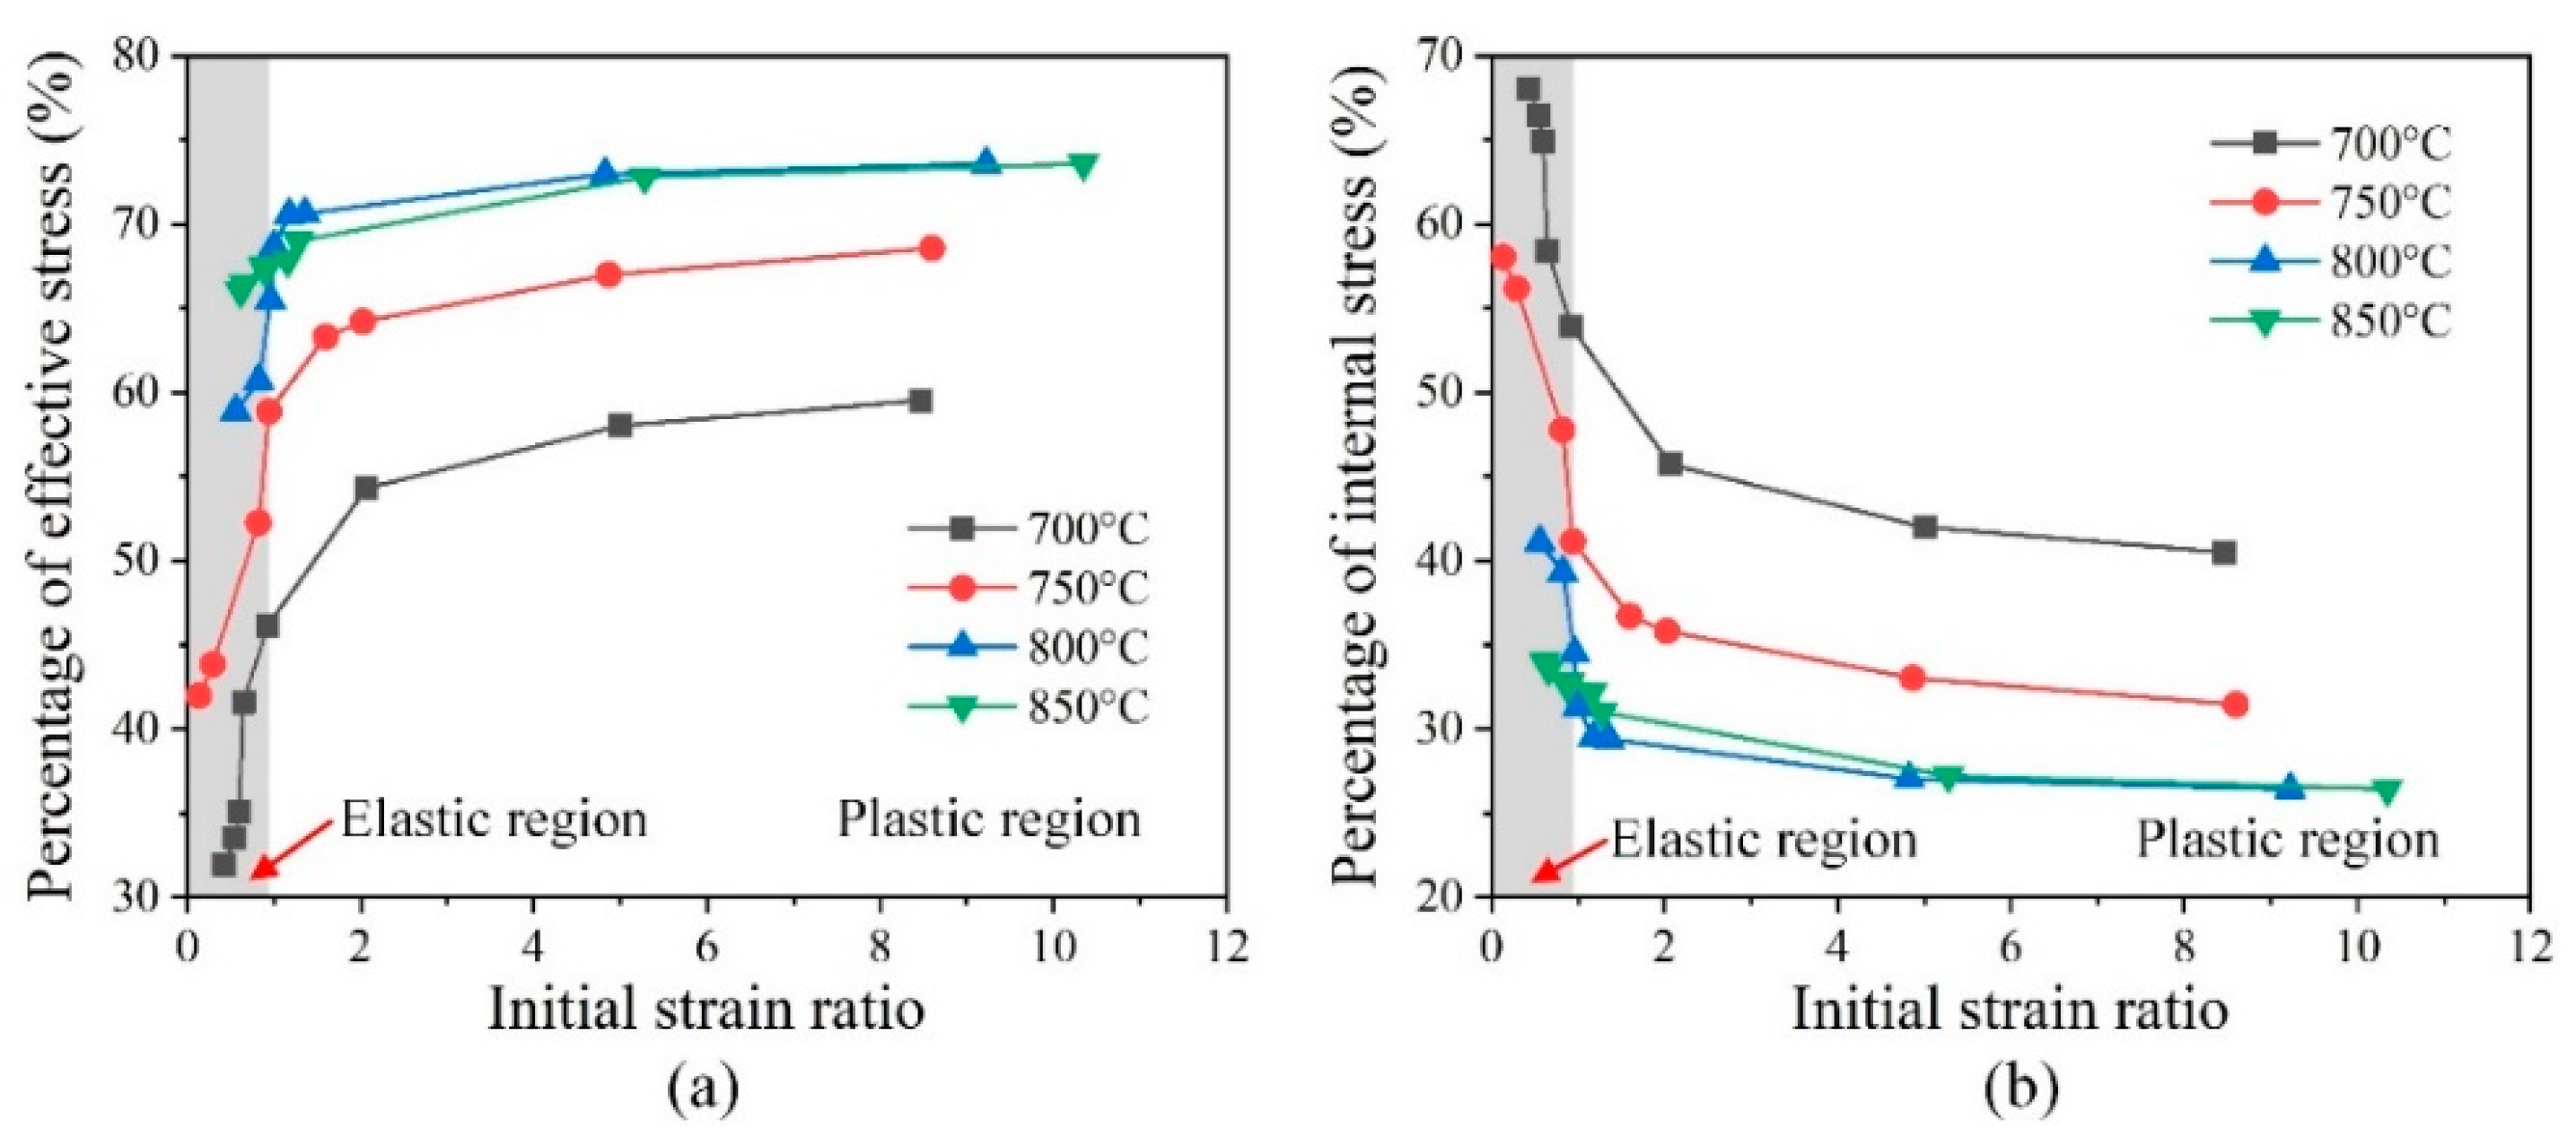
Figure 7.
Comparison of apparent activation energies from experimental (symbols) and computed (lines) results with different initial strain ratios and temperatures.
Figure 7.
Comparison of apparent activation energies from experimental (symbols) and computed (lines) results with different initial strain ratios and temperatures.
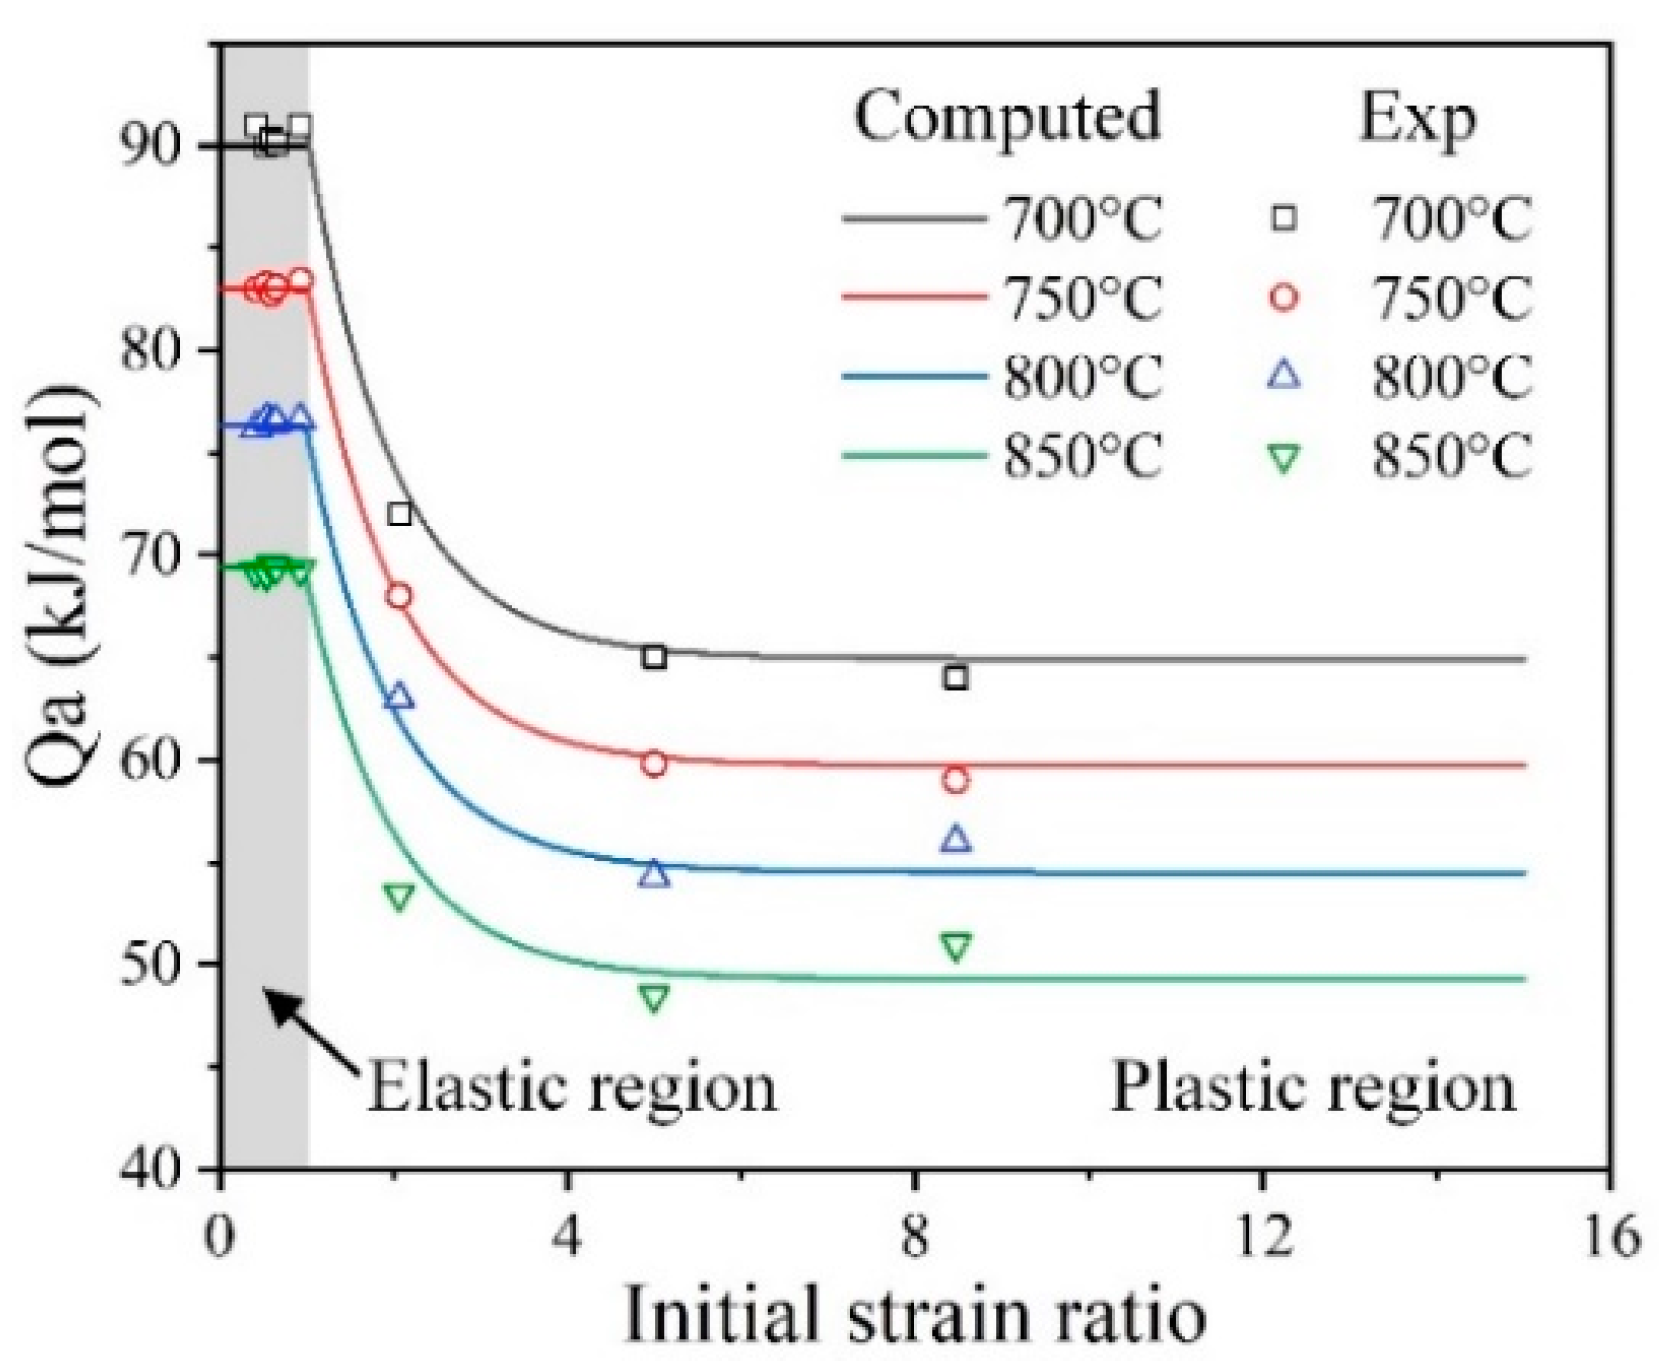
Figure 8.
SEM observation showing the microstructure evolution of Ti-6Al-4V alloy at (a) as-received material, (b) 700 °C/10%/0 s, (c) 800 °C/0.5%/0 s, (d) 800 °C/0.5%/2400 s, (e) 800 °C/10%/0 s and (f) 800 °C/10%/2400 s.
Figure 8.
SEM observation showing the microstructure evolution of Ti-6Al-4V alloy at (a) as-received material, (b) 700 °C/10%/0 s, (c) 800 °C/0.5%/0 s, (d) 800 °C/0.5%/2400 s, (e) 800 °C/10%/0 s and (f) 800 °C/10%/2400 s.
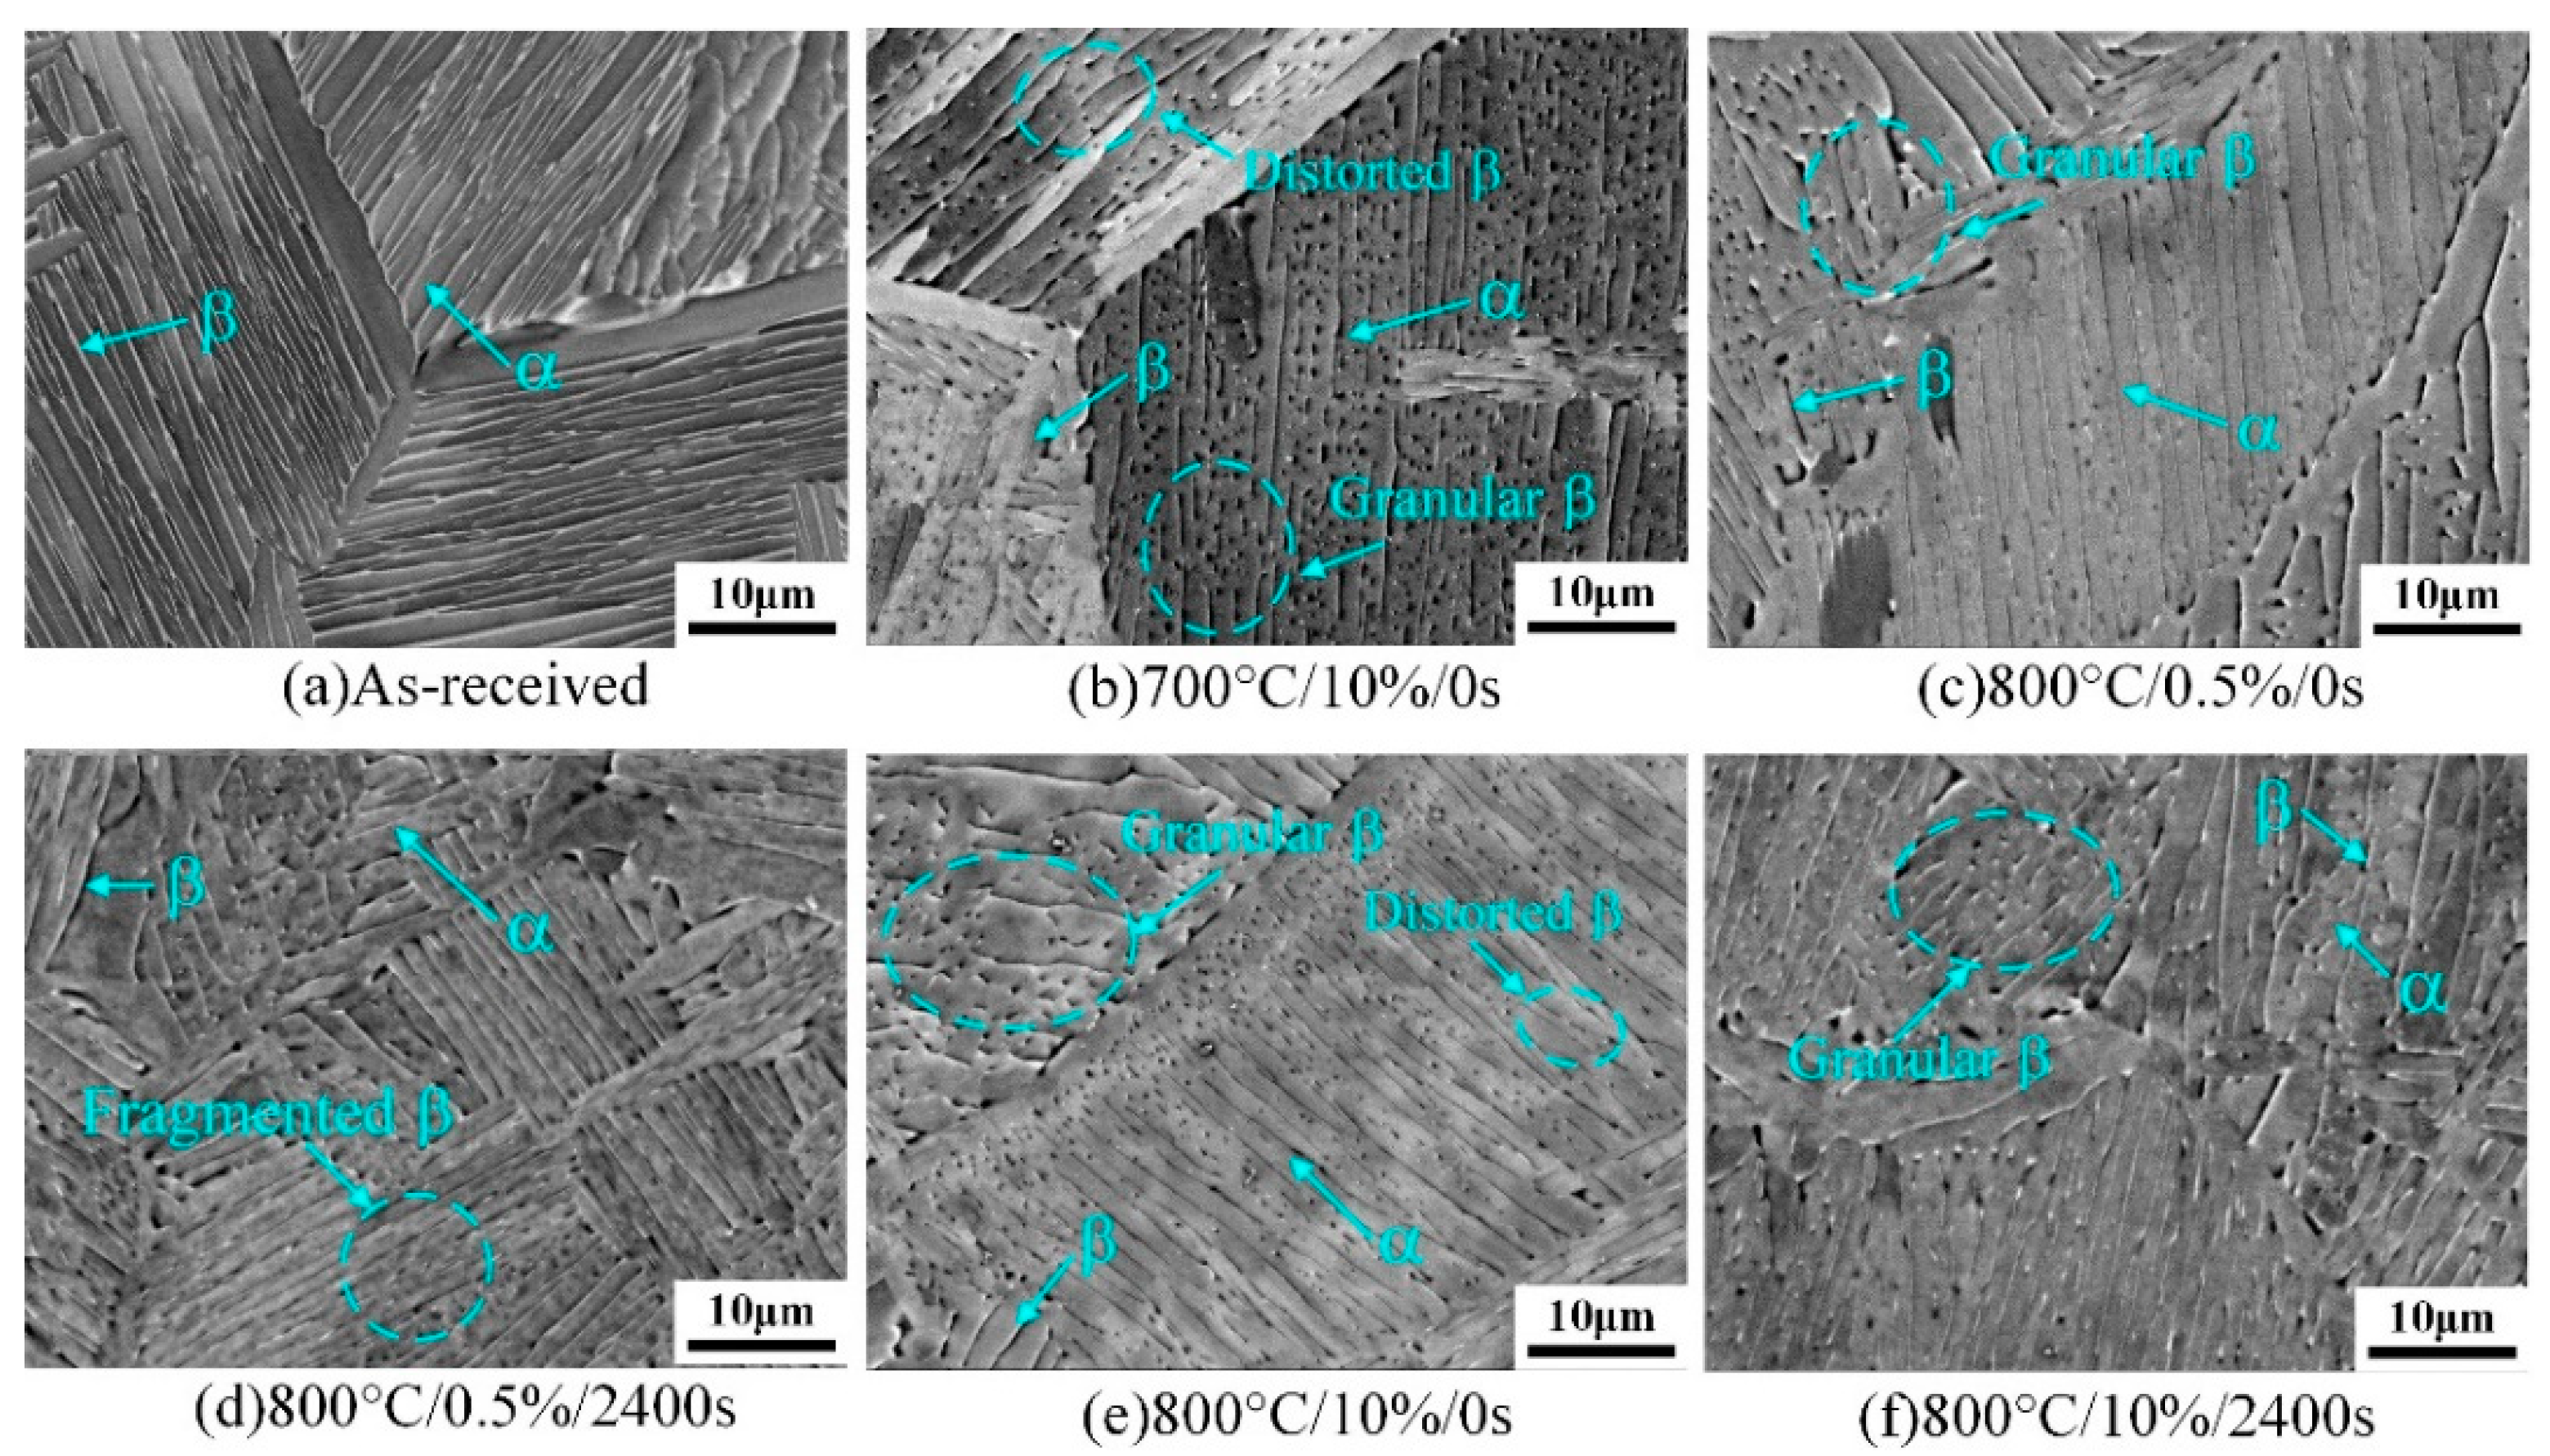
Figure 9.
Modeling procedure for the constitutive model of multi-stage stress relaxation process.

Figure 10.
Comparison of whole stress relaxation curves of simulation (solid line) and experiment (symbol) with different pre-strain and temperature, in which (a) 700 °C, (c) 800 °C and (d) 850 °C are the fitting data and (b) 750 °C is the verification data.
Figure 10.
Comparison of whole stress relaxation curves of simulation (solid line) and experiment (symbol) with different pre-strain and temperature, in which (a) 700 °C, (c) 800 °C and (d) 850 °C are the fitting data and (b) 750 °C is the verification data.
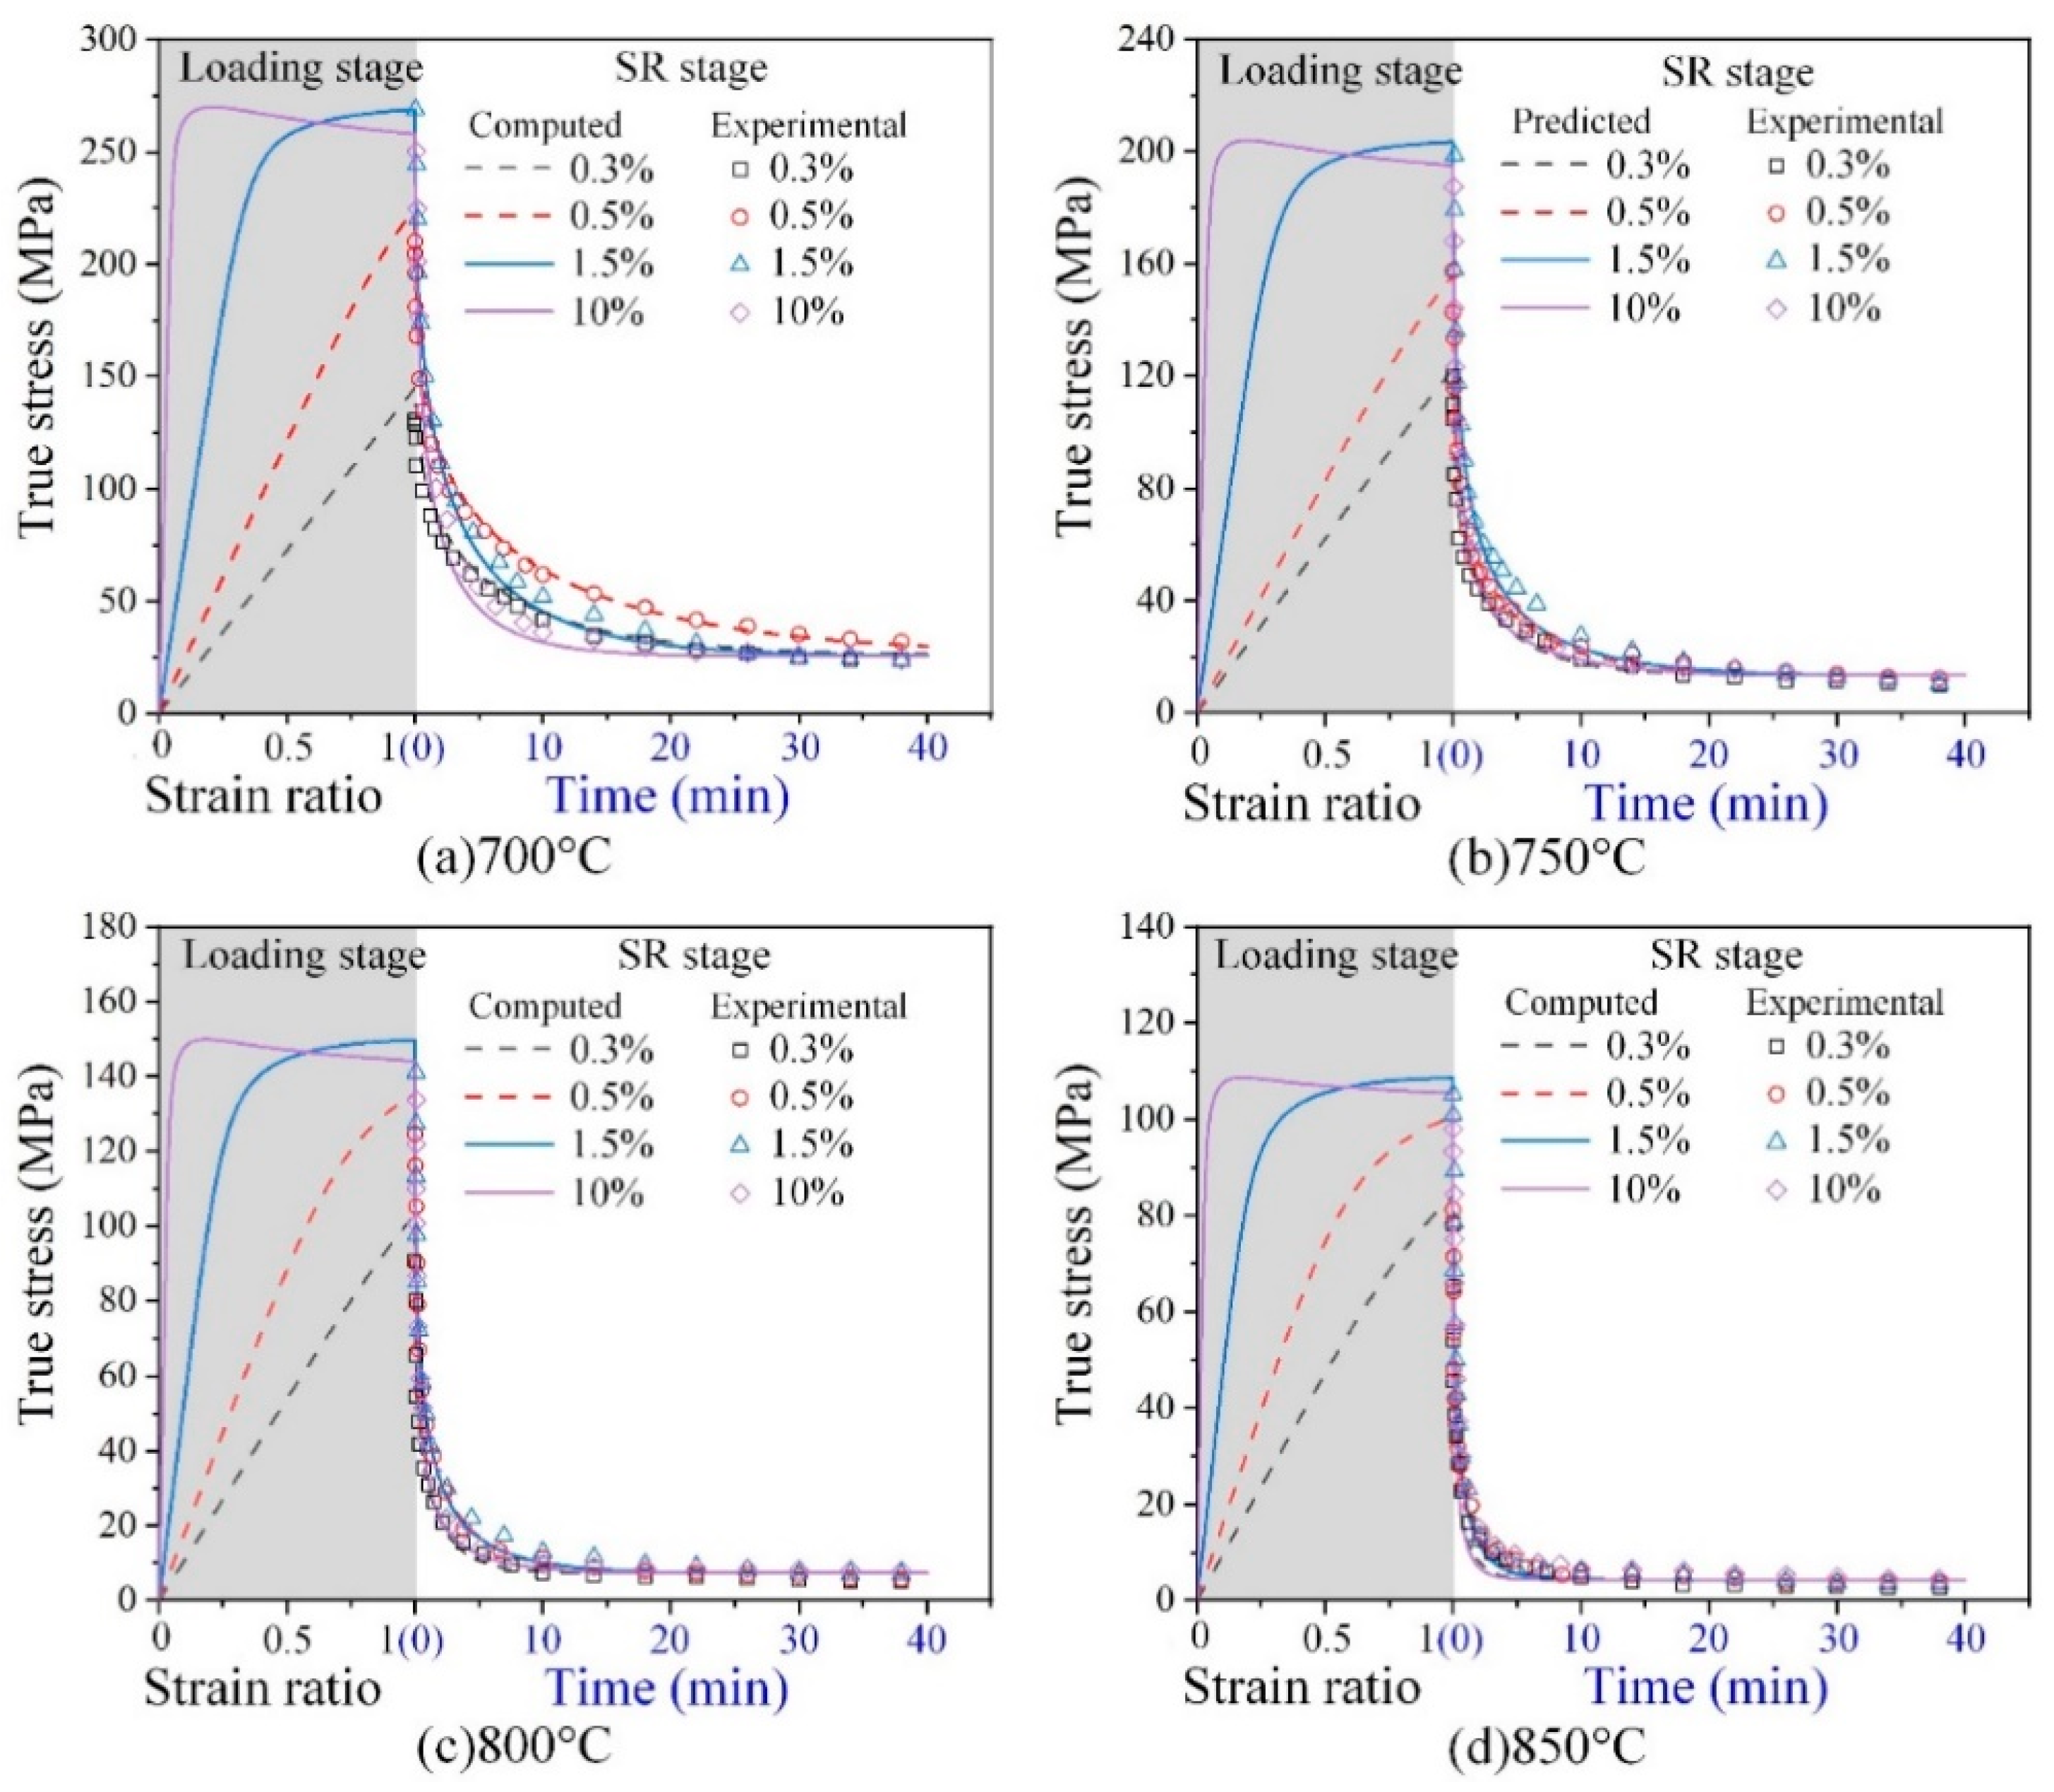
Figure 11.
Correlation between the experimental and predicted stress at 750 °C.
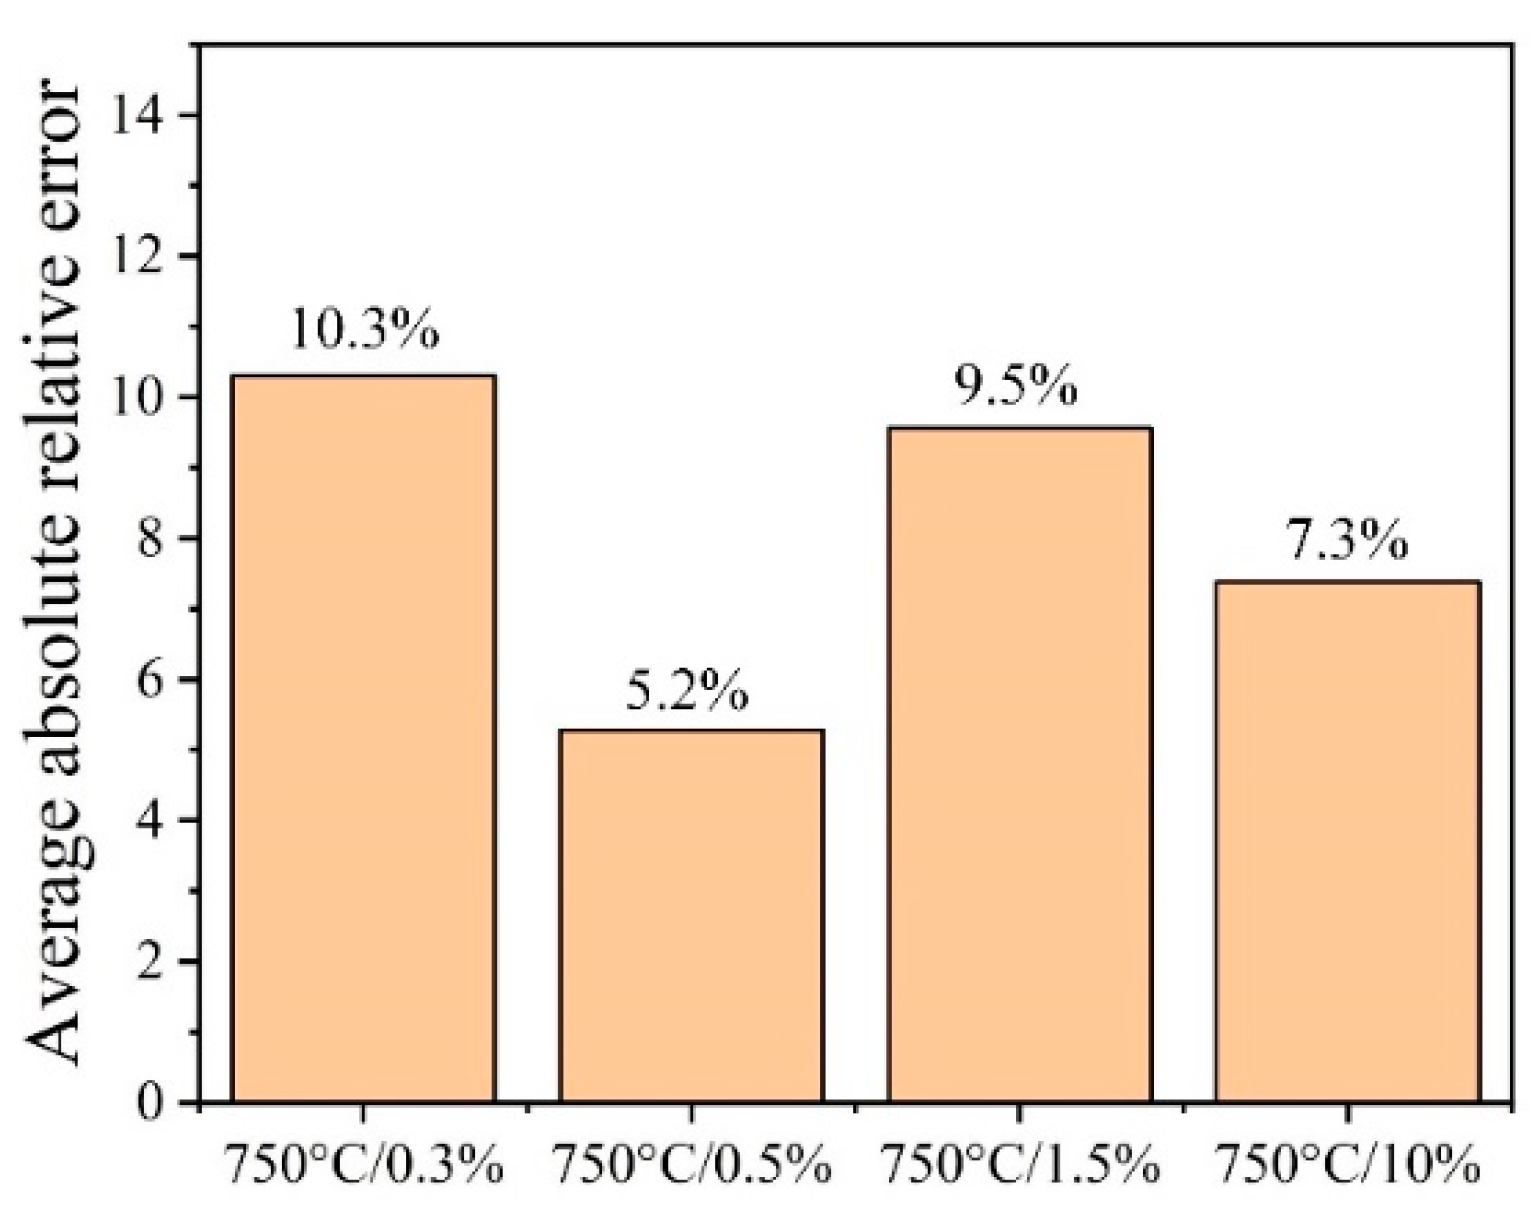
Figure 12.
Comparison between computed (line) and experiment (symbol) of normalized dislocation density evolution in the whole stress relaxation process with different deformation conditions.
Figure 12.
Comparison between computed (line) and experiment (symbol) of normalized dislocation density evolution in the whole stress relaxation process with different deformation conditions.
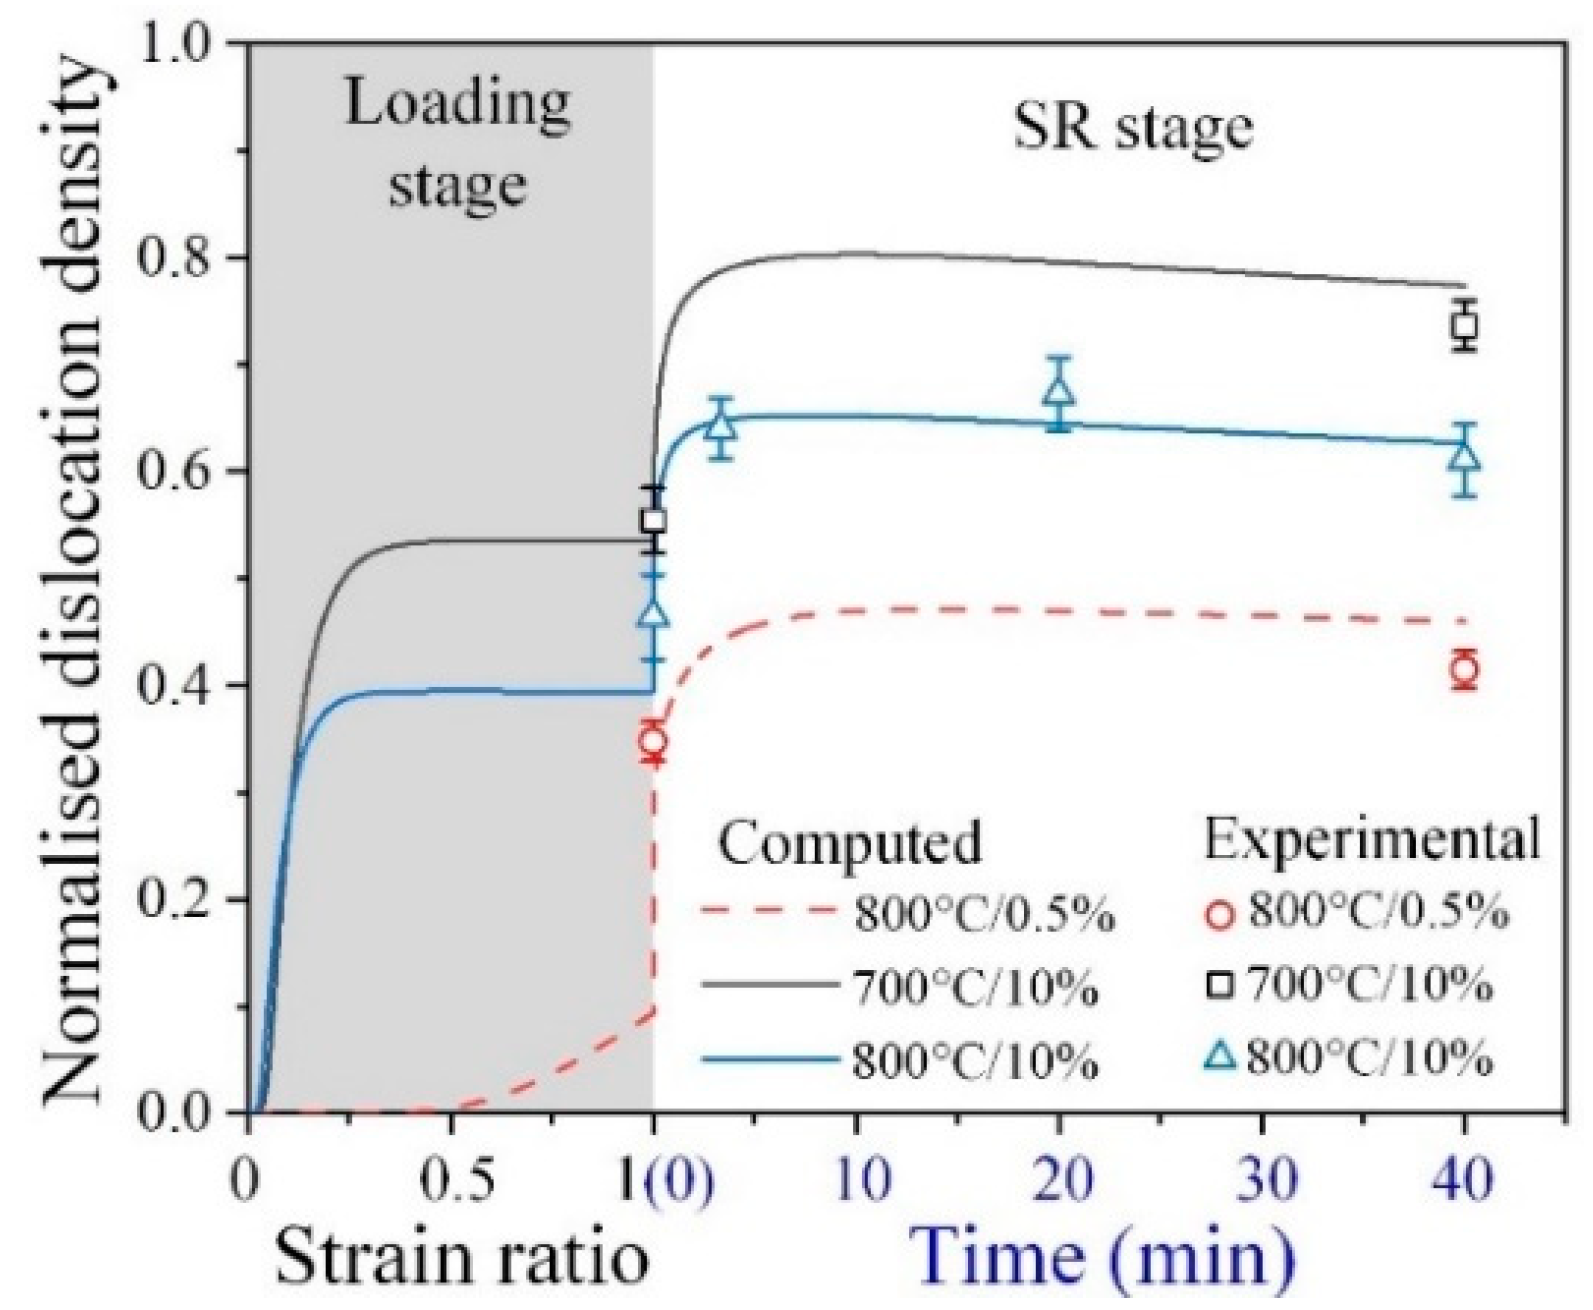
Figure 13.
Prediction of normalized dislocation density with different temperatures and pre-strain levels, (a) 700 °C, (b) 750 °C, (c) 800 °C and (d) 850 °C.
Figure 13.
Prediction of normalized dislocation density with different temperatures and pre-strain levels, (a) 700 °C, (b) 750 °C, (c) 800 °C and (d) 850 °C.
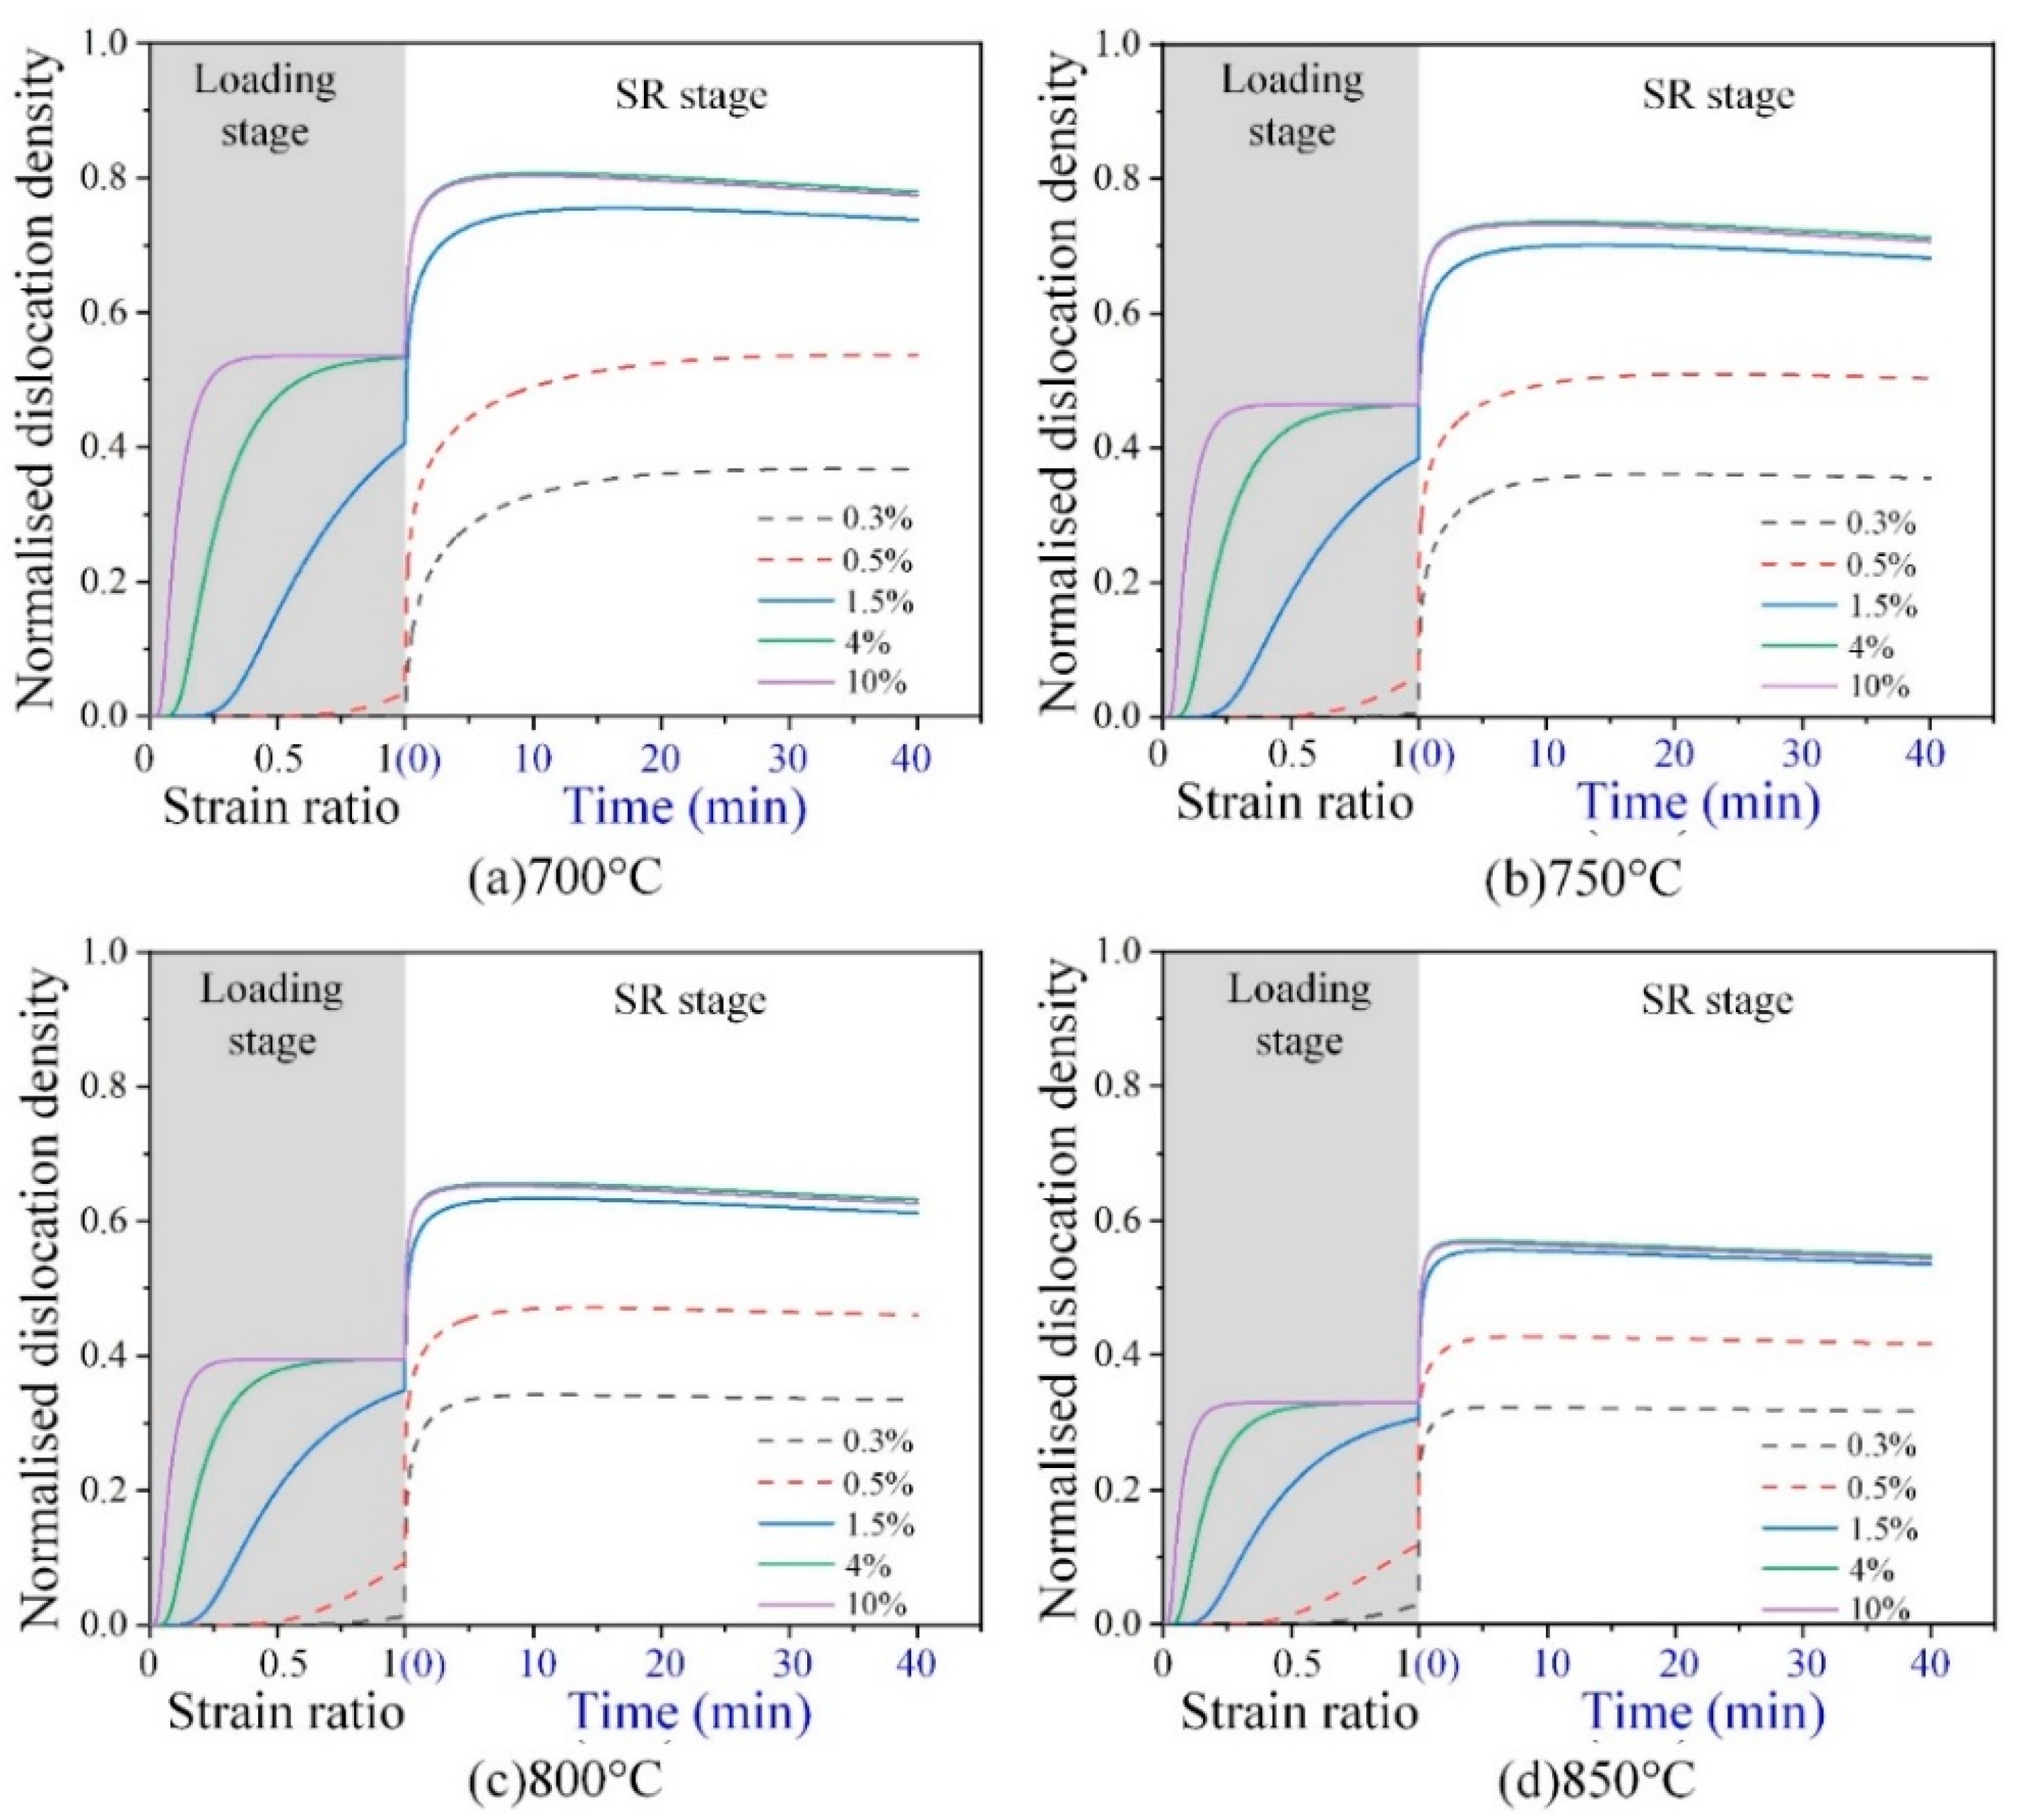
Figure 14.
Prediction of normalized α lamellae with different temperatures and pre-strain levels, (a) 700 °C, (b) 750 °C, (c) 800 °C and (d) 850 °C.
Figure 14.
Prediction of normalized α lamellae with different temperatures and pre-strain levels, (a) 700 °C, (b) 750 °C, (c) 800 °C and (d) 850 °C.


Table 1.
Experimental design for the uniaxial tensile, stress relaxation (SR) and repeated stress relaxation (RSR).
Table 1.
Experimental design for the uniaxial tensile, stress relaxation (SR) and repeated stress relaxation (RSR).
| Experiments | Temperature (°C) | Strain Rate (s−1), Stress (MPa) or Strain Levels | Time (s) | |
|---|---|---|---|---|
| Group 1 | Tensile tests | 700, 750, 800, 850 | 10−3 | —— |
| Group 2 | SR tests | 700, 750, 800, 850 | Elastic: 0.3%, 0.5% Plastic: 1.5%, 10% | 0, 1200, 2400 |
| Group 3 | RSR tests | 700, 750, 800, 850 | Elastic: 0.3%, 0.4%, 0.5%, 0.7%, 0.9% Plastic: 2%, 6%, 11% | 40 |
Table 2.
Elastic modulus and yield strength calculated in tensile tests.
| Temperature (°C) | Elastic Modulus (MPa) | Yield Strength (MPa) |
|---|---|---|
| 700 | 47,920 | 236 |
| 750 | 42,000 | 171 |
| 800 | 38,590 | 125 |
| 850 | 35,210 | 86 |
Table 3.
Determined values of material constants in the loading stage.
| Material Constants | Optimal Value | Material Constants (J/mol) | Optimal Value |
|---|---|---|---|
| 6.01 × 10³ | 3.77 × 10⁴ | ||
| 1.88 × 10² | −1.87 × 10⁴ | ||
| 1.28 × 101 | −4.16 × 10⁴ | ||
| 5.96 × 10⁵ | 1.67 × 10⁴ | ||
| 1.36 × 10³ | −3.4 × 10⁴ | ||
| 8.63 × 101 | −2.07 × 10⁴ | ||
| 1.97 × 101 | −2.89 × 10⁴ | ||
| 2.78 × 10⁻³ | 2.42 × 10⁴ | ||
| 1.04 × 100 | −2.13 × 10³ | ||
| 0.1 × 100 | 2.03 × 10⁴ | ||
| 7.94 × 101 | −4.86 × 10⁴ | ||
| 4.51 × 10⁻² | 4.15 × 10⁴ | ||
| 3.09 × 10⁻¹ | 1.35 × 10⁴ | ||
| 4.30 × 10⁻¹ | 3.79 × 10⁴ | ||
| 8.61 × 10⁴ | −2.6 × 10⁴ | ||
| 2.5 × 10⁻² | |||
| 1.59 × 10² | |||
| 1.00 × 100 |
Table 4.
Determined values of material constants in the stress relaxation stage.
| Material Constants | Optimal Value | Material Constants (J/mol) | Optimal Value |
|---|---|---|---|
| 1.15 × 10⁻⁶ | 1.26 × 10⁵ | ||
| 1.93 × 10² | −7.01 × 10⁴ | ||
| 1.59 × 101 | −2.11 × 10⁴ | ||
| 1.21 × 101 | 2.35 × 10⁴ | ||
| 2.67 × 10⁻² | −2.29 × 10⁴ | ||
| 7.94 × 101 | −6.12 × 10⁴ | ||
| 3.29 × 101 | −4.45 × 10³ | ||
| 1.01 × 100 (Elastic) | −2.35 × 10⁴ | ||
| 1.04 × 100 (Plastic) | 2.87 × 10⁴ | ||
| 4.8 × 10⁻¹ | 1.08 × 10⁵ | ||
| 1.00 × 100 | 3.19 × 10² (Elastic) | ||
| 2.56 × 101 | 3.47 × 10² (Plastic) | ||
| 5.00 × 10⁻² | |||
| 1.00 × 100 | |||
| 8.00 × 10⁻² | |||
| 4.09 × 10⁻⁵ | |||
| 1.58 × 10³ |
Publisher’s Note: MDPI stays neutral with regard to jurisdictional claims in published maps and institutional affiliations. |
© 2022 by the authors. Licensee MDPI, Basel, Switzerland. This article is an open access article distributed under the terms and conditions of the Creative Commons Attribution (CC BY) license (https://creativecommons.org/licenses/by/4.0/).
Share and Cite
MDPI and ACS Style
Zhang, Y.; Li, D.; Li, Y.; Li, X. A Unified Constitutive Model of Stress Relaxation of Ti-6Al-4V Alloy with Different Temperatures from Elastic to Plastic Loading. Machines 2022, 10, 437. https://doi.org/10.3390/machines10060437
AMA Style
Zhang Y, Li D, Li Y, Li X. A Unified Constitutive Model of Stress Relaxation of Ti-6Al-4V Alloy with Different Temperatures from Elastic to Plastic Loading. Machines. 2022; 10(6):437. https://doi.org/10.3390/machines10060437
Chicago/Turabian StyleZhang, Ying, Dongsheng Li, Yong Li, and Xiaoqiang Li. 2022. "A Unified Constitutive Model of Stress Relaxation of Ti-6Al-4V Alloy with Different Temperatures from Elastic to Plastic Loading" Machines 10, no. 6: 437. https://doi.org/10.3390/machines10060437
Note that from the first issue of 2016, this journal uses article numbers instead of page numbers. See further details here.