
An Adaptive Model-Based Approach to the Diagnosis and Prognosis of Rotor-Bearing Unbalance


1
Mechanical Engineering, National Taiwan University of Science and Technology, Taipei 10607, Taiwan
2
Mechanical Engineering, Ming Chi University of Technology, New Taipei City 24301, Taiwan
3
Electrical Engineering, Ming Chi University of Technology, New Taipei City 24301, Taiwan
*
Author to whom correspondence should be addressed.
Machines 2023, 11(10), 976; https://doi.org/10.3390/machines11100976
Submission received: 29 September 2023
/
Revised: 18 October 2023
/
Accepted: 19 October 2023
/
Published: 21 October 2023
(This article belongs to the Special Issue New Approaches in Rotating Machinery Modelling, Analysis and Monitoring)
Abstract
:Rotating machinery is the fundamental component of almost all industrial frameworks. Therefore, prognostics and health management (PHM) have emerged as crucial requirements for effectively managing and sustaining various systems in a timely manner. The unbalanced fault has been recognized as a significant contributing factor in the development of faults in rotor-bearing systems, eventually causing failure. Thus, it is essential to monitor the unbalance and maintain it within acceptable bounds in order to guarantee the system’s proper operation. Most approaches to the rotor’s unbalance monitoring are model-based instead of data-driven due to the shortage of faulted data. In a derived model-based approach, proper identification of the model’s parameters, e.g., bearing parameters, always plays a very crucial role. Nonetheless, the identified model’s parameters in their initial state would inevitably degenerate during a long-term operation because of aging or environmental changes, such that they are no longer well representative of the real system. In this context, this paper offers an adaptive model-based approach for the assessment of unbalance faults developing over days in a rotor-bearing model. The model is adaptive in the sense that it automatically adjusts its parameters so that they are more closely aligned with the real system. A particle swarm optimization (PSO) scheme is utilized in the parameter identification process. The residual serves as the index for initiating the adaptive process when it is greater than a preset percentage. Individual feature errors work as a gauge to determine which bearing parameters need to be reevaluated. A set of 16-month operational data from a local petrochemical company is used to validate the approach. The unbalanced deterioration trend is evaluated, and results from the adaptive methodology are assessed to show its superiority over the original one. It is also observed that the model’s capacity to anticipate unbalance is greatly enhanced by the adaptive strategy. Finally, future unbalances are explored to show its capacity for continuous monitoring-based maintenance solutions.
1. Introduction
In the realm of industrial machinery, the efficient operation of rotating systems is paramount for maintaining productivity, minimizing downtime, and ensuring overall safety. Among the challenges that plague such systems, rotor-bearing unbalance stands as a significant concern, exerting its adverse effects on equipment performance, longevity, and operational costs. Consequently, the implementation of early fault diagnosis and monitoring has emerged as a crucial measure in order to mitigate human and production losses, enhance machinery safety and availability, and bolster reliability. Throughout the years, a multitude of faults and diagnostic methods have been introduced.
To date, vibration-based condition monitoring has been widely regarded as the predominant approach for diagnosing faults in rotating machinery [1]. In the works of [2,3,4], they have provided a comprehensive analysis of the application of vibration-based techniques for the purpose of condition monitoring in rotating machinery. One of the most significant obstacles encountered in the field of condition monitoring is the timely identification and diagnosis of faults prior to their escalation into critical states.
The presence of any imperfections in rotor-bearings has a direct impact on their vibration characteristics, with the specific nature of this impact varying depending on the type of fault being considered. Vibrations observed in rotating machinery can be attributed to many problems, such as unbalance, misalignment, and cracks [5]. Monitoring methods with vibration measurements have been employed for decades to ensure the safe operation of rotor-bearing systems. These methods, however, often do not provide a deeper understanding of fault types and mainly catch machine errors at a rather late stage [6,7] because they are functions of vibration monitoring rather than fault diagnosis and monitoring. Researchers have been working consistently to create cutting-edge monitoring and diagnosis systems as a result of the inclination toward earlier defect detection and identification. Typically, rotor-bearing systems are analyzed for fault identification, diagnosis, or even prognosis through the utilization of model-based and data-driven approaches.
The utilization of signal processing techniques such as wavelet transform [8] and Hilbert-Huang transform [9] has experienced notable progress. The integration of data-driven methodologies with artificial intelligence (AI) techniques has gained significant attention and is expected to continue to be a prominent and auspicious field in the foreseeable future. In a comprehensive analysis of AI applications for detecting faults in rotating machinery [10], a significant emphasis was placed on fault classifications, with over 100 cited references primarily focusing on this aspect. The review highlighted several prominent models found in the literature, including the Naïve Bayes classifier [11], the k-nearest neighbor algorithm [12], the support vector machine, artificial neural networks (ANN) [13,14,15], as well as deep learning-based methodologies [16].
In a recent publication, Kumar et al. [17] conducted a comprehensive review of the utilization of machine learning and deep learning methodologies for the purpose of monitoring induction motors. The primary objective of this monitoring is to identify and diagnose various types of problems, including but not limited to bearing faults, broken bars, stator faults, and eccentricity. Lie et al. [18] recently conducted an extensive evaluation encompassing over 400 citations, focusing on the various uses of artificial intelligence (AI) in the field of fault detection. The authors present a comprehensive analysis that encompasses both historical context and contemporary advancements, while also considering potential future possibilities.
In the domain of data-driven methodologies, a fundamental characteristic is their abstention from establishing the underlying physical principles governing rotary systems. Consequently, these approaches excel at interpolating data but often introduce uncertainty when extrapolating results. The merits of data-driven techniques lie in their exemption from the necessity of crafting intricate physical models for rotor-bearing systems. Instead, they swiftly harness vibrational data to provide early alerts regarding potential faults. Nonetheless, it is crucial to recognize that a diagnostic process reliant solely on measured data has its constraints, predominantly confined to the qualitative assessment of symptoms associated with rotor faults. Achieving precise quantification of these faults, encompassing aspects like the location and extent of unbalance, typically necessitates extensive plant testing, an endeavor that may prove exceedingly time-consuming or, in some cases, unfeasible [19].
In the present scenario, model-based methods for defect identification originating from the physical model (full or partial) of rotor systems have been developed for years. A mathematical model built from system dynamics serves as the foundation of the model-based approach. The accuracy with which model parameters are chosen determines how successful a model will be. Optimization strategies that are linked with the measured response obtained from test rigs or actual operational machines are typically used to identify model parameters. Lin et al. [19] and Lees et al. [5] provided a comprehensive analysis of the application of model-based fault identification.
There are various types of model-based techniques. Using model-based techniques, numerous studies have revealed rotor faults with success. Markert et al. [20] and Platz et al. [21,22] employed model-based techniques to detect rotor defects in their respective studies. These methods involve utilizing virtual loads formed inside the system as a result of the faults. Sekhar [23] employed this methodology to detect the presence of both unbalance and cracks in a rotor-bearing system synchronously. Jain and Kundra [24] employed model-based techniques to detect unbalance and crack conditions. They conducted experimental validation specifically for unbalanced identification on a test rig. Even though each of these model-based approaches has advantages of its own, they all essentially use the same processes for fault isolation, diagnosis, and residual generation [25]. Bachschmid et al. [26] conducted a study in which they detected various defects by minimizing a multidimensional residual between vibrations measured on the machine in specific planes and the estimated vibrations resulting from the recognized faults. The experimental validation conducted by Bachschmid and Pennacchi [27] confirmed the effectiveness of employing model-based techniques for fault localization, severity assessment, and differentiation of faults exhibiting similar symptoms. A novel qualitative metric, referred to as “residual”, was established to assess the precision of the identification process. The fault identification technique proposed by Jalan and Mohanty [6] involves utilizing a Finite Element Method (FEM) model to identify unbalance and misalignment in a rotor-coupling bearing system. This technique is specifically designed to be applied under steady-state conditions. Through the implementation of an optimization technique, the investigators were able to identify both the unbalance and misalignment by decreasing the discrepancy between the measured and calculated forces.
When investigating faults in rotors, it is widely acknowledged that there are eight distinct types: unbalance, misalignment, cracks in blades and shafts, bearing faults, fluid-induced instability, rotor bow, rub, and looseness [28]. Among these faults, unbalance is one of the major causes of faults and failures in rotating equipment, especially for rotor-bearing model systems that are commonly used in industries such as oil and gas, power, and chemical processing. Unbalance causes excessive vibration, which may not cause the direct failure of the shaft but can induce secondary faults such as bearing rubbing, seal leakage, looseness, or blade rubbing and cracking, and eventually results in the failure of the entire system. Therefore, monitoring and detecting unbalance in a rotor model is essential to ensuring the safety, reliability, and efficiency of the equipment.
Numerous ongoing studies on unbalance in rotating machinery have been conducted and span a wide range of topics, such as unbalance misalignment [29], unbalance diagnostics [30], modeling methodologies to help with unbalance prediction, and lab-based experimental investigation. There are several comprehensive literature studies, including those by Edward et al. [31], Randall [32], and Walker et al. [33], that outline the range of unbalanced prediction research. Sudhakar and Sekhar [34] introduced an innovative approach for the detection of rotor unbalance within a bearing system. Their methodology is grounded in a model-based framework and revolves around the simultaneous optimization of two distinct criteria: the reduction of equivalent loads and the minimization of vibrations. By leveraging these criteria, they were able to achieve comprehensive and accurate unbalanced identification within the system.
Most of the publications mentioned above identify rotor unbalances based on known bearing parameter assumptions. There are not many research publications that identify bearing parameters and unbalances at the same time. Tiwari and Chakravarthy [35] utilized experimental data obtained from a rotor-bearing system, encompassing measurements of impulsive response and the rundown test of a specialized rig. Their study aimed to concurrently estimate the residual unbalance and bearing parameters. The outcomes of their investigation exhibited a notable congruence between the identified unbalance masses and the residual masses derived from the rotor-bearing test rig.
The vast majority of model-based rotary systems’ fault-identification relies on known bearing parameters and assumptions. It is believed that an accurate assessment of bearing parameters can prove to be a key and significant step before unbalance identification. Mutra and Srinivas [36] established error-based identification with the help of modified particle swarm optimization (PSO) for solution search. They introduced different degrees of noise into the system to verify the robustness of their approach. However, because it is challenging to pinpoint the precise nature of a bearing parameter’s variation, they did not consider how bearing parameters change during the course of operation.
The implementation of prognostics to address the issue of unbalance has presented significant challenges, leading to a limited amount of research conducted in this domain so far [37,38]. By utilizing a range of sensors and conducting measurements at many bearing positions, it becomes possible to make predictions regarding the collective unbalance exerted on a system. The application of forecasting techniques can enhance the analysis of measured data, enabling the prediction of future unbalanced values. This predictive capability has the potential to yield significant time and cost savings in the efficient operation of equipment. Forecasting techniques play a crucial role in predicting future parameters of a system through the analysis of patterns in past data. In view of that, there are classical or statistical methodologies such as exponential smoothing (ES), auto-regressive integrated moving average (ARIMA) [39], etc. that have been used for forecasting-based tasks for years. However, recently there has been a surge in machine learning (ML) incorporated forecasting tasks in order to understand the complex nature of the systems and to make more accurate and precise long-term predictions. One of the emerging ML-based forecasting methodologies is long short-term memory (LSTM) [40], which is increasingly being used in the field of time-series forecasting due to its ability to learn long-term dependencies in complex data systems and regression-based tasks.
In view of that, the present paper is an extension of the previous work conducted in [19]. In the aforementioned study, unbalance identification was conducted in two phases, where phase I identified the bearing parameters and initial unbalances. Subsequently, phase II evaluated the variation of unbalance over an operational dataset of 16 months. This study, however, presents an adaptive modal-based methodology in which the determination of bearing parameters in phase I is re-initiated when a computed residual value exceeds a predetermined threshold, which would occur due to component deterioration, aging, or part replacement. Once the newly identified bearing parameters have been established and proven to closely represent the actual system, phase II is run using these new parameters in order to enhance the accuracy of the predicted unbalances and achieve a closer resemblance to the actual system. Incorporating adaptability into a model-based rotor-bearing unbalance identification approach to accommodate the aging, component deterioration, replacement, or unknown causes in a long-run rotary system, to our understanding, is not seen in the published literature.
The remainder of this paper’s structure may be summed up as follows: In Section 2, model-based unbalance methodology is described, and Section 3 introduces the adaptive methodology employed in the present study. Section 4 describes the prognostic steps and methodology employed to compute the future unbalances, whereas Section 5 briefly discusses the results and describes how the adaptive model gives more overall accuracy in estimating the unbalance and helps in unbalance monitoring and prognosis. Finally, in Section 6, concluding remarks are drawn to justify the effectiveness of this study in maintenance-based solutions.
2. Model-Based Unbalance Analysis of the Turbine Rotor-Bearing System
2.1. Rotor-Bearing Model
The rotor-bearing system elucidated by Lin et al. [19] is portrayed and comprehensively expounded in the illustrative depiction of Figure 1. This visualization encapsulates the intricate geometrical specifications and precise coordinates inherent to the system. The turbine-bearing system is made up of a number of crucial components, including a flexible shaft, a three-stage impeller, and two hydrostatic fluid-film, 5-tilting-pad bearings that are positioned near the shaft’s ends. The rotor system operates at a speed of about 11,000 rpm but is balanced at about 800 rpm, which makes the turbine quasi-flexible.
2.2. Mathematical Derivation of the Physical Model
The equations of motion (EOM) via an assumed mode method (AMM) can be expressed as
where p and q are the so-called generalized coordinates of the assumed displacements in the x and y directions, i.e.,
where the assumed modes, i(z)’s, consist of the natural modes of a free-free beam plus two rigid body modes, translation and rotation. M, N, C, and K, respectively, represent the mass, rotary inertia, damping, and stiffness matrix. The entries of matrices include the geometric and material properties of the shaft and disks, bearings’ stiffness, and damping constants. They can be described as follows [19].
where . nd, md, Id, nb, and IA denote the number of disks, disk’s mass, disk’s diametric inertia, number of bearings, and shaft’s area moment of inertia, respectively.
The unbalanced (centrifugal) forces, located at the gravity center as an instance, can be decomposed into x and y components as
and subsequently, the generalized forces can be expressed as
where Ug = (me) is the typically defined unbalance with a unit of g.mm., αg is the unbalance phase angle relative to the key phasor, and δ(z) is the Dirac delta function used to locate a concentrated force. Here, the subscript g represents the gravity center. A flexible rotor’s unbalance can be specified at two arbitrary planes, and in the present case, the unbalance will be first specialized at the two bearing planes for computational convenience. However, to uniquely identify the rotor unbalance, the two-plane unbalances are eventually summed up and expressed in terms of static and dynamic unbalances.
Equations (2) and (3) provide a mathematical expression for the rotor’s displacements in relation to the variable z. However, it is important to note that the measurements used to verify these equations are only taken at the bearings’ locations, which can be written as
Here, subscripts 1 and 2 at z are used to differentiate between the two distinct bearing locations. Specifically, subscript 1 is assigned to the left bearing #15, while subscript 2 is assigned to the right bearing #16. The variables u and v correspond to the rotor’s displacements along the x and y axes. Additionally, the subscripts c and s are used to denote the cosine and sine components of these displacements. The response components uc, vs, us, and vc at two bearings reflect the severity of rotor unbalance and are selected as the features for parameter identification. Thus, the feature vector can be defined as
In the following text, the terms fT and fm respectively, refer to the theoretical (calculated) and measured (actual) feature vectors. The residual is defined as the sum of the absolute differences between the fT and fm vectors. Mathematically, the residual e reflects the total magnitude of the absolute errors between the calculated and actual features.
Via minimizing the residual e, the most appropriate parameters embedded in the physical model of Equation (1) can hence be identified. To be specific, the undetermined parameters in phase I can be described in terms of a design vector as
where the subscripts I denote phase I; 1 and 2 are designated for left and right bearing. k’s and C’s are the bearing’s stiffness and damping constants; are the initial unbalances of the rotor-bearing system specified at the two bearing planes. Provided dI is properly identified in phase I, the variables progressive with time afterwards, in normal operation, are the unbalances; therefore, a design vector in phase II can be defined as
The completeness of phase II identification will result in unbalanced variation curves with time, and it can be viewed as an unbalanced fault monitoring/diagnosis of the rotor-bearing system.
2.3. Parameter Identification
The success of model-based unbalance diagnosis and monitoring relies on the accurate identification of the model’s parameters in phase I. After several trials, a PSO [41] optimization scheme has been proven to be a very efficient and effective tool [19] and is hence chosen in both identification phases. Regarding the theory and applications of PSO, Gad [42] provides a systematic review of the recent works for interested readers. In phase II, the bearing parameters are usually kept constant, i.e., a time-invariant system, unless a sudden residual rise is detected, which implies significant system variations or loading changes.
The optimization problem of parameter identification in phase I can be formulated as,
The constraint of initial unbalances at two bearing planes is based on the manufacturer’s specification for the balancing stand. The search range for unbalanced angles was calculated based on the measured responses of the sensors [19]. The model’s parameters are fully determined when phase I is complete.
In phase II, (U1, α1) and (U2, α2) are evaluated over the operational days with known bearing stiffness and damping constants. The optimization problem can be expressed as,
The variation of U1 and U2 is set to be within the range of a 20% increment over the latest unbalances simply for computational efficiency, since unbalance variation hardly jumps over 20% in one-day operation without reason. The behavior of unbalance is such that it gradually increases and raises the overall vibration of the system. Nonetheless, an abrupt change in the rotor-bearing system could happen due to some unknown causes. If such an instance happens, using the existing model parameters to identify the developing unbalances in phase II may result in inaccurate estimation because the physical model does not appropriately represent the actual system. Therefore, adaptability in the physical model to accommodate surrounding changes, or self-updating the model to the status quo, is necessary and investigated for its effectiveness in this paper.
The construction of a self-updated function requires an index to initiate the action, and the residual, which indicates the absolute sum of total feature errors, appears to be an appropriate index. Whenever a preset threshold of residual and some criteria are reached, phase I identification is reactivated, and the full or partial model’s parameters, based on the gauge described in Section 2.4, are re-identified.
To illustrate the necessity and effectiveness of adaptability, it is helpful to first inspect the variation of residual and absolute features’ sums of the original invariant assumption, as shown in Figure 2, wherein the dataset was over the span of 16-month operational days provided by a local petrochemical company [19]. From the figure, it is clearly observed that the model derived from the physical system seems to perform really well, with the ratio of residual over feature sum (denoted f) around 14%, until the 125th day of operation. After that, the residual remains at a higher level, with the ratio e/f increasing up to 42%. This implies that there is an unexpected change in the system, and it is highly suspected that the present theoretical model is substantially different from the actual system. After a detailed investigation and consulting with the engineers of the company, it was found that there had been an incident of labyrinth ring breakdown and subsequent replacement. This repair has caused the model to deviate from its original setting and generate huge residuals. In view of this, it is realized that there is a need to set indices to reactivate phase I processes and to determine what model’s parameters ought to be adjusted so that it is ensured that the model closely resembles the real system at all times.
2.4. Analysis of Individual Feature Errors
The gauge for determining whether full or partial parameters need to be re-identified is described in this section. The features represent the response components at bearing locations. Thus, feature errors indicate how close the physical model is to the actual system. Figure 3 and Figure 4 show the features, calculated (estimated) and real (measured), of bearings #15 and #16, respectively. As seen from Figure 3, the calculated features closely resemble the measurements even after the 125th day, and it implies no significant deviation at bearing #15 parameters. Nonetheless, Figure 4 shows that uc and vs bearing #16 have significant differences after the labyrinth ring replacement, especially two uc’s that have been out of phase after ring replacement. This finding discloses that the parameters at bearing #16 side, which include bearing constants and unbalance (U2, α2), need to be adjusted after the maintenance has been performed.
3. Adaptive Methodology
In this particular implementation of the system model, the adaptive technique, as described in the previous section, is established in order to ascertain the model parameters and generate the prognosis curve of an unbalanced fault in the rotor-bearing system. Figure 5 depicts a flowchart that elucidates the adaptive model-based strategy employed in this study. The activation of the adaptive function is determined by two indices, e and e/f: (i) Continuously monitor the residual (e) rise and the ratio of residual to feature sum (e/f) in phase II’s unbalanced identification. A flag is set on if the e suddenly jumps over a preset threshold, e.g., a 50% increase or e/f ratio exceeding 1/3 in the present example. Note that the sensitivity of this index should be limited to prevent frequent fluctuations in the model parameters; (ii) keep monitoring e and e/f and see if they remain at a high level for three consecutive days. The reason for observing the indices for a few days is that a temporarily rapid change in residual may be attributed to loading variation, which belongs to transient behavior, and it will die out eventually; (iii) calculate the individual feature errors on two bearing sides using the latest three-day data to determine which bearing needs to be re-identified. (iv) Set different cases for testing. For instance, according to Figure 3 and Figure 4, the #16 bearing side needs to be adjusted because of large feature errors generated on this side. The feature errors, however, may be due to deviations in bearing parameters or a combination of unbalance and bearing. Based on that, the reevaluation of only bearing #16 constants is studied as case 1, and the bearing constants plus unbalance at #16 are studied as case 2. (v) Re-activate the phase I identification process for those cases and then select the one with the least residual as the new model’s parameters.
From the gauge of feature errors, there should be just two cases selected and tested in the subsequent analysis. Nonetheless, after consulting with the engineer of the company, it was noticed that in the replacement of labyrinth rings, the whole rotor-bearing had been disassembled and reassembled. Under such a situation, bearing #15 might have been altered to some extent as well. Therefore, re-identification of two bearings’ parameters is also investigated as case 3. In addition, the case in which all the model parameters are allowed for re-identification is also investigated as case 4. Comparisons of these four cases will be discussed in Section 4, and this comparison will also demonstrate that using individual feature errors as a gauge seems appropriate.
4. Prognostic Methodology
The establishment of the idea of unbalance prognostics enables a more thorough understanding of the progressive development of unbalance, its future behavior, and the timely implementation of suitable maintenance-based actions. The methodology incorporates the use of data collection, ongoing monitoring of unbalanced faults, the establishment of model training, and the assessment of forecast accuracy pertaining to unbalanced faults over a specified duration. For this analysis, we make use of existing forecasting methodologies, which are popular for understanding the temporal patterns of the time-series curve in long-term analysis. In the next part, Section 4.1 and Section 4.2 present a comprehensive overview of the methodologies employed in the prediction of unbalanced faults. In the examination of models, we have employed the classical ARIMA model, which is renowned for its strong forecasting capabilities in many instances. Additionally, we have utilized the LSTM model, a machine learning-based neural network model that is gaining prominence in forecasting tasks. The choice of ARIMA model is derived from a case study of the same model in a different time period described in reference [39]. However, the choice to utilize the LSTM-based forecasting strategy is motivated by its superior performance in comparison to other classical approaches such as ES, ARIMA, etc., as demonstrated in [43]. A comparative analysis between these two models is presented to determine which one produces superior outcomes in the specific scenario of unbalanced forecasting. This assessment aims to identify the model that can be relied upon for future maintenance-based actions.
4.1. Auto Regressive Integrated Moving Average (ARIMA)
The autoregressive integrated moving average (ARIMA) is a type of statistical approach commonly employed in the prediction and analysis of time series data. ARIMA models are particularly useful for understanding and predicting data points in a time series when there is a clear temporal component and the data exhibit trends, seasonality, or other recognizable patterns. The utilization of ARIMA models in employment involves the incorporation of parameters denoted as (p, d, q). In this context, p represents the auto-regressive order, d signifies the differencing order, which entails the subtraction of the prior value from the current value, and q denotes the moving average order.
where the variable denotes the lags of series while representing the coefficient of lag. Here, α represents the intercept term, ε is the error term specific to each lag in the autoregressive models of the respective lags, and signifies the coefficient associated with these errors.
4.2. Long Short Term Memory (LSTM)
The long short-term memory (LSTM) technique is a modified version of the recurrent neural network (RNN) approach that addresses the issue of the vanishing gradient problem commonly encountered in RNNs. These algorithms are primarily utilized in issues that involve sequence predictions, such as time series forecasting, natural language processing, and speech recognition. The selection of this approach is based on its capacity to accurately predict the distributions of non-linear regression data over a prolonged period of time. This approach presents the inclusion of memory cells and three distinct gates, namely the input gate, forget gate, and output gate, which enable the neural network to effectively store, discard, and utilize information throughout sequential data. This allows the approach to effectively capture both immediate and prolonged relationships within the data.
4.3. Numerical Evaluation
The criterion adopted for numerical evaluation of predicting outcomes utilizing the aforementioned methodologies is the root mean square error (RMSE). The equation that represents the root mean square error (RMSE) is expressed as follows:
where represents the current observation, whereas represents the anticipated value derived from the model. The RMSE is employed as a last step in the evaluation of the prognostic model. It is utilized to compare the performance of different models under varying training criteria, with the aim of better assessing their effectiveness in real-world industrial scenarios.
5. Results and Discussion
5.1. Unbalance Diagnosis and Monitoring
Based on the above reasoning, a greater than 50% abrupt increase in the residual e or the e/f value over 1/3 is designated as the chosen metric for identifying significant shifts in the system, necessitating the re-evaluation of full or partial model parameters. From the calculations of feature errors, it is justified that the model parameters at bearing #16′s side have deviated from the physical model, which includes bearing constants and unbalances. Four different cases, as previously described, are run and compared in this section.
Table 1 lists the re-identified model parameters for the four cases using the three-day dataset. In case 1, only bearing #16 (subscript 2) was chosen for re-identification of parameters, and in case 2, the unbalance and bearing on the #16 side were both re-identified. This decision was made on the belief that the second bearing location would be significantly more impacted following the replacement, as indicated by the findings presented in Figure 4. The units for C, k, U, and α in Table 1 are respectively kNsm−1, MN m−1, g.mm, and degree.
Upon the repetition of unbalance identification and monitoring in phase II, incorporating the re-identified model constants given in Table 1, the development of unbalance for the remaining days is conducted, and subsequently, the residual is recalculated for four cases and compared in Figure 6. This figure illustrates a very significant drop, compared to the original, in the total new residual for all cases. e/f values fall below 1/3 for all four cases, and cases 1 and 2 exhibit lesser error ratios than the other two. The reduction of total error partially proves the superiority of model adaptability over the original method, and it indicates that the process of re-identifying the model’s parameters plays a crucial role in ensuring that the residual value remains within acceptable limits.
While conducting an analysis, it was determined that the new adaptive approach employed in cases performed really well and resulted in an overall decrease of the residual in all cases. Particularly, cases 1 and 2 both demonstrated exceptionally good results, as can be seen from Table 2. Case 1 demonstrated a decrease in the average residual by around 53.95% compared to the original, whereas Case 2 exhibited an even greater reduction of 55.12%. Furthermore, it is noteworthy that the average error has exhibited a substantial decrease from the original 4.5980 to 2.0926 μm in case 1, and even less than 2.0174 μm in case 2. Additionally, the absolute sum of residual errors in case 2 over the whole operational day is also the lowest. This suggests that case 2 is the most suitable one for the current situation, which may also be ascribed to the fact that only the feature of bearing #16 was inaccurate, as observed earlier in Figure 4. This shows greater significance in adjusting the bearing parameters and unbalances in #16.
From the results of Table 2, it proves that using the individual feature errors as a gauge at two bearings for parameter selection appears to be appropriate and useful since cases 1 and 2 showed a lesser error than the others. The progression of unbalances at two bearing planes following the implementation of the adaptive model-based approach utilizing the assessed parameters from Case 2 as compared with the original one in [19] is shown in Figure 7. The diagnosed unbalance at bearing plane #15 remains about the same as that in [19] because #15 parameters have not been changed. However, there is a noticeable drop in the values of U2 and α2 after the re-run of phase II using new parameters. Figure 8 illustrates the diagnosed static and dynamic unbalances varying with time. As seen, the static unbalance remains about the same except for about 15-degrees’ phase difference due to the changes in #16, but the dynamic unbalance reduces about 25% in magnitude after changing bearing #16′s parameters.
To show the improvement of feature errors at #16, the calculated four response components uc, us, vs, vc, through all the operational days are compared with the measured ones in Figure 9. It can be observed from the figure that, in contrast to Figure 4, the discrepancy between physical calculations and real measurements is significantly reduced, especially uc.
5.2. Monitoring and Prognostics
Once the alignment between the physical model and the real system has been ensured, the model can be utilized for unbalance prediction, enabling a more accurate assessment of future unbalance. This not only enhances the overall reliability of the system, but it also contributes to its safe and timely maintenance. In this context, forecasting serves as a crucial instrument for preemptively predicting the future behavior of the system. For monitoring and prognostic analysis, both the ARIMA and LSTM models have been established in this study. The LSTM model performs generally well when there is a large data history available, whereas ARIMA is better suited for smaller datasets. The LSTM model is more complex in nature; it needs careful tuning of hyper-parameters to give accurate results, but it is more suitable for long-term forecasting results. Nevertheless, ARIMA is more accurate for short-term forecasts.
The prognostic algorithm was constructed using the MATLAB 2022 program for both short-term and long-term forecasts. For the case of daily forecasts, the online running of the code developed in MATLAB follows a specific methodology. Initially, the model is trained using data from the first 90 days. Subsequently, a 30-day prediction is generated. This process is then repeated daily, with each new day’s data being incorporated into the training dataset using an expanding window approach. The reason for using expanding windows over sliding windows is due to the fact that expanding windows seem to generate better forecasts compared to the others [39]. This allows for the continuous updating of the model. Finally, the model is utilized to forecast for the subsequent 60-day period, for a total of 460 days. The selection of the suitable ARIMA model was based on the analysis of the autocorrelation function (ACF) and partial autocorrelation function (PACF), as outlined in reference [39]. The chosen ARIMA model had (p,d,q) parameters set to (3,1,3).
Additionally, three distinct LSTM models were constructed, each with varying numbers of hidden units: 50, 55, and 64. A dropout rate of 0.2 was applied to all models. These models address the task of forecasting by optimizing using the “best validation loss” criterion and the “adam” optimizer function. These LSTM models are trained for 200 epochs. The unbalanced data input to the forecasting model was first smoothed with the help of the function called “smooth” in the MATLAB Curve Fitting Toolbox with “rlowess”, which is a robust linear regression function defined over a pre-defined window length. This pre-processing step was performed to eliminate noise from the data.
The comparison of the models employed is presented in Table 3, indicating that ARIMA exhibits a smaller RMSE compared to LSTM for the present unbalanced forecast model when forecasting for a shorter time horizon, such as daily or weekly forecasts. However, LSTM comparatively gives a better prediction than the ARIMA model for a longer time horizon, justifying the cases of both ARIMA and LSTM in different scenarios. Nevertheless, it was also observed that the change of different hyper-parameters in LSTM exhibited changes in the RMSE, as shown in Table 3. The LSTM model with hidden unit nodes 50, 55, and 64 has different RMSE values, which signifies that a more accurate forecast value can be obtained by optimizing the different hyper-parameters.
Figure 10 depicts the daily online predictions of static and dynamic unbalance and their respective phase angles (Ug, αg, Ud, αd) achieved by the utilization of the adaptive technique in case 2 with the help of the ARIMA forecasting model. For monitoring and prognostic system analysis, the case 2 adaptive model is employed due to the fact that its residual exhibits the smallest magnitude when compared to other cases. From Figure 10, it is also noticed that the forecasted curve surprisingly overlaps the real-life one, which ensures the accuracy of the prediction. The final portion of the curve is the estimated unbalanced faults for the forthcoming 60 days. It can serve as a prognostic tool for rotor unbalance and help engineers establish a safe and reliable maintenance strategy.
6. Conclusions
In this research, a novel adaptive model-based monitoring and prognostic system for rotor-bearing unbalance faults is constructed. The adaptive model is then evaluated utilizing the operational data collected from sensors at the two bearings in order to assess its validity and degree of similarity to the actual system. The model has the ability to re-identify the bearing parameters whenever the residual of the system increases over a preset percentage or the ratio of residual over feature sum exceeds a certain value. In this study, the index was set: the residual jumps over 50% or the ratio of residual over feature-sum (e/f) exceeds 1/3 for three consecutive days. Numerical results also prove that using individual features’ errors as a gauge for determining whether full or partial model parameters need to be re-identified is appropriate. It was discovered that the newly developed adaptive system is superior and has the capability of readily modifying itself whenever the variance between the system model and the actual model is high. According to the investigation results, the present adaptive model significantly reduces the overall residual by up to 55.12 percent. The prognostic system that is produced from the adaptive model has the potential to make the system more accurate in unbalanced monitoring, which also contributes to more accurate predictions for the future. Both ARIMA and LSTM-based forecasting models were employed, and it was observed that the ARIMA-based method gives better short-term predictions, while LSTM gives longer-term predictions in the present case. However, it was also observed that tuning parameters in LSTM can result in a change in the RMSE value. In the future, more accurate parameter tuning can be performed to have a precise forecasting model. Overall, the adaptive model makes the system as a whole more dependable, and it would assist in timely maintenance-based action and provide more usefulness to the industry.
Author Contributions
Conceptualization and methodology, S.-C.H.; software, C.-L.L.; formal analysis and validation, B.B. and M.N.; investigation and resources, S.-C.H.; writing—original draft preparation, B.B. and M.N.; writing—review and editing, S.-C.H. All authors have read and agreed to the published version of this manuscript.
Funding
This research received no external funding.
Data Availability Statement
The data are not publicly available due to privacy.
Acknowledgments
The authors are grateful to Taiwan’s National Science and Technology Council (NSTC) for the support of this research under Project No. MOST 111-2221-E-131-014.
Conflicts of Interest
The authors declare no conflict of interest.
References
- Zhao, B.; Yuan, Q. Improved generative adversarial network for vibration-based fault diagnosis with imbalanced data. Measurement 2021, 169, 108522. [Google Scholar] [CrossRef]
- Tiboni, M.; Remino, C.; Bussola, R.; Amici, C. A review on vibration-based condition monitoring of rotating machinery. Appl. Sci. 2022, 12, 972. [Google Scholar] [CrossRef]
- Sidar, R.; Sen, P.K.; Sahu, G. Review of vibration based fault diagnosis in rolling element bearing and vibration analysis techniques. Int. J. Sci. Res. Eng. Technol. 2015, 4, 998–1003. [Google Scholar]
- Elbhbah, K.; Sinha, J.K. Vibration-based condition monitoring of rotating machines using a machine composite spectrum. J. Sound Vib. 2013, 332, 2831–2845. [Google Scholar] [CrossRef]
- Lees, A.; Sinha, J.; Friswell, M. Model-based identification of rotating machines. Mech. Syst. Signal Process. 2009, 23, 1884–1893. [Google Scholar] [CrossRef]
- Jalan, A.K.; Mohanty, A. Model based fault diagnosis of a rotor–bearing system for misalignment and unbalance under steady-state condition. J. Sound Vib. 2009, 327, 604–622. [Google Scholar] [CrossRef]
- Devendiran, S.; Manivannan, K. Vibration based condition monitoring and fault diagnosis technologies for bearing and gear components-a review. Int. J. Appl. Eng. Res. 2016, 11, 3966–3975. [Google Scholar]
- Yan, R.; Gao, R.X.; Chen, X. Wavelets for fault diagnosis of rotary machines: A review with applications. Signal Process. 2014, 96, 1–15. [Google Scholar] [CrossRef]
- Peng, Z.; Peter, W.T.; Chu, F. A comparison study of improved Hilbert–Huang transform and wavelet transform: Application to fault diagnosis for rolling bearing. Mech. Syst. Signal Process. 2005, 19, 974–988. [Google Scholar] [CrossRef]
- Liu, R.; Yang, B.; Zio, E.; Chen, X. Artificial intelligence for fault diagnosis of rotating machinery: A review. Mech. Syst. Signal Process. 2018, 108, 33–47. [Google Scholar] [CrossRef]
- Seshadrinath, J.; Singh, B.; Panigrahi, B.K. Vibration analysis based interturn fault diagnosis in induction machines. IEEE Trans. Ind. Inform. 2013, 10, 340–350. [Google Scholar] [CrossRef]
- Casimir, R.; Boutleux, E.; Clerc, G.; Yahoui, A. The use of features selection and nearest neighbors rule for faults diagnostic in induction motors. Eng. Appl. Artif. Intell. 2006, 19, 169–177. [Google Scholar] [CrossRef]
- Sun, W.; Shao, S.; Zhao, R.; Yan, R.; Zhang, X.; Chen, X. A sparse auto-encoder-based deep neural network approach for induction motor faults classification. Measurement 2016, 89, 171–178. [Google Scholar] [CrossRef]
- Han, T.; Yang, B.-S.; Choi, W.-H.; Kim, J.-S. Fault diagnosis system of induction motors based on neural network and genetic algorithm using stator current signals. Int. J. Rotating Mach. 2006, 2006, 061690 . [Google Scholar] [CrossRef]
- Su, H.; Chong, K.T. Induction machine condition monitoring using neural network modeling. IEEE Trans. Ind. Electron. 2007, 54, 241–249. [Google Scholar] [CrossRef]
- Janssens, O.; Slavkovikj, V.; Vervisch, B.; Stockman, K.; Loccufier, M.; Verstockt, S.; Van de Walle, R.; Van Hoecke, S. Convolutional neural network based fault detection for rotating machinery. J. Sound Vib. 2016, 377, 331–345. [Google Scholar] [CrossRef]
- Kumar, P.; Hati, A.S. Review on machine learning algorithm based fault detection in induction motors. Arch. Comput. Methods Eng. 2021, 28, 1929–1940. [Google Scholar] [CrossRef]
- Lei, Y.; Yang, B.; Jiang, X.; Jia, F.; Li, N.; Nandi, A.K. Applications of machine learning to machine fault diagnosis: A review and roadmap. Mech. Syst. Signal Process. 2020, 138, 106587. [Google Scholar] [CrossRef]
- Lin, C.-L.; Liang, J.-W.; Huang, Y.-M.; Huang, S.-C. A novel model-based unbalance monitoring and prognostics for rotor-bearing systems. Adv. Mech. Eng. 2023, 15, 16878132221148019. [Google Scholar] [CrossRef]
- Markert, R.; Platz, R.; Seidler, M. Model based fault identification in rotor systems by least squares fitting. Int. J. Rotating Mach. 2001, 7, 311–321. [Google Scholar] [CrossRef]
- Platz, R.; Markert, R.; Seidler, M. Validation of online diagnostics of malfunctions in rotor systems. IMECHE Conf. Trans. 2000, 6, 581–590. [Google Scholar]
- Platz, R. Fault models for online identification of malfunctions in rotor systems. In Proceedings of the Survelliance 4-Acoustical and Vibratory Surveillance Methods and Diagnostic Techniques, Compiegne, France, 16–18 October 2001. [Google Scholar]
- Sekhar, A. Identification of unbalance and crack acting simultaneously in a rotor system: Modal expansion versus reduced basis dynamic expansion. J. Vib. Control 2005, 11, 1125–1145. [Google Scholar] [CrossRef]
- Jain, J.; Kundra, T. Model based online diagnosis of unbalance and transverse fatigue crack in rotor systems. Mech. Res. Commun. 2004, 31, 557–568. [Google Scholar] [CrossRef]
- Isermann, R. Model base fault detection and diagnosis methods. In Proceedings of the 1995 American Control Conference-ACC’95, Seattle, WA, USA, 21–23 June 1995; Volume 3, pp. 1605–1609. [Google Scholar]
- Bachschmid, N.; PENNACCHI, P.; Vania, A. Identification of multiple faults in rotor systems. J. Sound Vib. 2002, 254, 327–366. [Google Scholar] [CrossRef]
- Bachschmid, N.; Pennacchi, P. Accuracy of fault detection in real rotating machinery using model based diagnostic techniques. JSME Int. J. Ser. C Mech. Syst. Mach. Elem. Manuf. 2003, 46, 1026–1034. [Google Scholar] [CrossRef]
- Bently, D.E.; Hatch’Charles, T. Fundamentals of rotating machinery diagnostics. Mech. Eng. CIME 2003, 125, 53–54. [Google Scholar]
- Zhang, J.H.; Ma, L.; Lin, J.W.; Zhang, G.C. Dynamic analysis of flexible rotor-ball bearings system with unbalance-misalignment-rubbing coupling faults. Appl. Mech. Mater. 2012, 105, 448–453. [Google Scholar] [CrossRef]
- Ganeriwala, S.N.; Schwarz, B.; Richardson, M.H. Operating deflection shapes detect unbalance in rotating equipment. Sound Vib. 2009, 43, 11–13. [Google Scholar]
- Edwards, S.; Lees, A.; Friswell, M. Estimating rotor unbalance from a single run-down. IMeche Conf. Trans. 2000, 6, 323–334. [Google Scholar]
- Randall, R.B. State of the art in monitoring rotating machinery-part 1. Sound Vib. 2004, 38, 14–21. [Google Scholar]
- Walker, R.; Perinpanayagam, S.; Jennions, I.K. Physics-based simulation for health management of rotating machinery. In Proceedings of the 8th International Conference on Condition Monitoring and Machinery Failure Prevention Technologies, Cardiff Bay, UK, 20–22 June 2011; pp. 647–658. [Google Scholar]
- Sudhakar, G.; Sekhar, A. Identification of unbalance in a rotor bearing system. J. Sound Vib. 2011, 330, 2299–2313. [Google Scholar] [CrossRef]
- Tiwari, R.; Chakravarthy, V. Simultaneous estimation of the residual unbalance and bearing dynamic parameters from the experimental data in a rotor-bearing system. Mech. Mach. Theory 2009, 44, 792–812. [Google Scholar] [CrossRef]
- Mutra, R.R. An optimized bearing parameter identification approach from vibration response spectra. J. Vibroengineering 2019, 21, 1519–1532. [Google Scholar] [CrossRef]
- Lv, Y.; Zhao, W.; Zhao, Z.; Li, W.; Ng, K.K. Vibration signal-based early fault prognosis: Status quo and applications. Adv. Eng. Inform. 2022, 52, 101609. [Google Scholar] [CrossRef]
- Lee, J.; Wu, F.; Zhao, W.; Ghaffari, M.; Liao, L.; Siegel, D. Prognostics and health management design for rotary machinery systems—Reviews, methodology and applications. Mech. Syst. Signal Process. 2014, 42, 314–334. [Google Scholar] [CrossRef]
- Bera, B.; Lin, C.-L.; Huang, S.-C.; Liang, J.-W.; Lin, P.T. Establishing a Real-Time Multi-Step Ahead Forecasting Model of Unbalance Fault in a Rotor-Bearing System. Electronics 2023, 12, 312. [Google Scholar] [CrossRef]
- Zhang, H.; Zhang, Q.; Shao, S.; Niu, T.; Yang, X. Attention-based LSTM network for rotatory machine remaining useful life prediction. IEEE Access 2020, 8, 132188–132199. [Google Scholar] [CrossRef]
- Kennedy, J.; Eberhart, R. Particle swarm optimization. In Proceedings of the ICNN’95-International Conference on Neural Networks, Perth, Australia, 27 November–1 December 1995; Volume 4, pp. 1942–1948. [Google Scholar]
- Gad, A.G. Particle swarm optimization algorithm and its applications: A systematic review. Arch. Comput. Methods Eng. 2022, 29, 2531–2561. [Google Scholar] [CrossRef]
- Bera, B.; Huang, S.-C.; Ling, C.-L.; Lian, J.-W.; Lin, P.T. Online Real-Time Rotating Unbalance Forecast Incorporating Model-Based with Machine Learning Techniques. In Proceedings of the 2023 9th International Conference on Applied System Innovation (ICASI), Chiba, Japan, 21–25 April 2023; pp. 86–88. [Google Scholar] [CrossRef]
Figure 1.
Schematic diagram of turbine-bearing rotor dimensions and coordinates [19].
Figure 1.
Schematic diagram of turbine-bearing rotor dimensions and coordinates [19].

Figure 2.
Comparison of feature sum vs residual for the case of [19].
Figure 2.
Comparison of feature sum vs residual for the case of [19].

Figure 3.
Comparison of estimated and real features at bearing #15.

Figure 4.
Comparison of estimated and real features at bearing #16.

Figure 5.
Flowchart of adaptive model-based system.
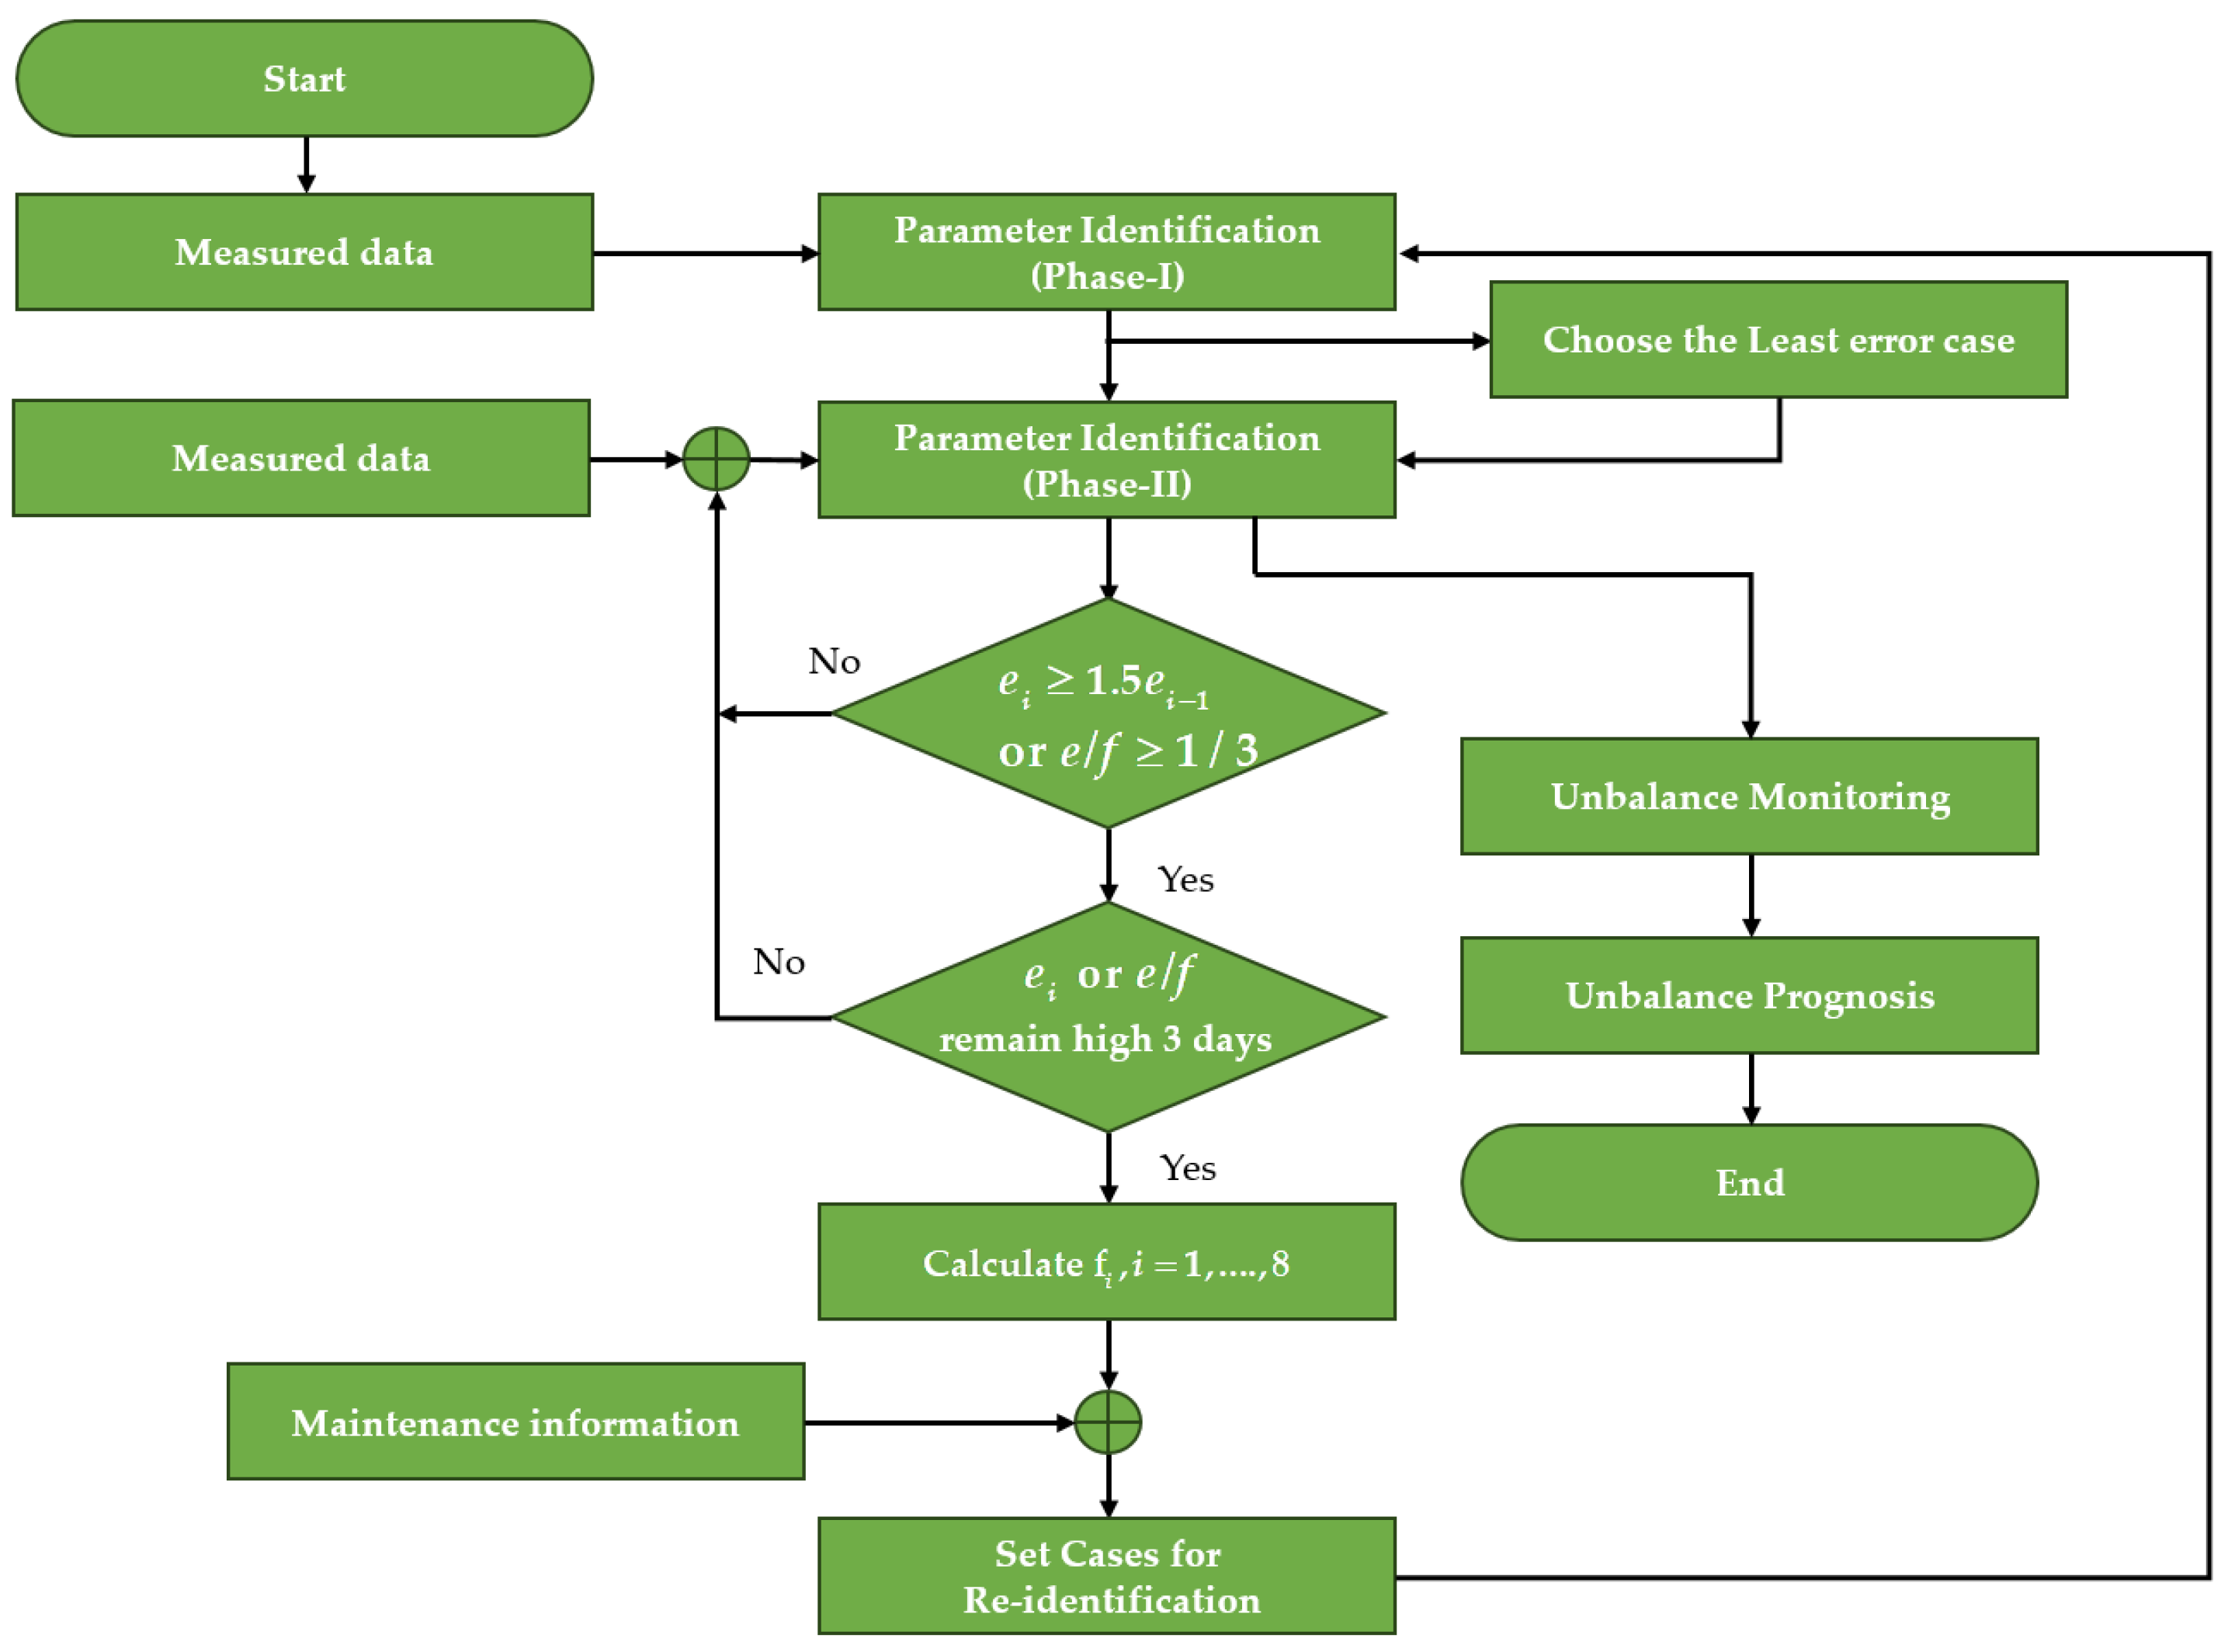
Figure 6.
Comparison between the new residual and the old residual for four cases.

Figure 7.
Unbalanced development at two bearing planes in case 2.
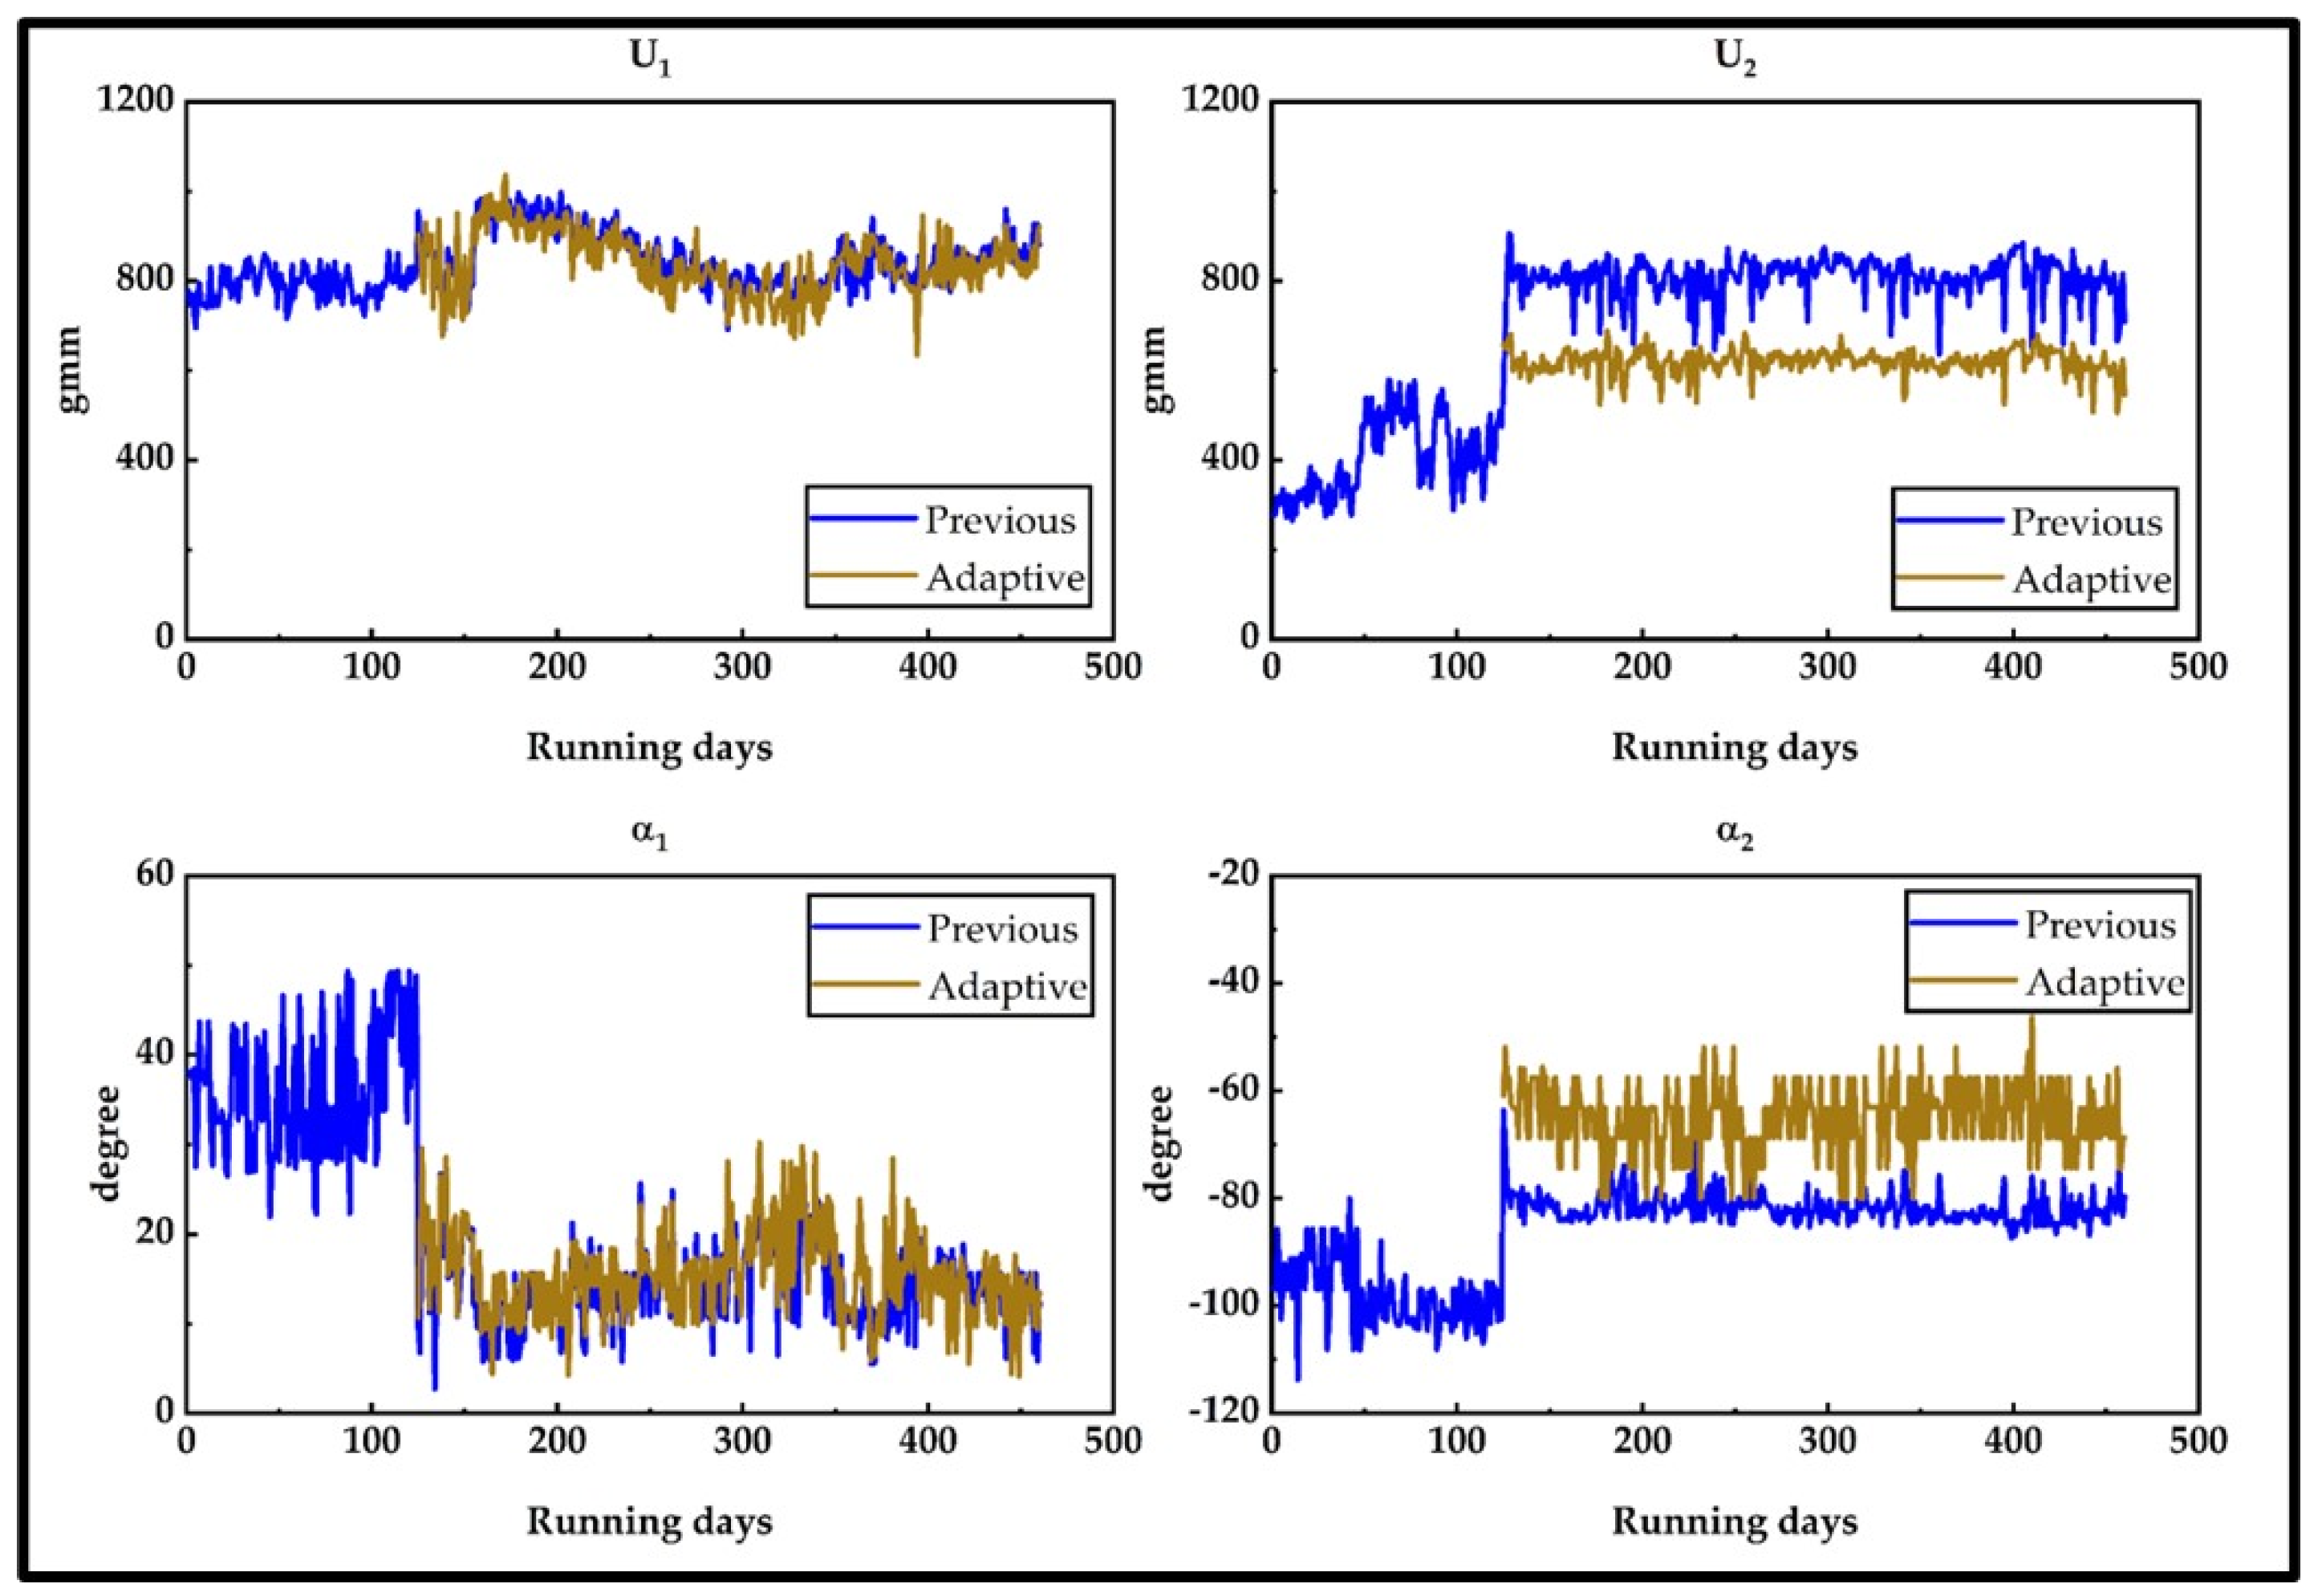
Figure 8.
Static and Dynamic unbalanced development of case 2.
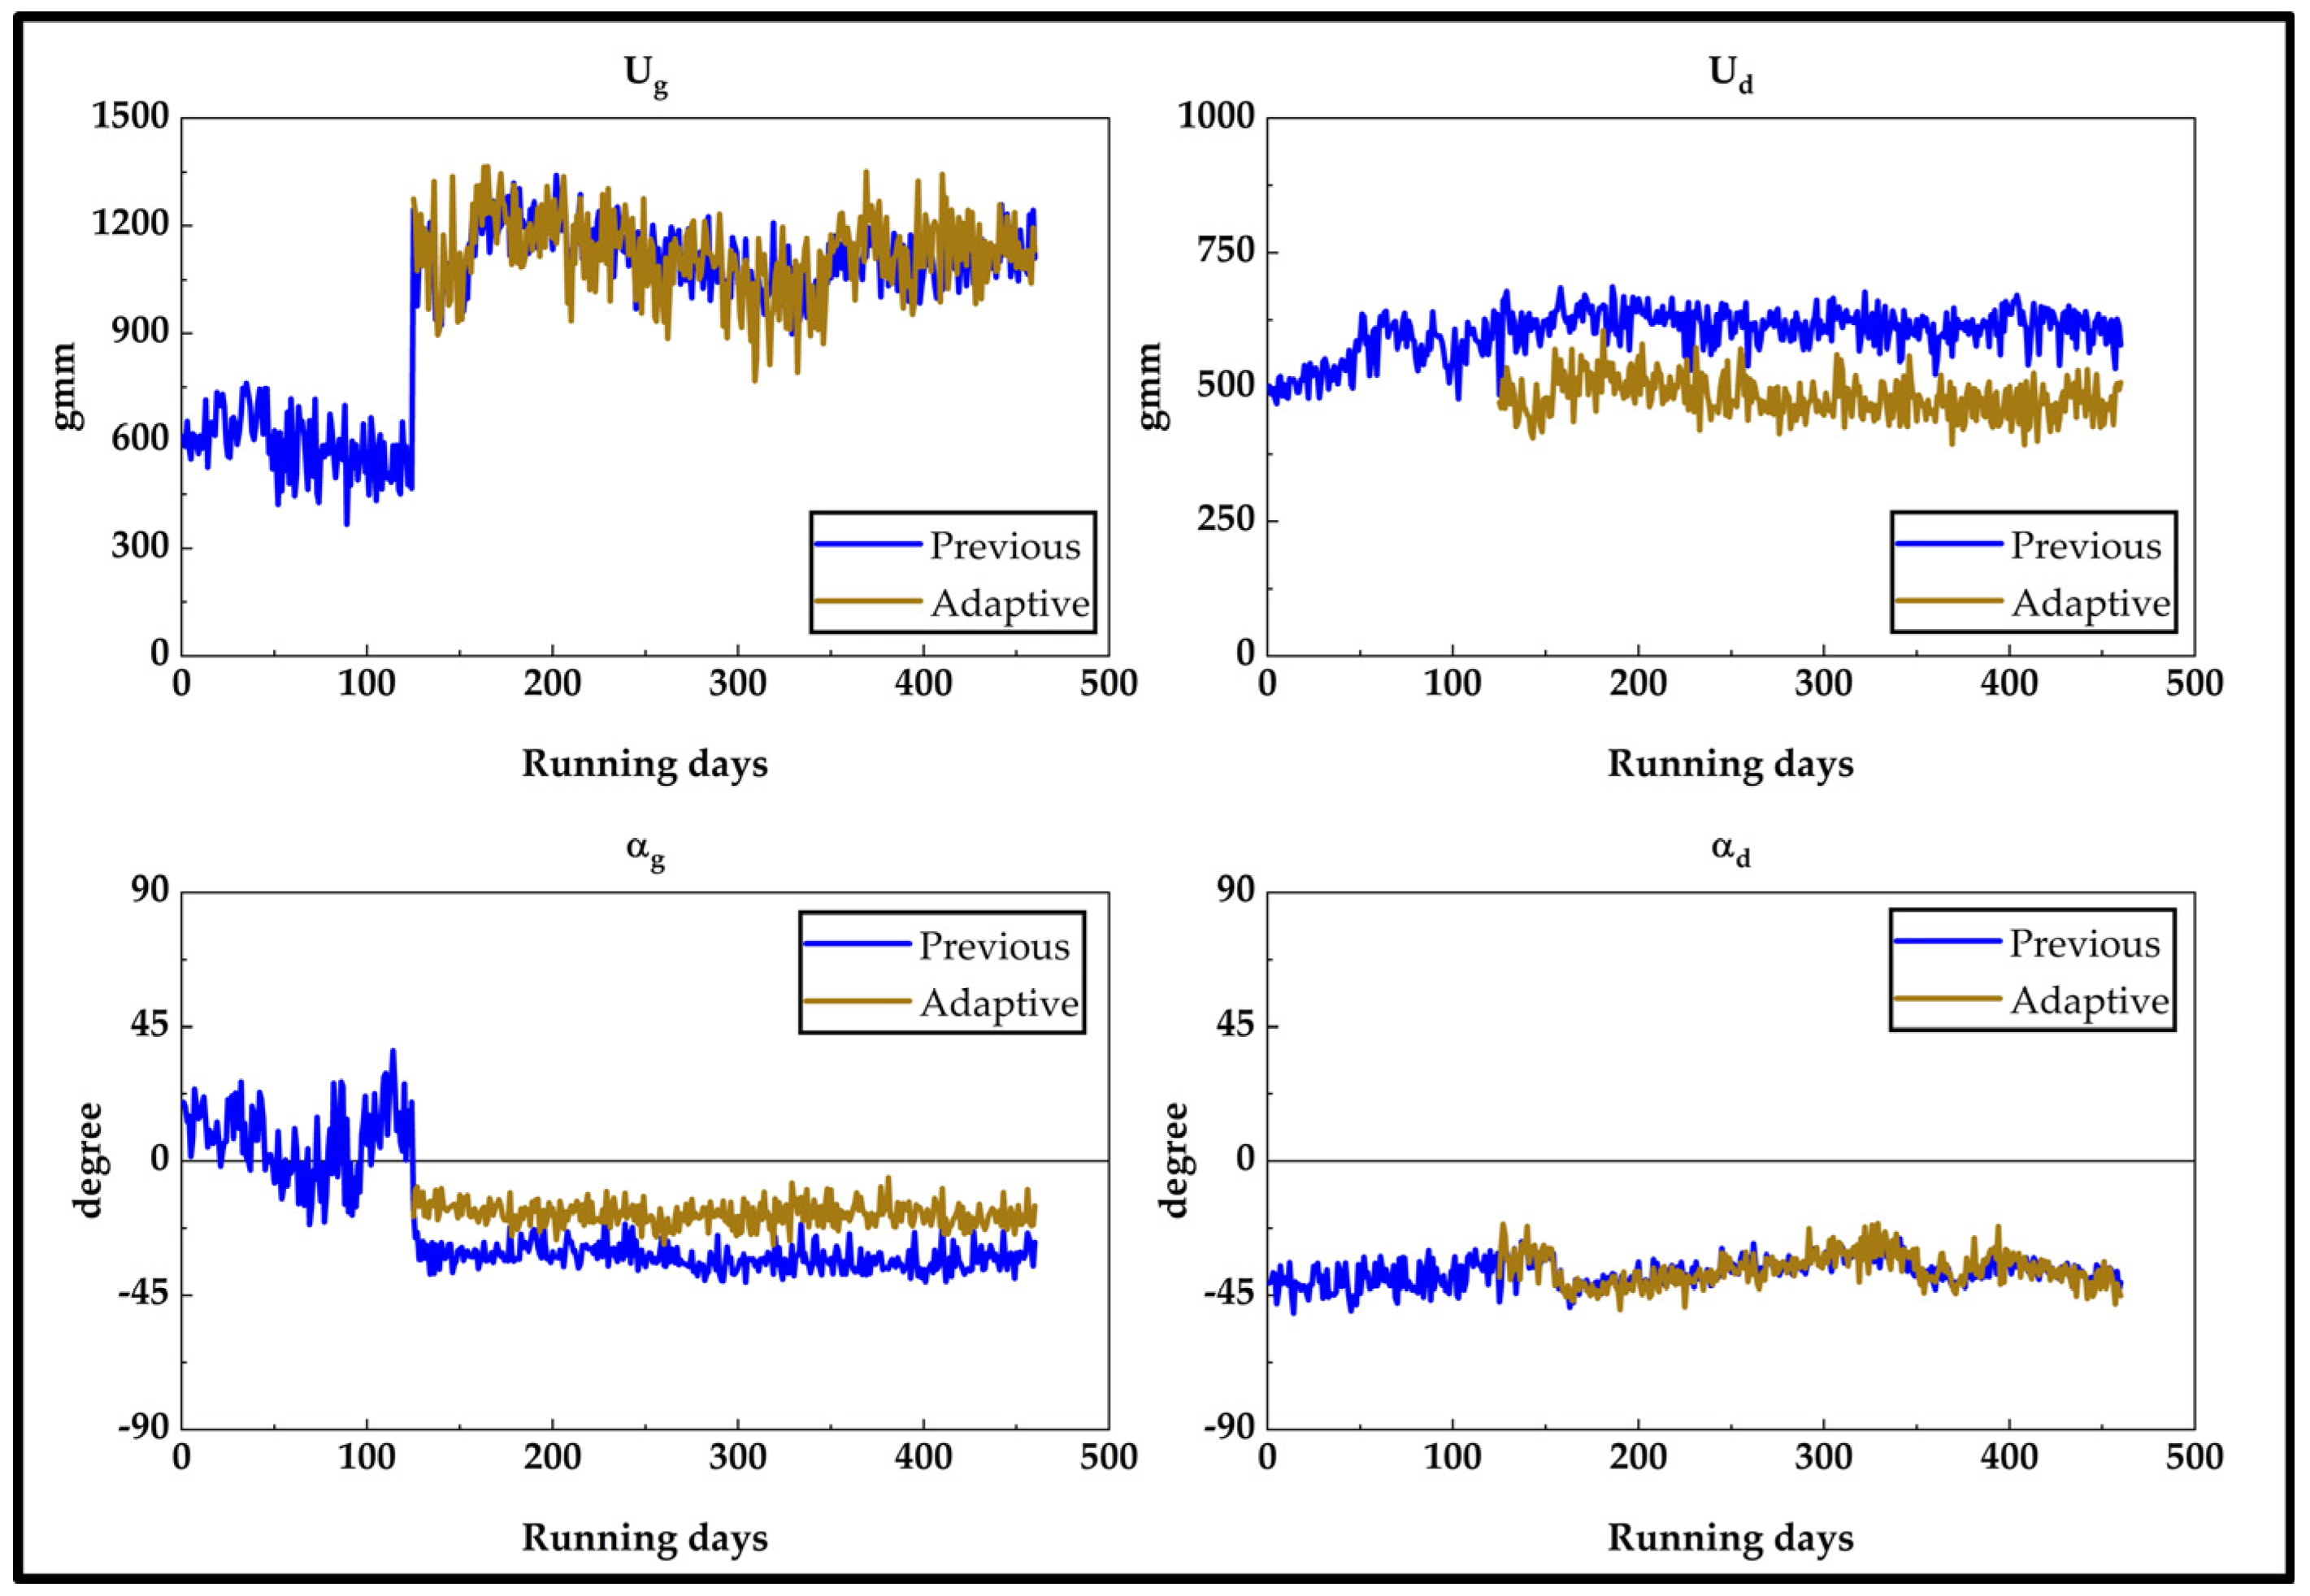
Figure 9.
Comparison of calculated and real features at bearing #16 employing the parameters of case 2.
Figure 9.
Comparison of calculated and real features at bearing #16 employing the parameters of case 2.
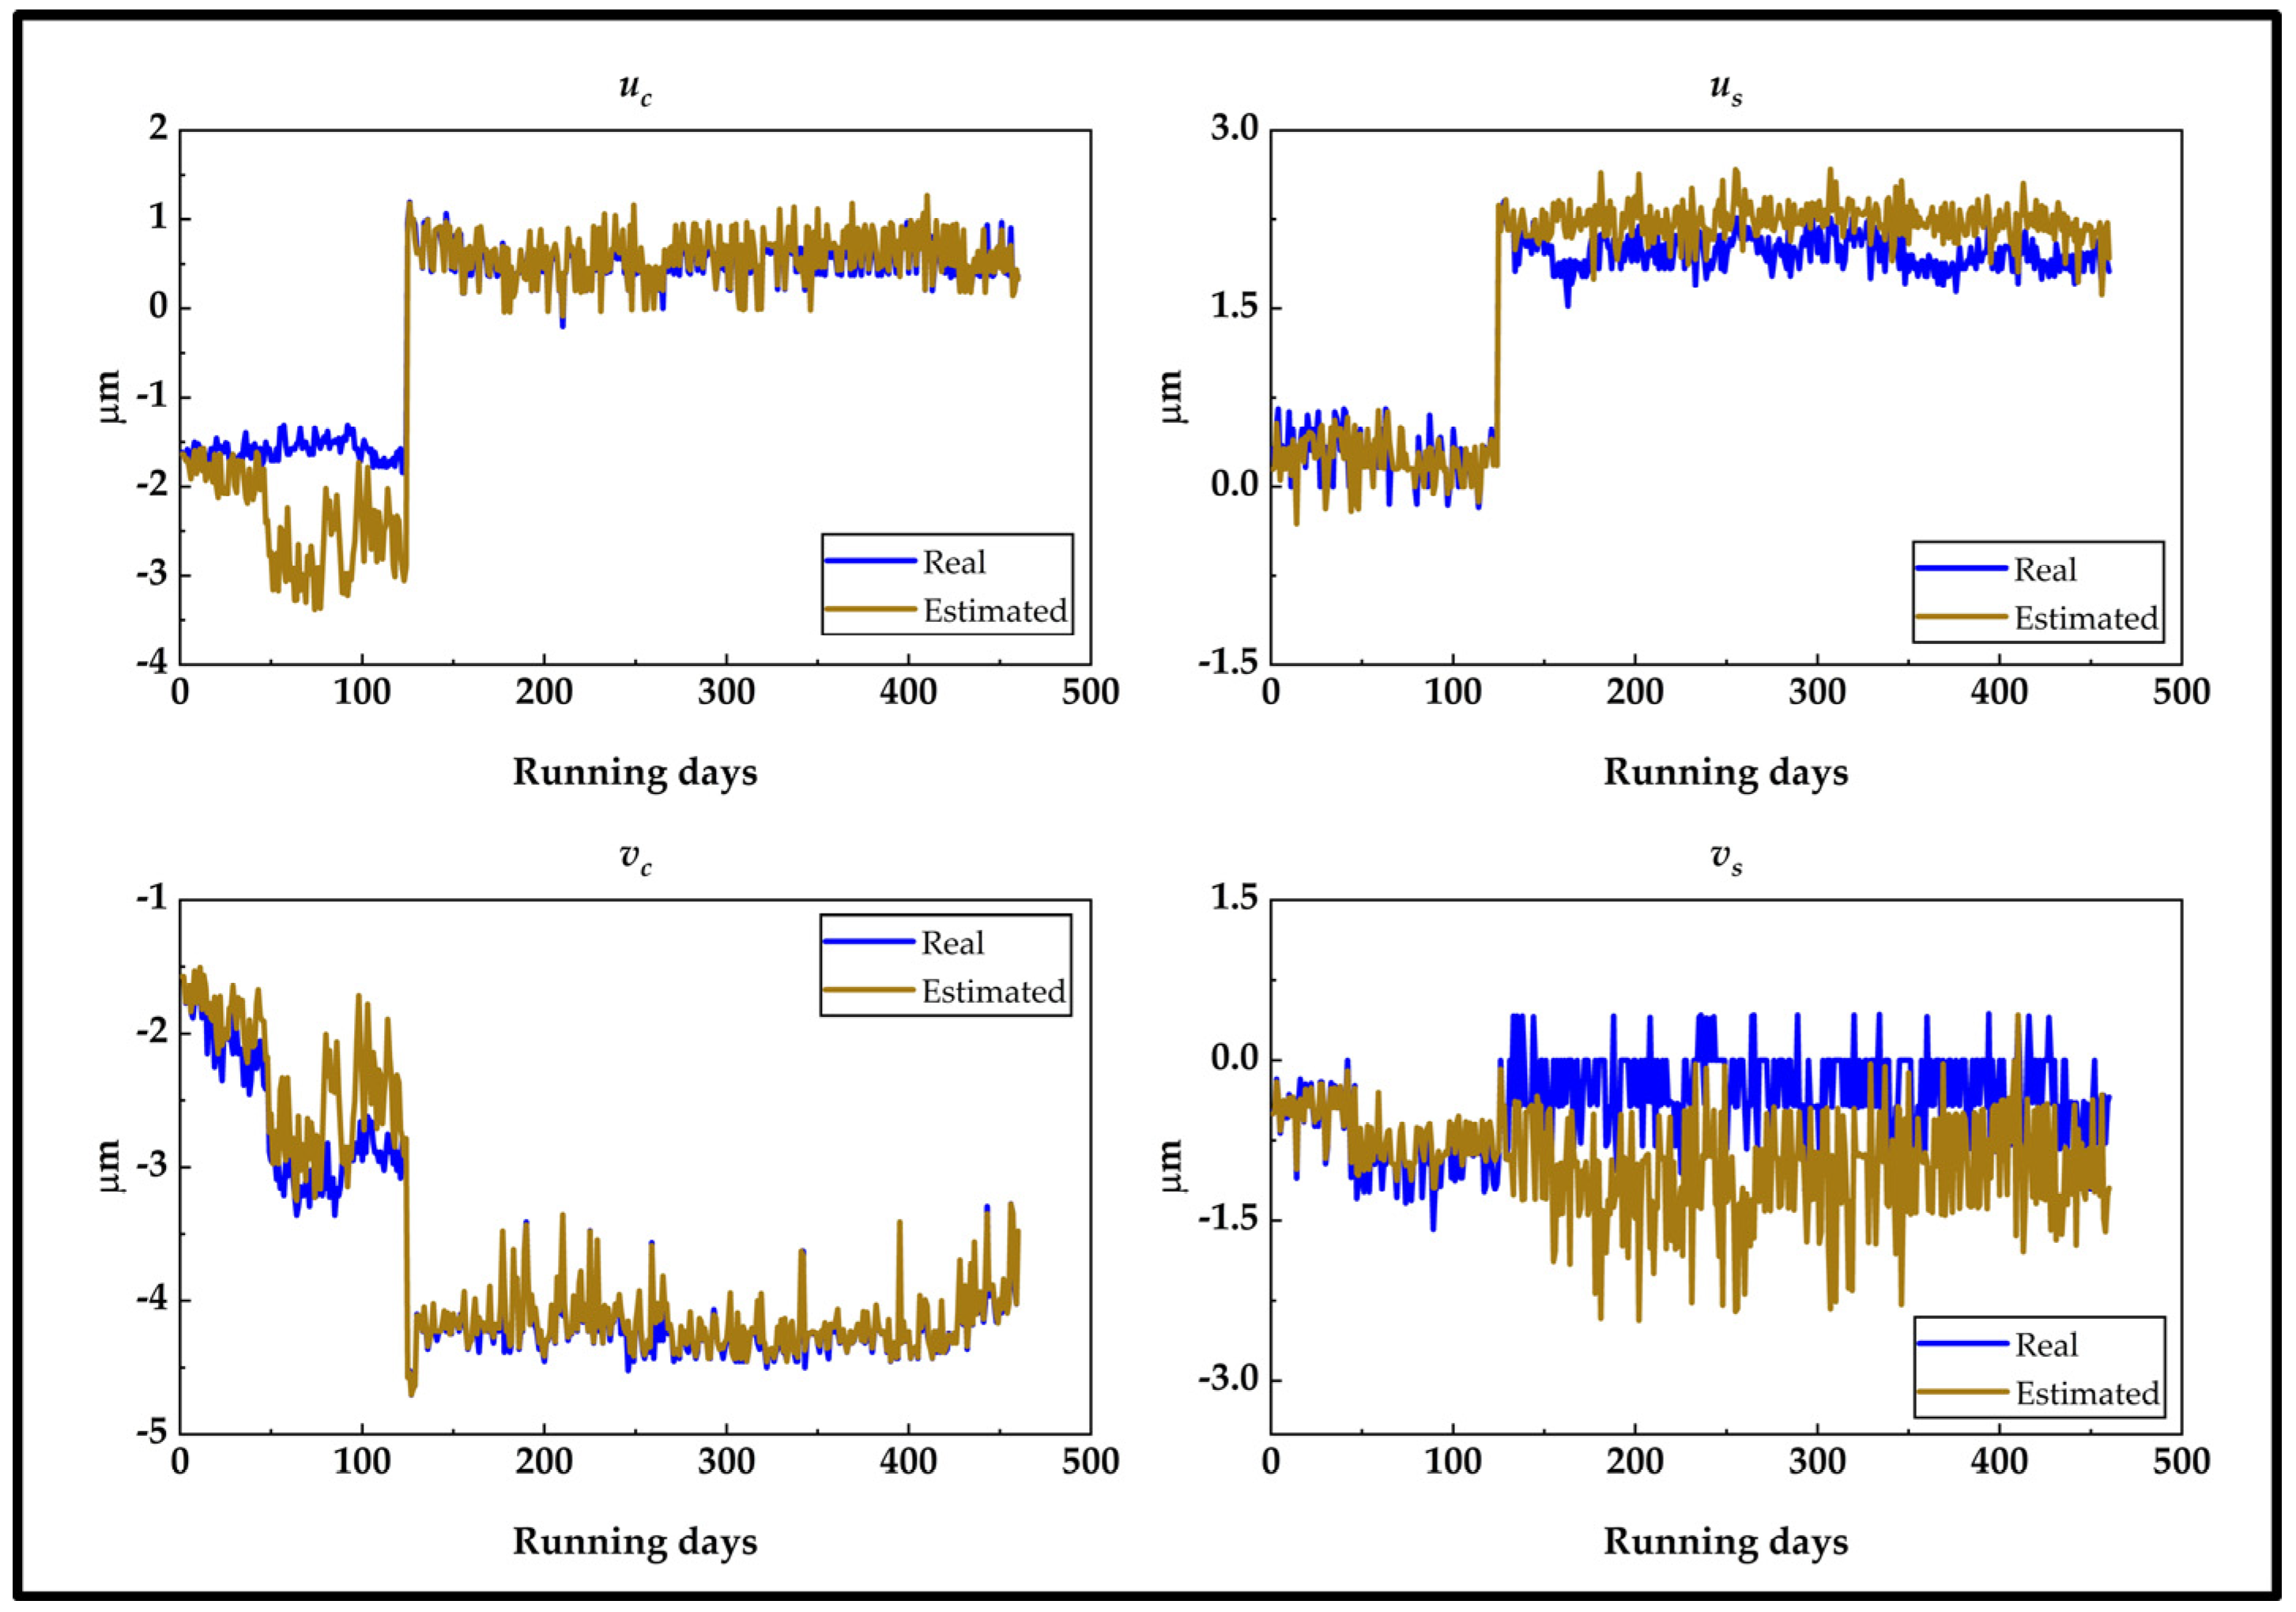
Figure 10.
Prognosis of unbalance in case 2.


Table 1.
Newly identified parameters for four cases.
| Cases | Cx1 | Cy1 | kx1 | ky1 | U1 | α1 | Cx2 | Cy2 | kx2 | ky2 | U2 | α2 |
|---|---|---|---|---|---|---|---|---|---|---|---|---|
| 1 | - | - | - | - | - | - | 2 × 10³ | 7.7 × 10⁴ | 3.5 × 10⁸ | 1.9 × 10⁸ | - | - |
| 2 | - | - | - | - | - | - | 2.7 × 10⁴ | 8 × 10⁴ | 3.5 × 10⁸ | 1.9 × 10⁸ | 650 | −57 |
| 3 | 2 × 10⁵ | 7.86 × 10⁴ | 1.89 × 10⁸ | 3.5 × 10⁸ | - | - | 2 × 10³ | 2 × 10³ | 1.6 × 10⁸ | 1.2 × 10⁸ | - | - |
| 4 | 1.4 × 10⁵ | 5.57 × 10⁴ | 1.32 × 10⁸ | 2.6 × 10⁸ | 502. | 35.0 | 2 × 10³ | 6.4 × 10⁴ | 3.1 × 10⁸ | 1.8 × 10⁸ | 600 | −62 |
Table 2.
Comparison of residuals of four cases (the red color represents the case with the least one).
Table 2.
Comparison of residuals of four cases (the red color represents the case with the least one).
| Cases | Average Residual (μm) | Absolute Sum of Total Residual (μm) | Percentage Residual Reduction (%) |
|---|---|---|---|
| 1 | 2.0926 | 703.12 | 53.95 |
| 2 | 2.0174 | 677.84 | 55.12 |
| 3 | 2.7382 | 920.02 | 43.82 |
| 4 | 2.9015 | 974.92 | 41.04 |
Table 3.
Comparisons of RMSE using two methods (red represents the least RMSE).
| Forecast | Model | RMSE Values | |||
|---|---|---|---|---|---|
| Ug | αg | Ud | αd | ||
| Daily | ARIMA (3,1,3) | 13.4639 | 0.5299 | 3.4743 | 0.3886 |
| LSTM (50) | 17.5981 | 1.0907 | 6.1918 | 0.8012 | |
| LSTM (55) | 14.9406 | 1.0627 | 5.0965 | 0.8186 | |
| LSTM (64) | 16.2910 | 1.2851 | 5.2719 | 0.8432 | |
| One Week | ARIMA (3,1,3) | 24.5688 | 1.9026 | 10.8808 | 1.3376 |
| LSTM (50) | 28.4997 | 1.5144 | 11.5623 | 1.6051 | |
| LSTM (55) | 30.8223 | 1.6213 | 11.78062 | 1.6285 | |
| LSTM (64) | 30.7599 | 1.5775 | 11.7438 | 1.5777 | |
| One Month | ARIMA (3,1,3) | 88.0832 | 8.1978 | 50.0537 | 5.8823 |
| LSTM (50) | 100.4109 | 5.9453 | 49.9060 | 6.1574 | |
| LSTM (55) | 92.8987 | 6.2579 | 50.8300 | 6.0797 | |
| LSTM (64) | 96.1129 | 5.9020 | 49.1724 | 6.1431 | |
| Two Months | ARIMA (3,1,3) | 130.2160 | 9.7533 | 66.8236 | 8.0524 |
| LSTM (64) | 131.9359 | 6.1146 | 59.9396 | 9.0648 | |
| LSTM (55) | 126.3275 | 6.0103 | 62.2515 | 8.6632 | |
| LSTM (50) | 129.7200 | 6.1129 | 56.6076 | 8.3724 | |
Disclaimer/Publisher’s Note: The statements, opinions and data contained in all publications are solely those of the individual author(s) and contributor(s) and not of MDPI and/or the editor(s). MDPI and/or the editor(s) disclaim responsibility for any injury to people or property resulting from any ideas, methods, instructions or products referred to in the content. |
© 2023 by the authors. Licensee MDPI, Basel, Switzerland. This article is an open access article distributed under the terms and conditions of the Creative Commons Attribution (CC BY) license (https://creativecommons.org/licenses/by/4.0/).
Share and Cite
MDPI and ACS Style
Bera, B.; Huang, S.-C.; Najibullah, M.; Lin, C.-L. An Adaptive Model-Based Approach to the Diagnosis and Prognosis of Rotor-Bearing Unbalance. Machines 2023, 11, 976. https://doi.org/10.3390/machines11100976
AMA Style
Bera B, Huang S-C, Najibullah M, Lin C-L. An Adaptive Model-Based Approach to the Diagnosis and Prognosis of Rotor-Bearing Unbalance. Machines. 2023; 11(10):976. https://doi.org/10.3390/machines11100976
Chicago/Turabian StyleBera, Banalata, Shyh-Chin Huang, Mohammad Najibullah, and Chun-Ling Lin. 2023. "An Adaptive Model-Based Approach to the Diagnosis and Prognosis of Rotor-Bearing Unbalance" Machines 11, no. 10: 976. https://doi.org/10.3390/machines11100976
Note that from the first issue of 2016, this journal uses article numbers instead of page numbers. See further details here.