Article

Damage Identification for Railway Tracks Using Onboard Monitoring Systems in In-Service Vehicles and Data Science

1
CONSTRUCT—LESE, Faculty of Engineering, University of Porto, 4200-465 Porto, Portugal
2
CONSTRUCT—LESE, School of Engineering, Polytechnic of Porto, 4249-015 Porto, Portugal
*
Author to whom correspondence should be addressed.
Machines 2023, 11(10), 981; https://doi.org/10.3390/machines11100981
Submission received: 26 July 2023 / Revised: 12 October 2023 / Accepted: 17 October 2023 / Published: 23 October 2023
(This article belongs to the Special Issue High-Speed Railway Systems Technology)

Abstract

:
Nowadays, railway track monitoring strategies are based on the use of railway inspection vehicles and wayside dynamic monitoring systems. The latter sometimes requires traffic disruption, as well as higher time and cost-consumption activities, and the use of dedicated inspection vehicles is less economical and efficient as the use of in-service vehicles. Furthermore, the use of non-automated algorithms faces challenges when it comes to early damage detection in railway infrastructure, considering operational, environmental, and big data aspects, and may lead to false alarms. To overcome these challenges, the application of artificial intelligence (AI) algorithms for early detection of track defects using accelerations, measured by dynamic monitoring systems in in-service railway vehicles is attracting the attention of railway managers. In this paper, an AI-based methodology based on axle box acceleration signals is applied for the early detection of distributed damage to track in terms of the longitudinal level and lateral alignment. The methodology relies on feature extraction using an autoregressive model, data normalization using principal component analysis, data fusion and feature discrimination using Mahalanobis distance and outlier analysis, considering eight onboard accelerometers. For the numerical simulations, 75 undamaged and 45 damaged track scenarios are considered. The alert limit state defined in the European Standard for assessing track geometry quality is also assumed as a threshold. It was found that the detection accuracy of the AI-based methodology for different sensor layouts and types of damage is greater than 94%, which is acceptable.

1. Introduction

Distributed track geometry defects result from the degradation of the track support system, while the deterioration or failure of individual track components mainly causes isolated defects. Without suitable inspection and maintenance actions, the geometrical defects increase with the number of passages [1,2,3] influencing wheel–rail dynamic forces, passenger comfort, and running safety. Frýba [4] states that the vertical vibrations of vehicles are influenced by the longitudinal level and cross level of the track. Claus and Schiehlen [5], verify that structural vibrations of the railway bogie are mainly caused by track irregularities. In addition, the lateral alignment, gauge, and cross level induce transverse vibrations of vehicles and torsional dynamic effects on bridges.
To evaluate the geometrical track quality, inspection operations should be performed periodically. These actions can be categorized as: (i) on-site inspections through specific equipment and human resources or wayside monitoring; (ii) on-board monitoring using an inspection vehicle equipped with optical and inertial systems. Currently, the geometrical quality of railway tracks is monitored through railway inspection vehicles because wayside monitoring has higher costs [6,7,8,9,10,11] and leads to less accurate results. The track inspection vehicle measures several geometric parameters, such as the position using a GPS (Global Positioning System), the track curvature, the longitudinal level, and the alignment of both rails, the cross level, the gauge, and the twist [8]. However, these inspection vehicles are expensive and may not always be available for the whole of the railway line [7,12]. Furthermore, these vehicles do not circulate at the same speed as in-service railway vehicles, which sometimes causes traffic disruption. To overcome these limitations, drive-by monitoring and data-driven damage detection are being employed as inspection instruments. In this scenario, sensors, usually accelerometers, are attached to railway in-service vehicles to measure the dynamic response by specific vehicle elements, such as the axle box. This approach does not disrupt traffic and it can provide real-time information about the track condition, detecting potential defects at early stages.
Sun et al. [13], and Bosso et al. [14] highlighted the importance of using artificial intelligence (AI) algorithms as promising ways to address the data interpretation problem and damage detection. Memon et al. [15] developed and validated a web-based cloud system with acceptable accuracy for fault detection on tracks. Ren et al. [16] proposed a methodology for the detection of subgrade settlement on railway ballastless track, using vibrations signals, and an algorithm based on support vector machines (SVM), convolutional neural networks (CNN), and particle swarm optimization (PSO). Additionally, Ribeiro et al. [17] refer to the fact that the GA can deal with big data, i.e., a significant number of modal parameters. Lederman et al. [18] developed a data-driven methodology for damage detection on railway tracks using the dynamic responses of in-service passenger vehicles. The authors proposed the average signal energy using a sliding window and found that the effect of speed variation is one of the challenges. The disadvantage in the proposed approach is the need to localize the track damage, since the average values are influenced by extreme values in the measured data. Moreover, the algorithms developed by Malekjafarian et al. [19] and Lederman et al. [18] were validated for passenger railway in-service vehicles. The Ensemble Empirical Mode Decomposition (EEMD) was considered by Li and Shi [20] for the extraction of wavelength features of rail corrugation for later detection using a machine learning classifier. These authors used the simulated wheel dynamic responses regarding accelerations as the raw data. But the EEMD is commonly used for damage in the dynamic system involving non-linear and non-stationary vibration signals. Kostic and Gul [21] proposed a methodology for the detection of damage to footbridges under temperature effects, using artificial neural networks (ANN) and vibration measurements, with acceptable feasibility. Lee et al. [22], developed an ANN, known as a convolutional autoencoder (CAE), and detected damage to bridges with an accuracy of around 90%, using bridge vibration simulated data under traffic loads. To extract the damage features, autoregressive models with exogenous input (ARX) were fitted to the acceleration dynamic responses. Huang et al. [23] developed an algorithm based on genetic evaluation theory for damage detection, considering the effects of temperature variation and vibration measurements, with acceptable accuracy. To detect unbalanced loads on a freight railway vehicle, and guarantee the comfort and safety of goods, Silva et al. [24] implemented an artificial intelligence algorithm, which recorded vibrations data using a virtual wayside monitoring system. For the extraction of the most sensitive features for damage detection and feature dimensionality reduction, Silva et al. [24] considered (linear) autoregressive models with exogenous input (ARX) for feature extraction from accelerations and strain dynamic responses. The Mahalanobis distance was considered for data fusion and features discrimination, and outlier analysis was used to distinguish in which scenarios the vertical and lateral vehicle loads were not balanced. They proved that the applied methodology enables users to automatically check whether the vehicles’ loads are unbalanced. Meixedo et al. [25] considered simulated bridge damage and experimental measurements. The authors considered different vehicle speeds, environmental conditions, damage severity, as well as different sensor locations. The developed algorithm proved that it had the potential to distinguish, automatically, between damaged and undamaged railway bridge conditions, even at early stages. Malekjafarian et al. [26] conducted a study wherein they introduced a railway track monitoring method. This approach involved utilizing acceleration data collected from an in-service train to identify the degradation of stiffness in the track sub-layers. This was achieved through the application of an Artificial Neural Network (ANN) algorithm. Malekjafarian et al. [19] proposed an algorithm based on HT (for features extraction) and peak-based decomposition (PBD) for the detection of track damage using data recorded in an in-service passenger vehicle. Song et al. [27] investigated the dynamic effects induced by car-body vibrations on the pantograph–catenary system, under track irregularities. They found that the car-body vibrations may cause the loss of contact between the pantograph and the overhead transmission line under extreme track degradation conditions. Xia et al. [28] presented an automated driving systems data acquisition and data analytics platform for vehicle detection and tracking. They used the Kalman filter and Chi-square test method to reduce the noise and remove the outlier in the vehicle trajectory data. Xia et al. [29] developed an algorithm for the localization of autonomous roadway vehicles equipped with onboard sensors, under different environmental conditions. Tsunashima and Hirose [30] considered simulated vertical car-body accelerations and a HTT algorithm to detect damage on a longitudinal level, after track maintenance activities. The accuracy of the algorithm was validated through wayside and simulated dynamic responses recorded by in-service vehicles in terms of vertical car-body accelerations. Quirke et al. [31] applied a cross-entropy optimization algorithm to randomly generate the railway track damage and compared the obtained results with vehicle dynamic responses, in terms of the accelerations recorded from the bogie. The algorithm was tested for noise sensitivity and damage to the tracks related to the longitudinal level. Quirke et al. [31] concluded that a change in the deflection of a railway bridge due to the presence of damage manifests itself as a variation in the simulated longitudinal level, associated with the measured railway vehicle dynamic response. A machine learning (ML) classification algorithm, named a support vector machine (SVM), was developed by Tsunashima [6] to automatically detect damage to railway tracks using accelerations recorded by simulated sensors attached to the car body. To validate the results, Tsunashima [6] conducted an experimental test and simulated a 3D numerical model using SIMPACK® [32]. For the identification of damaged lateral alignment, cross level and longitudinal level damage to tracks, the root mean square value (RMS) of the vertical and lateral accelerations, as well as the roll angle, were considered as damage indicators. The damage detection accuracy was found to be above 80%, showing the robustness of the developed approach. Balouchi et al. [7] found good agreement in relation to the longitudinal level and lateral alignment damage by using an ML approach for the detection and location of damage to track. Balouchi et al. [7] also reported that the dynamic responses in terms of axle box accelerations, under damage conditions, can be considered as the most reliable evidence of the extent of the damage to the track. Chang et al. [33] applied a continuous wavelet transform (CWT) to detect the resonant frequency of the car body, using vertical and lateral acceleration registered at the floor level, under rail [34,35,36] and wheel wear damage conditions. Erduran et al. [37] developed a methodology based on CWT for the detection of bridge vibration frequencies under track damage, using simulated bogie vibration signals, and found that the developed approach can detect the bridge vibration frequency with acceptable accuracy. They found that the developed methodology can detect and locate, in real time, the track damage using vehicle vibrations data. Wang et al. [38] concluded that early defects in high-speed railway vehicles can be detected using an algorithm based on Bayesian theory, also implemented by Flynn and Todd [39]. Sun et al. [40] validated an algorithm for the online detection of wheel fatigue defects in railway vehicles. Auersch [41] conducted an onboard dynamic monitoring test, recorded the bogie and axle box accelerations of passenger vehicles, and used a correlation coefficient to conclude that there is a strong correlation between the soil condition and vehicle vibrations on a railway track.
Regarding the numerical models of the vehicle–track dynamic system, which have been adopted in studies concerning the identification of damage and vehicle–structure dynamics, two main approaches may be found in the literature. Namely, approaches that rely on theories of multiple moving point loads, finite elements, and elastically supported structures [4,42,43,44,45,46,47,48,49,50,51], and theory of multi-body dynamic simulation of the railway vehicle–track dynamic system [14,52,53]. Mosleh et al. [54] developed a 3D numerical model of a passenger railway vehicle using the theory of finite elements. They modelled the ballast layers and soil foundation as masses, connected between them through spring-dashpot elements. Xue et al. [55] simulated a high-speed freight railway vehicle in SIMPACK® [32] and considered Kalker’s simplified theory of contact (FASTSIM) for computation of the tangential contact forces. Chang et al. [33] elaborated a 3D numerical model and found that the deformation to the car body (not only as a rigid body) of a passenger railway vehicle is influenced by railway track damage. Also, the sprung masses are generally greater than the unsprung masses. These facts may lead to the missed detection of track damage at the early stages of their appearance. However, onboard monitoring systems based on sensors attached to in-service vehicles may have drawbacks related to the communication system, power supply [56], and adaptability of the systems to different types of railway in-service vehicles, as well as different damage identification algorithms, that can affect the reliability and efficiency of these systems.
This paper aims to present an application of an unsupervised machine learning approach to detect distributed track irregularities as defined in the European Standard EN13848-5 [57], based on artificial measurements numerically simulated with the commercial software provided by SIMPACK® [32]. The detection methodology comprises four steps: (1) feature extraction from the acquired responses using an autoregressive method; (2) feature normalization; (3) data fusion; and (4) damage detection by performing an outlier analysis.
The following significant contributions can be highlighted from this research:
  • Detecting early-stage damage to railway tracks using artificial intelligence and simulated railway vehicle vibration measurements, recorded by in-service vehicles;
  • Create conditions for the operational and technical integration of railway track dynamic monitoring and maintenance for different railway networks;
  • Validate the developed artificial intelligence algorithm for damage detection to railway track using axle box accelerations registered by a freight wagon, considering an optimized number of accelerometers, big data, and operational and simulated environmental conditions, for railway decisionmakers in order to be integrated, later, into an in-service wagon.

2. Numerical Modeling of Vehicle–Track Dynamic System

2.1. Vehicle Model

This sub-section includes the aspects considered in the numerical modeling of the vehicle. The freight railway vehicle used in this work consists of a Laagrss-type wagon (Figure 1a,b), which is a freight vehicle with a 45 feet flat steel platform designed for the transportation of containers, that operates between Portugal and Spain and can reach speeds of up to 120 km/h. The platform is supported by two single wheelsets with leaf-type suspension, whose dynamic parameters were obtained in the experimental calibration of the numerical model developed by Braganca et al. [44].
The 3D (three-dimensional) multi-body system (MBS) simulates a freight wagon (Figure 2), whose main dynamic and geometric properties are adopted from Braganca et al. [44]. It consists of two wheelsets, with 10 m of wheelbase, and a car body (platform and container together), whose dynamic properties are summarized in Figure 1 and Figure 2. The wheelsets are connected to the rigid car body through the suspension system, consisting of spring-dashpot assemblies. To consider the wagon load variation (i.e., the operational effects), different loading schemes are considered, namely, unloaded, 50% loaded, and 100% loaded, as shown in Figure 2. The car body (platform and container together) and wheelsets are simulated as rigid body elements with 6DOFs (longitudinal, lateral, and vertical translations; roll, yaw, and pitch rotations); otherwise, the axles were simulated as rigid body elements with 5DOFs. The wheels are rigid body elements connected to the wheel axles and have real profiles (i.e., S1002, from the SIMPACK® default database). The rail–wheel ‘contact patch’ is assumed as the surface where the rail profile and the wheel outline intersect or interpenetrate geometrically. The vertical translation (z), the lateral translation (y), the longitudinal translation (x), the rotation around the x-axis (roll), the rotation around the y-axis (pitching), and the z-axis (yawing), are considered in the solution to the vehicle–track dynamic equation. To account for the vehicle speed variation along the track, a speed step of 20 km/h is considered. The sampling frequency ( F s ) for the axle box accelerations is 5 kHz, which corresponds to a time step of 0.2 ms. The vehicle–track dynamic equations are solved using a direct time integration method. It is also assumed that the vehicle starts from an undisturbed ideal track, with no track geometry damage. Geometric and dynamic properties of the freight wagon is summarized in Table 1.

2.2. Track Model

Herein are presented the aspects considered in the modeling of the track (as shown in Figure 2). The model assumes that the track moves with the vehicle [58], i.e., a moving track model. The track numerical model has a total length of about 5.4 km, and has lateral, vertical, and roll movements at the track foundation level. The rails are modeled using rigid body elements with the corresponding dynamic and geometric properties, summarized in Figure 3. The track ballast and track subgrade are modelled together as a total equivalent foundation layer (Figure 2) connected to the sleeper by only one spring-dashpot element (to model the flexibility of the track), considering the lateral, vertical, and roll (i.e., torsional) stiffness and damping properties, with 3DOFs. Main properties of track model is summarized in Table 2. As the foundation properties of the track are assumed to be homogenous along the track length, a moving elastic track model is assumed in SIMPACK® to optimize the unwanted computational cost and prevent unrealistic peak values in the acceleration responses. The track irregularities excite the vehicle through the wheel–rail contact interface, and all other dynamic properties beneath the rail and the rail profile are assumed to be constant. An equivalent, vertical, lateral, and roll stiffness and damping are considered to model the rail pads and rail fastening system. The track gauge considered in the numerical model is 1.668 m. The elastic track foundations have in common that they follow the track at the position of the wheel. This is ensured by joint 91, a wheel/rail track sleeper, which is used on the rail itself. This joint does not provide the related degrees of freedom. The total track stiffness and damping are simulated by only one vertical equivalent spring, with lateral, vertical, and roll degrees of freedom. This approach avoids using more than one spring-dashpot assembly to model the track’s dynamic properties for different DOFs. A similar approach was considered in the model developed in SIMPACK® by Carlberger et al. [59], and by Bezin et al. [60], and the track models discussed by Zhai et al. [45].

2.3. Modeling of Vehicle–Track Dynamic Interaction

The modeling of the vehicle–track interaction and the main assumptions made are discussed in this sub-section. To model the wheel–rail contact (as shown in Figure 2) [63], Kalker’s theory of contact [64] and the Hertz method are considered using the software SIMPACK®, for the computation of elastic forces at the contact surface. The wheel–rail ‘contact patch’ is assumed as the surface where the rail profile and the wheel outline intersect or interpenetrate geometrically. SIMPACK® provides two ways to calculate the normal force from the equivalent penetration. The Hertzian method [65] involves the dimensions of the equivalent contact ellipse and the combined Young’s modulus and Poisson’s ratio. An additional damping force is added to avoid high-frequency dynamic responses in the rail–wheel contact. The normal force is calculated to keep the natural damping constant, even when the Hertzian stiffness varies [32]. In SIMPACK, the user specifies a reference damping (known as the contact reference damping), for the present study it is set as 100   k N s / m , that is valid for a reference contact stiffness of K h = 500   M N . The final normal force is obtained as the sum of the Hertzian or linear spring force and the damping force. But, to avoid a situation where the wheel ‘sticks’ to the rail when the damping force becomes larger than the stiffness force, the normal force is limited to be greater than zero.
The FASTSIM approach [66] Is considered for the computation of tangential forces at the wheel–rail contact surfaces, with an initial patch discretization of eleven. The tangential contact forces depend on the normal contact force, the friction coefficient and the geometry of the contact patch, and the stress distribution within the wheel–rail contact patch. The Polach weighing factors A and B [64] are assumed to be zero in the software, while the friction coefficient is constant along the track (and within the whole contact area) and assumed as 0.3. Different methods for the selection of the friction coefficient [67] are available in the software. The stick friction coefficient determining the maximum adhesion forces [68] is set as 0.4. The stick coefficient used for virtual spring–damper considered only for the stick case is 100   M N / m by default [32]. The modulus of Young and Poisson’s ratio, considered for the computation of the wheel–rail contact, are 210   G P a and 0.28, respectively.

3. Simulation of Baseline and Damage Scenarios

3.1. Baseline

Herein, the baseline scenarios are discussed. The baseline scenarios, also designated as ‘reference’ scenarios, depict a limited state of the track in which the standard deviation of the track’s geometric irregularities is less than the standard deviation of the damage scenarios. The track geometry irregularities for the baseline scenarios (BSC) have a wavelength range of 3 D 1 25   m . The standard deviation (i.e., STDZ, STDY) of the left and right rail longitudinal level (LRLL, RRLL) and lateral alignment (LRLA, RRLA), at every window length of 200 m, are less than the standard deviation for the alert limit state (ALSTD), defined by European Standard EN 13848-5 [57], and less than the ALSTD for the damage scenarios for a vehicle speed of 80 km/h, as shown in Table 3. At each instance of travel, starting from a speed of 40 km/h to 120 km/h, a sampling frequency of 5 kHz is fixed to record the axle box accelerations (ABA), as shown in Table 4. For the baseline scenarios, a speed (v) increment of 20 km/h was assumed, to account for the vehicle speed variation. The signals are filtered and used for features extraction using an autoregressive model (A 3R model), as discussed in later sections in this paper. The ABA signals for the damage scenarios (BSC) were registered along a railway track of 1080 m in length. The total number of baseline scenarios is 75. In Table 4, a summary of the simulated baseline and damage scenarios is given.

3.2. Damage

The damage scenarios depict a limited state of the track, in which the standard deviation of the track’s geometric irregularities has changed in relation to the standard deviation of the baseline scenarios. The distributed track geometry irregularities for the damage scenarios (DSC) are generated using power spectral density function (PSD) in MATLAB® software [69], in the wavelength range of D1, as defined by European Standard EN 13848-5 [57]. The formulation used for the generation of track geometric irregularities is discussed by Claus and Schiehlen [5]. It is assumed that the standard deviation of the distributed defect, concerning the lack of the longitudinal level of the track on both the left and right rails, is less than the standard deviation chosen for the baseline, as stated before. The procedure is repeated, varying the standard of the lateral alignment (LA) and longitudinal level (LL) iteratively, thus obtaining 45 possible combinations (called damage scenarios). For each ‘combination’, considering that the vehicle travels at a speed of 80   k m / h and is fully loaded (full), the vehicle’s dynamic responses, in terms of the ABA, are registered. Since the maximum operating speed for which the baseline scenarios are considered is 120 km/h, the STD had to be iteratively increased up to 2.3 mm and 1.5 mm, values for which it is no longer considered practical to drive at the minimum speed (i.e., 80 km/h) considered here, without planned maintenance, as shown in Table 3. This also accounts for early damage and damage severities (for the same wagon loading condition), since the limit values are 2.3 mm and 1.5 mm for the longitudinal level and lateral alignment and a speed of 80 km/h.
It can be observed that all the STD values for the BSC are less than for the damage scenarios, as stated before. For the baseline scenarios, the freight wagon is subjected to three load increments in the wagon or loading scheme: (a) fully loaded (i.e., 100% loaded), (b) half load (i.e., 50% loaded), and (c) empty or tare (i.e., unloaded).

4. Vehicle Dynamic Responses

The vehicle dynamic responses are recorded by the axle box, as previously shown in Figure 2. The axle box acceleration signals that refer to the accelerometer S1Y and S1Z show that when the standard deviation increases, in general, the axle box acceleration increases. The results are shown only for the last tested track section. The lateral acceleration amplitudes recorded by the sensor S1Y are smaller than the vertical ones (recorded by the sensor S1Z) for damage scenario eight, for a fully loaded vehicle traveling at a speed of 80 km/h. Thus, the ALSTD for the lateral alignment is less than the ALSTD for the longitudinal level, as shown in Table 4. When the vehicle is fully loaded, driving over an undamaged track condition (BSC3 and BSC4), the vertical acceleration recorded by the S1Z is higher for a speed of 100 km/h than for 80 km/h, as expected. But, when the vertical acceleration for BSC4 ( 100   k m / h ) (Figure 3b) is compared to the vertical acceleration for DSC8 (i.e., 80 km/h, STDY = 2.3 mm, and STDZ = 1), recorded by the same sensor S1Z, a peak with a higher acceleration amplitude for BSC appears, which may lead to a false alarm when the operational effects and simulated environmental effects are not removed at the stage of data normalization. DSC8 refers to the scenarios with STDZ (longitudinal level standard deviation) equal to 2.3 mm and the standard deviation for lateral alignment (STDY) equal to 1.2 mm. In Figure 3a,b, the amplitudes of the accelerations recorded onboard the vehicle are higher for the situation with damage than for the situation without damage. But the detection of this difference between the two vehicle dynamic responses, in terms of acceleration, is not so evident when viewing the signal in the time domain, especially for the ALS (i.e., at the early stage of damage) involving big data (over a long track length). This proves that the interpretation of vehicle vibration signals, in the time domain, for track damage detection is limited since the signal contains many frequency components recorded over a long track length with irregularities concerning the different severities. This justifies the use of unsupervised machine learning in the interpretation of vehicle vibration signals for the identification of damage involving operational and environmental effects.

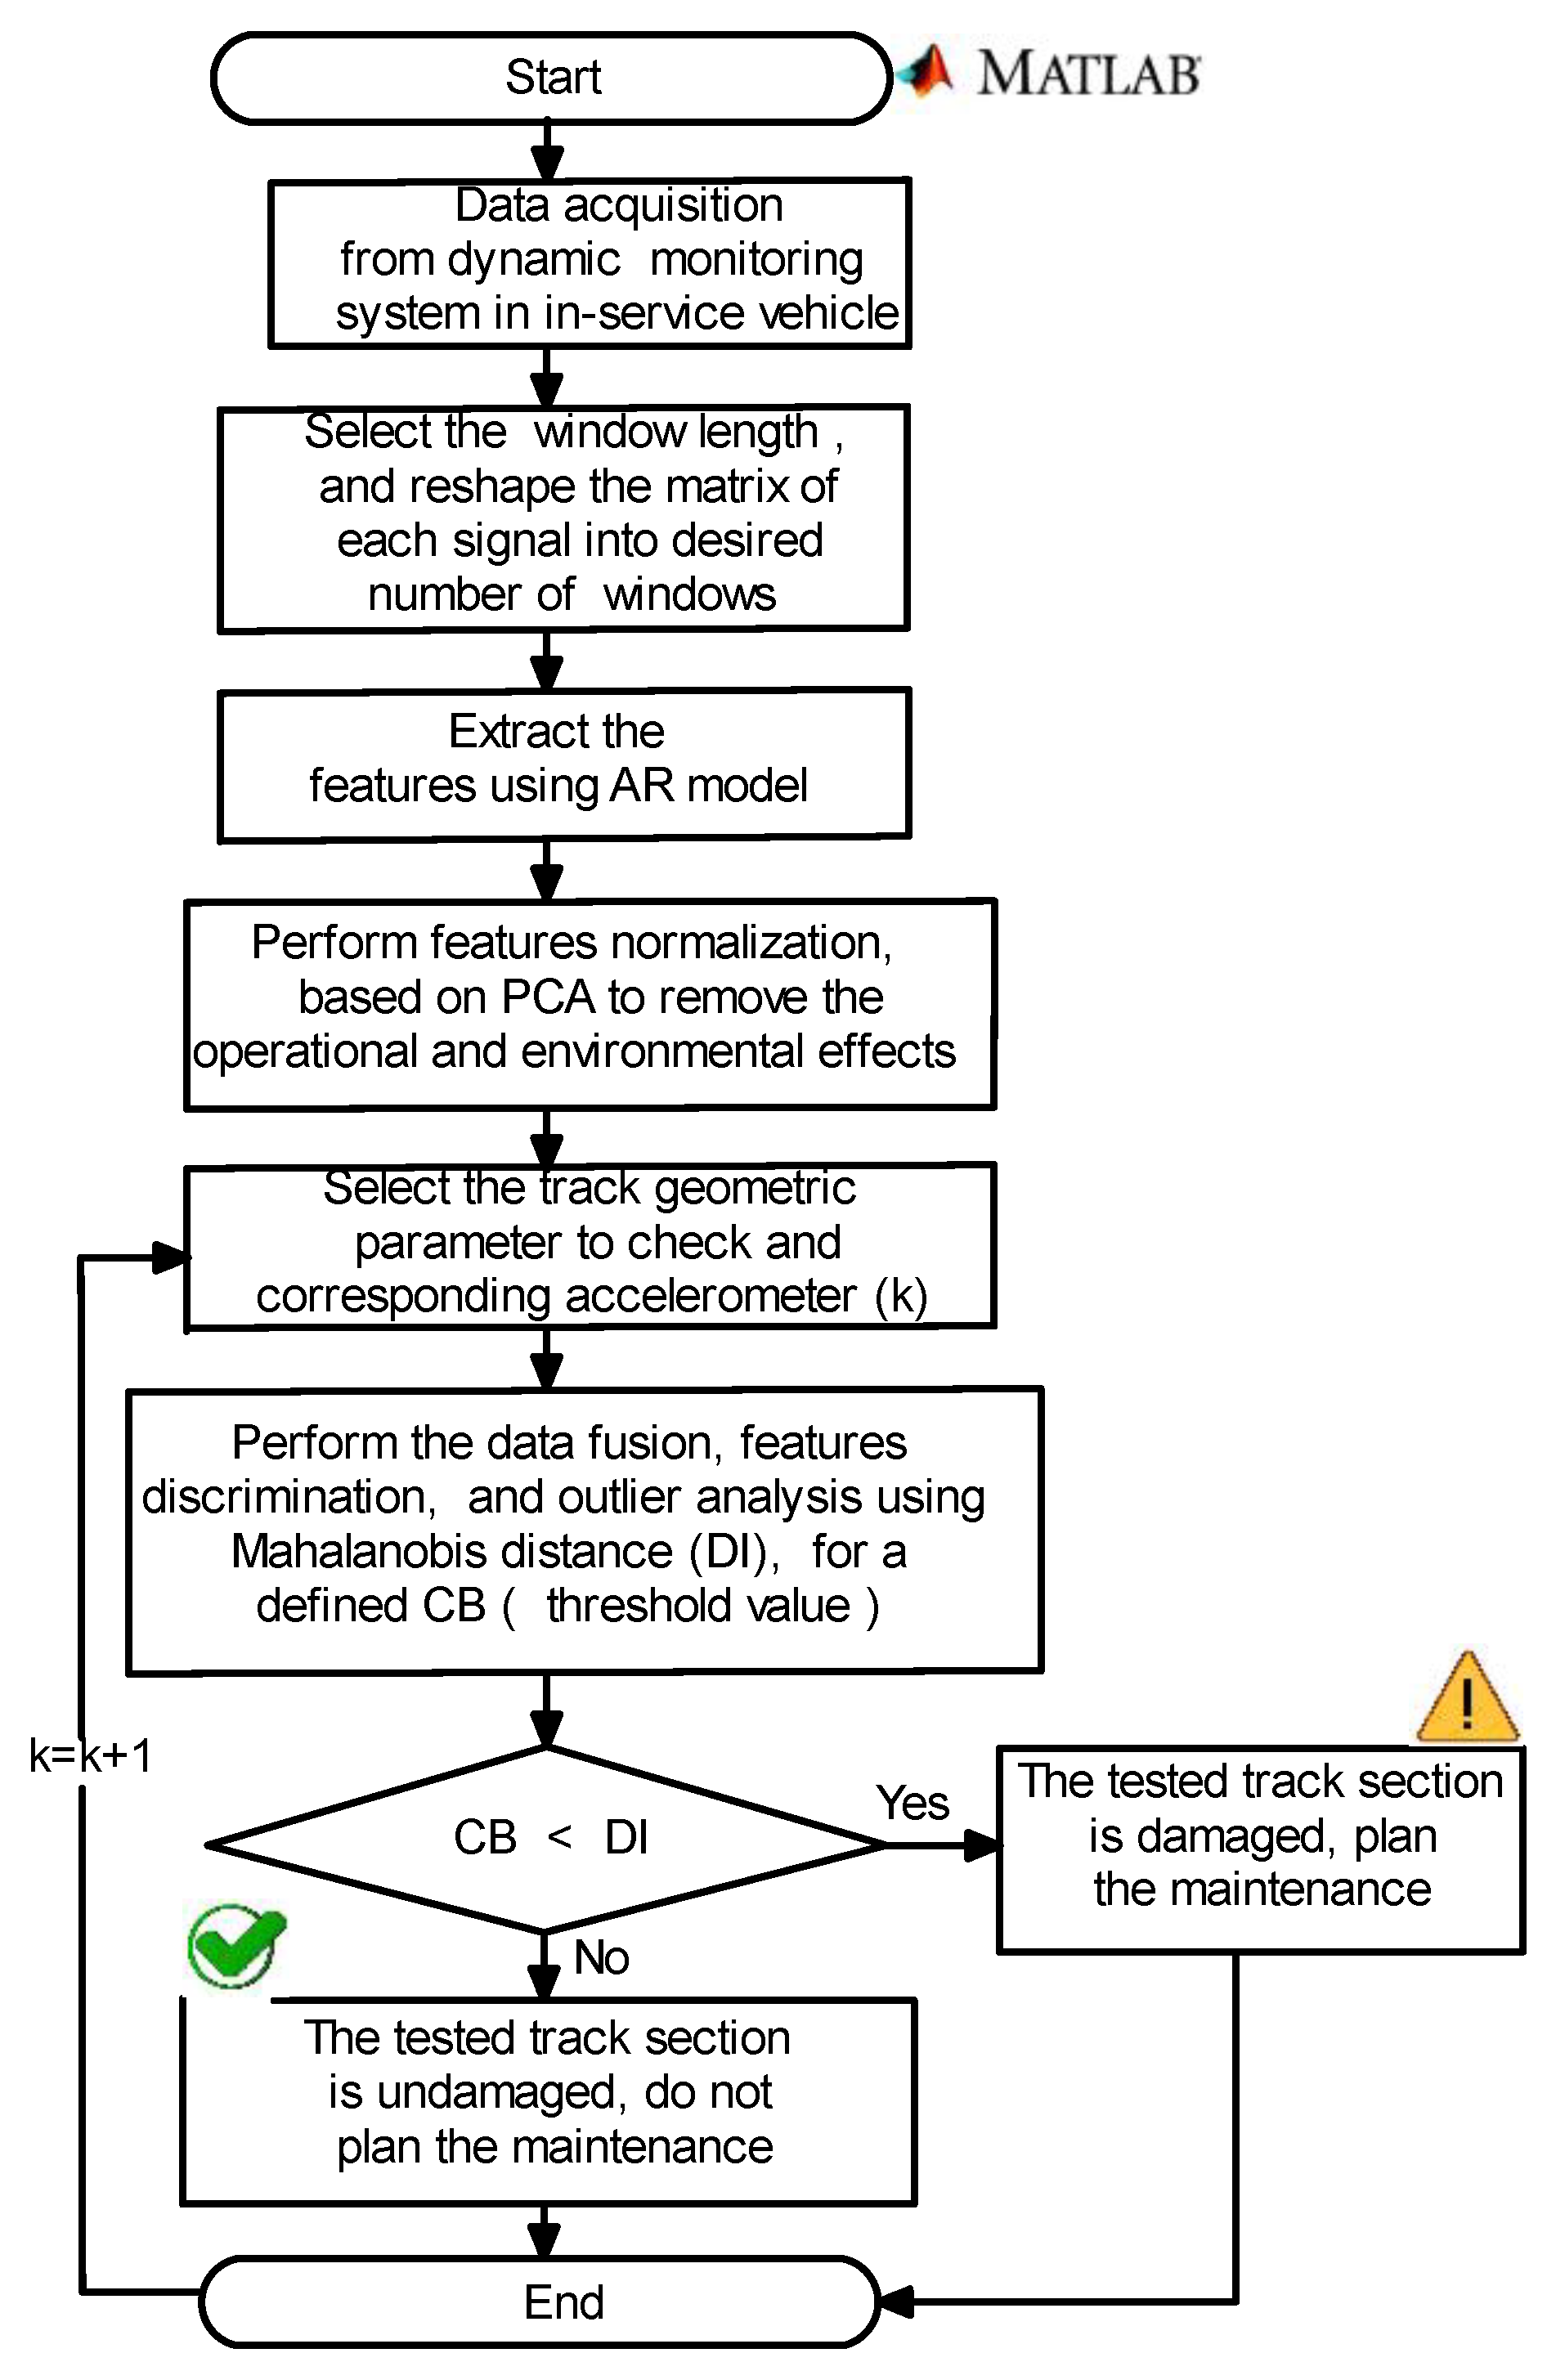
5. AI-Based Methodology for Railway Track Damage Detection

5.1. Overview

An automated AI-based methodology for the detection of damage to railway track was adapted based on the one firstly developed by Meixedo et al. [25] for damage identification in railway bridges. But it was not yet applied for the detection of damage to tracks using an onboard monitoring system for in-service vehicles, under big data conditions. The methodology deployed herein, using MATLAB® software, consists mainly of the following self-explanatory steps depicted in Figure 4. The main steps in the methodology are: (i) feature extraction using the AR model, for extraction of the most sensitive statistical variables, (ii) data normalization based on PCA to remove the environmental and operational effects, and (iii) a detection step that comprises data fusion, features discrimination, and outlier analysis.

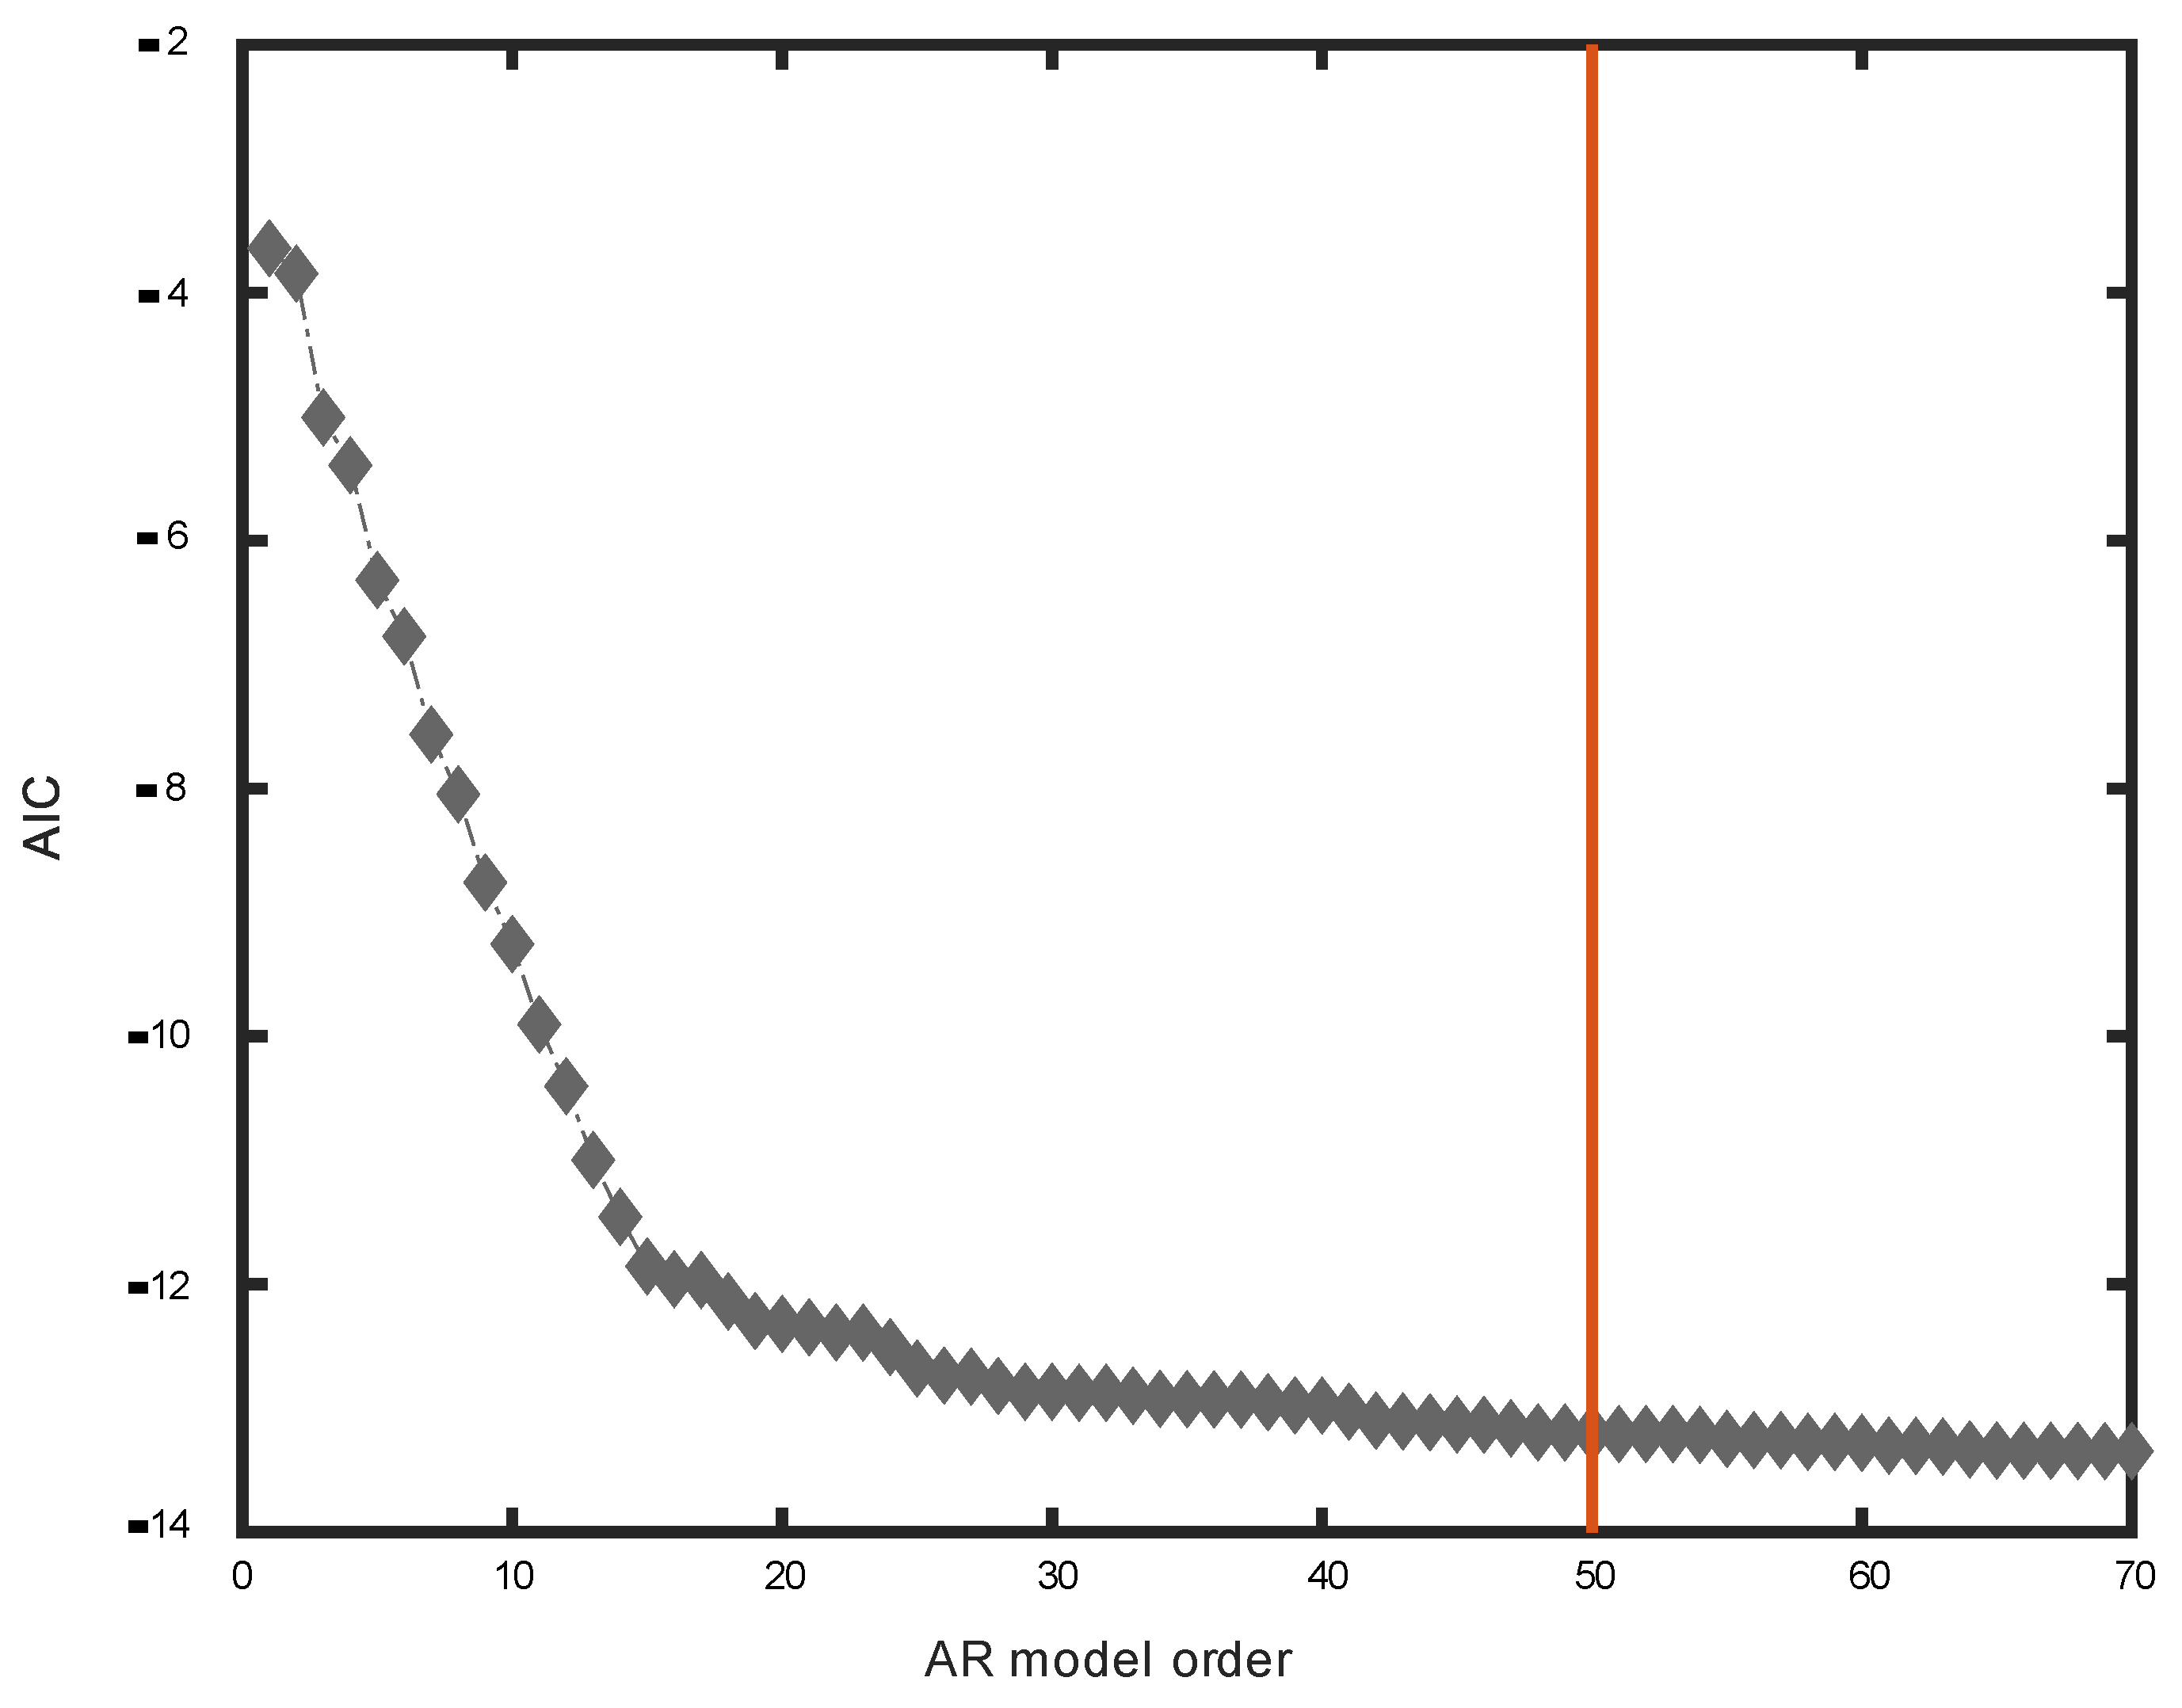
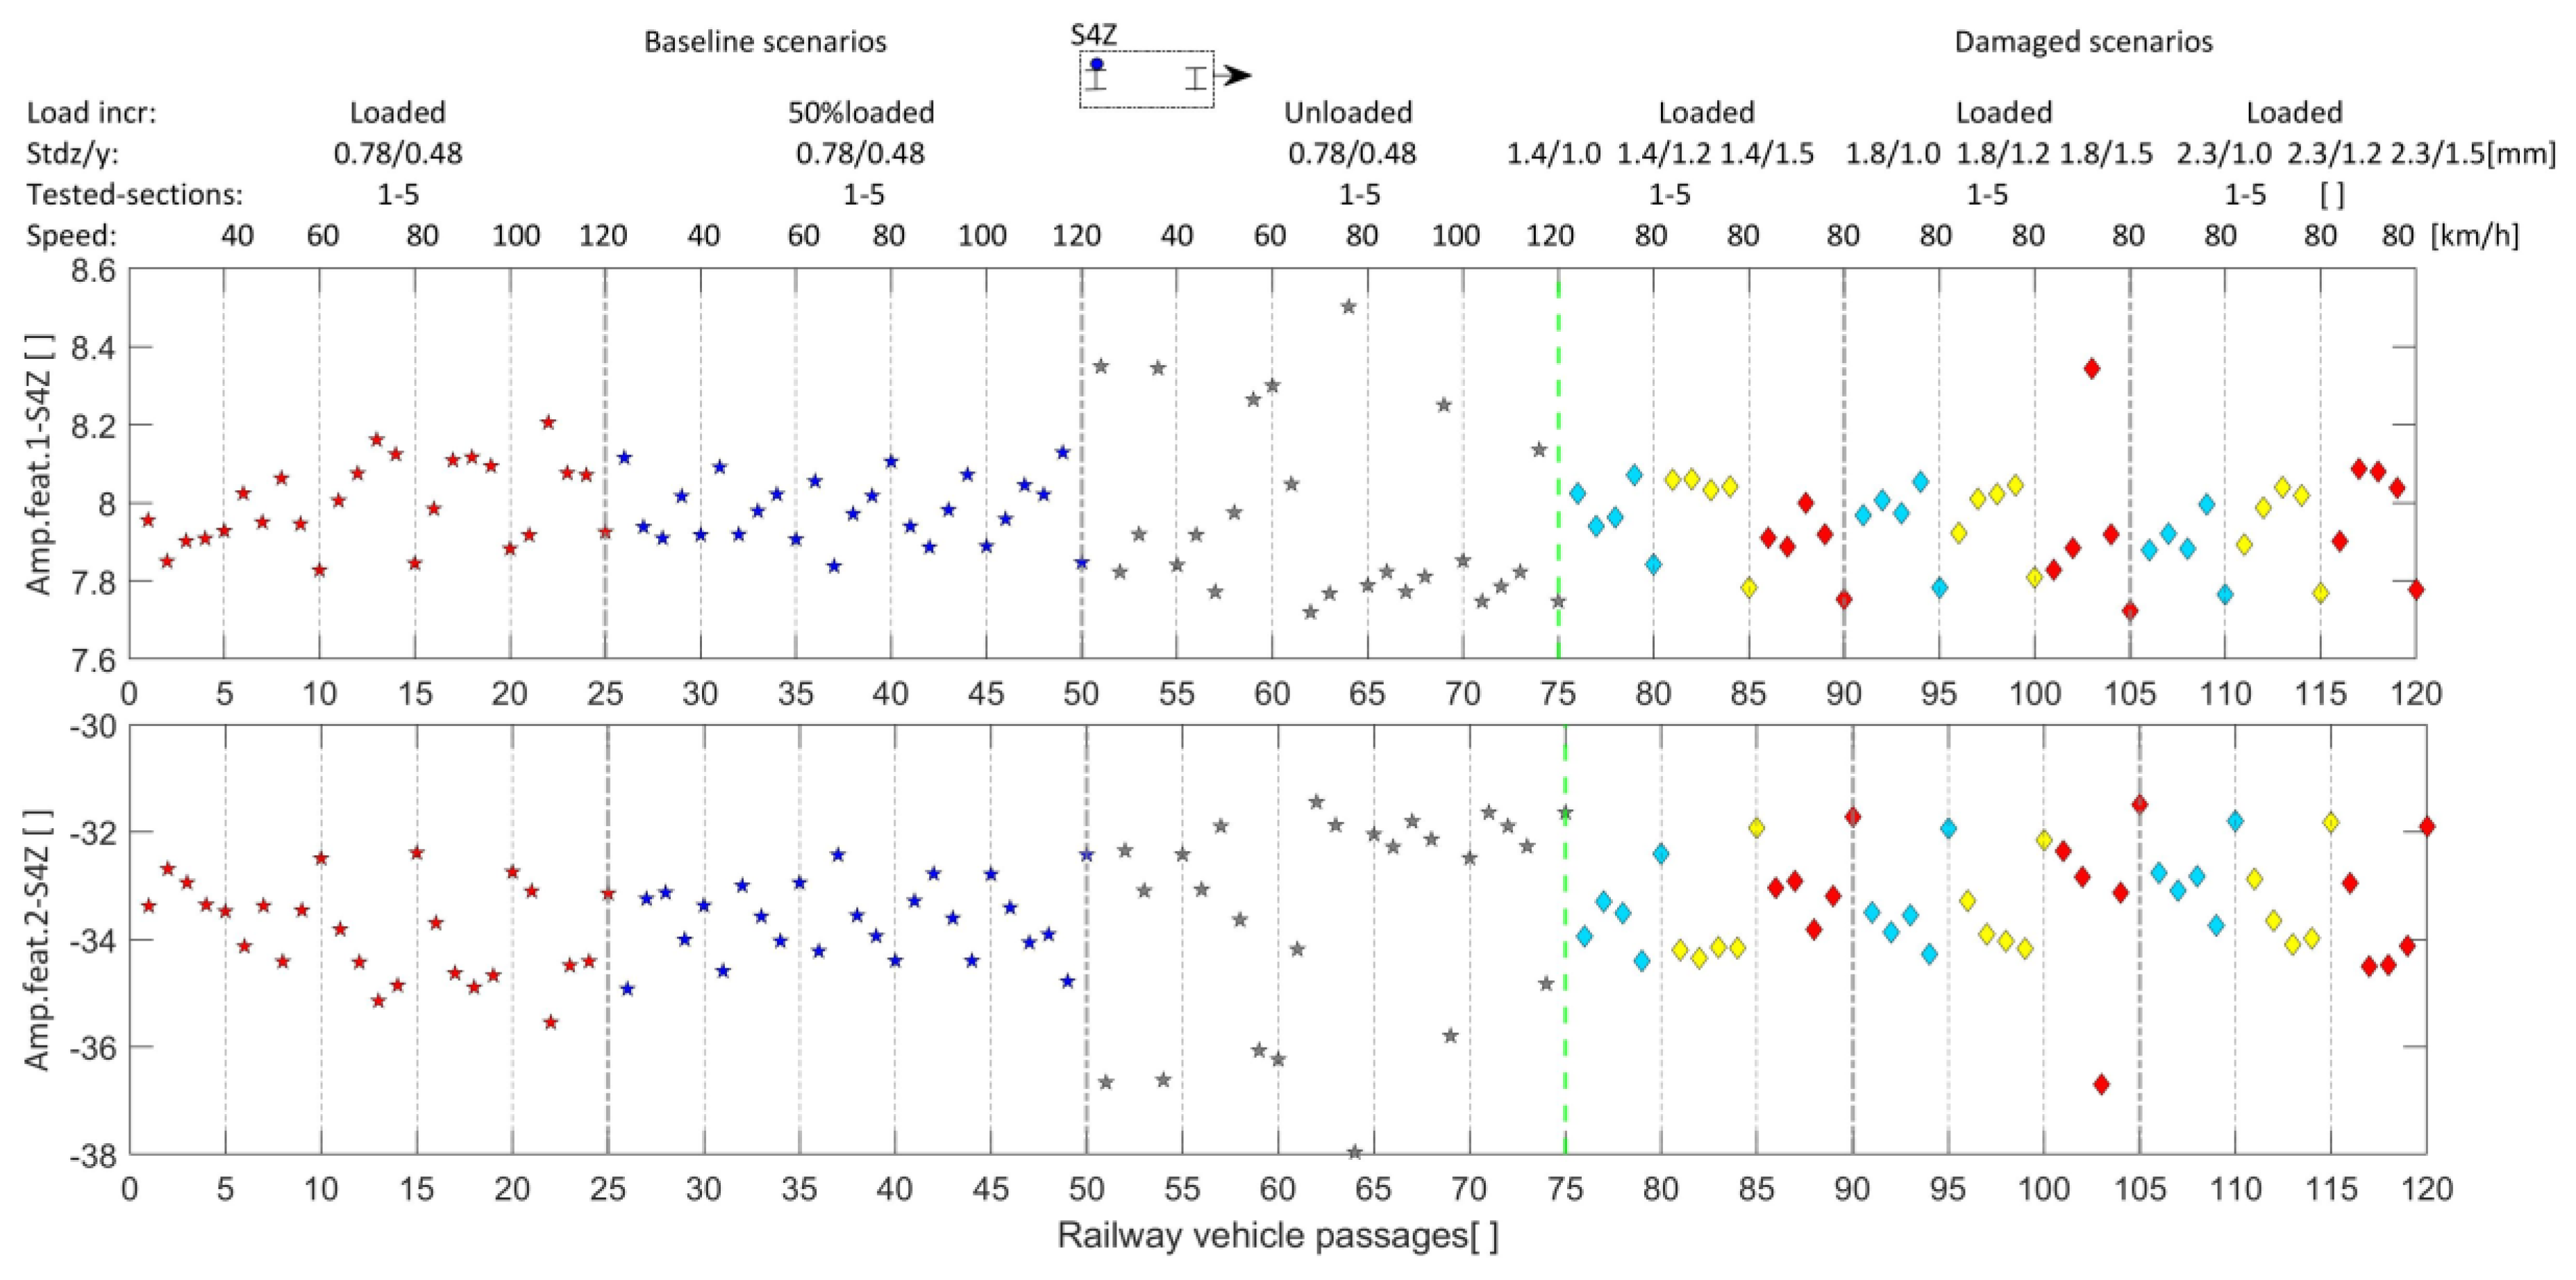
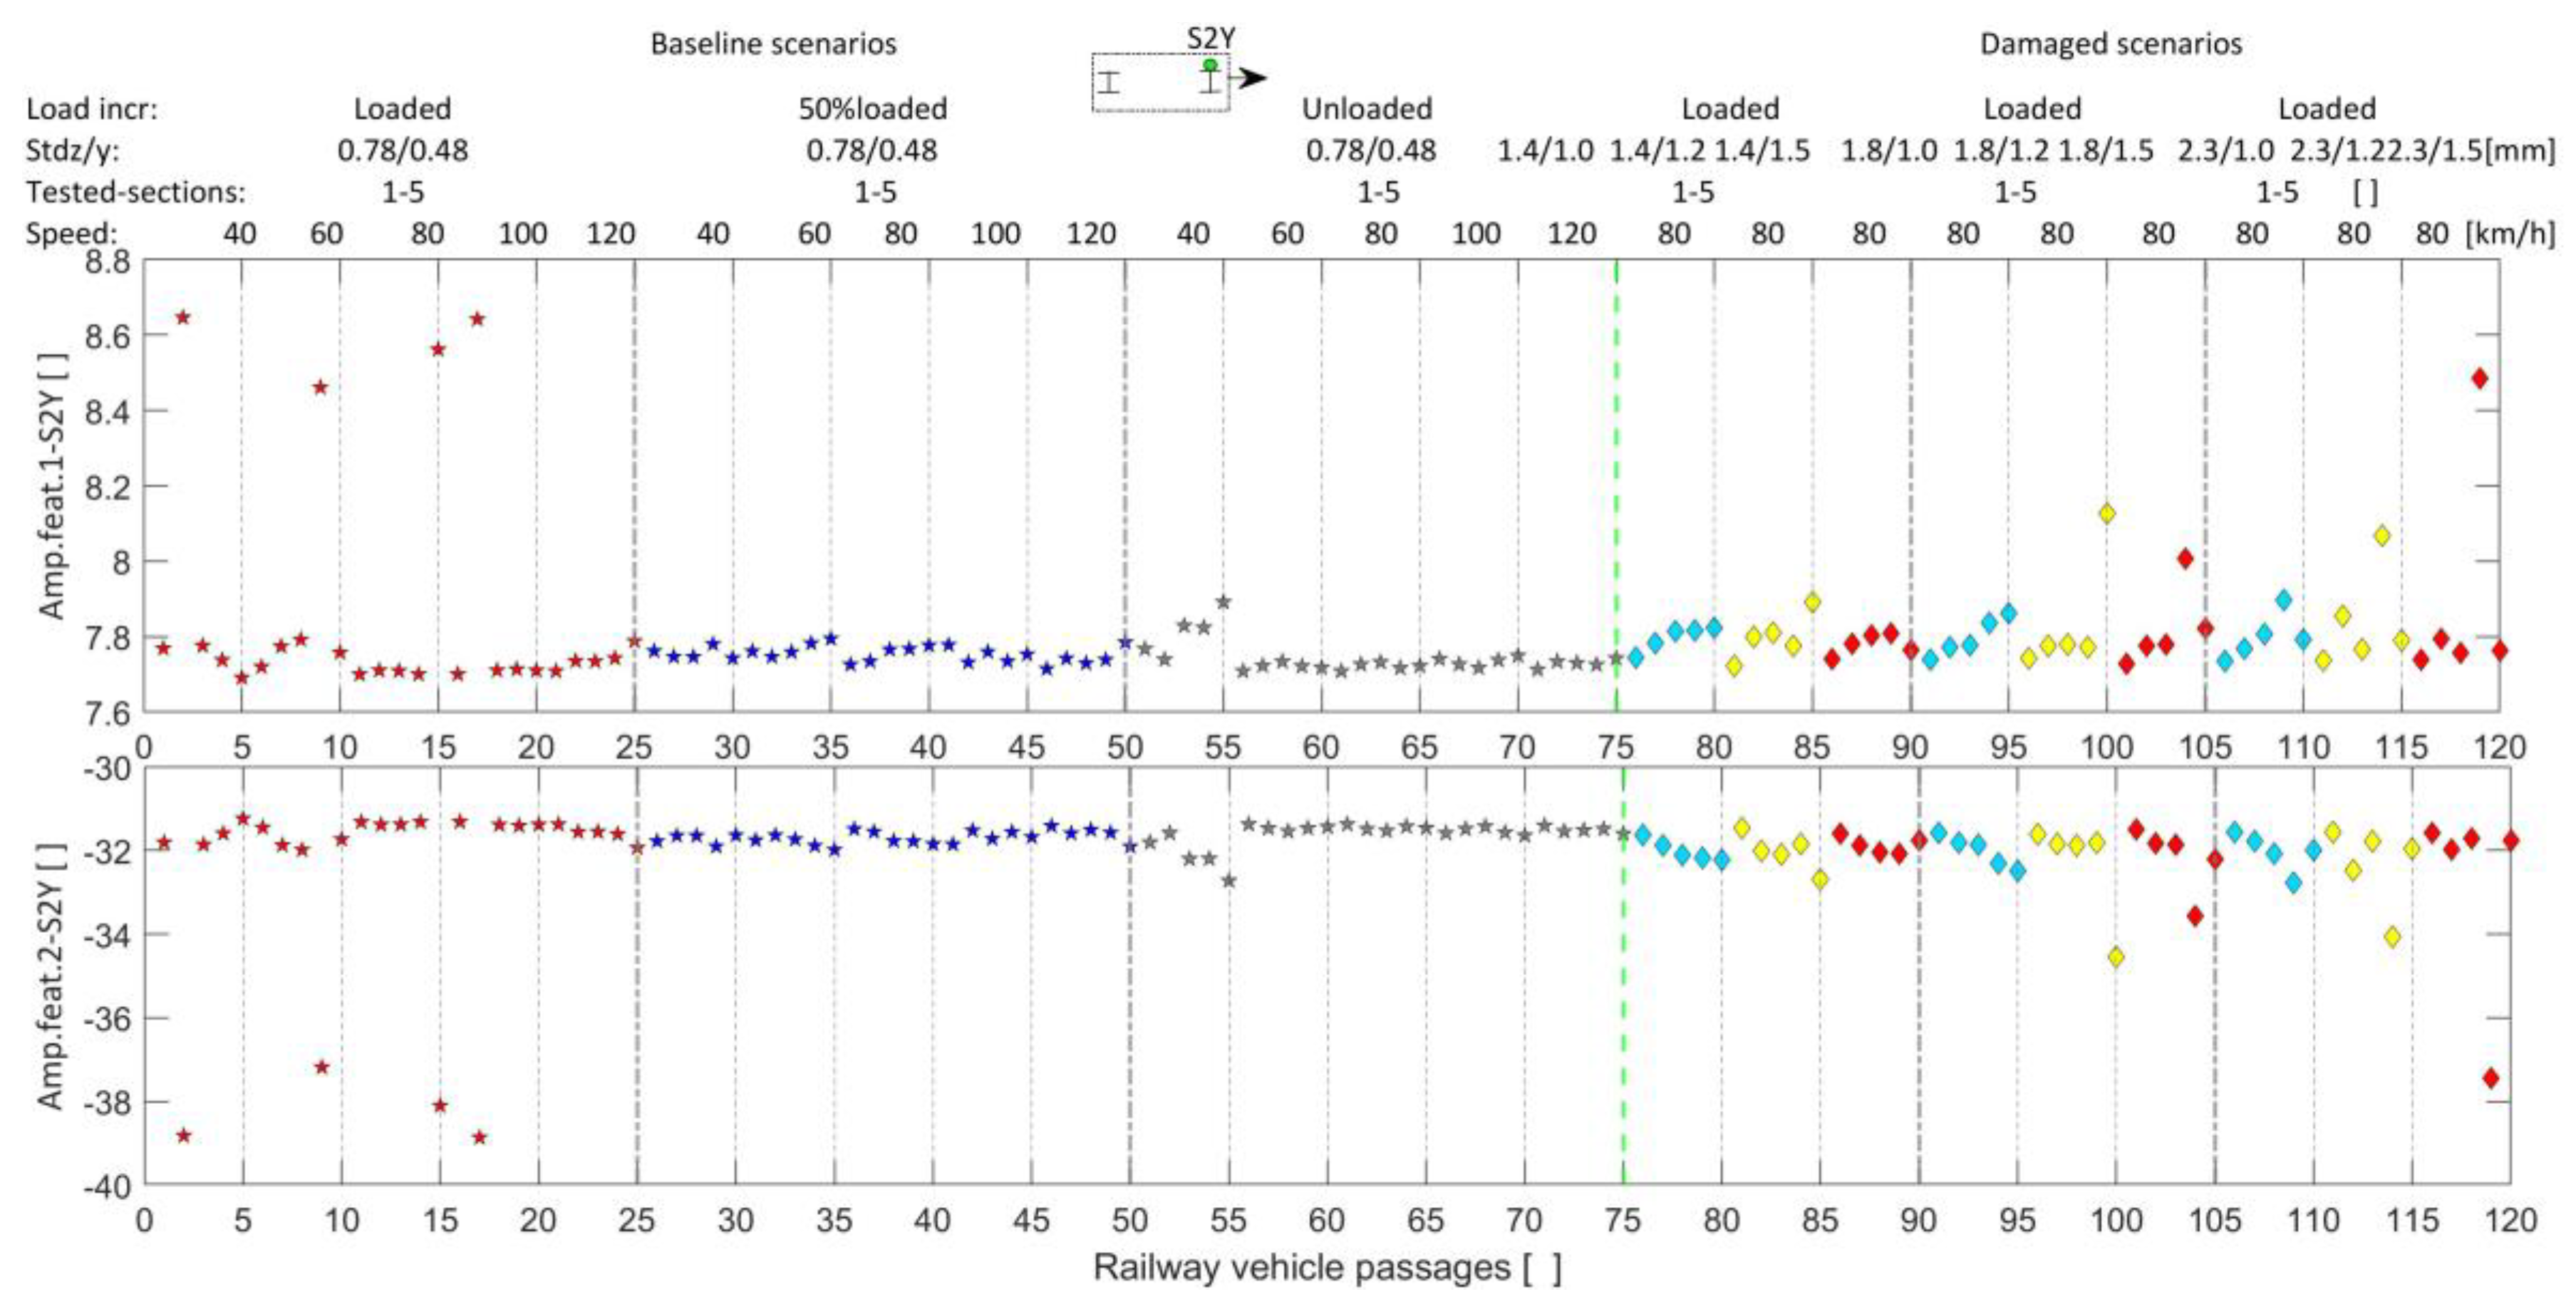
5.2. Feature Extraction

Feature extraction from vibration signals for damage recognition in structures involves the process of finding or processing the vibration signals to select statistical variables that are sufficient to describe the behavior of a vehicle–structure dynamic system in terms of the presence of structural changes. AR models are machine learning linear regression models deployed for structural dynamic system identification, in which the prediction of the features at each interaction is only a function of the features of the previous (regression) interaction of the same vibration signals and a bias. That is, the linear regression, at each step, is computed based only on the values for the previous step. In such a way that the total of the previous step is equal to the model order (i.e., 50 in the present work) or the number of variables involved in the regression. This leads to a small amount of meaningful or damage-sensitive (statistic) variables or features, whose quantity of features corresponds to the model order. The features corresponding to abnormal structural dynamic behavior when compared with those of normal structural conditions results in a group of damaged and undamaged structures at the given tested section. The formulation used in the present paper is shown in Equation (1), where m denotes the model order, x j i denotes the (input) registered axle box accelerations, ε j is the random error or bias in the model, and x j are the extracted features. The meaning of Equation (1) is that the output of the linear regression at any step (j) is computed based only (i.e., auto) on using the values for the same axle box acceleration signals as the previous step (i) and a bias. The AR model order was selected through convergence analysis, applying the Akaike information criterion, AIC [70]. Figure 5 shows the convergence analysis for the selection of the suitable model order. The AIC evaluates the relative amount of vehicle vibration information lost during the extraction of features from the axle box accelerations. In fact, a model order of 50 is set, since the less information an AR model loses, the higher the model quality, the lower the risk of overfitting or underfitting. In other words, by increasing the model order, the limit in the amplitude of the features when the model order tends to infinite, approaches zero, that is, its contribution to damage recognition is neglected. So, AR models with different orders, from 1 to 70, are assumed as candidate models, then the AIC for the evaluation of the goodness of data fitting, whose formulation is shown in Equation (2), is computed. Where N t denotes the number of estimated data points, N p is the number of estimated parameters, and ε denotes the average sum-of-squares residual ( S S R ) errors.
x j = i = 1 m a i x j i + ε j
A I C = N t ln ε + 2 N p ,   ε = S S R N t
The designed AR model is such that it minimizes the AIC values, that is, 50, as shown in the results plotted in Figure 5. It means 50 is the best fit AR model, according to the Akaike information criterion (AIC), which explains the greatest amount of variation using the fewest features. This value is shown by the red line in the Figure 5. Consequently, the total number of principal components is also fixed at 50.
Figure 6, Figure 7, Figure 8, Figure 9, Figure 10, Figure 11, Figure 12 and Figure 13 illustrate the results for some of the features extracted from the lateral rear and front axle box accelerometers, for randomly selected features 1 and 2, from a matrix s with a dimension r × f (i.e.,   120 × 50 ), whose row entries are the total number of railway vehicle passages ( r ) , which is equal to the number of scenarios, and the column entries are the total number of features ( f ) for the assessment of the railway track maintenance condition, under the alert limit state (ALS), for all k = 8 sensors. Note that the recognition patterns, corresponding to the baseline scenarios, are more dispersed around the mean, which highlights the dynamic effects on the vehicle due to speed and wagon load variations, since the track condition is the same. The opposite happens for the damage scenarios, with the same speed and different severity of damage. This result also shows that it is not practical to differentiate the baseline from the damage scenarios using only this step, which comprises the extraction and visualization of the features. Furthermore, as the amplitude of the features is more dispersed around the mean, due to the inclusion of the effect of speed and vehicle loading, these need to be removed to increase the damage detection accuracy. For this reason, data normalization is performed. The Stdz/y denotes the standard deviation for the longitudinal level and lateral alignment, for the previously mentioned scenarios and “1–5” denotes the range of tested track sections, each with 1080 m. These figures show that when the standard deviation increases, it does not necessarily mean that the corresponding feature amplitude will increase. Due to the presence of operational and simulated environmental effects, it means that the baseline and damage scenarios cannot be separated using the amplitude of the features. In Figure 6, Amp.feat.1-S4Y, denotes the features amplitude 1, extracted from the sensor S4Y (Figure 2), and Load incr. denotes the load increment or the condition for loading of the wagon. These details are analogous to Figure 7, Figure 8, Figure 9, Figure 10, Figure 11 and Figure 12.

5.3. Feature Normalization

Feature normalization is crucial for achieving the most accurate damage identification. Otherwise, the influence of environmental and operational effects on the acceleration signals can generate false positives. Principal component analysis (PCA) is a latent variable method that has been efficiently applied for this purpose. Considering an n × m matrix X , where m denotes the number of AR parameters extracted from the railway vehicle axle box acceleration signals, and n is the number of simulations for the baseline scenarios. The eigenvalues of the covariance matrix of X, which transform X into another set of m parameters, Y, are designated principal components, whose computation is obtained using Equation (3), where T is an m × m orthonormal linear transformation matrix that applies a rotation to the original coordinate system. The covariance matrix of the baseline feature, C, is related to the covariance matrix of the scores, Λ, using Equation (5). The superscript T denotes the transpose of the matrix T , where T and Λ denote the matrices obtained by the singular value decomposition (SVD) of the covariance matrix C of the features. The columns of T are the eigenvectors and the diagonal matrix Λ comprises the eigenvalues of the matrix C in descending order. Hence, the eigenvalues, that is, the coefficients of the linear combination of the principal components stored in Λ are the variances of the components of Y . They express the relative importance of the variation or damage for each principal component in the entire data set [25]. In a vehicle–track dynamic system, the vehicle acceleration signals are also influenced by the vehicle speed and the loading condition. Therefore, to separate the effects caused by the operational and environmental variability from the changes caused by the damage itself, all the features (firstly merged into a struct array) were normalized based on PCA and computed PCA residuals. The PCA can retain meaningful information related to the operational and environmental effects in the first components, thus the remaining components are those that enable the state of the damage to be distinguished from the state of an undamaged railway track. There are different ways to select the most informative principal components, which explain the largest variance in a dataset. Generally, values not less than 80 are chosen [70]. Another method is based on plotting the eigenvalues as a function of the number of principal components and then selecting those components, from which the eigenvalues are reasonably small, similar to the AIC plot (Figure 5). After neglecting the most influential principal components ( p ) that explain the largest variance, the m p principal components of the matrix Y are calculated using Equation (3) and a transformation matrix T ^ is built with the remaining m p columns of T . Those m p components can be remapped to the original space using Equation (5). This computation process was repeated for all matrix s , whose entries are the features from each of the eight onboard axle box accelerometers.
Y = X . T
C = T . Λ . T T
F P C A = X . T ^ . T ^ T
Figure 13, Figure 14, Figure 15, Figure 16, Figure 17, Figure 18, Figure 19, Figure 20 and Figure 21 show the results for the computed PCA residuals. It is evident that for different accelerometers, the selected features 1 and 2 are now normalized around the mean value, with no operational nor the simulated environmental effects. However, it is still difficult to distinguish the damaged from the undamaged scenarios at this stage. To overcome this problem, in the next step, all the features are automatically merged to increase the damage sensitivity, using data fusion, features discrimination, and outlier analysis. The observation of the plot of the features reveals that consecutive features (i.e., 1 and 2) have very similar values.

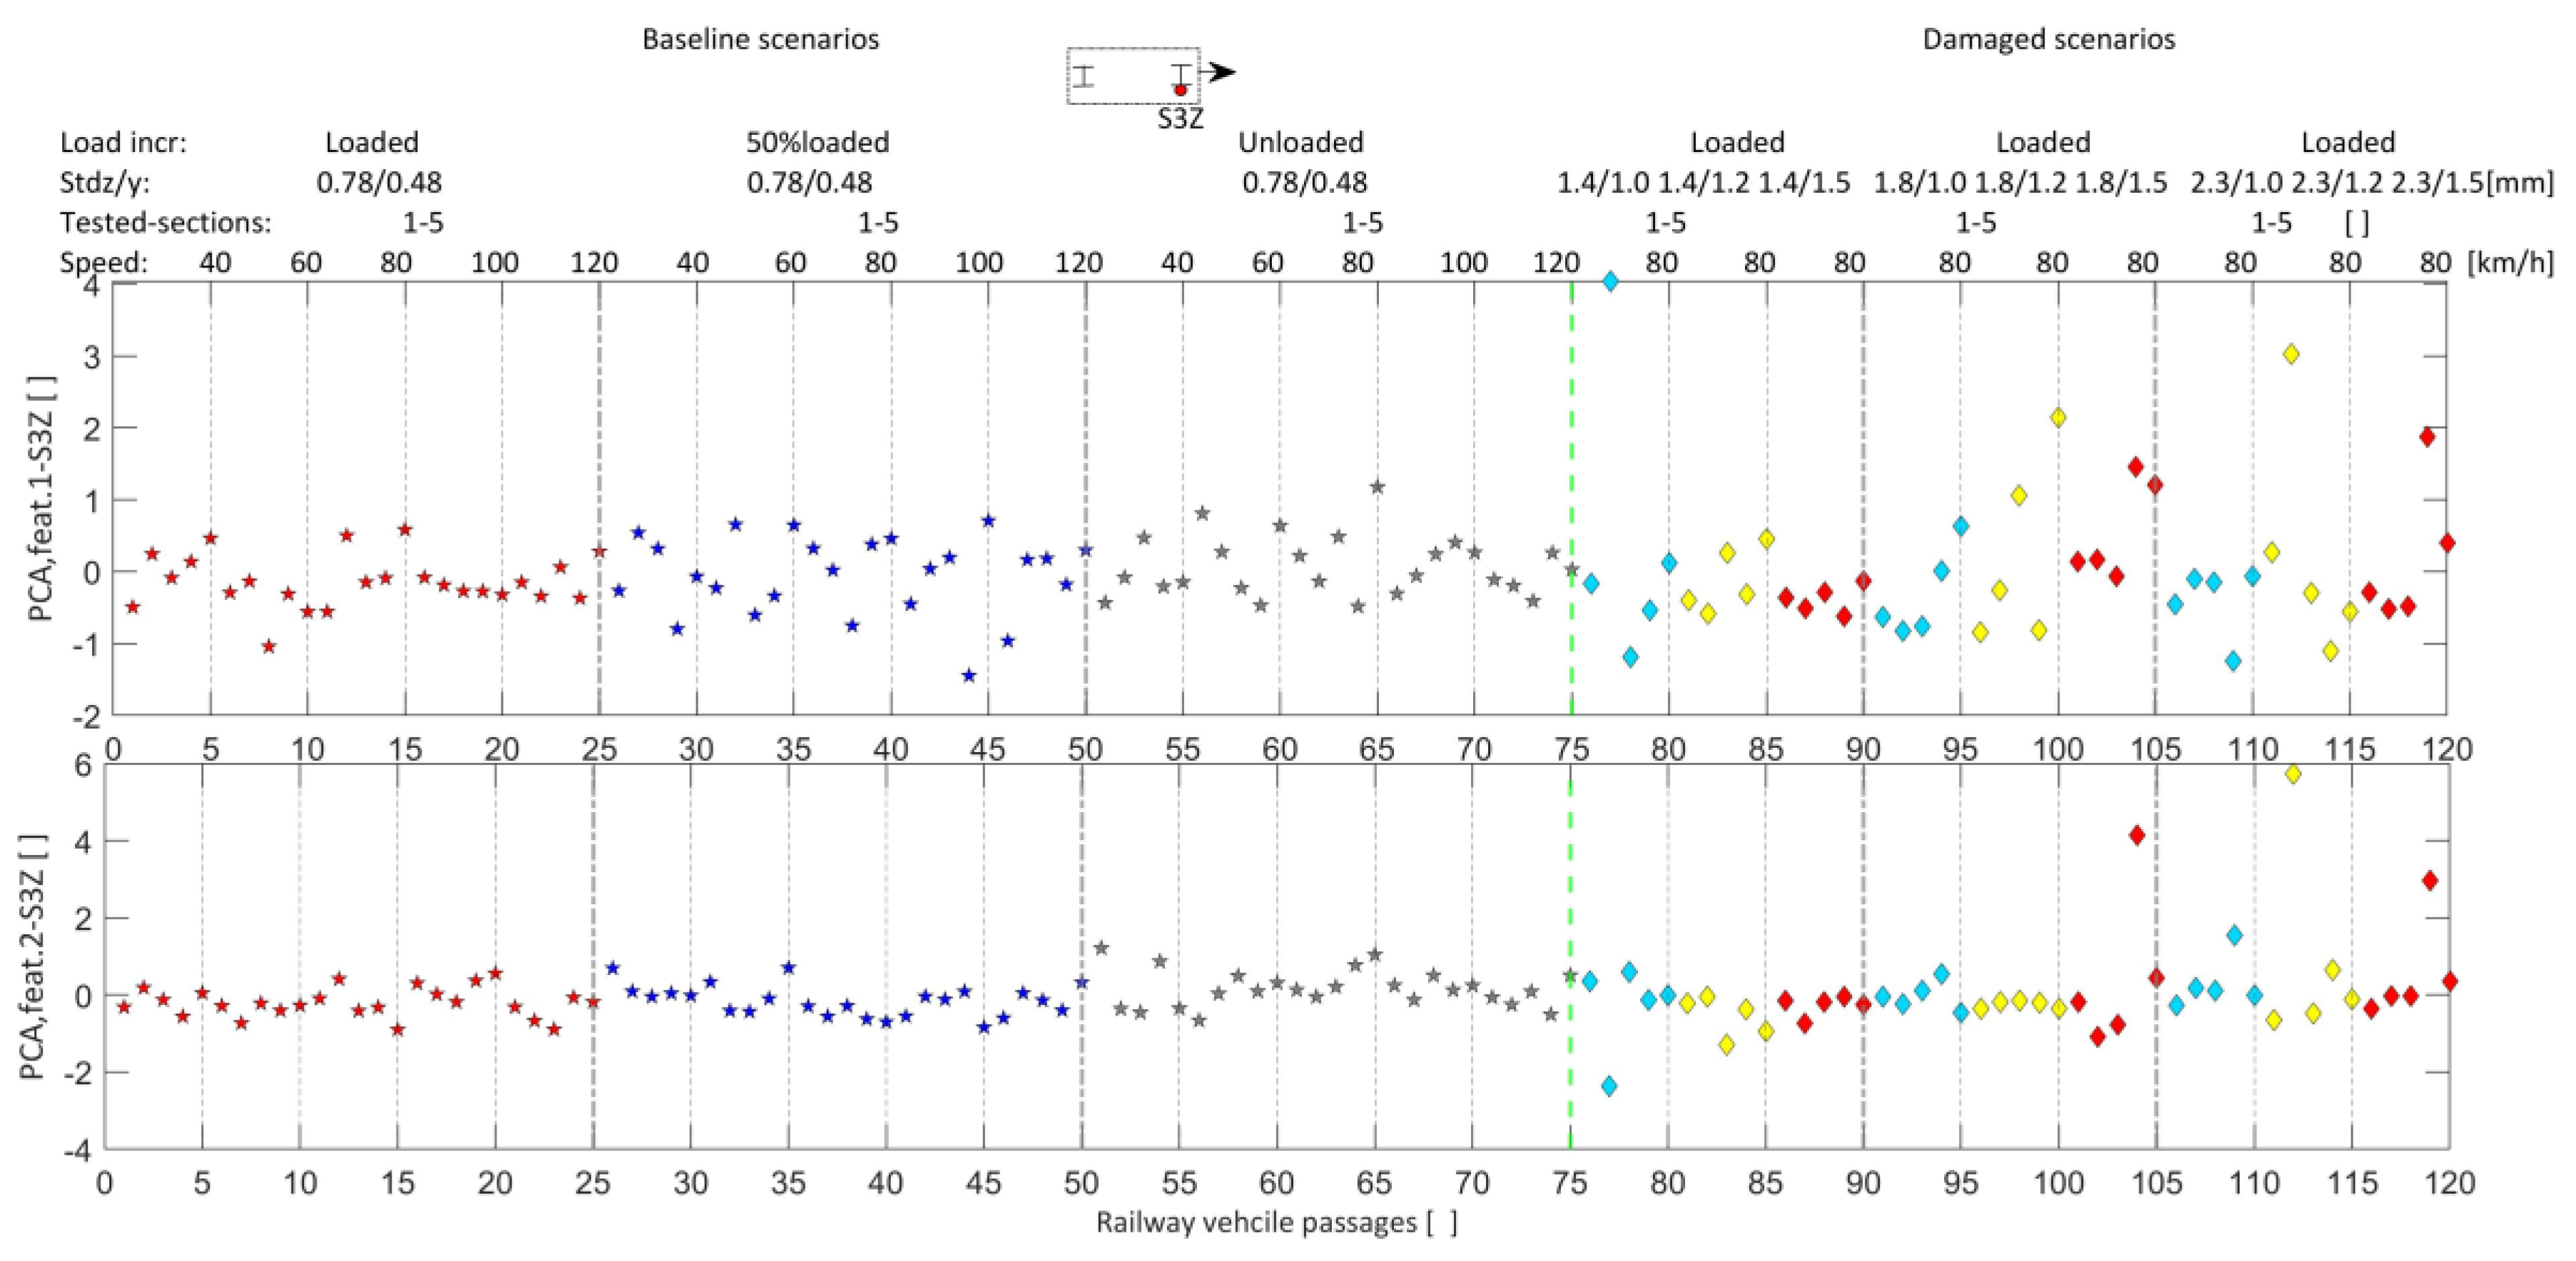
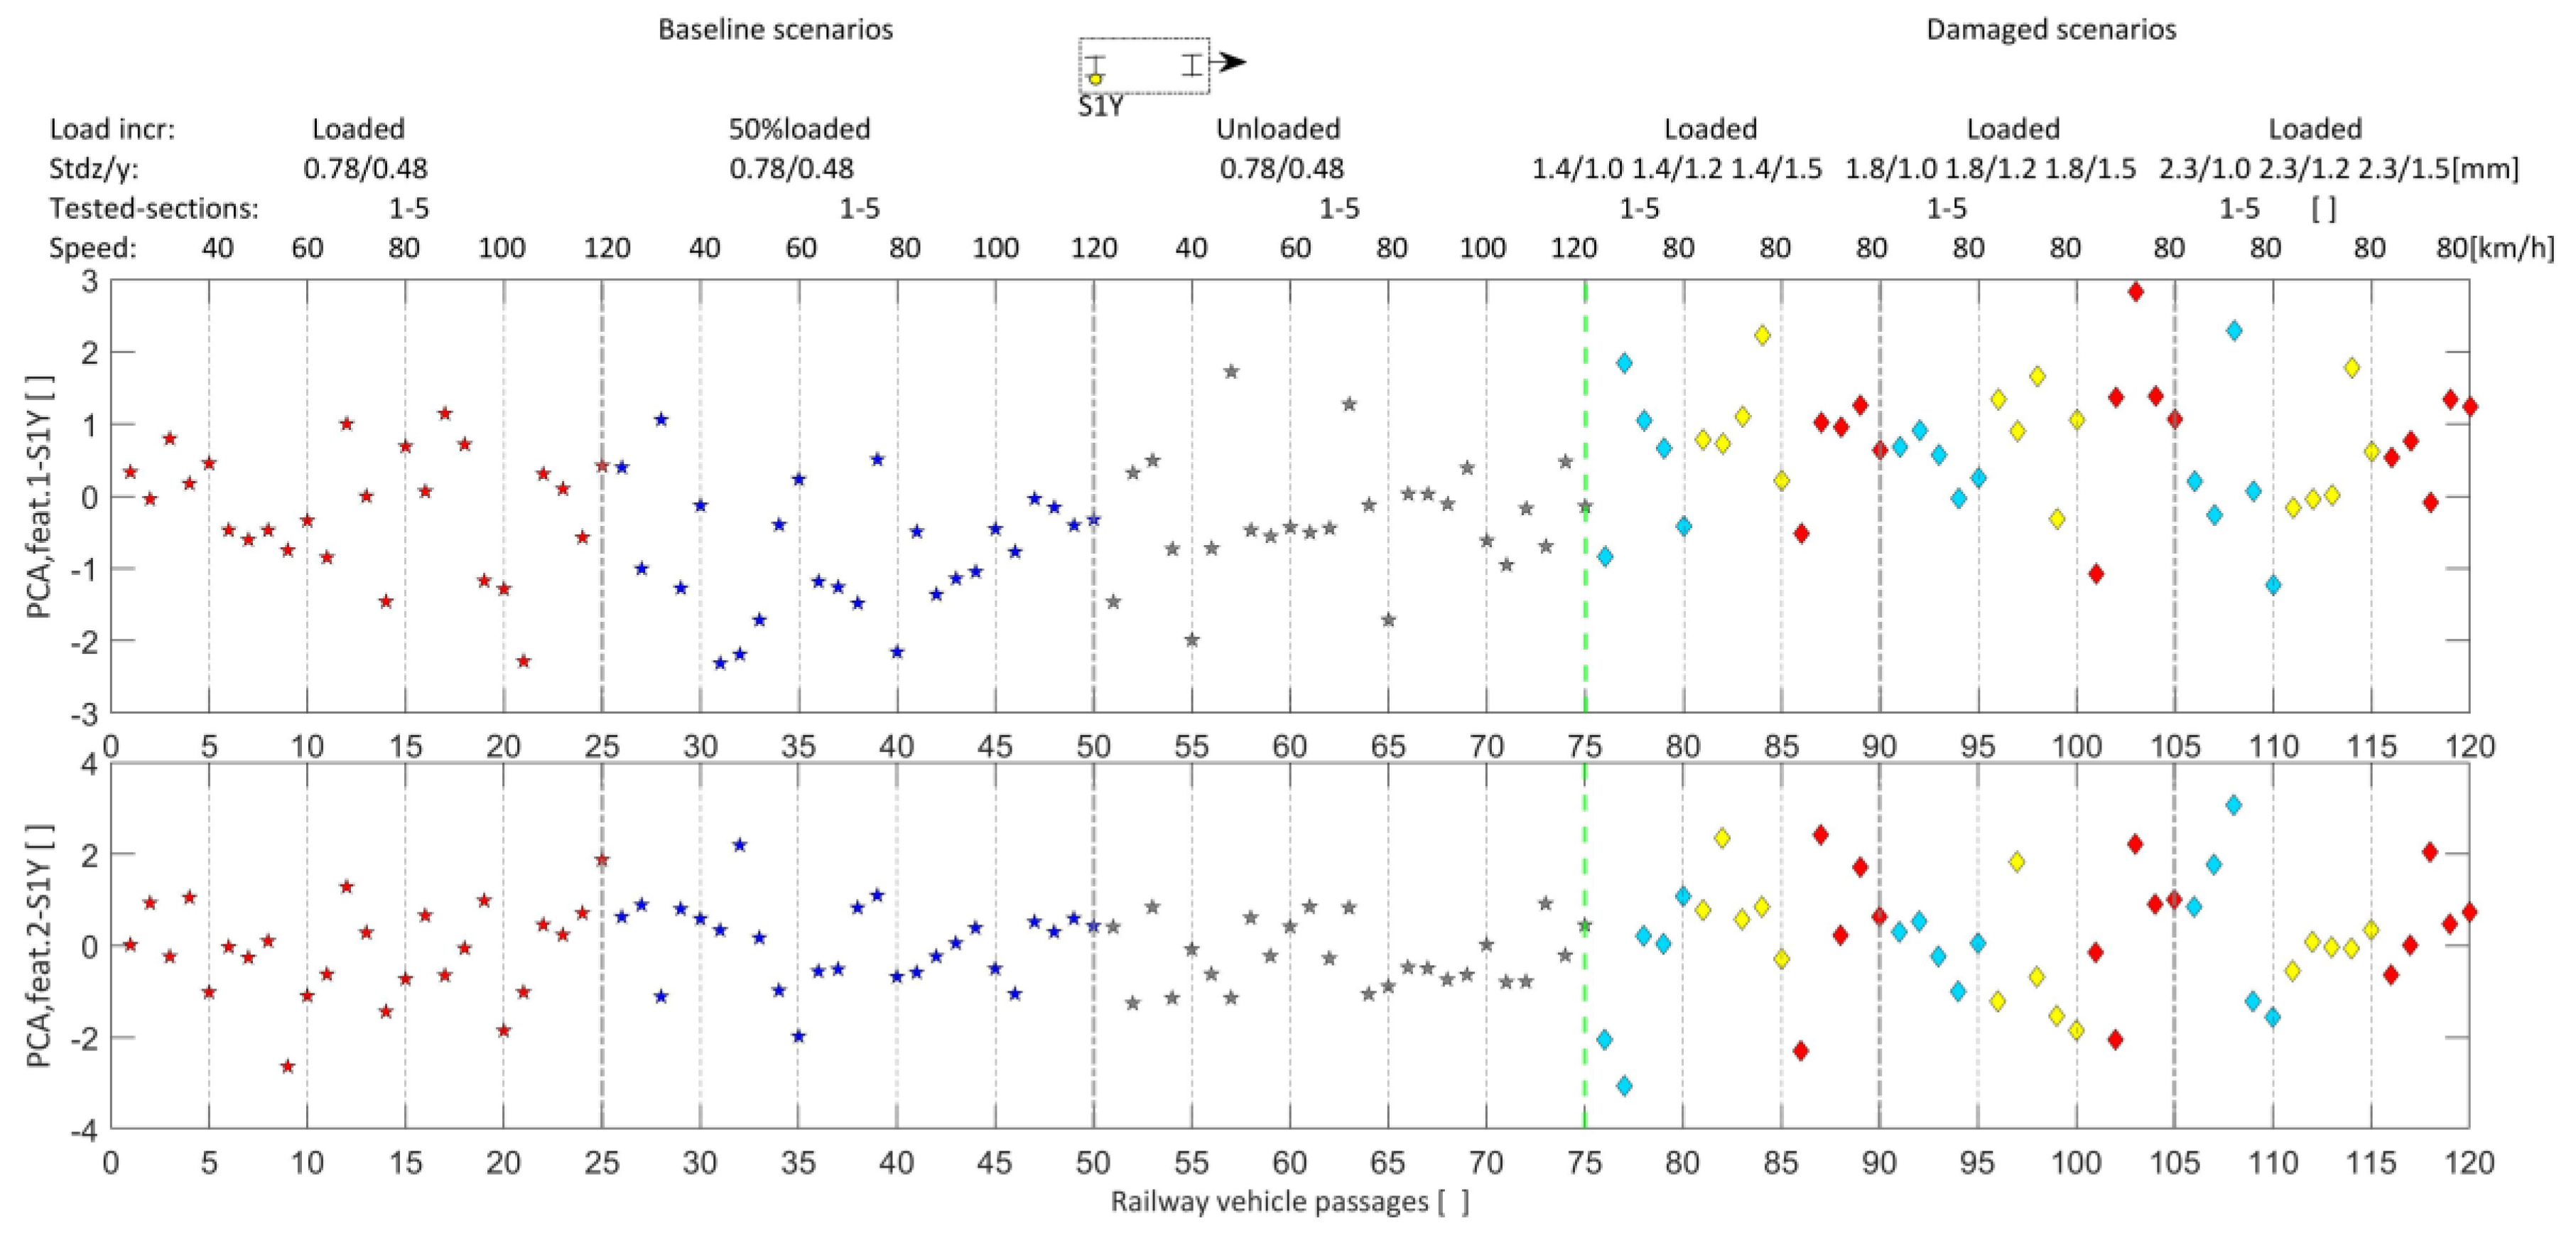
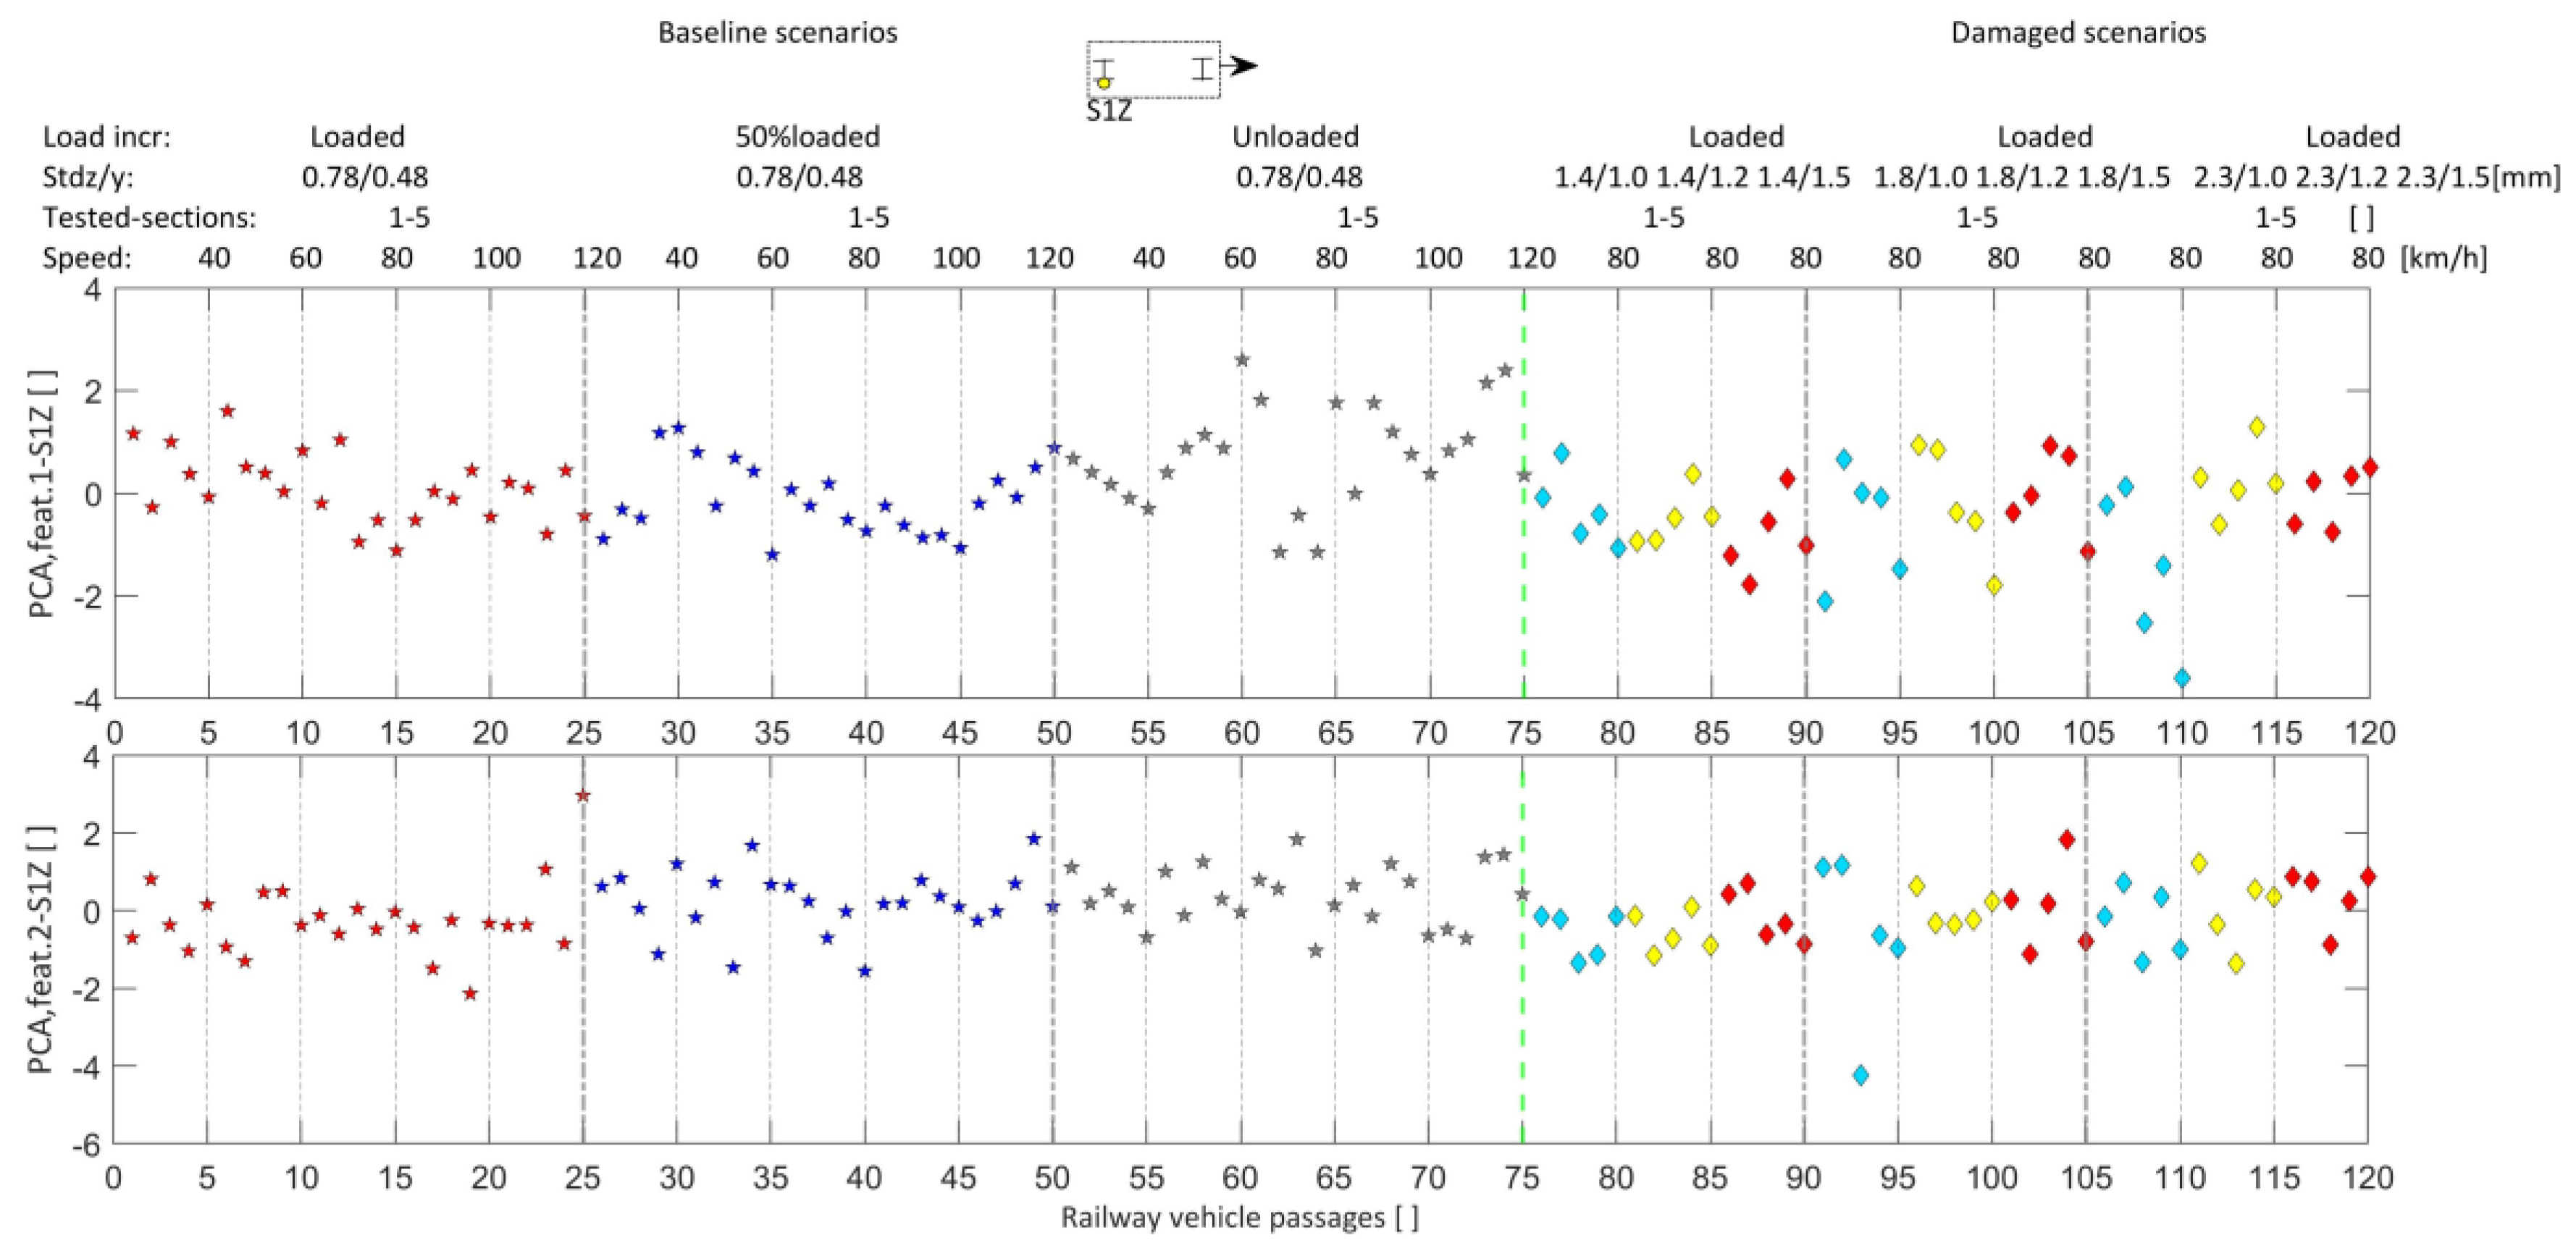
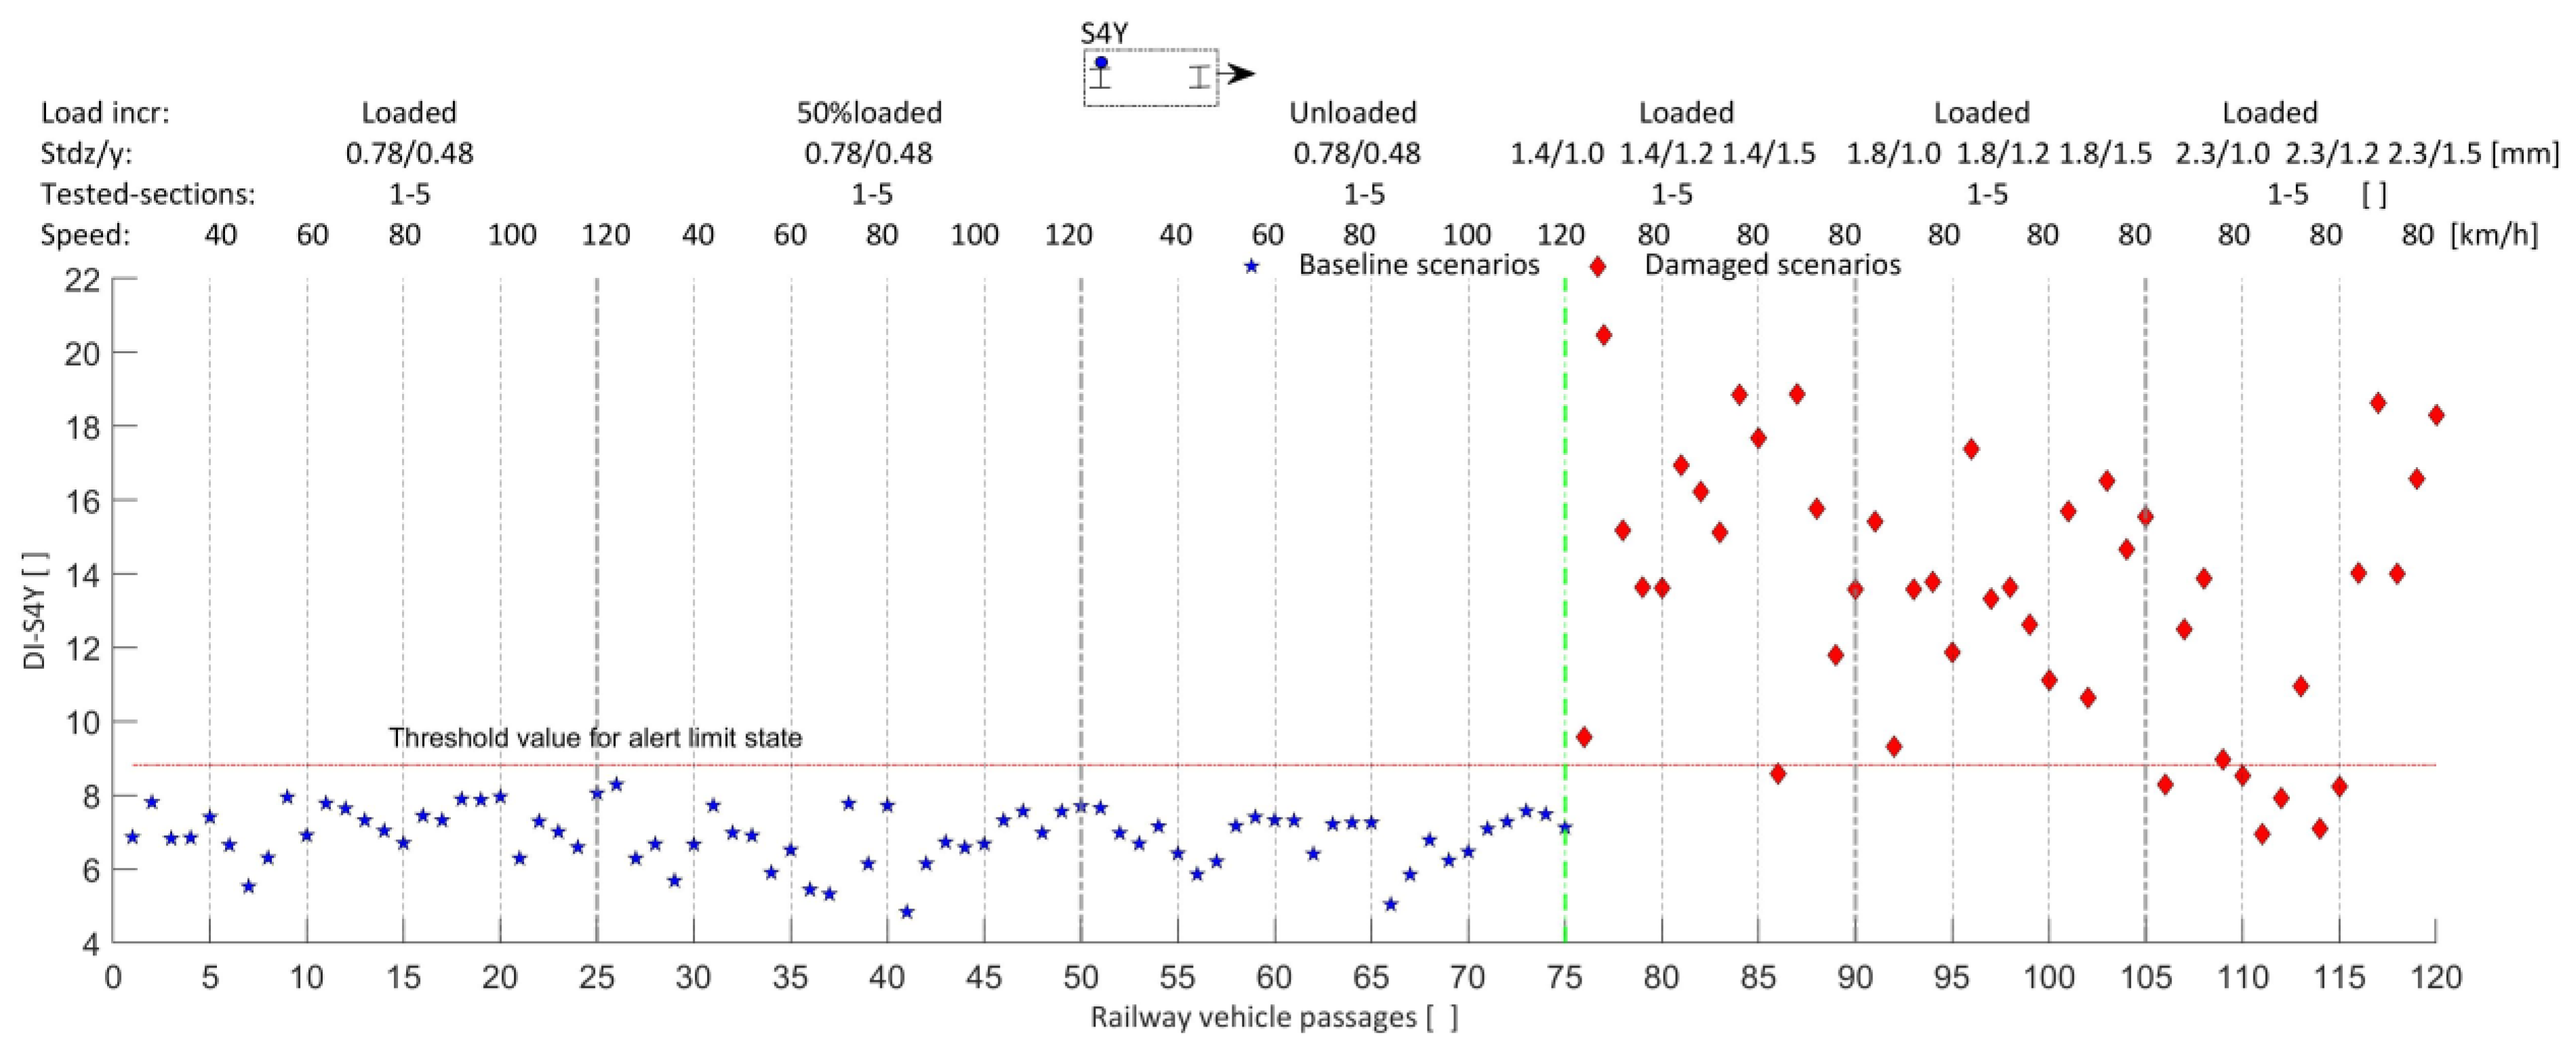
5.4. Data Fusion, Features Discrimination, and Outlier Analysis

Data fusion is the process of integrating data from multi-accelerometers to produce more consistent, accurate, and useful information than any individual feature or accelerometer. It improves the computational efficiency, data visualization, and interpretation, and increases the sensitivity of the features to the damage scenarios. As a result, a damage indicator ( D I ) is determined for each simulation and each tested track section. The Mahalanobis distance is a metric distance or similarity measure, used in machine learning to distinguish structural conditions. It is also understood as a fusion of multivariate data into a single D I , as referred to in Silva et al. [24], and Meixedo et al. [25]. The D I calculates the distance (i.e., dissimilarity or difference) between the damage and the baseline scenarios to state how severe each tested track section is compared to the normal condition. Since the features that characterize the vehicle vibration under damage and non-damage scenarios are stored in vectors, and the distance between two vectors always results in one value, this is what also leads to this process being called data fusion. This value is then used, together with a threshold (defined within a confidence boundary), to conclude whether a certain tested section of the railway track requires intervention, related to the alert limit state. Since D I and the threshold are automatically calculated, this process is called unsupervised machine learning. Equation (6) expresses the difference between several features, so that the baseline features are very similar (have close DI values between them) and very different from the damage-sensitive features, with a DI value mostly greater than the threshold. In Equation (6), D I i denotes the Mahalanobis damage indicator for each simulated railway vehicle passage ith, x i denotes a vector of m features representing the possible damage, x ¯ is the matrix of the mean values of the features estimated from the baseline scenarios, and S x is the covariance matrix of the baseline simulations. The D I i is computed for each simulation and each sensor resulting in a n × k matrix, whose entries are the D I i for the k accelerometer (s), and n is the total number of scenarios (baseline and damage scenarios). The subscript T denotes the transpose and S x 1 is the inverse of the covariance matrix. Then, a new D I i is determined, considering features from more than one sensor to obtain a vector n × 1 , i.e., a multi-sensor fusion from all the k = 8 , accelerometers.
D I i = x i x ¯ . S x 1 . x i x ¯ T
Feature discrimination is the last step in the AI-based methodology for the automatic damage detection. Based on the obtained results with the AR features, a confidence boundary (CB) of 99% [70] is considered to distinguish between the baseline and damage scenarios. The CB is determined by Equation (7), which expresses the Gaussian inverse cumulative distribution function (ICDF), considering the mean value ( μ ¯ ), and the standard deviation, σ , of the baseline scenarios, and for a significance level α . Where α corresponds to 1% of uncertainty, i.e., a 99% CB. This means that a certain tested section of the track is considered to have reached or exceeded the alert level, with an uncertainty of 1%. The value of 1% is also reported by Silva et al. [24] and Mosleh et al. [70]. The CB, in this case, is the mean of the estimated features, plus and minus the variance (standard deviation) of these estimated features. This is the range of values between which you expect your features that characterize a given condition to lie if you rerun the board test, within a confidence level of 99%. According to Tamhane [71], in statistics the upper confidence limit is a “conservative” approach.
C B = i n v   F x 1 α ,   with     F x μ ¯ , σ = 1 σ 2 π     α x e 1 2 x μ ¯ σ 2 d y ,   and     x ϵ R
For the detection of changes in the lateral alignment and longitudinal levelof the left rail, the features extracted from the axle box accelerations recorded by the back sensors, S4Y and S4Z (Figure 21 and Figure 22), are considered.
In order to find the detection accuracy and optimize the number of accelerometers, different axle box sensor locations are tested, for the lateral alignments and longitudinal level damage to both the left and right rails, using S4Y, S1Y, and sensors S2Y and S3Y (Figure 23, Figure 24, Figure 25, Figure 26, Figure 27 and Figure 28). The results depicted in Figure 23 and Figure 25 demonstrate that, in fact, the lateral accelerations of the vehicle are related to the lateral alignment damage to both the left and right rails.

5.5. Accuracy Assessment Based on Different Sensor Layouts

After the fusion of the features and the detection of damage, the reliability of the artificial intelligence model, in order to check its detection accuracy, for different sensor layout, is performed. For such purpose, detection accuracy is computed. The detection accuracy (%) is calculated by Equation (8), where TP and TN denote the true positive and true negative, respectively, and V P is the total number of vehicle passages.
Accuracy   ( % ) = TP + TN V P × 100
As shown in Table 5, the damage detection accuracy of the left rail lateral alignment (RRLA), right rail lateral alignment (RRLA), left rail longitudinal level (LRLL), and right rail longitudinal level (RRLL), varies according to the sensor location. In general, for all the sensors and for the fusion of all eight multi-sensors, the detection accuracy is greater than 94%, which is acceptable for engineering practice. In other words, the automated algorithm has acceptable accuracy for detecting longitudinal level and lateral alignment in railway tracks. As the accelerations are obtained from numerical modeling or data-driven processes, no evidence demonstrates that front sensors can better detect damage than rear sensors. Even more so because the sensors are not attached to the motor unit of a real vehicle. Moreover, the dynamic response of the front left axle is not the same as the lateral one, in a curved railway track, with different instances of damage along the railway length. Hence, in a curve, the rotational speed of the wheel on the outer rail and the wheel on the inner rail are different because the wheels describe the trajectory of the damaged track geometry. Therefore, the onboard registered axle box accelerations are different. Even so, for all the sensors, the accuracy is approximate.

6. Conclusions

The application of the AI-based methodology and axle box accelerations, recorded by simulated onboard monitoring systems in in-service freight railway vehicles traveling on railway tracks, demonstrated acceptable robustness for the automatic detection of early damage to tracks under an alert limit state. For all locations of the accelerometers, the detection accuracy of the damaged longitudinal level, lateral alignment, cross level, and twist is greater or equal to 94% of detection accuracy. This is because there are track-tested sections where the standard deviation of the longitudinal level and lateral alignment over a given window length is less than the amplitude of the track irregularities corresponding to the baseline scenarios. It means that for the track-tested sections where the damaged scenarios are less than the threshold value, no maintenance needs to be planned for a considered speed of 80 km/h and the considered baseline scenarios. The application of autoregressive models enabled the extraction of features from the dynamic vehicle responses for the computation of damage indicators for track damage identification, instead of using the measurements in the time domain. The deployment of the data normalization, based on the principal components, permitted the compression of vehicle vibration measurement (big data), improving the computational efficiency. Although the methodologies for track damage simulation and damage detection methodologies are valid for a freight railway in-service vehicle and simulated accelerations, it has the robustness to be implemented for any type of railway in-service vehicle and onboard dynamic measurements. It can also be adapted for damage identification in track-bridge transition zones, short-span railway bridges, and vehicle wheels. Furthermore, the developed approach can also be used for early warning for passenger comfort, and unbalanced loads affecting mainly freight vehicles. Further studies are recommended to detect other types of damage, likewise bridge twist, track twist, and cross level.
Regarding the literature review on onboard dynamic monitoring using sensors in in-service vehicles, the following conclusion can be drawn. The accelerations registered on the car body of railway vehicles for the assessment of railway track conditions still have a large margin of progression, mainly for low speed and early damage. Since, the dynamic effects induced in the vehicle are transferred to the car body after being attenuated by the suspension. Hence, it is reasonable to affirm that, mainly for freight where the loading condition is important, the axle boxes are much more sensitive sensor locations. From the literature review conducted, it is concluded that four (only on the front or rear axles), or at most eight, biaxial accelerometers (on both the front and rear axles of the same bogie) allow the longitudinal level and alignment of both rails to be evaluated, for the sake of redundancy in the vehicle vibration signals and the reliability of measurements.

Author Contributions

Applications of damage detection methodology for the assessment of railway track maintenance condition using axle box accelerations, N.T.; Railway vehicle–track dynamic modeling and results discussion, N.T., C.V., P.M. and D.R.; Resources, C.V., D.R. and R.C.; Simulation of track geometric damage, N.T., C.V. and P.M., Development of the idea on the combination of track geometric damage, N.T., Writing—original draft, N.T.; Review & editing, C.V., D.R., R.C., P.M., A.M. (Andreia Meixedo) and A.M. (Araliya Mosleh); Supervision, R.C., C.V. and D.R. All authors have read and agreed to the published version of the manuscript.

Funding

This work was financially supported by Base Funding-UIDB/04708/2020 and Programmatic Funding-UIDP/04708/2020 from the CONSTRUCT—Instituto de Estruturas e Construções, funded by national funds through the FCT/MCTES (PIDDAC). The paper reflects the research developed in the ambit of the project Way4SafeRail, NORTE-01-0247- FEDER-069595, founded by Agência Nacional de Inovação S.A., program P2020|COMPETE—Projetos em Copromoção. This work is the result of project “FERROVIA 4.0”, with reference POCI-01-0247-FEDER- 046111, co-funded by the European Regional Development Fund (ERDF), through the Operational Programme for Competitiveness and Internationalization (COMPETE 2020) and the Lisbon Regional Operational Programme (LISBOA 2020), under the PORTUGAL 2020 Partnership Agreement. This work is a result of Agenda “SMART WAGONS—Development of Production Capacity in Portugal of Smart Wagons for Freight”, nr. C644940527-00000048, investment project nr. 27, financed by the Recovery and Resilience Plan (PRR) and by European Union—NextGeneration EU.

Data Availability Statement

Not applicable.

Conflicts of Interest

The authors declare no conflict of interest.

References

  1. Vale, C.; Lurdes, S.M. Stochastic Model for the Geometrical Rail Track Degradation Process in the Portuguese Railway Northern Line. Reliab. Eng. Syst. Saf. 2013, 116, 91–98. [Google Scholar] [CrossRef]
  2. Abadi, T.; Le Pen, L.; Zervos, A.; Powrie, W. Effect of Sleeper Interventions on Railway Track Performance. J. Geotech. Geoenviron. Eng. 2019, 145, 04019009. [Google Scholar] [CrossRef]
  3. Harris, D.K.; Lutch, R.H.; Ahlborn, T.M.; Duong, P. Optimization of a Prestressed Concrete Railroad Crosstie for Heavy-Haul Applications. J. Transp. Eng. 2011, 137, 815–822. [Google Scholar] [CrossRef]
  4. Frýba, L. Dynamics of Railway Bridges, 2nd ed.; Academy of Scientes of Sciences Czeh Republic: Prague, Czeh Republic, 1996; p. 332. [Google Scholar] [CrossRef]
  5. Claus, H.; Schiehlen, W. Modeling and Simulation of Railway Bogie Structural Vibrations. Veh. Syst. Dyn. 1998, 29, 538–552. [Google Scholar] [CrossRef]
  6. Tsunashima, H. Condition Monitoring of Railway Tracks from Car-Body Vibration Using a Machine Learning Technique. Appl. Sci. 2019, 9, 2734. [Google Scholar] [CrossRef]
  7. Balouchi, F.; Bevan, A.; Formston, R. Development of Railway Track Condition Monitoring from Multi-Train in-Service Vehicles. Veh. Syst. Dyn. 2021, 59, 1397–1417. [Google Scholar] [CrossRef]
  8. Choi, S. Identifying Parametric Models Used to Estimate Track Irregularities of a High-Speed Railway. Machines 2023, 11, 6. [Google Scholar] [CrossRef]
  9. Tan, C.; Elhattab, A.; Uddin, N. “Drive-by’’ Bridge Frequency-Based Monitoring Utilizing Wavelet Transform. J. Civ. Struct. Health Monit. 2017, 7, 615–625. [Google Scholar] [CrossRef]
  10. Souza, E.F.; Bragança, C.; Meixedo, A.; Ribeiro, D.; Bittencourt, T.N.; Carvalho, H. Drive-by Methodologies Applied to Railway Infrastructure Subsystems: A Literature Review—Part I: Bridges and Viaducts. Appl. Sci. 2023, 13, 6940. [Google Scholar] [CrossRef]
  11. Bragança, C.; Souza, E.F.; Ribeiro, D.; Meixedo, A.; Bittencourt, T.N.; Carvalho, H. Drive-by Methodologies Applied to Railway Infrastructure Subsystems: A Literature Review—Part II: Track and Vehicle. Appl. Sci. 2023, 13, 6982. [Google Scholar] [CrossRef]
  12. Malekjafarian, A.; Obrien, E.J.; Quirke, P.; Cantero, D.; Golpayegani, F. Railway Track Loss-of-Stiffness Detection Using Bogie Filtered Displacement Data Measured on a Passing Train. Infrastructures 2021, 6, 93. [Google Scholar] [CrossRef]
  13. Sun, L.; Shang, Z.; Xia, Y.; Bhowmick, S.; Nagarajaiah, S. Review of Bridge Structural Health Monitoring Aided by Big Data and Artificial Intelligence: From Condition Assessment to Damage Detection. J. Struct. Eng. 2020, 146, 04020073. [Google Scholar] [CrossRef]
  14. Bosso, N.; Magelli, M.; Trinchero, R.; Zampieri, N. Application of Machine Learning Techniques to Build Digital Twins for Long Train Dynamics Simulations. Veh. Syst. Dyn. 2023, 1–20. [Google Scholar] [CrossRef]
  15. Memon, T.R.; Memon, T.D.; Chowdhry, B.S.; Kalwar, I.H.; Mal, K. Development of Specialized IoT Cloud Platform for Railway Track Condition Monitoring. In Proceedings of the 2021 International Conference on Robotics and Automation in Industry (ICRAI), Rawalpindi, Pakistan, 26–27 October 2021; pp. 1–4. [Google Scholar] [CrossRef]
  16. Ren, J.-J.; Liu, W.; Du, W.; Zheng, J.-L.; Wei, H.; Zhang, K.-Y.; Ye, W.-L. Identification Method for Subgrade Settlement of Ballastless Track Based on Vehicle Vibration Signals and Machine Learning. Constr. Build. Mater. 2023, 369, 130573. [Google Scholar] [CrossRef]
  17. Ribeiro, D.; Calçada, R.; Delgado, R.; Brehm, M.; Zabel, V. Finite-Element Model Calibration of a Railway Vehicle Based on Experimental Modal Parameters. Veh. Syst. Dyn. 2013, 51, 821–856. [Google Scholar] [CrossRef]
  18. Lederman, G.; Chen, S.; Garrett, J.H.; Kovačević, J.; Noh, H.Y.; Bielak, J. Track Monitoring from the Dynamic Response of a Passing Train: A sparse Approach. Mech. Syst. Signal Process. 2017, 90, 141–153. [Google Scholar] [CrossRef]
  19. Malekjafarian, A.; Obrien, E.; Quirke, P.; Bowe, C. Railway Track Monitoring Using Train Measurements: An Experimental Case Study. Appl. Sci. 2019, 9, 4859. [Google Scholar] [CrossRef]
  20. Li, J.; Shi, H. Rail Corrugation Diagnosis of High-Speed Railway Based on Dynamic Responses of the Vehicle. In Proceedings of the 2020 Prognostics and Health Management Conference (PHM-Besançon), Besancon, France, 4–7 May 2020; pp. 148–152. [Google Scholar] [CrossRef]
  21. Kostić, B.; Gül, M. Vibration-Based Damage Detection of Bridges under Varying Temperature Effects Using Time-Series Analysis and Artificial Neural Networks. J. Bridge Eng. 2017, 22, 04017065. [Google Scholar] [CrossRef]
  22. Lee, K.; Jeong, S.; Sim, S.-H.; Shin, D.H. Damage-Detection Approach for Bridges with Multi-Vehicle Loads Using Convolutional Autoencoder. Sensors 2022, 22, 1839. [Google Scholar] [CrossRef]
  23. Huang, M.-S.; Gül, M.; Zhu, H.-P. Vibration-Based Structural Damage Identification under Varying Temperature Effects. J. Aerosp. Eng. 2018, 31, 04018014. [Google Scholar] [CrossRef]
  24. Silva, R.; Guedes, A.; Ribeiro, D.; Vale, C.; Meixedo, A.; Mosleh, A.; Montenegro, P. Early Identification of Unbalanced Freight Traffic Loads Based on Wayside Monitoring and Artificial Intelligence. Sensors 2023, 23, 1544. [Google Scholar] [CrossRef] [PubMed]
  25. Meixedo, A.; Santos, J.; Ribeiro, D.; Calçada, R.; Todd, M. Damage Detection in Railway Bridges Using Traffic-Induced Dynamic Responses. Eng. Struct. 2021, 238, 112189. [Google Scholar] [CrossRef]
  26. Malekjafarian, A.; Sarrabezolles, C.; Khan, M.; Golpayegani, F. A Machine-Learning-Based Approach for Railway Track Monitoring Using Acceleration Measured on an In-Service Train. Sensors 2023, 23, 7568. [Google Scholar] [CrossRef] [PubMed]
  27. Song, Y.; Wang, Z.; Liu, Z.; Wang, R. A Spatial Coupling Model to Study Dynamic Performance of Pantograph-Catenary with Vehicle-Track Excitation. Mech. Syst. Signal Process. 2021, 151, 107336. [Google Scholar] [CrossRef]
  28. Xia, X.; Meng, Z.; Han, X.; Li, H.; Tsukiji, T.; Xu, R.; Zheng, Z.; Ma, J. An Automated Driving Systems Data Acquisition and Analytics Platform. Transp. Res. Part C Emerg. Technol. 2023, 151, 104120. [Google Scholar] [CrossRef]
  29. Xia, X.; Bhatt, N.P.; Khajepour, A.; Hashemi, E. Integrated Inertial-LiDAR-Based Map Matching Localization for Varying Environments. IEEE Trans. Intell. Veh. 2023, 99, 1–12. [Google Scholar] [CrossRef]
  30. Tsunashima, H.; Hirose, R. Condition Monitoring of Railway Track from Car-Body Vibration Using Time-Frequency Analysis. Veh. Syst. Dyn. 2022, 60, 1170–1187. [Google Scholar] [CrossRef]
  31. Quirke, P.; Bowe, C.; Obrien, E.J.; Cantero, D.; Antolin, P.; Goicolea, J.M. Railway Bridge Damage Detection Using Vehicle-Based Inertial Measurements and Apparent Profile. Eng. Struct. 2017, 153, 421–442. [Google Scholar] [CrossRef]
  32. SIMPACK®, Multibody System Simulation, Dassault Systemes Simulia Corp.: Eagan, MN, USA, 2021.
  33. Chang, C.; Ding, X.; Ling, L.; Li, F.; Liu, T.; Wang, K.; Zhai, W. Mechanism of High-Speed Train Carbody Shaking Due to Degradation of Wheel-Rail Contact Geometry. Int. J. Rail Transp. 2022, 11, 289–316. [Google Scholar] [CrossRef]
  34. Ng, A.K.; Martua, L.; Sun, G. Dynamic Modelling and Acceleration Signal Analysis of Rail Surface Defects for Enhanced Rail Condition Monitoring and Diagnosis. In Proceedings of the 2019 4th International Conference on Intelligent Transportation Engineering (ICITE), Singapore, 6–8 September 2019; pp. 69–73. [Google Scholar] [CrossRef]
  35. Belov, I.V.; Shalymov, R.V.; Tkachenko, A.N.; Larionov, D.Y.; Podgornaya, L.N. Development of an Algorithm for Detecting Railway Corrugations in Acceleration Data. In Proceedings of the 2021 IEEE Conference of Russian Young Researchers in Electrical and Electronic Engineering (ElConRus), St. Petersburg and Moscow, Russia, 26–29 January 2021; pp. 1609–1613. [Google Scholar] [CrossRef]
  36. Zhuang, L.; Qi, H.; Zhang, Z. The Automatic Rail Surface Multi-Flaw Identification Based on a Deep Learning Powered Framework. IEEE Trans. Intell. Transp. Syst. 2022, 23, 12133–12143. [Google Scholar] [CrossRef]
  37. Erduran, E.; Pettersen, F.M.; Gonen, S.; Lau, A. Identification of Vibration Frequencies of Railway Bridges from Train-Mounted Sensors Using Wavelet Transformation. Sensors 2023, 23, 1191. [Google Scholar] [CrossRef] [PubMed]
  38. Wang, Y.; Wang, Y.; Ni, Y.; Ni, Y.; Wang, X.; Wang, X. Real-Time Defect Detection of High-Speed Train Wheels by Using Bayesian Forecasting and Dynamic Model. Mech. Syst. Signal Process. 2020, 139, 106654. [Google Scholar] [CrossRef]
  39. Flynn, E.B.; Todd, M.D. A Bayesian Approach to Optimal Sensor Placement for Structural Health Monitoring with Application to Active Sensing. Mech. Syst. Signal Process. 2010, 24, 891–903. [Google Scholar] [CrossRef]
  40. Sun, Z.; Lu, J.; Sun, J. Online Dynamic Detection of Hazardous Cracks in Train Wheels by Probe Combination: Based on Classical Piezoelectric Ultrasonic Technology. IEEE Trans. Instrum. Meas. 2023, 72, 1–10. [Google Scholar] [CrossRef]
  41. Auersch, L. Simultaneous Measurements of the Vehicle, Track, and Soil Vibrations at a Surface, Bridge, and Tunnel Railway Line. Shock Vib. 2017, 2017, 11959286. [Google Scholar] [CrossRef]
  42. König, P.; Salcher, P.; Adam, C.; Hirzinger, B. Dynamic Analysis of Railway Bridges Exposed to High-Speed Trains Considering the Vehicle–Track–Bridge–Soil Interaction. Acta Mech. 2021, 232, 4583–4608. [Google Scholar] [CrossRef]
  43. Silva, R.; Ribeiro, D.; Bragança, C.; Costa, C.; Arêde, A.; Calçada, R. Model Updating of a Freight Wagon Based on Dynamic Tests under Different Loading Scenarios. Appl. Sci. 2021, 11, 10691. [Google Scholar] [CrossRef]
  44. Bragança, C.; Neto, J.; Pinto, N.; Montenegro, P.A.; Ribeiro, D.; Carvalho, H.; Calçada, R. Calibration and Validation of a Freight Wagon Dynamic Model in Operating Conditions Based on Limited Experimental Data. Veh. Syst. Dyn. 2022, 60, 3024–3050. [Google Scholar] [CrossRef]
  45. Zhai, W.; Han, Z.; Chen, Z.; Ling, L.; Zhu, S. Train–Track–Bridge Dynamic Interaction: A State-of-the-Art Review. Veh. Syst. Dyn. 2019, 57, 984–1027. [Google Scholar] [CrossRef]
  46. Zhang, D.; Zhai, W.; Wang, K. Dynamic Interaction between Heavy-Haul Train and Track Structure Due to Increasing Axle Load. Aust. J. Struct. Eng. 2017, 18, 190–203. [Google Scholar] [CrossRef]
  47. Lou, P.; Gong, K.; Zhao, C.; Xu, Q.; Luo, R.K. Dynamic Responses of Vehicle-CRTS III Slab Track System and Vehicle Running Safety Subjected to Uniform Seismic Excitation. Shock Vib. 2019, 2019, 5308209. [Google Scholar] [CrossRef]
  48. Wu, X.; Liang, S.; Chi, M. An Investigation of Rocking Derailment of Railway Vehicles under the Earthquake Excitation. Eng. Fail. Anal. 2020, 117, 104913. [Google Scholar] [CrossRef]
  49. Choi, J.-Y.; Chung, J.-S.; Kim, S.-H. Experimental Study on Track-Bridge Interactions for Direct Fixation Track on Long-Span Railway Bridge. Shock Vib. 2019, 2019, 1903752. [Google Scholar] [CrossRef]
  50. Yin, X.; Wei, X.; Zheng, H. Applying System Dynamics of Discrete Supported Track to Analyze the Rail Corrugation Causation on Curved Urban Railway Tracks. Discret. Dyn. Nat. Soc. 2021, 2021, 9958163. [Google Scholar] [CrossRef]
  51. Carnevale, M.; Collina, A.; Peirlinck, T. A Feasibility Study of the Drive-By Method for Damage Detection in Railway Bridges. Appl. Sci. 2019, 9, 160. [Google Scholar] [CrossRef]
  52. Bernal, E.; Spiryagin, M.; Vollebregt, E.; Oldknow, K.; Stichel, S.; Shrestha, S.; Ahmad, S.; Wu, Q.; Sun, Y.; Cole, C. Prediction of Rail Surface Damage in Locomotive Traction Operations Using Laboratory-Field Measured and Calibrated Data. Eng. Fail. Anal. 2022, 135, 106165. [Google Scholar] [CrossRef]
  53. Chang, C.; Ling, L.; Han, Z.; Wang, K.; Zhai, W. High-Speed Train-Track-Bridge Dynamic Interaction Considering Wheel-Rail Contact Nonlinearity Due to Wheel Hollow Wear. Shock Vib. 2019, 2019, 5874678. [Google Scholar] [CrossRef]
  54. Mosleh, A.; Montenegro, P.; Costa, P.A.; Calçada, R. An Approach for Wheel Flat Detection of Railway Train Wheels Using Envelope Spectrum Analysis. Struct. Infrastruct. Eng. 2021, 17, 1710–1729. [Google Scholar] [CrossRef]
  55. Xue, R.; Ren, Z.; Fan, T.; Rakheja, S. Vertical Vibration Analysis of a Coupled Vehicle-Container Model of a High-Speed Freight EMU. Veh. Syst. Dyn. 2020, 60, 1228–1252. [Google Scholar] [CrossRef]
  56. Bernal, E.; Spiryagin, M.; Cole, C. Onboard Condition Monitoring Sensors, Systems and Techniques for Freight Railway Vehicles: A Review. IEEE Sens. J. 2019, 19, 4–24. [Google Scholar] [CrossRef]
  57. EN13848-5:2008+A1:2015; Via-Qualidade Geométrica, Parte 5: Níveis De Qualidade Da Geometria Da Via-Plena Via. European Committee for Standarization, CEN: Brussels, Belgium, 2015; p. 20. (In Portuguese)
  58. Bezin, Y.; Iwnicki, S.D.; Cavalletti, M.; de Vries, E.; Shahzad, F.; Evans, G. An Investigation of Sleeper Voids Using a Flexible Track Model Integrated with Railway Multi-Body Dynamics. Proc. Inst. Mech. Eng. Part F J. Rail Rapid Transit 2009, 223, 597–607. [Google Scholar] [CrossRef]
  59. Carlberger, A.; Torstensson, P.T.; Nielsen, J.C.; Frid, A. An Iterative Methodology for the Prediction of Dynamic Vehicle–Track Interaction and Long-Term Periodic Rail Wear. Proc. Inst. Mech. Eng. Part F J. Rail Rapid Transit 2018, 232, 1718–1730. [Google Scholar] [CrossRef]
  60. Bezin, Y.; Sambo, B.; Magalhaes, H.; Kik, W.; Megna, G.; Costa, J.N. Challenges and methodology for pre-processing measured and new rail profiles to efficiently simulate wheel-rail interaction in switches and crossing. Veh. Syst. Dyn. 2023, 61, 799–820. [Google Scholar] [CrossRef]
  61. Neto, J.; Montenegro, P.A.; Vale, C.; Calçada, R. Evaluation of the Train Running Safety under Crosswinds—A Numerical Study on the Influence of the Wind Speed and Orientation Considering the Normative Chinese Hat Model. Int. J. Rail Transp. 2020, 9, 204–231. [Google Scholar] [CrossRef]
  62. Zhai, W.; Wang, K.; Cai, C. Fundamentals of Vehicle–Track Coupled Dynamics. Veh. Syst. Dyn. 2009, 47, 1349–1376. [Google Scholar] [CrossRef]
  63. Montenegro, P.; Neves, S.; Calçada, R.; Tanabe, M.; Sogabe, M. Wheel–Rail Contact Formulation for Analyzing the Lateral Train–Structure Dynamic Interaction. Comput. Struct. 2015, 152, 200–214. [Google Scholar] [CrossRef]
  64. Polach, O. A Fast Wheel-Rail Forces Calculation Computer Code. Veh. Syst. Dyn. 2021, 33, 728–739. [Google Scholar] [CrossRef]
  65. Yan, W.; Fischer, F.D. Applicability of the Hertz Contact Theory to Rail-Wheel Contact Problems. Arch. Appl. Mech. 2000, 70, 255–268. [Google Scholar] [CrossRef]
  66. Kalker, J.J. A Fast Algorithm for the Simplified Theory of Rolling Contact. Veh. Syst. Dyn. 1982, 11, 1–13. [Google Scholar] [CrossRef]
  67. Six, K.; Meierhofer, A.; Müller, G.; Dietmaier, P. Physical Processes in Wheel–Rail Contact and Its Implications on Vehicle–Track Interaction. Veh. Syst. Dyn. 2015, 53, 635–650. [Google Scholar] [CrossRef]
  68. Liu, B.; Mei, T.; Bruni, S. Design and Optimisation of Wheel–Rail Profiles for Adhesion Improvement. Veh. Syst. Dyn. 2018, 54, 429–444. [Google Scholar] [CrossRef]
  69. MATLAB6®, Version 2018; Themathworks Inc.: Natick, Ma, USA, 2018.
  70. Mosleh, A.; Meixedo, A.; Ribeiro, D.; Montenegro, P.; Calçada, R. Automatic Clustering-Based Approach for Train Wheels Condition Monitoring. Int. J. Rail Transp. 2022, 11, 639–664. [Google Scholar] [CrossRef]
  71. Tamhane, A.C. Statistical Analysis of Designed Experiments; John Wiley & Sons, Inc.: Hoboken, NJ, USA, 2009; p. 708. [Google Scholar] [CrossRef]
Figure 1. The wagon of the freight vehicle (Laagrss) (a) and leaf-type suspension system (b) [44].
Machines 11 00981 g001
Figure 2. Model of the vehicle–track multi-body dynamic system.
Machines 11 00981 g002
Figure 3. Vehicle dynamic responses with noise and filtered for: (a) BSC3 and S1Z, 80 km/h; (b) BSC4 and S1Z, 100 km/h; (c) DSC8 and S1Y, 80 km/h; (d) DSC8 and S1Z, 80 km/h.
Machines 11 00981 g003
Figure 4. Flowchart for automated damage detection on railway track using onboard sensors.
Machines 11 00981 g004
Figure 5. Convergence analysis and selection of suitable autoregressive model order based on AIC.
Machines 11 00981 g005
Figure 6. Amplitude of feature 1 (Amp.feat.1-S4Y) and amplitude of feature 2 (Amp.feat.2-S4Y), from rear lateral left accelerometer, S4Y.
Machines 11 00981 g006
Figure 7. Amplitude of feature 1 (Amp.feat.1-S4Z) and amplitude of feature 2 (Amp.feat.1-S4Z), from rear vertical left accelerometer, S4Z.
Machines 11 00981 g007
Figure 8. Amplitude of feature 1 (Amp.feat.1-S2Y) and amplitude of feature 2 (Amp.feat.2-S2Y), from front lateral left accelerometer, S2Y.
Machines 11 00981 g008
Figure 9. Amplitude of feature 1 (Amp.feat.1-S2Z) and amplitude of feature 2 (Amp.feat.1-S2Z), from front vertical left accelerometer, S2Z.
Machines 11 00981 g009
Figure 10. Amplitude of feature 1 (Amp.feat.1-S3Z) and amplitude of feature 2 (Amp.feat.1-S3Z), from front vertical right accelerometer, S3Z.
Machines 11 00981 g010
Figure 11. Amplitude of feature 1 (Amp.feat.1-S1Y) and amplitude of feature 2 (Amp.feat.2-S1Y), from rear lateral right accelerometer, S1Y.
Machines 11 00981 g011
Figure 12. Amplitude of feature 1 (Amp.feat.2-S1Z) and amplitude of feature 2 (Amp.feat.2-S1Z), from rear vertical right accelerometer, S1Z.
Machines 11 00981 g012
Figure 13. Residual principal components related to feature 1 (PCA, feat.1-S4Y) and residual principal components related to feature 2 (PCA, feat.2-S4Y), referred to S4Y.
Machines 11 00981 g013
Figure 14. Residual principal components related to feature 1 (PCA, feat.1-S4Z) and residual principal components related to feature 2 (PCA, feat.1-S4Z), referred to S4Z.
Machines 11 00981 g014
Figure 15. Residual principal components related to feature 1 (PCA, feat.1-S2Y) and residual principal components related to feature 2 (PCA, feat.2-S2Y), referred to S2Y.
Machines 11 00981 g015
Figure 16. Residual principal components related to feature 1 (PCA, feat.1-S2Z) and residual principal components related to feature 2 (PCA, feat.2-S2Z), referred to S2Z.
Machines 11 00981 g016
Figure 17. Residual principal components related to feature 1 (PCA, feat.1-S3Y) and residual principal components related to feature 2 (PCA, feat.2-S3Y), referred to S3Y.
Machines 11 00981 g017
Figure 18. Residual principal components related to feature 1 (PCA, feat.1-S3Z) and residual principal components related to feature 2 (PCA, feat.2-S3Z), referred to S3Z.
Machines 11 00981 g018
Figure 19. Residual principal components related to feature 1 (PCA, feat.1-S2Y) and residual principal components related to feature 2 (PCA, feat.2-S1Y), referred to S1Y.
Machines 11 00981 g019
Figure 20. Residual principal components related to feature 1 (PCA, feat.1-S1Z) and residual principal components related to feature 2 (PCA, feat.2-S1Z), referred to S1Z.
Machines 11 00981 g020
Figure 21. Detection of lateral alignment damage to the left rail using S4Y.
Machines 11 00981 g021
Figure 22. Detection of longitudinal level damage to the left rail using S4Z.
Machines 11 00981 g022
Figure 23. Detection of longitudinal level damage to the left rail using S2Y.
Machines 11 00981 g023
Figure 24. Detection of longitudinal level damage to the left rail using S2Z.
Machines 11 00981 g024
Figure 25. Detection of lateral alignment damage to the left rail using S3Y.
Machines 11 00981 g025
Figure 26. Detection of longitudinal level damage to the right rail using S3Z.
Machines 11 00981 g026
Figure 27. Detection of lateral alignment damage to the right rail using S1Y.
Machines 11 00981 g027
Figure 28. Detection of vertical longitudinal level damage to the right rail using S1Z.
Machines 11 00981 g028
Table 1. Geometric and dynamic properties of the freight wagon, adopted from [44].
Geometric and Dynamic PropertiesLimit Bounds (Lower/Upper)Adopted ValueUnit
Car body mass (mc) 33,200   t o   49,800 41,100[ k g ]
Car   body   roll   moment   of   inertia   ( I x ) 39,200   t o   58,800 49,000 [ k g . m 2 ]
Car   body   pitch   moment   of   inertia   ( I y ) 337,000   t o   674,000 673,000 [ k g . m 2 ]
Car   body   yaw   moment   of   inertia   ( I z ) 337,000   t o   674,000 665,000 [ k g . m 2 ]
Length   ( L )−/− 1247 [ k g . m 2 ]
Width   ( W )−/− 312   [ k g . m 2 ]
Height   above   the   ground   ( H )−/− 312 [ k g . m 2 ]
Wheel set mass 1250   k g   t o   2875 1247 [ k g ]
Wheel   set   roll   moment   of   inertia   ( J x )−/− 312 [ k g ]
Wheel   set   yaw   moment   of   inertia   ( J z )−/− 312 [ k g ]
Wheel   set   height   above   the   ground   ( H ) 0.450   [m]
Longitudinal   suspension   stiffness   ( x z ) 22,500   t o   67,500 44,981 [ k N / m ]
Lateral   suspension   stiffness   ( k y ) 15,450   t o   46,350 30,948 [ k N / m ]
Vertical   suspension   stiffness   ( k z ) 1560   t o   2780 1860 [ k N / m ]
Vertical   suspension   damping   ( c z )−/− 16.7 [ k N . s / m ]
Table 2. Main properties adopted for track model.
Description of the PropertiesValue UnitReferences
Rail Cross   sec tion   ( m 2 )87.7[ k N / m ][61]
Density7850[ k g / m 3 ][61]
Moment of inertia0.309[ c m 4 ][61]
Elasticity modulus (E) 210 [ G P a ][44]
Poisson’s ratio (ν)0.28 [-][61]
Rail pad and fastening system Lateral   stiffness   ( k y ) 20   [ M N / m ][61]
Vertical   stiffness   ( k z ) 500   [ M N / m ][44]
Lateral   damping   ( c y ) 50   [ k N / m ] [61]
Vertical   damping   ( c z ) 200   [ k N / m ][44]
SleeperArea of the cross section 402.5   [ c m 2 ][44]
Moment of inertia of the cross section 17,620   [ c m 4 ][44]
Density 2590 [ k g / m 3 ][61]
Elasticity   modulus   ( E ) 40.9 [ G P a ][44,61]
Poisson’s ratio (ν)0.2[-][61]
Ballast Density   ( ρ ) 1995.9   [ k g / m 3 ][44]
Elasticity   modulus   ( E )0.11 [ G P a ][62]
Lateral   stiffness   ( k y ) 2.25 [ M N / m ] [61]
Vertical   stiffness   ( k z ) 30 [ M N / m ][61]
Lateral   damping   ( C y )50[ k N . s / m ][61]
Vertical   damping   ( C z )15 [ k N . s / m ][61]
Foundation Lateral   stiffness   and   vertical   stiffness   ( k y = k z ) 20 [ M N / m ][61]
Lateral   and   vertical   damping   ( C y = C z )0.501[ k N / m ][61]
Table 3. Adopted value of standard deviation for alert limit, according to EN 13848-5 [57].
Speed (km/h)ALSTD for LL (mm)ALSTD for LA (mm)
v 80 2.3 to 3.01.5 to 1.8
80 < v 120 1.8 to 2.71.2 to 1.5
120 < v 160 1.4 to 2.41.0 to 1.3
160 < v 230 1.2 to 1.90.8 to 1.1
230 < v 300 1.0 to 1.50.7 to 1.0
Table 4. Simulations of baseline and damage scenarios.
DescriptionBaseline ScenariosDamage Scenarios
Type of railway vehicleFreight Laagrss vehicleFreight Laagrss vehicle
Load increment of wagon3 types1 type
Noise ratio5%5%
Vehicle speeds [km/h]40–12080
Track geometric irregularities 1 profile9 profiles
ALSTD for longitudinal level (z)0.781.4, 1.8, 2.3
ALSTD for lateral alignment (y)0.481, 1.2, 1.5
Total number of analyses4575
Sampling frequency for acceleration, F s = 5   k H z .
Low-pass digital filter for acceleration (Chebyshev II) F c = 1.5   k H z
Table 5. Detection accuracy of the AI-based methodology for different sensor layouts and damage.
DamageDetection Accuracy for Each Sensor
S4YS1YS2YS3YS2ZS3ZS4ZS1Z
LRLL----------------94%----98%----
RRLL--------------------99%----98%
LRLA----98%99%--------------------
RRLA95%--------100%----------------
Disclaimer/Publisher’s Note: The statements, opinions and data contained in all publications are solely those of the individual author(s) and contributor(s) and not of MDPI and/or the editor(s). MDPI and/or the editor(s) disclaim responsibility for any injury to people or property resulting from any ideas, methods, instructions or products referred to in the content.

