Article

Investigation on Start-Up Characteristics of Large Axial Flow Pump Systems Considering the Influence of Auxiliary Safety Facilities

College of Hydraulic Science and Engineering, Yangzhou University, Yangzhou 225009, China
*
Author to whom correspondence should be addressed.
Machines 2023, 11(2), 182; https://doi.org/10.3390/machines11020182
Submission received: 27 December 2022 / Revised: 23 January 2023 / Accepted: 26 January 2023 / Published: 28 January 2023
(This article belongs to the Special Issue Optimization and Flow Characteristics in Advanced Fluid Machinery)

Abstract

:
A large number of operation practices show that the reliability and stability of large axial flow pump systems will face significant challenges during the start-up process. If the start-up control mode or safety auxiliary facilities of large axial flow pump stations are unreasonable, start-up failure will easily follow. In order to find a scientific control strategy for the start-up of large axial flow pump stations, the start-up characteristics of large axial flow pump stations must be fully understood first. In this paper, based on the secondary development of Flowmaster software, a simulation study of the start-up process of a large axial flow pump system equipped with different safety aids is carried out. It is found that it is a very dangerous start-up control mode to delay the opening of the rapid-drop gate to reduce the maximum reflux value and reflux duration when the pump system is initially started. When the rapid-drop gate opens with a delay of 4 s, the power overload coefficient reaches 23.49, indicating that the possibility of start-up failure of the large axial flow pump system increases sharply the longer the gate delay is opened. The method of adding a flap valve to the rapid-drop gate can significantly weaken the instantaneous impact power of the unit and prevent the unit from overload. When safety auxiliary facilities with an additional disc valve on the fast descending gate are adopted, the backflow coefficient is within 0.2, the impact head coefficient is within 2, and the power overload coefficient is less than 0. The research results will provide an important reference value for comprehensively understanding the start-up characteristics of large axial flow pump stations and finding scientific and safe start-up control strategies.

1. Introduction

In order to meet the needs of drainage, irrigation, and inter-basin water transfer, the large axial flow pump station system (LAPS) is widely used in many countries in the world. At present, the optimization and improvement of the energy characteristics of the LAPS have reached a design bottleneck, and the reliability and stability of the LAPS have become the main problems in the development of the LAPS [1,2,3]. A number of operation practices show that the reliability and stability of the LAPS will face the greatest challenge during the start-up process, and operating parameters such as flow, head, shaft power and impeller torque change sharply during the start-up process of the LAPS. The inertia of fluid flow and the inertia of machine motion cause great dynamic additional load, and most of the accidents involving a LAPS occur during the start-up of units. Exploring a reasonable start-up control mode and finding effective auxiliary facilities to improve the safety and reliability of the unit in the start-up process has become an urgent task for the development of the LAPS [4,5,6].
Many experts and scholars have carried out research on the transition process of hydraulic machinery and its systems, and the research on the transition process of hydropower stations or pump stations is more mature [7,8]. Its theoretical basis is mainly rigid water hammer theory and elastic water hammer theory, and the analysis method is mainly the characteristic line method in computational fluid dynamics. The characteristic line method in computational fluid dynamics has been tested by engineering field tests, and has good adaptability and accuracy in dealing with the transition process of hydraulic machinery. In recent years, some scholars have tried to use the method of three-dimensional numerical simulation to study the evolution law of the internal flow field in the transition process of hydraulic machinery. However, application of three-dimensional numerical simulation in hydraulic machinery systems, especially in the LAPS, is very time-consuming. It often requires a huge calculation cost to calculate a single case, and the accuracy is difficult to guarantee. It is difficult to compare and discuss a large number of different cases. At the same time, hydraulic machinery systems such as the LAPS are often equipped with many kinds of safety auxiliary facilities [9,10,11], such as overflow holes, flap valves, rapid-drop gates and so on. Three-dimensional numerical simulation will face multiple exit boundaries such as overflow holes, flap valves, rapid-drop gates and so on, and the outlet boundary conditions of the flap valve and the rapid-drop gate change in real time, so the convergence of three-dimensional numerical simulation is extremely difficult [12,13].
At present, the progress of research on different hydraulic machinery systems is very uneven, and most of the research results are concentrated on hydropower stations, pumped storage power stations and centrifugal pump stations. The research on the transition process of the LAPS is almost non-existent [14,15,16,17]. On the one hand, the related research of the LAPS started relatively late, on the other hand, the problem of the transition process of the LAPS has its particularity [18,19]. Firstly, the inlet system and outlet system of the LAPS are distorted and irregular short pipes, and most of them are cast-in-place reinforced concrete structures, so water compressibility, wave propagation and pipeline elasticity cannot be the decisive factors of the transition process. Secondly, the core content of the dynamic process research of the LAPS is not to study the abnormal water hammer pressure in the system, but to establish the relationship between the characteristic parameters of the pump unit to prevent overload and lack of control [20,21,22].
According to the field operation experience of the LAPS, if the start-up control mode or safety auxiliary facilities of the LAPS are unreasonable, its start-up will easily fail. There are two most common main reasons for start-up failure of the LAPS [23,24,25]. Firstly, the LAPS falls into the saddle zone of the axial flow pump during the start-up process, which leads to the instability or even failure of the start-up of the LAPS. Secondly, during the start-up of the LAPS, the instantaneous impact power exceeds the maximum power limit of the unit, which leads to the overload of the unit and the failure of the start-up. Therefore, whether the LAPS falls into the saddle zone of the axial flow pump during the start-up process, and whether the instantaneous impact power is overloaded, are the core factors in reviewing whether the transition process of the LAPS is safe [26,27,28]. At the same time, because the backflow in the LAPS will cause impact and damage to the pump blade at the initial stage of the start-up of the LAPS, parameters such as the maximum backflow flow (MBF) and backflow duration of the LAPS during the start-up process are also worthy of attention.
In this paper, the start-up characteristics of the LAPS are studied by combining one-dimensional modeling, three-dimensional modeling and a model experiment. Firstly, three-dimensional modeling of the LAPS is carried out, and the pressure drop curves of the inlet channel, outlet channel and flap valve under different flow conditions are established by the CFD method. Secondly, the secondary development of Flowmaster V7 software is carried out, and the pump experiment performance curve obtained from the model experiment is stored in the database of Flowmaster in the form of the Suter curve, and the pressure drop characteristics of inlet and outlet channels predicted by CFD are added to the self-developed flow resistance element. Thirdly, an energy characteristic experiment and power-off runaway experiment are carried out on the pump system model, and the experimental results are compared with the software simulation results to verify the accuracy of the simulation calculation. Finally, the start-up characteristics of LAPS units with different auxiliary facilities and different start-up control modes are studied, and the relationship and variation law of characteristic parameters in the start-up process are revealed.

2. Numerical Simulation and Experimental Setup
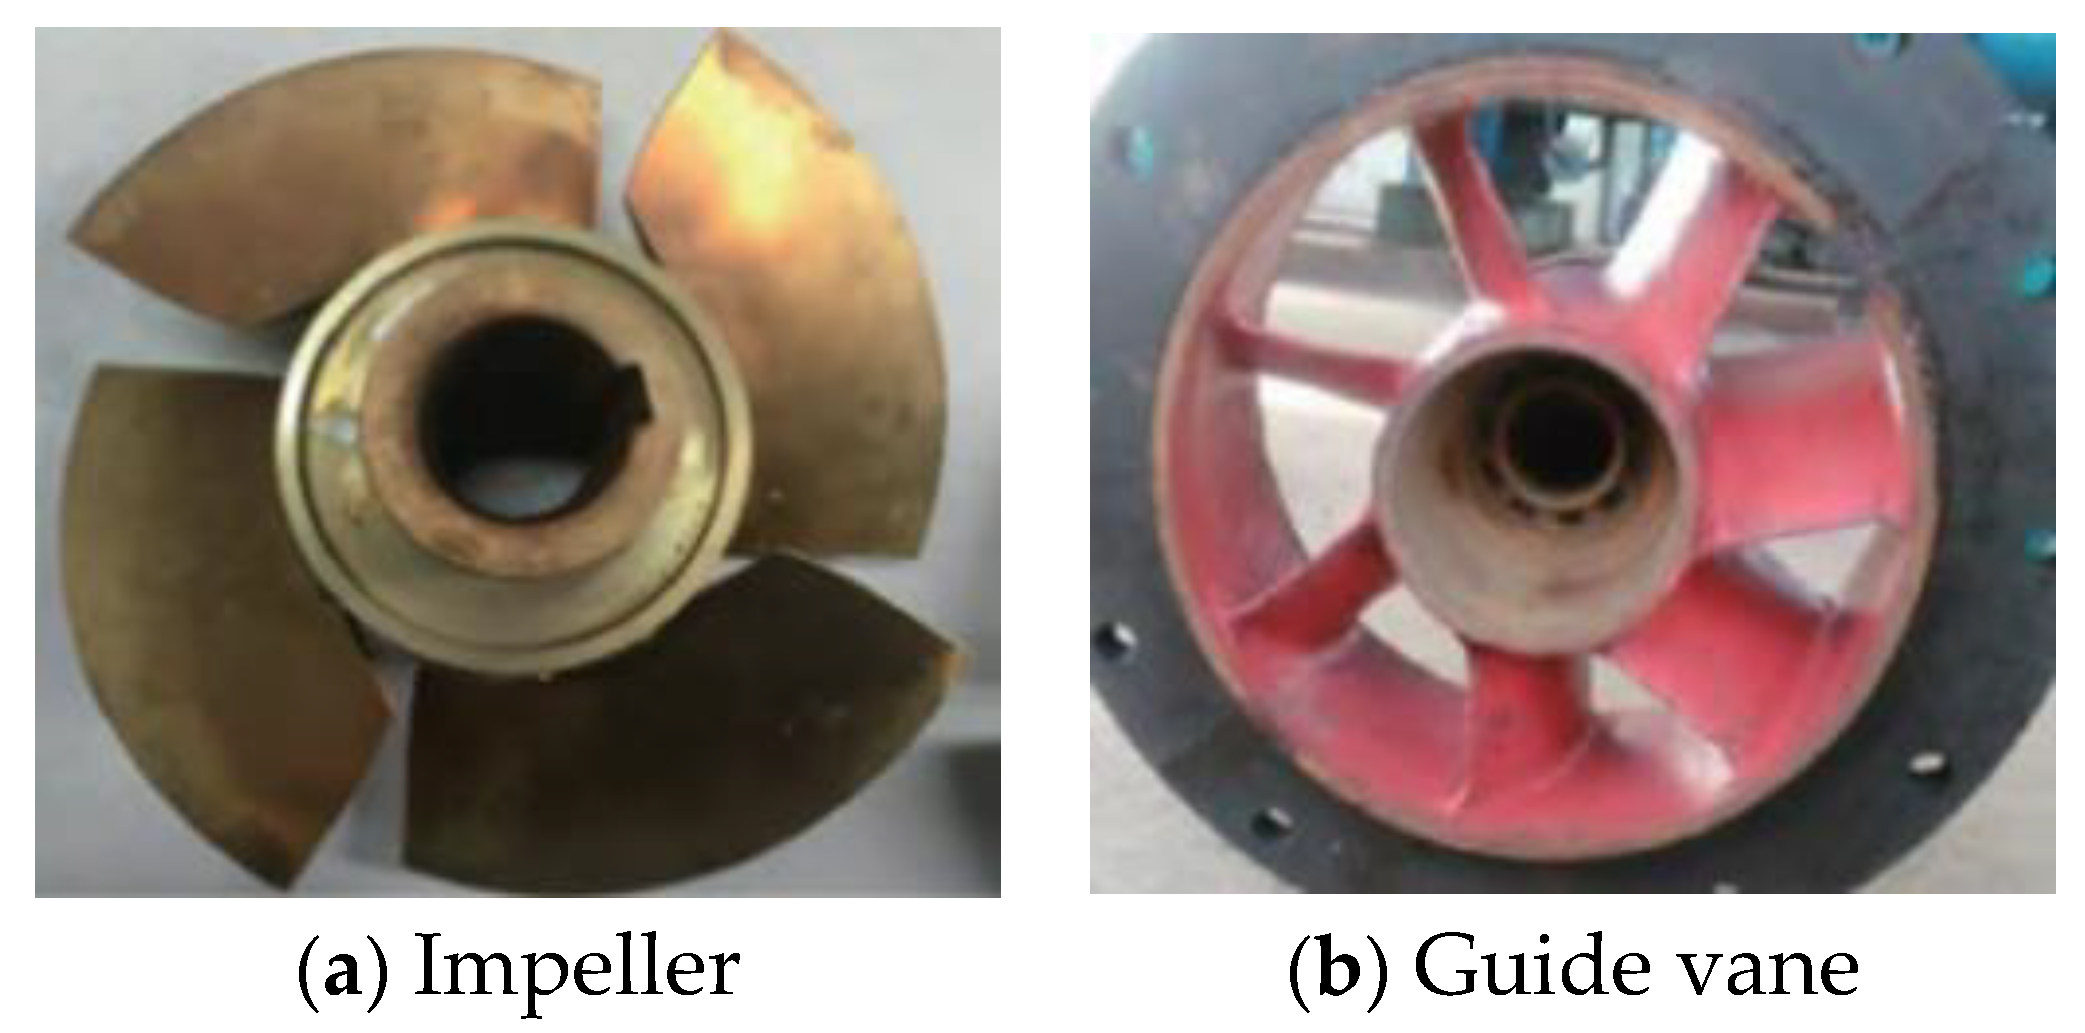
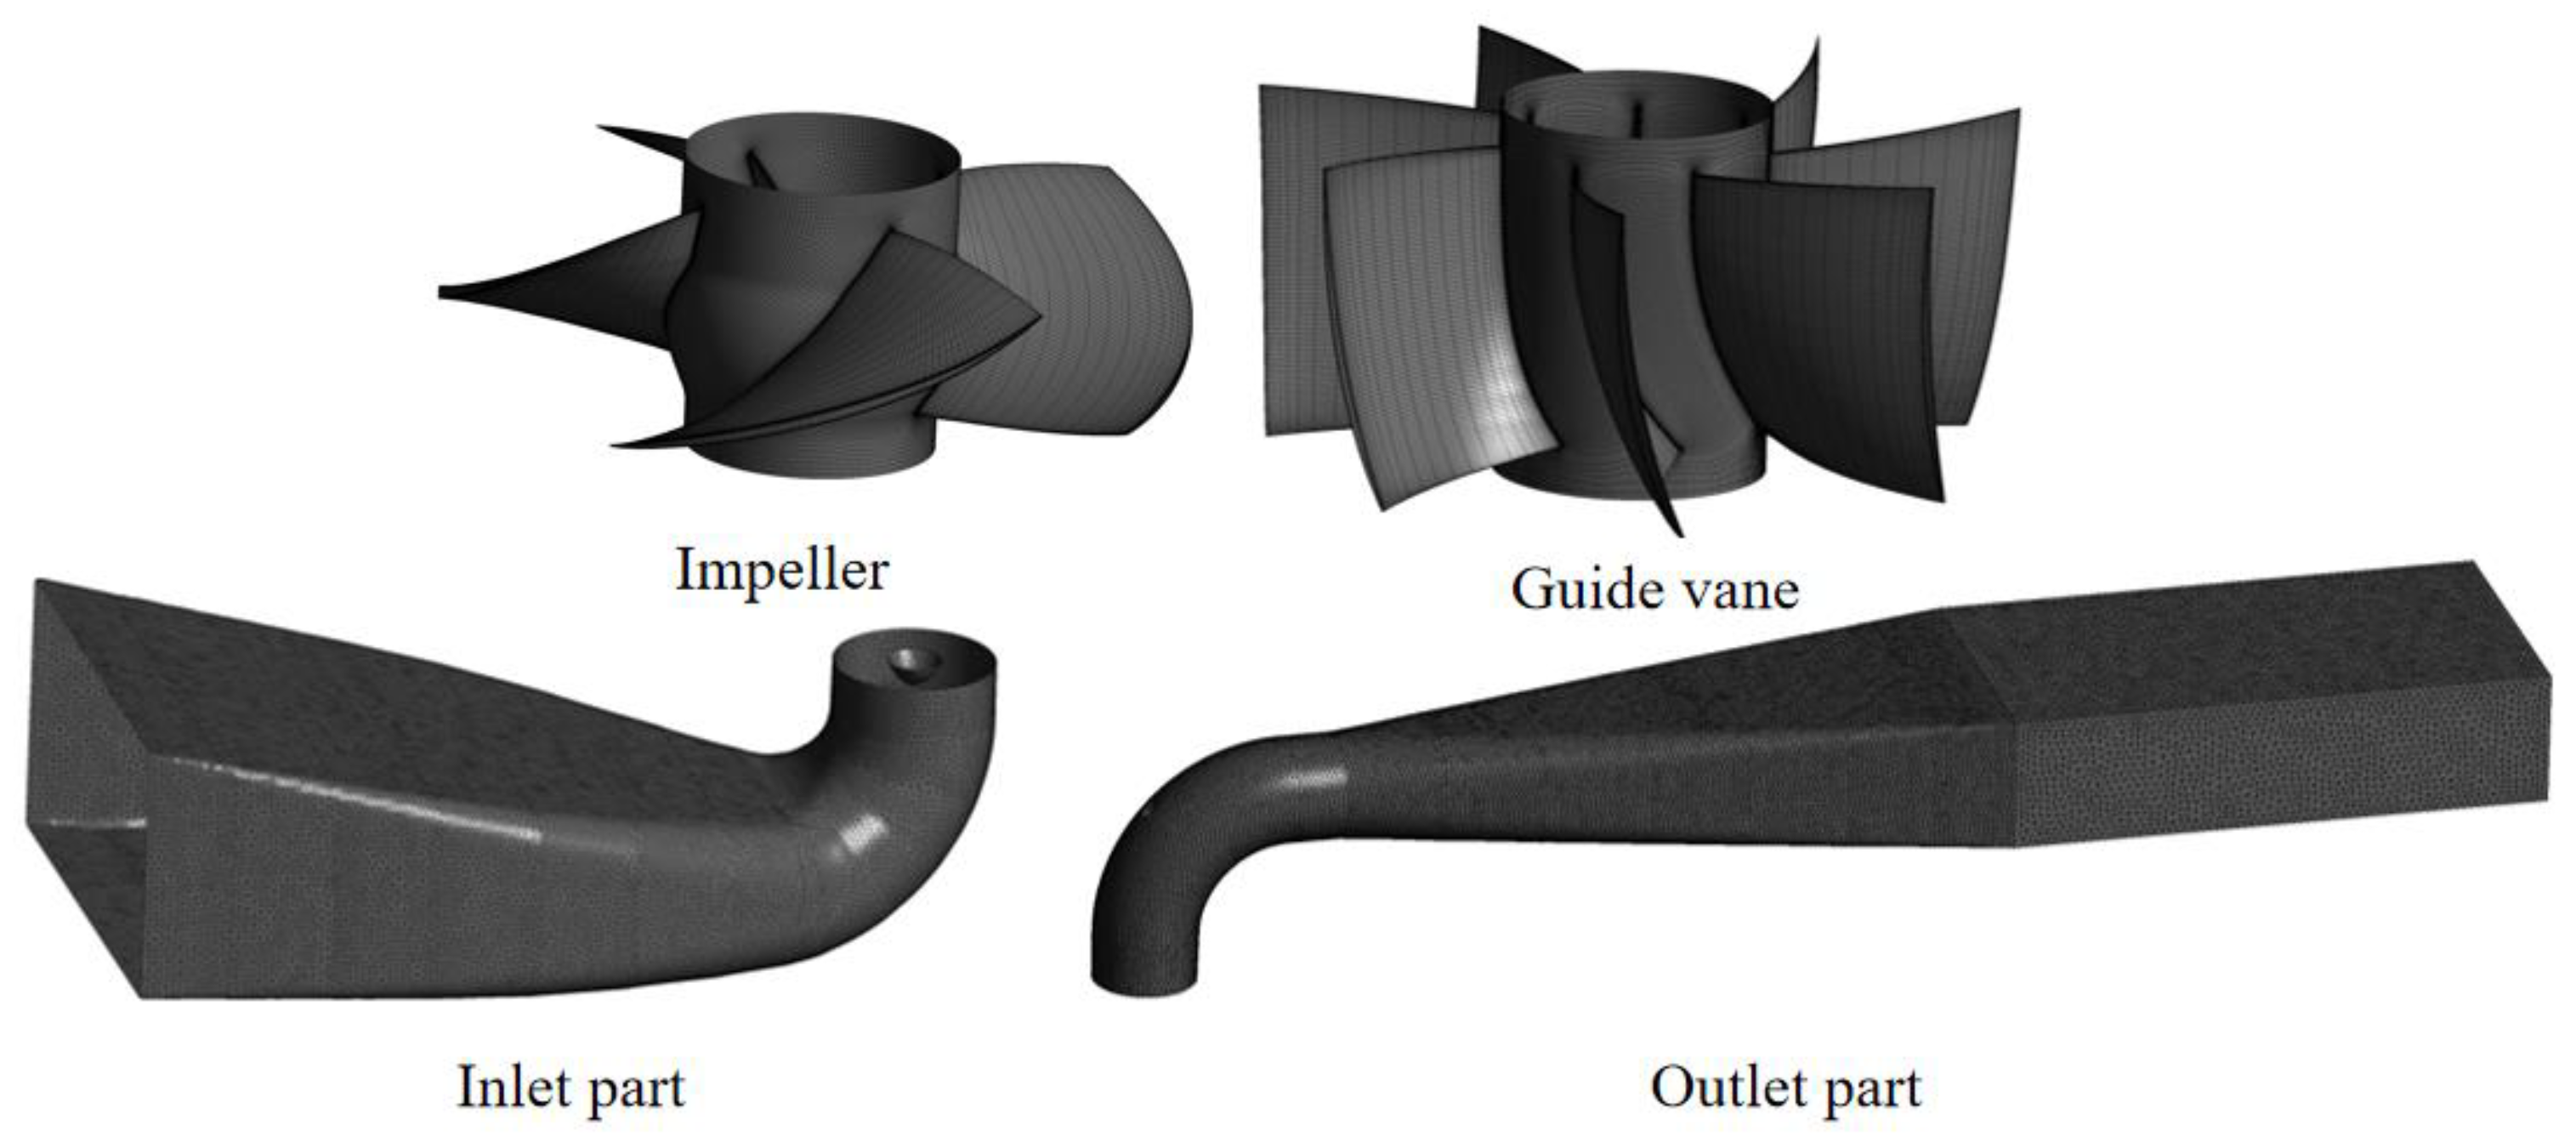
2.1. Physical Model

This paper took a typical LAPS in China as its research subject. A typical LAPS consists of an inlet channel, axial flow pump, outlet elbow, outlet channel and safety auxiliary facilities. Among them, the safety auxiliary facilities include a rapid-drop gate, flap valve and overflow hole. Figure 1 shows the diagram and main parameters of the LAPS. Since the start-up under the maximum net head Hn is the most unfavorable condition in the start-up process of the LAPS, the start-up process research in this paper is based on the maximum net head as the calculation boundary. The specific speed of the pump is 806, the impeller inlet diameter is 1.87 m, and the impeller outlet diameter is 1.96 m. The inertia moment of the LAPS Ip is 425.80 kg·m2, the motor rotation inertia Im is 3350 kg·m2, the upper limit of motor power Pu is 1000 kW, and the area of the rapid-drop gate Ar is 13.25 m2. It should be noted that the rapid-drop gate is opened or closed at a constant speed.

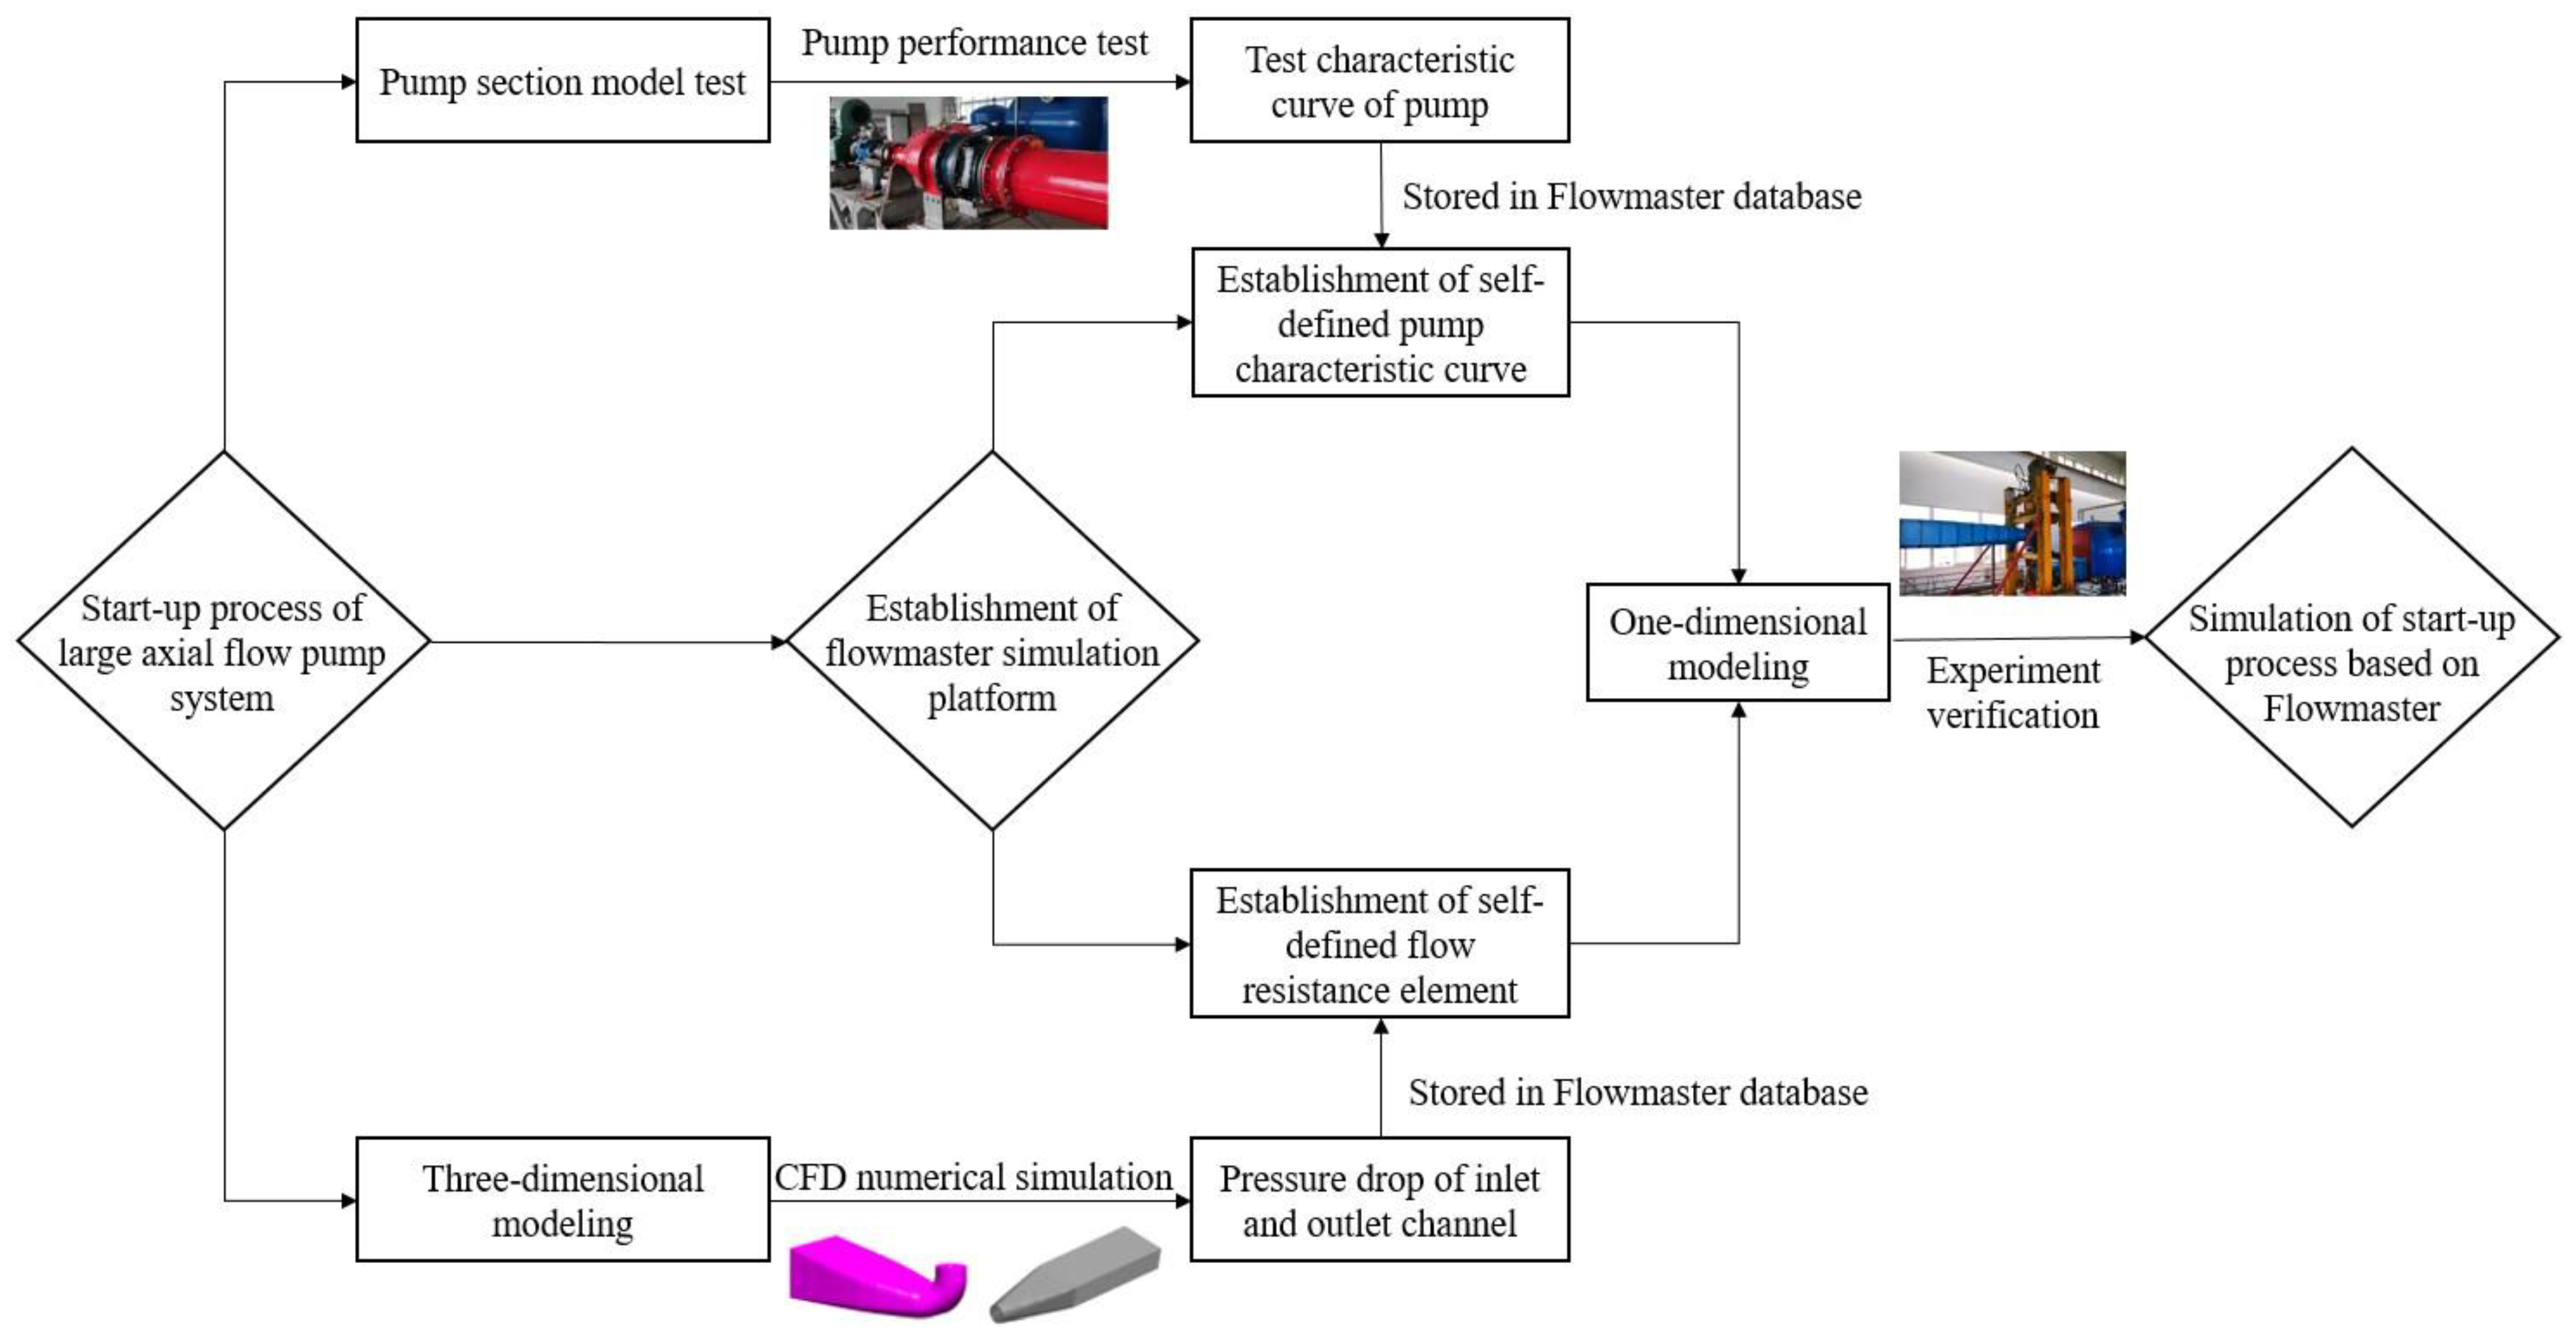
2.2. Simulation Process and Mathematical Model

Before the simulation based on Flowmaster was carried out, the pressure drop characteristics of the inlet and outlet channels were calculated by CFD method (based on ANSYS CFX 17.2 software). The grid diagram of the core components of LAPS is shown in Figure 2, which has been densified at the blade shroud. The impeller and guide vane are divided by structured grids, and the other parts are divided by unstructured grids. Figure 3 shows the grid independence analysis of the head and efficiency of LAPS under the design flow condition during the steady-state condition. It can be seen that when the total number of grids increases to 5.16 million, the head and efficiency are basically stable and meet the requirements of grid independence. In order to save calculation time and cost, the scheme in this paper is simulated numerically with the number of grids set at 5.16 million. Table 1 shows the number of grids and nodes of each flow passage component. It can be seen that the number of grids and nodes of the inlet channel is 1,083,798 and 191,421 respectively, and the number of grids and nodes of the outlet channel is 910,224 and 158,193. The CFD calculation is based on the Reynolds time-averaged N-S equation, which is discretized by the finite volume method and the SIMPLEC algorithm [29,30,31]. The pressure term is in the standard format, and the momentum, turbulent kinetic energy and dissipation rate terms are in the second-order upwind scheme. For the setting of boundary conditions, velocity inlet conditions and free outflow conditions are used as inlet and outlet boundary conditions, respectively.
The simulation of the start-up transition process was realized by Flowmaster software and its self-defined secondary development platform [32]. Flowmaster regards the fluid pipeline system as the object, and regards the fluid pipeline system as a series of fluid pipeline elements. The pipeline is directly connected by nodes, and the continuity equation and momentum equation are used to linearly describe the fluidity of each element in the system. The simplified fluid network solution equation is as follows [33]:
v ¯ h x + h t v ¯ sin α + a 2 g v ¯ x = 0
g h x + v ¯ v ¯ x + v ¯ t + f v ¯ | v ¯ | 2 D = 0
where h is the head along the way, in the pipeline expressed as the sum of pressure energy and potential energy and in the free surface reservoir expressed as the water level; v ¯ is the average velocity of the fluid on the cross-section; g is the gravitational acceleration; f is the friction factor; α is the angle between the pipe centerline and the horizontal line; D is the pipe diameter; a is the wave velocity.
In the simulation, the overall linear equations of the whole fluid network were solved first to obtain the flow and head parameters of each element in the steady state, and then the transient process was calculated. The model of each element in the fluid network was mainly based on the pressure-flow relationship, and the linear equations of the fluid network were derived according to the following derivation.
Taking the pipeline as an example, the linear equation of the element was derived. It was assumed that Qm1 and P1 were the fluid mass flow and pressure at the inlet of the pipeline, and Qm2 and P2 were the fluid mass flow and pressure at the outlet of the pipeline, respectively. Assuming that the cross-sectional area along the pipeline is constant, the relationship between the pressure difference and the flow can be expressed as follows [34]:
Δ P = k ρ v ¯ 2 2 = k Q m 2 2 ρ A 2
where Qm is the mass flow; ΔP is the pressure difference between the inlet and outlet of the pipeline, ΔP = P2P1; A is the cross-section area of the element; ρ is the liquid density; k is the pressure difference coefficient.
Considering the direction of the mass flow of the fluid, the formula can be changed to [35]:
Δ P = k Q m Q m 2 ρ A 2
Thus, the linear equation of pipeline inlet and outlet can be deduced [33]:
Q m 1 = 2 ρ A 2 k Q m 1 P 1 + 2 ρ A 2 k Q m 1 P 2
Q m 2 = 2 ρ A 2 k Q m 2 P 1 2 ρ A 2 k Q m 2 P 2
Because of the continuity of the fluid Qm1 = Qm2, the linear equation can be obtained [34]:
Q m 1 = A 1 ρ 1 + A 2 ρ 2 + B 1
Q m 2 = A 3 ρ 3 + A 4 ρ 4 + B 2
w h e r e   A 1 = 2 ρ A 2 k | Q m 1 | ,   A 2 = A 1 ,   B 2 = 0 ,   A 3 = A 1 ,   A 4 = A 1 ,   B 2 = 0
Since any fluid node in the pipeline system must satisfy the continuity equation, the overall equation set of the whole pipeline system can be obtained by simultaneously establishing the continuity equations of all nodes. For any fluid node m on the pipeline system [35]:
i = 1 M Q i n = q m
where Qin is the node flow of unit i connected to node m; the left side of the formula is the sum of node traffic of all M units contributing to the node; and qm is the total traffic entering the node.
Before the simulation based on the Flowmaster platform, the pump experiment and the three-dimensional modeling of the LAPS were carried out, and the performance curve of the pump test and the pressure drop curve of the flow channel were obtained by the pump experiment and CFD method [36,37,38]. Then, the secondary development of Flowmaster software was carried out, and the pump test performance curve obtained from the model test was stored in the database of Flowmaster in the form of the Suter curve, and the pressure drop characteristics of inlet and outlet channel predicted by CFD were added to the self-developed flow resistance element. Figure 4 shows the numerical strategy block diagram of this numerical calculation.

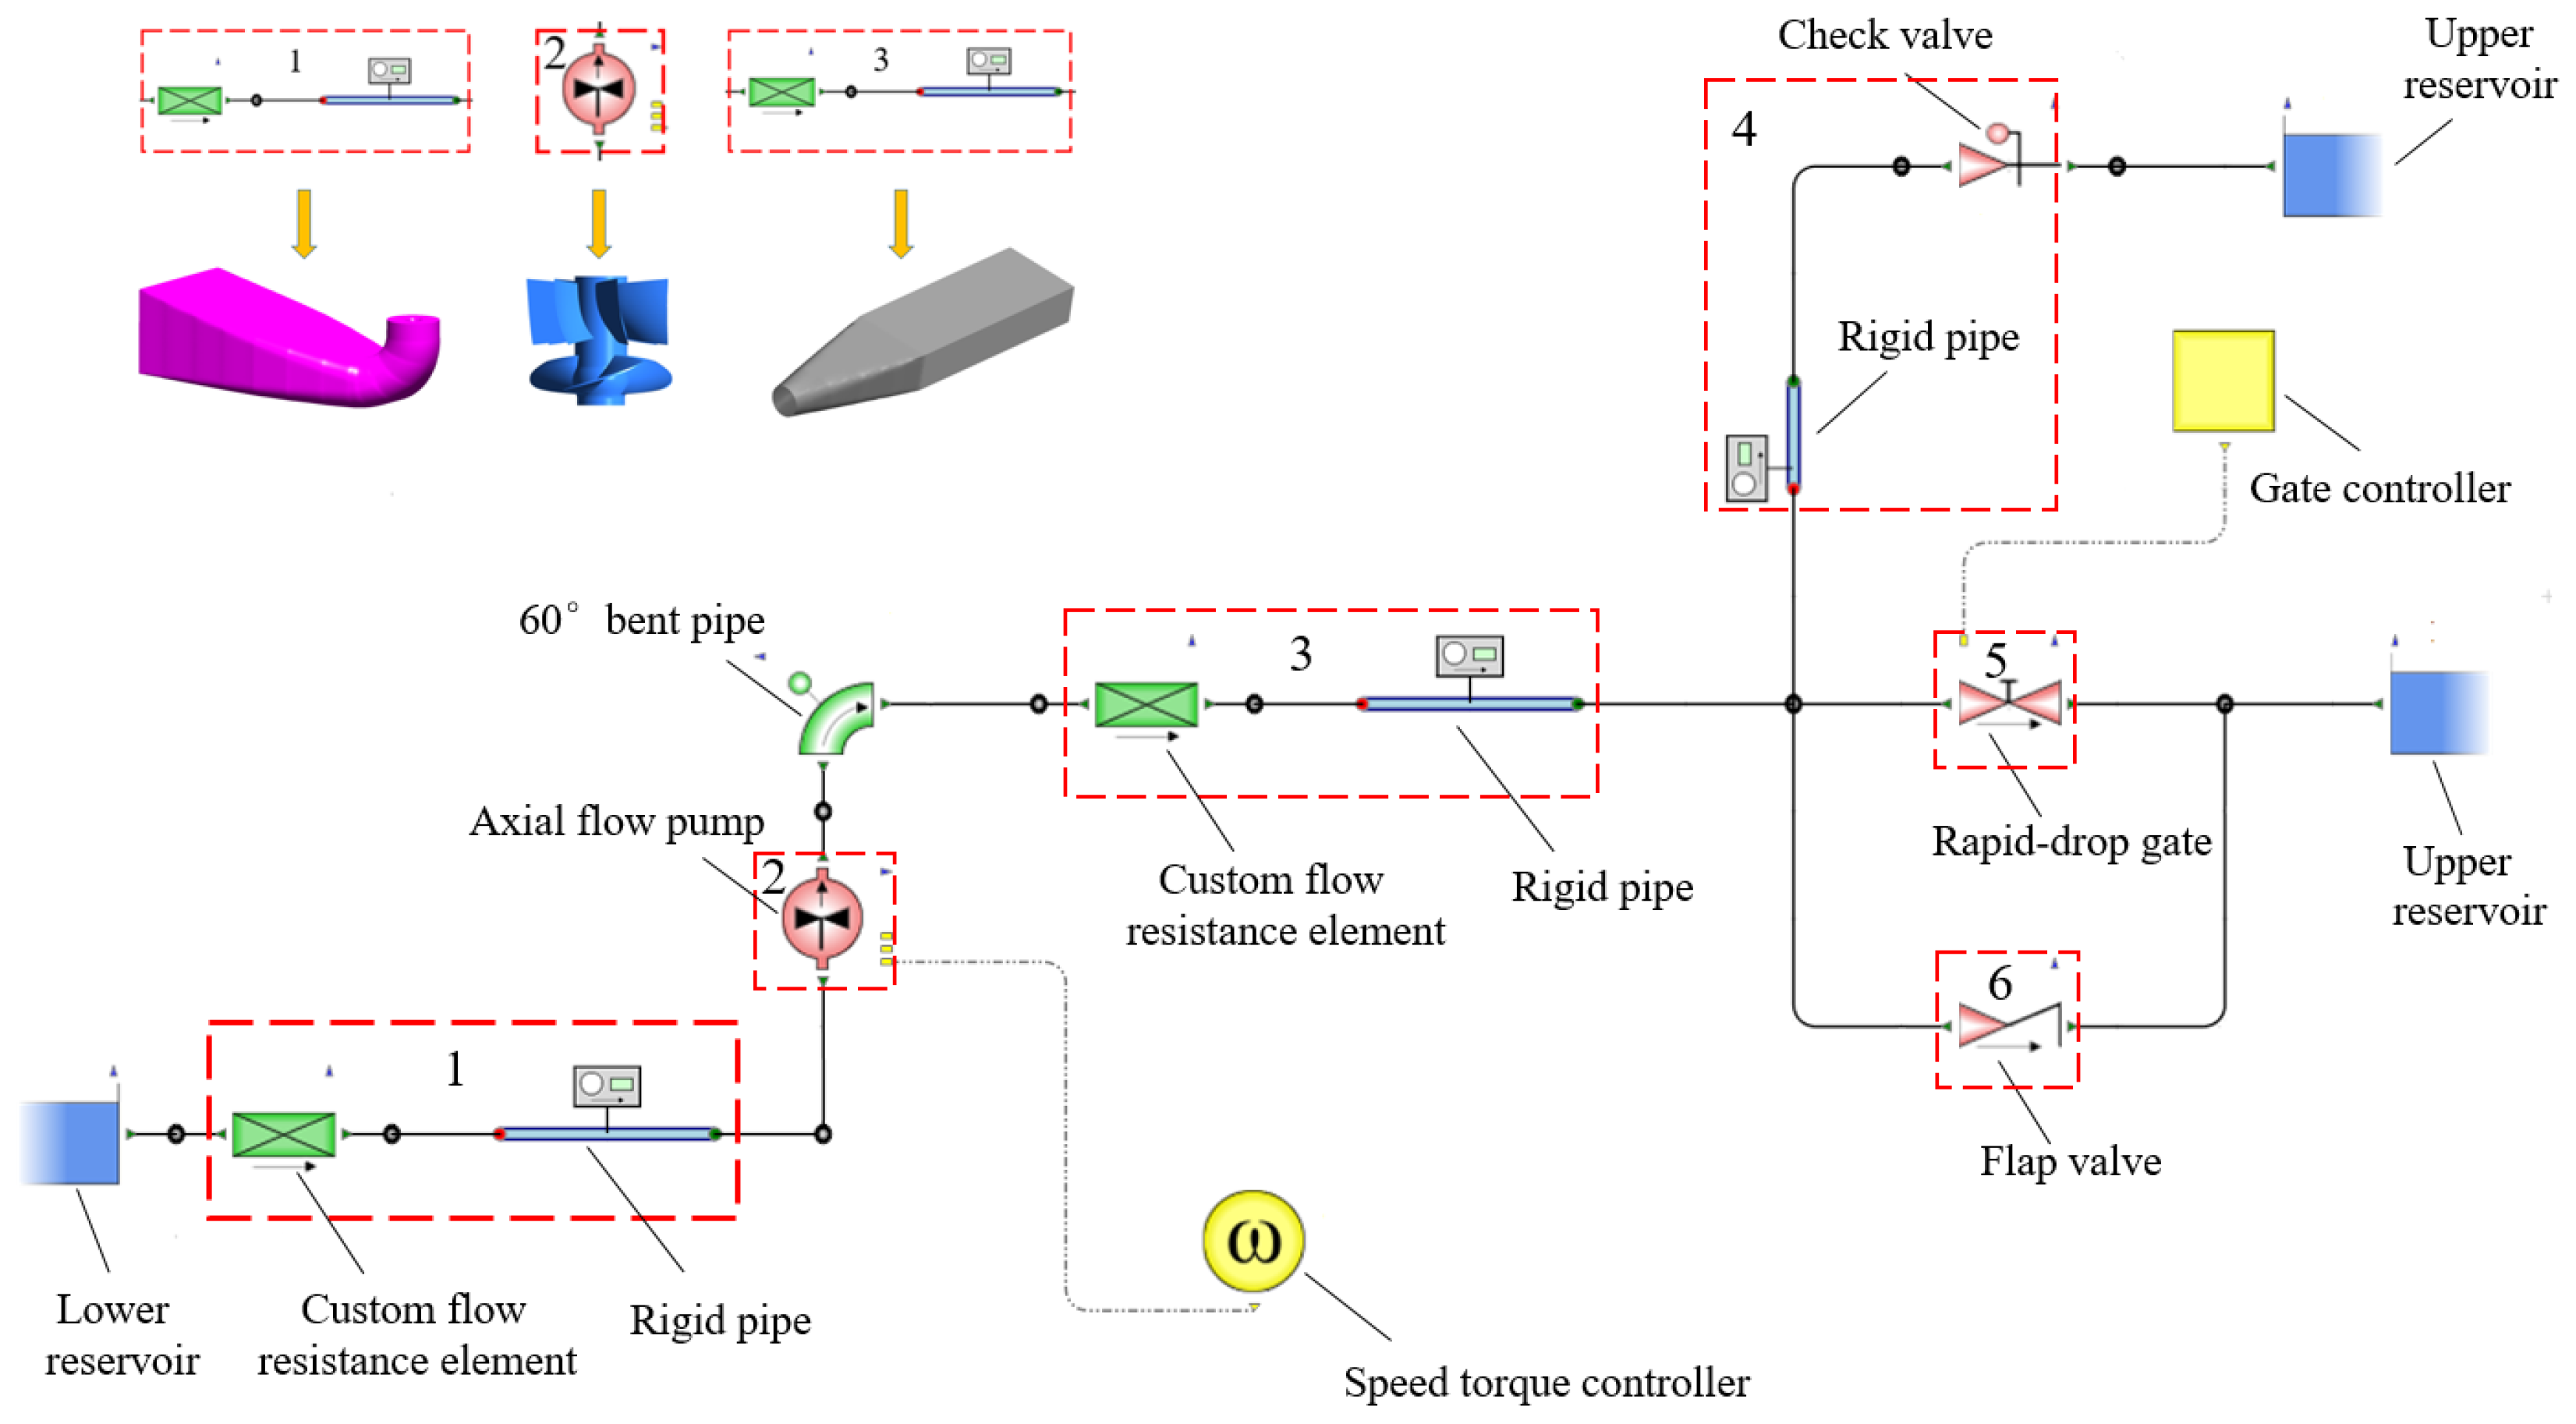
2.3. Simulation Model Construction and Boundary Conditions

A simulation model based on the Flowmaster platform was built after secondary development. Figure 5 shows the simulation model platform involving all components such as the overflow hole, flap valve and rapid-drop gate. Among them, element 1 and element 3 represent the inlet and outlet channels, which were realized in the form of self-defined flow resistance elements and rigid pipes. Element 2 represents the hydraulic model of the LAPS, and the pump speed control was realized by the pump speed controller. Element 4 represents the overflow hole, which was realized in the form of a rigid pipe and check valve. Element 5 represents the rapid-drop gate, and the gate control was realized by the gate controller. Element 6 represents the flap valve attached to the rapid-drop gate. It should be noted that in the study method used this paper, the simulation models of different schemes can delete the elements not involved, according to need.
The control of the pump start-up speed in the Flowmaster platform was based on the field measured data of the LAPS. The pump speed rose linearly from 0, taking 6 s reach to the rated speed of 214.3 r/min. The length of the pipeline in element 1 in the Flowmaster platform took the length of the centerline of the inlet channel, which was 10.62 m. Twenty-five sections were uniformly selected from the inlet to the outlet of the inlet channel, and the weighted average of the hydraulic diameter of these 25 sections was 2.82 m, the diameter of the pipe in element 1. The length of the pipeline in element 3 in the Flowmaster platform took the length of the centerline of the outlet channel, which was 23.87 m. Twenty-five sections were uniformly selected from the inlet to the outlet of the outlet channel, and the weighted average of the hydraulic diameter of these 25 sections was 2.87 m, the diameter of the pipe in element 3. After the independence test of the calculation time step, 0.0025 s was selected as the time step for transient calculation. The total calculation time of transient simulation was 250 s.

2.4. Scheme and Its Specific Description

In order to better describe the influence of adding different auxiliary measures on the characteristic parameters of LAPS, this section uses Table 2 to describe in detail the hydraulic components added in different schemes and the changes of control methods when using different auxiliary measures.
The Flowmaster platform and the British fluid Society have carried out a number of experiments on the resistance coefficient of the flap valve, and the loss coefficient of different types of flap valves can be selected in the Flowmaster database. The different loss coefficients ξ caused by the change of the opening angle of the flap valve in this simulation are shown in Table 3.

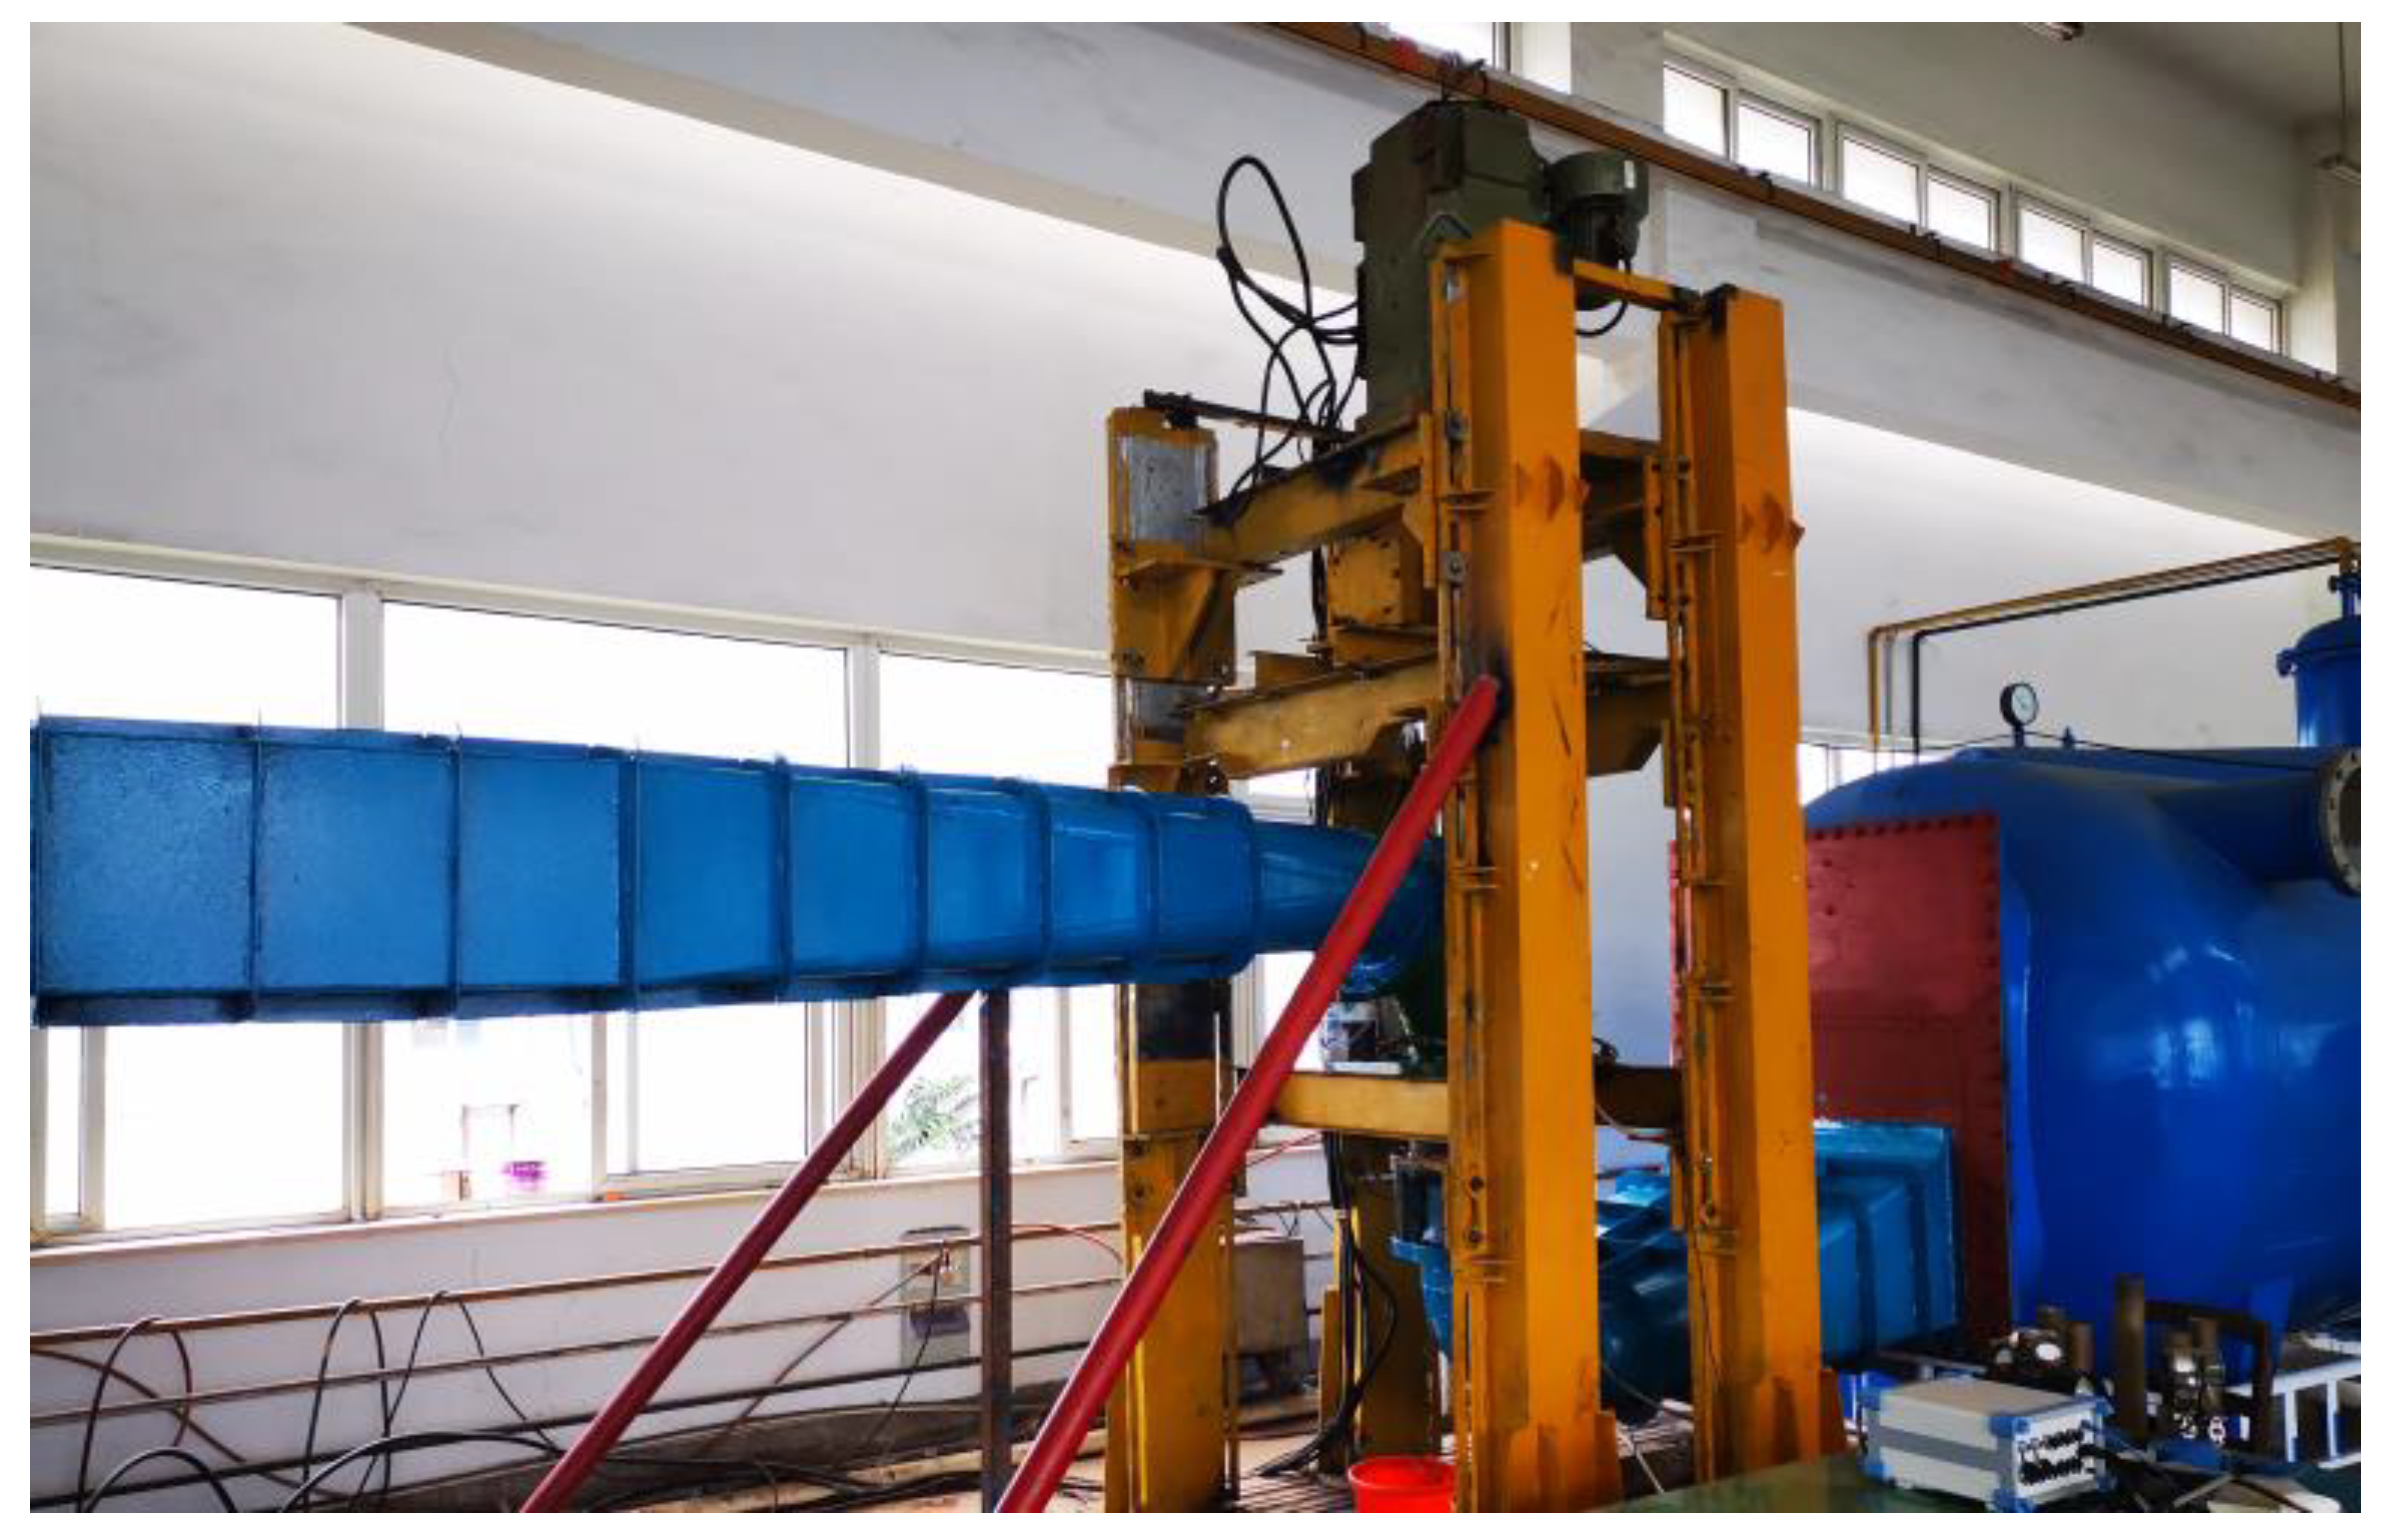
2.5. Experimental Setup
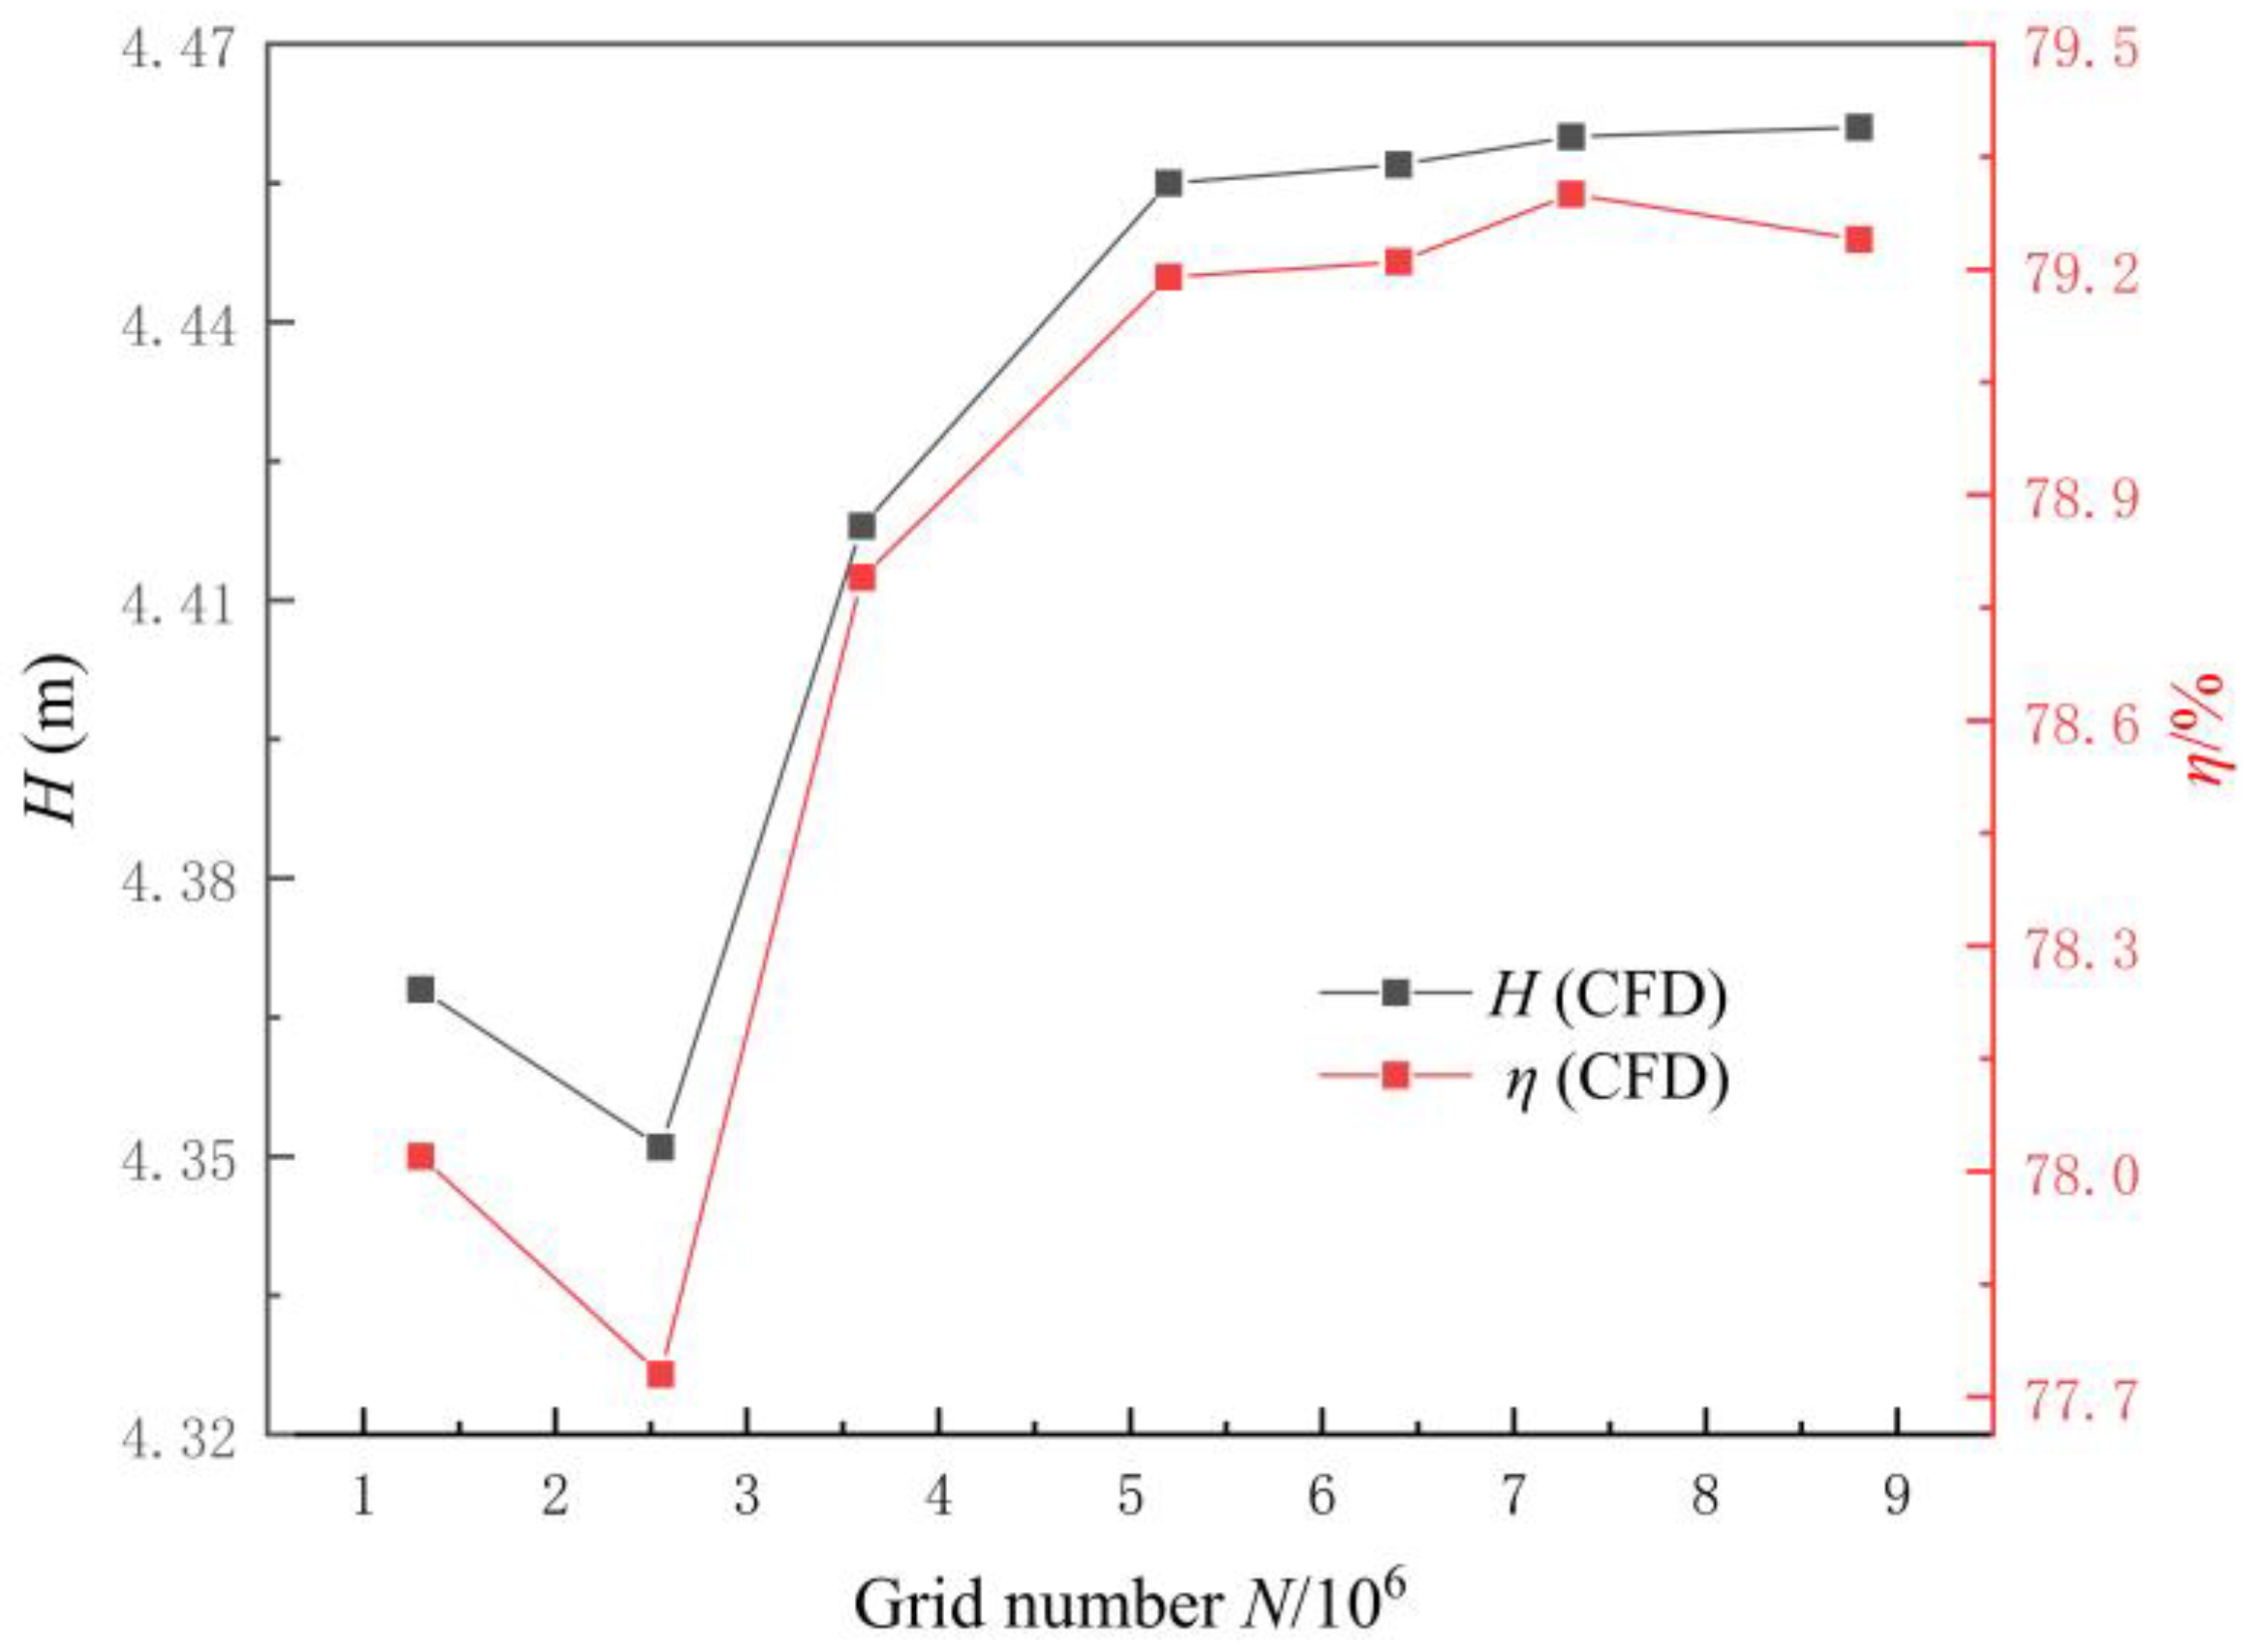
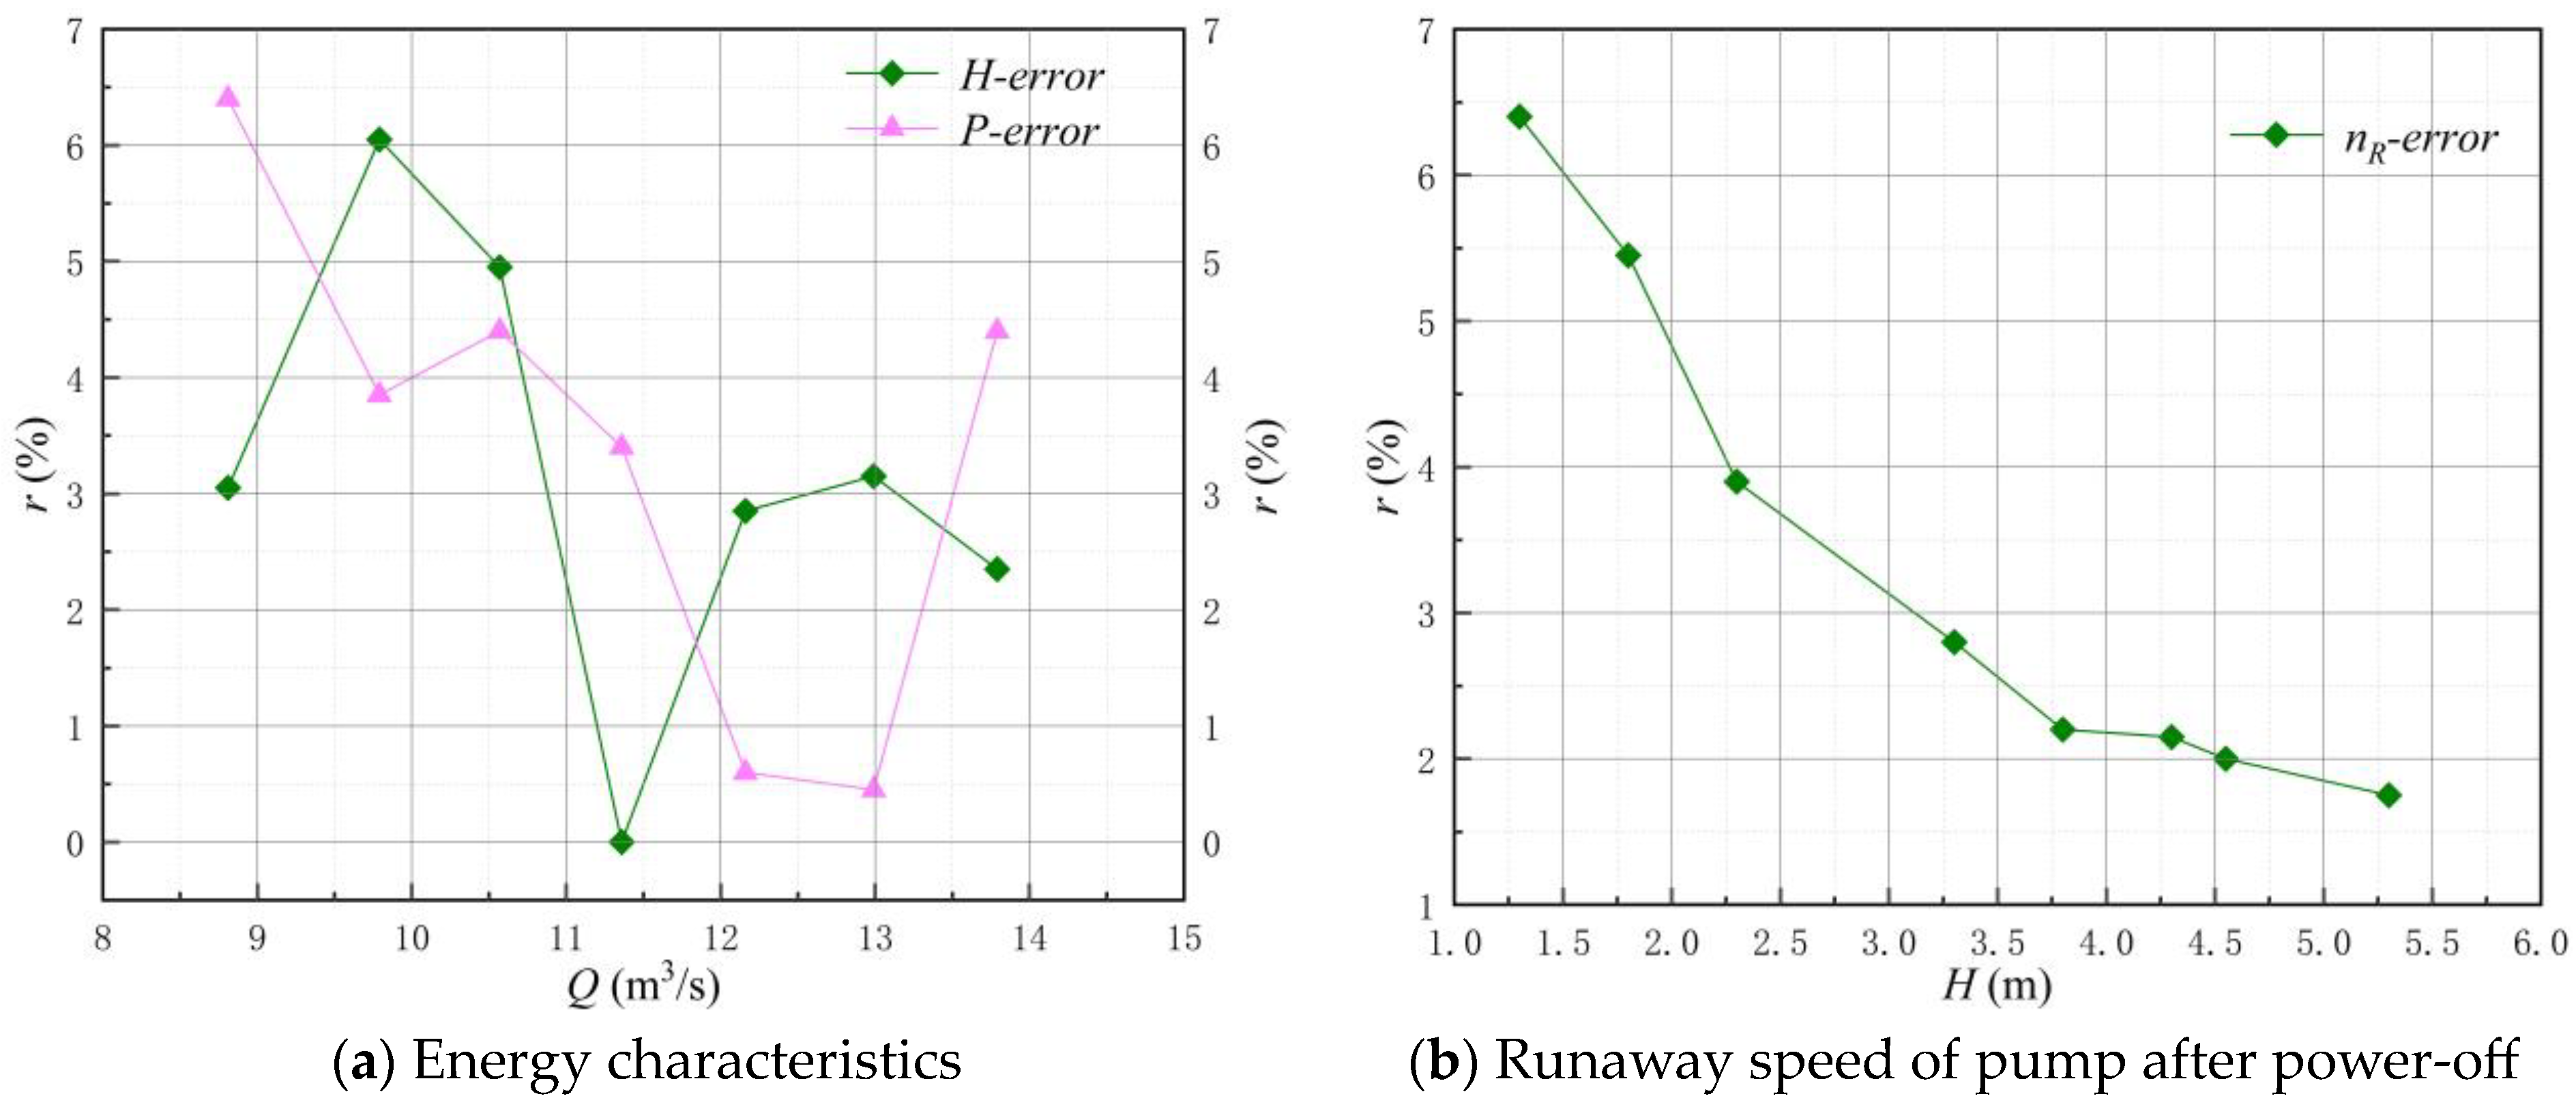
The experimental test in this paper was carried out on the high-precision hydraulic machinery test bench of Jiangsu Key Laboratory of Hydraulic and Power Engineering. The system comprehensive uncertainty of the experimental test was related to the precision of the measuring instrument, and its calculation formula is as follows [39]:
E η , s = ± E q , s 2 + E H , s 2 + E n , s 2 + E M , s 2
where Eη,s is the system comprehensive uncertainty %; Eq,s is the flow test system uncertainty %; EH,s is the head test system uncertainty %; En,s is the speed test system uncertainty %; EM,s is the torque test system uncertainty %.
The system comprehensive uncertainty of the test bench was ±0.39%. Figure 6 shows the schematic diagram of the high-precision hydraulic machinery test bench. The parameters of the main measuring instruments of the test bench are shown in Table 4. Figure 7 shows the physical diagram of axial flow pump.

3. Model Validation

In order to verify the feasibility of the numerical strategy and the accuracy of the simulation results, for this paper we machined the LAPS model and conducted an energy characteristic experiment and power-off runaway experiment on the LAPS model. The model experiment diagram of the LAPS is shown in Figure 8. The energy characteristic experiment carried out was to verify the steady simulation model, and the power-off runaway experiment was to verify the transient simulation model. The actual test process was completely based on the acceptance test specifications of the pump model and device model (SL 140-2006). The energy characteristics of the LAPS under different flow conditions and the runaway characteristics of the pump under different lifts were tested.
Figure 9 shows the comparison between the experimental results and the simulation results [40,41]. Figure 9a shows the energy characteristics, and Figure 9b shows the runaway speed of the pump after power-off. From Figure 9a, it can be seen that the experiment head and shaft power were very close to the simulation head and shaft power, and the maximum error was less than 5%, indicating that the steady simulation of the LAPS based on the numerical model in this paper has high accuracy. From Figure 9b, it can be seen that the runaway speed of the pump after the power-off of the LAPS under the different heads was very close to that of the simulation, the variation law was highly consistent and the maximum error was less than 3%, indicating that the transient simulation of the LAPS based on the numerical model in this paper also has high accuracy [42,43].
Figure 10 shows the error analysis of numerical simulation. From the error of head and shaft power in Figure 10a, it can be seen that with the increase of flow, the error value of head and shaft power obtained by numerical simulation gradually decreased. At the design flow, the error of head was about 3.0%, and the error of power was about 0.5%. From Figure 10b, it can be seen that the error value of runaway speed obtained by numerical simulation gradually decreased with the increase of head. At the design head, the error value of runaway speed was about 2.0%.

4. Results and Discussion

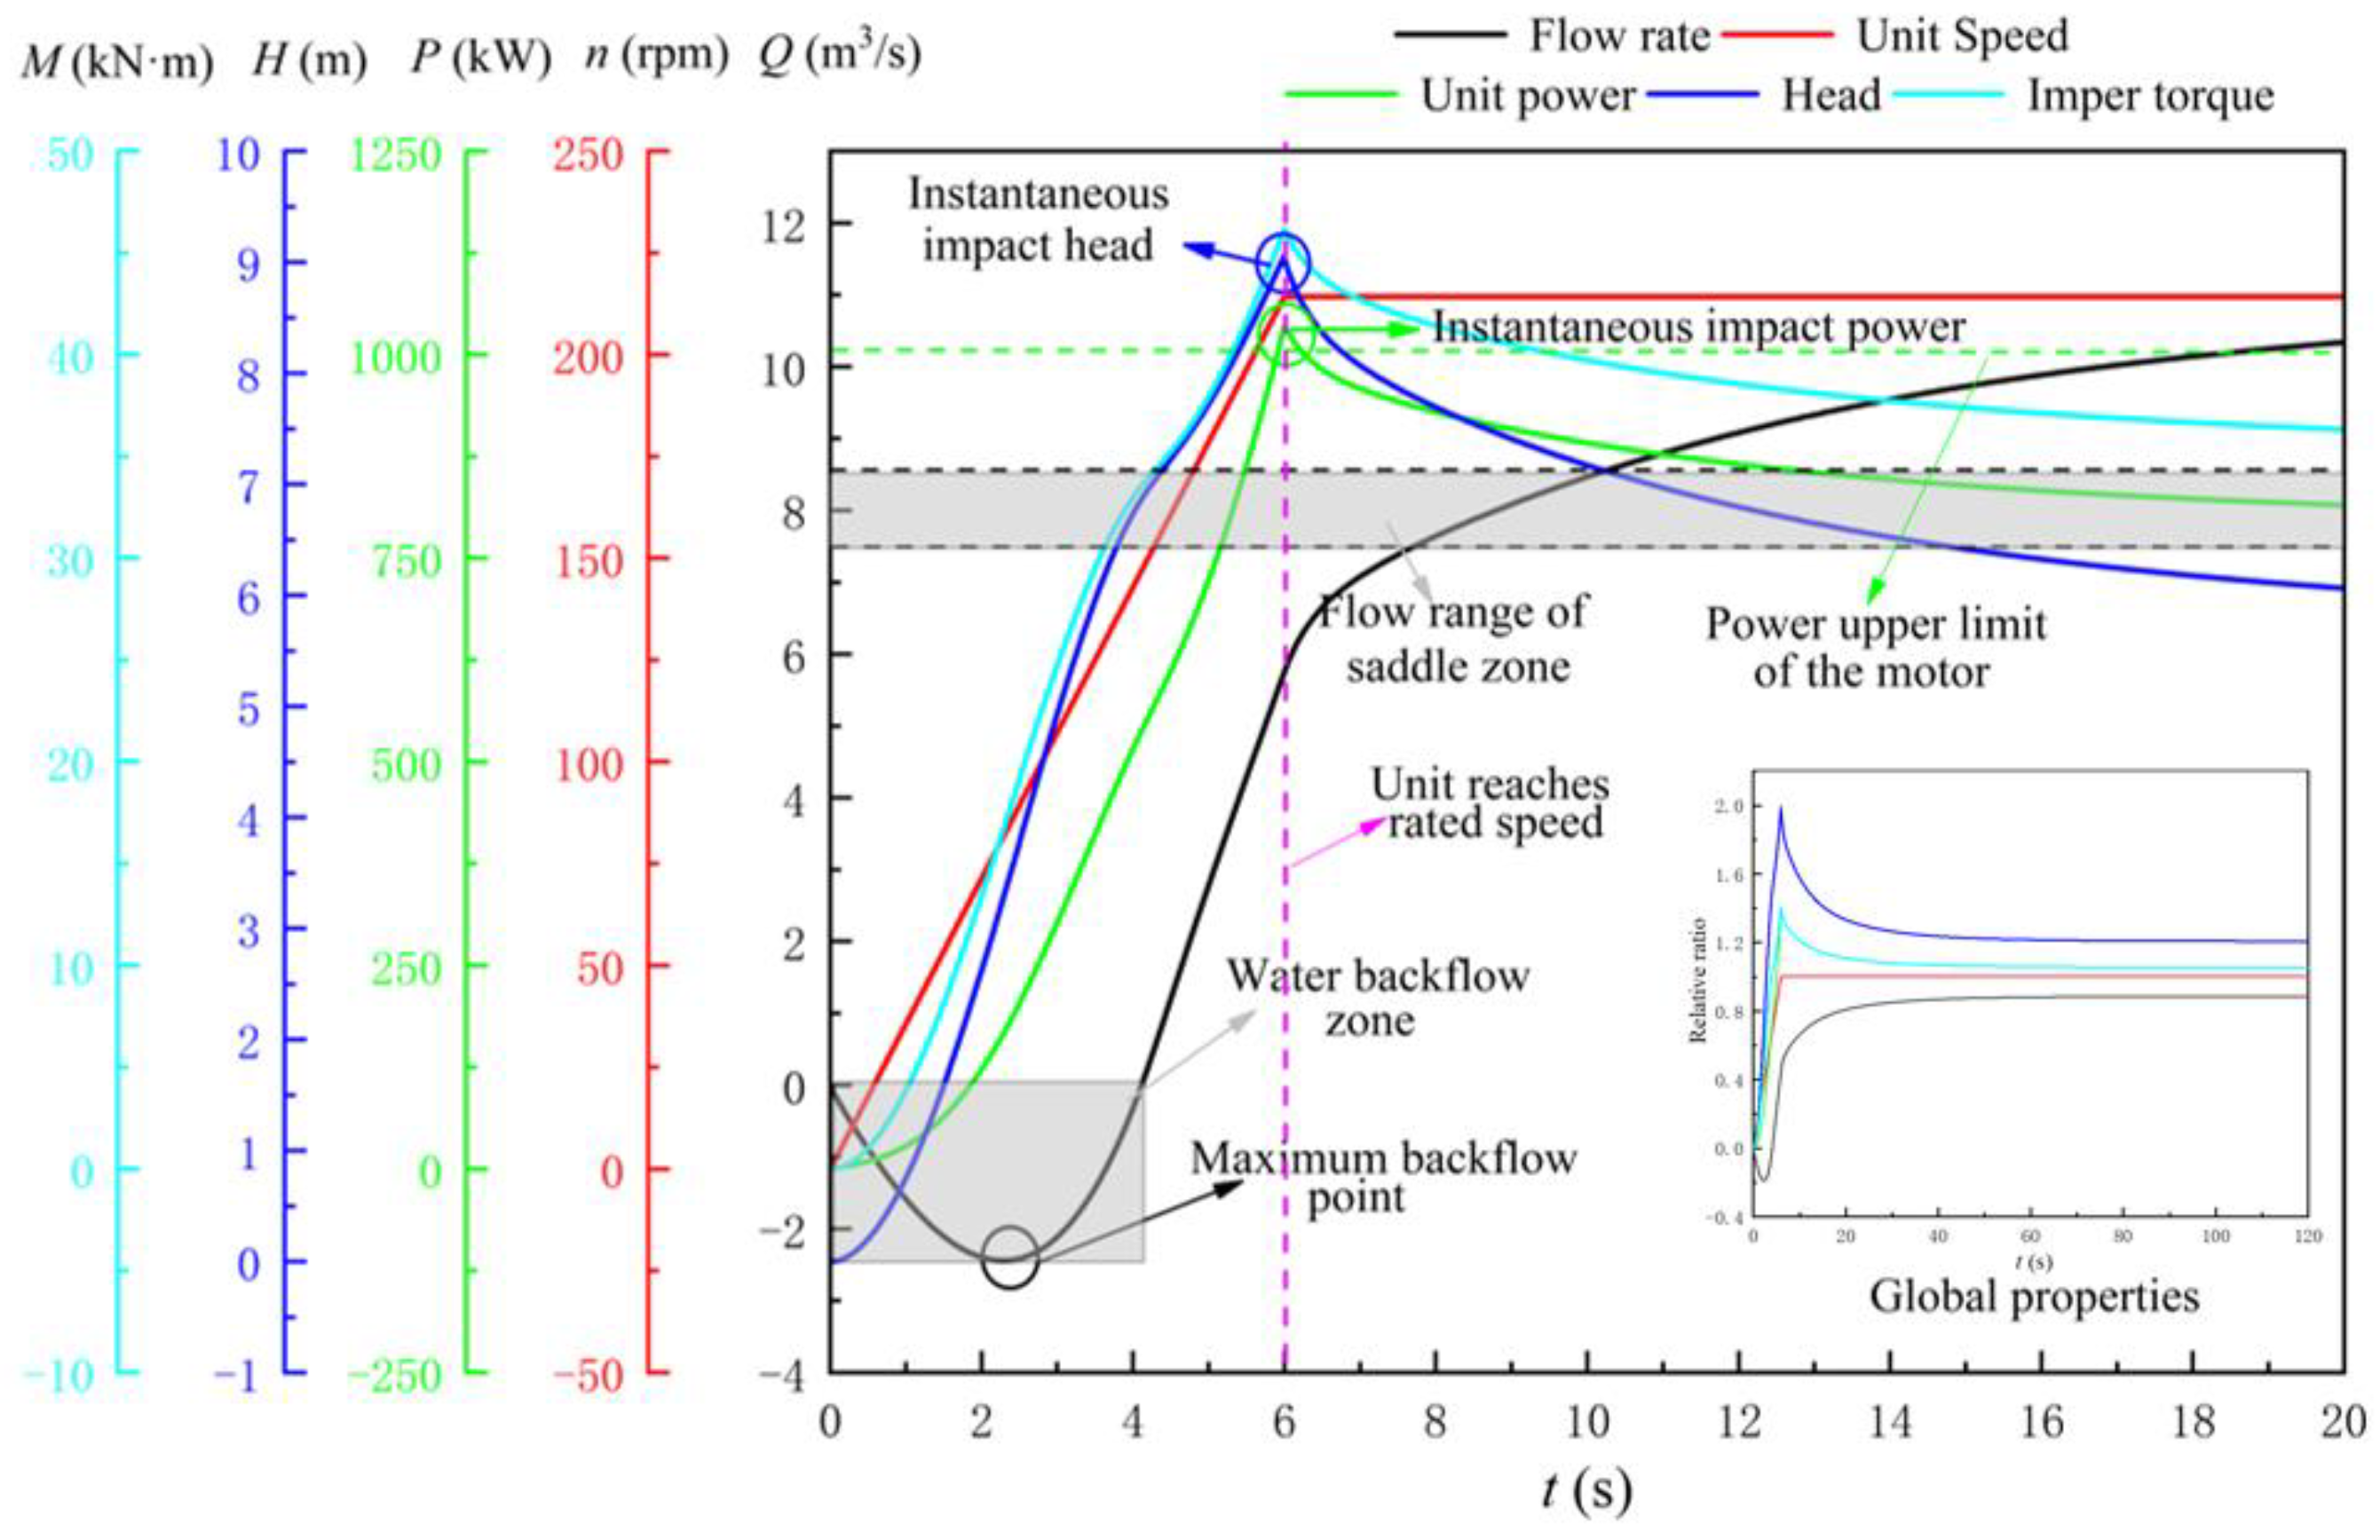
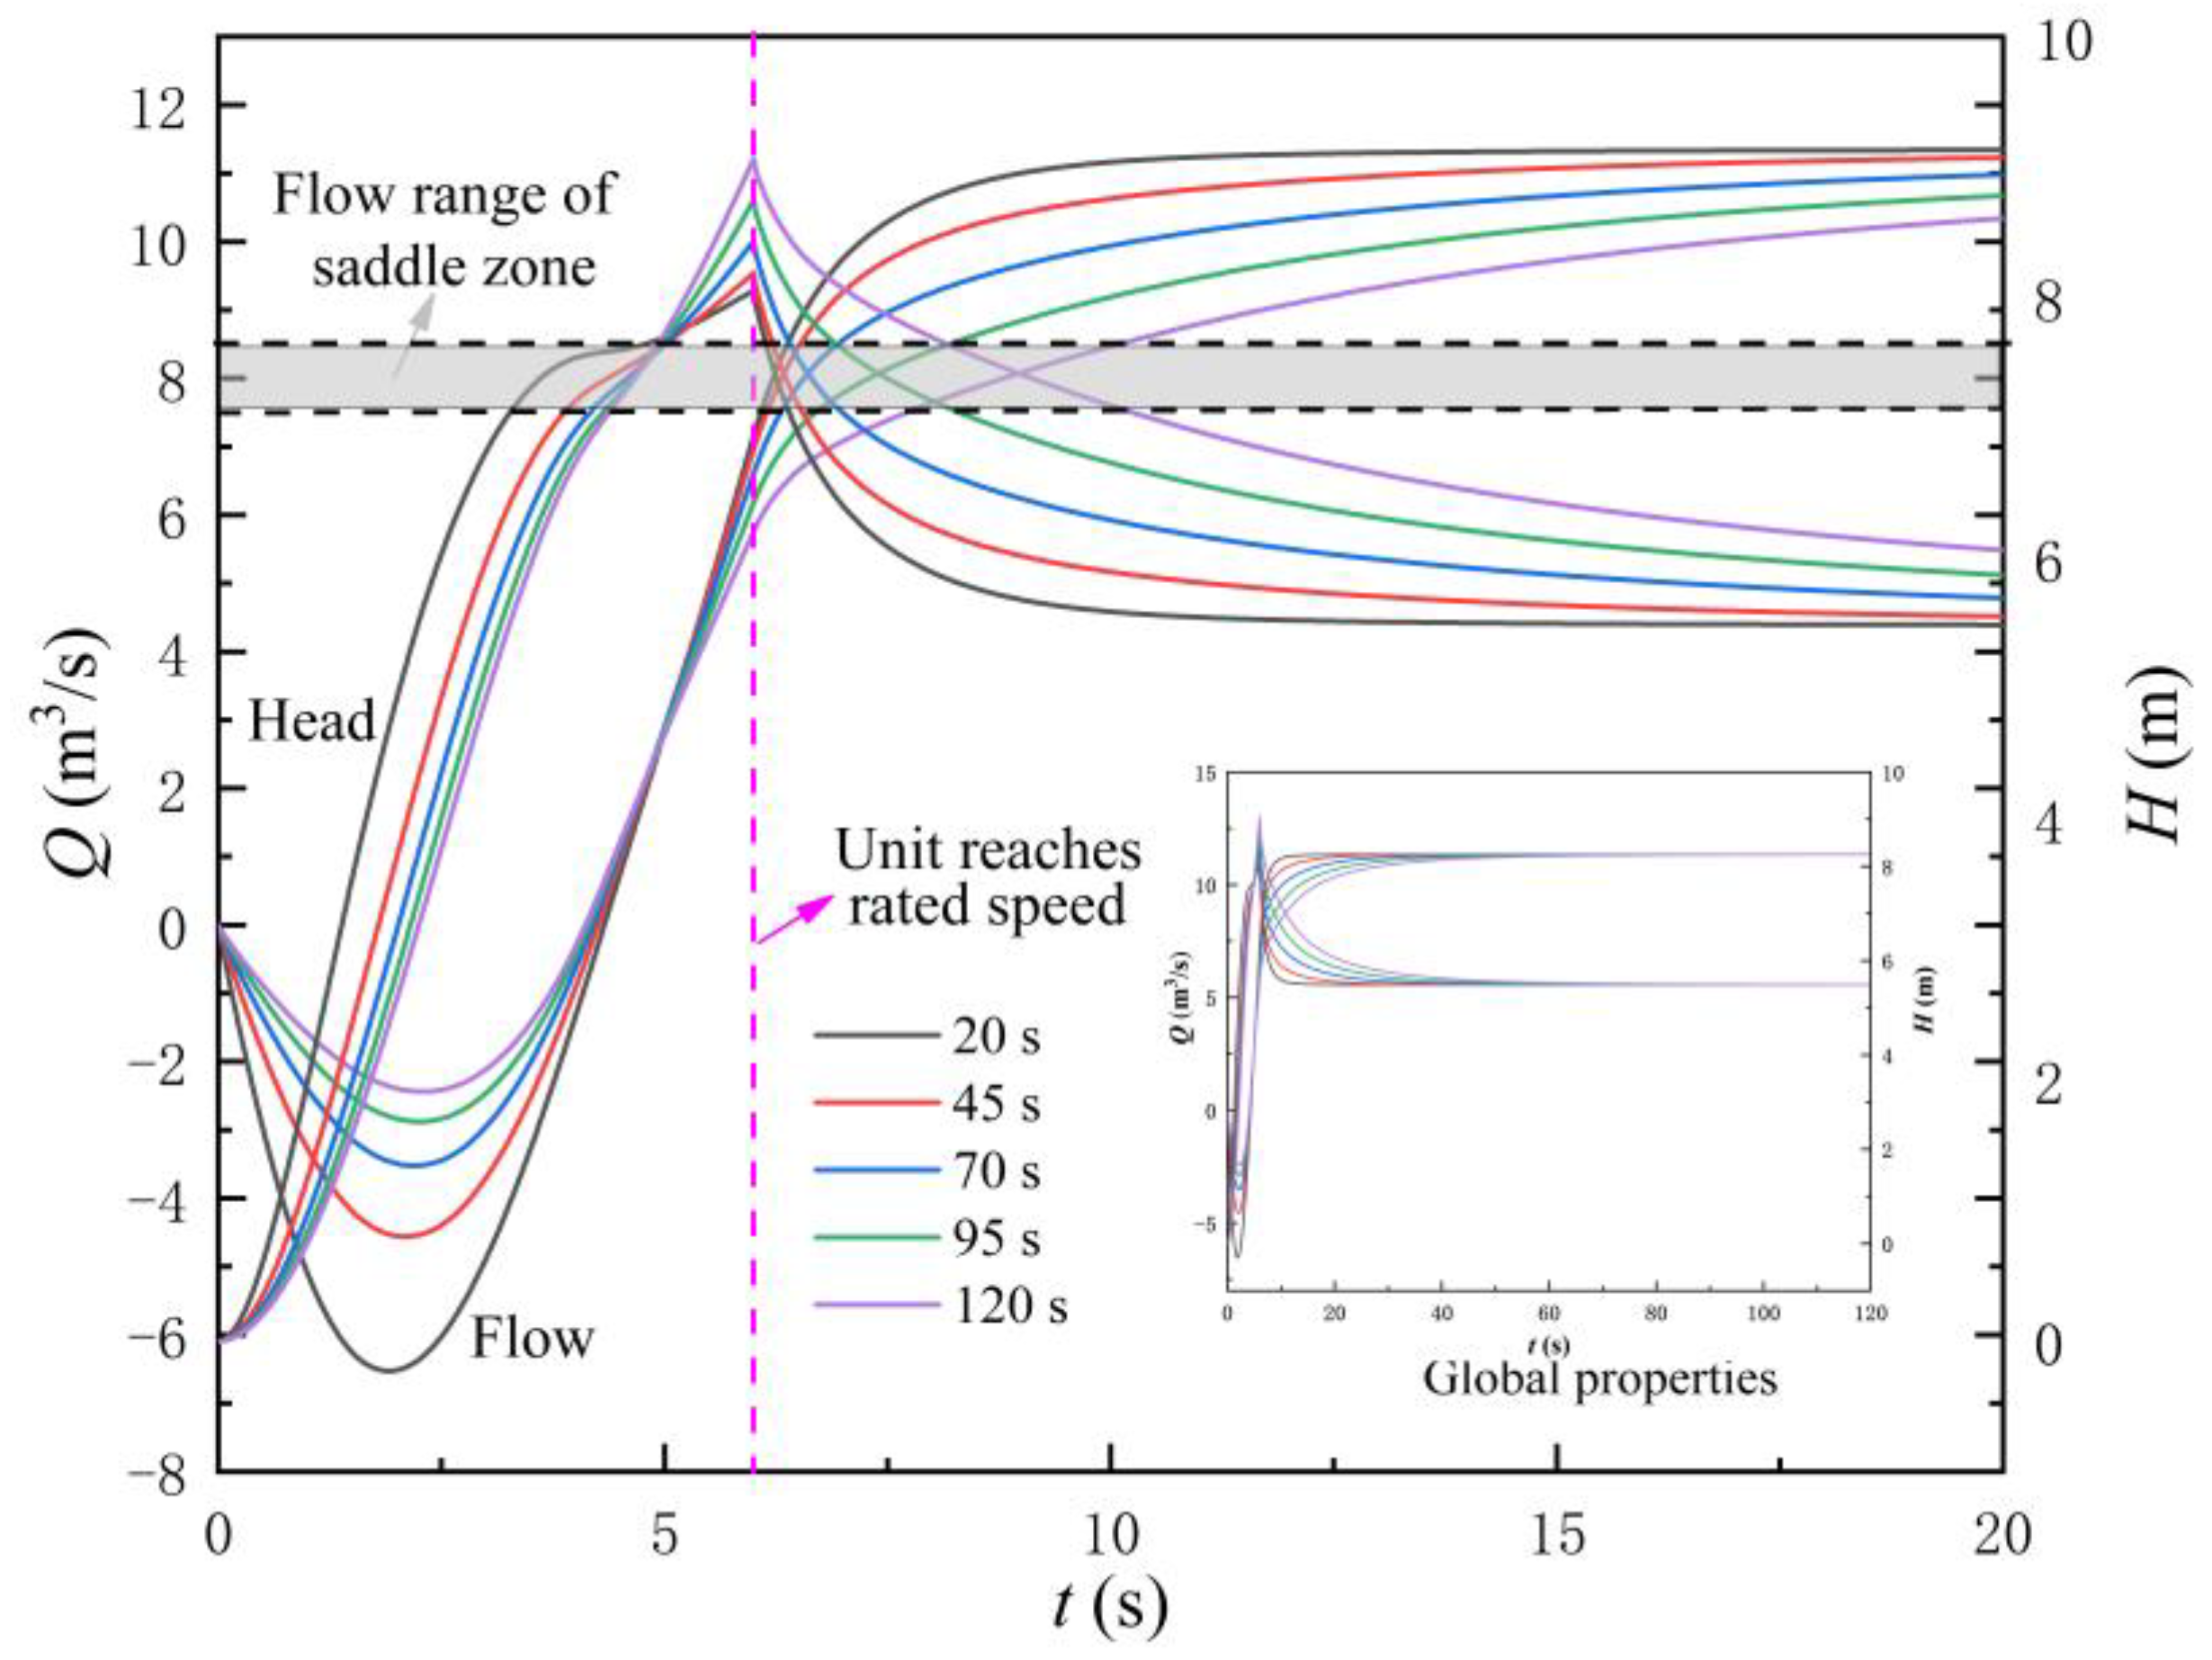
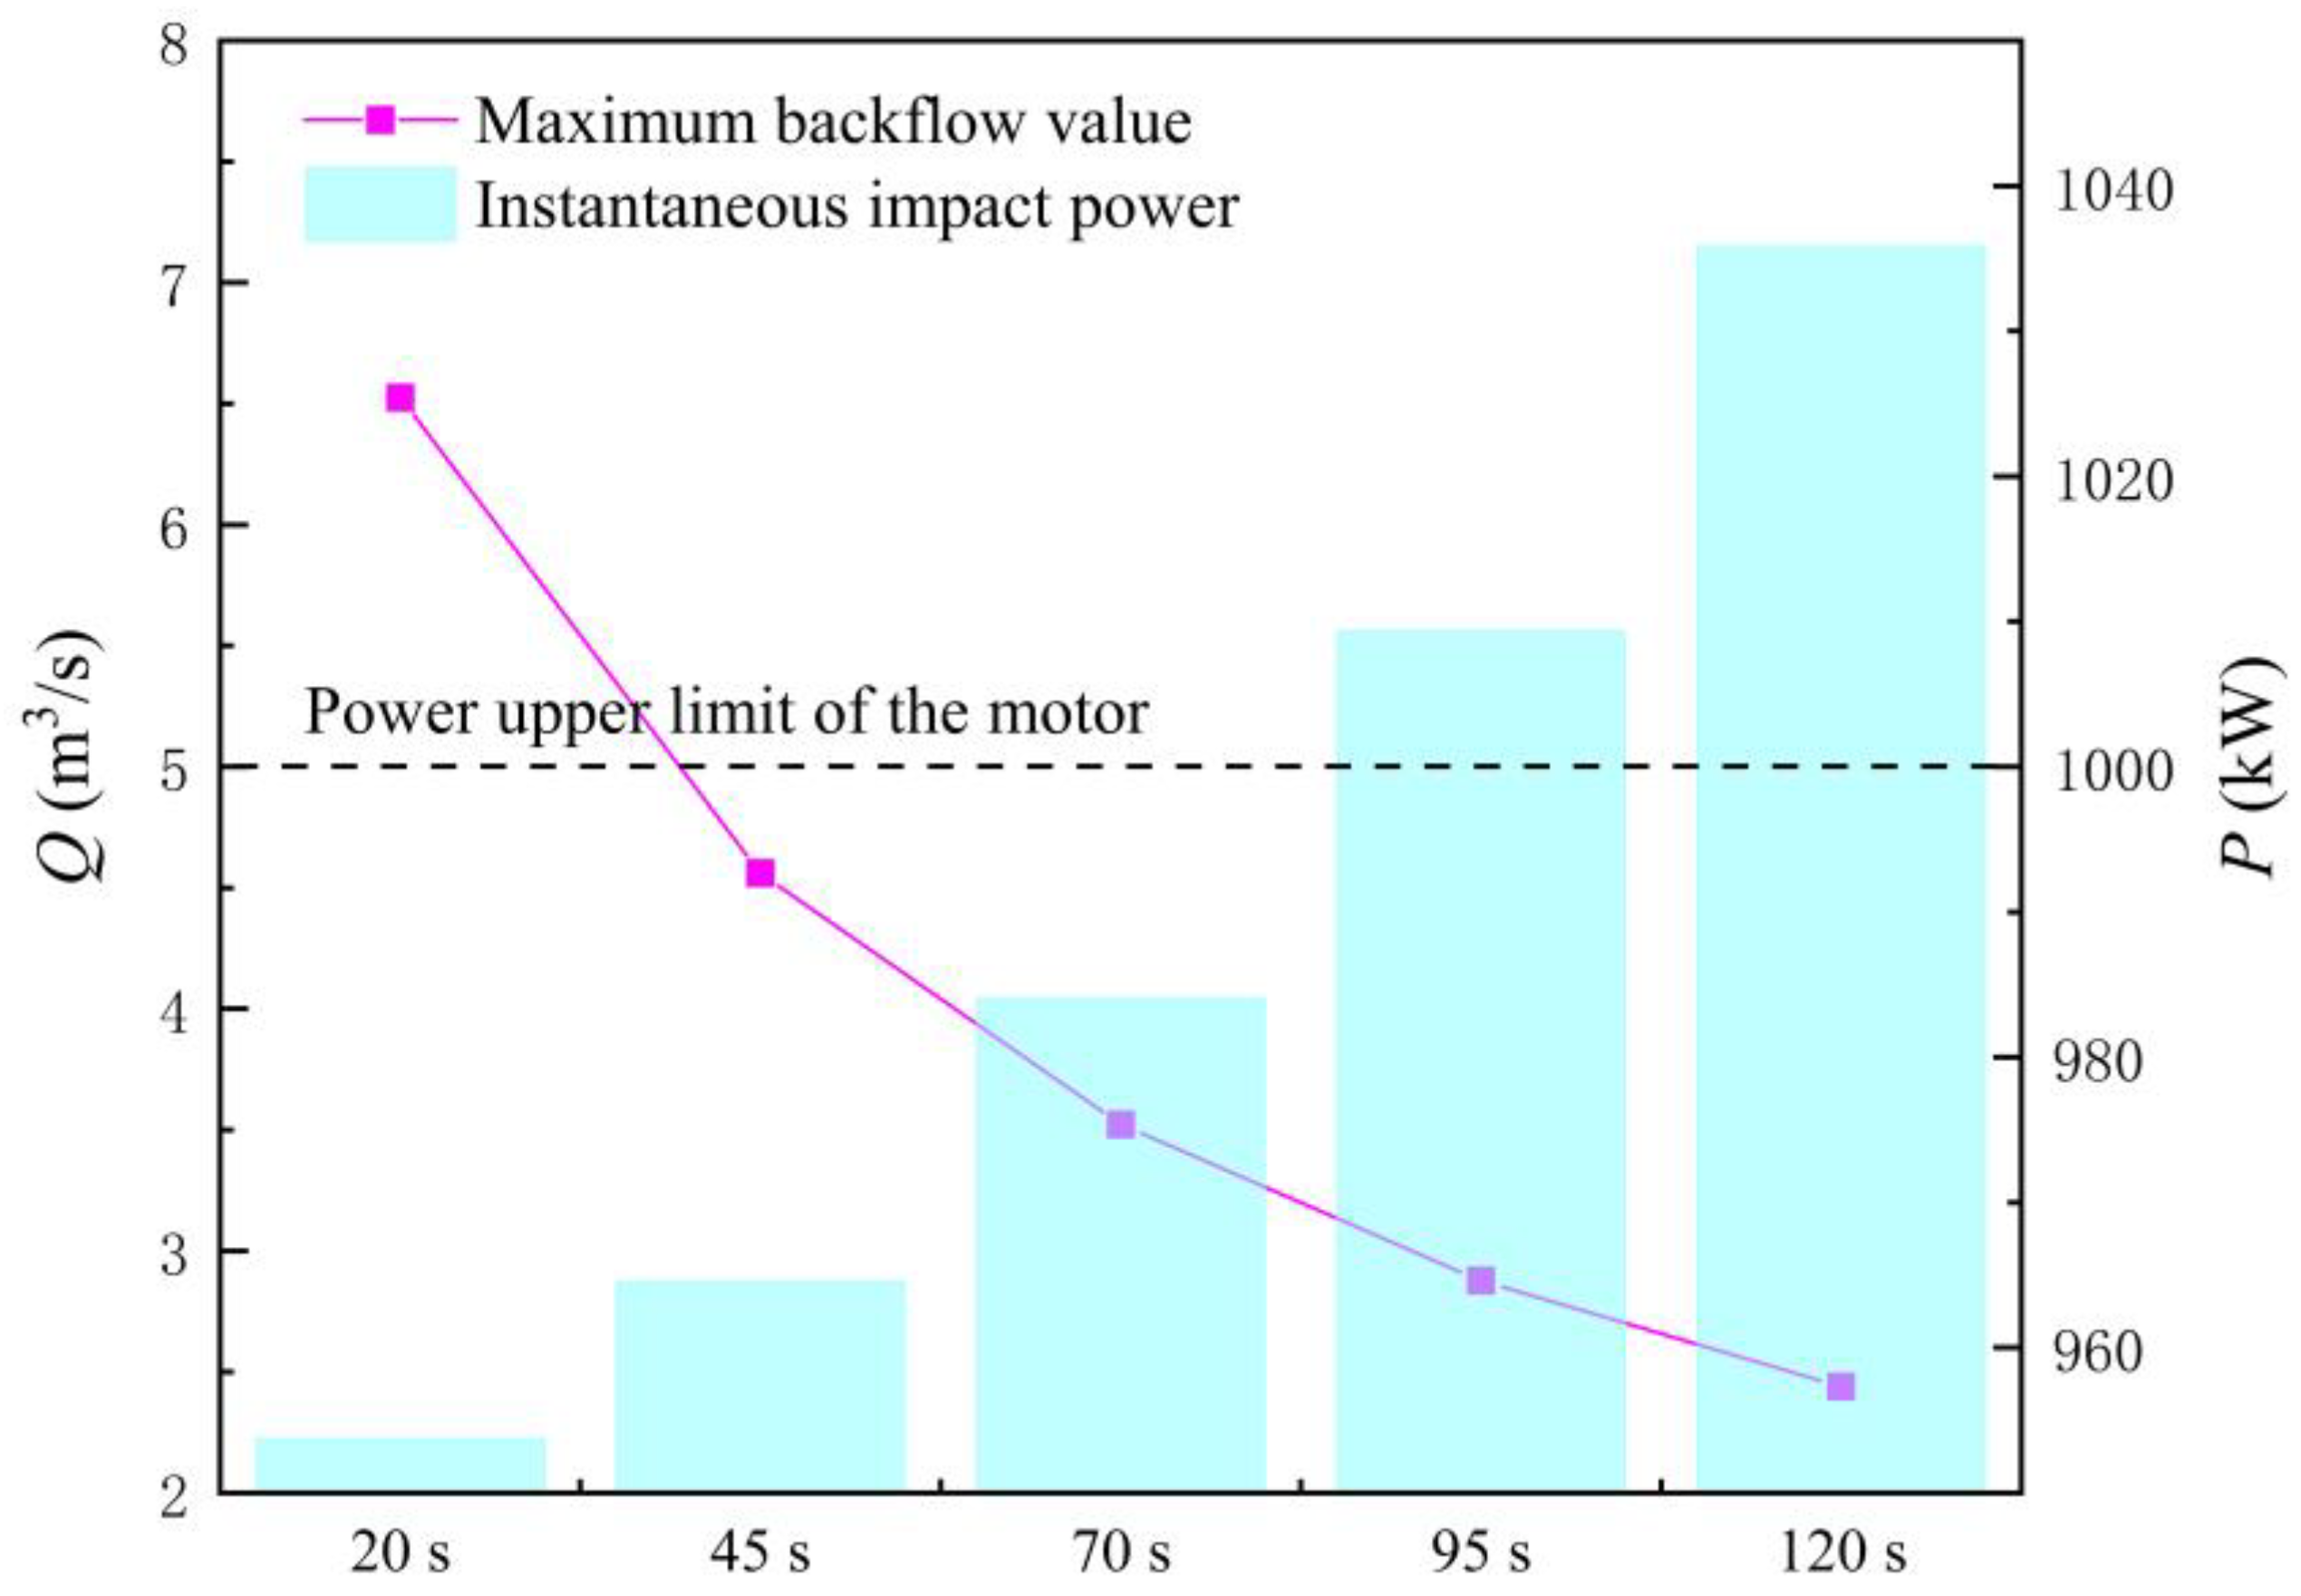
4.1. Influence of Opening Speed of Rapid-Drop Gate

In order to explore the influence of rapid-drop gate opening speed on the start-up process characteristics of the LAPS, it was necessary to transiently simulate the start-up process of the LAPS with different gate opening speeds (gate opening and unit start-up synchronization). Figure 11 shows the variation law of the key characteristic parameters of the LAPS with time; the time required for gate opening was 120 s. It can be seen from Figure 11 that the fluid in the pump will be backflow at the initial stage of the start-up because the speed of the impeller has not been raised to the rated speed. With the gradual increase of the speed of the impeller, the phenomenon of backflow in the pump gradually disappears, and the pump head increases steadily. When t = 6 s, the unit reaches the rated speed, and the instantaneous impact head and instantaneous impact power (IIP) of the pump also reach the maximum. When the unit reaches the rated speed, the LAPS gradually transitions to the conventional steady operation, and the fluctuation of the key characteristic parameters tends to be smooth.
According to the actual operation experience of the LAPS, as long as the corresponding instantaneous flow rate does not fall within the flow range of the saddle area when the LAPS reaches the rated speed, it can basically ensure that the start-up of the LAPS will not lead to instability of the LAPS due to the influence of the saddle zone. Through the performance experiment of the pump, it was found that the flow rate range of the saddle zone was 7.5 m3/s~8.5 m3/s. When t = 6 s, the instantaneous impact head of the pump was 9.06 m, and the corresponding flow was 5.76 m3/s, which was not within the flow range of the saddle zone, indicating that when the LAPS starts with this scheme, it cannot be unstable due to the influence of the saddle zone. However, when t = 6 s, the IIP of the unit is 1035.88 kW, which exceeds the upper limit of the maximum power of the motor. Therefore, it is likely to cause the LAPS to fail on start-up.
Figure 12 shows the variation law of flow rate and head under different times required for gate opening (TRRO). From Figure 12, the following conclusions can be drawn. Firstly, no matter which TRRO is adopted, the corresponding instantaneous flow rate is not within the flow range of the saddle area when the LAPS reaches the rated speed, so the start-up of the LAPS cannot be unstable due to the influence of the saddle zone. Secondly, no matter which TRRO is adopted, the instantaneous impact head in the LAPS reaches the maximum when the unit reaches the rated speed, but the slower the gate opening speed is, the faster the increasing speed of the pump head is, and the greater the maximum instantaneous impact head is. Thirdly, the slower the gate opening speed is, the more favorable it is for reducing the backflow and the duration of backflow at the initial stage of the start-up of the LAPS. It can be observed that with the increase in the TRRO, the maximum backflow flow (MBF) in the start-up process of the LAPS gradually decreases, and the duration of the backflow state in the LAPS is also gradually shortened.
Figure 13 shows the MBF and IIP of the LAPS under the different TRRO. The following conclusions can be drawn from Figure 13. Firstly, with the gradual increase in the TRRO, the MBF decreases gradually. Under the TRRO = 20 s scheme, the MBF in the LAPS is 6.53 m3/s, and under the TRRO = 120 s scheme, the MBF in the LAPS has been reduced to 2.44 m3/s. Secondly, the decline rate of the MBF in the LAPS is not linear, but slows down with the gradual increase of the TRRO. Thirdly, the larger the TRRO, the greater the IIP of the unit is. Under the TRRO = 20 s scheme, the IIP of the unit reaches 1009.36 kW, and under the TRRO = 120 s scheme, the IIP of the unit reaches 1035.88 kW. It is obvious that if the gate starts too slowly, the IIP will exceed the upper limit of the maximum power of the motor, which will lead to the overload of the unit and finally lead to start-up failure.

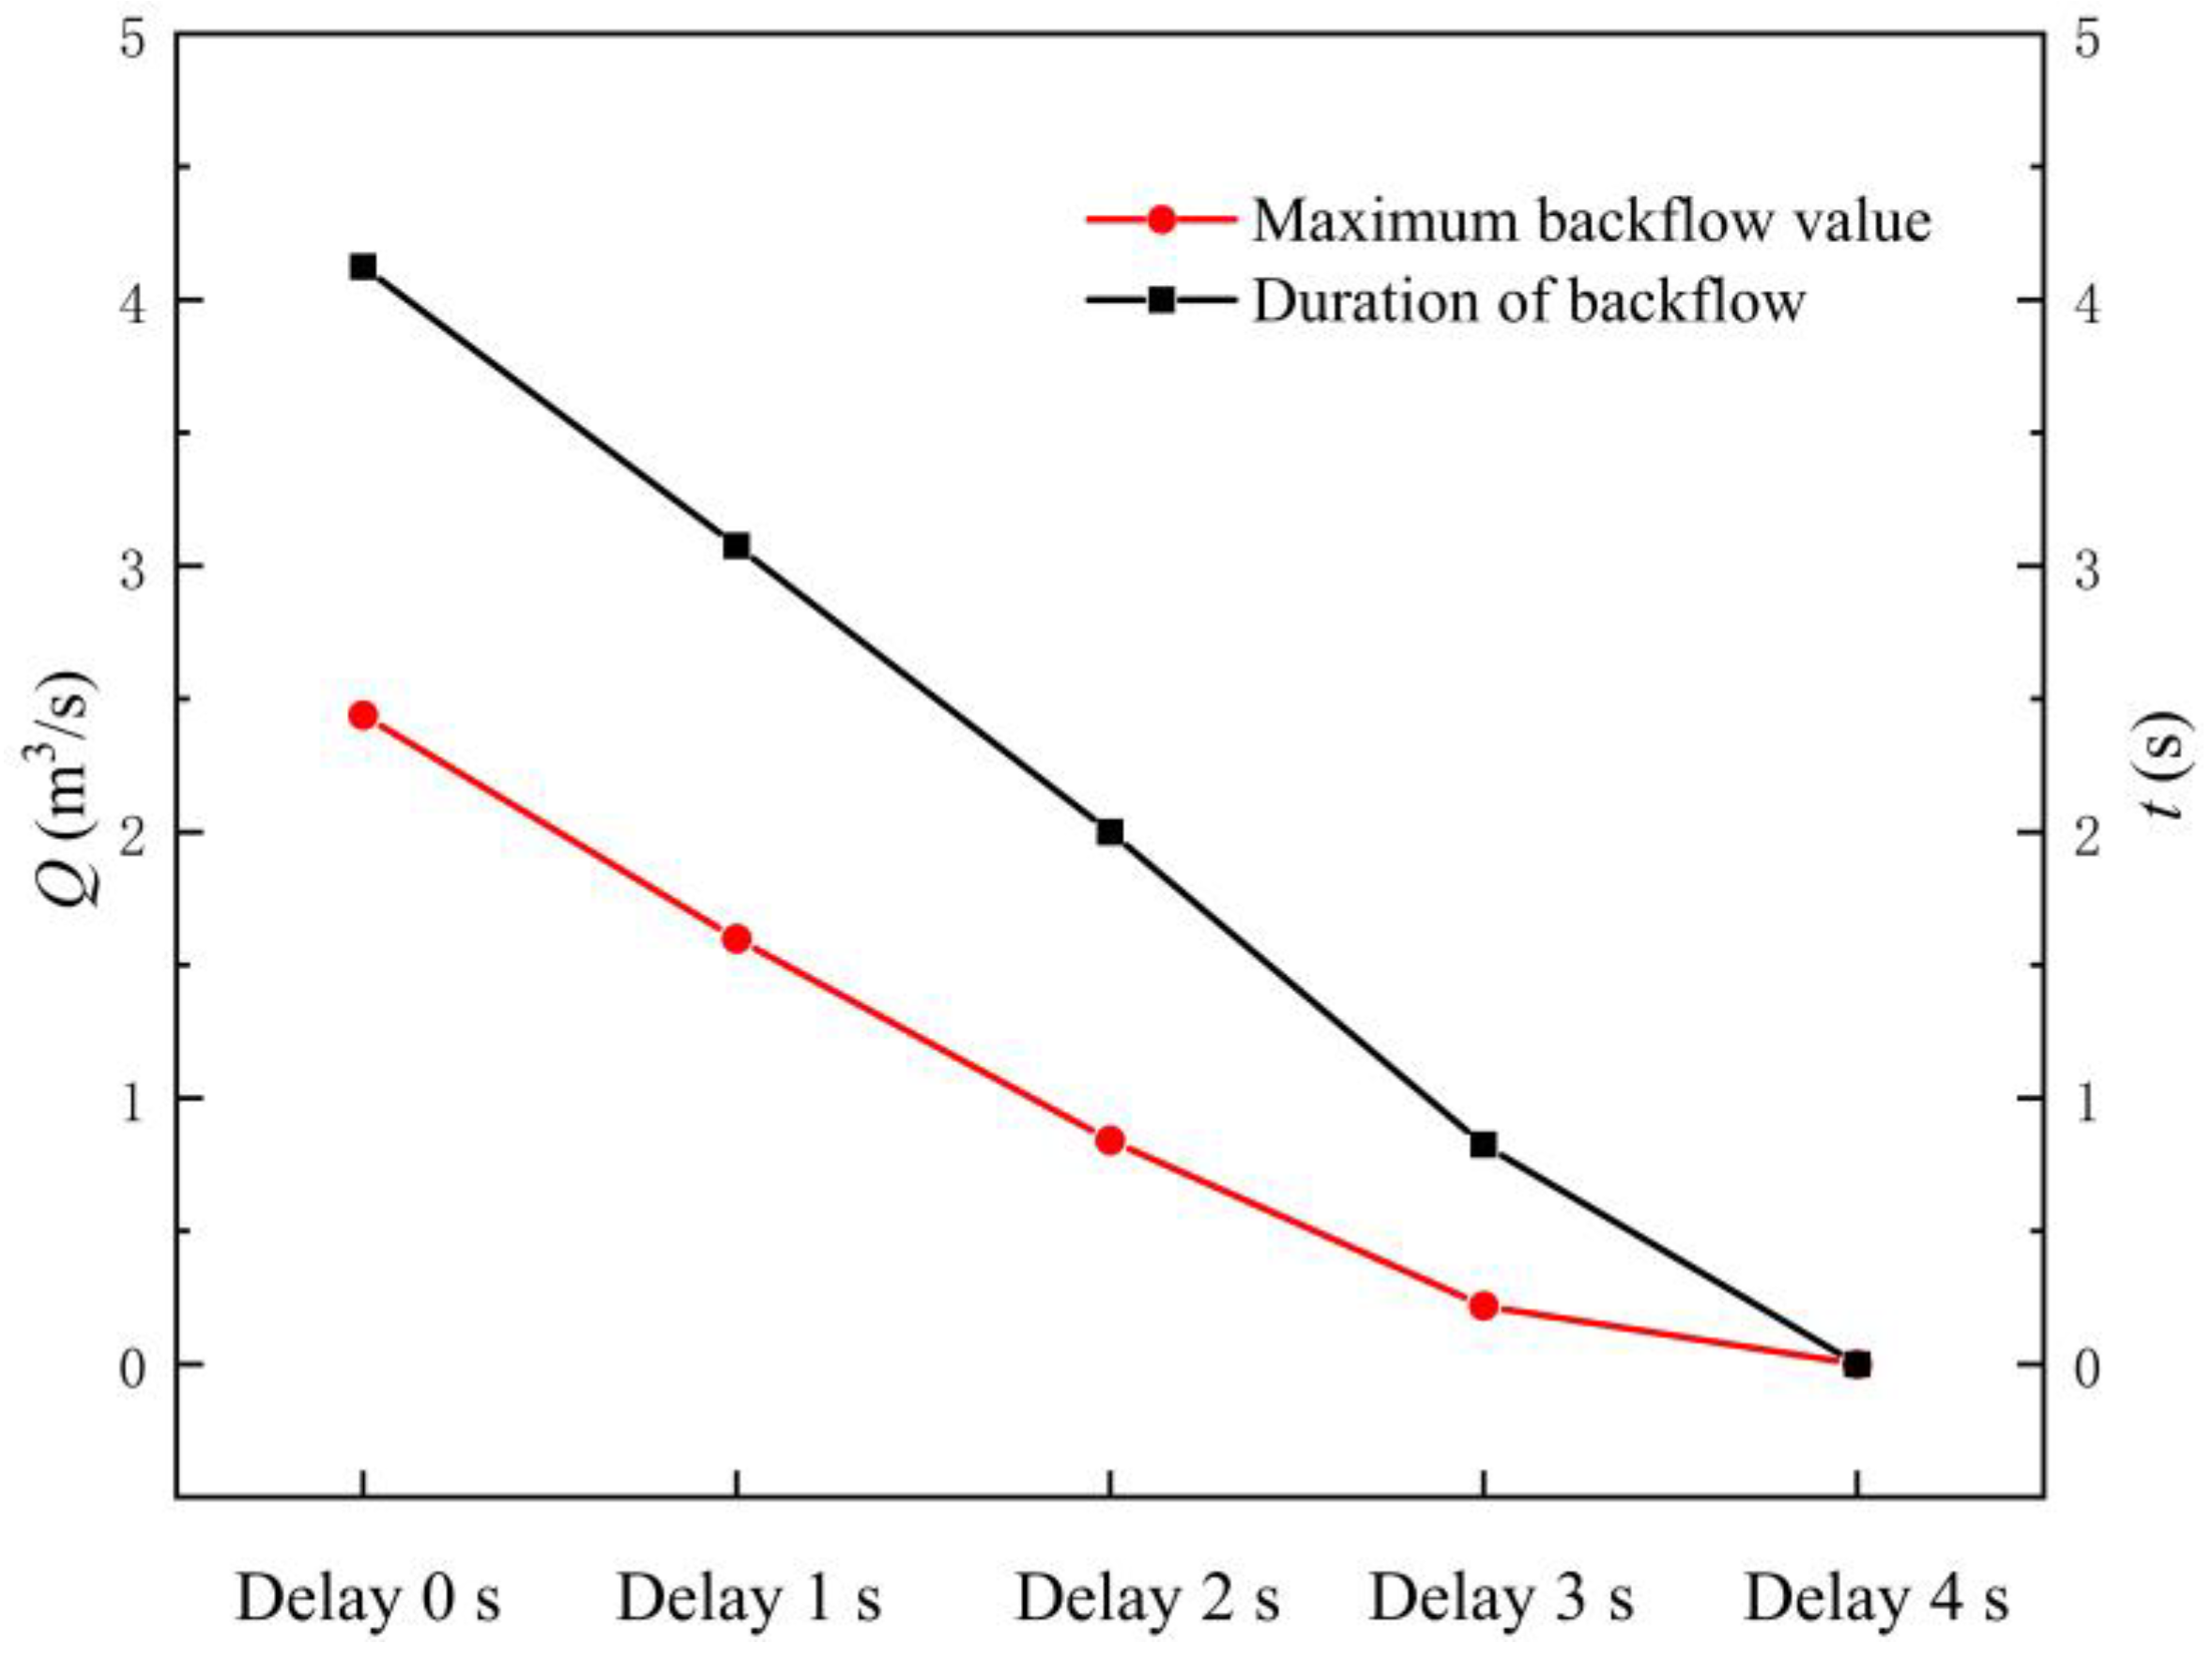
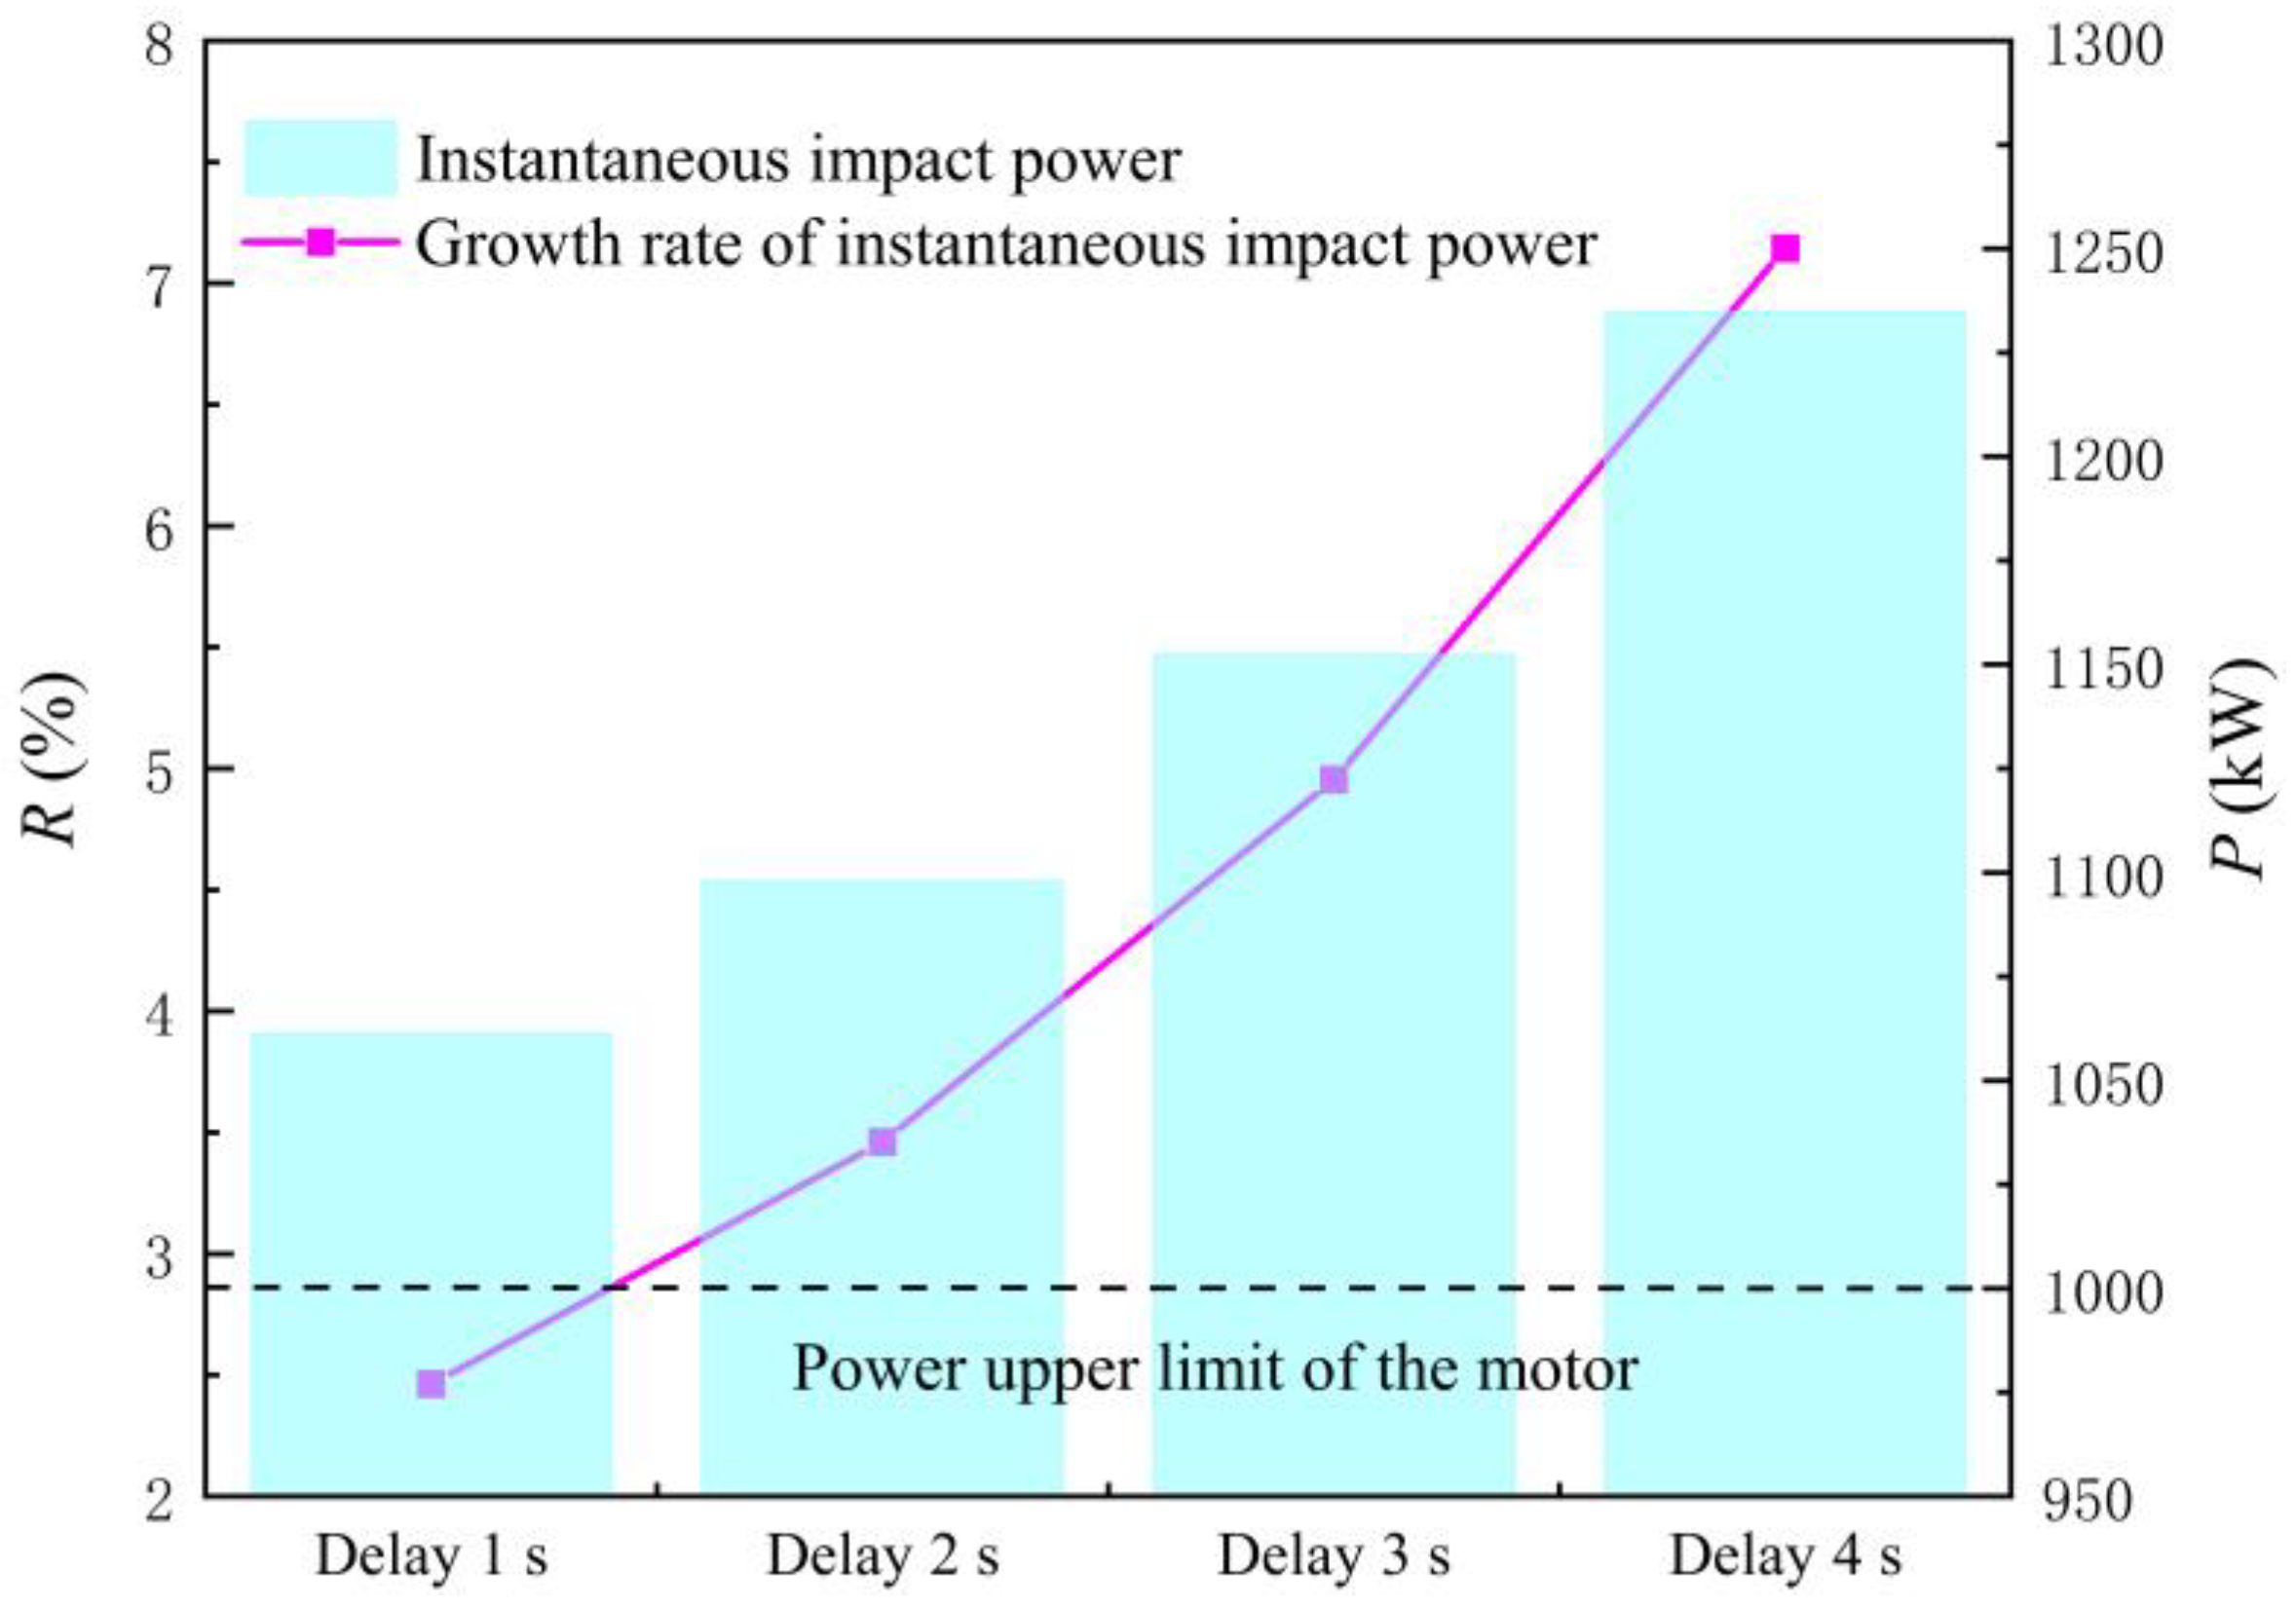
4.2. Influence of Delaying Opening Time of Rapid-Drop Gate

From Section 4.1, it can be found that in the initial stage of the start-up of the LAPS, if the rapid-drop gate and the motor are opened synchronously, backflow will occur in the LAPS, which will cause impact and damage to the pump blade. This section studies the influence of delaying opening time of the rapid-drop gate in the start-up process characteristics of the LAPS.
Figure 14 shows the variation law of the flow rate and head of the LAPS with different times of gate opening delay (TOOD). The following conclusions can be drawn from Figure 14. Firstly, when adopting the four different TOOD schemes, the flow rate of the LAPS corresponding to the synchronous speed of the unit is not within the flow range of the saddle zone, and the start-up of the LAPS cannot be unstable due to the influence of the saddle zone. Secondly, delaying the opening of the gate will result in a surge of instantaneous impact head, but the instantaneous impact head in the LAPS will still reach the maximum when the unit reaches the rated speed, and the longer the gate lag is, the greater the instantaneous impact head of the pump. Finally, delaying the opening of the gate can significantly reduce the MBF and the duration of backflow at the initial start-up of the LAPS. It can be observed that the longer the TOOD, the smaller the MBF during the start-up of the LAPS is, and the shorter the duration of the fluid backflow state in the LAPS is.
Figure 15 shows the MBF and backflow duration of the LAPS with the different TOOD. The following conclusions can be drawn from Figure 15. Firstly, with the delay of the rapid-drop gate opening, the MBF of the LAPS gradually decreases, and the backflow duration of the LAPS continues to shorten. When the TOOD = 1 s, the MBF in the LAPS is 1.60 m3/s, and the duration of backflow is 3.08 s. When the TOOD = 4 s, the MBF and the duration of backflow in the LAPS are 0, indicating that the backflow in the LAPS disappears completely. Secondly, when the TOOD = 2 s, the decreasing rate of the MBF and backflow duration in the LAPS tend to be linear, and when the TOOD is more than 2 s, the decline rate of the MBF and backflow duration in the LAPS slows down gradually.
Figure 16 shows the IIP and the growth rate of the LAPS with different TOOD. The following conclusions can be drawn from Figure 16. Firstly, the opening of the rapid-drop gate lags the opening of the motor, which will bring great risk to the start-up of the LAPS. With the delayed opening of the rapid-drop gate, the IIP of the unit increases rapidly. The IIP of the unit is 1061.4 kW when the TOOD = 1 s, and the IIP of the unit has reached 1234.89 kW when the TOOD = 4 s, which far exceeds the upper limit of the motor power. Secondly, the longer the opening of the rapid-drop gate lags the opening of the motor, the faster the IIP growth rate of the unit will rise. When the TOOD = 1 s, the growth rate of the IIP of the unit is 2.46%. When the TOOD = 4 s, the growth rate of the IIP of the unit has jumped to 7.15%.

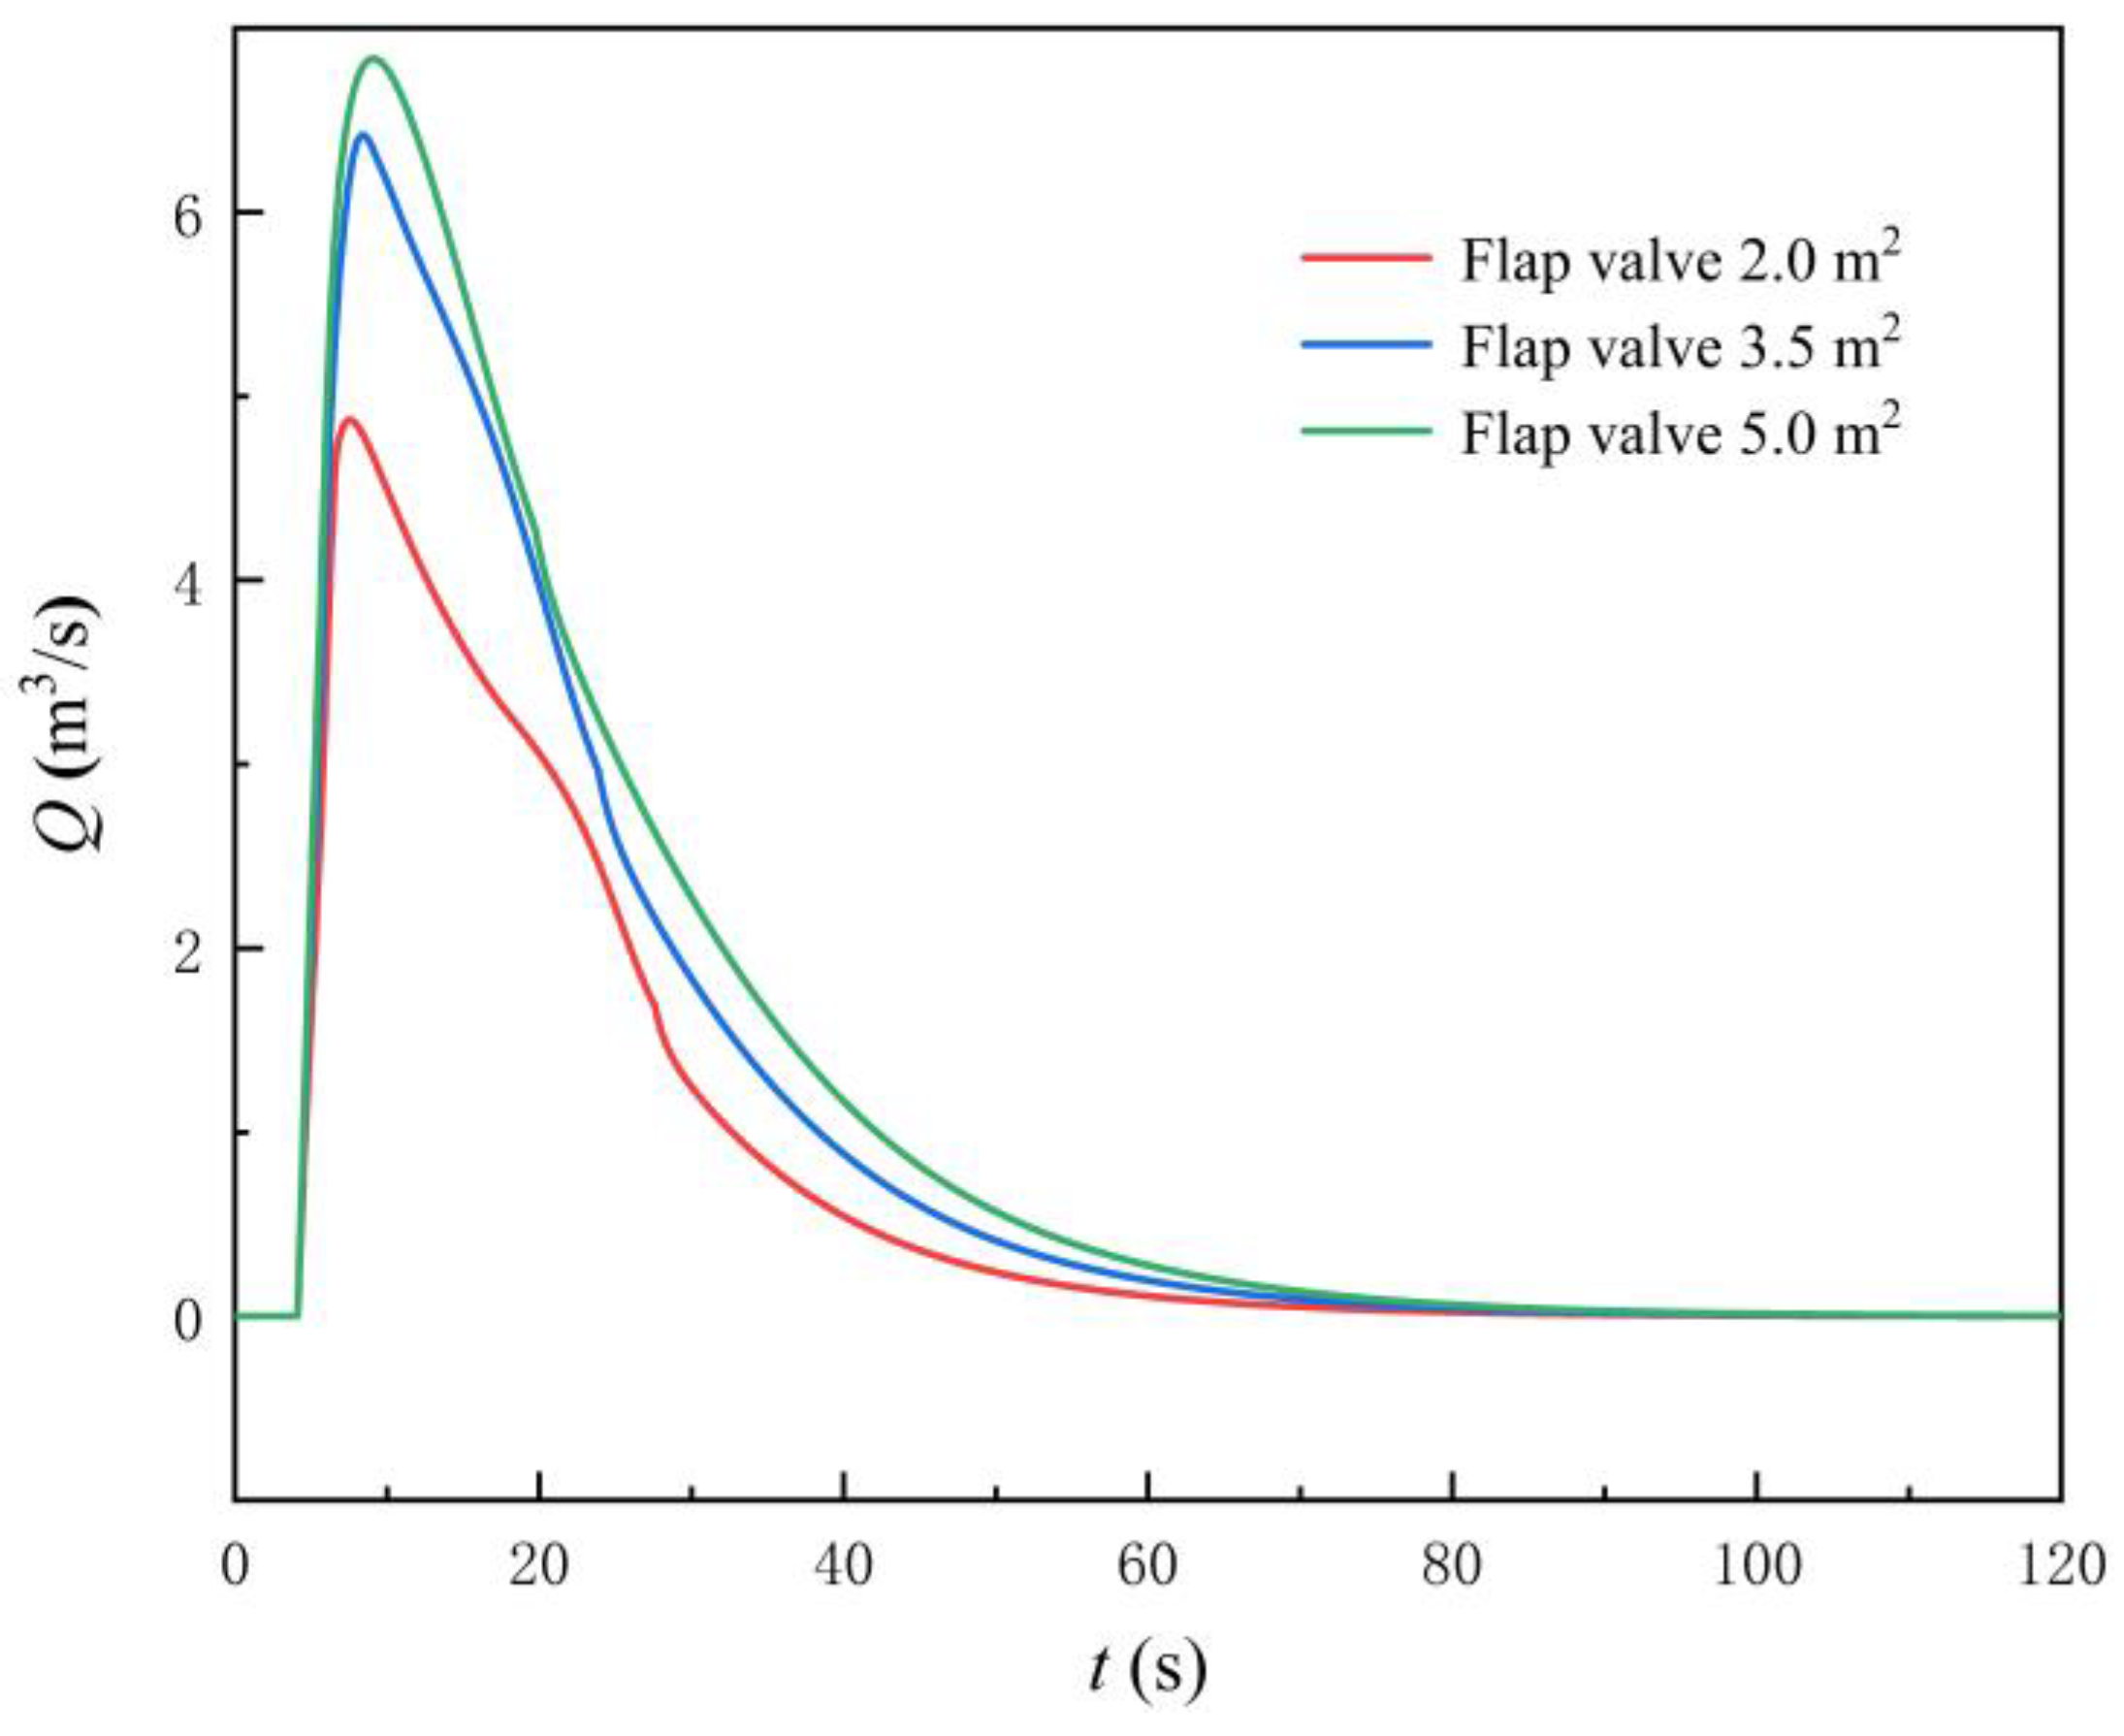
4.3. Influence of Adding the Flap Valve

From Section 4.1, it can be found that if the gate opening speed is too slow, the head and power of the LAPS will increase sharply in a short time, which will cause the motor to overpower and the pump unit start-up will fail. This section studies the influence of adding the flap valve to the start-up process characteristics of the LAPS.
Figure 17 shows the variation law of the flow rate and head of the LAPS after adding the flap valve. Figure 18 shows the flow rate at the flap valve. The following conclusions can be drawn by combining Figure 17 and Figure 18. Firstly, when adopting the three different areas of flap valve (AOF), the flow rate corresponding to the synchronous speed of the LAPS is not within the flow range of the saddle zone, and the start-up of the LAPS cannot be unstable due to the influence of the saddle zone. Secondly, the addition of the flap valve to the rapid-drop gate will significantly reduce the maximum instantaneous impact head, and with the increase of the AOF, the maximum instantaneous impact head will gradually decrease. Thirdly, the scheme of adding the flap valve is not helpful to shorten the backflow state at the initial stage of the LAPS start-up, and the flow rate variation law of the LAPS with different AOF is basically the same as that without the flap valve. Finally, with the increase of the AOF, the shunt effect of the flap valve in the start-up process is gradually enhanced.
Figure 19 shows the MBF and IIP of the LAPS after adding the flap valve. The following conclusions can be drawn from Figure 19. Firstly, the addition of the flap valve to the rapid-drop gate will weaken the IIP of the unit, prevent the overload of the unit and significantly improve the reliability of the LAPS start-up. When AOF = 2.0 m2 (15% of the area of the gate), the IIP of the unit has been reduced to 974.26 kW, which reduces the 61.62 kW compared with the start-up scheme without a flap valve. With the gradual increase of the AOF, the IIP of the unit decreases gradually. Secondly, the method of adding the flap valve is not helpful to reduce the MBF at the initial stage of the LAPS start-up. No matter how big the AOF is, the MBF of the LAPS is unchanged, consistent with MBF start-up without adding the flap valve, which is 2.44 m3/s.

4.4. Influence of Adding the Overflow Hole

This section studies the influence of adding an overflow hole in the start-up process characteristics of the LAPS. Figure 20 shows the variation law of the flow rate and head of the LAPS after adding the overflow hole. Figure 21 shows the flow rate at the overflow hole. Combining Figure 20 and Figure 21, the following conclusions can be drawn. Firstly, with different elevation of overflow hole (EOOH), the corresponding flow rate of the LAPS is not within the flow range of the saddle zone when the unit reaches the synchronous speed, and the start-up of the LAPS cannot be unstable due to the influence of the saddle zone. Secondly, after adding the overflow hole, the instantaneous impact head of the start-up process is reduced, but the extent of the reduction is not as obvious as that of the flap valve. When the overflow hole is not added, the instantaneous impact head is 9.06 m, and when the EOOH = 5.65 m (1.06 times of the maximum net head), the instantaneous impact head still reaches 8.45 m. Thirdly, adding overflow holes does not help to shorten the backflow state at the initial stage of the LAPS start-up, and the backflow variation law of the LAPS with different overflow hole elevations is basically the same as that of the LAPS without an overflow hole. Finally, with the increase of the EOOH, the shunt effect in the start-up process of the overflow hole is gradually weakened.
Figure 22 shows the MBF and IIP of the LAPS after adding the overflow hole. The following conclusions can be drawn from Figure 22. Firstly, adding the overflow hole can appropriately reduce the IIP of the unit, but cannot significantly improve the start-up reliability of the LAPS. With different overflow holes, only the IIP of the EOOH = 5.65 m (1.06 times of the maximum net head) is lower than the maximum power limit of the motor. The IIP of EOOH = 6.15 m (1.15 times of the maximum net head) and EOOH = 6.65 m (1.24 times of the maximum net head) is still as high as 1007.13 kW and 1024.89 kW, which cannot meet the start-up load requirements. Secondly, the method of adding the overflow hole is not helpful to reduce the MBF at the initial stage of the LAPS start-up. No matter how higher the EOOH is, the MBF of the LAPS is unchanged, consistent with the MBF start-up without adding the flap valve, which is 2.44 m3/s.

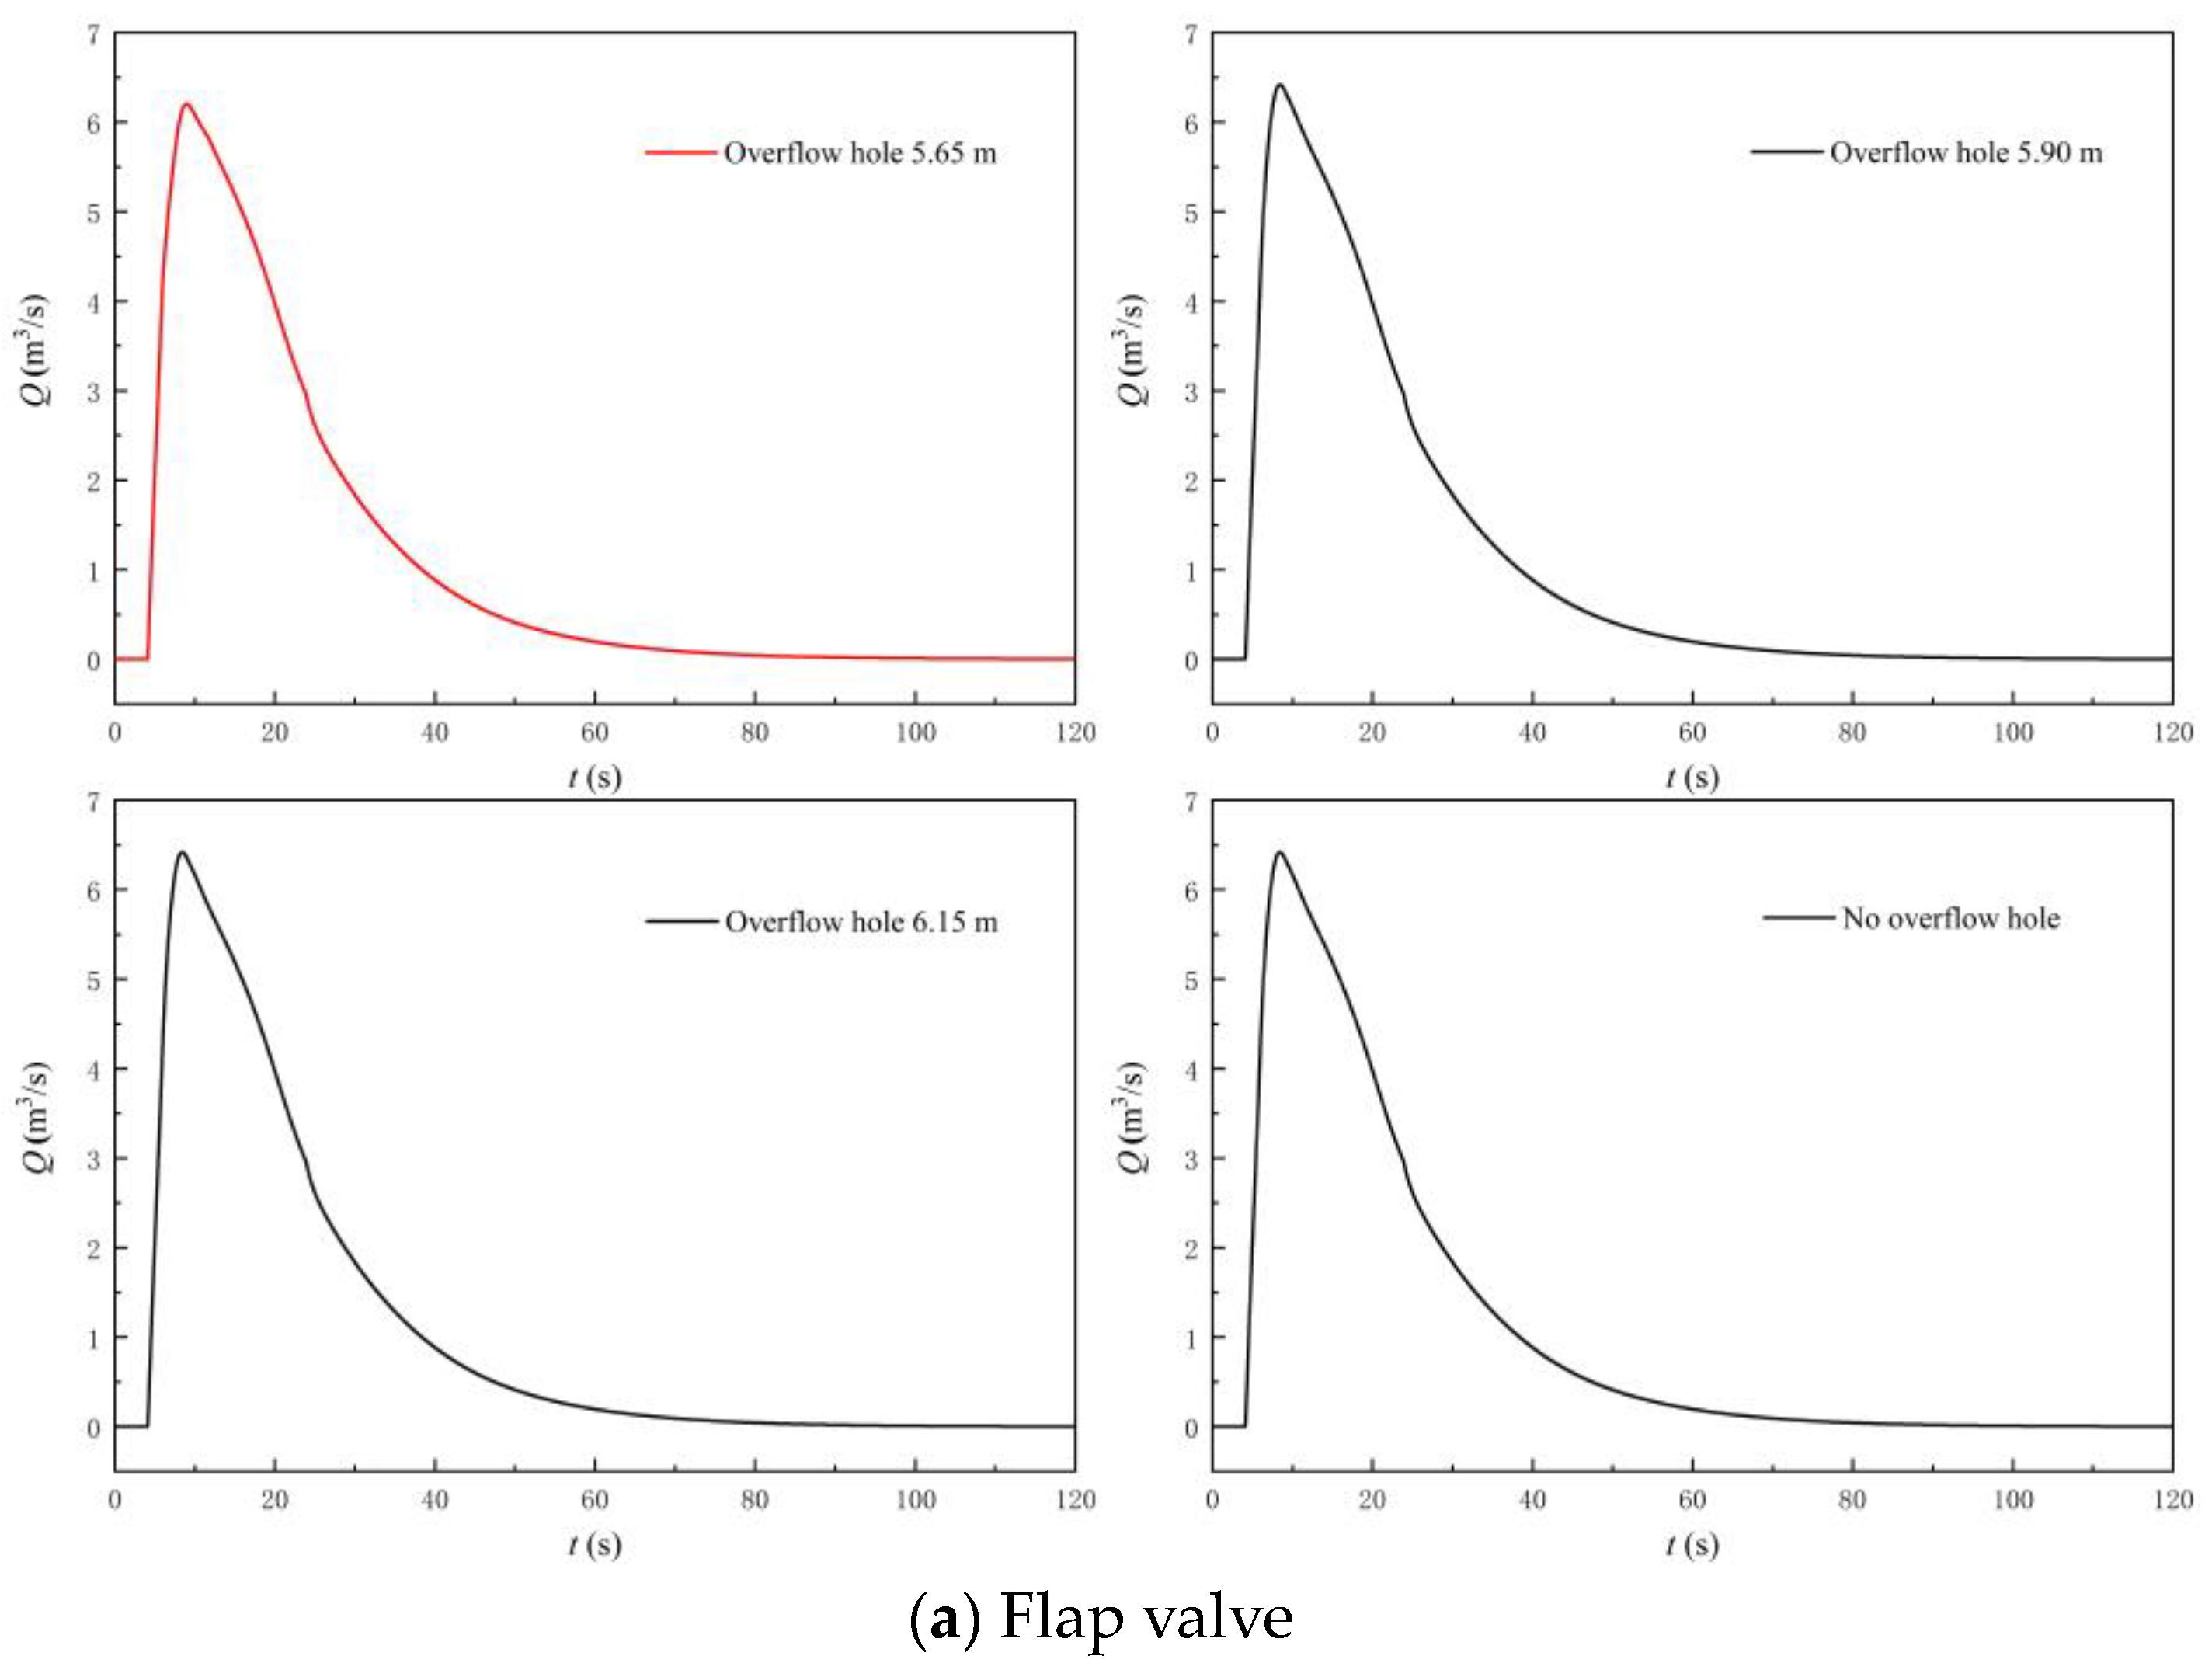
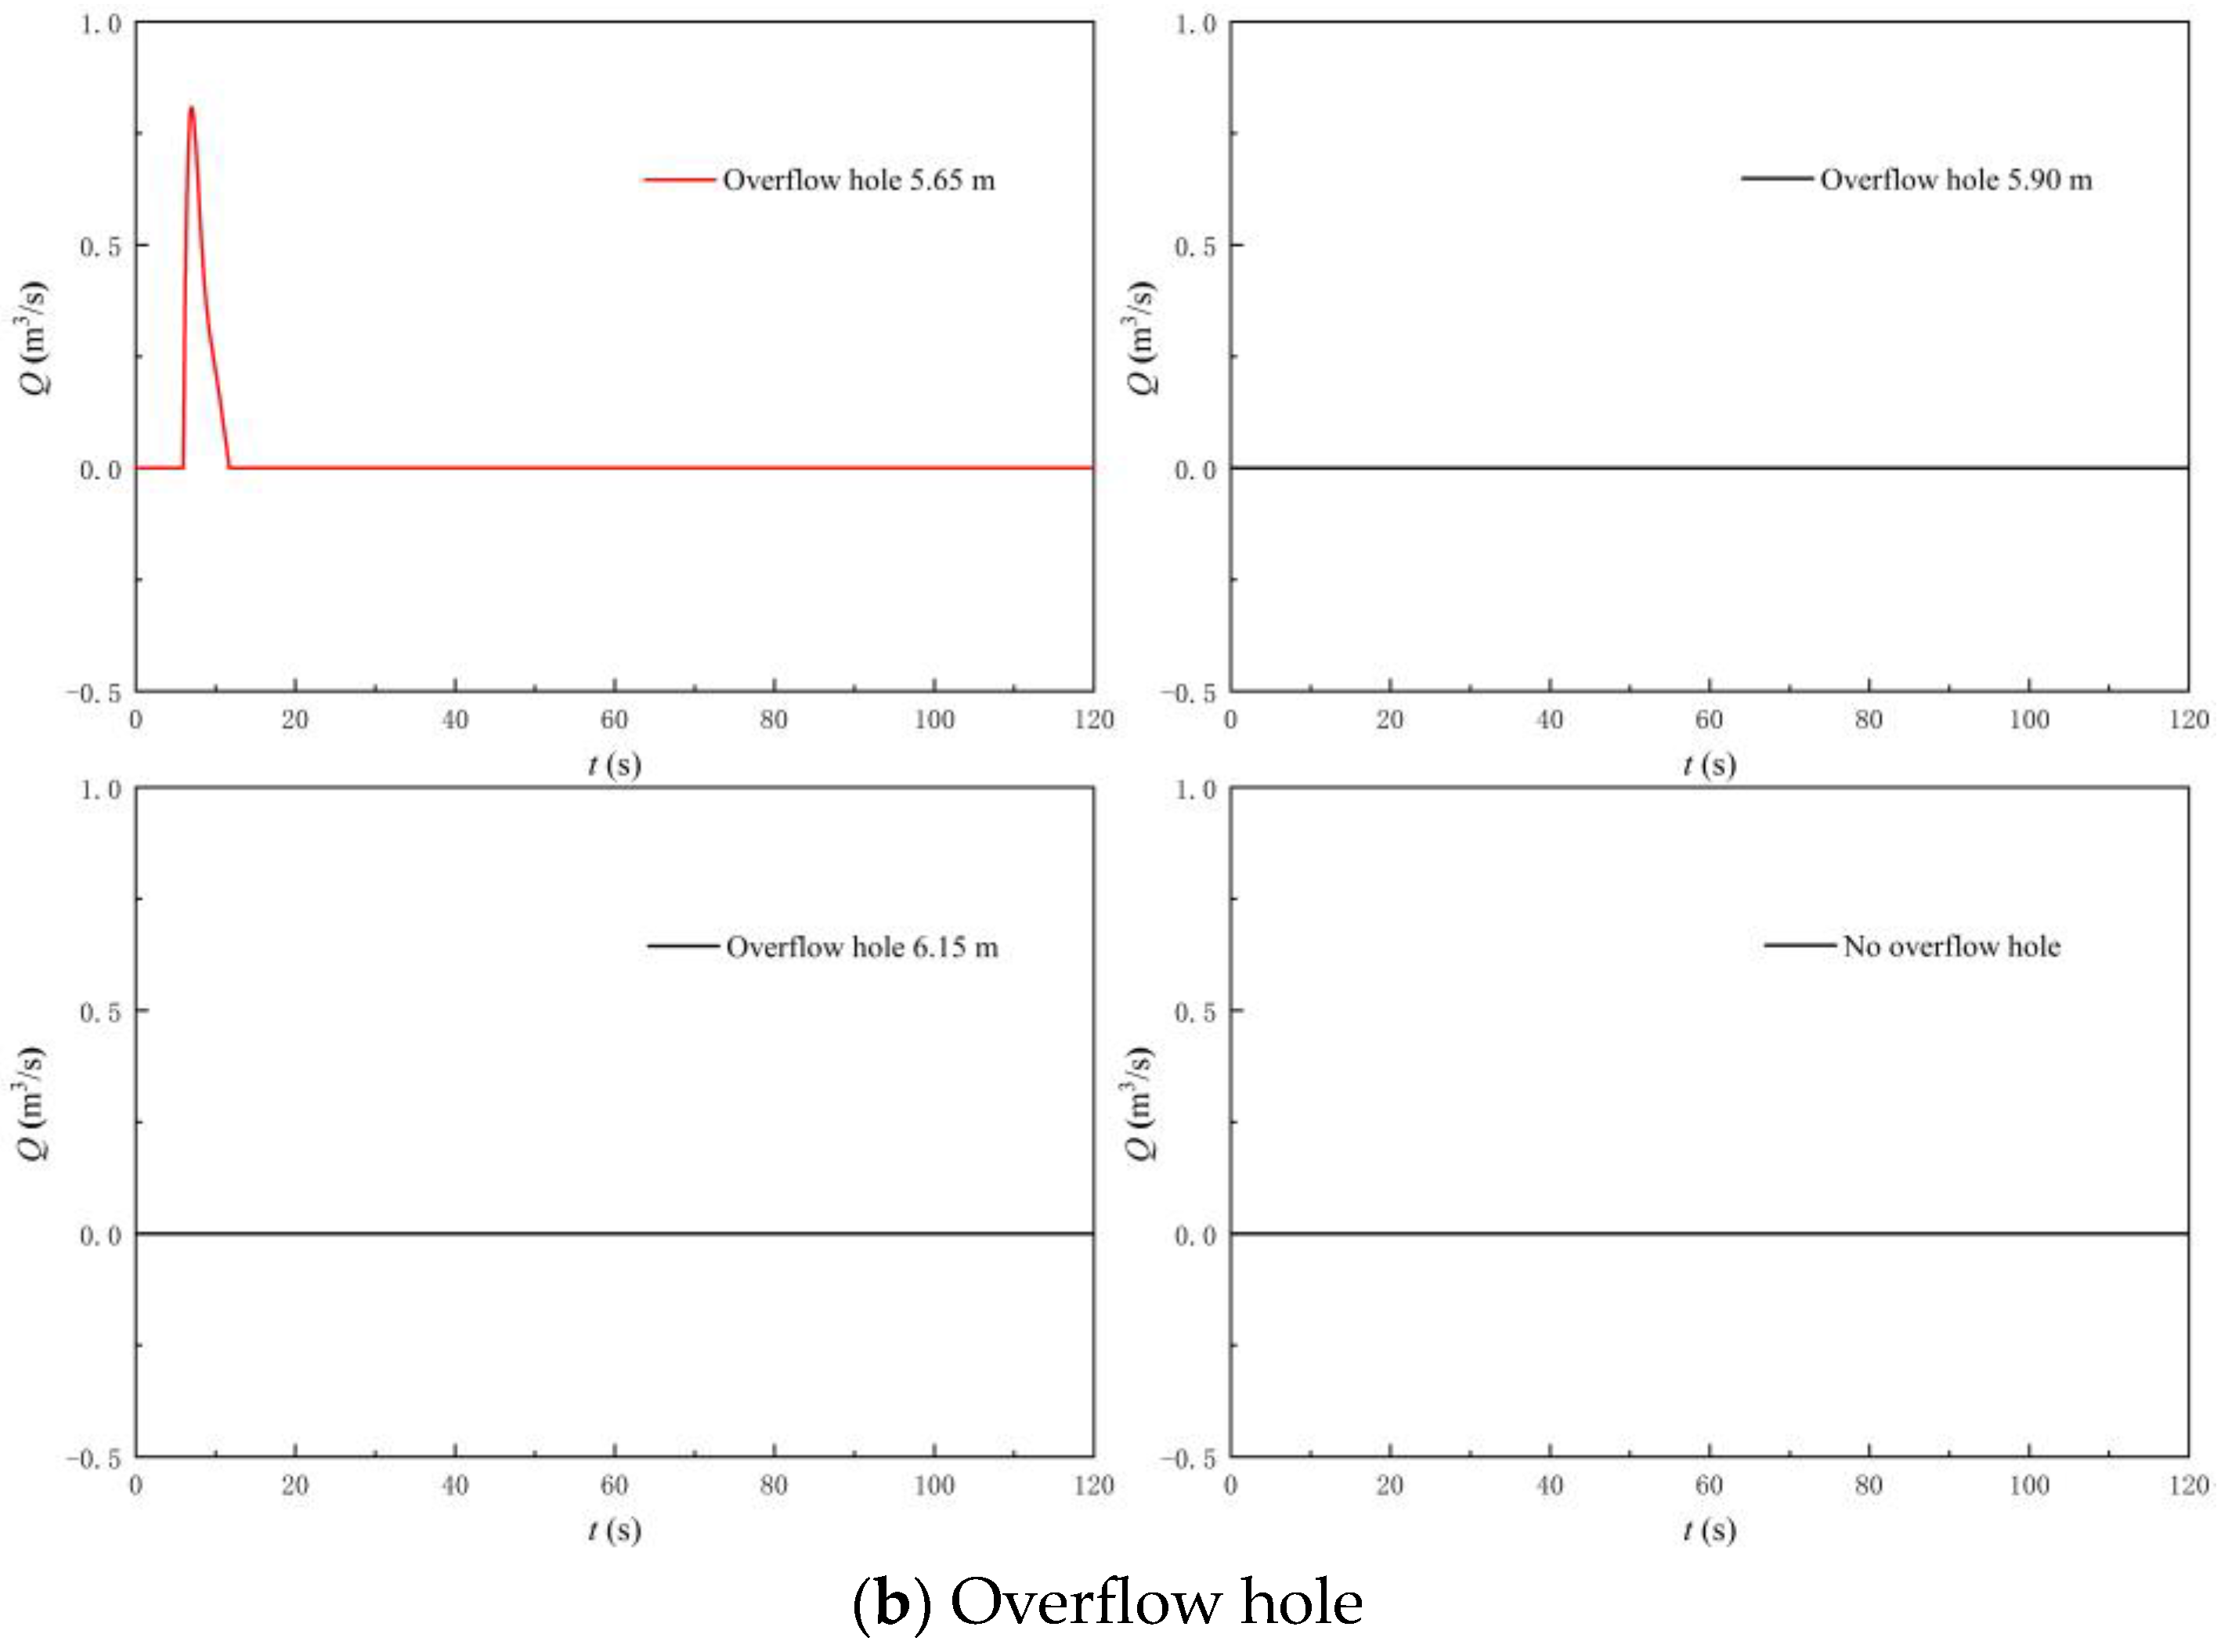
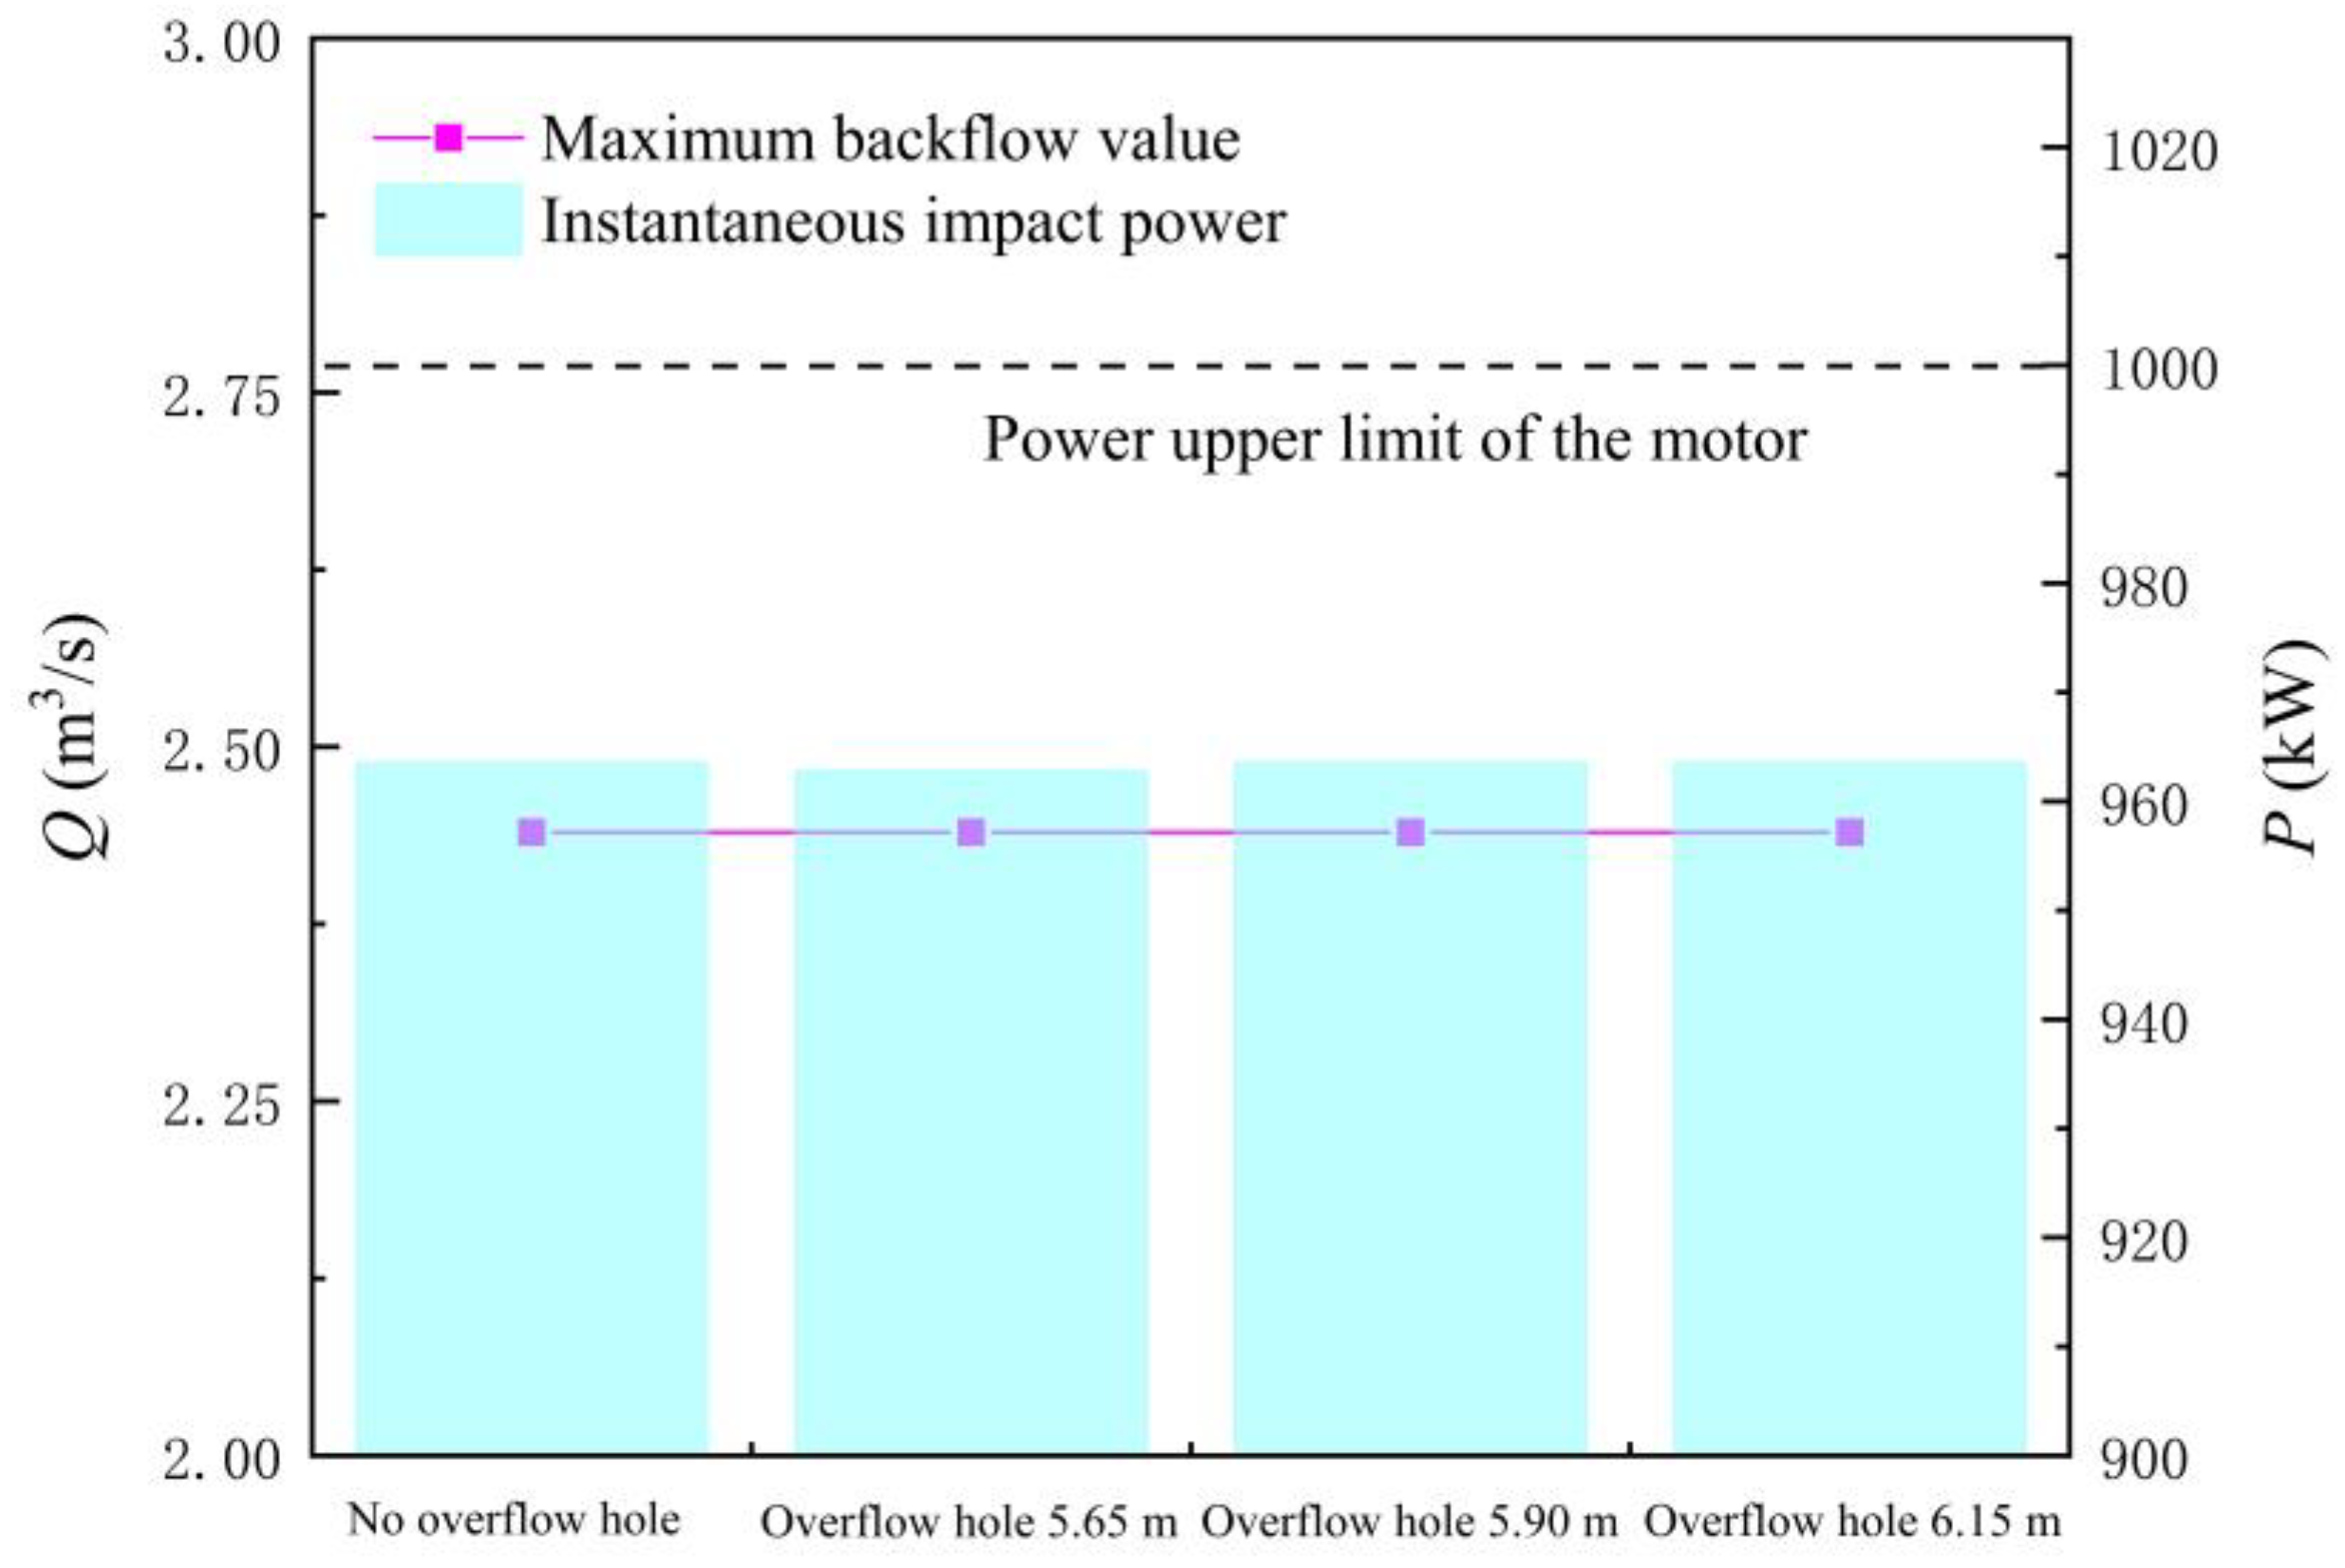
4.5. Influence of Adding Both the Flap Valve and Overflow Hole

According to the analysis results of Section 4.3 and Section 4.4, adding the flap valve is more effective than adding the overflow hole to improve reliability in the start-up process. This section further studies the influence of adding the overflow hole on the start-up process characteristics of the LAPS on the basis of adding a flap valve to the rapid-drop gate.
Figure 23 shows the variation law of the flow rate and head of the LAPS when the overflow hole is further added. The following conclusions can be drawn from Figure 23. Firstly, after adding overflow holes with the three different elevations, the corresponding flow rate of the LAPS is not within the flow range of the saddle zone when the unit reaches the synchronous speed, and the start-up of the LAPS cannot be unstable due to the influence of the saddle zone. Secondly, adding the flap valve on the basis of the rapid-drop gate and then adding the overflow hole is not helpful in further reducing the instantaneous impact head in the start-up process. The instantaneous impact head is 8.18 m when only adding the flap valve and not adding the overflow hole, the pump head is still 8.18 m when a different elevation overflow hole is added. Finally, on the basis of adding the flap valve, adding an overflow hole is still not helpful to shorten the backflow at the initial stage of the LAPS start-up, and the flow rate variation law of the LAPS with time has not changed after adding overflow holes of different elevations.
Figure 24 shows the flow rate at the flap valve and overflow hole. Figure 25 shows the MBF and IIP of the LAPS when an overflow hole is further added. The following conclusions can be drawn by combining Figure 24 and Figure 25. Firstly, the flap valve diversion plays an absolutely dominant role in the initial start-up of the LAPS, and further setting the overflow hole on the basis of adding the flap valve (26% of the rapid-drop gate area) cannot play an obvious role in the further diversion in the initial start-up of the LAPS. Only the overflow hole with an elevation of 5.65 m could divert the maximum flow rate of 0.81 m3/s at the initial stage of the start-up of the LAPS. Secondly, on the basis of adding the flap valve (26% of the area of the rapid-drop gate), the addition of the overflow hole has no significant influence on the MBF and IIP of the LAPS. On the basis of adding the flap valve (26% of the area of the rapid-drop gate), it can be considered whether or not to adjust the overflow hole further.

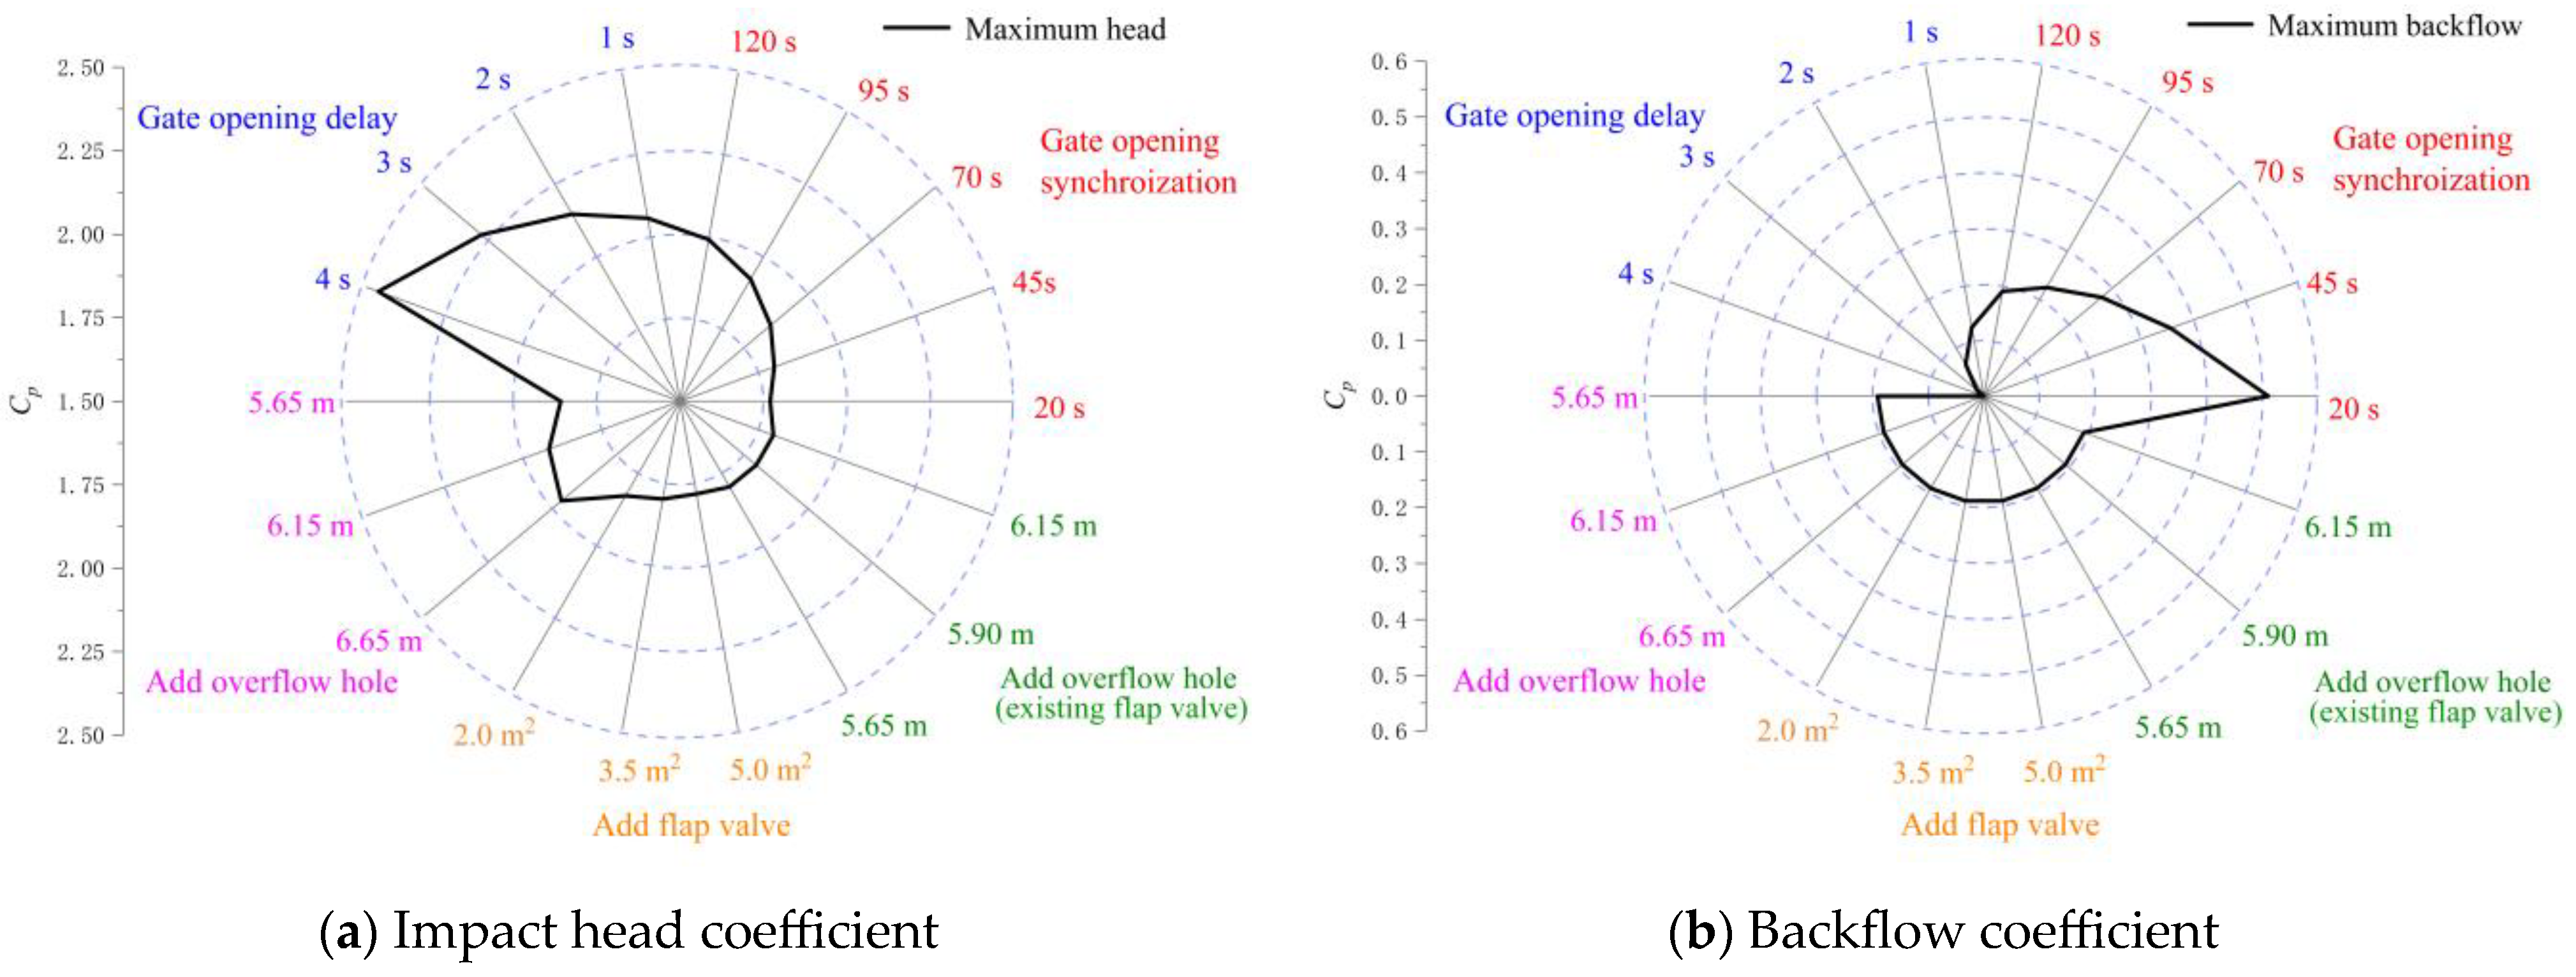
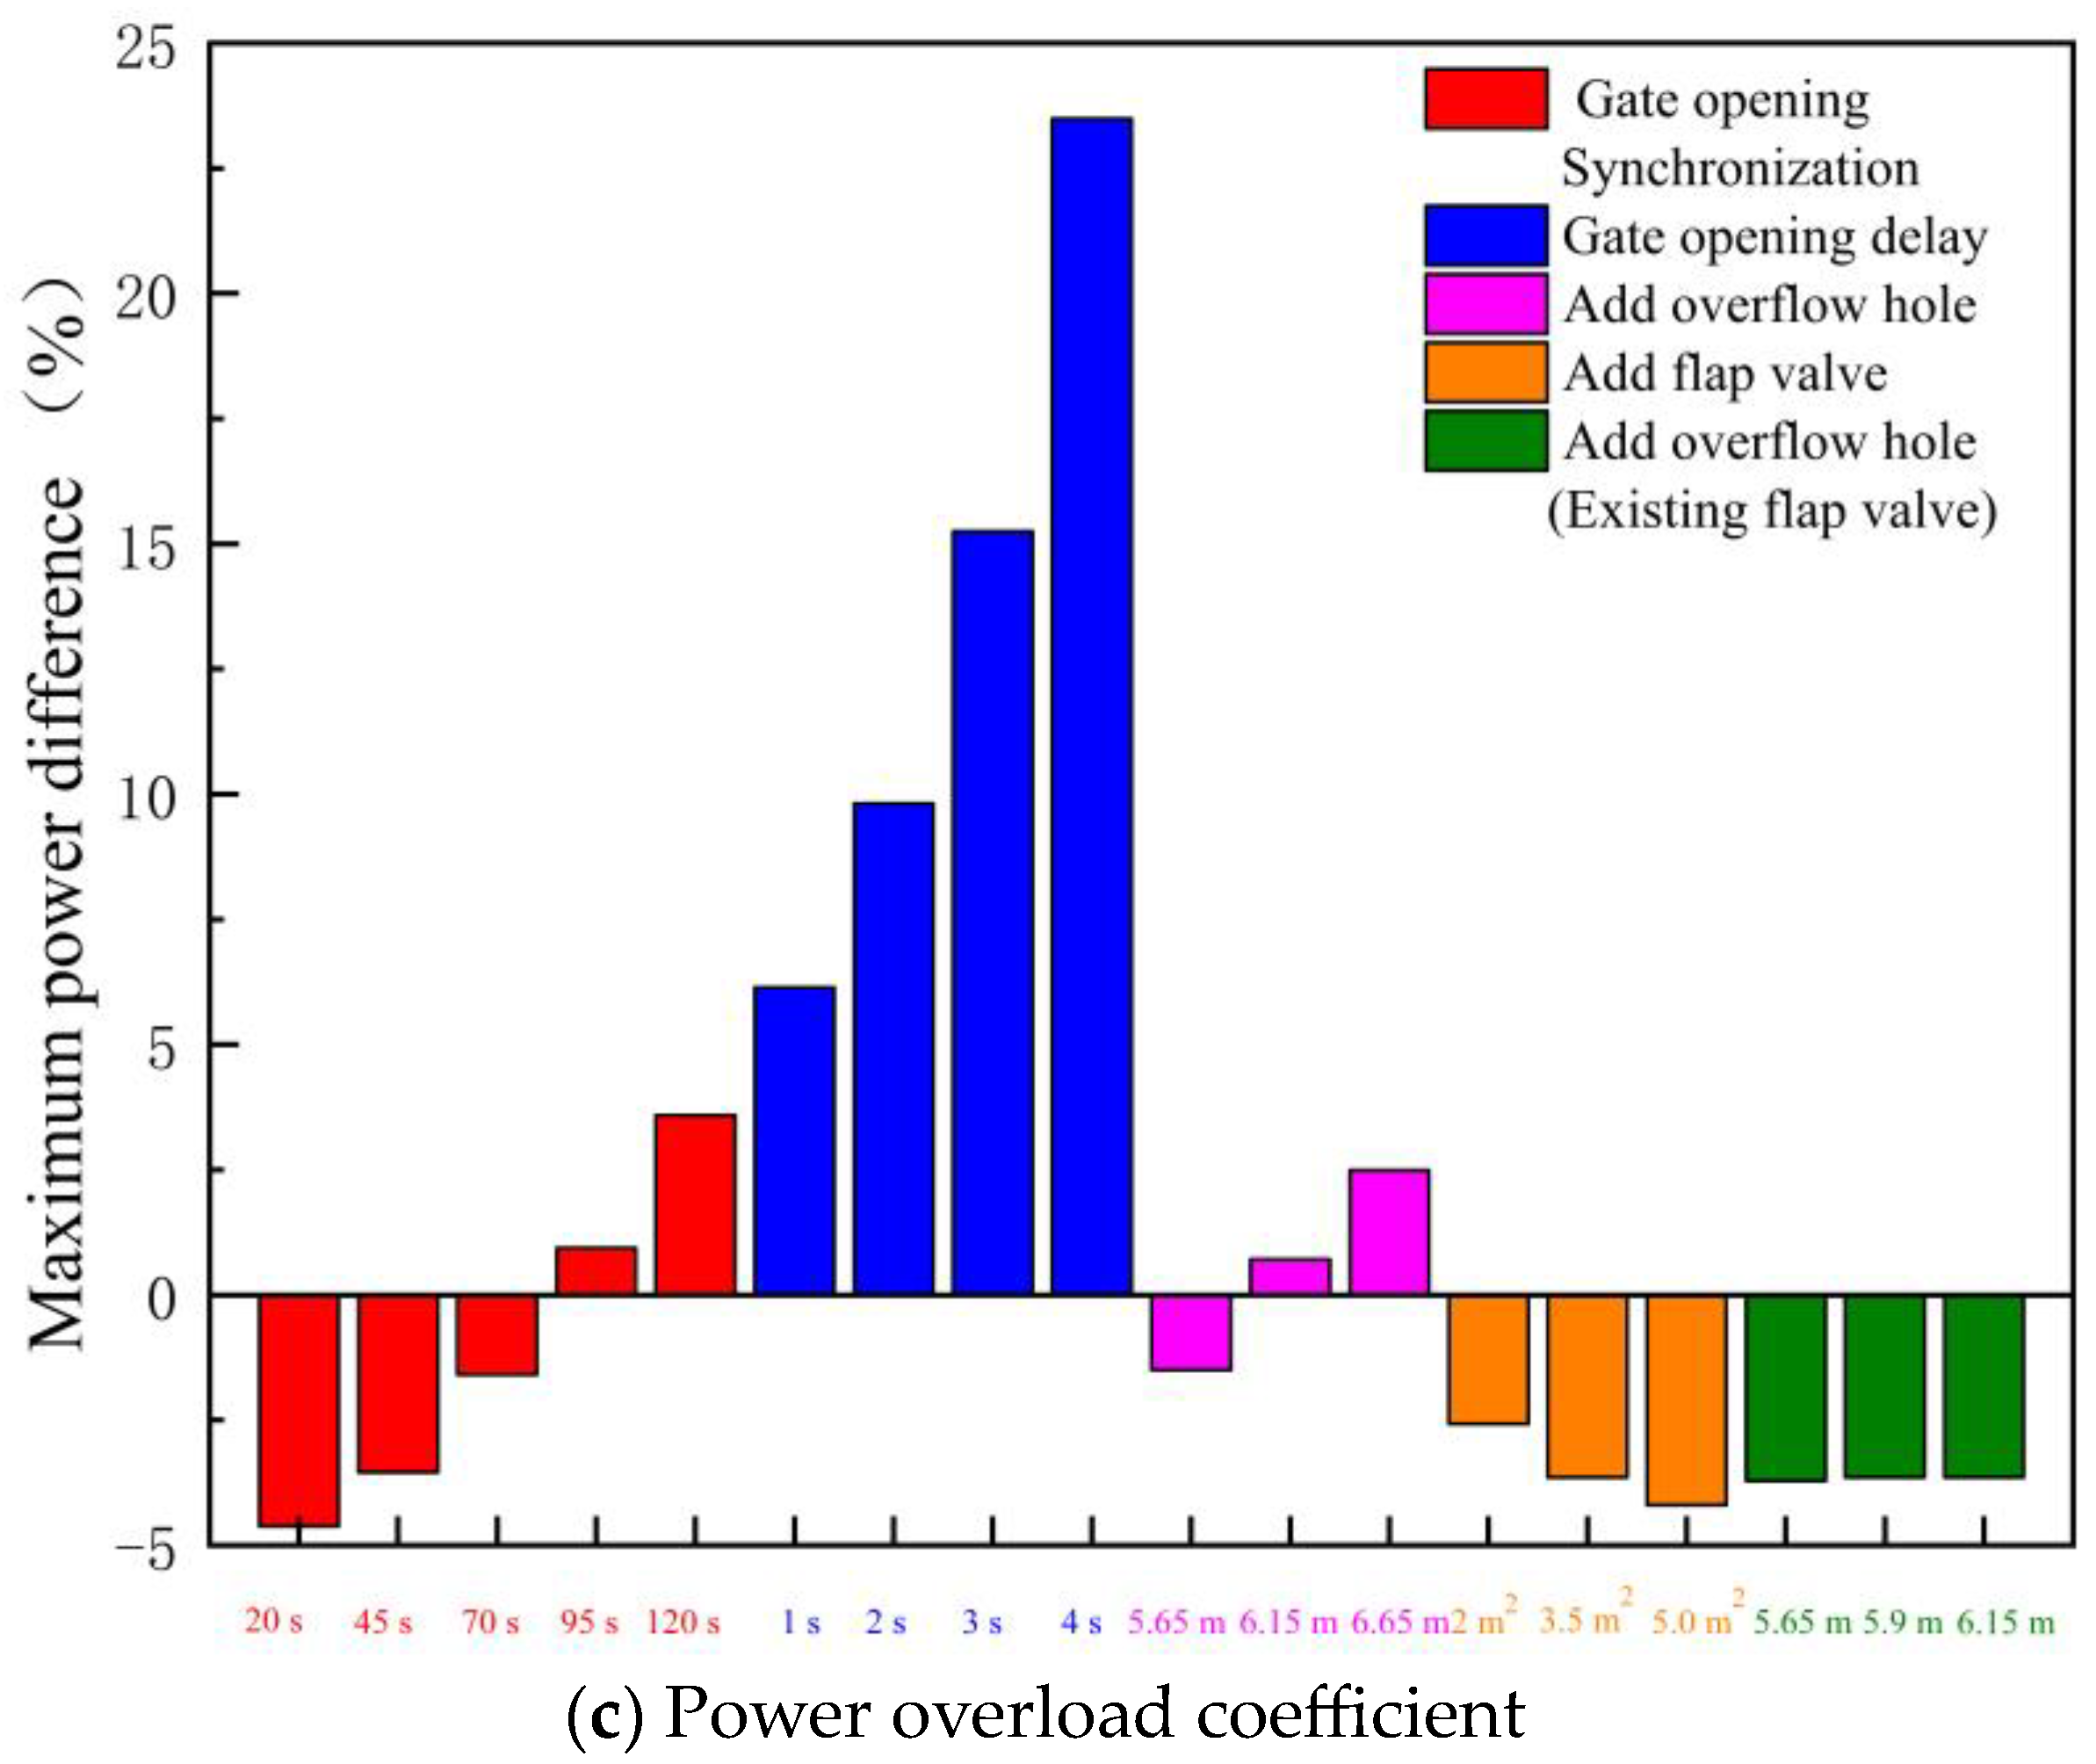
4.6. Comparison of the Influence of Different Safety Auxiliary Measures

In order to study the influence of different safety auxiliary measures on the start-up characteristics of the LAPS, this section extracts the key characteristic indexes in the start-up process of the LAPS and carries out the dimensionless treatment. The dimensionless coefficients include backflow coefficient KQ, impact head coefficient KH and power overload coefficient KP. The dimensionless method is as follows [44]:
K H = H i H d
K Q = Q b Q d × 10
K P = P i P u P u × 100
where Hi is the maximum instantaneous impact head in the start-up process; Hd is the design head of the LAPS; KH is the impact head coefficient; Qb is the maximum backflow during start-up; Qd is the design flow of the LAPS; KQ is the backflow coefficient; Pi is the maximum IIP in the start-up process; Pu is the upper limit of motor power; KP is the power overload coefficient.
Figure 26 shows the key characteristic indexes (dimensionless) during the start-up of the LAPS after taking different safety auxiliary measures. The following conclusions can be drawn from Figure 26. Firstly, when no other facilities are used, only the opening speed of the rapid-drop gate is adjusted, so it is difficult to take into account the backflow coefficient index and the impact head coefficient index at the same time. Once the setting of the rapid-drop gate opening law is unreasonable, it will often lead to a sharp increase in the backflow or a sharp increase in the instantaneous impact head. When the total opening time of the rapid-drop gate is 20 s, the backflow coefficient reaches 0.51, which will cause a certain impact and damage to the pump blade. Secondly, the delayed opening of the rapid-drop gate has a very great risk, although the backflow coefficient index has been optimized to a certain extent, the power overload coefficient is more than 5. When the rapid-drop gate opens with a delay of 4 s, the power overload coefficient reaches 23.49, indicating that the possibility of start-up failure of the LAPS increases sharply the longer the gate opening is delayed. Thirdly, the improvement effect of adding a flap valve or overflow hole on the quality of the start-up process is similar, but the indexes of the start-up process of the LAPS with the addition of a flap valve show it is better. When the safety auxiliary facilities of an additional flap valve on the rapid-drop gate are adopted, the backflow coefficient is within 0.2, the impact head coefficient is within 2, and the power overload coefficient is less than 0. Combining the three key characteristic indexes of backflow coefficient, impact head coefficient and power overload coefficient to evaluate them, the method of adding a flap valve on the rapid-drop gate can obtain a higher quality of the start-up process. Finally, on the basis of the existing flap valve, further adding overflow holes has little influence on improving the quality of the start-up process, and the three key characteristic indexes have little change. Only an overflow hole with a very low elevation can further slightly improve the start-up process quality of the LAPS.
In order to further comprehensively show the changes in the start-up characteristics of the LAPS before and after the adoption of safety ancillary measures, this paper selects the one with the highest quality of all the start-up transition process calculation schemes to display. Figure 27 shows variation law of the key characteristic parameters of the LAPS. In Section 4.1, Figure 11 shows the variation law of key characteristic parameters of the LAPS (TRRO = 120 s). Compared with Figure 11, the curve of the key characteristic parameters in Figure 27 is relatively smooth, the fluctuation of the parameters is relatively smooth at the initial stage of the LAPS start-up, the coverage of the backflow area is small and the IIP is within the allowable range. After the unit reaches the rated speed, the characteristics of the LAPS quickly transition to a stable operation state.

5. Conclusions

In this paper, considering the defects of theoretical derivation method and CFD method in obtaining a large number of different pump start-up schemes, a new simulation strategy is proposed. Based on the secondary development of Flowmaster, the start-up process of a LAPS with various safety auxiliary facilities such as a pat door and overflow hole is numerically simulated, and the start-up characteristics of a large axial flow pump station are comprehensively explored. This paper fills the gap in the research on the influence of safety auxiliary facilities on the LAPS start-up process, and can provide important reference value for LAPS systems to find a scientific and safe start-up control strategy. The main conclusions are as follows:
(1)
During the start-up transition process, if only the opening speed of the rapid-drop gate is adjusted without any safety auxiliary facilities, it will be difficult to give consideration to the index of backflow coefficient and the index of impact head coefficient. Once the gate opening speed is too fast, it will cause a sharp increase in backflow, while if the gate opening speed is too slow, it will cause a sharp increase in the instantaneous impact head and the instantaneous impact power.
(2)
It is a very dangerous start-up mode to delay the opening of the rapid-drop gate to reduce the maximum backflow value and the duration of backflow at the initial start-up of the pump system. When the opening of the rapid-drop gate lags behind the start of the motor, the instantaneous impact power of the unit will increase rapidly, and the possibility of start-up failure of the pump station will be greatly increased.
(3)
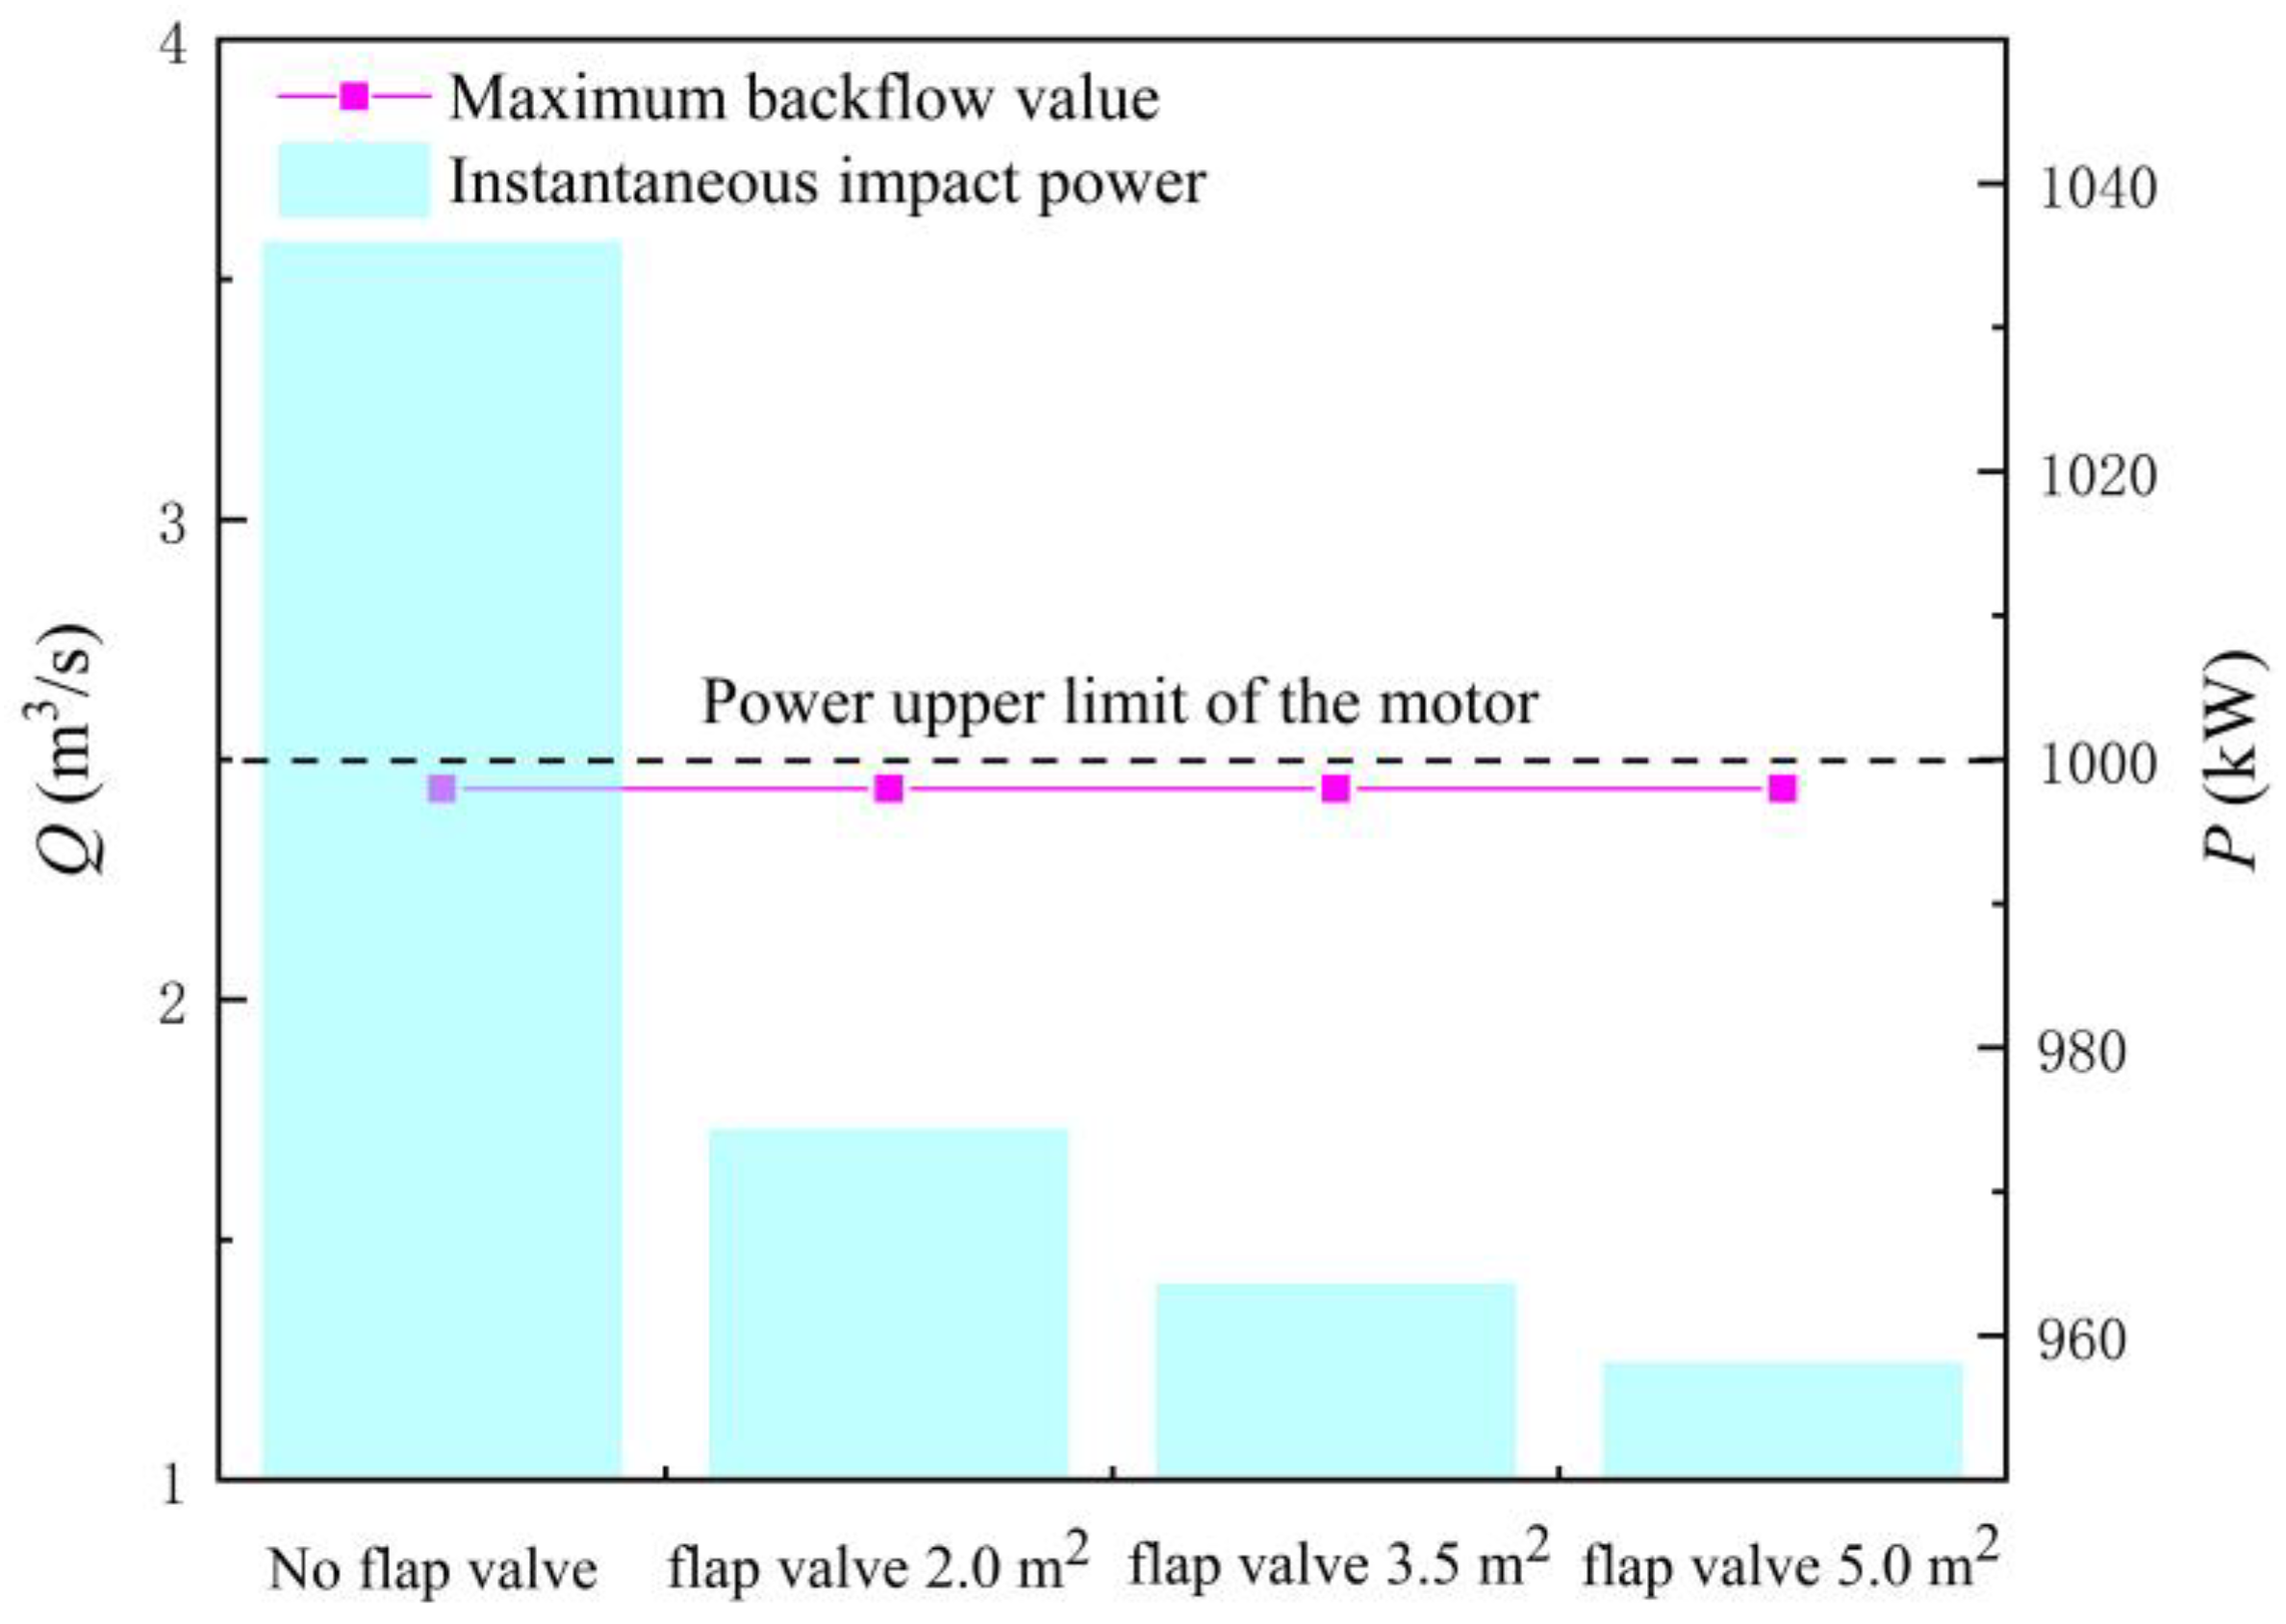
The method of adding the flap valve to the rapid-drop gate has no obvious benefit in shortening the backflow state at the initial stage of the pump start-up, but it will significantly weaken the instantaneous impact power of the unit and prevent overload of the unit. When the safety auxiliary facilities of an additional flap valve on the rapid-drop gate are adopted, the backflow coefficient is within 0.2, the impact head coefficient is within 2, and the power overload coefficient is less than 0. Synthesizing the three key characteristic indexes in the start-up process evaluation, the method of adding a flap valve on the rapid-drop gate can obtain a higher quality of the start-up transition process.
The influence of the overflow hole on the start-up process characteristics of the pump station is similar to that of the flap valve, but the effect of improving the start-up process quality of the pump station is not as good as that of the flap valve. Moreover, it should be pointed out that, on the basis of the existing flap valve, the further addition of an overflow hole has little effect on improving the quality of the start-up transition process, and the three key characteristic indexes show little change. In the case of the existing flap valve, the start-up transition process quality of the pump station can be further slightly improved only if an overflow hole with extremely low elevation is used. In this paper, a one-dimensional simulation of the start-up process of a large axial flow pump system equipped with safety auxiliary facilities is carried out. The main purpose of the research is to reveal the variation of key characteristic parameters of a LAPS equipped with different safety auxiliary facilities during the start-up process, and to evaluate the influence of different safety auxiliary facilities on the safety of LAPS during the start-up process. However, the three-dimensional internal flow field of the LAPS has not been studied in detail. In the future research, the three-dimensional numerical simulation of LAPS will be carried out based on CFD method to reveal the hydraulic transient flow characteristics during LAPS start-up.

Author Contributions

X.Z.: conceptualization, software, methodology, writing—original draft preparation, and supervision; Y.J.: model experiment, data curation, and visualization; F.T.: writing—reviewing, supervision and funding acquisition; X.S.: supervision and visualization; Y.L.: model experiment and visualization; F.Y.: data curation and visualization; L.S.: funding acquisition. All authors have read and agreed to the published version of the manuscript.

Funding

This research was supported by the National Natural Science Foundation of China (No. 52209116); the Scientific and Technological Research and Development Program of South-to-North Water Transfer in Jiangsu Province (No. JSNSBD202201); the Jiangsu Water Conservancy Science and Technology Project (No. 2021012).

Data Availability Statement

The data presented in this study are available on request from the corresponding author.

Conflicts of Interest

The authors declare no conflict of interest.

Nomenclature

gLocal acceleration of gravity (m/s2)
HHead (m)
MThe impeller torque (kN·m)
nRated speed (r/min)
Hthe maximum net head (m)
DImpeller diameter
IpThe inertia moment of the LAPS (kg·m2)
ImThe motor rotation inertia (m3/s)
ArThe area of the rapid-drop gate (m2)
tTime (s)
ρThe density of flow (kg/m3)
ωThe angular velocity of the impeller (rad/s)
ηEfficiency (%)
ηexpExperimental efficiency (%)
ηsimSimulated efficiency (%)
QbThe maximum backflow
QdDesigned flow
HexpExperimental head (m)
HsimSimulated head (m)
HiMaximum instantaneous impact head
HdThe design head of the pump system
KHThe impact head coefficient
KQThe backflow coefficient
KpThe power overload coefficient
PiThe maximum IIP
PuThe upper limit of motor power

Abbreviations

CFDComputational fluid dynamics
LAPSLarge axial flow pump station system
IIPInstantaneous impact power
TRROTime required for gate opening
TOODTime of gate opening delay
AOFArea of flap valve
EOOHElevation of overflow hole
MBFMaximum backflow flow

References

  1. Ge, X.F.; Zhang, J.; Zhang, J.; Liu, D.; Zheng, Y.; Chen, H.X. Review of Research on the Three-Dimensional Transition Process of Large-Scale Low-Lift Pump. Energies 2022, 15, 8338. [Google Scholar] [CrossRef]
  2. Xu, H.; Gong, Y.; Cao, C.J.; Chen, H.X.; Kan, K.; Feng, J.G. Research on the three-dimensional transition process of the full discharge system of the axial extension tubular pump station. J. Agric. Mach. 2021, 52, 143–151. [Google Scholar]
  3. Zhang, X.X.; Cheng, Y.G.; Yang, J.D.; Xia, L.S.; Lai, X. Simulation of the load rejection transient process of a francis turbine by using a 1-D-3-D coupling approach. J. Hydrodyn. 2014, 26, 715–724. [Google Scholar] [CrossRef]
  4. Thanapandi, P.; Prasad, R. Centrifugal pump transient characteristics and analysis using the method of characteristics. Int. J. Mech. Sci. 1995, 37, 77–89. [Google Scholar] [CrossRef]
  5. Zhang, J.P. The Study on Characteristics of Starting Transient Process of Shaft Tubular Pumping Station; Yangzhou University: Yangzhou, China, 2015. [Google Scholar]
  6. Fu, S.F.; Zheng, Y.; Kan, K.; Chen, H.X.; Han, X.X.; Liang, X.L.; Liu, H.W.; Tian, X.Q. Numerical simulation and experimental study of transient characteristics in an axial flow pump during start-up. Renew. Energy 2020, 146, 1879–1887. [Google Scholar] [CrossRef]
  7. Long, Y.; Lin, B.; Fang, J.; Zhu, R.S.; Fu, Q. Research on the Transient Hydraulic Characteristics of Multistage Centrifugal Pump During Start-Up Process. Front. Energy Res. 2020, 8, 76. [Google Scholar] [CrossRef]
  8. Li, T.X.; Li, Y.C.; He, Z.S.; Luo, W. Application of the Energy-saving Flap Valve in Pumping Station Rebuild. Fluid Mach 2008, 8, 48–49, 65. [Google Scholar]
  9. Liang, X.; Zhang, J.K.; Li, Z.H.; Xiao, B.C.; Chen, S. Optimizing protection scheme for accident shutdown of axial flow pumping station under super hump conditions. J. Drain. Irrig. Mach. Eng. 2020, 38, 1010–1015. [Google Scholar]
  10. Xu, Z.; Zheng, Y.; Kan, K.; Chen, H.X.; Lu, Y.; Dai, J. Accelerated starting transition process of rapid gate in large tubular pumping station. J. Drain. Irrig. Mach. Eng. 2020, 38, 1016–1022. [Google Scholar]
  11. Li, Q.; Ma, X.; Wu, P.; Yang, S.; Huang, B.; Wu, D.Z. Study on the Transient Characteristics of the Centrifugal Pump during the Startup Period with Assisted Valve. Processes 2020, 8, 1241. [Google Scholar] [CrossRef]
  12. Lu, W. Studies on the Mechanical Characteristics of Flap Valve Cutoff Device in Pumping Stations; Shanghai University: Shanghai, China, 2009. [Google Scholar]
  13. Wang, Z.X.; Du, Y.T. Opening Angle and Impact Force Analysis of Different Types Flap Valve in Pumping Stations. IOP Conf. Ser. Earth Environ. Sci. 2019, 371, 022067. [Google Scholar] [CrossRef] [Green Version]
  14. Tsukamoto, H.; Ohashi, H. Transient Characteristics of a Centrifugal Pump during Starting Period. J. Fluids Eng. 1982, 104, 6–13. [Google Scholar] [CrossRef]
  15. Li, Z.F.; Wu, P.; Wu, D.Z.; Wang, L.Q. Experimental and numerical study of transient flow in a centrifugal pump during startup. J. Mech. Sci. Technol. 2011, 25, 749–757. [Google Scholar] [CrossRef]
  16. Zhang, X.W.; Tang, F.P.; Liu, C.; Shi, L.J.; Liu, H.Y.; Sun, Z.Z.; Hu, W.Z. Numerical Simulation of Transient Characteristics of Start-Up Transition Process of Large Vertical Siphon Axial Flow Pump Station. Front. Energy Res. 2021, 9, 706975. [Google Scholar] [CrossRef]
  17. Wang, Y.; Xie, L.; Chen, J.; Liu, H.L.; Luo, K.K.; Zhang, Z.L.; Cao, M.H. Experimental study on transient startup characteristics of a super low specific speed centrifugal pump. J. Chem. Eng. Jpn. 2019, 52, 743–750. [Google Scholar] [CrossRef]
  18. Liu, Y.F.; Zhou, D.Q.; Zheng, Y.; Zhang, H.S.; Xu, J.Y. Numerical simulation of starting process of axial flow pump with quick-stop gate. South North Water Transf. Water Sci. Technol. 2017, 15, 167–172. [Google Scholar]
  19. Ge, Q.E.; Duan, X.H.; Xu, L.L.; Ma, B.; Chen, S.S.; Yan, D.F. Experimental Study of the Transition Course on the Starts of Synchronous Motor in South-North Water Diversion Project. Large Electric Machine and Hydraulic Turbine 2006, 5, 1–5. [Google Scholar]
  20. Sun, Y.M.; Yu, G.P.; Liu, C. Research on Closing Control of the Sluice Gate for Sudden Power Off of Large Pump. Adv. Sci. Lett. 2011, 4, 2316–2320. [Google Scholar] [CrossRef]
  21. Zhang, C.Y.; Wang, W.J.; Pei, J.; Yuan, S.Q. Numerical simulation of unsteady flow characteristics in a centrifugal pump during runaway process caused by power failure. J. Phys. Conf. Ser. 2022, 2217, 0212047. [Google Scholar] [CrossRef]
  22. Kan, K.; Zheng, Y.; Chen, H.X.; Zhou, D.Q.; Dai, J.; Binama, M.; Yu, A. Numerical simulation of transient flow in a shaft extension tubular pump unit during runaway process caused by power failure. Renew. Energy 2020, 154, 1153–1164. [Google Scholar] [CrossRef]
  23. Kan, K.; Chen, H.X.; Zheng, Y.; Zhou, D.Q.; Binama, M.; Dai, J. Transient Characteristics during Power-Off Process in a Shaft Extension Tubular Pump by Using a Suitable Numerical Model. Renew. Energy 2021, 164, 109–121. [Google Scholar] [CrossRef]
  24. Zhang, X.W.; Tang, F.P. Investigation on hydrodynamic characteristics of coastal axial flow pump system model under full working condition of forward rotation based on experiment and CFD method. Ocean Eng. 2022, 253, 0029–8018. [Google Scholar] [CrossRef]
  25. Feng, J.J.; Ge, Z.G.; Zhang, Y.; Zhu, G.; Wu, G.J.; Lu, J.L.; Luo, X.Q. Numerical investigation on characteristics of transient process in centrifugal pumps during power failure. Renew. Energy 2021, 170, 267–276. [Google Scholar] [CrossRef]
  26. Gou, D.M.; Guo, P.C.; Luo, X.Q.; Zhan, L.G.; Guo, Y.F. 3-D combined simulation of power-off runaway transient process of pumped storage power station under pump condition. Chin. J. Hydrodyn. 2018, 33, 28–39. [Google Scholar]
  27. Yang, Z.Y.; Liu, Z.R.; Cheng, Y.G.; Zhang, X.X.; Liu, K.; Xia, L.S. Differences of Flow Patterns and Pressure Pulsations in Four Prototype Pump-Turbines during Runaway Transient Processes. Energies 2020, 13, 5269. [Google Scholar] [CrossRef]
  28. Yang, Z.Y.; Zhang, X.X.; Liu, D.M.; Cheng, Y.G.; Zhao, M.D. CFD simulation of the pump trip runaway transient process of a pumped-storage power plant with head 700 m. IOP Conf. Ser. Earth Environ. Sci. 2021, 774, 012102. [Google Scholar] [CrossRef]
  29. Song, X.J.; Liu, C. Experimental study of the floor-attached vortices in pump sump using V3V. Renew. Energy 2021, 164, 0960–1481. [Google Scholar]
  30. Song, X.J.; Luo, Y.Y.; Wang, Z.W. Numerical prediction of the influence of free surface vortex air-entrainment on pump unit performance. Ocean Eng. 2022, 256, 111503. [Google Scholar] [CrossRef]
  31. Yang, F.; Li, Z.B.; Yuan, Y.; Lin, Z.K.; Zhou, G.X.; Ji, Q.W. Study on vortex flow and pressure fluctuation in dustpan-shaped conduit of a low head axial-flow pump as turbine. Renew. Energy 2022, 196, 856–869. [Google Scholar] [CrossRef]
  32. Rohani, M.; Afshar, M. Simulation of transient flow caused by pump failure: Point-Implicit Method of Characteristics. Ann. Nucl. Energy 2010, 37, 1742–1750. [Google Scholar] [CrossRef]
  33. Wang, F.J.; Bai, M.M.; Xiao R., F. Application of Flowmaster in the analysis of pump station transition process. J. Drain. Irrig. Mech. Eng. 2010, 28, 144–148. [Google Scholar]
  34. Hu, X.Y. Research on Hydraulic Transition Process in Pump Station System Based on Flowmaster; Xihua University: Chengdu, China, 2012. [Google Scholar]
  35. Geng, T.H. Numerical Simulation of Hydraulic Transient Process of Francis Turbine Generator Unit based on Flowmaster; Xihua University: Chengdu, China, 2020. [Google Scholar]
  36. Yang, F.; Li, Z.B.; Fu, J.G.; Lv, Y.T.; Ji, Q.W.; Jian, H.F. Numerical and experimental analysis of transient flow field and pressure pulsations of an axial-flow pump considering the pump-pipeline interaction. J. Mar. Sci. Eng. 2022, 10, 258. [Google Scholar] [CrossRef]
  37. He, Z.; Bao, H.; Gao, C.; Shu, L. Research of runaway transition process in the full flow system of tubular shaft-extension pump. Fluid Mach 2021, 49, 57–64. [Google Scholar]
  38. Yang, Z.Y.; Cheng, Y.G.; Xia, L.S.; Meng, W.W.; Liu, K.; Zhang, X.X. Evolutions of flow patterns and pressure fluctuations in a prototype pump-turbine during the runaway transient process after pump-trip. Renew. Energy 2020, 152, 1149–1159. [Google Scholar] [CrossRef]
  39. Wang, L.; Tang, F.P.; Chen, Y.; Liu, H.Y. Evolution Characteristics of Suction-Side-Perpendicular Cavitating Vortex in Axial Flow Pump under Low Flow Condition. J. Mar. Sci. Eng. 2021, 9, 1058. [Google Scholar] [CrossRef]
  40. Song, X.J.; Liu, C.; Wang, Z.W. Prediction on the pressure pulsation induced by the free surface vortex based on experimental investigation and Biot-Savart Law. Ocean Eng. 2022, 250, 0029–8018. [Google Scholar] [CrossRef]
  41. Yang, F.; Li, Z.B.; Hu, W.Z.; Liu, C.; Jiang, D.J.; Liu, D.S.; Nasr, A. Analysis of flow loss characteristics of slanted axial-flow pump device based on entropy production theory. R. Soc. Open Sci. 2022, 9, 211208. [Google Scholar] [CrossRef] [PubMed]
  42. Yang, Z.Y.; Cheng, Y.G.; Xia, L.S.; Meng, W.W.; Gao, L.W.; Dai, Y.X. Evolutions of guide vane moment of a pump-turbine during runaway transient process after pump trip. IOP Conf. Ser. Earth Environ. Sci. 2019, 240, 072033. [Google Scholar] [CrossRef]
  43. Liu, J.T.; Li, Z.; Wang, L.; Jiao, L. Numerical Simulation of the Transient Flow in a Radial Flow Pump during Stopping Period. J. Fluids Eng. 2011, 133, 111101. [Google Scholar] [CrossRef]
  44. Zhang, R.T.; Zhu, H.G.; Li C., X.; Yao, L.B. Shut-down Transient of Bulb Tubular Pumping Station with VFD. Trans. Chin. Soc. Agric. Mach. 2013, 44, 45–49. [Google Scholar]
Figure 1. Diagram and main parameters of the large axial flow pump system.
Machines 11 00182 g001
Figure 2. Grid diagram of each flow passage components.
Machines 11 00182 g002
Figure 3. Grid independence analysis of head and efficiency of the large axial flow pump system.
Machines 11 00182 g003
Figure 4. Flow chart of start-up process simulation strategy for the large axial flow pump system.
Machines 11 00182 g004
Figure 5. Schematic diagram of simulation model of the large axial flow pump system.
Machines 11 00182 g005
Figure 6. Schematic diagram of the high-precision hydraulic machinery test bench. 1. Intake tank. 2. Tested pump unit and drive motor. 3. Pressure outlet tank. 4. Bifurcation tank. 5. Condition regulating gate valve. 6. Voltage regulating rectifier. 7. Electromagnetic flowmeter. 8. System forward and reverse operation control gate valve. 9. Auxiliary pump unit.
Machines 11 00182 g006
Figure 7. Physical diagram of axial flow pump.
Machines 11 00182 g007
Figure 8. Model experiment of the large axial flow pump system.
Machines 11 00182 g008
Figure 9. Comparison between experimental results and simulation results.
Machines 11 00182 g009
Figure 10. Error analysis of numerical simulation.
Machines 11 00182 g010
Figure 11. Variation law of the key characteristic parameters of the large axial flow pump system (time required for gate opening is 120 s).
Machines 11 00182 g011
Figure 12. Variation law of flow rate and head with time under different times required for gate opening.
Machines 11 00182 g012
Figure 13. Maximum backflow flow and instantaneous impact power of the large axial flow pump system with different times required for gate opening.
Machines 11 00182 g013
Figure 14. Variation law of the flow rate and head of the large axial flow pump system with different times of gate opening delay.
Machines 11 00182 g014
Figure 15. Maximum backflow flow of the large axial flow pump system with different times of gate opening delay.
Machines 11 00182 g015
Figure 16. Instantaneous impact power of the large axial flow pump system with different times of gate opening delay.
Machines 11 00182 g016
Figure 17. Variation law of the flow rate and head of the large axial flow pump system with different areas of flap valve.
Machines 11 00182 g017
Figure 18. Flow rate at the flap valve.
Machines 11 00182 g018
Figure 19. Maximum backflow flow and instantaneous impact power of the large axial flow pump system with different areas of flap valve.
Machines 11 00182 g019
Figure 20. Variation law of the flow rate and head of the large axial flow pump system with different elevations of overflow hole.
Machines 11 00182 g020
Figure 21. Flow rate at the overflow hole.
Machines 11 00182 g021
Figure 22. Maximum backflow flow and instantaneous impact power of the large axial flow pump system with different elevations of overflow hole.
Machines 11 00182 g022
Figure 23. Variation law of the flow rate and head of the large axial flow pump system with different elevations of overflow hole (area of flap valve is 3.5 m2).
Machines 11 00182 g023
Figure 24. Flow rate at flap valve and overflow hole.
Machines 11 00182 g024aMachines 11 00182 g024b
Figure 25. Maximum backflow flow and instantaneous impact power of the large axial flow pump system with different elevation of overflow hole (area of flap valve is 3.5 m2).
Machines 11 00182 g025
Figure 26. Key characteristic indexes (dimensionless) in the start-up process of the large axial flow pump system.
Machines 11 00182 g026aMachines 11 00182 g026b
Figure 27. Variation law of the key characteristic parameters of the large axial flow pump system: time required for gate opening is 120 s, time of gate opening delay is 0 s, area of flap valve is 3.5 m2, elevation of overflow hole is 5.65 m).
Machines 11 00182 g027
Table 1. Number of grids and nodes of each flow passage component.
Flow Passage ComponentNumber of GridsNumber of Nodes
Inlet channel1,083,798191,421
Impeller1,296,2561,373,248
Guide vane1,438,2551,538,250
Outlet elbow432,53378,380
Outlet channel910,224158,193
Total5,161,0663,339,492
Table 2. Scheme and its specific hydraulic components description.
Start-Up Control SimulationSafety Auxiliary Facility ComponentsTime for Pump to Reach Rated SpeedTime
Required for Gate Opening
Relation between Motor Starting and Gate OpeningScheme Design
Influence of opening speed of rapid-drop gate (Section 4.1)Rapid-drop gate6 s SynchronizationTime required for gate opening
(TRRO)
20 s45 s70 s95 s120 s
Influence of delaying opening of rapid-drop gate (Section 4.2)Rapid-drop gate6 s120 sAsynchronizationTime of gate opening delay
(TOOD)
1 s2 s3 s4 s
Influence of adding the flap valve (Section 4.3)Rapid-drop gate and
flap valve
6 s120 sSynchronizationArea of flap valve
(AOF)
2.0 m23.5 m25.0 m2
Influence of adding the overflow hole (Section 4.4)Rapid-drop gate and
overflow hole
6 s120 sSynchronizationElevation of overflow hole
(EOOH)
5.65 m6.15 m6.65 m
Influence of adding both the flap valve and overflow hole (Section 4.5)Rapid-drop gate, flap valve and overflow hole 6 s120 sSynchronizationElevation of overflow hole
(AOF =3.5 m2)
5.65 m5.90 m6.15 m
Table 3. Hydraulic loss coefficient of the flap valve.
Flap valve opening angle α2030405060
Loss coefficients ζ6.343.22.82.5
Table 4. Parameters of main measuring instruments of the test bench.
Measuring ItemsInstrument NameInstrument TypesInstrument RangeCalibration Accuracy
HeadDifference pressure transmitterEJA 110A0~200 kPa±0.1%
FlowElectromagnetic flowmeterE-mag typeDN400 mm±0.20%
TorqueSpeed and torque sensorZJ200 N·m±0.15%
Disclaimer/Publisher’s Note: The statements, opinions and data contained in all publications are solely those of the individual author(s) and contributor(s) and not of MDPI and/or the editor(s). MDPI and/or the editor(s) disclaim responsibility for any injury to people or property resulting from any ideas, methods, instructions or products referred to in the content.

