
Railways Passengers Comfort Evaluation through Motion Parameters: A Systematic Review
by
 , , , and
Patricia Silva
1,2,*,
Diogo Ribeiro
3,
Joaquim Mendes
4,5,
Eurico Augusto Rodrigues Seabra
2 and
Octavian Postolache
6 1
CONSTRUCT—LESE, Faculty of Engineering, University of Porto, 4099-002 Porto, Portugal
2
Department of Mechanical Engineering, School of Engineering, University of Minho, 4710-057 Guimarães, Portugal
3
CONSTRUCT—LESE, School of Engineering, Polytechnic of Porto, 4249-015 Porto, Portugal
4
Faculty of Engineering, University of Porto, 4099-002 Porto, Portugal
5
Labiomep, INEGI, 4099-002 Porto, Portugal
6
Instituto de Telecomunicações, ISCTE-IUL Lisbon, 1649-026 Lisbon, Portugal
*
Author to whom correspondence should be addressed.
Machines 2023, 11(4), 465; https://doi.org/10.3390/machines11040465
Submission received: 9 March 2023
/
Revised: 29 March 2023
/
Accepted: 5 April 2023
/
Published: 8 April 2023
Abstract
:Railways are one of the most widely used mass transportation systems. Its superior transportation capacity, low environmental impact, high safety, and comfort have been leading to a continuous increase in passengers. To keep this trend going, it is crucial to improve the railways’ attractiveness and comfort levels. A rail journey’s comfort performance is rather complex, involving the analysis of multiple factors. Those raised by the vehicle motion and seat performance are the focus of vehicle designers’ concerns. Therefore, only a combination of static and dynamic comfort methodologies can accurately characterize passengers’ comfort. This work aimed to perform a systematic review concerning the comfort evaluation of train passengers. The bibliographic search yielded 62 studies on static and dynamic comfort evaluation methods. Results show a lack of experiments conducted on real rail environments, leading to weak conclusions regarding the real in-service conditions that train users face. Moreover, an investigation gap concerning the simultaneous application of both static and dynamic methodologies was observed. Therefore, more investigations are needed to evaluate and increase passengers’ comfort and promote rail usage as a daily transportation system.
1. Introduction
The increasing global population necessitates the need for mass transportation. Due to its high efficiency, superior transportation capacity, comfort, safety, and low environmental impact, rail transportation is the most widely used public transportation system. During the last decade, a continuous increase in passenger numbers was reported. Thus, to keep this trend going, improving the users’ satisfaction and delivering comfortable journeys is crucial. Those are defined based on user conditions, safety, and comfort [1,2]. Based on that assumption, rail design nowadays focuses on comfort and performance.
The comfort concept is not consensual, as multiple interpretations can be found in the literature. Perceived comfort is divided into two dimensions: comfort and discomfort. These are processed through different neural perspectives. Comfort is associated with feelings of well-being and relaxation, and the aesthetic impression of a product or environment influences it. This is a hard-to-measure subjective concept [3,4]. On the contrary, discomfort is related to pain, soreness, numbness, and stiffness resulting from the biomechanical load imposed on the musculoskeletal structure. Therefore, discomfort feelings are affected by the product’s physical constraints and are easier to quantify [3,5,6]. The most accepted model, used as the basis of the present work, is the theoretical sitting model of comfort and discomfort developed by De Looze et al. [7]. This model illustrates the relationship between comfort and discomfort and its relationship with the product. Potential influences are distinguished by three levels: the human, the product, and the environment [4,7,8]. The model is divided into two sides: the right side is associated with comfort, whereas the left side is linked to discomfort. The user’s emotions and expectations highly influence comfort. Discomfort levels are related to the interaction of the human’s physical capacities, such as weight, physiological processes, muscle activation, body temperature, intradiscal pressure, or nerve conduction. This way, comfort and discomfort are defined as a combination of phycological and physical factors. Additionally, the De Looze model concludes with the dominant effect of discomfort on comfort. Therefore, it is more reliable to assess perceived comfort based on discomfort measurements [4,7,8].
Passengers’ comfort is rather complex, involving multiple factors such as vibration, noise, temperature, visual stimuli, illumination, smell, humidity, and seat design. However, due to its high complexity and the significant number of tests required, it is impossible to consider all factors for the evaluation. Therefore, attention is focused on the parameters related to “motion.” Those, depending on the vehicle, should be evaluated based on both static and dynamic properties. The former concerns surface quality and the sitting impressions of the passenger when there is no vibration, and the latter relates to vibration characteristics and the user’s sitting impressions while being exposed to vibration [2,9].
Regarding seat cushion quality, interface pressure, density, hysteresis loss, and SAG factor behaviour are usually measured as static properties. As dynamic properties, vibration transmission should be assessed through ride comfort, seat effective amplitude transmissibility (SEAT), and seat transmissibility. Passengers spend most of their time seated, so the seat affects passenger comfort, among other interior facilities of the vehicle. Seats may present good dynamic behaviour but poor static performance. The ideal seat presents optimum dynamic properties (to minimise unwanted vibration) combined with the best static behaviour (to equally distribute pressure at the seat surface and, this way, reduce the interface pressure) [2,10].
The objective of this work was to assess the evaluation methodologies currently applied to evaluating railroad passengers’ comfort. A systematic review was performed, along with an evaluation of the currently applied techniques and the identification of research gaps.
2. Materials and Methods
This systematic review was conducted following the PRISMA (Preferred Reporting Items for Systematic Reviews and Meta-Analyses) guidelines [11]. Relevant studies concerning the evaluation of motion factors affecting passengers’ comfort were carefully selected and reviewed.
2.1. Information Sources
The bibliographic search was performed over the reference sources Scopus, ISI Web of Science, PubMed, and IEEE Xplore with the syntax (TITLE-ABS-KEY (dynamic AND seating AND comfort) OR TITLE-ABS-KEY (static AND seating AND comfort) OR TITLE-ABS-KEY (railways AND passenger AND comfort) OR TITLE-ABS-KEY (railways AND ride AND comfort AND analysis) OR TITLE-ABS-KEY (railways AND passenger AND objective AND comfort) OR TITLE-ABS-KEY (comfort AND evaluation AND train AND passenger) OR TITLE-ABS-KEY (sitting AND comfort AND factors)). The Google Scholar database was also searched with the same keyword combination to ensure a wide band with the largest possible number of articles. There was no time restriction, and publications from the first date they were available to February 2023 were included. A duplicate deletion was made after the bibliographic search.
2.2. Eligibility Criteria and Screening
After article selection, all titles and abstracts were scrutinized, and publications that did not refer to dynamic or static comfort evaluation methods were excluded. Five eligibility criteria were defined: (1) articles need to deal with static or dynamic comfort evaluation methods; (2) articles should report a comfort assessment; (3) articles should be written in English; (4) review articles were excluded; and (5) articles without full text available online and that are still unavailable upon contact with authors are omitted. If the content of the papers was unclear, we additionally reviewed the introduction and methodology sections.
3. Results
A total of 1823 articles were retrieved from the literature search; 1799 from the four databases; and 16 papers and 8 standards were identified through other sources. The bibliographic research yielded 1069 records after the removal of duplicates. The third criterion excluded 300 publications, whereas 49 articles were excluded due to criterion 4, and 43 papers were unavailable online (criterion 5). Furthermore, out of the 677 remaining publications, 314 articles were excluded during the title and abstract screening stage because they did not mention using comfort analysis methods. Finally, 301 papers were excluded once no comfort assessment was reported. The remaining 62 publications were divided according to the comfort-type evaluation method (static, dynamic, or both). Static comfort was evaluated in 12 studies, whereas the dynamic evaluation produced 46 articles divided into ride comfort, seat effective amplitude transmissibility (SEAT), and transmissibility analysis, and 4 papers assessed both static and dynamic comfort. A flow diagram depicting the steps of this systematic review is shown in Figure 1 [11].
The information retrieved from the selected studies is summarised in Appendix A.
3.1. Dynamic Comfort Evaluation
Dynamic comfort is evaluated based on the ride comfort analysis, SEAT, and transmissibility. Therefore, the dynamic comfort evaluation section is divided into those three sub-sections.
3.1.1. Ride Comfort Analysis
Vibration, derived from wheel–track interaction and rail motion, generates a more complex operating environment on trains than on other transportation systems. That is the critical factor affecting passengers’ comfort and health, limiting their performance. Therefore, evaluating the vibration transmission in a rail environment is fundamental to quantifying passengers’ comfort levels and assessing the harmful consequences of vibration [1,2,12,13].
Ride comfort, or long-term comfort, defines human tolerance to vibration exposure over time. Several countries use their national standards to evaluate ride comfort for example, the United Kingdom uses BS ISO 2631 [14] or BS EN 12299 [15], in Japan, the Japanese National Railway Riding Comfort Standard [16], in the USA, ANSI/ASCE 21-13 [17], and in China, GB/T 5599-2019 [18] is the reference standard. The application of different standards worldwide leads to multiple ride comfort interpretations and evaluations, which explains the difficulties in having a comprehensive evaluation methodology. Nevertheless, presently, three main methods are worldwide accepted and widely applied. Those are the base of the previously mentioned standards and are fully dedicated to evaluating passengers’ comfort based on vibration analysis. ISO 2631, EN 12299, and Sperling ride index [1]. Moreover, the impact of exposure time and car body vibration on ride comfort depends on the frequency bands, which are sensitive to human perception. The human body has its own natural vibration modes, which affect the human vibration feeling. When this mode matches an externally induced vibration, resonance may occur, which, if absorbed, may result in physical stress on tissues and organs [1,2,12,13,19,20,21]. Furthermore, depending on the human tissue’s characteristics, vibrations with similar intensities but different spectral contents will induce different dynamic responses in the human body. Thus, acceleration needs to be weighted based on human body sensitivity to obtain an index that can reflect the vibrational feeling. Despite existing different methodologies, the three methods mentioned above all use frequency weighting curves. Frequencies capable of producing the highest effect are assigned the highest weight, while other frequencies are attenuated based on their relative importance [2,22,23,24].
Long-term comfort evaluation methodologies are based on acceleration measurements. Nevertheless, it should be highlighted that although the methods share common assumptions and objectives, they employ distinct calculation techniques to assess comfort. Therefore, one method cannot be converted into another only by analysing its results. Instead, a complete analysis and correlation among indexes need to be performed. This way, it is crucial to properly understand the relationship between these indices and the advantages and limitations of the different methods [1,2].
The International Organization for Standardization (ISO) introduced ISO 2631 to define procedures for assessing human exposure to whole-body vibration (WBV). This standard quantifies WBV regarding comfort, human health, and motion sickness. Comfort and health are strongly linked in many ways; therefore, frequencies between 0.5–80 Hz are defined as interesting ones. Once at this interval, vibration affects the body as a whole, which can lead to discomfort and fatigue. Acceleration measurements should occur on the vibration transmission interfaces: floor, seat surface, and seatback. The root-mean-square (rms) acceleration is calculated for each axis, and the corresponding weighting curve is applied [2,19,20,21,24]. The weighting process is calculated following Equation (1)
where Wi represents the weighting frequencies and ai the rms accelerations, the application of weighting curves depends on the measurement location and purpose. The total vibration is calculated according to Equation (2):
where are the rms accelerations for each axis, and represents the multiplying factor dependent on the measuring position, as presented in Table 1 regarding the comfort approach.
Finally, based on , the discomfort is assessed on a defined scale (see Table 2), where accelerations higher than 0.315 m/s2 are ranked as uncomfortable.
Large fluctuations in acceleration and frequency levels may arise throughout a train ride due to the track section’s condition, rail irregularities, braking, or speed restrictions. ISO 2631 is suitable for evaluating WBV when minor frequency-level variations occur. To overcome the major standard limitation, the vibration dose value (VDV) was introduced. This method makes use of the fourth power of acceleration instead of the second power; thus, it emphasises acceleration peaks [1,2,24]. The VDV is calculated as follows in Equation (3):
The statistical analysis introduced by the EN 12299 standard was developed based on the rms. EN 12299 standard defines ride comfort based on two methods: standard and complete. The former considers only floor vibration (three directions). In contrast, the latter uses both floor (vertical acceleration) and seat locations (vertical and lateral at the seat surface and longitudinal at the backrest). The standard method can be classified as a simplification of the complete method [25]. Moreover, while this standard presents several methods to calculate different passenger comfort indices, the mean comfort index () is commonly used.
quantifies the passenger mean comfort during a continuous 5 min run. This way, the measurement duration shall be a multiple of five, and a minimum of four travelled zones at constant speed must be accomplished to apply the method [1,26,27]. In contrast to the ISO 2631 method, weighting curves are applied initially. Then the rms acceleration over 5 s is calculated for each direction (longitudinal, lateral, and vertical) throughout the tested track. Finally, the 95th percentile (i.e., the 4th highest value) is determined for periods of 5 min, allowing the achievement of the index for each axis [1,26]. The partial is calculated as follows:
where, represents the 95th percentile of the weighted accelerations in the three directions, x, y, and z. By combining the acceleration in the three directions, a global comfort index is obtained, as follows in Equation (7):
The evaluation of is defined by an established scale, Table 3, which considers values between one and five. Values under one are considered a “very comfortable ride,” and for results above five, the journey is ranked as a “very uncomfortable ride” [27].
The main advantage of this method is that it avoids sensitivity to artifactual extremes. On the other hand, using the 95th percentile may lead to data exclusion (loss of information) and some doubtful analysis [1]. Kufver et al. [27] considered three different hypothetical 5 min vibration patterns. Contrary to expectations, the three patterns were found to be equally comfortable. Moreover, the lack of possibility to correspond the track irregularity’s location with the values (the highest values can occur during three different 5 s time intervals), represents another significant limitation [27]. Finally, the test protocol specifies that the test should be conducted in four blocks of 5 min each while maintaining a constant speed. These conditions are difficult to achieve during passenger service and do not reflect the natural in-service circumstances [25,27].
Sperling proposed an alternative ride comfort evaluation method that is fundamentally distinct from the methods based on rms analysis. The Sperling’s ride index () is evaluated individually for longitudinal, lateral, and vertical directions. Moreover, is calculated for defined time intervals or track sections [1,22] according to the following Equation (8):
where corresponds to the double-sided square acceleration [(cm/s2)2] and represents the frequency weighting curve. Similar to the previous methods, passenger comfort is assessed using a scale provided in Table 4, where values below 3 indicate no discomfort and values above 3.5 indicate extreme discomfort [2].
The fact that Sperling’s method is evaluated based on a fixed number makes it the most suitable for comparing different conditions or trains. Several authors concur with this statement and emphasise that, when compared to the ISO 2631 methodology, Sperling’s method is easier to implement and comprehend. Nevertheless, it should be noted that the ISO methodology is considerably superior in terms of accuracy and the quality of results obtained. Additionally, this method assesses vibration individually for all directions and is generally employed to evaluate the carriage’s vibration level instead of the passenger’s comfort. The main limitation of Sperling’s method is that it does not account for the influence of vibration in different frequency bands and directions on sitting comfort [22,23,28,29].
Several authors worldwide have utilized the three ride comfort analysis methodologies. Liu et al. [25] applied ISO 2631 to investigate the effect of train speed and track geometry on ride comfort in high-speed trains (speeds up to 400 km/h). Initially, the authors conducted actual measurements on a high-speed train traveling at a constant speed of approximately 210 km/h, focusing on the floor, seat surface, and backrest. The data showed a total acceleration of 0.358 m/s2, which means that the ride was a “little uncomfortable”. Then, using the three-dimensional multi-body vehicle model developed by Wickens and Huang, Liu et al. expanded its conclusion for speeds up to 400 km/h. The authors stated that the track’s vertical irregularities are the predominant source of vibration discomfort, even though the lateral irregularities also develop to be essential as speed increases. Moreover, it was concluded that as speed increased from 200 to 300 km/h, the total acceleration increased by a factor of 2. That factor rises to 3.5 when the speed rises from 200 km/h up to 400 km/h [25]. Similar conclusions were drawn by Peng et al. [23] when studying the ride comfort on high-speed (300 km/h) railways connecting Shanghai and Kunming in China. The authors applied three-axial accelerometers to the seat surface and seatback. Maximum total accelerations of 0.12 m/s2 were obtained. Results demonstrated higher discomfort provoked by the vertical acceleration on both the seat surface and seatback. Therefore, vertical vibration had the most significant impact among the three directions (vertical, lateral, and longitudinal). Furthermore, Peng et al. demonstrated that the ride comfort of passengers is significantly affected by tunnels and the train’s speed [23]. Johannin et al. [30] reached the same conclusions as Liu et al. and Peng et al. regarding the evaluation of whole-body vibration (WBV) exposure of locomotive engineers under normal operating conditions. By placing three-axial accelerometers at both floor and seat surfaces, Johannin et al. [30] found higher weighted accelerations on the vertical axis, providing further evidence of the significant impact of this direction on ride comfort.
Cheng and Hsu [31] numerically evaluated the effect of the vehicle speed and tilting angles based on a tilting railway vehicle modelled by a 27 degree of freedom (DOF) car system. Regarding the titling vehicle, as the speed rises, the ride comfort rises as well. On the contrary, the non-tilting train ride comfort initially rises, decreasing subsequently when vehicle speed increases. Concerning the tilting angles, higher discomfort was found for higher angles. Ride comfort also appears to be sensitive to rail irregularities, as it increases when those are introduced [31]. To determine the vibration limit levels that affect sedentary activities, Khan and Sundstrom [22] instrumented the 2nd class seats of three different inter-regional Swedish trains, particularly the IR-train, Y2-train, and X50-train. The authors conducted a survey questionnaire and calculated both, and . While results noted “not uncomfortable” rides, the same measurements evaluated with ranked the journeys as “more pronounced but not unpleasant.” The results highlighted the differences between the applications of both standards. Regarding the vibration effect on sedentary activities, even with the low levels of vibration demonstrated by the ride comfort methodologies, 47% of the passengers described shocks and vibration as their leading causes of disturbance. Moreover, 60% of passengers reported moderate difficulties in performing a short writing test, and 12% of passengers noticed great difficulty in performing that test. The results demonstrate that even low vibration levels can lead to significant discomfort and limitations for rail passengers [22].
Jiang et al. [1] attempted to establish a relationship between and indices. For that purpose, the authors installed three-axial accelerometers on the floors of Australian N-series passenger carriages. As in the previously mentioned studies, both methods agreed on the vertical direction vibration effect on passengers’ comfort caused by track irregularities. However, the vibration ranking did not agree, as the vibration evaluated based on revealed higher discomfort levels than those of [1]. Dimitriu and Leu [32] perform the same comparison as Jiang et al. [1], but on a mechanical model travelling on a track with vertical irregularities. The vehicle consisted of a rigid-flexible coupled model, including an elastic beam for the carbody and six rigid bodies for bogies and axles. Initially, the authors observed that ride comfort indices increased in a non-uniform manner when speed increased. The non-uniform growth is justified by the geometric filtering effect, which is a critical feature regarding the vertical behaviour of railway vehicles. Then, the critical comfort points were identified. Indeed, at high speed (250 km/h), both bogies and the carbody centre are comparable when applying the EN 12299 standard, demonstrating results of 1.91 at the carbody centre, 1.82 above bogie 1 (front), and 1.99 above bogie 2 (rear). As in the other mentioned studies, Sperling’s method results are slightly higher than those of Mean Comfort, presenting 2.0 at the carbody centre, 2.7 above bogie 1 and 3.1 above bogie 2 [32]. Munawir et al. [33] also developed a study to compare Sperling’s method and the EN 12299 ride comfort indices on the Ampang Line route in Malaysia. Similar evaluations were found for both EN 12299 and Sperling’s method. Most of the time, the journey was considered comfortable. The highest discomfort levels were 3.34 for and 2.63 for , respectively [33]. Dimitriu and Stanica [34] conducted a numerical simulation to investigate the comparison between Sperling’s method and Mean Comfort, and to predict the effects of train suspension and speed on the ride comfort index. The vehicle model consisted of a rigid-flexible coupled model (Figure 2). The carbody was represented by an equivalent Euler-Bernoulli beam, and the bogies and wheelsets were modelled using rigid bodies. Utilizing a speed interval of 0–240 km/h, the authors found a relationship between increasing speed and low comfort levels, exposing those lower levels of comfort when speed increases. Additionally, when analysing the three reference points (one at the carbody centre and two above each bogie) for speed until 80 km/h, the three points demonstrated similar comfort levels on both methods. As speed increases above this threshold, the discomfort levels are higher at the bogies (1.72 above bogie 1 and 1.86 above bogie 2 for 240 km/h) than at the carbody centre (1.68 at 240 km/h). Under the same running conditions, higher were noticed, as the carbody centre demonstrated 1.9 discomfort, and3.0, and 2.7 regarding bogies 1 and 2 respectively. Therefore, significant differences between both ride comfort assessment methods were reported, with the producing a weaker ride comfort than the . For the suspension effect, employing values of damping ratio within the range of 0.10 to 0.40, it was found that lower levels of damping will result in a lower ride comfort index, corresponding to higher comfort levels [34].
Kim et al. [2] tried to compare ISO 2631, EN 12299, and Sperling’s method comfort levels. To achieve this goal, the authors recorded acceleration measurements on Korean high-speed trains, which were used as vibration models of railway vehicles. Based on those models, equations of fitted curves between two ride comfort indices were obtained, namely , and . However, the authors did not report values of ride comfort indices [2].
Although all three ride comfort analysis methodologies present some advantages and limitations, the ISO 2631 standard seems to be the most widely employed one. The methods share the application of frequency-dependent filters and acceleration records at the passenger–seat car body interfaces. That approach involves installing a set of dedicated accelerometers in multiple locations, which may be challenging. Indeed, the passengers’ involuntary movements may modify the accelerometers’ positioning, compromising the measurements’ quality. Nevertheless, when performed adequately, it constitutes the more adequate one to evaluate passenger comfort because it considers a more realistic model of the seat structure dynamics [35,36,37].
3.1.2. Seat Effective Amplitude Transmissibility (SEAT)
On a rail journey, passengers spend most of their time seated. Thus, the vibration felt by users depends on the seat’s dynamic behaviour, namely its vibration isolation performance. Seats with poor dynamic behaviour will lead to unpleasant ride comfort [38]. SEAT value is a complementary method used to estimate dynamic seat comfort. This indicator of seat isolation efficiency reflects the extent to which a seat amplifies or attenuates vibration transmission [39]. The extent to which a seat can provide vibration attenuation relies on three factors: the spectrum of vibration (characterized by the vehicle motion), how the seat modifies the vibration spectrum (seat vibration transmissibility), and the sensitivity of the human body to the vibration range causing discomfort. This way, SEAT reports how those three parameters fluctuate with the frequency and vibration direction to estimate the seat’s vibration isolation [38,40,41].
SEAT compares the vibration discomfort when sitting on a rigid seat compared to discomfort on a non-rigid seat [41]. Thus, SEAT is specified as the ratio between the VDV measured on the seat and the VDV assessed on rigid support beneath the seat surface, according to Equation (9):
where represents the vibration dose value measured at the seat, and means those vibration dose values obtained at the floor. Depending on vibration characteristics, it is possible to calculate SEAT by either VDV or weighted rms acceleration . The vibration Crest Factor (CF) determines how impulsive a measure is by calculating the ratio of the peak weighted acceleration to its rms value , as in Equation (10):
Data with crest factors under nine (low crest factors) can be evaluated with , while data with higher crest factors must be evaluated based on VDV. Nevertheless, SEAT evaluation is better performed using VDV once this highlights the vibration effect [42].
A SEAT value greater than 100% implies that the seat magnifies vibration transmission. This means that the discomfort the user feels on the seat is higher than that of a rigid seat. On the other side, SEAT values lower than 100% indicate vibration mitigation by the seat, and therefore, the seat provides proper vibration attenuation and increases passengers’ comfort. The seat does not influence vibration transmission if a SEAT result equals 100%. Due to the foam cushion’s inability to absorb low-frequency vibrations, which are typically dominant in the vertical directions of railways, the vertical SEAT value of those vehicle seats is generally higher than 100% [38].
Seats are designed to have the lowest SEAT value, yet this must fit other constraints. Reducing the SEAT value may lead to a too-soft or too-hard seat, resulting in poor static comfort for the passengers [38]. Therefore, the optimum SEAT value will not eliminate the vibration transmission to the user but will minimise vibration exposure [38,40].
SEAT values can be achieved through direct acceleration measurements on rail seats and floors, laboratory experiments that mimic the railway environment, or even by estimating them using vibration records and transmissibility functions of the seat/user combination [39,42].
Multiple authors applied SEAT to measure or predict dynamic seat behaviour. Gong and Griffin [38] used SEAT to understand vibration transmission through railroad passenger seats, specifically in each direction. Based on a laboratory experiment, a double train seat unit—similar to subway seats—was fixed to a six-axis motion simulator and instrumented with two three-axial accelerometers at both the seat surface and seatback. Three types of stimuli were applied: simulated train vibrations, three-axial random vibrations, and single random vibrations. The authors calculated, measured, and predicted SEAT values for each direction (longitudinal, lateral, and fore-and-aft). Results were similar for the three axes when applying three-axial and single-axis random vibration. For the same stimulus, the SEAT at the backrest presented 10% higher SEAT values for the three-axis vibration in the fore-and-aft direction than for the single-axis vibration. The values obtained using the simulated train vibration were higher than those obtained using the other two stimuli on both seat surface and seatback conditions. The authors concluded that a real vibration should be applied when studying the SEAT. Otherwise, the conclusions are invalid for the conditions that passengers and seats face in service [38].
Patelli and Griffin [41] conducted a study to realise the transmission of vertical shocks across a seat cushion. To do it, a rigid seat (weighing approximately 1000 kg) was attached to an electrohydraulic vibrator. The subjects were seated in three conditions: a rigid seat, 40 mm seat foam, and 80 mm seat foam. The stimuli consisted of 13 different vertical mechanical shocks with frequencies comprehended between 1–16 Hz. The SEAT results demonstrated discomfort differences when sitting on the rigid seat and the foam cushions. Both foams increased discomfort at frequencies between 1–4 Hz and decreased discomfort caused by shocks within the 8–16 Hz range. The 80 mm foam originated greater discomfort, i.e., higher foam thickness increased user vibration discomfort [41]. Van Niekerk et al. [42] conducted a laboratory experiment to investigate using SEAT values to predict dynamic comfort and the correlation between subjective and objective data. Sixteen seats were fixed to a six-DOF hydraulic actuator, which vertically excited the seats. The seats were instrumented with two three-axial accelerometers placed at the seat surface and backrest. Besides measuring data objectively, six subjects also ranked the discomfort based on the Just Noticeable Difference (JND) scale. Seat surface results indicated a good correlation between SEAT values and dynamic vertical comfort. The correlation between SEAT’s objective and subjective results revealed promising results, as the preferences of the six subjects were similar to the objective data measurements. This way, the authors assumed that it is feasible to set levels for vertical vibration transmission utilizing SEAT values [42]. In a complementary study with the same objective as the previous one but on the seatback, Westhuizen and Van Niekerk [39] implemented the same methodology and used the same seats and subjects. However, the authors failed to identify the seatback influence on dynamic seat comfort, as no correlation was found between subjective and objective data results [39].
3.1.3. Transmissibility
Seat dynamics is mostly quantified in terms of transmissibility, which verifies seat efficiency in handling vibration discomfort. The seat and human body constitute a coupled complex dynamic system. This way, train seats are fundamental to reducing vibration transmission from the carbody to the passenger [20,41,43]. A substantial difference may be noted when comparing the transmissibility of subjects with identical characteristics, namely identical mass. Seat transmissibility can be highly influenced by the biodynamics of the human body and its noticeable non-linearity [44]. The human body has its own natural resonance frequencies that, when matched, can result in physiological responses. The frequency range between 4 and 8 Hz conducts resonance in the abdominal region; those like the head and neck muscles are affected by a superior frequency range within 20–30 Hz. Finally, in the frequency interval comprehended between 30 and 80 Hz, the ocular system perceives resonance [21,45,46,47].
The biodynamic response of the human body is cross-axis-coupled, i.e., inducing vibration in one axis may lead to a response in another axis. Westhuizen and Van Niekerk [39] demonstrated the cross-axis characteristic of transmissibility by reporting significant body movements in the fore-and-aft direction at the seatback when only vertical excitation was induced at the seat base. This way, the cross-axis-coupled characteristic of seat transmissibility was proven.
Moreover, various authors assessed the influence of subjects’ physical characteristics, such as weight, on the resonance frequency and seat transmissibility. Several studies conducted employing subjects with varying mass ranges reported unaffected results. Once the foam’s behaviour justifies the absence of the subject’s weight effect on seat transmissibility, raising the loading imposed by the subject’s weight tends to raise the foam’s dynamic stiffness. Therefore, inter-subject variability does not affect vibration transmissibility [48,49,50,51,52].
Transmissibility varies in direction, specifically in the vertical, fore-and-aft, and lateral directions, and location, for example, on the seat surface and seatback. Multiple laboratory experiments have exhibited a vertical transmissibility peak at around 4–6 Hz when sitting upright with seatback support [38,40,48,52]. The seat surface generally presents lateral and longitudinal transmissibility around 25 Hz. Those values are reported for the lateral and vertical transmissibility at the seatback, whereas its longitudinal vibration transmissibility reports frequencies around 4–6 Hz [38]. However, these experiments implement transmissibility tests in a train seat simplification constituted by a single rigid seat frame with different characteristics from those of a traditional train seat. Figure 3 shows that the seat model used in those experiments has frame dimensions and support points distinct from the current train seat designs. Additionally, the foam was freely placed on top of the seat surface without any restricting cover [38,40,48,52]. The foam constraint conditions are fundamental to adequately evaluating the influence of the foam thickness variation on the seat transmissibility, especially on the evaluation of its dynamic stiffness [40].
Based on a simplified experimental setup, Ribeiro et al. [53] instrumented a 2nd class Alfa Pendular seat to experimentally and numerically, investigate its transmissibility in a rail environment. A transmissibility resonance around 4.3 Hz was experimentally obtained. A 1 DOF numerical simulation achieved the same results [53]. Then, Ribeiro et al. [54] numerically investigated the vertical sitting transmissibility passengers felt when crossing a bridge. A 1 DOF numerical simulation demonstrated vertical transmissibility of 4.3 Hz. The authors also concluded that the identified frequency mode corresponds to isolated vibrations of the passenger-seat system and is unrelated to vehicle carbody natural frequencies [54]. Liu et al. [25] were the first authors to study the transmissibility of railway seats and their association with carbody natural frequencies in a real train environment. The authors instrumented a standard-class seat on a Chinese high-speed train in service. Vertical transmissibility around 5 Hz was noticed regarding the seat cushion. Considering the seatback, the vertical transmissibility revealed peaks at 7, 10, 20, and 30 Hz. Performing the vertical floor input—fore-and-aft seatback output transmissibility, longitudinal transmissibility was obtained at approximately 12 Hz, which corresponds to the first-order vertical bending and torsional modes of the carbody. This study evidences the importance of carbody natural frequencies on seat transmissibility [25]. Following the same approach as Ribeiro et al. [53], Silva et al. [55] expanded the experimental setup on 1st and 2nd class seats of Alfa Pendular trains to investigate its transmissibility and modal identification in real-world conditions. Authors found that seat movements depend on foam’s inability to absorb vibration and the carbody’s natural frequencies. Moreover, transmissibility results revealed lower values than those obtained from experiments conducted under laboratory conditions. Therefore, the influence of the seat structural frame and foam leather cover on transmissibility was proved. This was the first experiment that contemplated all aspects of seat dynamics on seat transmissibility, namely the effect of the seat cushion’s flexibility and carbody components on seat transmissibility [55]. Figure 4 presents the simplified experimental setup used by Ribeiro et al. [53] and the expanded experimental setup developed by Silva et al. [55].
Moreover, the use of a backrest also significantly influences vibration discomfort. Basri and Griffin [40] compared vibration transmissibility when sitting in a rigid back to a seatback with foam. Although foam reduced the vibrations at frequencies superior to around 8 Hz, it intensified those vibrations within the 4–8 Hz range for the x-axis vibration. The discomfort caused by the longitudinal vibration at the seatback decreases by 30–40% when the backrest reclining angle increases from 0° to 30°. Thus, seatback inclination decreases vibration discomfort [40].
Concerning seat cushion properties, changing foam thickness has usually been demonstrated to have the most noticeable and predictable impacts on seat transmissibility. Doubling the foam’s thickness approximately halved its stiffness, increasing transmissibility and discomfort. Patelli and Griffin [41] performed an experimental study to examine the effect of foam thickness on seat transmissibility. The authors increased the foam thickness from 40 mm to 80 mm. Consequently, transmissibility was reduced from 4–7 Hz to 3–5 Hz, respectively. Resonance frequencies were within the 3–4 Hz range for 40 mm foam, decreasing to 2–3 Hz for 80 mm foam. The experimental subjects did not exert contact with the seatback [41]. Zhang et al. [48] stated a similar tendency. The authors noticed a higher transmissibility resonance when the seat cushion foam thickness increased from 60 mm to 80 mm and, posteriorly, to 100 mm. Ebe and Griffin [56] and Neal [57] reported the same tendency as those aforementioned studies.
In contrast, varying the foam hardness (composition and density) does not substantially affect seat transmissibility. Indeed, density influences static comfort but not seat transmissibility because of the hysteresis loss. Ebe and Griffin [9] analysed that parameter by using four foam cushions with equal dimensions but varying densities (from 45 to 65 kg/m3). Seat transmissibility did not notice meaningful alterations, differing from what was observed with the individual’s comfort judgements. This way, those judgement variations were connected to the static seat comfort [9]. Choi and Kim [58] conducted a distinct investigation to assess the molecular effect of crosslinking agents on the dynamic comfort of polyurethane foams (traditionally used on railway vehicles). Three crosslinking agents were used, namely DEA, DETA, and BHMTA. Vibrational energy can be transmitted from one side to the other of the foam over the cell wall and struts. Regarding cell morphology, a thinner cell wall, strut, and lower wall area are presumably advantageous in achieving lower vibration transmission. Those characteristics were evidenced by the BHMTA crosslinking agent foam, which guaranteed the lowest vibration transmissibility. The DETA foam demonstrated a higher cell wall area, which negatively influenced transmissibility. Thus, the crosslinking agent has a strong impact on the dynamic comfort properties of polyurethane foams and should be carefully selected to increase the passengers’ comfort. The results presented by the authors are demonstrated in Figure 5 [58].
3.2. Static Evaluation
“Static comfort” refers to the sitting impressions of seat users when there is no vibration. Both dynamic and static seat characteristics influence overall seat discomfort. These two factors are firmly connected; the importance of one depends on the other. In situations with low or absent vibration, discomfort evaluation depends mostly on the static seat characteristics. In contrast, dynamic features dominated discomfort evaluation when vibration magnitude increased. Therefore, it is essential to consider static and dynamic seat characteristics when evaluating passengers’ comfort. Interface pressure and foam properties are commonly evaluated using a static comfort evaluation technique [10,59].
When a passenger sits, it exerts pressure on the seat cushion due to the biomechanical load imposed by the musculoskeletal structure. The pressure at the interface between the seat and the user’s buttocks varies over the seat surface area since the human buttocks are not flat. Local pressure variation is generally defined as pressure distribution, which can be affected by multiple factors, such as the user’s anatomical characteristics and seat foam features such as hardness and shape. Pressure distribution provides information such as specific pressure points, contact area, and peak pressure. Moreover, pressure distribution directly correlates with seat comfort and subjective comfort evaluation once it is obtained with a person sitting. This way, pressure measurements evaluate the biomechanics factor of sitting discomfort by evaluating and correlating objective measurements with subjective rankings [3,9,60,61].
When a passenger sits down, more than 70% of their body weight is supported by the seat cushion, resulting in a significant concentration of pressure, particularly in the ischial tuberosity area, leading to pressure peaks. This interface pressure causes low oxygen content in cells, inducing fatigue, pain, and discomfort [10,60,62,63]. However, the literature has no consensus about the maximum pressure threshold. Multiple authors defend the fact that 32 mmHg should not be exceeded. That pressure corresponds to the capillary pressure value, and an above-normal pressure can be considered harmful once it can obstruct the capillaries, restricting blood circulation and, consequently, resulting in a deprivation of oxygen in the tissues, causing discomfort [59,60,64,65,66]. In contrast, other authors state that a seat is considered comfortable if it presents a maximum of 43.50 mmHg pressure under the ischial tuberosities and 21.75 mmHg elsewhere. This highlights the fact that the mean pressure should never be above 37.75 mmHg; at this pressure, skin capillaries close [61,63]. Although no studies define the ideal body pressure distribution, there seems to be a consensus that a widely dispersed distribution without local concentration peaks represents the ideal foam [3,59,61,63,64,65,66,67].
Using a pressure map sensor in conjunction with the seat pressure distribution (SPD%) indicates the seat cushion’s ability to distribute pressure uniformly [61]. It is calculated according to Equation (11),
where represents the total number of nonzero cell elements, is the pressure on its cells, and is the mean pressure of the elements. Lower SPD% corresponds to uniform pressure distribution on the seat surface, whereas zero represents the total equilibrium of pressure distribution.
User anthropometric characteristics, such as weight, height, body mass index (BMI), and body part or knee angle, influence pressure distribution. Heavy subjects tend to induce lower pressure due to their higher contact area with the seat surface, while thinner subjects present higher pressure around the ischial tuberosities area [61]. Hu et al. [61] evaluated the effect of BMI on sitting pressure distribution. Three individuals with different BMIs (underweight, normal, and obese) were tested. Normal users presented lower pressure magnitudes (maximum and mean pressures) and lower contact areas. In contrast, the obese subject generates the highest contact area. Results demonstrated that contact area would linearly increase when subjects’ weight and height increased. Due to the larger contact area, the obese subject also had the lowest SPD% of all subjects. Therefore, larger contact areas represent more evenly distributed pressure and, consequently, lower discomfort levels [61]. Akgunduz et al. [67] examined the influence of knee angle on seat interface pressure. Results suggested that increasing the angle from 95° to 115° and up to 135° decreased the pressure around the ischial tuberosities and increased pressure beneath the thighs. This way, pressure is distributed along the seat surface, reducing pressure magnitudes. The increased contact area also supports this fact [67]. Xu et al. [60] discussed the association between local comfort and whole-body comfort. Four body parts were defined: the back, waist, hips, and thighs. Pressure measurements and a subjective ranking assessed discomfort. Results highlighted the hips as the most significant body part affecting whole-body discomfort, followed by the back, waist, and thighs (Figure 6a; [60]). A similar study by Peng et al. [63] revealed the passengers’ local and overall comfort degradation mechanisms on high-speed railways. Pressure map sensors measure the interface pressure between the user and the seat on a 2nd class Chinese high-speed rail seat (Figure 6b). At every 10 min of the experiment, passengers also evaluated discomfort based on a subjective ranking. Local comfort was divided into eight parts: shoulders, mid-back, side back, waist, buttocks, and upper, side, and lower thigh. Results demonstrated that the comfort of the shoulders, waist, and buttocks mainly influences overall comfort. In contrast, the side back, upper thigh, and lower thigh noticed the lowest correlation with overall comfort. Comfort degradation was defined based on sitting time. During the initial 20 min of sitting, the seat has a negative influence on the comfort degradation rate, with fatigue appearing after this time [63]. Yuxie et al. [3] also analysed sitting duration on overall comfort on high-speed railways. By evaluating comfort with both objective (the Tekscan body pressure measurement system) and subjective (the numerical rating scale [NRS]) methods, the authors concluded that higher sitting duration leads to higher discomfort levels [3].
Regarding foam characteristics, hardness, hysteresis loss, SAG factor, and foam shape may interfere with pressure distribution and are generally presented as static comfort properties. Seat hardness seems to be the factor that mainly affects pressure distribution comfort. Multiple authors stated that softer seats lead to higher comfort levels. Indeed, the soft contact area is considerably larger than that of a rigid seat, which minimises pressure peaks on the soft seat. Moreover, a more rigid foam is less flexible than a soft one, which induces higher pressure around the ischial tuberosities. Therefore, on a rigid seat, the contact area is caused by the subject’s buttocks’ deformation, whereas on a soft seat, both seat and buttock deformations contribute to enlarging the contact area [9,61,67].
Commonly, the foam hardness is obtained following the ISO 2439 standard specifications, particularly the 25% ILD hardness. That standard also defines the calculation of the SAG factor and foam hysteresis loss. Seat materials require a high SAG factor and low hysteresis values [9,58,68]. The SAG factor represents comfort while seated and is determined as the ratio of the stress value of 65% with that of 25%. The proposed recommendation is to use a SAG factor higher than 2.8 for seating applications. At lower values, bottoming may occur as the passengers feel the seat pad bottom [9,58]. The hysteresis loss is calculated as the percentage ratio of energies between the loading (0–75%) and unloading (75–0%) compression cycles. Energy is obtained based on the area under the stress-strain curve. This way, hysteresis loss represents the passengers’ comfort during de-seating [58]. This property is highly influenced by the cellular foam structure, particularly the cell wall area ratio, once energy loss occurs, mainly due to the buckling that affects the unrecovered cell walls and struts by buckling during the compression cycle. Therefore, low cell wall area ratios are required to obtain low hysteresis values [58]. Figure 7 illustrates the influence of the crosslinking agent found by Choi and Kim [58] on hysteresis loss evaluation, where the BHMTA agent promoted the lowest cell wall area ratio.
Ebe and Griffin [9] related multiple static physical foam characteristics to subjects’ impressions of sitting comfort. Based on four foams with equal hardness but different densities (45, 52, 55, and 65 kg/m3), the influence of density, hysteresis loss, and the SAG factor on sitting comfort was investigated. The low-density foam (45 kg/m3) was judged as the least comfortable foam, whereas high-durability foam (55 kg/m3) was ranked as the most comfortable seat. The same foams presented 34.3% and 29% hysteresis loss, respectively. This way, in opposition to what was expected, it was observed that the foam with a higher hysteresis loss was classified as the most comfortable. Moreover, from the investigated factors, the hysteresis loss revealed the lowest correlation with comfort evaluations, whereas a higher correlation between seat comfort and the SAG factor was obtained [9].
Tang et al. [69] developed an experiment to indicate which seat cushion foam shape model is preferred based on discomfort analysis. Three surface shape models were produced with equal thickness and material: (1) a bilateral protruding cushion; (2) a front protruding cushion; and (3) a flat cushion. A pressure sensor system and a subjective body region discomfort questionnaire quantified discomfort. Static pressure distribution among the three cushions showed a significant difference, with foam (2) exhibiting the highest pressure peaks, followed by foam (1), while cushion (3) had the lowest peaks. On the subjective questionnaire, the highest overall comfort was achieved by foam (3), and the lowest by foam (1). Thus, the flat cushion shape was considered the most suitable foam shape for high-speed railway seats [69].
4. Discussion
Multiple factors influence railroad passengers’ comfort, being those dependent on the vehicle and its motion the primary research concern. The comfort of passengers is dependent on the static and dynamic characteristics of the vehicle and seat, and whether or not vibrations are present. The influence of both comfort types depends on the environmental conditions. The comfort experienced by passengers is influenced by both the static and dynamic characteristics of the vehicle and seat, with the former being more significant for low vibration magnitudes, and the latter dominating discomfort when vibration magnitude increases [10]. Dynamic comfort is evaluated by ride comfort indexes, SEAT, and transmissibility, whereas static comfort is mainly assessed by measuring the seat-user interface pressure. This pressure highly depends on the user’s anthropometric characteristics and foam properties.
Ride comfort defines the human tolerance to vibration exposure over time. Besides several countries applying their comfort evaluation standards, those were developed based on three main methodologies/standards specially developed for that purpose, ISO 2631, EN 12299, and Sperling’s method. Evaluations following the different methods agree that acceleration in the vertical direction induces higher discomfort than longitudinal or lateral accelerations. Moreover, the track’s vertical irregularities are the dominant cause of vibration discomfort [23,25,30]. However, besides sharing the same assumptions, frequency dependence, and goals, each method has its own calculation formulation and evaluation scale. Thus, one method cannot be directly converted into another without performing a complete analysis [1]. Although several authors have attempted to establish a methodology for comparing ride comfort methods, this goal has not yet been achieved. Experimental campaigns must be performed and evaluated based on the three methods to fill this research gap. Moreover, the lack of a consensus methodology capable of being applied worldwide and in multiple conditions leads to misevaluation when comparing results.
Based on the ride comfort analysis, especially the ISO 2631 analysis, SEAT values should be calculated as a complementary comfort analysis for an accurate passenger comfort evaluation. The SEAT reflects seat isolation efficiency [39]. Due to the low-frequency vibrations, dominant in the vertical direction of railways, and foam’s incapacity to absorb them, a vertical SEAT higher than 100% is expected [38]. Currently, SEAT evaluations are primarily performed in laboratory experiments, which do not accurately translate the seat’s behaviour under service conditions. Gong and Griffin [38] concluded that SEAT values should be obtained based on real vibration conditions; otherwise, the conclusions are not valid for service conditions.
Seat transmissibility quantifies seat dynamics and verifies its efficiency in handling vibration discomfort. Seat efficiency depends on human body biodynamics, vibration excitation, and foam properties. The human body produces nonlinear physiological responses to vibration. Thus, the vibration frequency range influences some body regions more than others. For example, frequencies comprehended between 4–8 Hz led to resonance in the abdominal region [20,41,44]. Moreover, once the biodynamic response of the human body is cross-axis-coupled, vibration transmissibility presents the same characteristic. The cross-axis-coupled transmissibility is a crucial factor because, in this way, vibration induced in one axis induces responses in other axes [39]. Seat users’ anthropometric characteristics do not influence vibration transmissibility [48,49,50,51,52]. Additionally, to being cross-axis-coupled, transmissibility differs in direction and location. Therefore, transmissibility peaks in vertical, longitudinal, and lateral directions in both the seat surface and seatback, present different trends. While the vertical seat surface transmissibility exhibits a peak between 4–6 Hz, the transmissibility increases up to around 25 Hz in both the lateral and longitudinal directions. The seatback transmissibility peaks are a rotation of those of the seat surface. This way, while the vertical and lateral transmissibilities have peaked around 25 Hz, the longitudinal ones are comprehended between 4–6 Hz [38]. The most referenced bibliography studies’ major limitation concerns their performance on a seat simulator instead of a train seat. Seat dimensions, support points, foam coupling, real train vibration induction, and the influence of carbody natural frequencies on seat transmissibility are crucial parameters not evaluated in those studies. Transmissibility tests should be conducted in real-world train environments instead of laboratory analysis. This way, tests can be adapted to perform a modal identification and analysis of the seat structure. Particularly, natural frequencies related to the seat frame structure can be distinguished from those dependent on the carbody, therefore increasing the ability to perform a more robust comfort evaluation. Regarding the foam properties, the thickness was demonstrated to influence seat transmissibility. Doubling the foam’s thickness approximately halved its stiffness, increasing transmissibility and discomfort [41,46,48,56,57]. Foam hardness, composition, and density do not significantly affect seat transmissibility [9].
The biomechanical load the human body’s musculoskeletal structure imposes on a seat surface defines its interface pressure. That depends on the users’ anatomical characteristics and foam properties, such as hardness, hysteresis loss, and SAG factor. The human buttocks are not flat. Therefore, local pressure varies over the seating contact area, achieving higher values under the ischial tuberosities. Those local pressure peaks are highly related to discomfort and should be avoided [3,9,60,61]. The maximum interface pressure threshold is not well-defined in the literature. Some authors defend the fact that a 32 mmHg pressure should not be exceeded once it represents the capillary pressure value, while others accept a higher 37.75 mmHg pressure. However, although the lack of consensus defines a maximum pressure threshold, it seems unanimous that the ideal seat will avoid pressure peaks, leading to a widely dispersed distribution [59,61,63,64,65,66,67,70].
Regarding passengers’ anthropometric characteristics influencing interface pressure, subjects’ weight has the most substantial impact. Heavier subjects report higher contact areas with the seat surface, leading to lower pressure and increased comfort. In contrast, thinner subjects tend to produce a higher pressure around the ischial tuberosities, resulting in higher discomfort levels [61]. Additionally, the waist and buttocks are the most remarkable body parts influencing whole-body discomfort [60,63]. Currently, to the author’s knowledge and research, only experiments conducted with adults have been performed. Since the interface pressure depends on the subject’s weight, conducting an interface pressure experiment on children would be interesting since they are typically shorter and lighter than adults.
Foam properties, i.e., hardness, hysteresis loss, and SAG factor, also significantly impact pressure distribution. Softer seats reach higher comfort levels due to their increased contact area than rigid seats [9,61,67]. For seating applications, the SAG factor, which measures comfort while sitting, should have a value higher than 2.8. Lower values induce bottoming and, consequently, passenger discomfort [9,58]. In its turn, hysteresis loss represents the passenger’s comfort during de-seating. Thus, theoretically, low hysteresis loss values are required to increase passengers’ comfort [58]. However, an experimental study conducted by Ebe and Griffin [9] showed the opposite, indicating that passengers reported higher comfort levels for foam with high hysteresis loss. The lack of experiments regarding this factor, coupled with the opposite conclusions between theoretical and experimental results, highlights the need for further research on this topic. Moreover, the same study concluded that the SAG factor highly correlates with passenger comfort [9]. Collectively, the ideal foam presents low hysteresis loss, a high SAG factor, and low vibration transmissibility.
To the author’s knowledge and appreciable research, there is a lack of interface pressure tests conducted on real train seats under static and dynamic conditions. To accurately characterise static foam comfort, foam evaluation should be performed as a complement to interface pressure analysis and foam properties laboratory analysis, namely density, hardness, hysteresis loss, and SAG factor. This way, the foam behaviour under static conditions could be thoroughly evaluated. There is a general consensus among most authors regarding the effectiveness of evaluating the combined static and dynamic comfort of seating. The authors’ knowledge suggests that only four published studies have evaluated both types of comfort simultaneously, indicating a gap in research.
5. Conclusions
Railways are currently one of the most used public transportation systems. Therefore, its comfort performance is now a central theme regarding rail design. Depending on multiple factors, rail comfort is evaluated by the both static and dynamic behaviour of motion parameters. Interface pressure, density, hysteresis loss, and the SAG factor define static comfort, whereas dynamic comfort is assessed using ride comfort, SEAT, and seat transmissibility.
Ride comfort is evaluated by three main methods: ISO 2631, EN 12299, and Sperling’s method. Although these methodologies share similar assumptions and goals, the comfort calculations vary, and no correlation has been found between the methods, invalidating a universal analysis methodology. It should also be highlighted that the absence of a consensus methodology for evaluating passengers’ ride comfort may lead to erroneous assessments when comparing results. This way, a research gap can be identified, and more efforts must be made to accomplish a global and consensus ride comfort evaluation methodology. SEAT and transmissibility agree in determining the importance of vertical vibrations in passengers’ discomfort. Nevertheless, the main bibliographic research conducted on these topics is performed under laboratory conditions, which do not consider the influence of the seat frame structure and carbody natural frequencies. Therefore, those experiments may not properly reproduce railroad service conditions and how those parameters affect passengers’ comfort.
The combination of interface pressure analysis and foam properties accurately defines the foam’s static behaviour. However, to the best of our knowledge, no studies have reported the combined use of static comfort analysis methods. Further research is needed in this area. Furthermore, multiple studies demonstrated that the subject’s weight influences the interface pressure. Since children are typically shorter and lighter than adults, conducting experimental research on children’s interface pressure in rail seats would be relevant.
There is a generalised lack of experiments conducted on real rail vehicles and seats. Laboratory experiments allow comfort predictions but do not represent actual in-service conditions. Moreover, comfort can only be thoroughly evaluated if static and dynamic evaluations are performed. The present research revealed an investigation gap once only four studies were obtained regarding that type of evaluation. More work is needed to evaluate and increase passengers’ comfort and promote rail usage as a daily transportation system.
Author Contributions
Conceptualization, P.S., D.R. and J.M.; methodology, P.S.; validation, P.S., D.R., J.M., E.A.R.S. and O.P.; formal analysis, P.S.; investigation, P.S.; writing—original draft preparation, P.S.; writing—review and editing, P.S, D.R., O.P., J.M. and E.A.R.S.; visualization, P.S.; supervision, J.M. and E.A.R.S.; project administration, P.S.; funding acquisition, P.S., J.M. and D.R. All authors have read and agreed to the published version of the manuscript.
Funding
This research was funded by Fundação para a Ciência e Tecnologia, with grant number PD/BD/143161/2019. The authors also acknowledge the financial support from the Base Funding (UIDB/04708/2020) and Programmatic Funding (UIDP/04708/2020) of CONSTRUCT—Instituto de Estruturas e Construções, funded by national funds through the FCT/MCTES (PIDDAC).
Data Availability Statement
No new data were created or analyzed in this study. Data sharing is not applicable to this article.
Acknowledgments
This work results from the project “FERROVIA 4.0,” with reference POCI-01-0247-FEDER-046111, co-funded by the European Regional Development Fund (ERDF) through the Operational Programme for Competitiveness and Internationalization (COMPETE 2020) and the Lisbon Regional Operational Programme (LISBOA 2020), under the Portugal 2020 Partnership Agreement. The first author thanks Fundação para a Ciência e Tecnologia (FCT) for a Ph.D. scholarship under the project iRail (PD/BD/143161/2019). The authors would like to acknowledge the support of the projects FCT LAETA–UIDB/50022/2020, UIDP/50022/2020, and UIDB/04077/2020.
Conflicts of Interest
The authors declare no conflict of interest.
Appendix A

Table A1.
Dynamic comfort evaluations with the respective evaluation types (ride comfort, SEAT, and transmissibility), evaluated factor, elements analysed (seat surface, seat backrest, floor, and foam), experiment types (laboratory experiment, rail environment experiment, and numerical simulation), and study conclusions. Bibliographic references are ordered chronologically, from the most recent study to the oldest.
| Year | Ref. | Comfort Evaluation | Factor | Elements Analysed | Experiment Type | Main Conclusions |
|---|---|---|---|---|---|---|
| 2023 | [55] | Transmissibility and Modal identification | -Transmissibility in rail conditions (effect of seat frame and foam) | Floor and seat (surface and seatback) | Rail environment experiment | -Lower transmissibility resonance peaks than laboratory experiments -Transmissibility depends on foam’s incapacity to absorb low vibration frequencies -Transmissibility depends on seat frame structure -Carbody natural frequencies influence transmissibility |
| 2022 | [2] | Ride comfort (ISO 2631, EN 12299, and Sperling’s method) | -Methods comparison | Floor | Rail environment experiment | -Numerical correlation between three ride comfort indexes |
| 2022 | [43] | Ride comfort (EN 12299 and Sperling’s method) | -Influence of track quality and wind load on comfort | Floor | Numerical simulation | -Track quality as neglective effect on comfort compared with wind load |
| 2022 | [45] | Not applicable | -Shock and vibration health effects | Not applicable | Not applicable | -Negative impact of vibration |
| 2021 | [23] | Ride comfort (ISO 2631) | -Effect of track -Influence of vibration direction | Seat (surface and backrest) | Rail environment experiment | -Vertical vibration mostly impacts discomfort -Tunnels and running speed have a significant influence on vibration discomfort |
| 2021 | [34] | Ride comfort (EN 12299 and Sperling’s method) | -Effect of speed -Effect of suspension | Floor | Numerical simulation | -Higher speeds lead to higher discomfort levels -Lower damping conducts to lower comfort levels |
| 2021 | [54] | Transmissibility | -Influence of bridges passing in transmissibility | Floor and seat surface | Numerical simulation | -Vertical transmissibility is equal to 4.3 Hz (1 DOF system) -Vertical transmissibility of the passenger-seat system is unrelated to the vehicle carbody natural frequencies |
| 2019 | [1] | Ride comfort (EN 12299 and Sperling’s method) | -Methods comparison | Floor | Rail environment experiment | -Sperling’s method revealed higher discomfort levels |
| 2019 | [25] | Ride comfort (ISO 2631) and transmissibility | -Effect of speed -Effect of track geometry -Identification of resonance peaks according to the direction | Floor and Seat (surface and backrest) | Rail environment experiment + Numerical simulation | -As speed increases, discomfort is influenced by track geometry, especially lateral direction -Vertical irregularities are the dominant cause of vibration discomfort -Seat surface vertical transmissibility: 5 Hz -Seatback longitudinal transmissibility: 12 Hz |
| 2019 | [41] | SEAT and Transmissibility | -Influence of vertical shocks transmission -Influence of foam thickness | Floor and seat surface (only foam) | Laboratory experiment | -Higher foam thickness increases vibration discomfort -Thicker foams have higher transmissibility resonances |
| 2019 | [18] | Ride comfort standard (China) | -Mechanical vibration and shock | Not applicable | Not applicable | -Evaluation of human exposure to whole-body vibration |
| 2018 | [32] | Ride comfort (EN 12299 and Sperling’s method) | -Methods comparison | Floor | Numerical simulation | -Sperling’s method revealed higher discomfort levels |
| 2018 | [38] | SEAT and Transmissibility | -Vibration transmission on train seats and the influence of vibration excitation | Floor and seat (surface and backrest) | Laboratory experiment | -Seat surface lateral and longitudinal transmissibility: 25 Hz -Seat surface vertical vibration: 3.8–5.0 Hz -Seat backrest, vertical and lateral transmissibility.: 24 Hz -Seat backrest longitudinal trans.: 4 Hz -Real vibration should be applied; otherwise, conclusions are invalid |
| 2017 | [33] | Ride comfort (EN 12299 and Sperling’s method) | -Methods comparison | Seat surface | Rail environment experiment | -Similar evaluation results for both methods |
| 2016 | [31] | Ride comfort | -Effect of speed | Floor | Numerical simulation | -Vehicle speed increases discomfort increases -Higher tilting angles lead to higher discomfort |
| 2015 | [28] | Ride comfort (ISO 2631, EN 12299, and Sperling’s method) | -Vibration comfort level | Floor | Numerical simulation | -Advantages and limitations of ride comfort methodologies |
| 2015 | [48] | Transmissibility | -Influence of subject’s variability (weight and height) -Influence of foam thickness | Foam (cushion and backrest) | Laboratory experiment | -Inter-subject variability does not influence transmissibility -Increasing foam thickness decreases vertical transmissibility resonances |
| 2014 | [40] | Transmissibility | -Influence of seatback foam and inclination on transmissibility | Foam (cushion and backrest) | Laboratory experiment | -Recline seat reduces discomfort -Rigid seats increase vibration magnitude transmission and discomfort |
| 2013 | [13] | Ride comfort (ISO 2631) and SEAT | -Method of measuring whole-body vibration | Floor and seat (surface and backrest) | Laboratory experiment | -Quantification of ride comfort according to ISO 2631 and VDV -Seat quantified with regard to SEAT |
| 2013 | [44] | Transmissibility | -Influence of soft seating on the apparent mass of the human body -Factors influencing seat dynamic response | Foam | Laboratory experiment | -Stiffness of foam tends to increase with increasing frequency of vibration -Vertical transmissibility around 5 Hz -Increasing magnitude of vibration produced significant reductions in the resonance frequency of the transmissibility |
| 2013 | [53] | Transmissibility | -Transmissibility in rail conditions | Floor and seat surface | Rail environment experiment + Numerical simulation | -Vertical transmissibility around 4.3 Hz (experimental and 1 DOF system) |
| 2013 | [17] | Ride comfort standard (USA) | -Mechanical vibration and shock | Not applicable | Not applicable | -Evaluation of human exposure to whole-body vibration |
| 2011 | [52] | SEAT and Transmissibility | -Influence of user anthropometric characteristics on vibration transmission | Floor and seat (surface and backrest) | Laboratory experiment | -Seat surface lateral and longitudinal transmissibility: 25 Hz -Seat surface vertical vibration: 3.8–5.0 Hz -Seat backrest vertical and lateral trans.: 24 Hz -Seat backrest longitudinal trans.: 4 Hz -No statistically significant correlations between subject mass (or body mass index) and SEAT values were found, so the subject’s anthropometric characteristics do not influence transmissibility |
| 2010 | [20] | Ride comfort (ISO 2631 and Sperling’s method) | -Influence of vibration direction -Methods comparison | Floor and seat (surface and backrest) | Rail environment experiment | -Influence of vertical vibration -Sperling’s index produced higher discomfort values than ISO 2631 |
| 2010 | [27] | Ride comfort (EN 12299) | -Track irregularity’s location | Floor | Numerical simulation | -Lack of possibility to correspond to the track irregularity’s location |
| 2007 | [22] | Ride comfort (ISO 2631) | -Influence of vibration direction and magnitude | Floor, seat (surface, backrest, and armrest), and table | Rail environment experiment | -Vibration is the main cause of disturbance and may lead to limitations in performing sedentary activities |
| 2007 | [37] | Ride comfort (ISO 2631) | -Influence of vibration direction | Seat surface | Numerical simulation | -Influence of vertical vibration direction |
| 2006 | [35] | Ride comfort (ISO 2631) | -Influence of vibration magnitude and direction | Floor and seat (surface and backrest) | Laboratory experiment | -Higher magnitude leads to higher discomfort -Main influence of vertical direction |
| 2006 | [39] | SEAT and Transmissibility | -Predict dynamic sitting comfort using SEAT and transmissibility | Seat (surface and seatback) | Laboratory experiment | -Good correlation between SEAT and vertical comfort -Seat surface vertical transmissibility around 5 Hz -Failed to identify seatback influence on dynamic comfort |
| 2006 | [16] | Ride comfort standard (Japan) | -Mechanical vibration and shock | Not applicable | Not applicable | -Evaluation of human exposure to whole-body vibration |
| 2005 | [19] | Not applicable | -Health risks of vibration | Not applicable | Not applicable | Not applicable |
| 2005 | [29] | Ride comfort (ISO 2631, EN 12299, and Sperling’s method) | -Influence of speed -Influence of rail condition -Influence of rail curvature | Floor | Rail environment experiment | -Speed and rail conditions significantly influenced vibration discomfort -Influence order: speed, rail condition, and rail curvature |
| 2003 | [42] | SEAT and Transmissibility | -Predict dynamic sitting comfort -Correlation between subjective and objective methods | Floor and seat (surface and backrest) | Laboratory experiment | -Correlation between SEAT objective and subjective results noticed promising results -Subject’s preferences were similar to the objective data measurements |
| 2002 | [30] | Ride comfort (ISO 2631) | -Influence of vibration direction | Floor and seat surface | Rail environment experiment | -Vertical vibration is the main cause of vibration discomfort |
| 2001 | [14,19] | ISO 2631 standard | -Mechanical vibration and shock | Not applicable | Not applicable | -Evaluation of human exposure to whole-body vibration |
| 2001 | [57] | Transmissibility and Foam properties (hysteresis loss) | -Influence of foam thickness | Foam | Laboratory experiment | -Thicker foams have higher transmissibility resonances -Hysteresis does not depend on the thickness |
| 2000 | [49] | Transmissibility | -Dynamic foam response | Foam | Laboratory experiment + Numerical simulation | -Higher compression does not influence transmissibility |
| 2000 | [56] | Transmissibility | -Influence of foam thickness and hardness | Foam | Laboratory experiment | -Thinner foam cushions were evaluated as significantly more uncomfortable than thicker foam cushions -Discomfort increased as vibration magnitude increased |
| 1999 | [15,26] | EN 12299 standard | -Ride comfort for passengers | Not applicable | Not applicable | -Measurement and evaluation |
| 1998 | [50] | Transmissibility | -Influence of increasing masses on transmissibility | Seat surface and foam | Laboratory experiment | -Higher mass (sandbags) compression does not influence transmissibility |
| 1990 | [21] | Not applicable | -Health risks of vibration | Not applicable | Not applicable | Not applicable |
| 1989 | [47] | Ride comfort (ISO2631) | -Evaluation factors of whole-body vibration | Seat | Not applicable | -Whole-body vibration analysis -Frequency weighting -Vibration measurement systems |
| 1977 | [51] | Transmissibility | -Dynamic characteristics of seat-human interaction | Floor and seat surface | Laboratory experiment | -Subjects weight and height does not influence vibration transmissibility |
Table A2.
Studies that perform both dynamic and static comfort evaluations with the respective evaluation types (ride comfort, SEAT and transmissibility, and interface pressure), evaluated factors, elements analysed (seat surface, seat backrest, floor, and foam), experiment types (laboratory experiment, rail environment experiment, and numerical simulation), and study conclusions. Bibliographic references are ordered chronologically, from the most recent study to the oldest.
| Year | Ref. | Comfort Evaluation | Factor | Elements Analysed | Experiment Type | Main Conclusions |
|---|---|---|---|---|---|---|
| 2020 | [58] | Transmissibility and Foam properties (hysteresis loss) | -Influence of crosslinking agent on transmissibility and hysteresis loss | Foam | Laboratory experiment | -Thinner cell wall, a lower wall area, and a thinner strut are advantageous in achieving lower vibration transmission -Low cell wall area ratios are required to obtain low hysteresis values |
| 2004 | [12] | Transmissibility and Interface pressure | Not applicable | Not applicable | Laboratory experiment | -Harmful consequences of vibration |
| 2003 | [36] | Ride comfort (ISO 2631) and Interface pressure | -Influence of subject’s weight in interface pressure -Comparison between the regular seat and air-cell seat | Foam | Laboratory experiment | -Heaviest subject presented higher maximum pressure -Regular seat demonstrated higher comfort levels for frequencies lower than 4.5 Hz, whereas the air-cell seat performed better between 4.5–8 Hz |
| 2001 | [9] | Transmissibility and Interface pressure | -Influence of foam density and hardness | Foam | Laboratory experiment | -Foam density does not influence transmissibility -Softer foams lead to higher comfort |
Table A3.
Static comfort evaluations with the respective evaluation type (interface pressure), evaluated factor, elements analysed (seat surface, seat backrest, floor, and foam), experiment type (laboratory experiment, rail environment experiment, and numerical simulation), and study conclusions. Bibliographic references are ordered chronologically, from the most recent study to the oldest.
| Year | Ref. | Comfort Evaluation | Factor | Elements Analysed | Experiment Type | Main Conclusions |
|---|---|---|---|---|---|---|
| 2022 | [3] | Interface pressure | -Sitting duration influence on comfort | Seat (surface + backrest) | Laboratory experiment + Numerical simulation | -Higher sitting duration leads to higher discomfort levels |
| 2022 | [63] | Interface pressure | -Comfort degradation mechanism | Seat (surface and backrest) | Rail environment experiment | -Comfort depends on sitting time (after >20 min fatigue appears and comfort decreases) |
| 2021 | [69] | Interface pressure | -Influence of foam shape | Foam | Laboratory experiment | -Flat cushion shape is the most suitable for rail application |
| 2018 | [61] | Interface pressure | -Influence of BMI -Maximum pressure threshold | Foam | Laboratory experiment | -Normal subjects have higher comfort levels 43.50 mmHg pressure under the ischial tuberosities and 21.75 mmHg elsewhere -Mean pressure should never be above 37.75 mmHg |
| 2017 | [60] | Interface pressure | -Association between local comfort and whole-body comfort | Seat (surface and backrest) | Rail environment experiment | -Hips most influence whole-body discomfort |
| 2014 | [59] | Interface pressure | -Evaluation of express train sitting discomfort | Seat surface | Laboratory experiment | -High pressure on 2nd class seats -High pressure for thinner subjects |
| 2014 | [67] | Interface pressure | -Effect of knee angle -Influence of seat hardness | Seat surface | Laboratory experiment | -Increase angle decrease pressure around the ischial tuberosities and increase beneath the thighs -Softer seats lead to a higher contact area and higher comfort |
| 2012 | [64] | Interface pressure | -Association between subject posture and interface pressure | Seat (surface and backrest) | Laboratory experiment | -Widely distributed pressure leads to comfortable seats -Subjects tend to adjust their pressure when they feel fatigue |
| 2008 | [62] | Interface pressure | -Associations between interface pressure and subjective ratings | Seat surface | Laboratory experiment | -High correlation between subjective comfort rankings and objective evaluation - Contrary to de Looze et al., which found that interface pressure is more directly associated with discomfort |
| 2006 | [66] | Interface pressure | -Pressure map characteristics | Floor | Laboratory experiment | -Repeatability -Sensitivity -Temperature sensitivity -Hysteresis |
| 2003 | [65] | Interface pressure | -Relationship between interface pressure and gender, body mass index (BMI) | Seat (surface and backrest) | Laboratory experiment | -Average and maximum pressures are independent of gender -Average pressure had a significant positive correlation with BMI -Reclining the chair significantly reduced the average pressure |
| 1999 | [46] | Not applicable | - Occupational biomechanics | Not applicable | Not applicable | -Human biomechanics |
References
- Jiang, Y.; Chen, B.K.; Thompson, C. A comparison study of ride comfort indices between Sperling’s method and EN 12299. Int. J. Rail Transp. 2019, 7, 279–296. [Google Scholar] [CrossRef]
- Kim, Y.G.; Kwon, H.B.; Kim, S.W.; Kim, C.K.; Kim, T.W. Correlation of ride comfort evaluation methods for railway vehicles. Proc. Inst. Mech. Eng. Part F J. Rail Rapid Transit 2003, 217, 73–88. [Google Scholar] [CrossRef]
- Yuxue, B.; Bingchen, G.; Jianjie, C.; Wenzhe, C.; Hang, Z.; Chen, C. Sitting comfort analysis and prediction for high-speed rail passengers based on statistical analysis and machine learning. Build. Environ. 2022, 225, 109589. [Google Scholar] [CrossRef]
- Vink, P.; Hallbeck, S. Editorial: Comfort and discomfort studies demonstrate the need for a new model. Appl. Ergon. 2012, 43, 271–276. [Google Scholar] [CrossRef] [PubMed]
- Zhang, L.; Helander, M.; Kumar, S. Identifying Factors of Comfort and Discomfort: A Multidisciplinary Approach. In Advances in Industrial Ergonomics and Safety IV; Taylor & Francis: Milton Park, UK, 1992; pp. 395–402. [Google Scholar]
- Zhang, L.; Helander, M.G.; Drury, C.G. Identifying Factors of Comfort and Discomfort in Sitting. Hum. Factors 1996, 38, 377–389. [Google Scholar] [CrossRef]
- De Looze, M.P.; Kuijt-Evers, L.F.M.; Van Dieën, J. Sitting comfort and discomfort and the relationships with objective measures. Ergonomics 2003, 46, 985–997. [Google Scholar] [CrossRef]
- Mastrigt, S.H.-V.; Groenesteijn, L.; Vink, P.; Kuijt-Evers, L.F.M. Predicting passenger seat comfort and discomfort on the basis of human, context and seat characteristics: A literature review. Ergonomics 2016, 60, 889–911. [Google Scholar] [CrossRef]
- Ebe, K.; Griffin, M. Factors affecting static seat cushion comfort. Ergonomics 2001, 44, 901–921. [Google Scholar] [CrossRef]
- Ebe, K.; Griffin, M. Quantitative prediction of overall seat discomfort. Ergonomics 2000, 43, 791–806. [Google Scholar] [CrossRef]
- Moher, D.; Liberati, A.; Tetzlaff, J.; Altman, D.G. Preferred reporting items for systematic reviews and meta-analyses: The PRISMA statement. PLoS Med. 2009, 6, e1000097. [Google Scholar] [CrossRef]
- Hostens, I. Analysis of Seating during Low Frequency Vibration Exposure. Ph.D. Thesis, Katholieke Universiteit Leuven, Leuven, Belgium, 2004. [Google Scholar]
- Park, S.J.; Subramaniyam, M. Evaluating Methods of Vibration Exposure and Ride Comfort in Car. J. Ergon. Soc. Korea 2013, 32, 381–387. [Google Scholar] [CrossRef]
- BS ISO 2631; Mechanical Vibration and Shock. Evaluation of Human Exposure to Whole-Body Vibration. British Standards Institution: London, UK; International Standard Organization: Geneva, Switzerland, 2001.
- BS EN 12299; Railway Applications—Ride Comfort for Passengers—Measurement and Evaluation. British Standards Institution: London, UK; European Committee for Standardization: Brussels, Belgium; British Standards Policy and Strategy Committee: London, UK, 2009.
- Railway Technical Research Institute. Outline of Design Standards for Railway Structures and Commentary (Displacement Limits); Railway Technical Research Institute: Tokyo, Japan, 2006. [Google Scholar]
- ANSI/ASCE/T&DI 21-13; Automated People Mover Standards. American Society of Civil Engineers: Reston, VA, USA, 2013.
- GB/T 5599-2019; Specification for Dynamic Performance Assessment and Testing Verification of Rolling Stock. People’s Republic of China National Railway Administration: Beijing, China, 2019.
- Bovenzi, M. Health effects of mechanical vibration. G. Ital. Med. Lav. Erg. 2005, 27, 58–64. [Google Scholar]
- Năstac, S.; Picu, M. Evaluating Methods of Whole-Body-Vibration Exposure in Trains. Ann.“Dunarea De Jos” Univ. Galati, Fasc. XIV Mech. Eng 2 2010, 14, 55–60. [Google Scholar]
- Griffin, M.J.; Erdreich, J. Handbook of Human Vibration; Academic Press: London, UK, 1990. [Google Scholar] [CrossRef]
- Khan, S.; Sundstrom, J. Effects of vibration on sedentary activities in passenger trains. J. Low Freq. Noise Vib. Act. Control 2007, 26, 43–55. [Google Scholar] [CrossRef]
- Peng, Y.; Wu, Z.; Fan, C.; Zhou, J.; Yi, S.; Peng, Y.; Gao, K. Assessment of passenger long-term vibration discomfort: A field study in high-speed train environments. Ergonomics 2021, 65, 659–671. [Google Scholar] [CrossRef]
- ISO 2631; Mechanical Vibration and Shock—Evaluation of Human Exposure to Whole-Body Vibration. International Standard Organization: Geneva, Switzerland, 2001.
- Liu, C.; Thompson, D.; Griffin, M.J.; Entezami, M. Effect of train speed and track geometry on the ride comfort in high-speed railways based on ISO 2631-1. Proc. Inst. Mech. Eng. F J. Rail. Rapid. Transit. 2020, 234, 765–778. [Google Scholar] [CrossRef]
- EN 12299; Railway Applications—Ride Comfort for Passengers—Measurement and Evaluation. European Committee for Standardization: Brussels, Belgium, 1999.
- Kufver, B.; Persson, R.; Wingren, J. Certain aspects of the CEN standard for the evaluation of ride comfort for rail passengers. WIT Trans. Built Environ. 2010, 114, 605–614. [Google Scholar] [CrossRef]
- Darlton, A.O.; Marinov, M. Suitability of Tilting Technology to the Tyne and Wear Metro System. Urban Rail Transit 2015, 1, 47–68. [Google Scholar] [CrossRef]
- Karakasis, K.; Skarlatos, D.; Zakinthinos, T. A factorial analysis for the determination of an optimal train speed with a desired ride comfort. Appl. Acoust. 2005, 66, 1121–1134. [Google Scholar] [CrossRef]
- Johanning, E.; Fischer, S.; Christ, E.; Göres, B.; Landsbergis, P. Whole-body vibration exposure study in U.S. railroad locomotives—An ergonomic risk assessment. Am. Ind. Hyg. Assoc. J. 2002, 63, 439–446. [Google Scholar] [CrossRef]
- Cheng, Y.C.; Hsu, C.T. Parametric Analysis of Ride Comfort for Tilting Railway Vehicles Running on Irregular Curved Tracks. Int. J. Struct. Stab. Dyn. 2016, 16, 1550056. [Google Scholar] [CrossRef]
- Dumitriu, M.; Leu, M. Correlation between Ride Comfort Index and Sperling’s Index for Evaluation Ride Comfort in Railway Vehicles. Appl. Mech. Mater. 2018, 880, 201–206. [Google Scholar] [CrossRef]
- Munawir, T.I.T.; Abu Samah, A.A.; Rosle, M.A.A.; Azlis-Sani, J.; Hasnan, K.; Sabri, S.; Ismail, S.; Yunos, M.N.A.M.; Bin, T.Y. A Comparison Study on the Assessment of Ride Comfort for LRT Passengers. IOP Conf. Ser. Mater. Sci. Eng. 2017, 226, 012039. [Google Scholar] [CrossRef]
- Dumitriu, M.; Stănică, D.I. Study on the evaluation methods of the vertical ride comfort of railway vehicle—Mean comfort method and sperling’s method. Appl. Sci. 2021, 11, 3953. [Google Scholar] [CrossRef]
- Schust, M.; Blüthner, R.; Seidel, H. Examination of perceptions (intensity, seat comfort, effort) and reaction times (brake and accelerator) during low-frequency vibration in x- or y-direction and biaxial (xy-) vibration of driver seats with activated and deactivated suspension. J. Sound. Vib. 2006, 298, 606–626. [Google Scholar] [CrossRef]
- Hong, K.-T.; Hwang, S.-H.; Hong, K.-S. Automotive Ride-Comfort Improvement with an Air Cushion Seat. In Proceedings of the SICE Annual Conference, Fukui University, Fukui, Japan, 4–6 August 2003; pp. 2043–2048. [Google Scholar]
- Bonin, G.; Cantisani, G.; Loprencipe, G.; Sbrolli, M. Ride Quality Evaluation: 8 D.O.F. Vehicle Model Calibration. In Proceedings of the 4th INTERNATIONAL SIIV CONGRESS, Palermo, Italy, 12–14 September 2007. [Google Scholar]
- Gong, W.; Griffin, M.J. Measuring, evaluating and assessing the transmission of vibration through the seats of railway vehicles. Proc. Inst. Mech. Eng. F J. Rail. Rapid Transit. 2018, 232, 384–395. [Google Scholar] [CrossRef]
- Van der Westhuizen, A.; Van Niekerk, J.L. Verification of seat effective amplitude transmissibility (SEAT) value as a reliable metric to predict dynamic seat comfort. J. Sound Vib. 2006, 295, 1060–1075. [Google Scholar] [CrossRef]
- Basri, B.; Griffin, M.J. The application of SEAT values for predicting how compliant seats with backrests influence vibration discomfort. Appl. Ergon. 2014, 45, 1461–1474. [Google Scholar] [CrossRef]
- Patelli, G.; Griffin, M.J. Effects of seating on the discomfort caused by mechanical shocks: Measurement and prediction of SEAT values. Appl. Ergon. 2019, 74, 134–144. [Google Scholar] [CrossRef]
- Van Niekerk, J.L.; Pielemeier, W.J.; Greenberg, J.A. The use of seat effective amplitude transmissibility (SEAT) values to predict dynamic seat comfort. J. Sound Vib. 2003, 260, 867–888. [Google Scholar] [CrossRef]
- Montenegro, P.; Ribeiro, D.; Ortega, M.; Millanes, F.; Goicolea, J.; Zhai, W.; Calçada, R. Impact of the train-track-bridge system characteristics in the runnability of high-speed trains against crosswinds—Part II: Riding comfort. J. Wind Eng. Ind. Aerodyn. 2022, 224, 104987. [Google Scholar] [CrossRef]
- Tufano, S.; Griffin, M. Nonlinearity in the vertical transmissibility of seating: The role of the human body apparent mass and seat dynamic stiffness. Veh. Syst. Dyn. 2013, 51, 122–138. [Google Scholar] [CrossRef]
- Harris, C.; Piersol, A. Harris’ Shock and Vibration Handbook; McGraw-Hill: New York, NY, USA, 2002. [Google Scholar]
- Chaffin, D.; Anderson, G.; Martin, B. Occupational Biomechanics; John Wiley & Sons: New York, NY, USA, 1999. [Google Scholar]
- Bruel & Kjaer. Primer: Human Vibration, Booklet; K. Larsen & Son: Naerum, Denmark, 1989. [Google Scholar]
- Zhang, X.; Qiu, Y.; Griffin, M. Transmission of vertical vibration through a seat: Effect of thickness of foam cushions at the seat pan and the backrest. Int. J. Ind. Ergon. 2015, 48, 36–45. [Google Scholar] [CrossRef]
- White, S.W.; Kim, S.K.; Bajaj, A.K.; Davies, P.; Showers, D.K.; Liedtke, P.E. Experimental techniques and identification of nonlinear and viscoelastic properties of flexible polyurethane foam. Nonlinear Dyn. 2000, 22, 281–313. [Google Scholar] [CrossRef]
- Wei, L.; Griffin, M. The prediction of seat transmissibility from measures of seat impedance. J. Sound Vib. 1998, 214, 121–137. [Google Scholar] [CrossRef]
- Varterasian, J.; Thompson, R. The dynamic characteristics of automobile seats with human occupants. SAE Transactions 1977, 86, 1173–1182. [Google Scholar]
- Toward, M.G.R.; Griffin, M.J. The transmission of vertical vibration through seats: Influence of the characteristics of the human body. J. Sound Vib. 2011, 330, 6526–6543. [Google Scholar] [CrossRef]
- Ribeiro, D.; Calçada, R.; Delgado, R.; Brehm, M.; Zabel, V. Finite-element model calibration of a railway vehicle based on experimental modal parameters. Veh. Syst. Dyn. 2013, 51, 821–856. [Google Scholar] [CrossRef]
- Ribeiro, D.; Costa, B.; Cruz, L.; Oliveira, M.; Alves, V.; Montenegro, P.; Calçada, R. Simulation of the Dynamic Behavior of a Centenary Metallic Bridge under Metro Traffic Actions Based on Advanced Interaction Models. Int. J. Struct. Stab. Dyn. 2021, 21, 2150057. [Google Scholar] [CrossRef]
- Silva, P.; Ribeiro, D.; Mendes, J.; Seabra, E. Modal Identification of Train Passenger Seats Based on Dynamic Tests and Output-Only Techniques. Appl. Sci. 2023, 13, 2277. [Google Scholar] [CrossRef]
- Ebe, K.; Griffin, M.J. Qualitative models of seat discomfort including static and dynamic factors. Ergonomics 2000, 43, 771–790. [Google Scholar] [CrossRef]
- Neal, B.L. Dynamic Property Response of Polyurethane Foam as a Function of Test Frequency. J. Mater. Manuf. 2001, 110, 168–177. [Google Scholar] [CrossRef]
- Choi, H.J.; Kim, J.H. Static and dynamic comfort properties of polyurethane foams including a flexible amine crosslinker. J. Ind. Eng. Chem. 2020, 90, 260–265. [Google Scholar] [CrossRef]
- Park, S.J.; Min, S.N.; Lee, H.; Subramaniyam, M.; Suh, W.S. Express Train Seat Discomfort Evaluation using Body Pressure and Anthropometric Data. J. Ergon. Soc. Korea 2014, 33, 215–227. [Google Scholar] [CrossRef]
- Xu, Z.; Yuan, Q.; Huang, S.; Zhang, Z.; He, Y. Analysis of partial-body and whole-body static sitting comfort. J. Vibroengineering 2017, 19, 3797–3808. [Google Scholar] [CrossRef]
- Hu, L.; Tor, O.; Duan, P.; Zhang, J.; Xu, X. Effect of Body Mass Index on Sitting Pressure Distribution on Seat Cushion. In Advances in Ergonomics in Design Proceedings of the AHFE; Rebelo, F., Soares, M., Eds.; Springer: Orlando, FL, USA, 2018. [Google Scholar] [CrossRef]
- Kyung, G.; Nussbaum, M.A. Driver sitting comfort and discomfort (part II): Relationships with and prediction from interface pressure. Int. J. Ind. Ergon. 2008, 38, 526–538. [Google Scholar] [CrossRef]
- Peng, Y.; Sun, D.; Fan, C.; Wu, Z.; Yi, S.; Peng, Y.; Liu, Y. Research on the comfort degradation mechanism of high-speed railway passengers: A field study using dynamic interface pressure. Transp. Saf. Environ. 2022, 4, 1–13. [Google Scholar] [CrossRef]
- Ciaccia, F.R.D.A.S.; Sznelwar, L.I. An approach to aircraft seat comfort using interface pressure mapping. Work 2012, 41, 240–245. [Google Scholar] [CrossRef]
- Stinson, M.D.; Porter-Armstrong, A.; Eakin, P. Seat-interface pressure: A pilot study of the relationship to gender, body mass index, and seating position. Arch. Phys. Med. Rehabil. 2003, 84, 405–409. [Google Scholar] [CrossRef]
- Kärki, S.; Lekkala, J. Pressure Mapping System for Physiological Measurements. In Proceedings of the 18th IMEKO World Congress 2006: Metrology for a Sustainable Development, Rio de Janeiro, Brazil, 17–22 September 2006; Volume 3, pp. 2247–2251. [Google Scholar]
- Akgunduz, A.; Rakheja, S.; Tarczay, A. Distributed occupant-seat interactions as an objective measure of seating comfort. Int. J. Veh. Des. 2014, 65, 293. [Google Scholar] [CrossRef]
- ISO 2439; Flexible cellular polymeric materials—Determination of hardness (indentation technique). International Standard Organization: Geneva, Switzerland, 2009.
- Tang, Z.; Liu, Z.; Tang, Y.; Dou, J.; Xu, C.; Wang, L. Model construction and analysis of ride comfort for high-speed railway seat cushions. Work 2021, 68, S223–S229. [Google Scholar] [CrossRef] [PubMed]
- Hirao, A.; Naito, S.; Yamazaki, N. Pressure Sensitivity of Buttock and Thigh as a Key Factor for Understanding of Sitting Comfort. Appl. Sci. 2022, 12, 7363. [Google Scholar] [CrossRef]
Figure 1.
Information flow diagram through the steps of the systematic review process [11].
Figure 1.
Information flow diagram through the steps of the systematic review process [11].
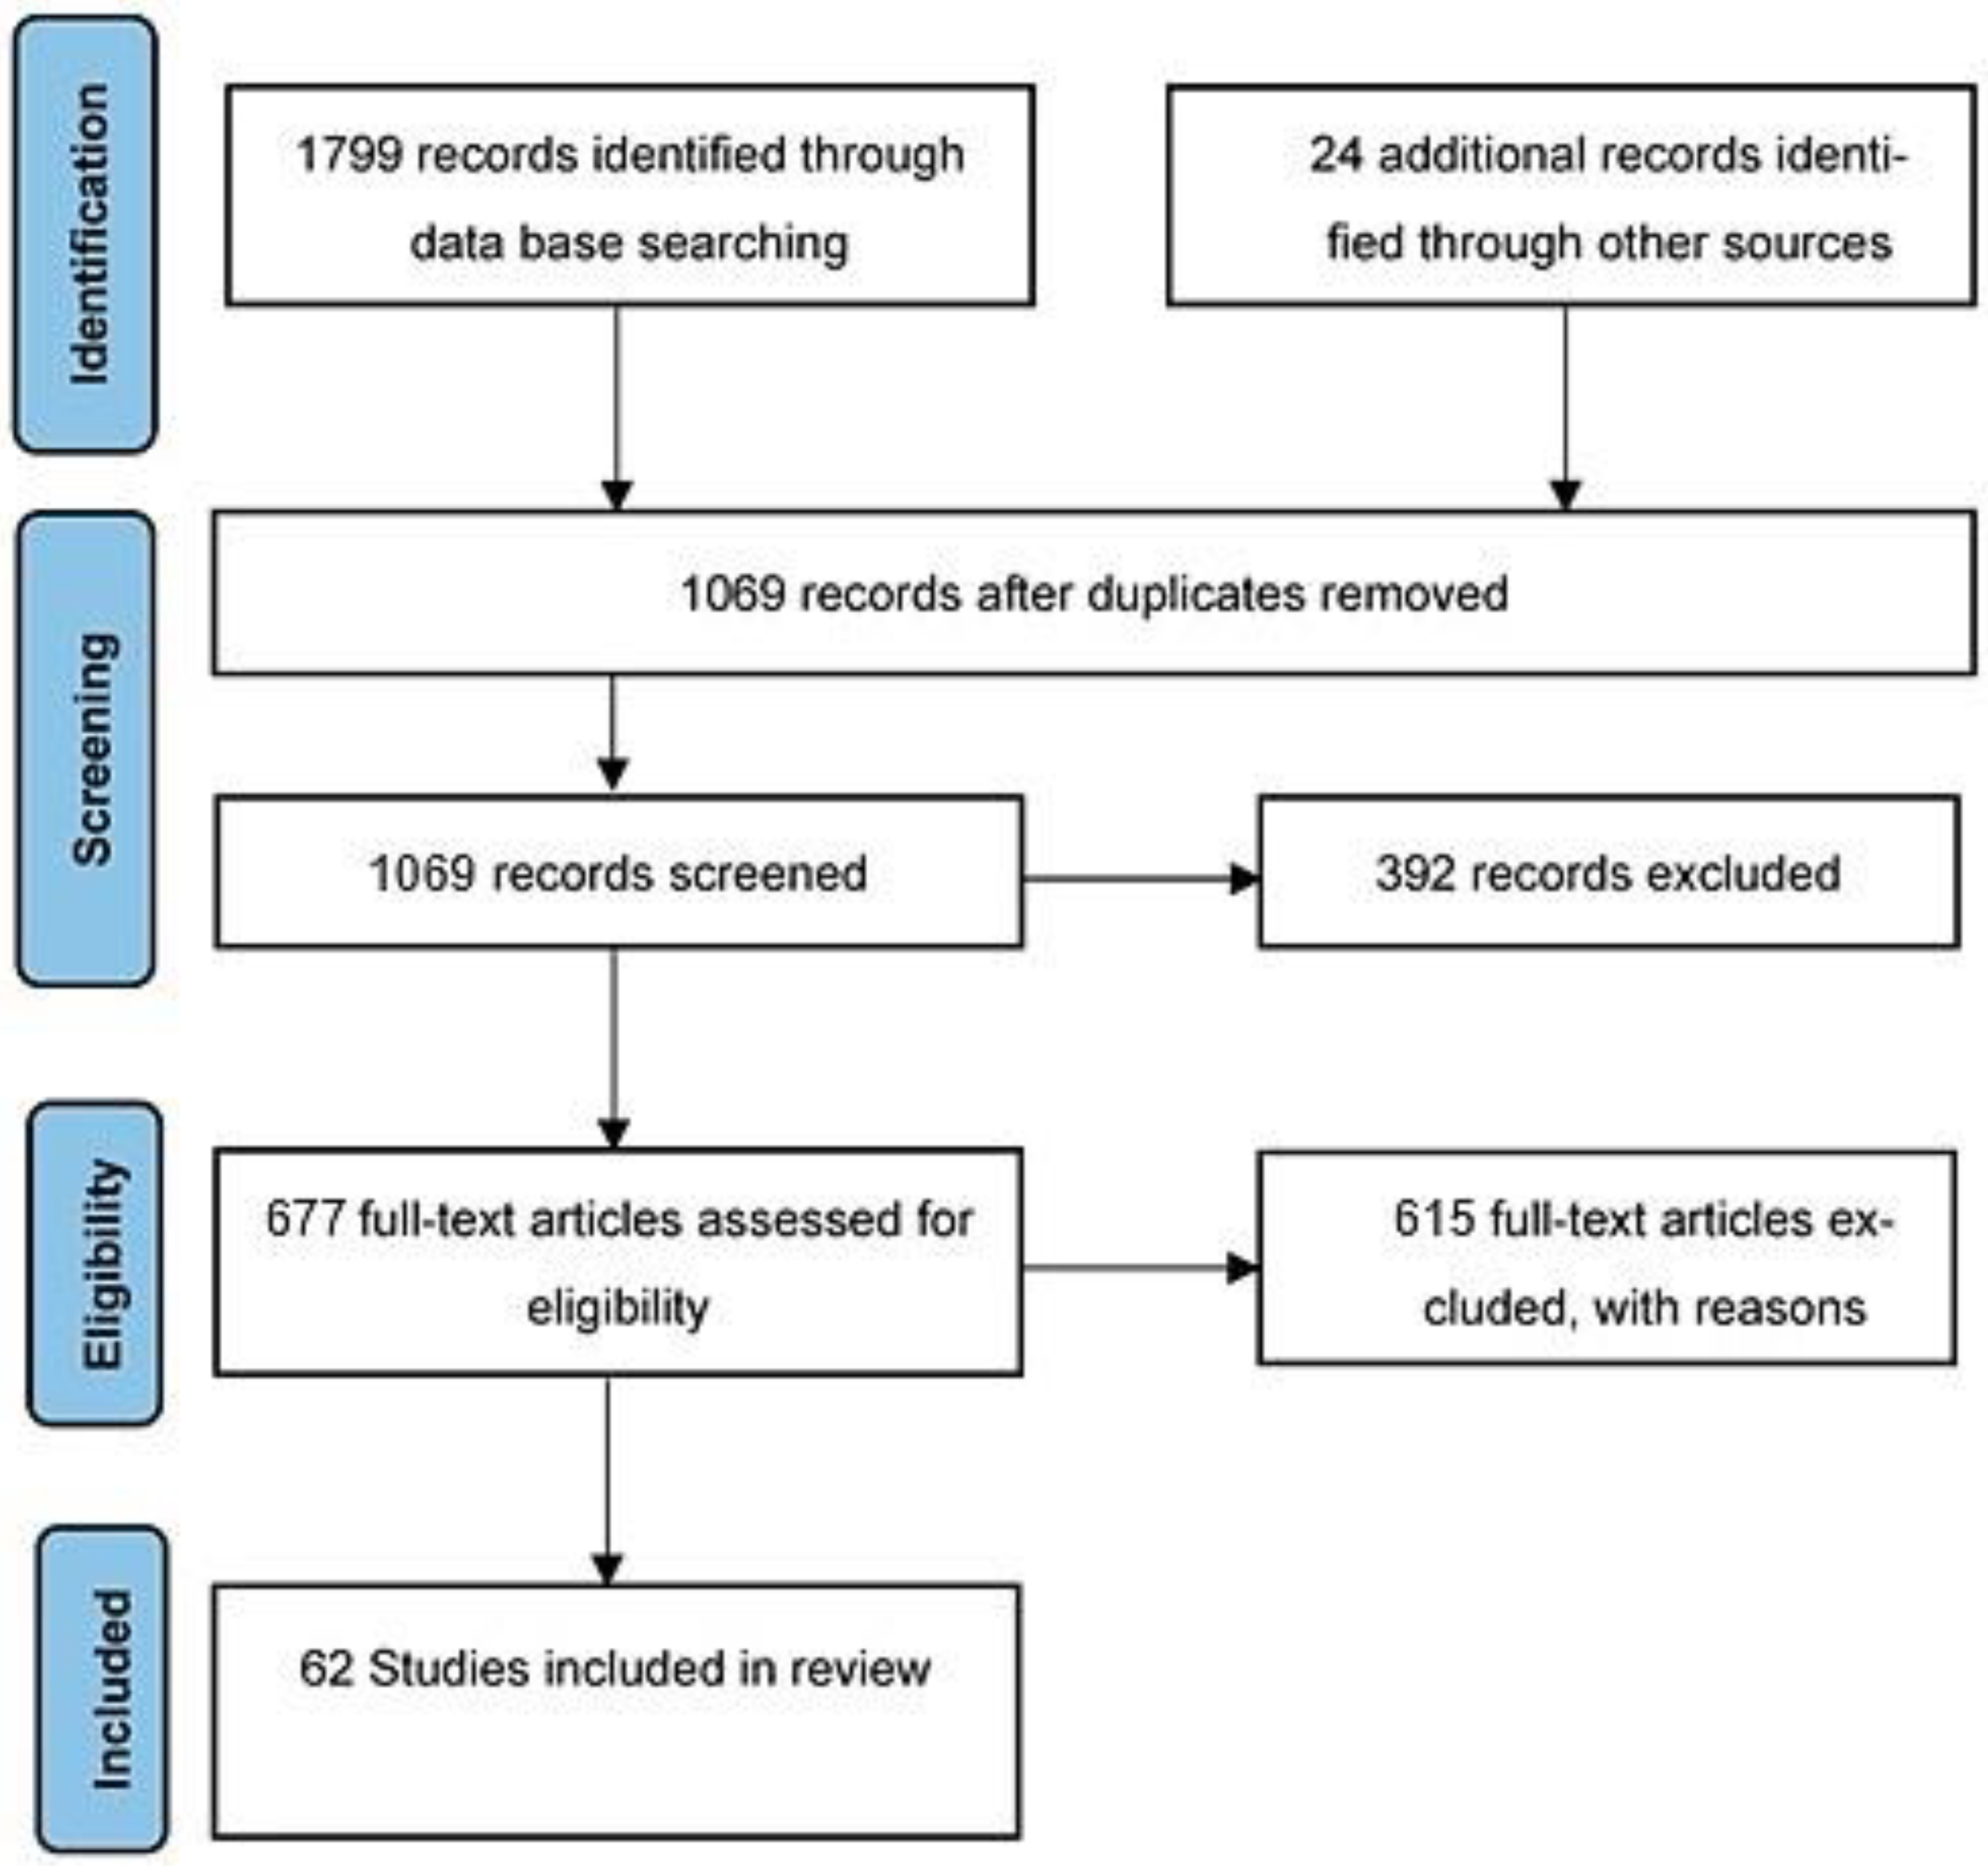
Figure 2.
Vehicle model used by Dimitriu and Stanica [34].
Figure 2.
Vehicle model used by Dimitriu and Stanica [34].
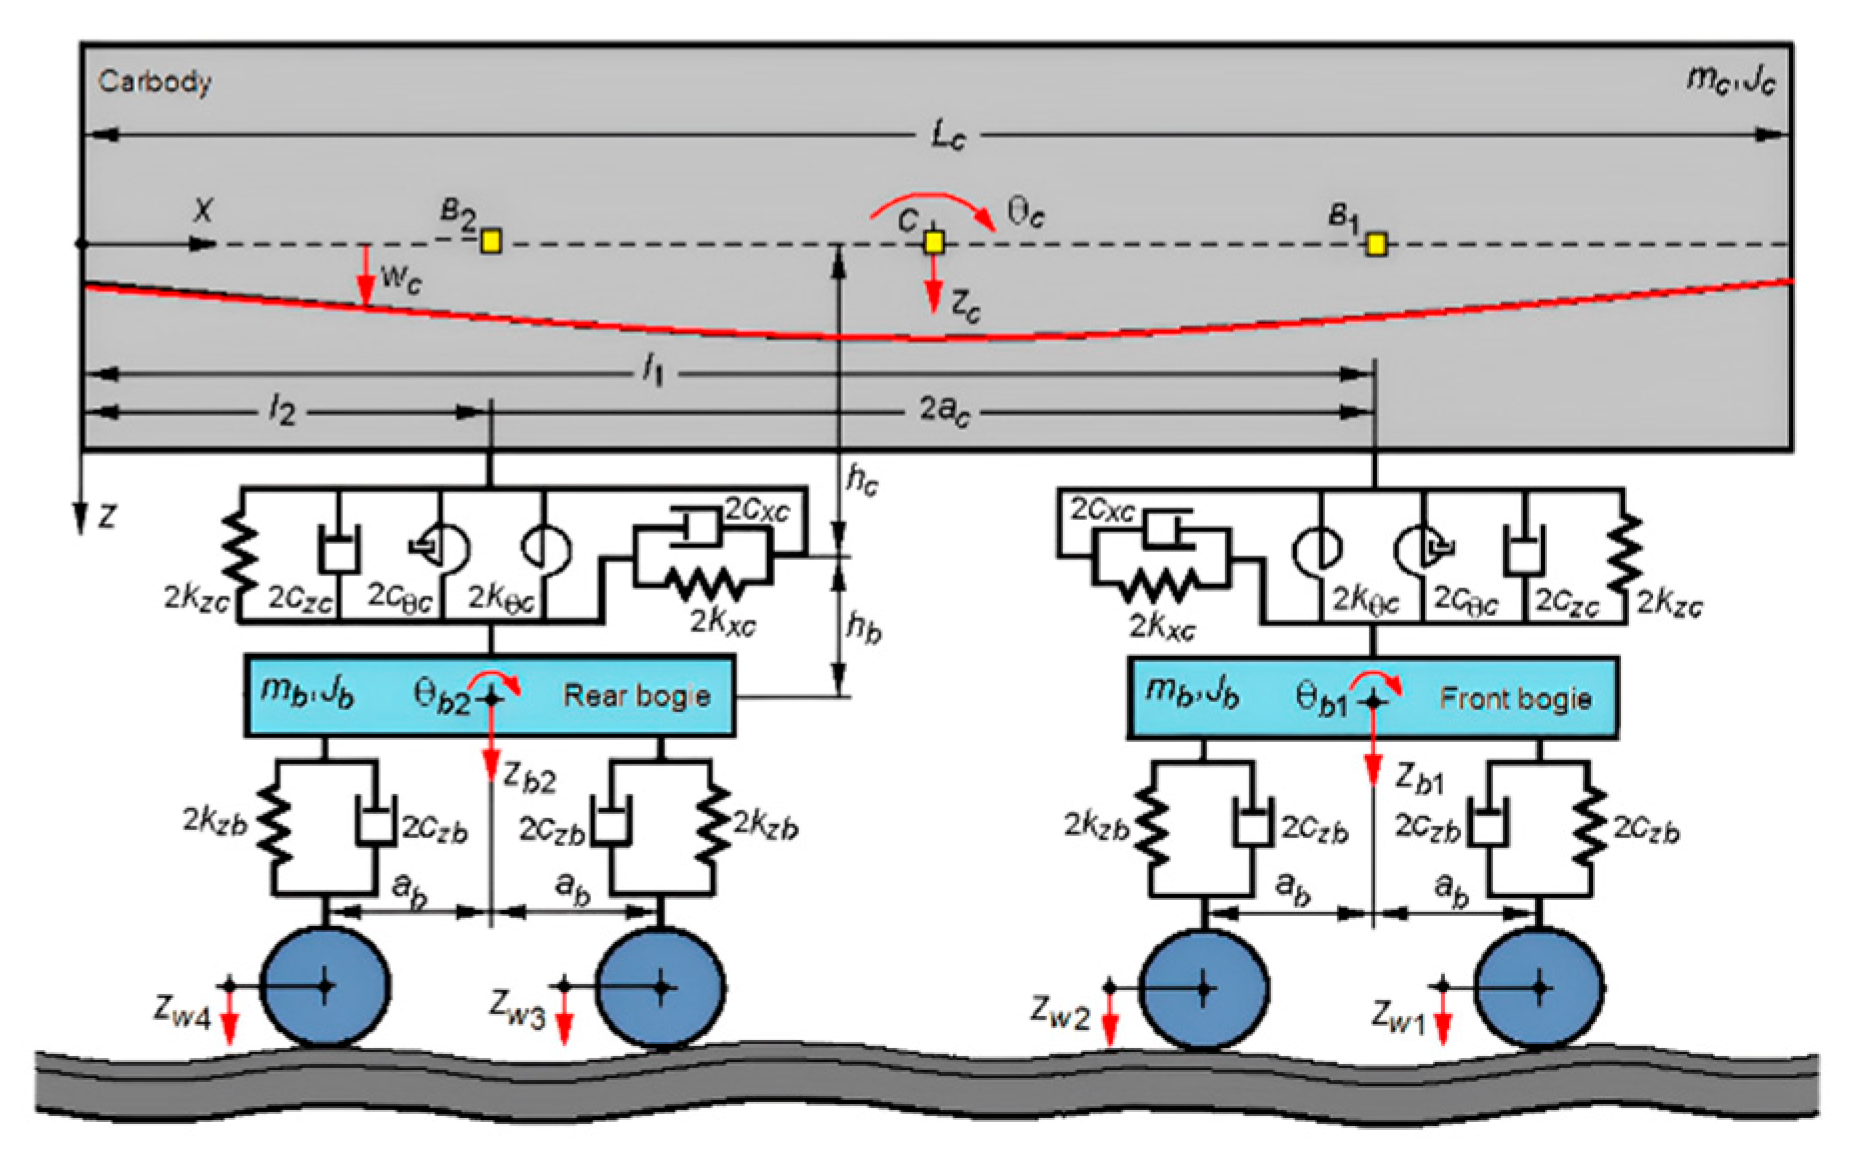
Figure 3.
Transmissibility experimental setup used in laboratory experiments with seat simplification (adapted from [48]).
Figure 3.
Transmissibility experimental setup used in laboratory experiments with seat simplification (adapted from [48]).
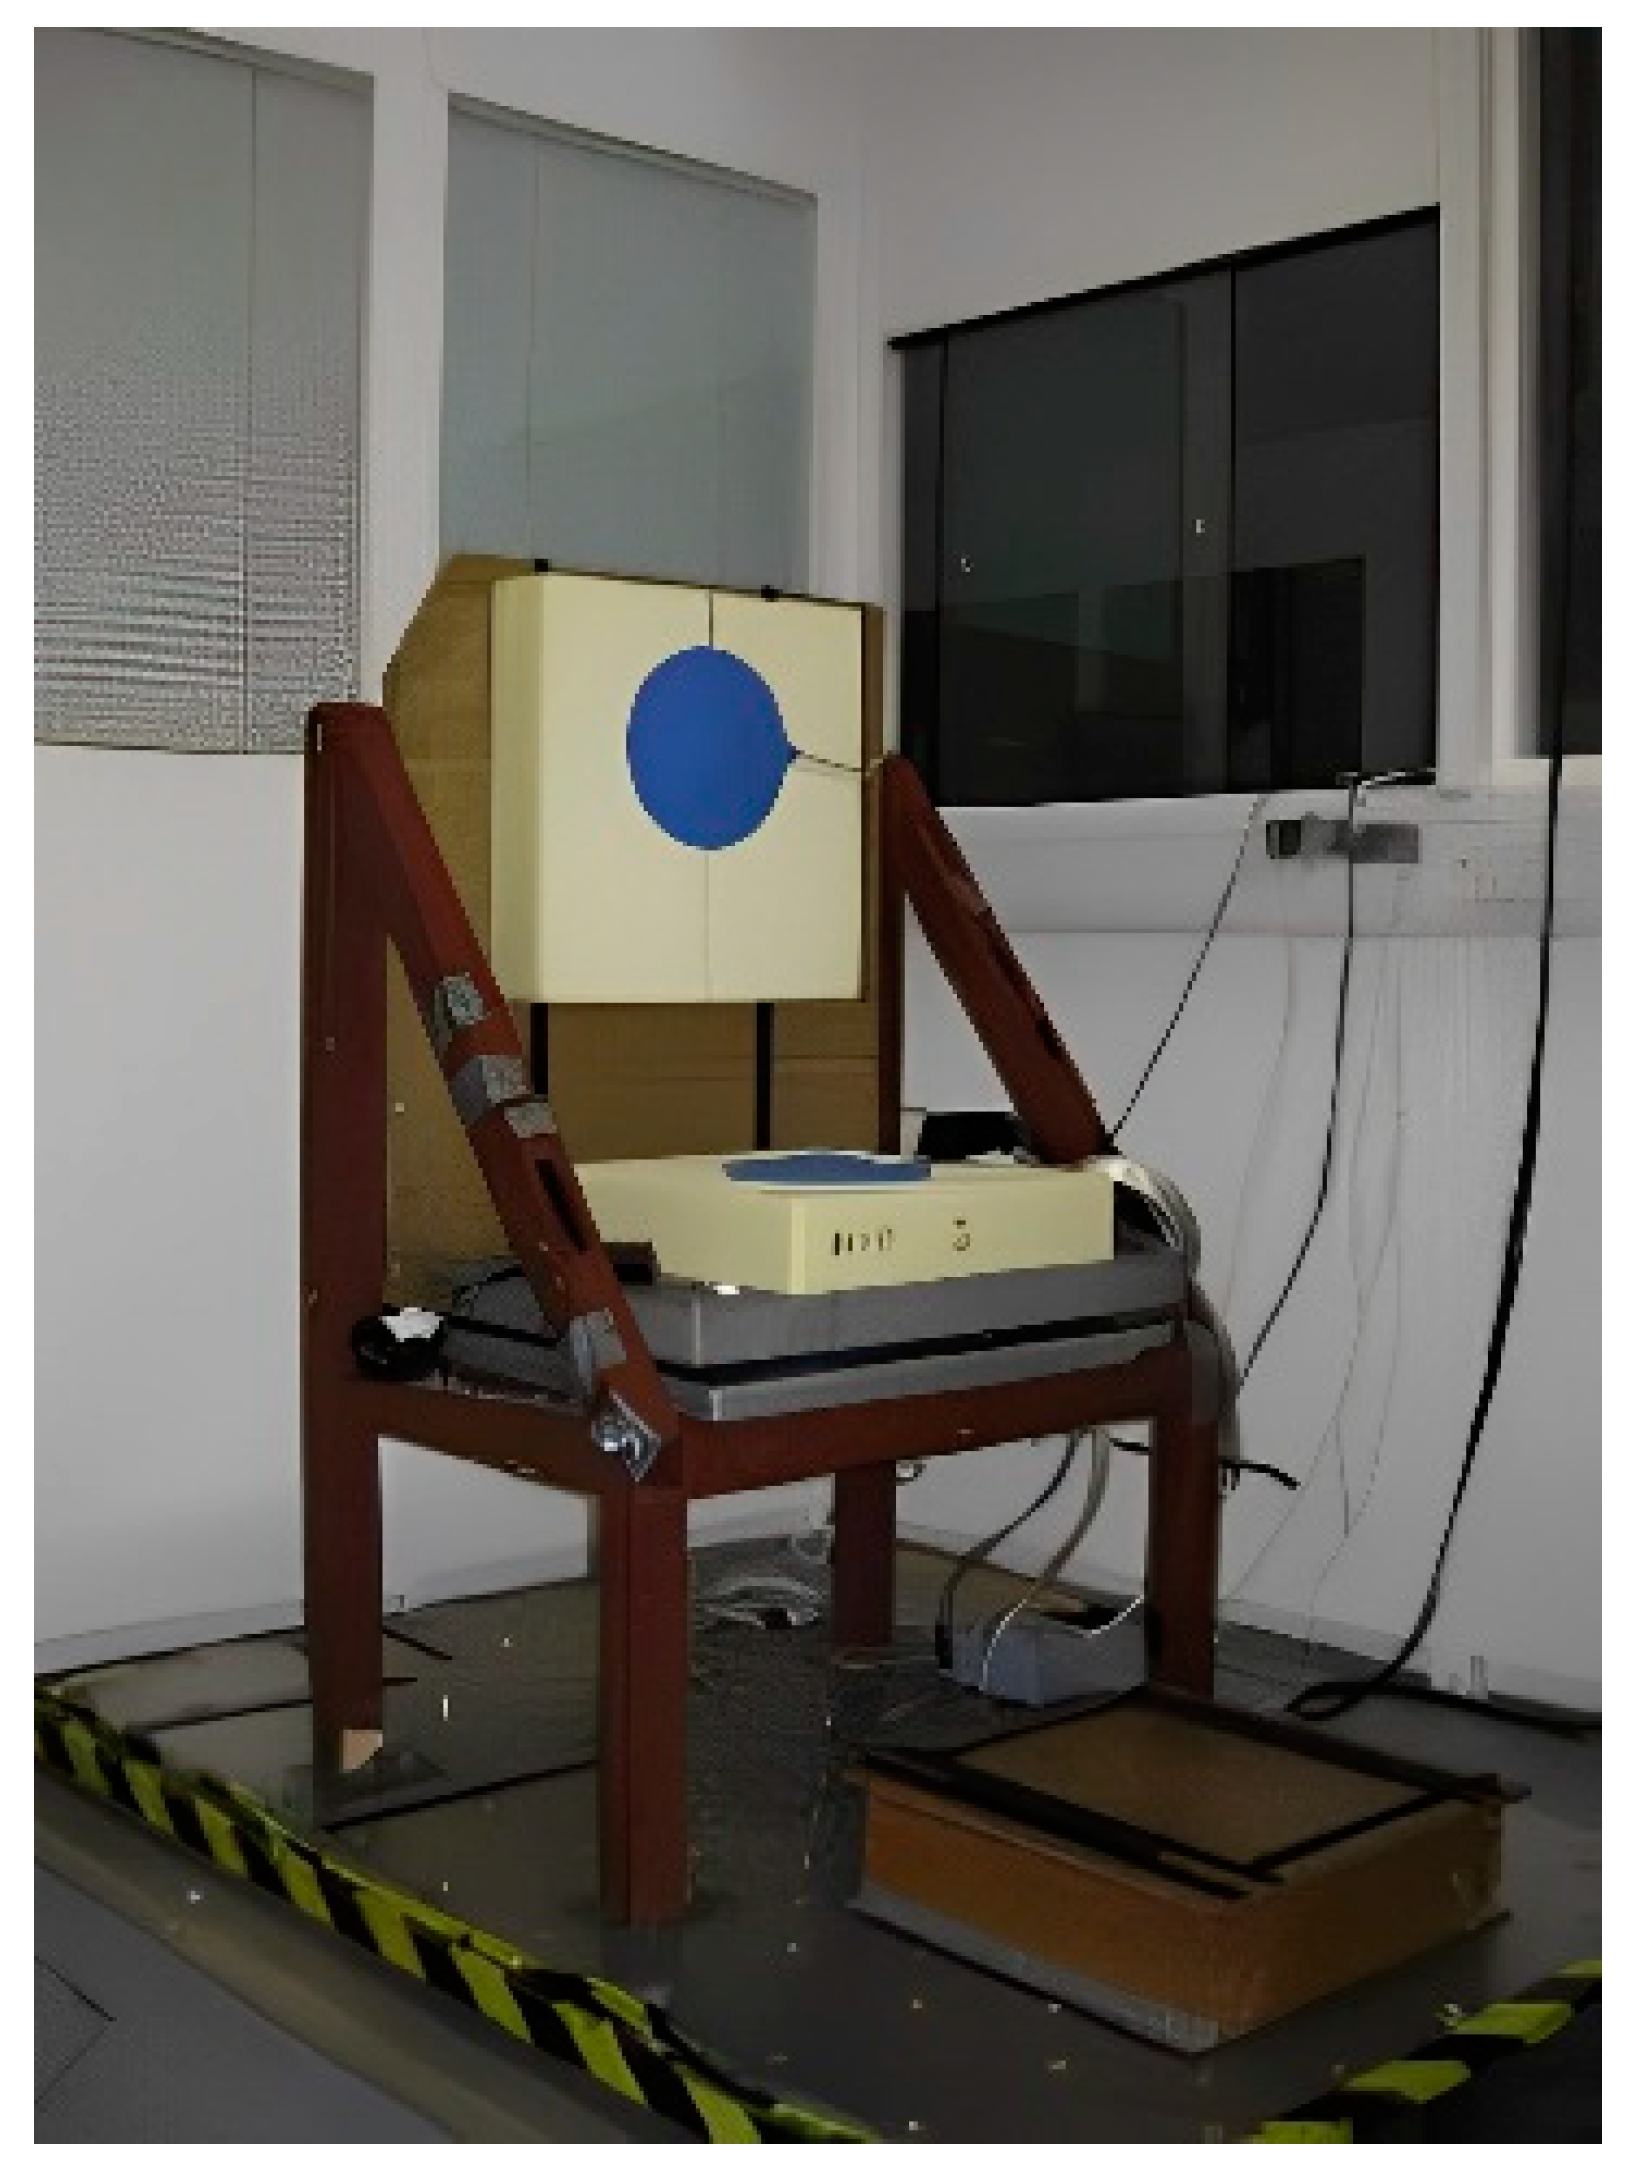
Figure 4.
Transmissibility experimental setup applied in real train environment experiments: (a) Ribeiro et al. [53] setup; (b) Silva et al. [55] expanded setup.

Figure 5.
Foam vibration transmissibility evaluation due to the influence of crosslinking agents (adapted from [58]).
Figure 5.
Foam vibration transmissibility evaluation due to the influence of crosslinking agents (adapted from [58]).
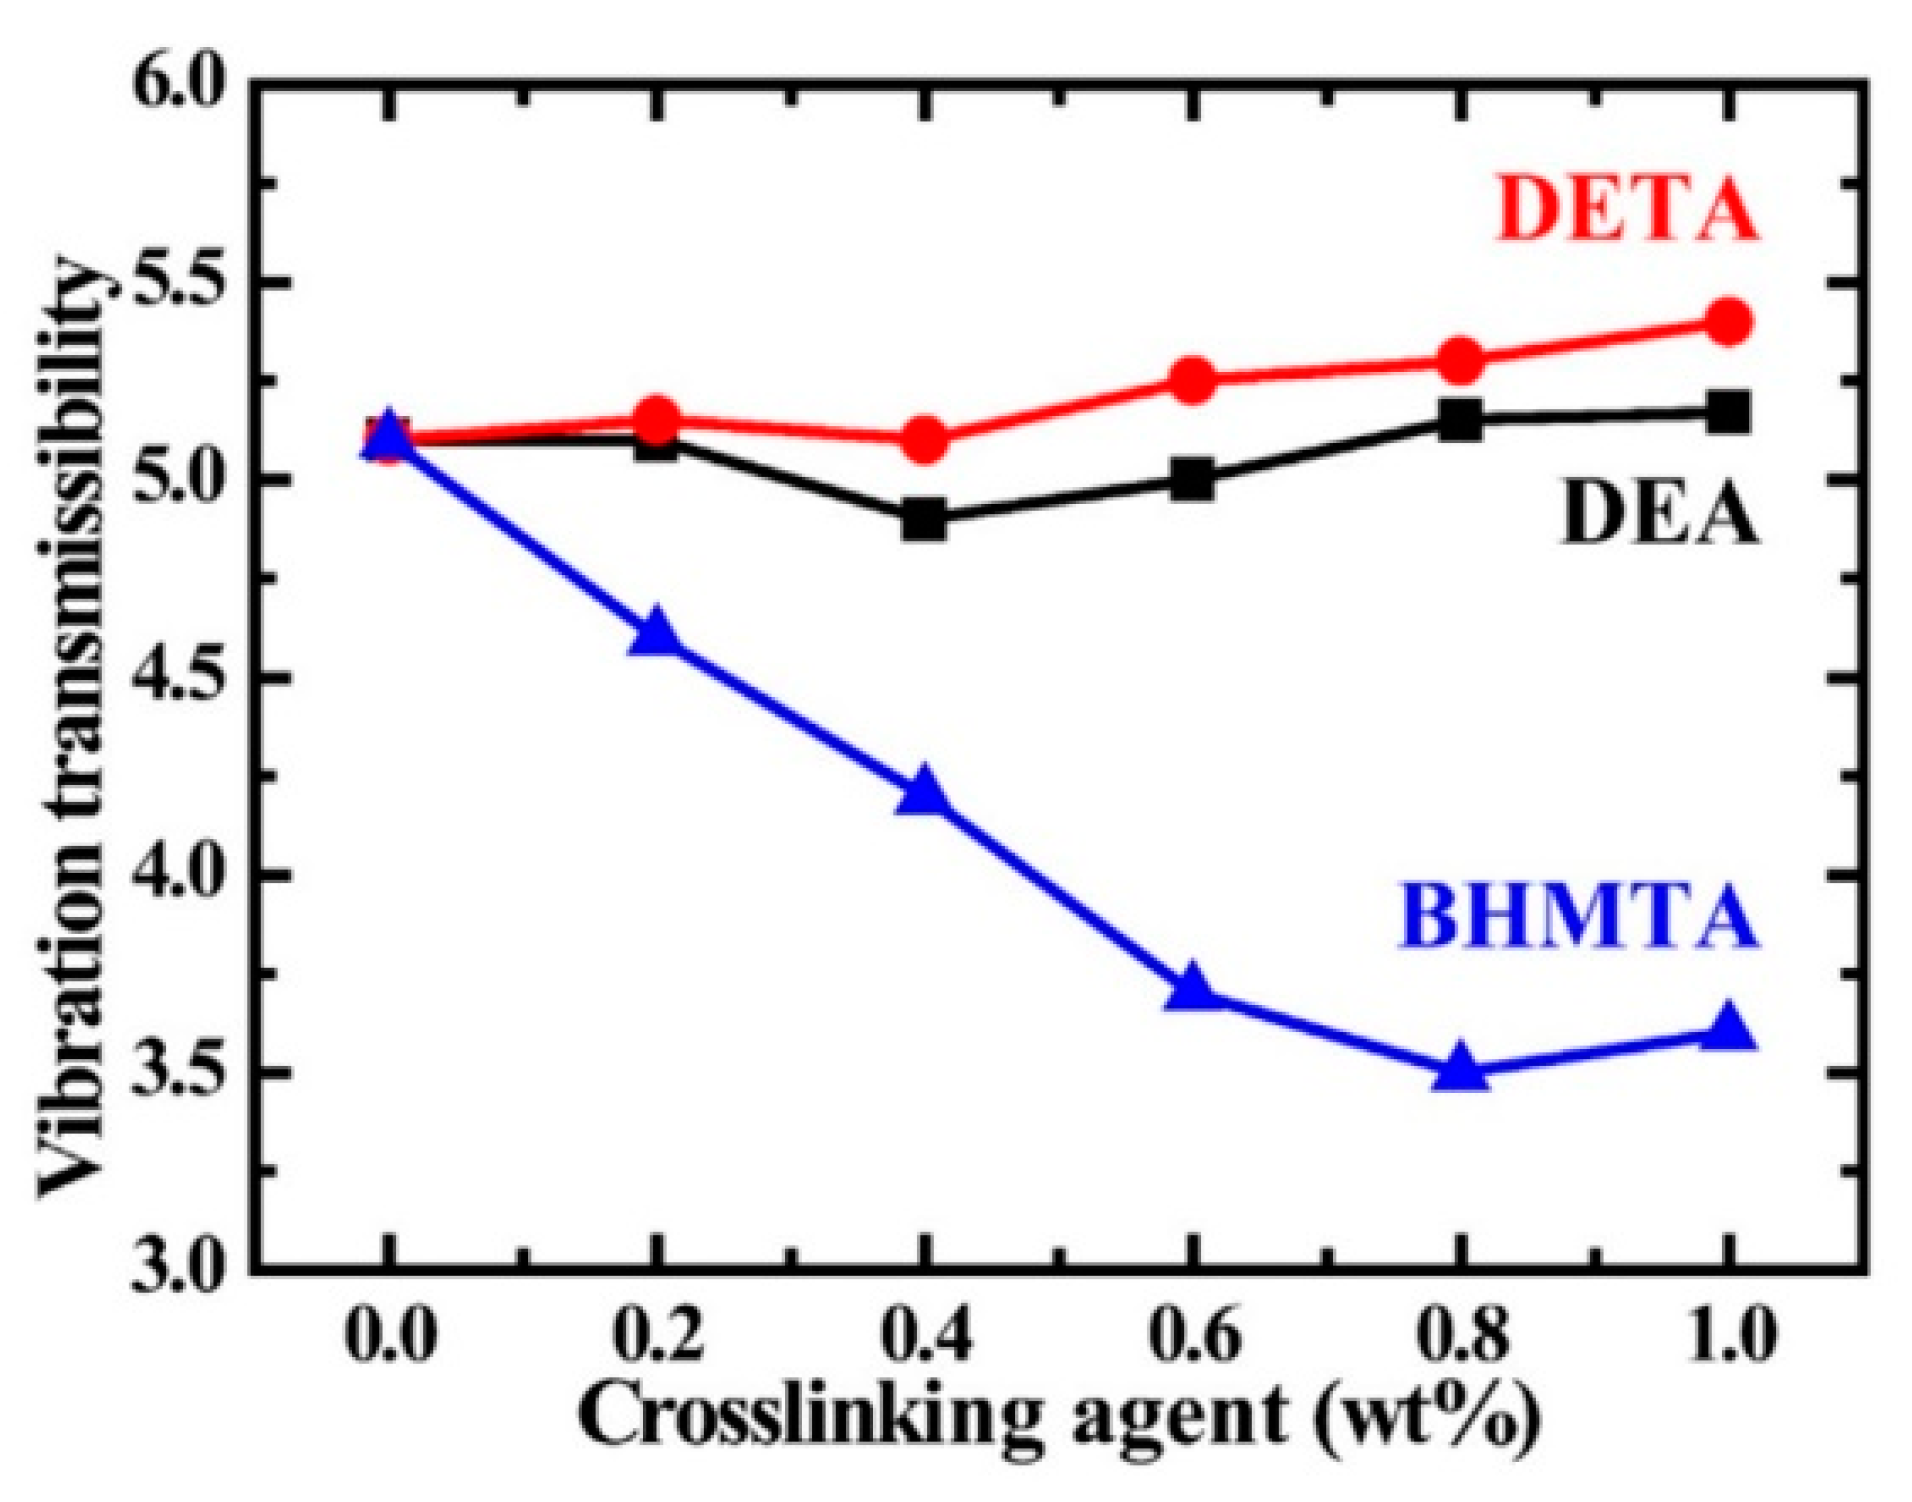
Figure 6.
Interface pressure experiments (a) typical body pressure distribution (adapted from [60]); (b) the experimental setup employed by Peng et al. [63] on a Chinese high-speed rail 2nd class seat.

Figure 7.
Influence of a crosslinking agent on hysteresis loss evaluation (adapted from [58]).
Figure 7.
Influence of a crosslinking agent on hysteresis loss evaluation (adapted from [58]).
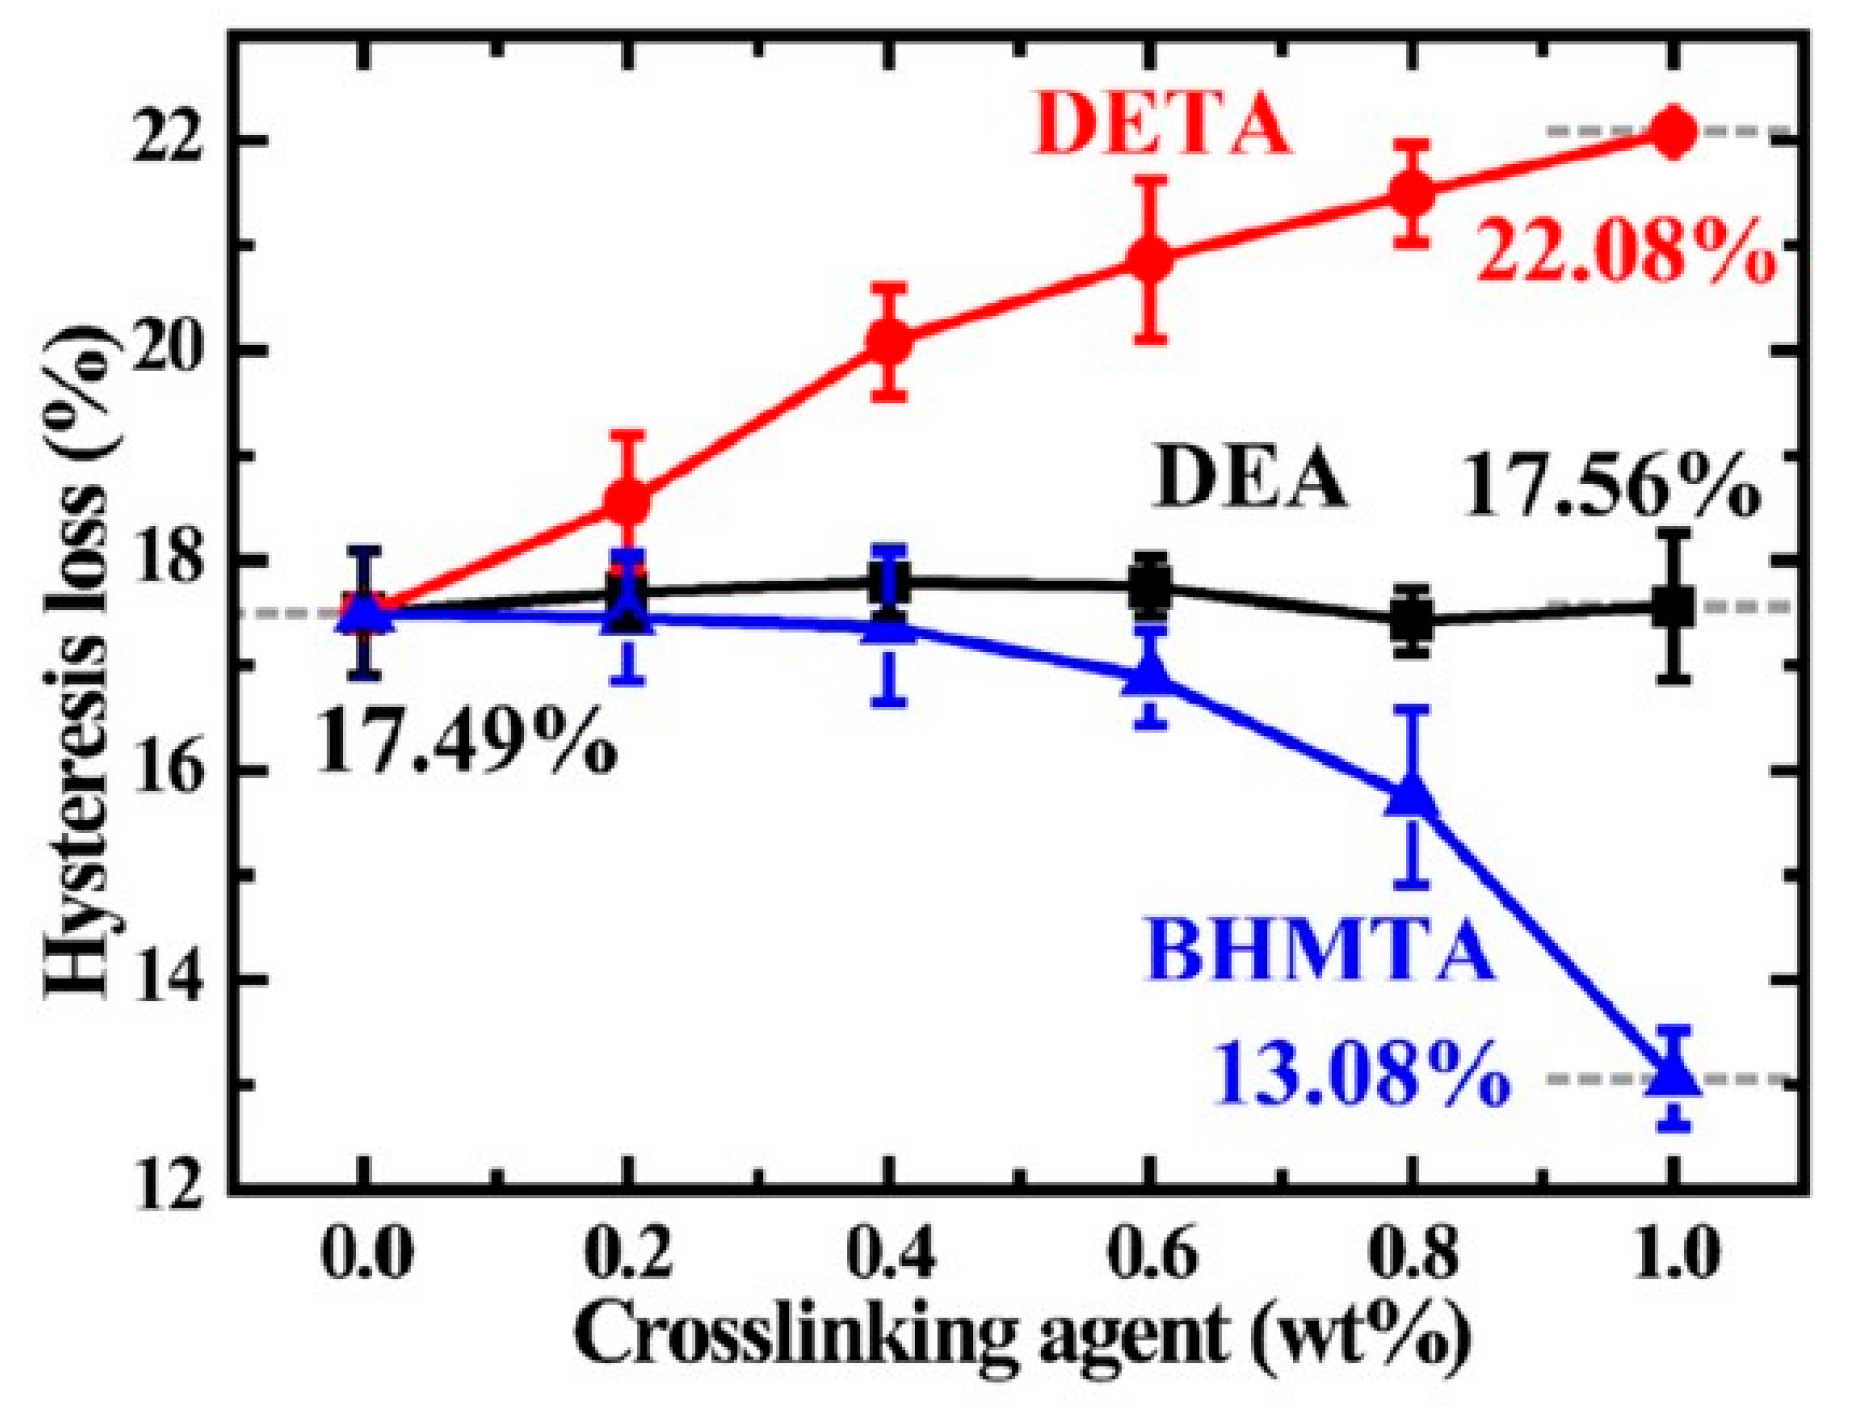
Table 1.
Weighting curves and multiplying factors are applied following the comfort approach for a seated passenger as defined by ISO 2631.
Table 1.
Weighting curves and multiplying factors are applied following the comfort approach for a seated passenger as defined by ISO 2631.
| X-Axis | Y-Axis | Z-Axis | |
|---|---|---|---|
| Floor | Wk and kx = 0.25 | Wk and ky = 0.25 | Wk and kz = 0.40 |
| Seat surface | Wd and kx = 1.0 | Wd and ky = 1.0 | Wk and kz = 1.0 |
| Seatback | Wc and kx = 0.80 | Wd and ky = 0.50 | Wd and kz = 0.40 |
Table 2.
ISO 2631 comfort evaluation scale.
| Ride Comfort | |
|---|---|
| ≤0.315 | Not uncomfortable |
| 0.5–0.63 | Little uncomfortable |
| 0.63–0.8 | Little uncomfortable to fairly uncomfortable |
| 0.8–1.0 | Fairly uncomfortable to uncomfortable |
| 1.0–1.25 | Uncomfortable |
| 1.25–1.6 | Uncomfortable to very uncomfortable |
| 1.6–2.0 | Very uncomfortable |
| 2.0–2.5 | Very uncomfortable to extremely uncomfortable |
| ≥2.5 | Extremely uncomfortable |
Table 3.
EN 12299 evaluation scale.
| NMV | Ride Comfort |
|---|---|
| ≤1 | Very comfortable |
| 1–2 | Comfortable |
| 2–4 | Medium |
| 4–5 | Uncomfortable |
| ≥5 | Very uncomfortable |
Table 4.
Sperling’s method comfort evaluation scale.
| Ride Comfort | |
|---|---|
| 1 | Just noticeable |
| 2 | Clearly noticeable |
| 2.5 | More pronounced but not unpleasant |
| 3 | Strong, irregular but still tolerable |
| 3.25 | Very irregular |
| 3.5 | Extremely irregular, unpleasant, annoying; prolonged exposure intolerable |
| 4 | Extremely unpleasant; prolonged exposure harmful |
Disclaimer/Publisher’s Note: The statements, opinions and data contained in all publications are solely those of the individual author(s) and contributor(s) and not of MDPI and/or the editor(s). MDPI and/or the editor(s) disclaim responsibility for any injury to people or property resulting from any ideas, methods, instructions or products referred to in the content. |
© 2023 by the authors. Licensee MDPI, Basel, Switzerland. This article is an open access article distributed under the terms and conditions of the Creative Commons Attribution (CC BY) license (https://creativecommons.org/licenses/by/4.0/).
Share and Cite
MDPI and ACS Style
Silva, P.; Ribeiro, D.; Mendes, J.; Seabra, E.A.R.; Postolache, O. Railways Passengers Comfort Evaluation through Motion Parameters: A Systematic Review. Machines 2023, 11, 465. https://doi.org/10.3390/machines11040465
AMA Style
Silva P, Ribeiro D, Mendes J, Seabra EAR, Postolache O. Railways Passengers Comfort Evaluation through Motion Parameters: A Systematic Review. Machines. 2023; 11(4):465. https://doi.org/10.3390/machines11040465
Chicago/Turabian StyleSilva, Patricia, Diogo Ribeiro, Joaquim Mendes, Eurico Augusto Rodrigues Seabra, and Octavian Postolache. 2023. "Railways Passengers Comfort Evaluation through Motion Parameters: A Systematic Review" Machines 11, no. 4: 465. https://doi.org/10.3390/machines11040465
Note that from the first issue of 2016, this journal uses article numbers instead of page numbers. See further details here.