
Rotor Bar Fault Diagnosis in Indirect Field–Oriented Control-Fed Induction Motor Drive Using Hilbert Transform, Discrete Wavelet Transform, and Energy Eigenvalue Computation

Abstract
:1. Introduction
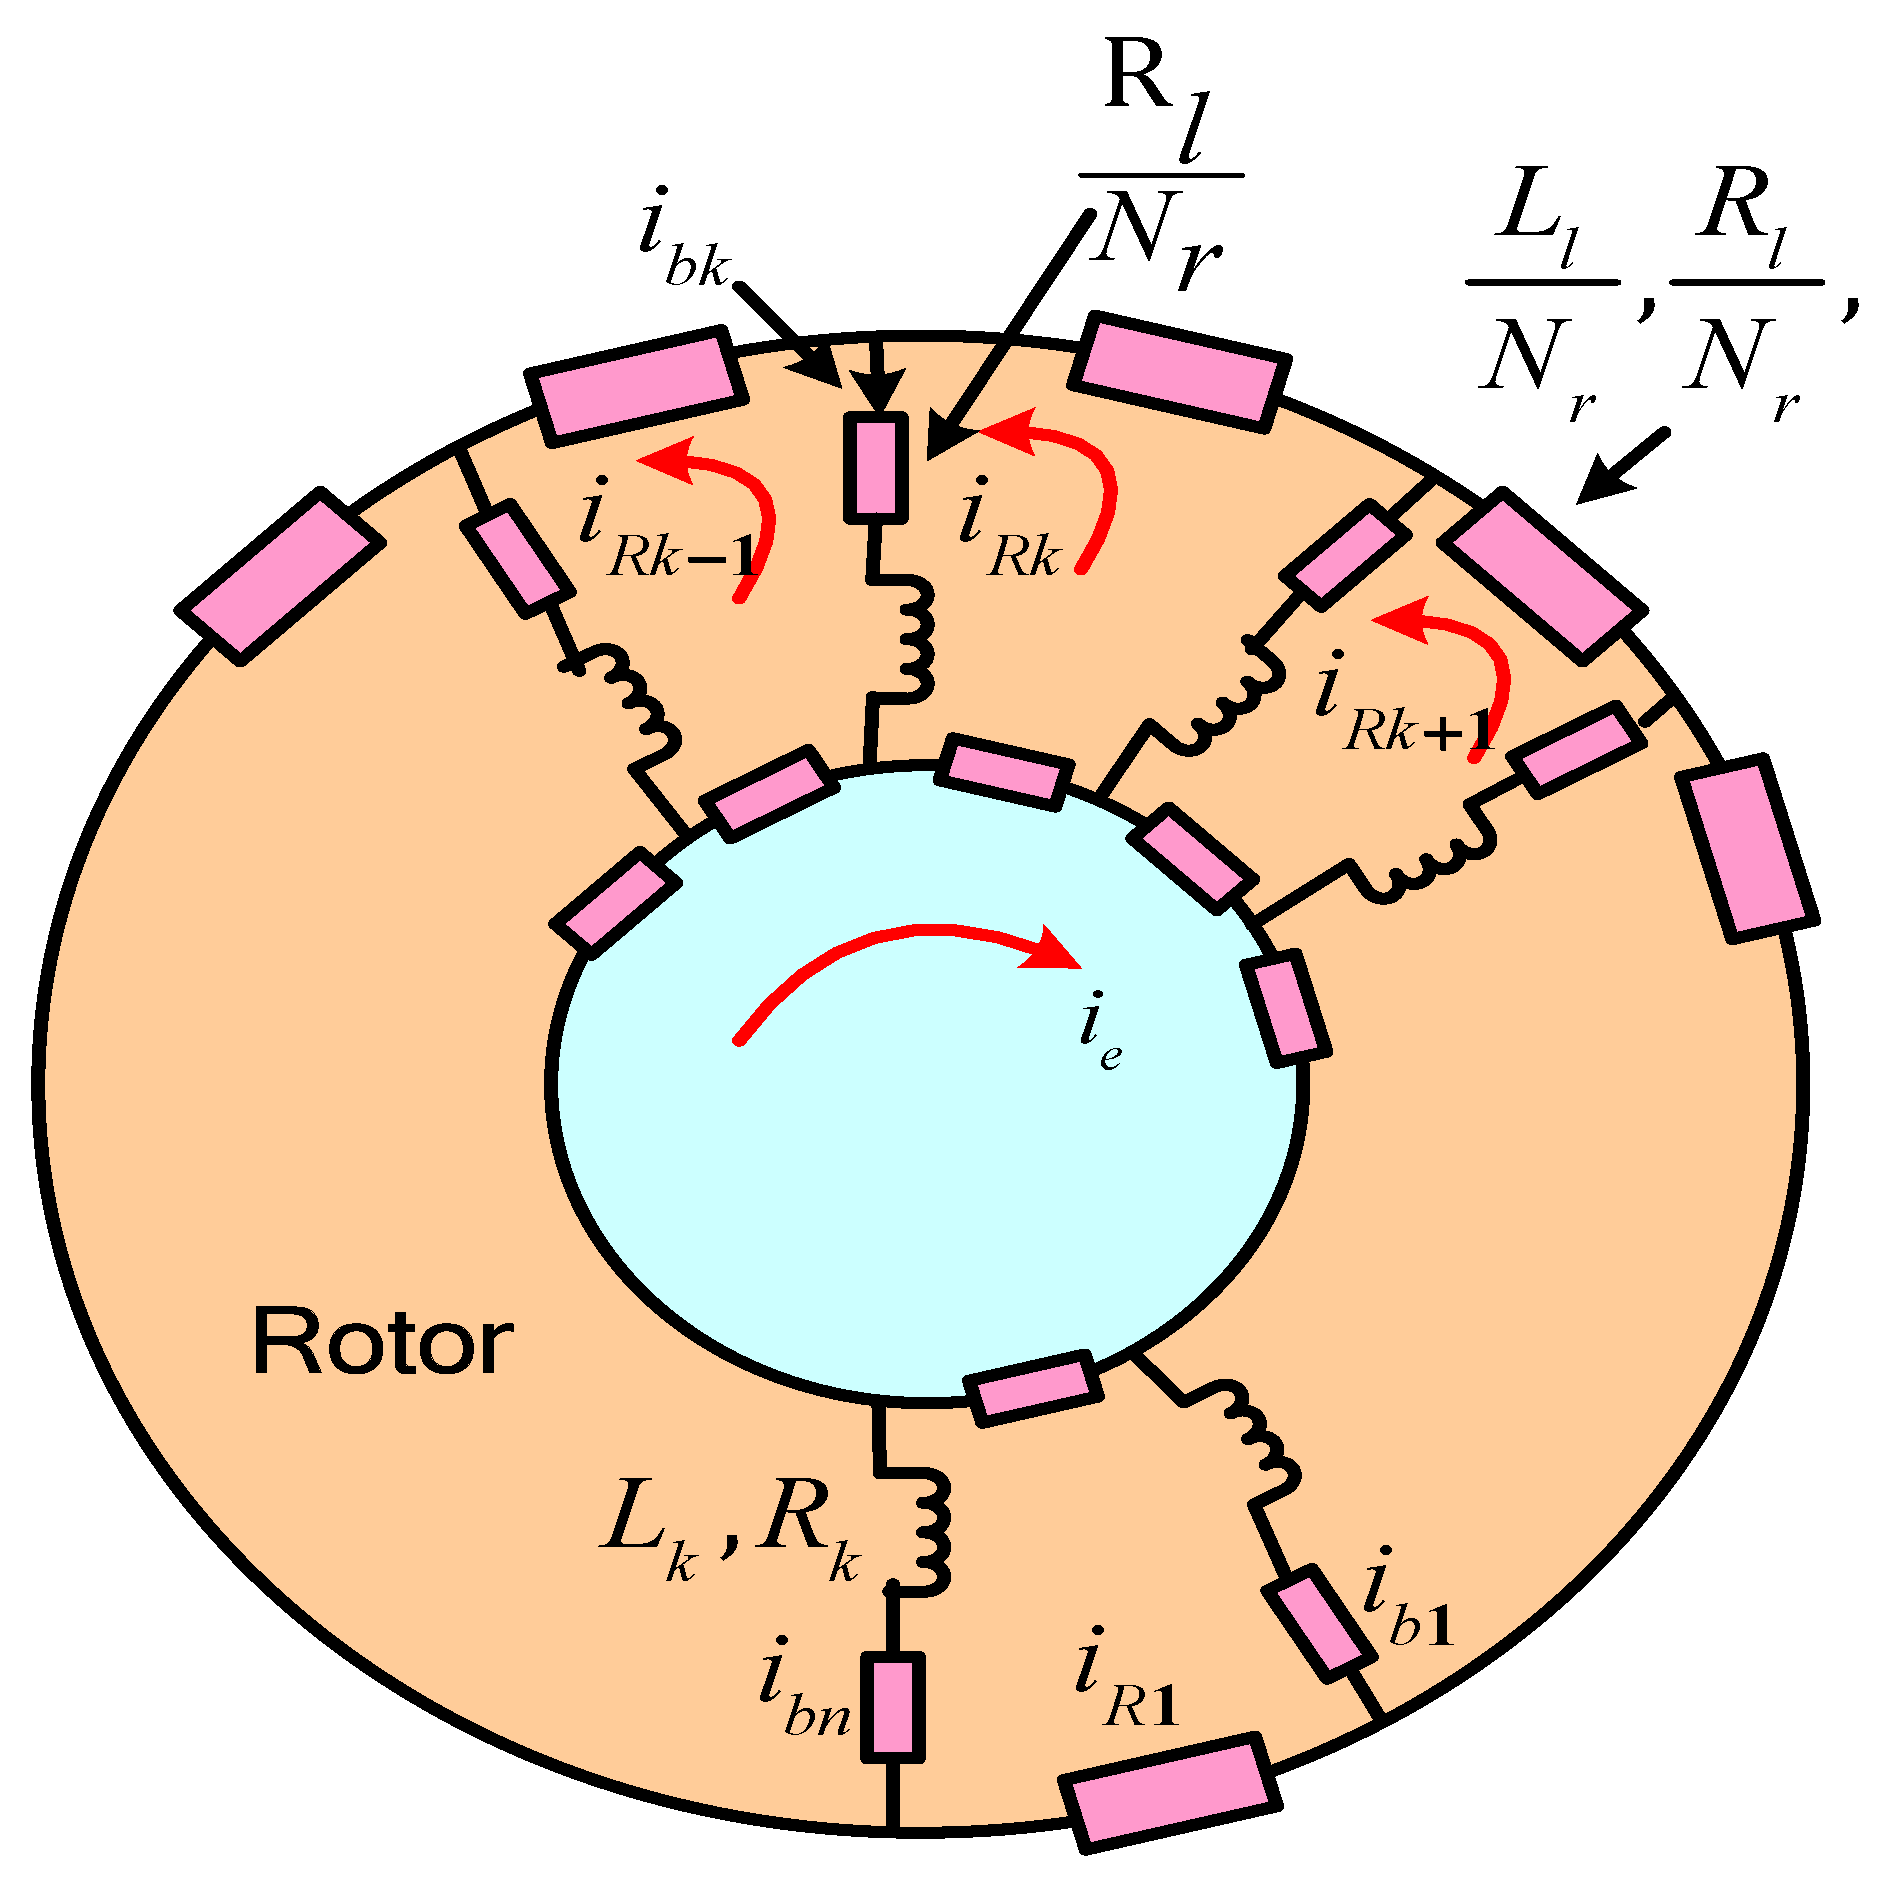
2. Modeling of IM with BRBs
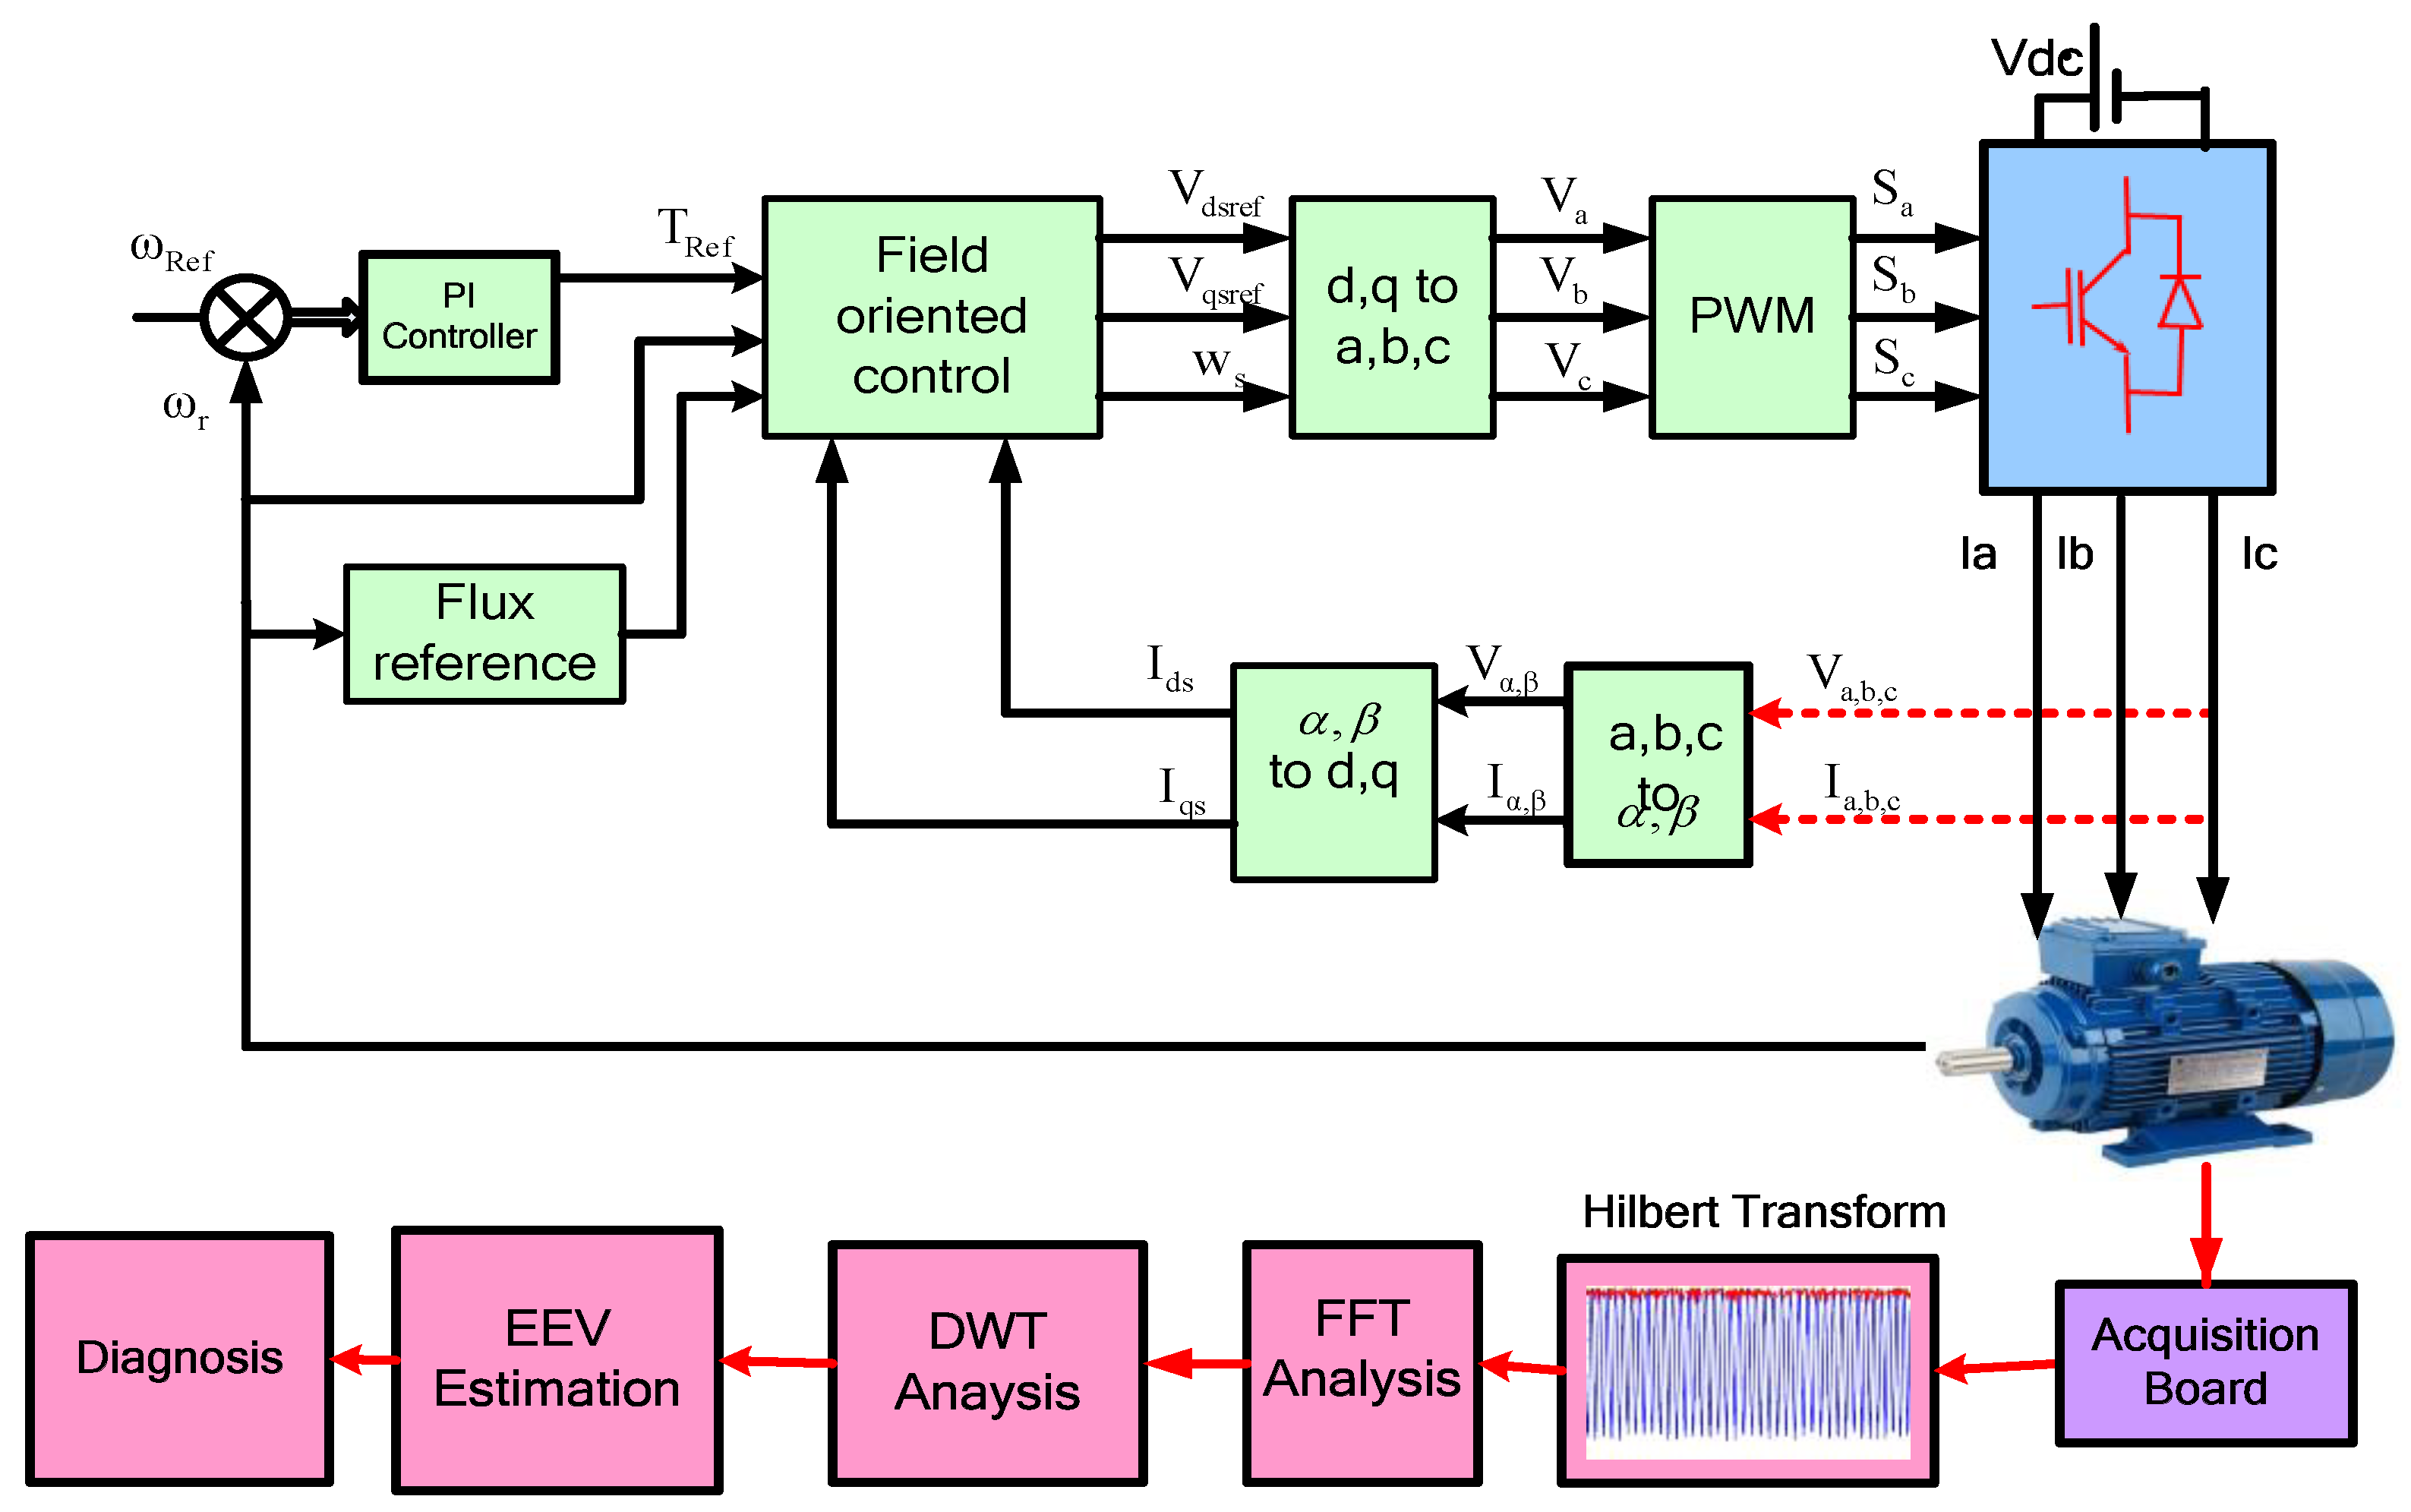
3. IFOC-Based Drive under Rotor Failure
4. Fault Diagnosis Process
4.1. HT
4.2. Fourier Transform (FT)
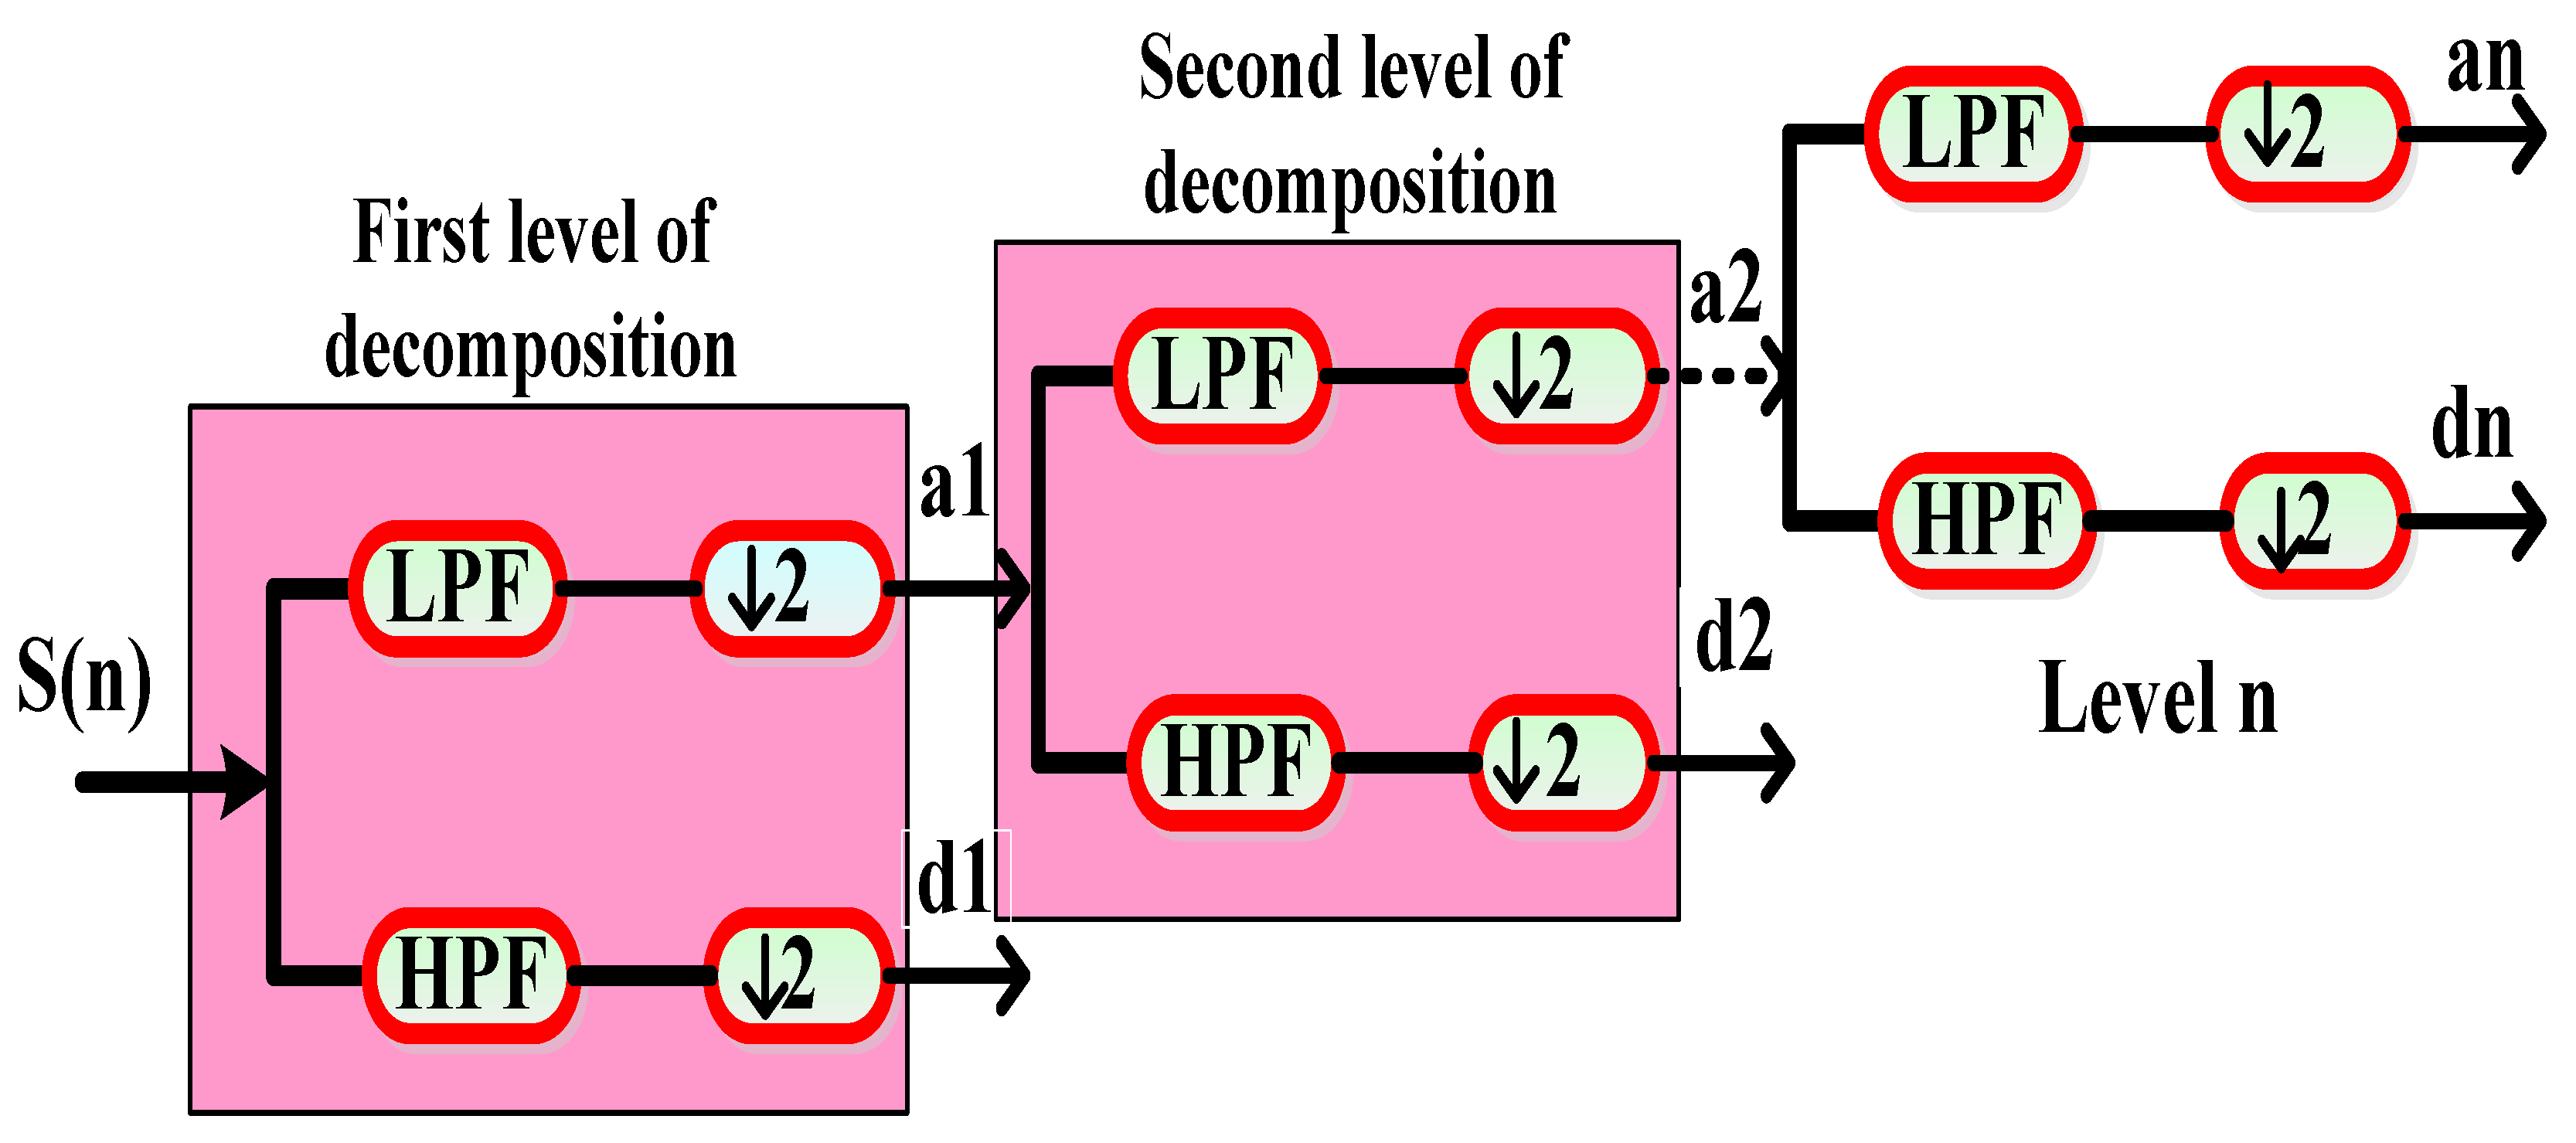
4.3. DWT
4.4. EEV Computation
5. Results and Discussion
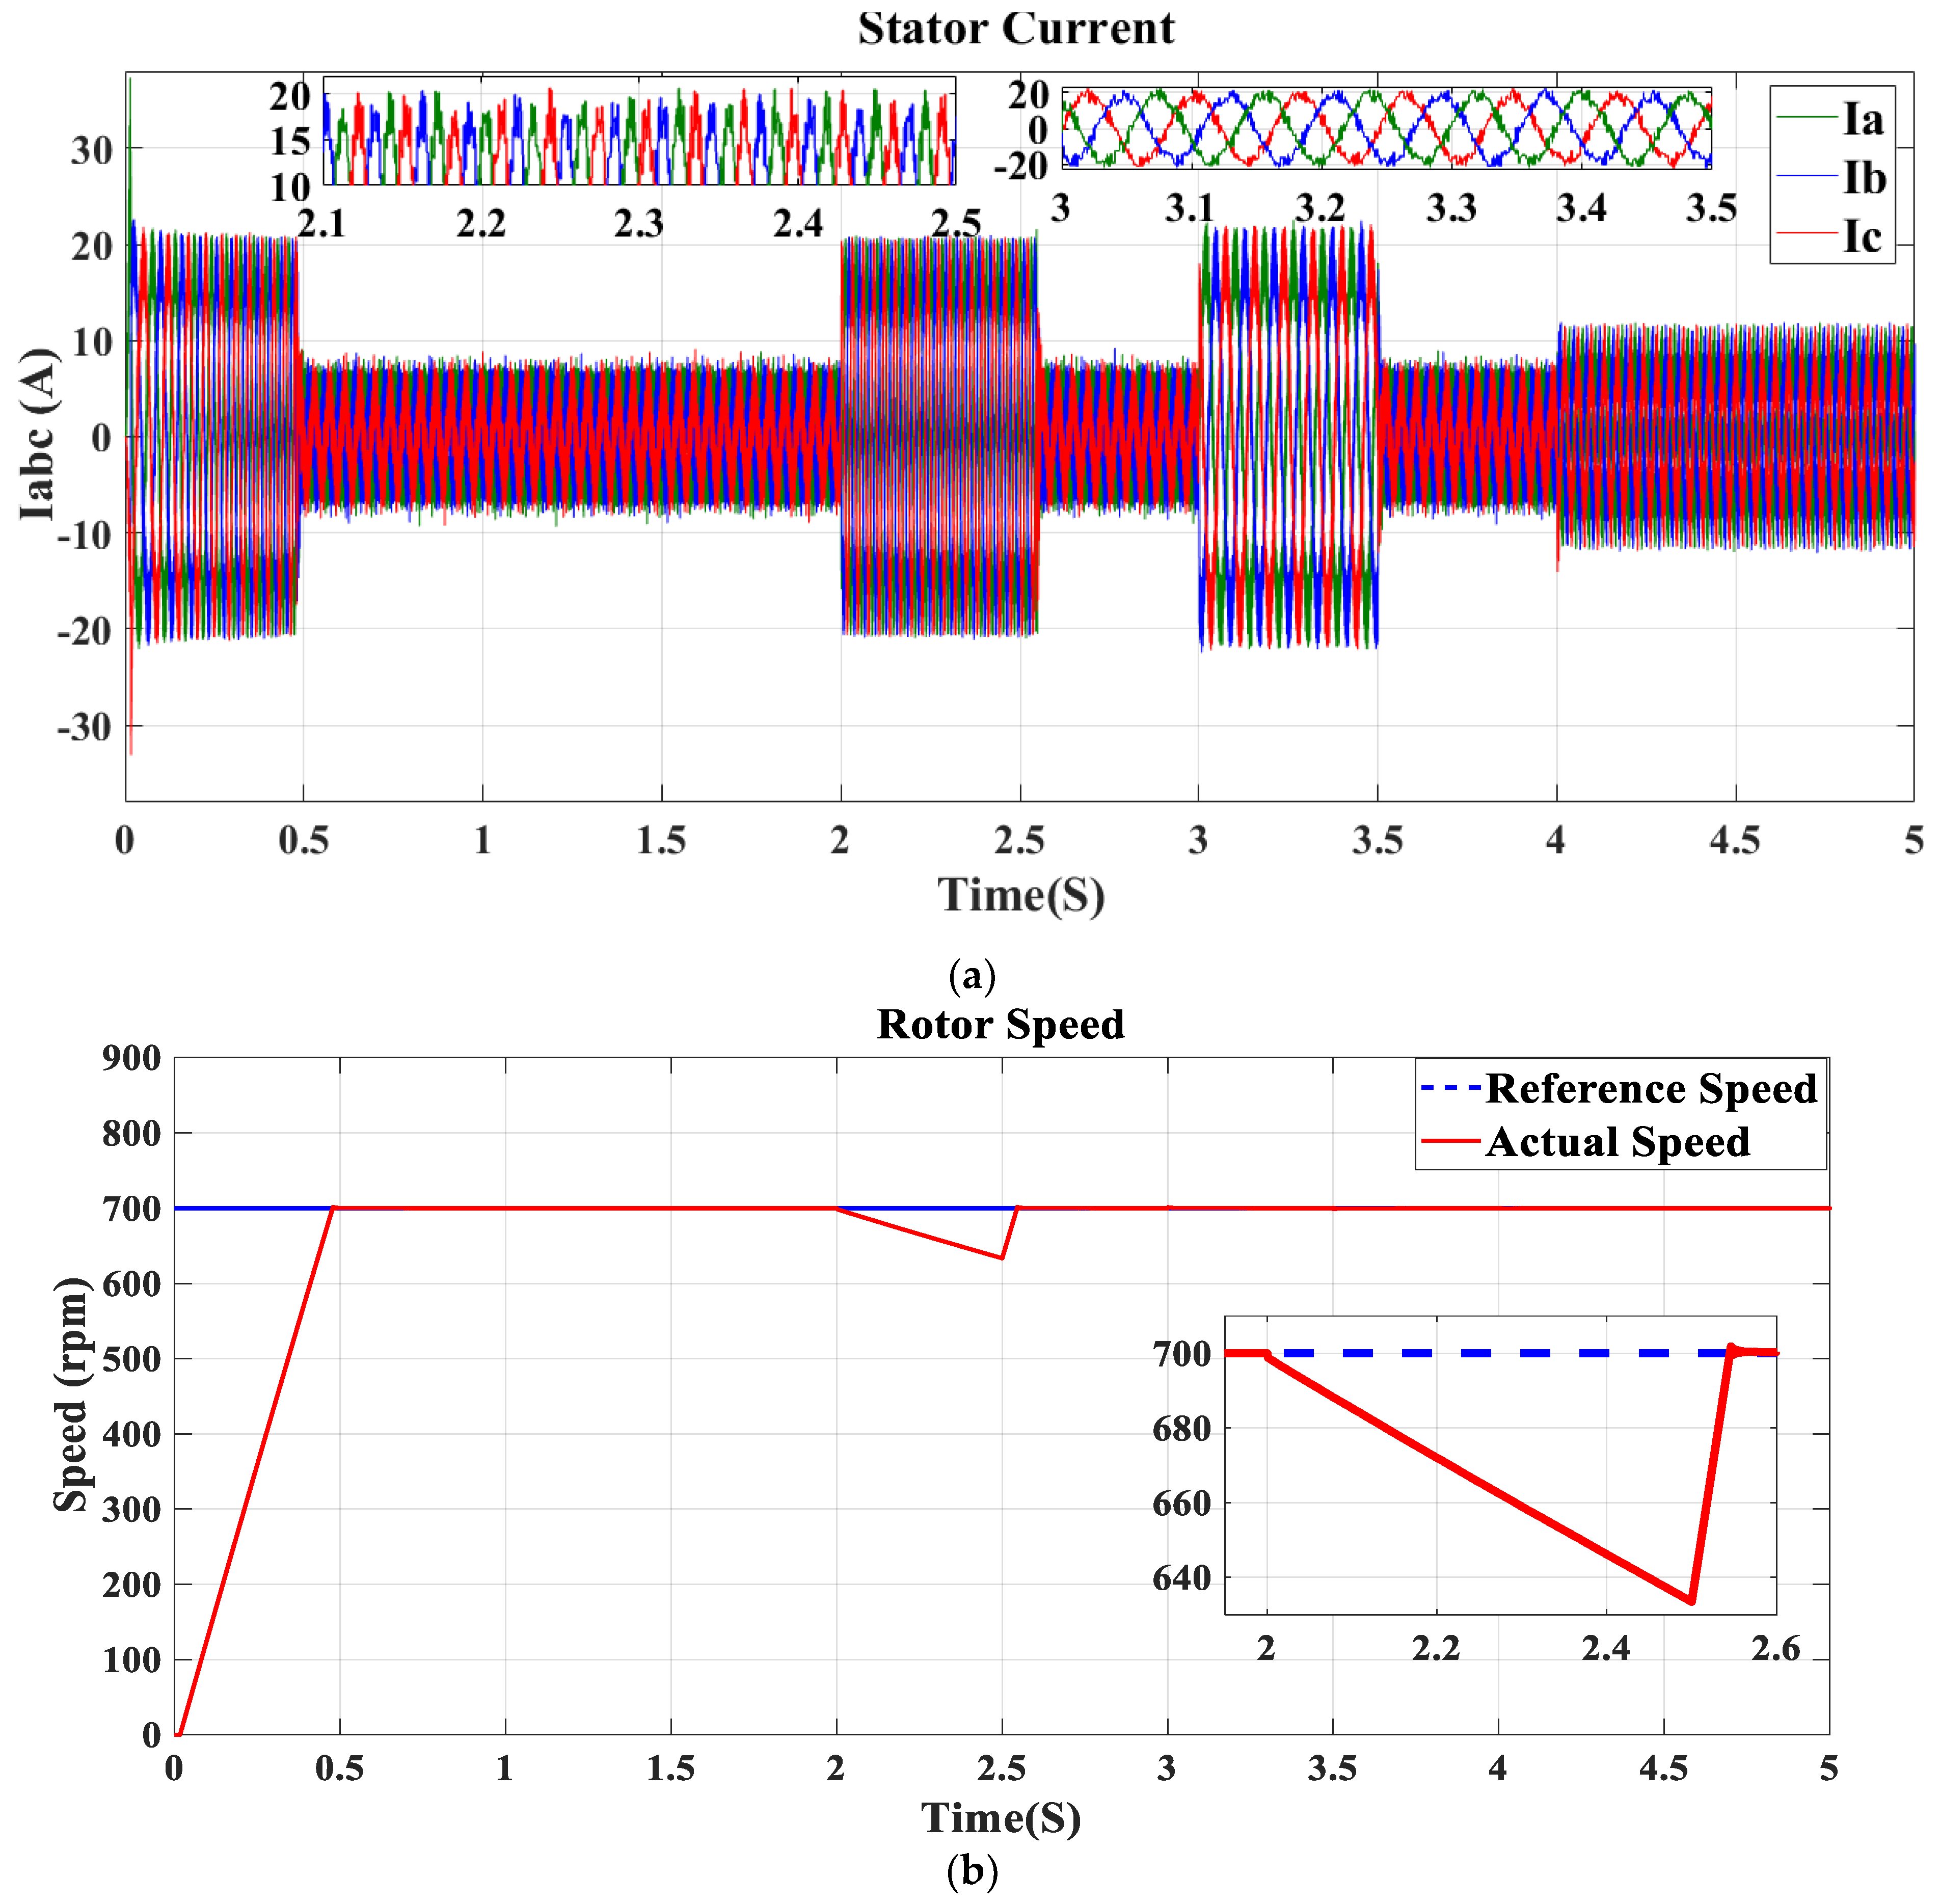
5.1. Simulation Results
5.2. Experimental Results
5.3. Fault Diagnosis Using HT and DWT
5.3.1. HT
5.3.2. FFT Analysis
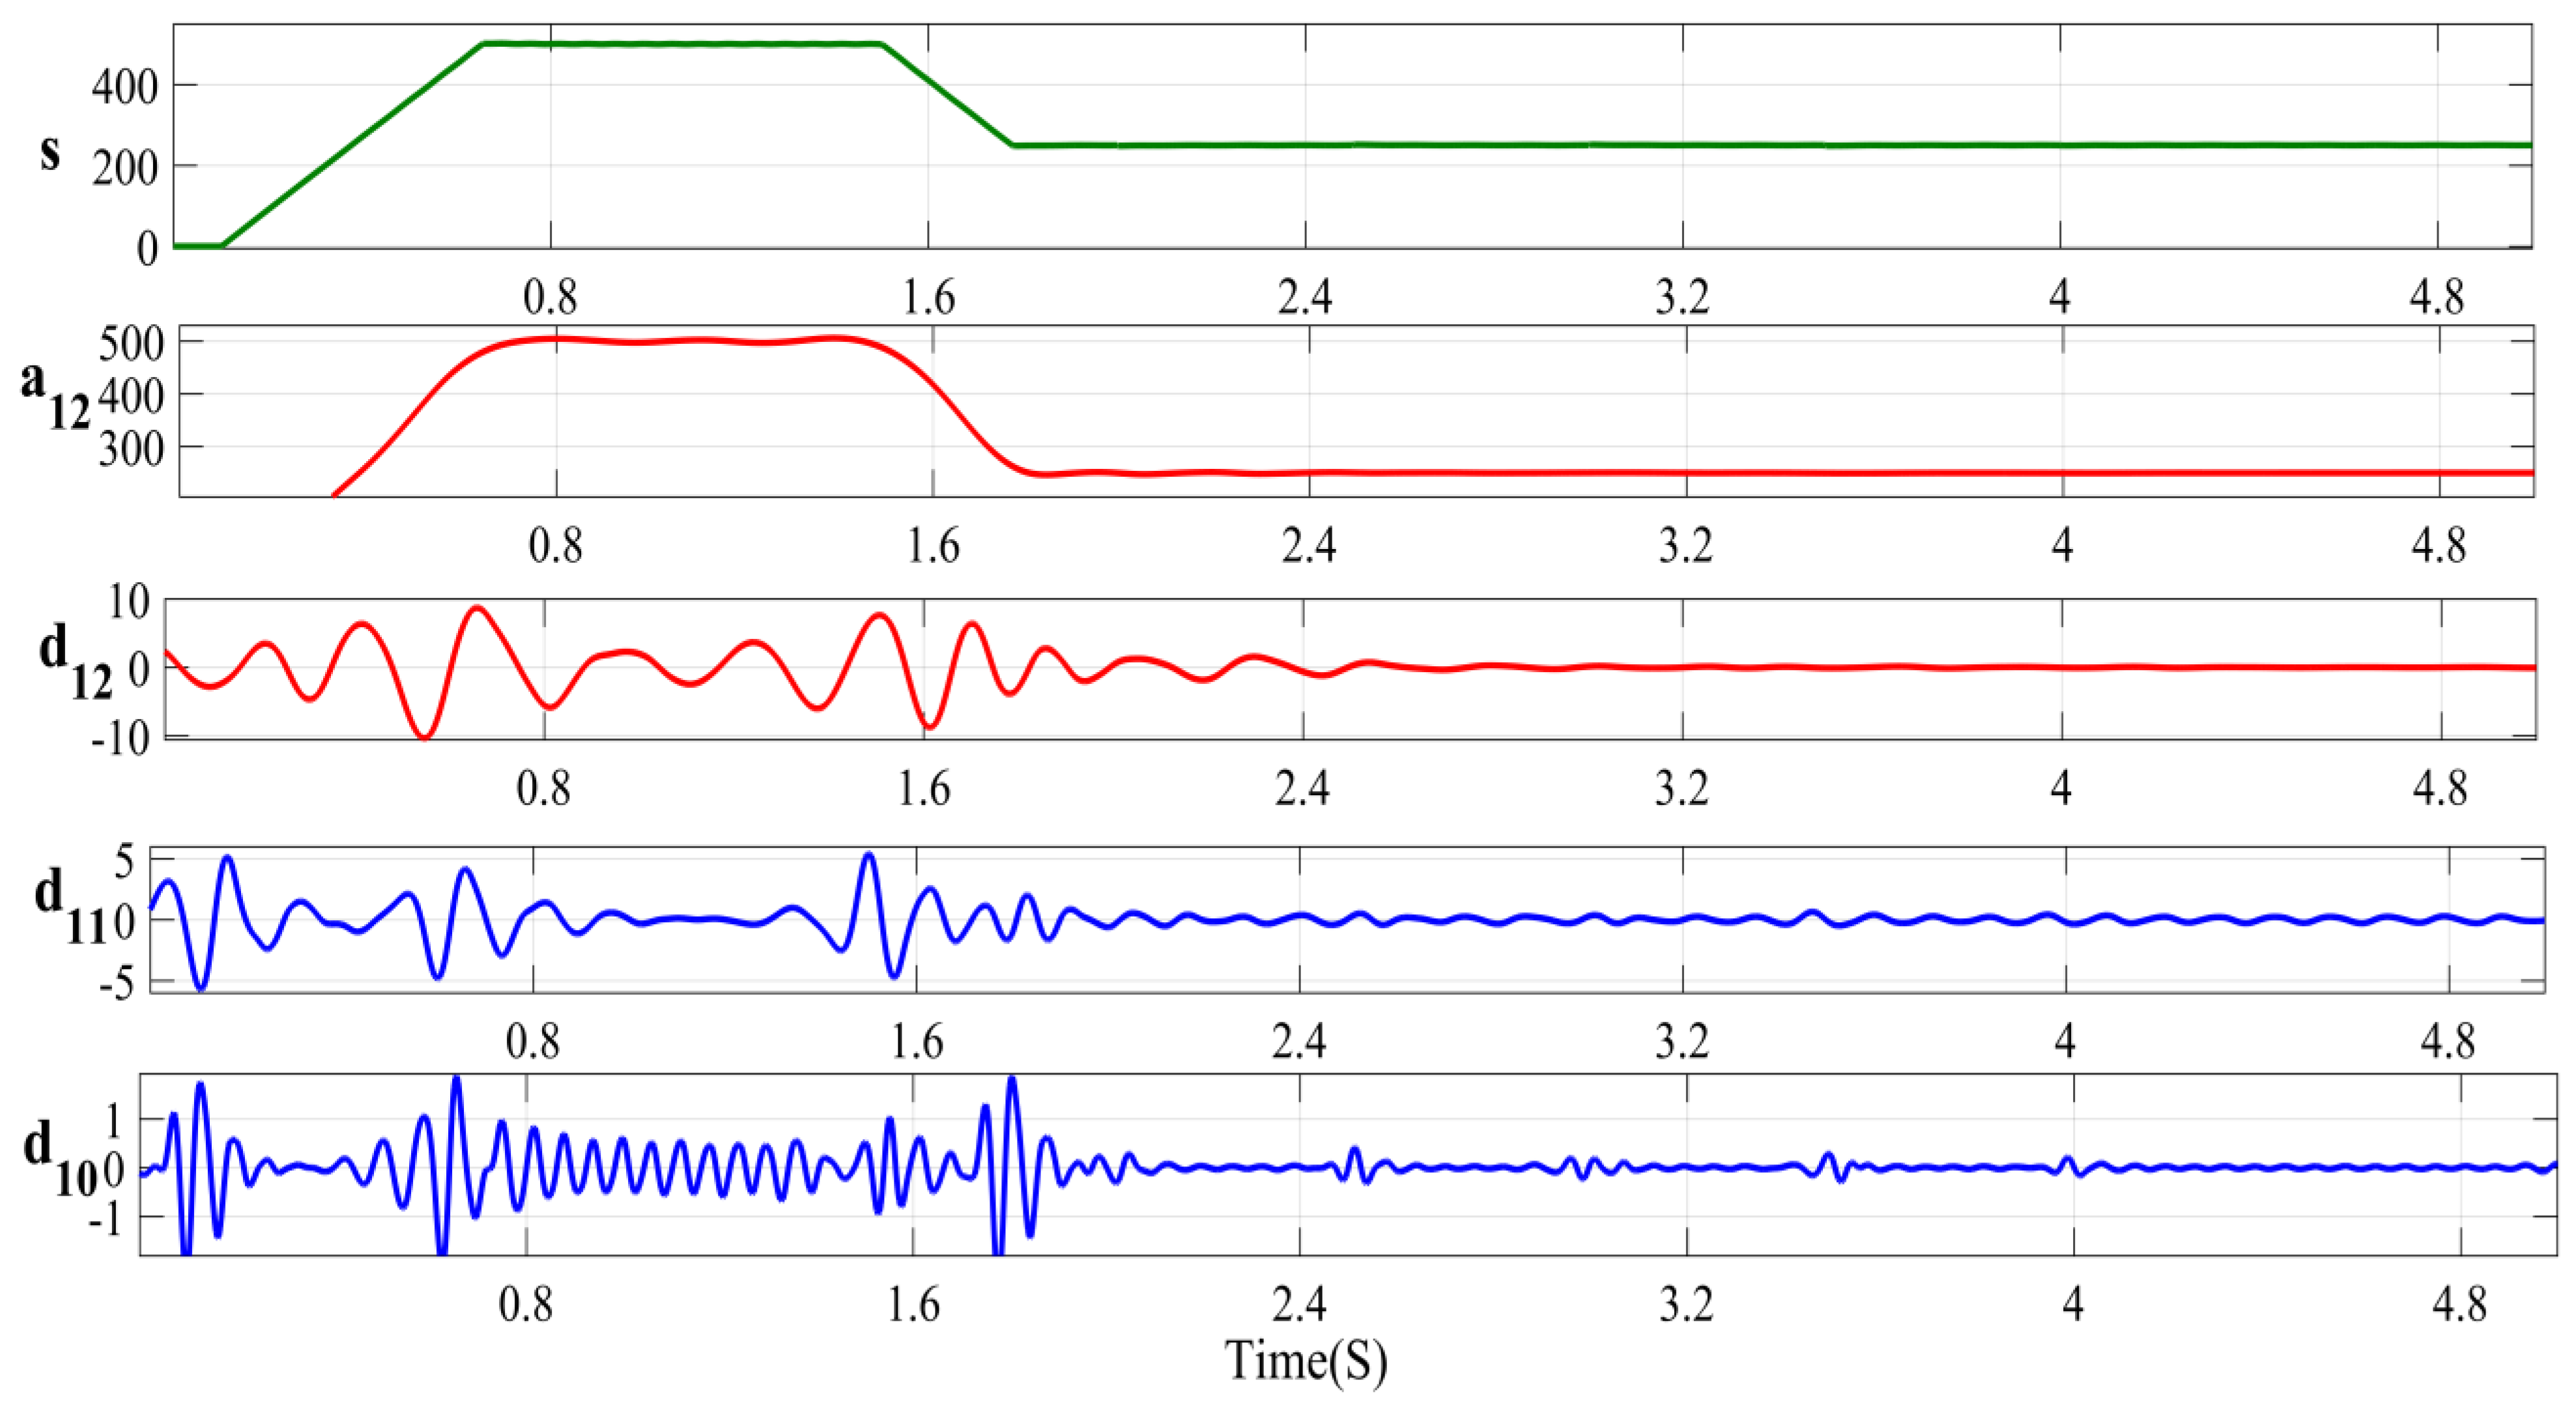
5.3.3. DWT Analysis
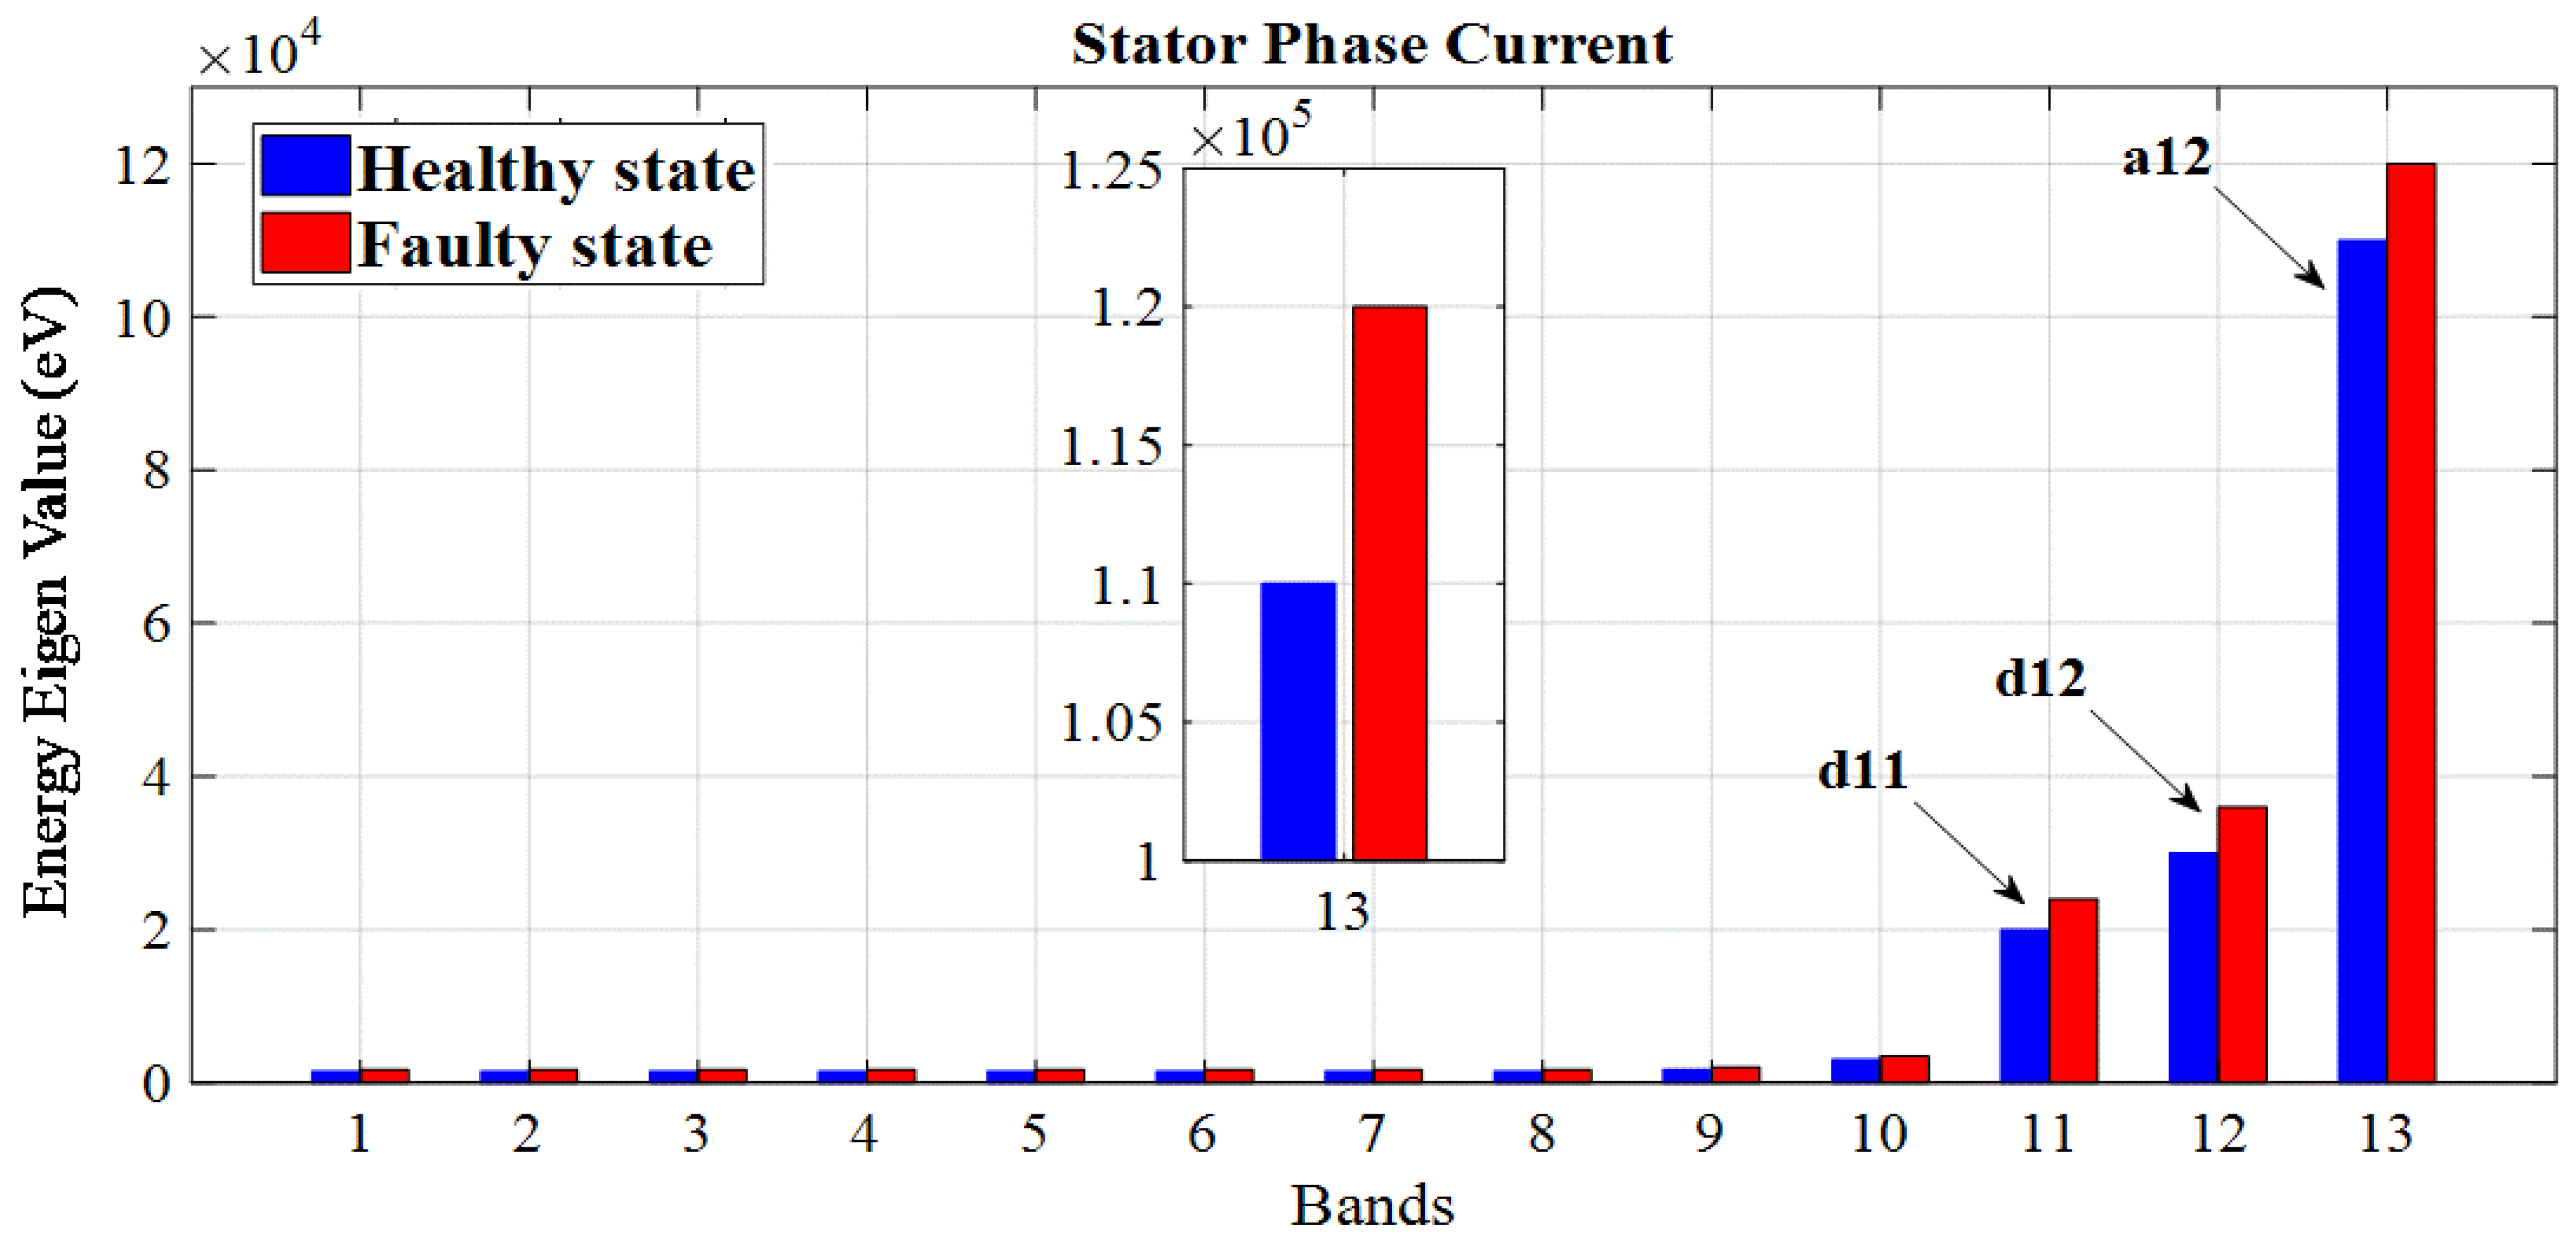
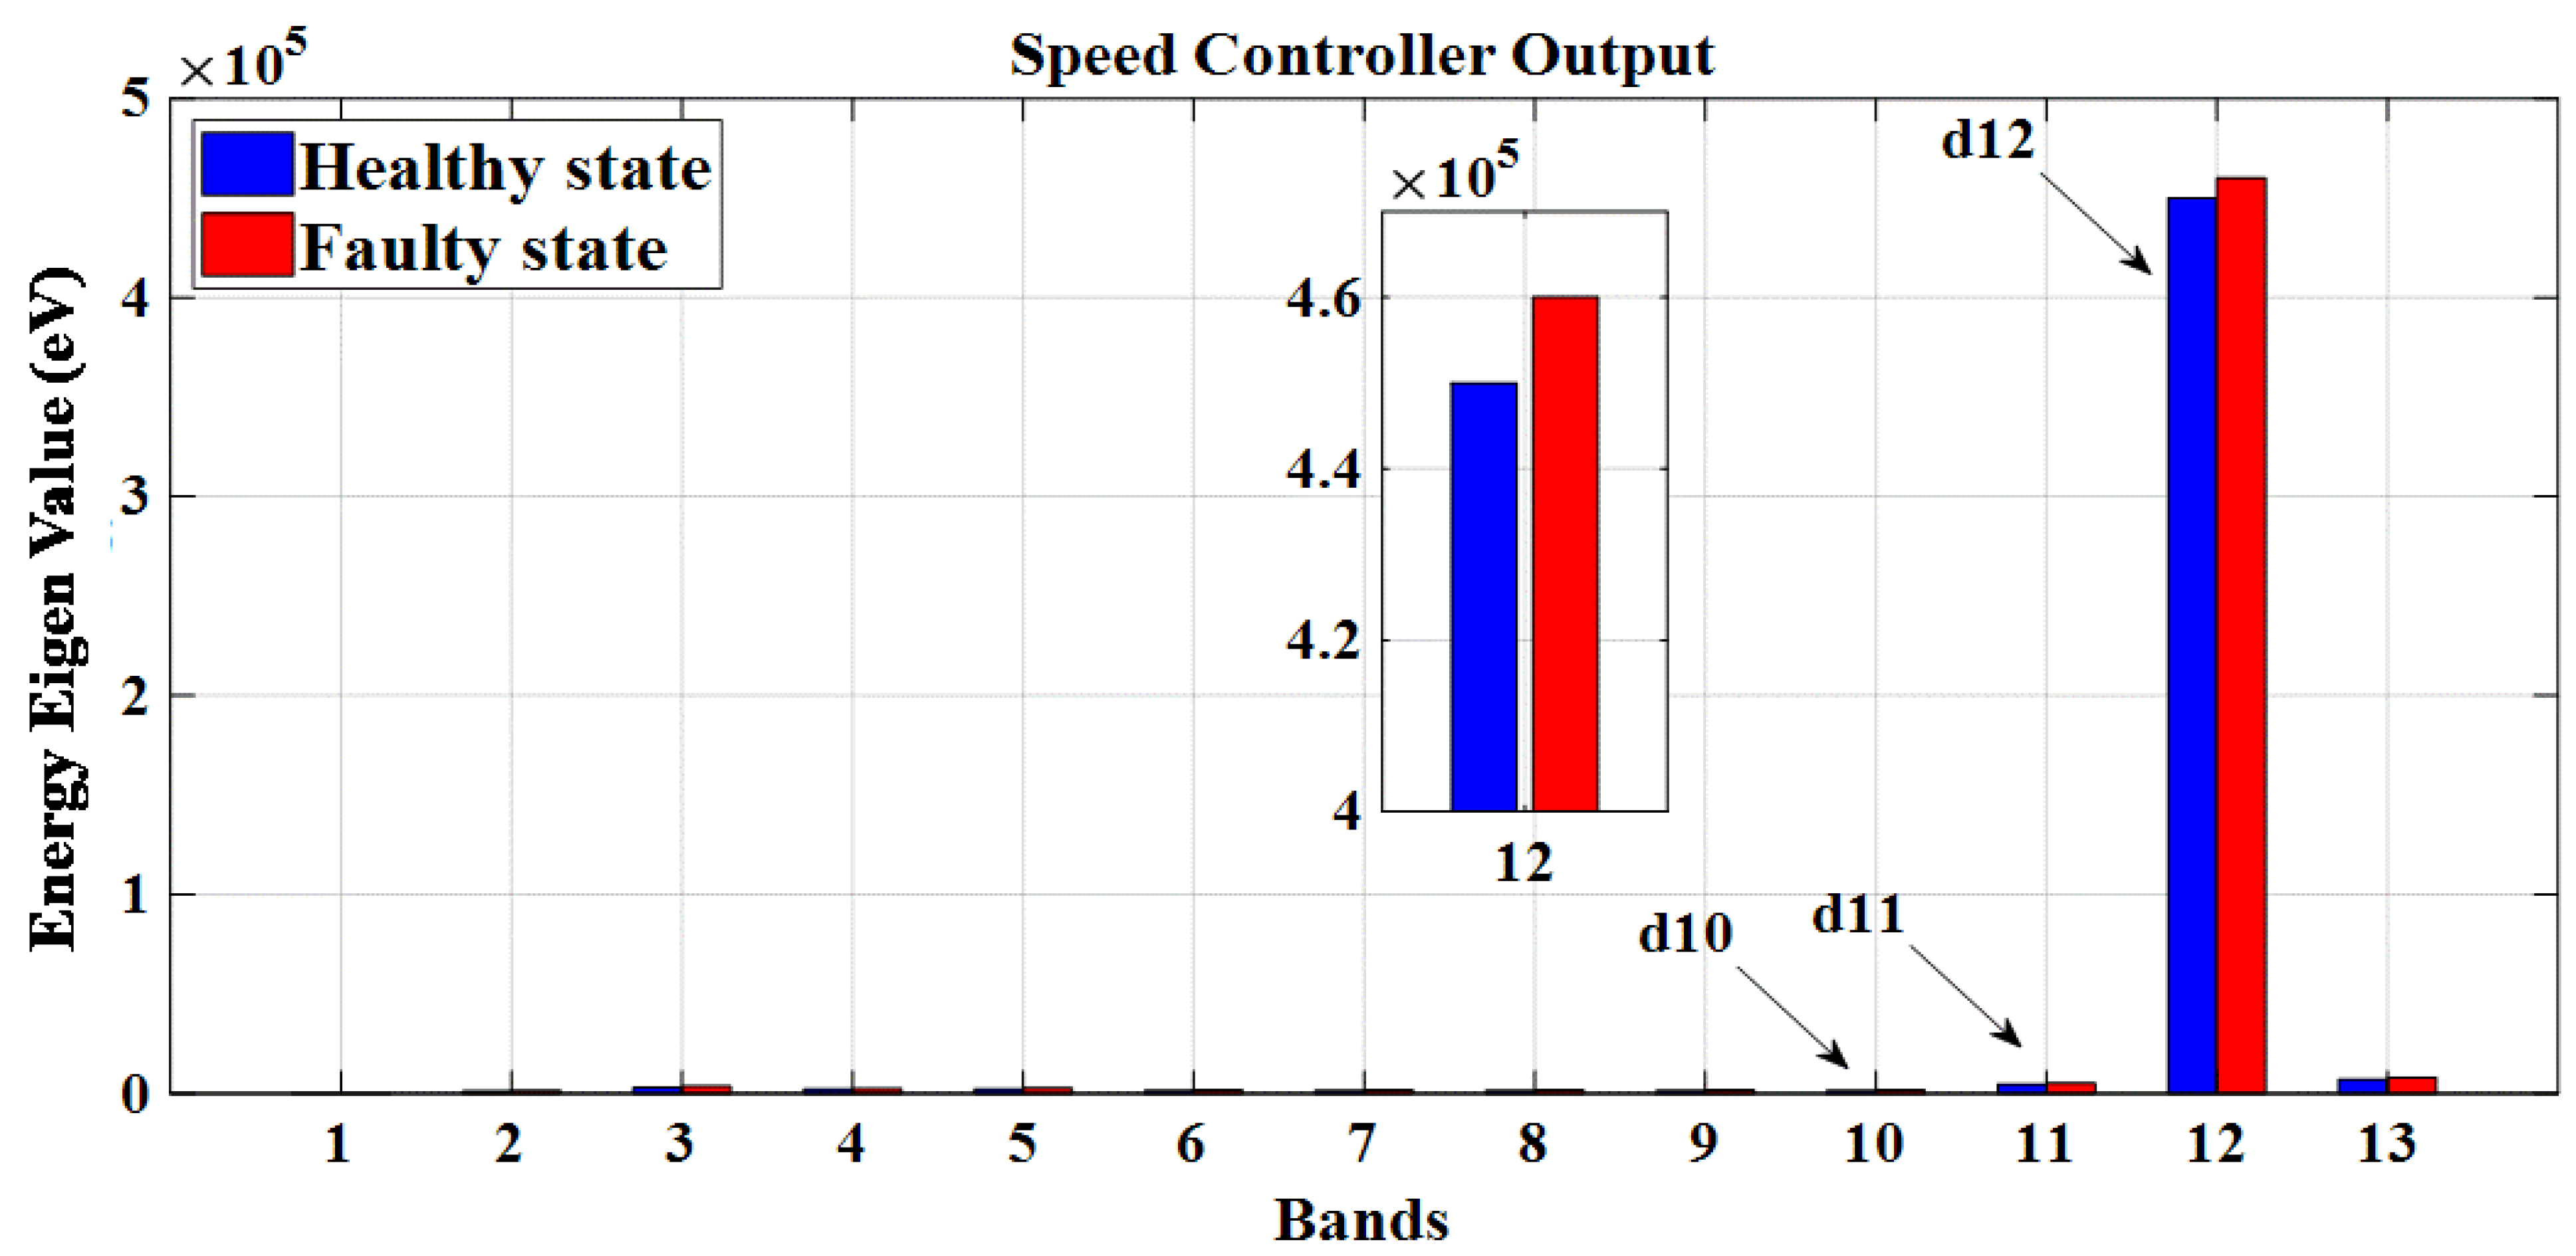
5.3.4. EEV Computation
6. Discussion
7. Conclusions
Author Contributions
Funding
Data Availability Statement
Acknowledgments
Conflicts of Interest
Appendix A. Machines Parameters
| Symbol | Parameters | Ratings |
| P0 | Output power | 2.2 KW |
| Vs | Stator line voltage | 415 V |
| LS | Stator resistance | 6.81 Ω |
| Rr | Rotor resistance | 5.24 Ω |
| Rb | Rotor bar resistance | 0.21 m Ω |
| Mst | Mutual inductance | 63.24 mH |
| Lb | Rotor bar inductance | 0.13 mH |
| Lsf | Stator leakage inductance | 22.5 mH |
| TL | Load torque | 10 Nm |
| nb | Rotor bars | 16 |
References
- Sabir, H.; Ouassaid, M.; Ngote, N. An experimental method for diagnostic of incipient broken rotor bar fault in induction machines. Heliyon 2022, 8, e09136. [Google Scholar] [CrossRef]
- Kumar, R.S.; Raj, I.G.C.; Alhamrouni, I.; Saravanan, S.; Prabaharan, N.; Ishwarya, S.; Salem, M. A combined HT and ANN based early broken bar fault diagnosis approach for IFOC fed induction motor drive. Alex. Eng. J. 2023, 66, 15–30. [Google Scholar] [CrossRef]
- Ameid, T.; Menacer, A.; Talhaoui, H.; Harzelli, I. Rotor resistance estimation using Extended Kalman filter and spectral analysis for rotor bar fault diagnosis of sensorless vector control induction motor. Measurement 2017, 111, 243–259. [Google Scholar] [CrossRef]
- Talhaoui, H.; Ameid, T.; Aissa, O.; Kessal, A. Wavelet packet and fuzzy logic theory for automatic fault detection in induction motor. Soft Comput. 2022, 26, 11935–11949. [Google Scholar] [CrossRef]
- Hassan, O.E.; Amer, M.; Abdelsalam, A.K.; Williams, B.W. Induction motor broken rotor bar fault detection techniques based on fault signature analysis–a review. IET Electr. Power Appl. 2018, 12, 895–907. [Google Scholar] [CrossRef]
- Singh, G.K. Induction machine drive condition monitoring and diagnostic research—A survey. Electr. Power Syst. Res. 2003, 64, 145–158. [Google Scholar] [CrossRef]
- Heising, C. IEEE Recommended Practice for the Design of Reliable Industrial and Commercial Power Systems; IEEE Inc.: New York, NY, USA, 2007. [Google Scholar]
- Harzelli, I.; Benakcha, A.; Ameid, T.; Menacer, A. Closed-Loop Drive Detection and Diagnosis of Multiple Combined Faults in Induction Motor Through Model-Based and Neuro-Fuzzy Network Techniques. J. Model. Optim. 2021, 13, 58–79. [Google Scholar] [CrossRef]
- Senthil Kumar, R.; Gerald Christopher Raj, I.; Suresh, K.P.; Leninpugalhanthi, P.; Suresh, M.; Panchal, H.; Sadasivuni, K.K. A method for broken bar fault diagnosis in three phase induction motor drive system using Artificial Neural Networks. Int. J. Ambient. Energy 2022, 43, 5138–5144. [Google Scholar] [CrossRef]
- Ameid, T.; Menacer, A.; Talhaoui, H.; Harzelli, I.; Ammar, A. Simulation and real-time implementation of sensorless field oriented control of induction motor at healthy state using rotor cage model and EKF. In Proceedings of the 2016 8th International Conference on Modelling, Identification and Control (ICMIC), Algiers, Algeria, 15–17 November 2016; pp. 695–700. [Google Scholar]
- Dişli, F.; Gedikpinar, M.; Sengur, A. Deep transfer learning-based broken rotor fault diagnosis for Induction Motors. Turk. J. Sci. Technol. 2023, 18, 275–290. [Google Scholar] [CrossRef]
- Sun, H.; Yang, Y.; Yu, J.; Zhang, Z.; Xia, Z.; Zhu, J.; Zhang, H. Artificial Intelligence of Manufacturing Robotics Health Monitoring System by semantic modeling. Micromachines 2022, 13, 300. [Google Scholar] [CrossRef]
- Abdellah, C.; Mama, C.; Meflah Abderrahmane, M.R.; Mohammed, B. Current Park’s vector pattern technique for diagnosis of broken rotor bars fault in saturated induction motor. J. Electr. Eng. Technol. 2023, 13, 2749–2758. [Google Scholar] [CrossRef]
- Baranov, G.D.; Nepomuceno, E.G.; Vaganov, M.A.; Ostrovskii, V.Y.; Butusov, D.N. New spectral markers for broken bars diagnostics in induction motors. Machines 2020, 8, 6. [Google Scholar] [CrossRef] [Green Version]
- Luong, P.; Wang, W. Smart sensor-based synergistic analysis for rotor bar fault detection of induction motors. IEEE/ASME Trans. Mechatron. 2020, 25, 1067–1075. [Google Scholar] [CrossRef]
- Khelfi, H.; Hamdani, S. Induction motor rotor fault diagnosis using three-phase current intersection signal. Electr. Eng. 2020, 102, 539–548. [Google Scholar] [CrossRef]
- Yassa, N.; Rachek, M.; Houassine, H. Motor current signature analysis for the air gap eccentricity detection in the squirrel cage induction machines. Energy Procedia 2019, 162, 251–262. [Google Scholar] [CrossRef]
- Sundararaju, K.; Kumar, R.S.; Raj, I.G.C. Modeling and simulation of neural based speed controller for direct torque control of three phase induction motor. In Proceedings of the TENCON 2017-2017 IEEE Region 10 Conference, Penang, Malaysia, 5–8 November 2017; pp. 1439–1444. [Google Scholar]
- Abd-el-Malek, M.; Abdelsalam, A.K.; Hassan, O.E. Induction motor broken rotor bar fault location detection through envelope analysis of start-up current using Hilbert transform. Mech. Syst. Signal Process. 2017, 93, 332–350. [Google Scholar] [CrossRef]
- Rivera-Guillen, J.R.; De Santiago-Perez, J.J.; Amezquita-Sanchez, J.P.; Valtierra-Rodriguez, M.; Romero-Troncoso, R.J. Enhanced FFT-based method for incipient broken rotor bar detection in induction motors during the startup transient. Measurement 2018, 124, 277–285. [Google Scholar] [CrossRef]
- Bessam, B.; Menacer, A.; Boumehraz, M.; Cherif, H. DWT and Hilbert transform for broken rotor bar fault diagnosis in induction machine at low load. Energy Procedia 2015, 74, 1248–12570. [Google Scholar] [CrossRef] [Green Version]
- Lizarraga-Morales, R.A.; Rodriguez-Donate, C.; Cabal-Yepez, E.; Lopez-Ramirez, M.; Ledesma-Carrillo, L.M.; Ferrucho-Alvarez, E.R. Novel FPGA-based methodology for early broken rotor bar detection and classification through homogeneity estimation. IEEE Trans. Instrum. Meas. 2017, 66, 1760–1769. [Google Scholar] [CrossRef]
- Ferrucho-Alvarez, E.R.; Martinez-Herrera, A.L.; Cabal-Yepez, E.; Rodriguez-Donate, C.; Lopez-Ramirez, M.; Mata-Chavez, R.I. Broken rotor bar detection in induction motors through contrast estimation. Sensors 2021, 21, 7446. [Google Scholar] [CrossRef]
- Bessam, B.; Menacer, A.; Boumehraz, M.; Cherif, H. Detection of broken rotor bar faults in induction motor at low load using neural network. ISA Trans. 2016, 64, 241–246. [Google Scholar] [CrossRef]
- Sabir, H.; Ouassaid, M.; Ngote, N. Early Severity Assessment of Unbalanced rotor Fault in WRIM using ANN based Hybrid TSA and FFT Approach. In Proceedings of the 2020 IEEE 7th International Conference on Engineering Technologies and Applied Sciences (ICETAS) IEEE, Kuala Lumpur, Malaysia, 18–20 December 2020; pp. 1–6. [Google Scholar]
- Gangsar, P.; Tiwari, R. Signal based condition monitoring techniques for fault detection and diagnosis of induction motors: A state-of-the-art review. Mech. Syst. Signal Process. 2020, 144, 106908. [Google Scholar] [CrossRef]
- Ramu, S.K.; Irudayaraj, G.C.R.; Subramani, S.; Subramaniam, U. Broken rotor bar fault detection using Hilbert transform and neural networks applied to direct torque control of induction motor drive. IET Power Electron. 2020, 13, 3328–3338. [Google Scholar] [CrossRef]
- Ameid, T.; Menacer, A.; Talhaoui, H.; Azzoug, Y. Discrete wavelet transform and energy eigen value for rotor bars fault detection in variable speed field-oriented control of induction motor drive. ISA Trans. 2018, 79, 217–231. [Google Scholar] [CrossRef]
- Singh, A.; Grant, B.; De Four, R.; Sharma, C.; Bahadoorsingh, S. A review of induction motor fault modeling. Electr. Power Syst. Res. 2016, 133, 191–197. [Google Scholar] [CrossRef]
- Saidi, L.; Fnaiech, F.; Henao, H.; Capolino, G.A.; Cirrincione, G. Diagnosis of broken-bars fault in induction machines using higher order spectral analysis. ISA Trans. 2013, 52, 140–148. [Google Scholar] [CrossRef]
- Talhaoui, H.; Menacer, A.; Kessal, A.; Kechida, R. Fast Fourier and discrete wavelet transforms applied to sensorless vector control induction motor for rotor bar faults diagnosis. ISA Trans. 2014, 53, 1639–1649. [Google Scholar] [CrossRef]
- Zeb, K.; Ali, Z.; Saleem, K.; Uddin, W.; Javed, M.A.; Christofides, N. Indirect field-oriented control of induction motor drive based on Adaptive Fuzzy Logic Controller. Electr. Eng. 2016, 99, 803–815. [Google Scholar] [CrossRef]
- Wang, K.; Li, Y.; Ge, Q.; Shi, L. An improved indirect field-oriented control scheme for linear induction motor traction drives. IEEE Trans. Ind. Electron. 2018, 65, 9928–9937. [Google Scholar] [CrossRef]
- Kumar, R.; Singh, B.; Kant, P. Assessment of Multi-Phase Conversion and Modified PWM Strategy for Power Converters of Medium-Voltage Induction Motors Drive. IEEE Trans. Ind. Appl. 2023, 59, 3458–3469. [Google Scholar] [CrossRef]
- Ameid, T.; Menacer, A.; Talhaoui, H.; Harzelli, I. Broken rotor bar fault diagnosis using fast Fourier transform applied to field-oriented control induction machine: Simulation and experimental study. Int. J. Adv. Manuf. Technol. 2017, 92, 917–928. [Google Scholar] [CrossRef]
- Abd-el-Malek, M.B.; Abdelsalam, A.K.; Hassan, O.E. Novel approach using Hilbert Transform for multiple broken rotor bars fault location detection for three phase induction motor. ISA Trans. 2018, 80, 439–457. [Google Scholar] [CrossRef]
- Dias, C.G.; Silva, L.C. Induction Motor Speed Estimation based on Airgap flux measurement using Hilbert transform and fast fourier transform. IEEE Sens. J. 2022, 22, 12690–12699. [Google Scholar] [CrossRef]
- El Idrissi, A.; Derouich, A.; Mahfoud, S.; El Ouanjli, N.; Chantoufi, A.; Al-Sumaiti, A.S.; Mossa, M.A. Bearing fault diagnosis for an induction motor controlled by an artificial neural network—Direct torque control using the Hilbert transform. Mathematics 2022, 10, 4258. [Google Scholar] [CrossRef]
- Ameid, T.; Ammar, A.; Talhaoui, H.; Azzoug, Y.; Chebaani, M. An automatic rotor bar fault diagnosis using fuzzy logic and DWT-energy for backstepping control driven induction motor in low-speed operation. Soft Comput. 2023, 27, 10411–10426. [Google Scholar] [CrossRef]
- Das, O.; Bagci Das, D. Smart Machine Fault Diagnostics based on fault specified discrete wavelet transform. J. Braz. Soc. Mech. Sci. Eng. 2023, 45, 55. [Google Scholar] [CrossRef]
- Mallat, S.G. A theory for multiresolution signal decomposition: The wavelet representation. IEEE Trans. Pattern Anal. Mach. Intell. 1989, 11, 674–693. [Google Scholar] [CrossRef] [Green Version]
- Senthil Kumar, R.; Gerald Christopher Raj, I. Broken rotor bar fault detection using DWT and energy eigenvalue for DTC fed induction motor drive. Int. J. Electron. 2021, 108, 1401–1425. [Google Scholar] [CrossRef]
- Tanwar, P.; Somkuwar, A. Hard component detection of transient noise and its removal using empirical mode decomposition and wavelet-based predictive filter. IET Signal Process. 2018, 12, 907–916. [Google Scholar] [CrossRef]
- Kapoor, S.R.; Khandelwal, N.; Pareek, P. Bearing fault analysis by signal energy calculation based signal processing technique in squirrel cage induction motor. In Proceedings of the 2014 International Conference on Signal Propagation and Computer Technology (ICSPCT 2014), Ajmer, India, 12–13 July 2014; pp. 33–38. [Google Scholar]
- Ramu, S.K.; Irudayaraj, G.C.R.; Devarajan, G.; Indragandhi, V.; Subramaniyaswamy, V.; Sam Alaric, J. Diagnosis of Broken Bars in V/F Control Induction Motor Drive Using Wavelets and EEV Estimation for Electric Vehicle Applications. Int. Trans. Electr. Energy Syst. 2022, 2022, 9474640. [Google Scholar] [CrossRef]
- Guellout, O.; Rezig, A.; Touati, S.; Djerdir, A. Elimination of broken rotor bars false indications in induction machines. Math. Comput. Simul. 2020, 167, 250–266. [Google Scholar] [CrossRef]
- Liboni, L.H.; Flauzino, R.A.; da Silva, I.N.; Costa, E.C.M. Efficient feature extraction technique for diagnosing broken bars in three-phase induction machines. Measurement 2019, 134, 825–834. [Google Scholar] [CrossRef]
- Xie, Y.; Chen, P.; Li, F.; Liu, H. Electromagnetic forces signature and vibration characteristic for diagnosis broken bars in squirrel cage induction motors. Mech. Syst. Signal Process. 2019, 123, 554–572. [Google Scholar] [CrossRef]
- Choudhary, A.; Mishra, R.K.; Fatima, S.; Panigrahi, B.K. Multi-input CNN based vibro-acoustic fusion for accurate fault diagnosis of induction motor. Eng. Appl. Artif. Intell. 2023, 120, 105872. [Google Scholar] [CrossRef]
- Elhaija, W.A.; Al-Haija, Q.A. A novel dataset and lightweight detection system for broken bars induction motors using optimizable neural networks. Intell. Syst. Appl. 2023, 17, 200167. [Google Scholar] [CrossRef]
- Glowacz, A. Thermographic fault diagnosis of electrical faults of commutator and induction motors. Eng. Appl. Artif. Intell. 2023, 121, 105962. [Google Scholar] [CrossRef]
- Barusu, M.R.; Deivasigamani, M. Diagnosis of multiple rotor bar faults of squirrel cage induction motor (SCIM) using rational dilation wavelet transforms. IETE J. Res. 2023, 69, 249–263. [Google Scholar] [CrossRef]
- Talhaoui, H.; Ameid, T.; Kessal, A. Energy eigenvalues and neural network analysis for broken bars fault diagnosis in induction machine under variable load: Experimental study. J. Ambient. Intell. Humaniz. Comput. 2022, 13, 2651–2665. [Google Scholar] [CrossRef]


| Time Parameters | Control Methods | |||
|---|---|---|---|---|
| Rotor Speed | ||||
| V/F | DTC | IOL | IFOC | |
| [45] | ||||
| Rise time (ts) in ms | 1126 | 497 | 416 | 258 |
| Maximum peak overshoot (Mp) in % | 48 | 273 | 76 | 113 |
| Settling time (ts) in ms | 139 | 8 | 12 | 4 |
| Levels | Frequency Band |
|---|---|
| 25,000–50,000 Hz | |
| 12,250–25,000 Hz | |
| 6125–12,250 Hz | |
| 3062.5–6125 Hz | |
| 1531.25–3062.5 Hz | |
| 765.625–1531.25 Hz | |
| 382.81–765.625 Hz | |
| 191.40–382.81 Hz | |
| 95.70–191.40 Hz | |
| 47.85–95.70 Hz | |
| 23.926–47.85 Hz | |
| 11.96–23.926 Hz | |
| 5.98–11.96 Hz |
| References | BRBs | Load | Mode | Validation | Control Techniques | Methods | Outcomes | ||||||||||
|---|---|---|---|---|---|---|---|---|---|---|---|---|---|---|---|---|---|
| One | Two | >Two | NL | ML | FL | Steady State | Transient | Simulation | Experimental | DOL | Inverter-Fed | ||||||
| V/F | IOL | DTC | IFOC | ||||||||||||||
| [1] | √ | √ | √ | √ | √ | √ | 1. DWT 2. FL | FDS in OLD | |||||||||
| [2] | √ | √ | √ | √ | √ | √ | √ | √ | 1. HT 2. ANN | FDS in closed-loop IFOC drives | |||||||
| [4] | √ | √ | √ | √ | √ | √ | 1. Wavelet packet 2. FL | FDS in OLD | |||||||||
| [19] | √ | √ | √ | √ | √ | √ | 1. HT | FDS in OLD | |||||||||
| [21] | √ | √ | √ | √ | √ | √ | √ | √ | 1. FFT 2. ANN | FD in IOL control | |||||||
| [25] | √ | √ | √ | √ | √ | √ | 1. HT 2. ANN | Fault diagnosis in open-loop drives | |||||||||
| [28] | √ | √ | √ | √ | √ | √ | √ | 1. DWT 2. EEV | FDS in closed-loop IFOC drives | ||||||||
| [42] | √ | √ | √ | √ | √ | 1. DWT 2. EEV | FDS in DTC-fed drives | ||||||||||
| [46] | √ | √ | √ | √ | √ | √ | 1. FFT 2. Current signature analysis | Fault estimation based on load torque fluctuations | |||||||||
| [47] | √ | √ | √ | √ | √ | 1. Orthogonal decomposition | Fault severity in OLD | ||||||||||
| [48] | √ | √ | √ | √ | √ | √ | √ | 1. FFT 2. Torque signature analysis | FD in OLD | ||||||||
| [49] | √ | √ | √ | √ | √ | √ | 1. Multi-input convolutional neural networks | FD in OLD | |||||||||
| [50] | √ | √ | √ | √ | √ | √ | √ | √ | 1. Self-configurable ANN model | BRB fault classification in OLD | |||||||
| [51] | √ | √ | √ | √ | √ | √ | 1. Arithmetic mean with Otsu’s method | FDS using thermal images | |||||||||
| [52] | √ | √ | √ | √ | √ | √ | √ | 1. Rational DWT 2. Non-invasive software phase-locked loop | Multiple rotor FDS in OLD | ||||||||
| [53] | √ | √ | √ | √ | √ | √ | 1. EEV 2. ANN | FD in OLD | |||||||||
| Proposed Method | √ | √ | √ | √ | √ | √ | √ | √ | √ | 1. HT 2. FFT 3. DWT 4. EEV | FDS in closed-loop IFOC drives and fault severity estimation | ||||||
Disclaimer/Publisher’s Note: The statements, opinions and data contained in all publications are solely those of the individual author(s) and contributor(s) and not of MDPI and/or the editor(s). MDPI and/or the editor(s) disclaim responsibility for any injury to people or property resulting from any ideas, methods, instructions or products referred to in the content. |
© 2023 by the authors. Licensee MDPI, Basel, Switzerland. This article is an open access article distributed under the terms and conditions of the Creative Commons Attribution (CC BY) license (https://creativecommons.org/licenses/by/4.0/).
Share and Cite
Ramu, S.K.; Vairavasundaram, I.; Aljafari, B.; Kareri, T. Rotor Bar Fault Diagnosis in Indirect Field–Oriented Control-Fed Induction Motor Drive Using Hilbert Transform, Discrete Wavelet Transform, and Energy Eigenvalue Computation. Machines 2023, 11, 711. https://doi.org/10.3390/machines11070711
Ramu SK, Vairavasundaram I, Aljafari B, Kareri T. Rotor Bar Fault Diagnosis in Indirect Field–Oriented Control-Fed Induction Motor Drive Using Hilbert Transform, Discrete Wavelet Transform, and Energy Eigenvalue Computation. Machines. 2023; 11(7):711. https://doi.org/10.3390/machines11070711
Chicago/Turabian StyleRamu, Senthil Kumar, Indragandhi Vairavasundaram, Belqasem Aljafari, and Tareq Kareri. 2023. "Rotor Bar Fault Diagnosis in Indirect Field–Oriented Control-Fed Induction Motor Drive Using Hilbert Transform, Discrete Wavelet Transform, and Energy Eigenvalue Computation" Machines 11, no. 7: 711. https://doi.org/10.3390/machines11070711