
Design of Z Profile Roller Tooling and Research on Roller Clearance


School of Mechanical and Automotive Engineering, Liaocheng University, Liaocheng 252000, China
*
Author to whom correspondence should be addressed.
Machines 2023, 11(7), 767; https://doi.org/10.3390/machines11070767
Submission received: 31 May 2023
/
Revised: 5 July 2023
/
Accepted: 21 July 2023
/
Published: 24 July 2023
(This article belongs to the Section Advanced Manufacturing)
Abstract
:In metal processing, bending forming is widely applied in various fields. To prevent excessive surface scratching and heavy indentation on the profiles, which can negatively affect the surface quality, it is often necessary to determine the clearances between the rollers and the upper and lower surfaces of the profiles using experimental methods. However, this experimental approach not only results in material waste but also fails to determine the optimal clearance value. Therefore, orthogonal experiments were conducted to design different clearances between the rollers and the upper and lower surfaces of the profiles to mitigate the issues of excessive surface scratching and poor surface quality during the bending forming process of large-section Z-profiles. Finite element simulation was employed to simulate the different experiments, and a range analysis was performed on the experimental results to obtain the optimal clearance value. The obtained results fall within the range of results obtained from traditional experimental methods, indicating its consistency with actual practice, higher accuracy, and scientific rigor compared with experimental methods. Furthermore, the roller tooling design was revised based on the optimal clearance value for the profile processing. The experimental results demonstrate that the surface quality of the profiles processed with optimal clearance is superior to those processed without it. Additionally, this study presents a comprehensive methodology for roller tooling design and investigates the influence of different loading modes on the local wrinkling deformation of the profiles.
1. Introduction
In metal processing, the bending forming process is widely used in many fields such as oil and natural gas, navy, pipeline manufacturing, and automobiles [1,2,3,4]. Aluminum alloy profiles, owing to their high specific strength, lightweight nature, and good formability, have been widely utilized in the aerospace industry as key load-bearing structures for aircraft frames [5,6]. Aircraft frame edge profiles typically have large spatial dimensions, diverse cross-sectional structures, and varying forming radii. Therefore, the bending process, which is characterized by flexible processing capabilities, is predominantly employed for shaping and processing such components [7,8,9]. Alloys possess high strength, stiffness, and durability, making them ideal materials for lighting in the automotive industry [10]. Bending profiles are widely used in the construction of vehicle body frames, offering advantages such as reduced joining processes, increased overall strength, and improved aesthetics [11,12].
However, the surface of the profile experienced significant scratching and indentation during the roll-bending process, which adversely affected the surface quality. Additionally, post-forming correction is required to satisfy the design requirements, which significantly affects the processing efficiency of this type of profile. Currently, process engineers rely primarily on traditional empirical analyses and experimentation methods. The gap between the roller and upper and lower surfaces may contribute to the poor surface quality of the profile. Hua [13,14] studied the four-roll forming process and analyzed the influence of the process parameters on roll forming. Zhou [15] and Luo [16] pointed out that the linear velocity at the contact point between the lower roller and surface of the part is inconsistent. Therefore, at any given moment, the contact surfaces of the upper and lower rollers with the part can only ensure a consistent linear velocity at one location, whereas other contact surfaces must have a gap, which needs to be determined through experimentation. Hu [17] conducted simulation studies on the vertical gap between the lower roller and the lower surface of the profile but did not investigate the impact of the gap on the surface quality of the profile. Furthermore, their research methodology has limitations, as it only considers the gap on a single surface and does not study the comprehensive effects of gaps on both surfaces.
Excessive scratches and severe indentations on the surface of profiles affect surface quality and design requirements, so it is necessary to calibrate bent parts, which seriously affects the processing efficiency of such profiles. Technicians rely on traditional empirical analysis and experimental methods, which are time-consuming and cannot determine the optimal results. In order to determine the gap value of the roller, it is necessary to replace the roller for repeated experiments. This method consumes time and wastes experimental profiles during roller processing and machine installation, which is inefficient. Owing to the numerous influencing factors in the roll-bending process, traditional experimental methods struggle to determine the comprehensive impact of the process parameters on the forming quality, leading to various errors [18]. Therefore, finite element numerical simulation methods are considered one of the most effective approaches for predicting springback and defects in profile roll bending [19,20,21,22].
However, because of the extensive time and complexity involved in this approach, previous studies have not simultaneously considered the gaps between the upper surface of the profile and roller and between the lower surface of the profile and roller to determine the optimal gap. Based on this, to overcome the ambiguity in determining the gap between the roller and the upper surface of the profile through traditional experimental methods, which hampers the ability to achieve the optimal gap, this study utilizes finite element simulation to comprehensively consider the gaps between the upper and lower surfaces of the profile and roller. An orthogonal experiment was designed to determine the roller and surface gap that minimizes surface scratching of the profile, aiming to reduce surface damage to the profile, avoid the waste generated by traditional experimental methods, and improve scientific rigor.
2. Materials and Methods
2.1. Roll-Bending Principle
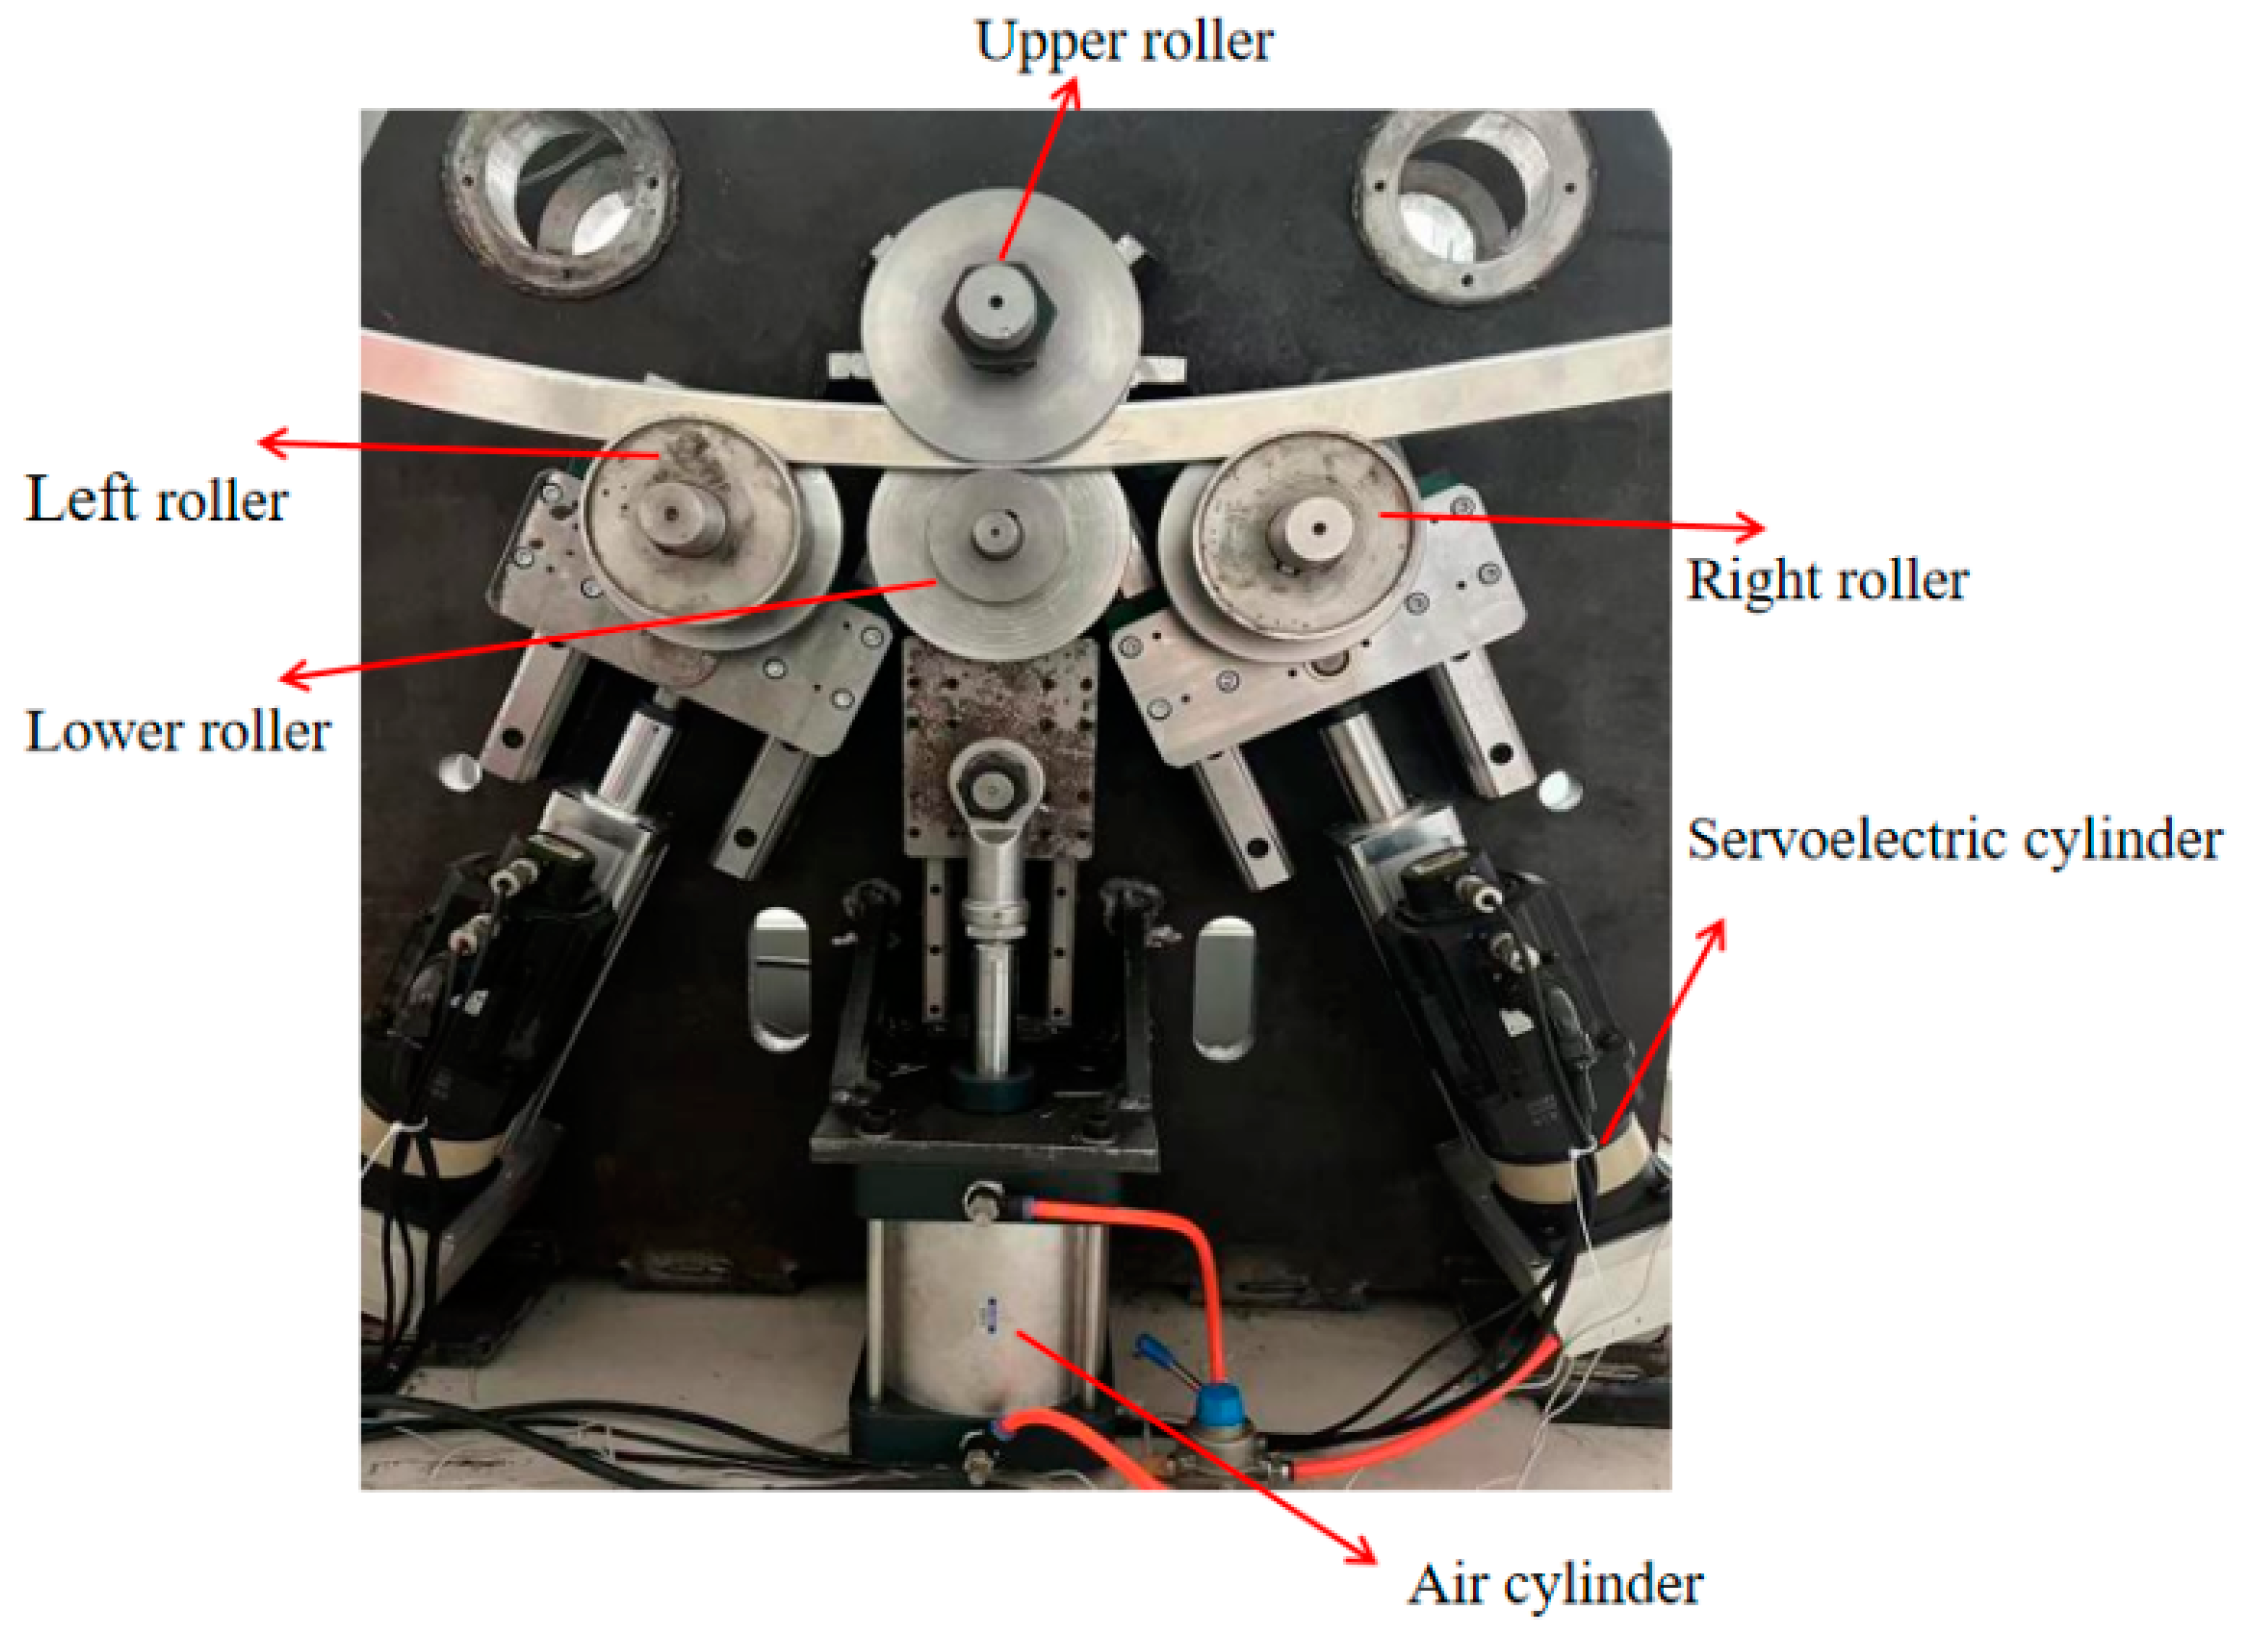
As depicted in Figure 1, the four-roll-bending machine operates based on the following principle: the upper roller governs the profile and, owing to the friction between the profile and upper roller, propels the profile to execute the feeding motion while causing the other rollers to rotate. The upper roller is the driving wheel, and the lower roller and left and right rollers are the driven wheels. The tangential force applied by the upper roller generates a driving torque to the lower rollers. The tangential force applied by the upper and lower rollers to the sheet metal generates a driving torque, which is the driving force for the displacement of the profile. The driving force direction is to point toward the displacement direction of the profile along the tangential direction of the roller, while the left and right rollers will generate a frictional resistance moment toward the tangential direction of the profile in the opposite direction of the tangential displacement direction. During the initial bending stage, the lower roll pressed the profile and extruded it between the upper and lower rolls, thereby ensuring continuous and stable bending and deformation of the profile under the influence of the roller friction. Consequently, this effectively prevents deflection or misalignment of the profile.
The experimental machine used is a CNC four-axis bending machine independently designed by the laboratory of the Robotics Research Institute of Liaocheng University. It comprises three main components: mechanical equipment, a pneumatic system, and a CNC system. The mechanical structure of the machine encompasses four rollers: the upper rollers, left and right side rollers, lower center rollers, servo electric cylinder, spindle motor, and frame. The profile was positioned between the upper and lower rollers, with the left and right lower rollers regulating the roller position based on the rolling radius. As the rollers rotate, they facilitate feeding of the profile and execute one or more feeding movements until the profile is shaped into the desired curvature.
In the roll-bending process, there is a certain center distance between the main and auxiliary rollers and the side bar, and the effect of roll bending can only be produced by the mutual extrusion of the main and auxiliary rollers with the largest center distance in the roll-bending process. However, because of the existence of the center distance between the rollers, a part of both ends of the profile cannot be extruded with the largest center distance, so the problem of a straight line section will occur. Therefore, a pre-bending process was adopted to reduce the straightness of the profile during the roll-bending process. The main processing process of the bending machine is shown in Figure 2.
Centering is shown in Figure 2a: by centering the profile before roll bending, it can be ensured that the end face of the processed profile is parallel to the side roll, thus effectively avoiding the distortion and deformation of the profile during rolling.
Pre-bending is as shown in Figure 2b; in the four roll symmetric bending machine, the asymmetric distribution of the roll positions can be used to pre-bend the end of the part to reduce or even eliminate the residual straight edges so that the resulting straight edge margin is 0. The main process of profile pre-bending is as follows: first, on the basis of centering, the left roll descends to the corresponding position; second, the upper roll reverses to drive the profile back to the position with the corresponding margin on the left side of the profile; and finally, the right roll rises to the corresponding position, and the upper roll rotates in a positive direction to drive the profile to perform pre-bending.
The steady roll-bending process is shown in Figure 2c, where continuous roll bending was the main process of the roll-bending forming. In this process, it is necessary to strictly control the speed and position of the upper roll and feed rate of the side roll. Based on pre-bending, the right roll descends to the corresponding position, the left roll rises to the corresponding position, and the upper roll rotates in the corresponding direction to drive the profile feeding for continuous roll-bending processing. The profile roll-bending process after end-face centering, pre-bending, and continuous roll bending is called the pre-bending side roll-lifting roll-bending process.
2.2. Tooling Design and Improvement
In contemporary aircraft component manufacturing, extruded profiles play a critical role in the production of various frame edges and elongated truss elements. These components, selected for their L- and Z-sections based on structural design requirements, are directly riveted to aircraft skin during assembly. Given the need for intricate theoretical shapes such as single, double, or multiple curvatures, the profiles must undergo bending and forming processes to conform to the skin shape. This ensures the seamless integration of the aircraft structure profile, thereby enhancing the overall structural strength. The bending and forming of profile components are prevalent manufacturing techniques for sheet metal parts, and the quality of these processes directly impacts the final product’s quality and aircraft’s manufacturing standards.
Let us consider the example of the long truss part of a specific aircraft’s fuselage with slightly adjusted parameters. Figure 2 shows a cross-sectional view of the profile, featuring a thickness of 2 mm and length of 1300 mm.
Using this cross-sectional data, we aim to design a standard roller tooling with the equipment closing height set at 154 mm. The design process is outlined in Equations (1) and (2), and the roller data are presented in Table 1.
is the height of the profile, and t is the thickness of the profile, as shown in Figure 3. , , , and represent the radius of the roller, , , , and represent the width of the roller, as shown in Figure 4b.
Based on the data in Table 1, the roller was modeled in solidworks 2018, and the three-dimensional diagram of the roller design is depicted in Figure 4.
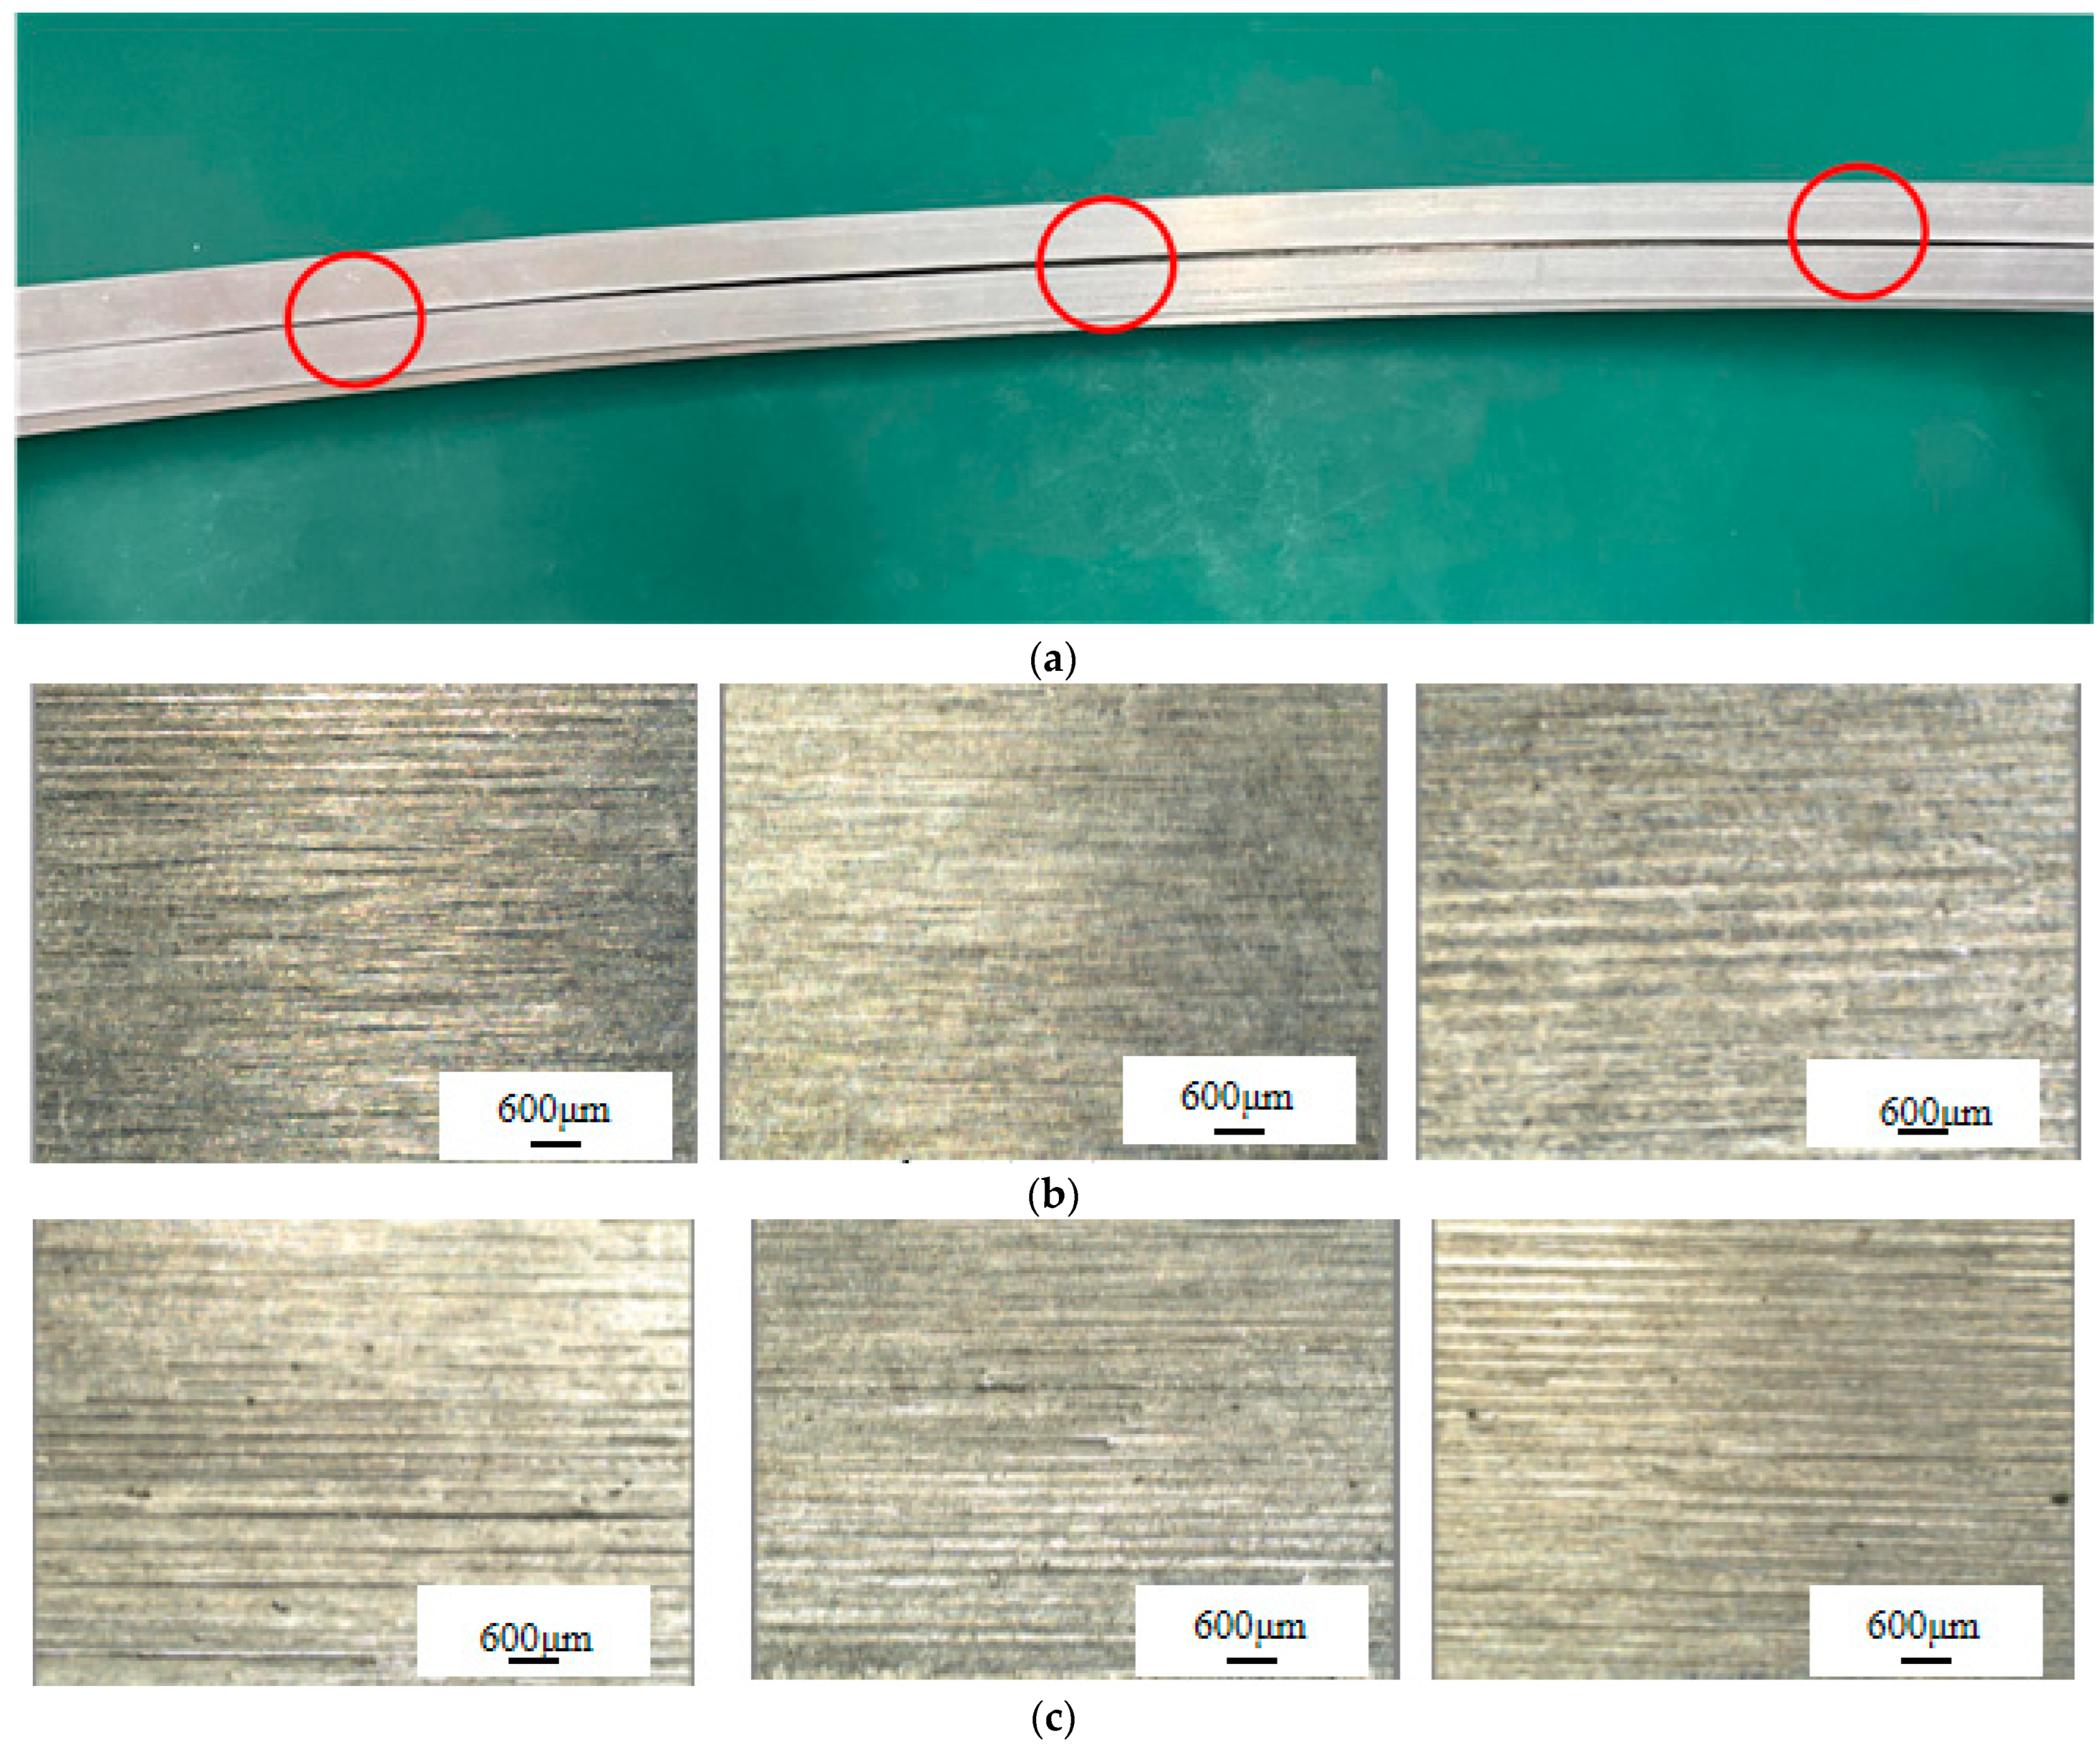
During actual processing, it was found that the surface of the profile was seriously scratched during the roll-bending process, resulting in poor quality stability. The mold was manufactured according to the model shown in Figure 3 and installed on the machine for profile-roll bending. However, the profile surface suffered from significant scratches and heavy indentation, which adversely affected the surface quality. Three positions on the profile surface were selected for observation using a VMA251 optical measuring instrument, and the results are shown in Figure 5. Shoots on the upper surface of the profile revealed severe scratching and excessive indentation, making it unsuitable for production requirements. Additionally, the formed parts require further corrective shaping to meet the design specifications, significantly affecting the processing efficiency of this type of profile. Therefore, an analysis was conducted to investigate excessive scratching and indentation. Under 0.2 mm focal length observation, it was evident that the profile surface had severe scratches that failed to meet the processing requirements.
Under the observation of a focal length of 0.1 mm, it is evident that the surface of the profile has severe scratches, making it difficult to meet the processing requirements. After research and analysis, it was determined that the roller structure used in roll-bending processes does not consider the clearance of the contact surface, assuming that the angular velocity of the upper roller is and the angular velocity of the lower roller is , as shown in Figure 4.
At
At
However, this tooling design results in inconsistent linear velocities at the contact points between the upper and lower rollers and at the surface of the part being formed. The primary function of the upper and lower rollers is to clamp and transmit parts to ensure stability during the roll bending. Given the high surface quality requirements, it is crucial to prevent slippage or surface scratching. To achieve this, it is essential that the rollers maintain the same linear speed while in contact with the parts. Traditional tooling design cannot ensure consistent linear velocity between the upper and lower roller contact surfaces, so it is necessary to leave gaps on one contact surface to avoid surface scratches and damage. The fixture design with reserved gaps is shown in Figure 6.
From the derivation of Formulas (3) and (4), it is evident that the roller structure depicted in Figure 4b leads to contradictory derivation results. Consequently, this roller structure fails to ensure consistent linear speed at the contact points between the roller and the part. In theory, the outer surface of the roller and the side of the curved profile are in the same plane. The main bearing surface of the part is typically selected as the contact surface, while the other surface must be maintained with a gap. The main supporting surface of the part is the surface where the lower roller contacts the profile.
During the roll-forming process, there was no gap between the upper roller and the profile on the contact surface (surface A). Consequently, the upper surface of the profile edge strip is extruded by the upper roller. Simultaneously, the linear speed of the upper roller at surface A was lower than that at surface B, causing varying linear speeds within the profile. This discrepancy leads to uneven forces and results in scratches and other types of damage. To ensure a smooth formation process, it is crucial to maintain an appropriate gap on one of the contact surfaces. This enables the rollers to effectively clamp and transmit the parts while preventing surface damage and ensuring a consistent linear speed contact.
Building on this research, an initial implementation of orthogonal experiments was conducted to determine the appropriate size of the gap, with the aim of enhancing the surface quality of the profile during processing. The improved formula for roller tooling design is as follows: (6) set the upper roller gap to , and (5) adjust the clearance of the lower roller to .
is the gap between the upper roller and surface of the profile, and is the gap between the lower roller and surface of the profile, as shown in Figure 6.
2.3. Establishment of Finite Element Model for Four-Roll Bending
2.3.1. Mechanical Property Testing of 6063-T5 Aluminum Alloy
To perform material modeling in the 6063-T5 simulation, mechanical performance parameters of the profile material were required. Therefore, tensile tests were conducted on the profile material to determine its mechanical properties. First, the tensile specimens were prepared according to the GB/T228.1-2010 standard, as shown in Figure 7. The sample thickness is 3.13 mm. The WDW3200 microelectronic universal testing machine was used for the tensile test at a rate of 2 mm/min. The mechanical properties of 6063-T5 aluminum alloy are summarized in Table 2.
The finite element simulation method offers advantages such as shorter test cycles and lower costs. Additionally, it enables a more accurate analysis of the laws and relationships among variables in the forming process. Consequently, this method has found wide application in various fields of profile roll-bending analysis [23], and it is regarded as the most effective approach for profile bending research [24,25]. Based on this, a dynamic finite element model of the four-roller roll-bending process was developed using the finite element software ABAQUS. The purpose of establishing this finite element model is to study the effect of different gaps between the surface of the upper roller and the profile on the surface of the profile.
2.3.2. Build Geometric Model
A finite element model was established based on the data of a four-roll-bending machine; the large roll diameter is 200 mm, its small diameter is 104 mm, the side roll inclination is 25°, and the deformation of the roll is small and negligible; therefore, it is defined as discrete rigid. When the profile undergoes elastic–plastic deformation in the roll-bending process, it must be defined as deformable. A deformable plane strain element was selected, the 4-node linear reduced integral element CPS4R was used, and the plate was divided into 3-layer grids along the thickness direction, as shown in Figure 8. The friction coefficient between the upper and lower rollers and the sheet metal was set to 0.15 [26]. During rolling and bending, the upper roller is the active roller, and its rotation of the upper roller drives the feeding of the profile.
2.3.3. Material Properties
In this simulation test, a 6063-T5 aluminum alloy steel plate was used for the four-roll-bending simulation. It was assumed that the sheet material was isotropic, and the influence of the sheet weight on roll bending was not considered. Elastoplastic deformation of the profile occurs during roll bending; therefore, the constitutive relation of the profile must be set in ABAQUS. As the bilinear hardening model can better fit the real constitutive relationship of materials, this study used the bilinear-hardening model to define the constitutive relationship of plates to simulate the plastic deformation of plates in the process of roll bending. The constitutive equation is given by (7).
Among them, is the stress/MPa, is the yield limit/MPa, is the strain, is the elastic strain limit, is Young’s model/MPa, and is the strengthening coefficient.
2.3.4. Contact Definition and Constraint
The penalty function contact mode was adopted, the friction coefficient between the roller and profile was defined as 0.15, and the roller and sheet were defined as having a limited relative slip. When the profile is continuously rolled and bent, the upper and lower rollers can rotate only around their respective axes. The side rollers can not only rotate around their axes but also feed along a fixed oblique line (see Table 3 for constraint types).
2.3.5. Effects of Different Loading Methods
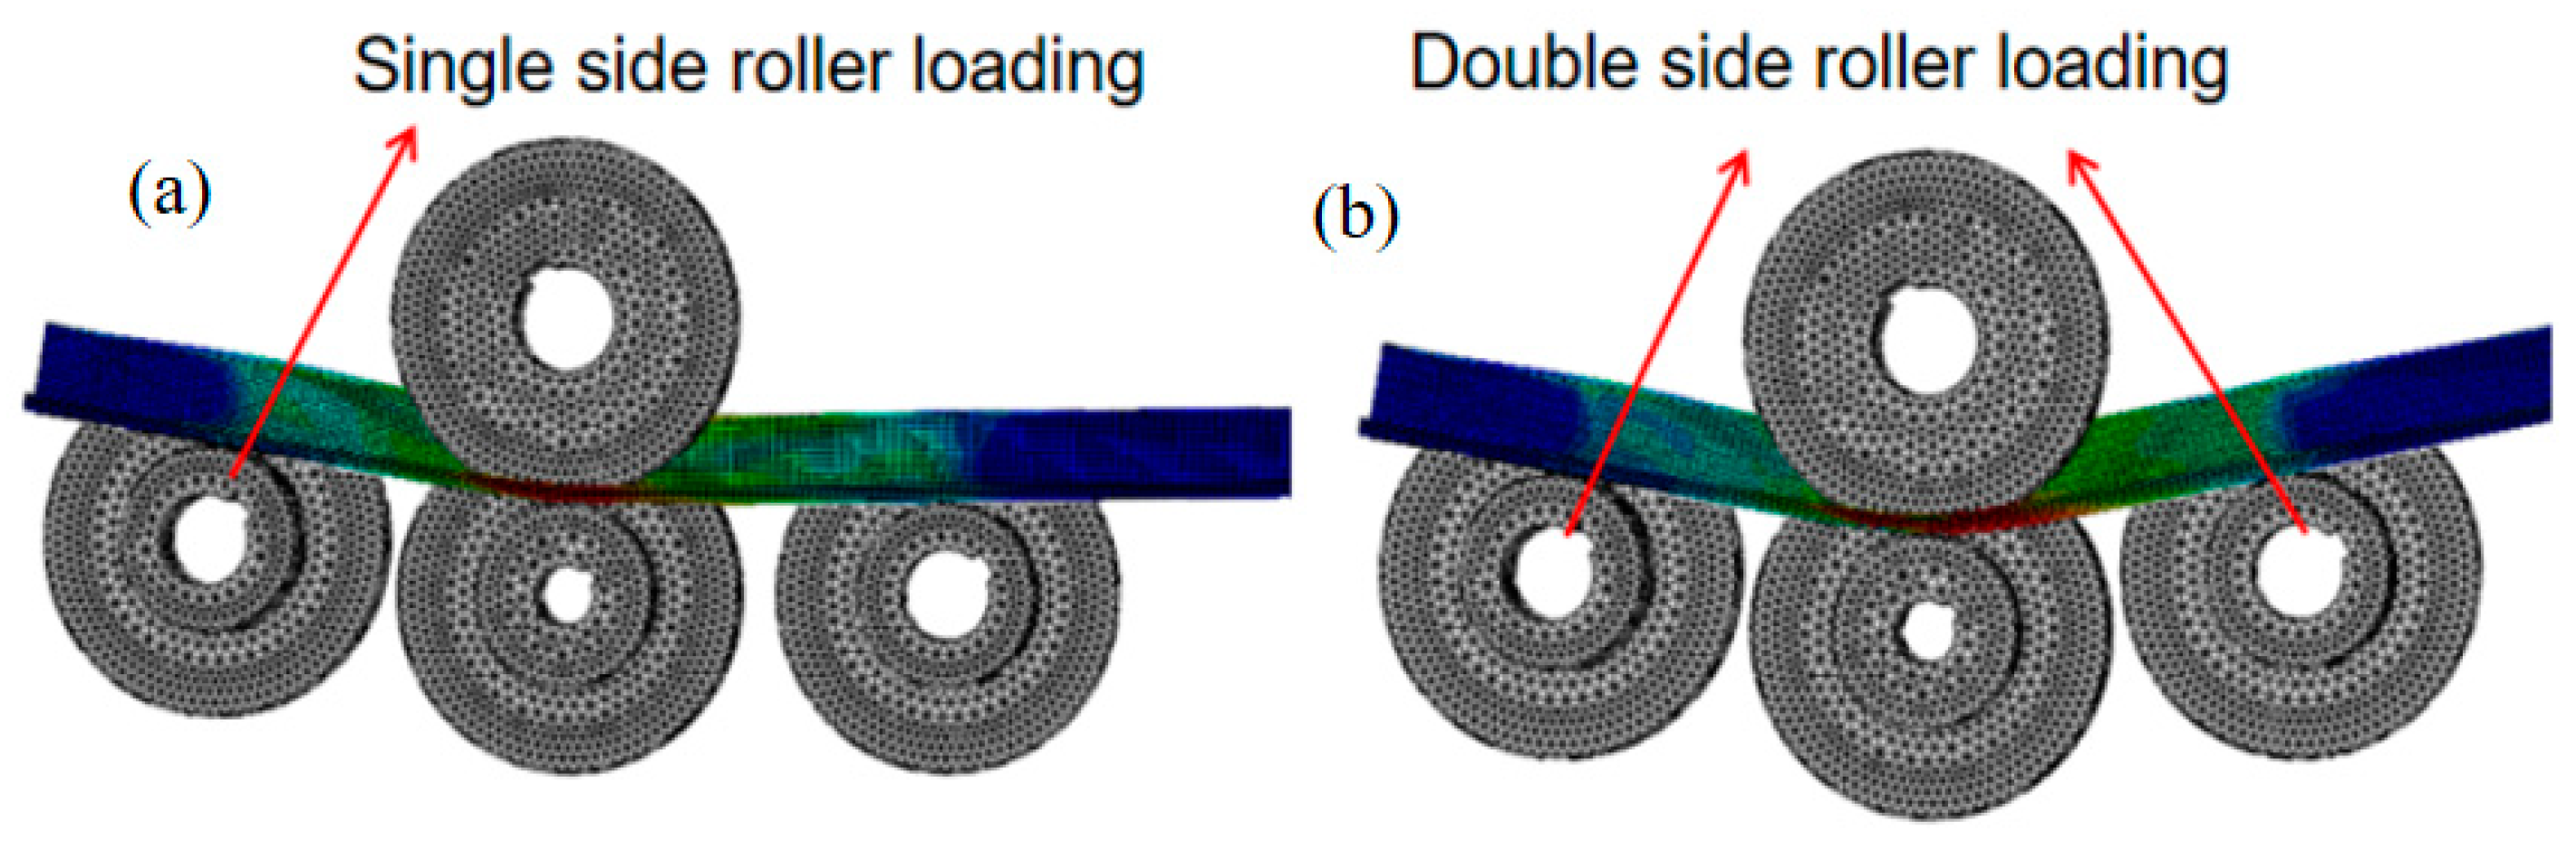
The four-axis roll-bending machine offers two modes of operation: single-sided roll loading and double-sided roll loading. However, this deformation did not occur when single-sided roll feeding was used. Consequently, simulations were conducted for both feeding methods to further investigate this phenomenon.
The equivalent plastic strain is a physical quantity used to determine the position of the yield surface of a material after strengthening. For example, in experiments, we obtained the elastic–plastic stress–strain curve of the material under uniaxial tension. In reality, the stress state of the structure is often a spatial stress state, which is also the spatial yield when yielding, and by calculating the equivalent plastic strain, we can find the equivalent stress corresponding to the strain state after plastic yield and the spatial stress state of the structure at this time [26]. The equivalent plastic strain curves for both single-side and double-side roll loadings demonstrate that profile deformation is a gradual loading process that occurs throughout the roll-bending process. Figure 9a shows the single side roller loading method, and Figure 9b shows the double side roller loading method. Figure 10 shows the equivalent plastic strain distribution, the equivalent plastic strains at the same position for single-side and double-side roll loading were 0.108 and 0.135. This indicates a 19.6% decrease in the equivalent plastic strain at the same position, which is significantly lower for single-side roll loading than for double-side roll loading. By reducing the stress concentration zone and lowering the stress value, the utilization of single-sided roll loading can effectively avoid wrinkling. Therefore, subsequent studies have focused on single-side roller feeding methods.
2.3.6. Model Accuracy Verification
Only when the accuracy of the finite element model is verified can subsequent research be conducted. We conducted an inspection based on the most important forming curvature in profile rolling forming. Then, we performed error analysis on the finite element simulation results and the formed curvature of the profile after processing on the experimental bench at side roll feeds of 20, 30, 40, and 50 mm.
Because ABAQUS does not directly measure the radius of curvature, the radius must be indirectly calculated based on the three-point rounding principle. The coordinates of the first, second, and third points are (X1, Y1), (X2, Y2), and (X3, Y3), respectively. The corresponding horizontal and vertical coordinates of the center of the circle are shown in (9) and (10), respectively.
Horizontal coordinate of the center of a circle
Center ordinate
Then, the radius of curvature is:
Taking the simulation results of the profile-side roller feed 50 as an example, node 25061 is (−4.76945 × 10², 5.6 × 10²), node 18,985 is (−4.38479 × 10², 3.30501 × 10²), and node 13638 is (−3.23989 × 10², 1.67293 × 10²), and by substituting Equations (8)–(11), 4888.4 mm can be obtained.
We conducted rolling bending experiments on 6063T-5 aluminum alloy and pasted the processed profiles with reflective stickers, as shown in Figure 11a. Finally, a 333 CREAFORM portable 3D scanner was used to scan and model the processed contour, as shown in Figure 11b. To ensure the accuracy of the contour curvature, reverse unfolding is used to obtain the curvature of the processed contour.
As shown in Table 4, the experimental results showed an error range of 2% to 5% compared to the simulation results with an average error of 3.4%%. The accuracy and reliability of the finite element model were validated by Wang’s [27,28] simulation of sheet metal forming, which exhibited an error within 7% when compared to the bending test data. Zhou’s [29] research on profile roll bending demonstrated a high precision with a forming radius error of less than 4% in finite element simulations, providing guidance for practical applications. The error range between the experimental and simulation results in this study was within 1% to 5%, with an average error of 3.4%; the error is within an acceptable range and can be applied in subsequent research.
2.4. Orthogonal Experiment
To minimize surface scratches on the profiles, the curved main bearing surface is typically chosen as the contact surface, whereas a gap must be left on the other surface. The gap between the roller and the profile should not be excessively large, as it would hinder compression and result in an inconsistent curvature between the upper and lower surfaces of the Z-profile. Hence, simulations were conducted within the range of 0.1 to 0.4 mm, which is consistent with the actual production experience. An orthogonal experimental design was used within the range of the 0.1–0.4 mm gap. The upper and lower rollers are shown in Figure 4, and the gap is shown in Figure 6.
A two-factor, four-level orthogonal experimental design was conducted, as shown in Table 5.
3. Results and Discussion
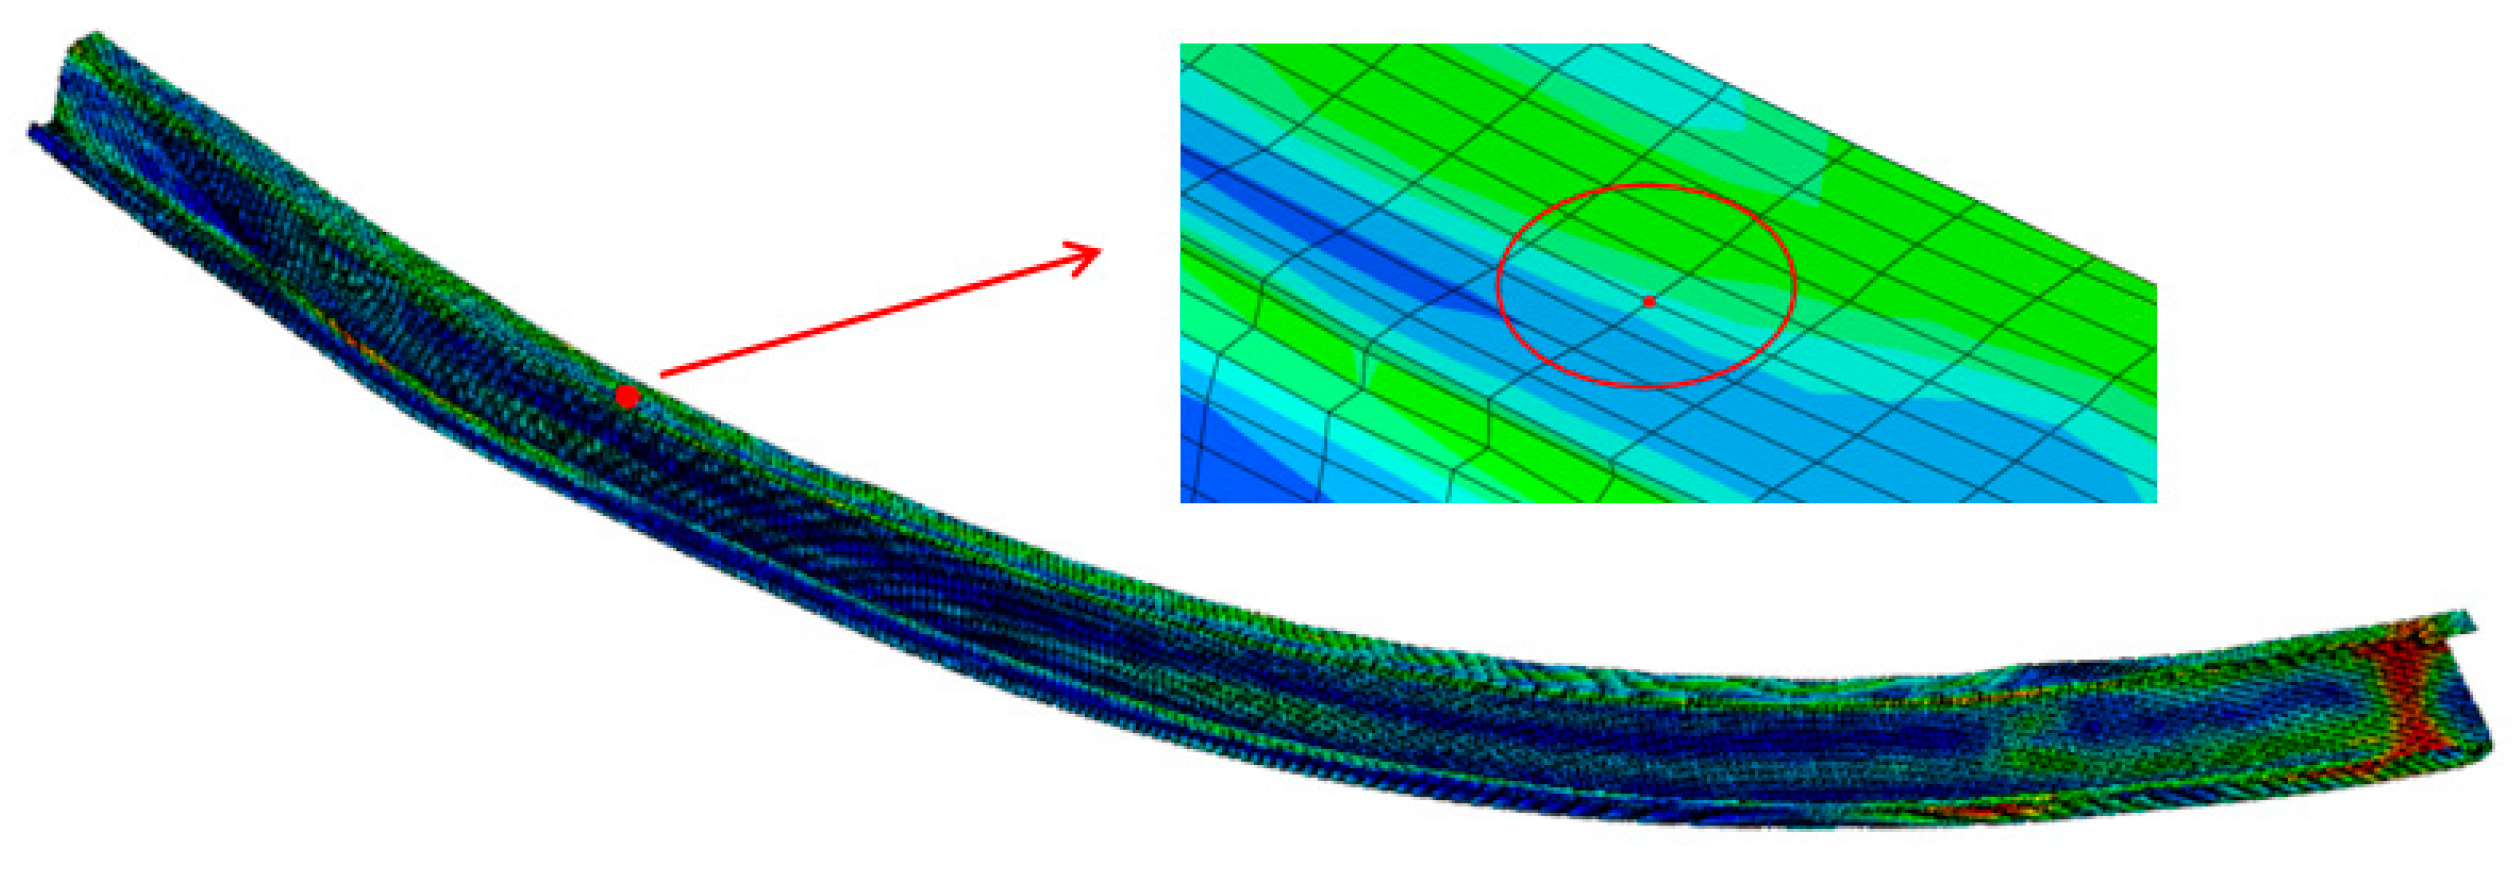
In a study by TIAN [30], it was found that the maximum strain in the scratched area increased significantly with an increase in depression depth compared to the non-scratched area, and the scratch defect significantly exacerbated the stress concentration. Therefore, the maximum stress and equivalent plastic strain were used as evaluation indicators. The surface quality increases with the decrease in equivalent plastic strain and stress, while scratches decrease with the decrease in equivalent plastic strain and stress. First, 16 simulations were conducted with different gap values on the upper and lower surfaces of the roller; the experimental labels are listed in Table 6. Therefore, the maximum stress and equivalent plastic strain values were obtained for the same position of the profile for analysis, and the maximum stress and equivalent plastic strain of the 16 groups of experiments after simulation are shown in Table 6.The data query location is shown in red punctuation in Figure 12.
3.1. Result Analysis
The intuitive range analysis method analyzes problems by analyzing the average range of each factor. The range is the difference between the maximum and minimum values of the average effect. By using a range, we can identify the main factors that affect the indicators and help us find the optimal combination of factor levels. The purpose of the range analysis is to evaluate the dispersion of a set of data using the maximum minimum value (i.e., range). Based on range analysis, the degree of influence of the different gaps on the evaluation indicators can be determined. We performed a range [31] analysis of various factors based on the results in Table 6. The results of the analysis are presented in Table 7. Range analysis can be used to study orthogonal test data, including the advantages or disadvantages of specific levels between factors. Here, () is the average value of the () evaluation index under the () level of a certain parameter. = 1 and 2 represent two levels; = 1, 2 represents the evaluation index stress and equivalent plastic strain 1 is the corresponding range, and according to Table 7, the impact of various factors on the evaluation indicators is analyzed, as shown in Figure 13a,b.
- Influence of Clearance Level on Stresses: The upper roller clearance has a more significant impact on stresses than the lower roller clearance. Stresses demonstrate an increasing and then decreasing pattern with increasing upper roller clearance.
- The Effect of Gap Level on Equivalent Plastic Strain: The effect of the upper roller gap on equivalent plastic strain is greater than that of the lower roller gap. The equivalent plastic strain tends to decrease first and then increase as the gap between the upper roller and the roller increases, and as the gap between the lower rollers increases, it keeps increasing.
3.2. Parameter Optimization
Firstly, using stress as the evaluation indicator, the minimum level of stress is selected as the optimal level, as shown in Figure 13a. The optimal level of A is 4, and the optimal level of B is 3; that is, the gap between the upper surface and the roller is 4 mm, and the gap between the lower roller and the surface is 3 mm.
Using equivalent plastic strain as the evaluation indicator, the minimum equivalent plastic strain is selected as the optimal level, as shown in Figure 13b. The optimal level of A is 2, and the optimal level of B is 1; that is, the gap between the upper surface and the roller is 2 mm, and the gap between the lower roller and the surface is 1 mm.
However, as shown in Table 7, R1 is larger than R2. The range R reflects the amplitude of change in the experimental indicators when the factor level fluctuates. Therefore, the larger the range of R, the greater the impact of this factor on the experimental indicators. Therefore, a gap of 4 mm between the upper surface and the roller, and a gap of 3 mm between the lower roller and the surface, were selected as the optimal level, and experimental verification was conducted. The size of the roller was modified according to Equations (5) and (6), as shown in Figure 14. The improved roller dimensions are listed in Table 8. From Figure 15, it can be clearly seen that the two improved clearances have significantly improved compared to no gaps left.
3.3. Discussion
A comparative analysis was conducted on the simulation results of profiles processed without roller gaps on the upper and lower surfaces as well as profiles processed with the optimal stress level and equivalent plastic strain level. We extracted equivalent plastic strain and stress values at the same location as node 26,059. The stress is shown in Figure 15a, and the equivalent plastic strain is shown in Figure 15b.
From Figure 15, it is evident that the profile with optimal clearances exhibits a significant reduction in the equivalent plastic strain compared to the profile without clearances at the same position. The gap between the upper roller and the surface is 0.4 mm, and the gap between the lower roller and the surface is 0.3 mm. Compared with no gap left, the maximum stress decreases from 225.6 to 204.1 MPa, and the equivalent plastic strain decreases from 0.032 to 0.019. It can be seen that the surface quality of the profile processed with a gap has been improved.
Based on range analysis, the roller was reprocessed with optimal clearances. The profiles were processed using both the roller fixture designs with and without clearances, as shown in Figure 16a. The top profile in Figure 16a represents the profile processed with clearances, whereas the bottom profile represents that processed without clearances.
Using the VMA251 optical measuring instrument with a focal length of 0.2 mm, the profile surfaces at the same three positions were observed for both the profile processed without clearances and that processed with clearances. It is evident from Figure 16b that the surface quality of the profile processed with clearances was significantly better than that of the profile processed without clearances, as shown in Figure 16c. Overall, the profile processed with optimal clearances effectively reduces the occurrence of scratches and improves the surface quality of the profile. This is particularly beneficial in high-precision fields such as the aviation and automotive industries because it reduces processing steps and improves processing efficiency. The use of orthogonal experiments allows for a more comprehensive consideration of the effects of different clearances between the roller and upper and lower surfaces. Compared to traditional experimental methods, finite element simulation methods improve the processing efficiency and reduce material waste. Additionally, finite element simulation methods can provide accurate clearance values rather than just a range of clearances, thereby further enhancing their effectiveness.
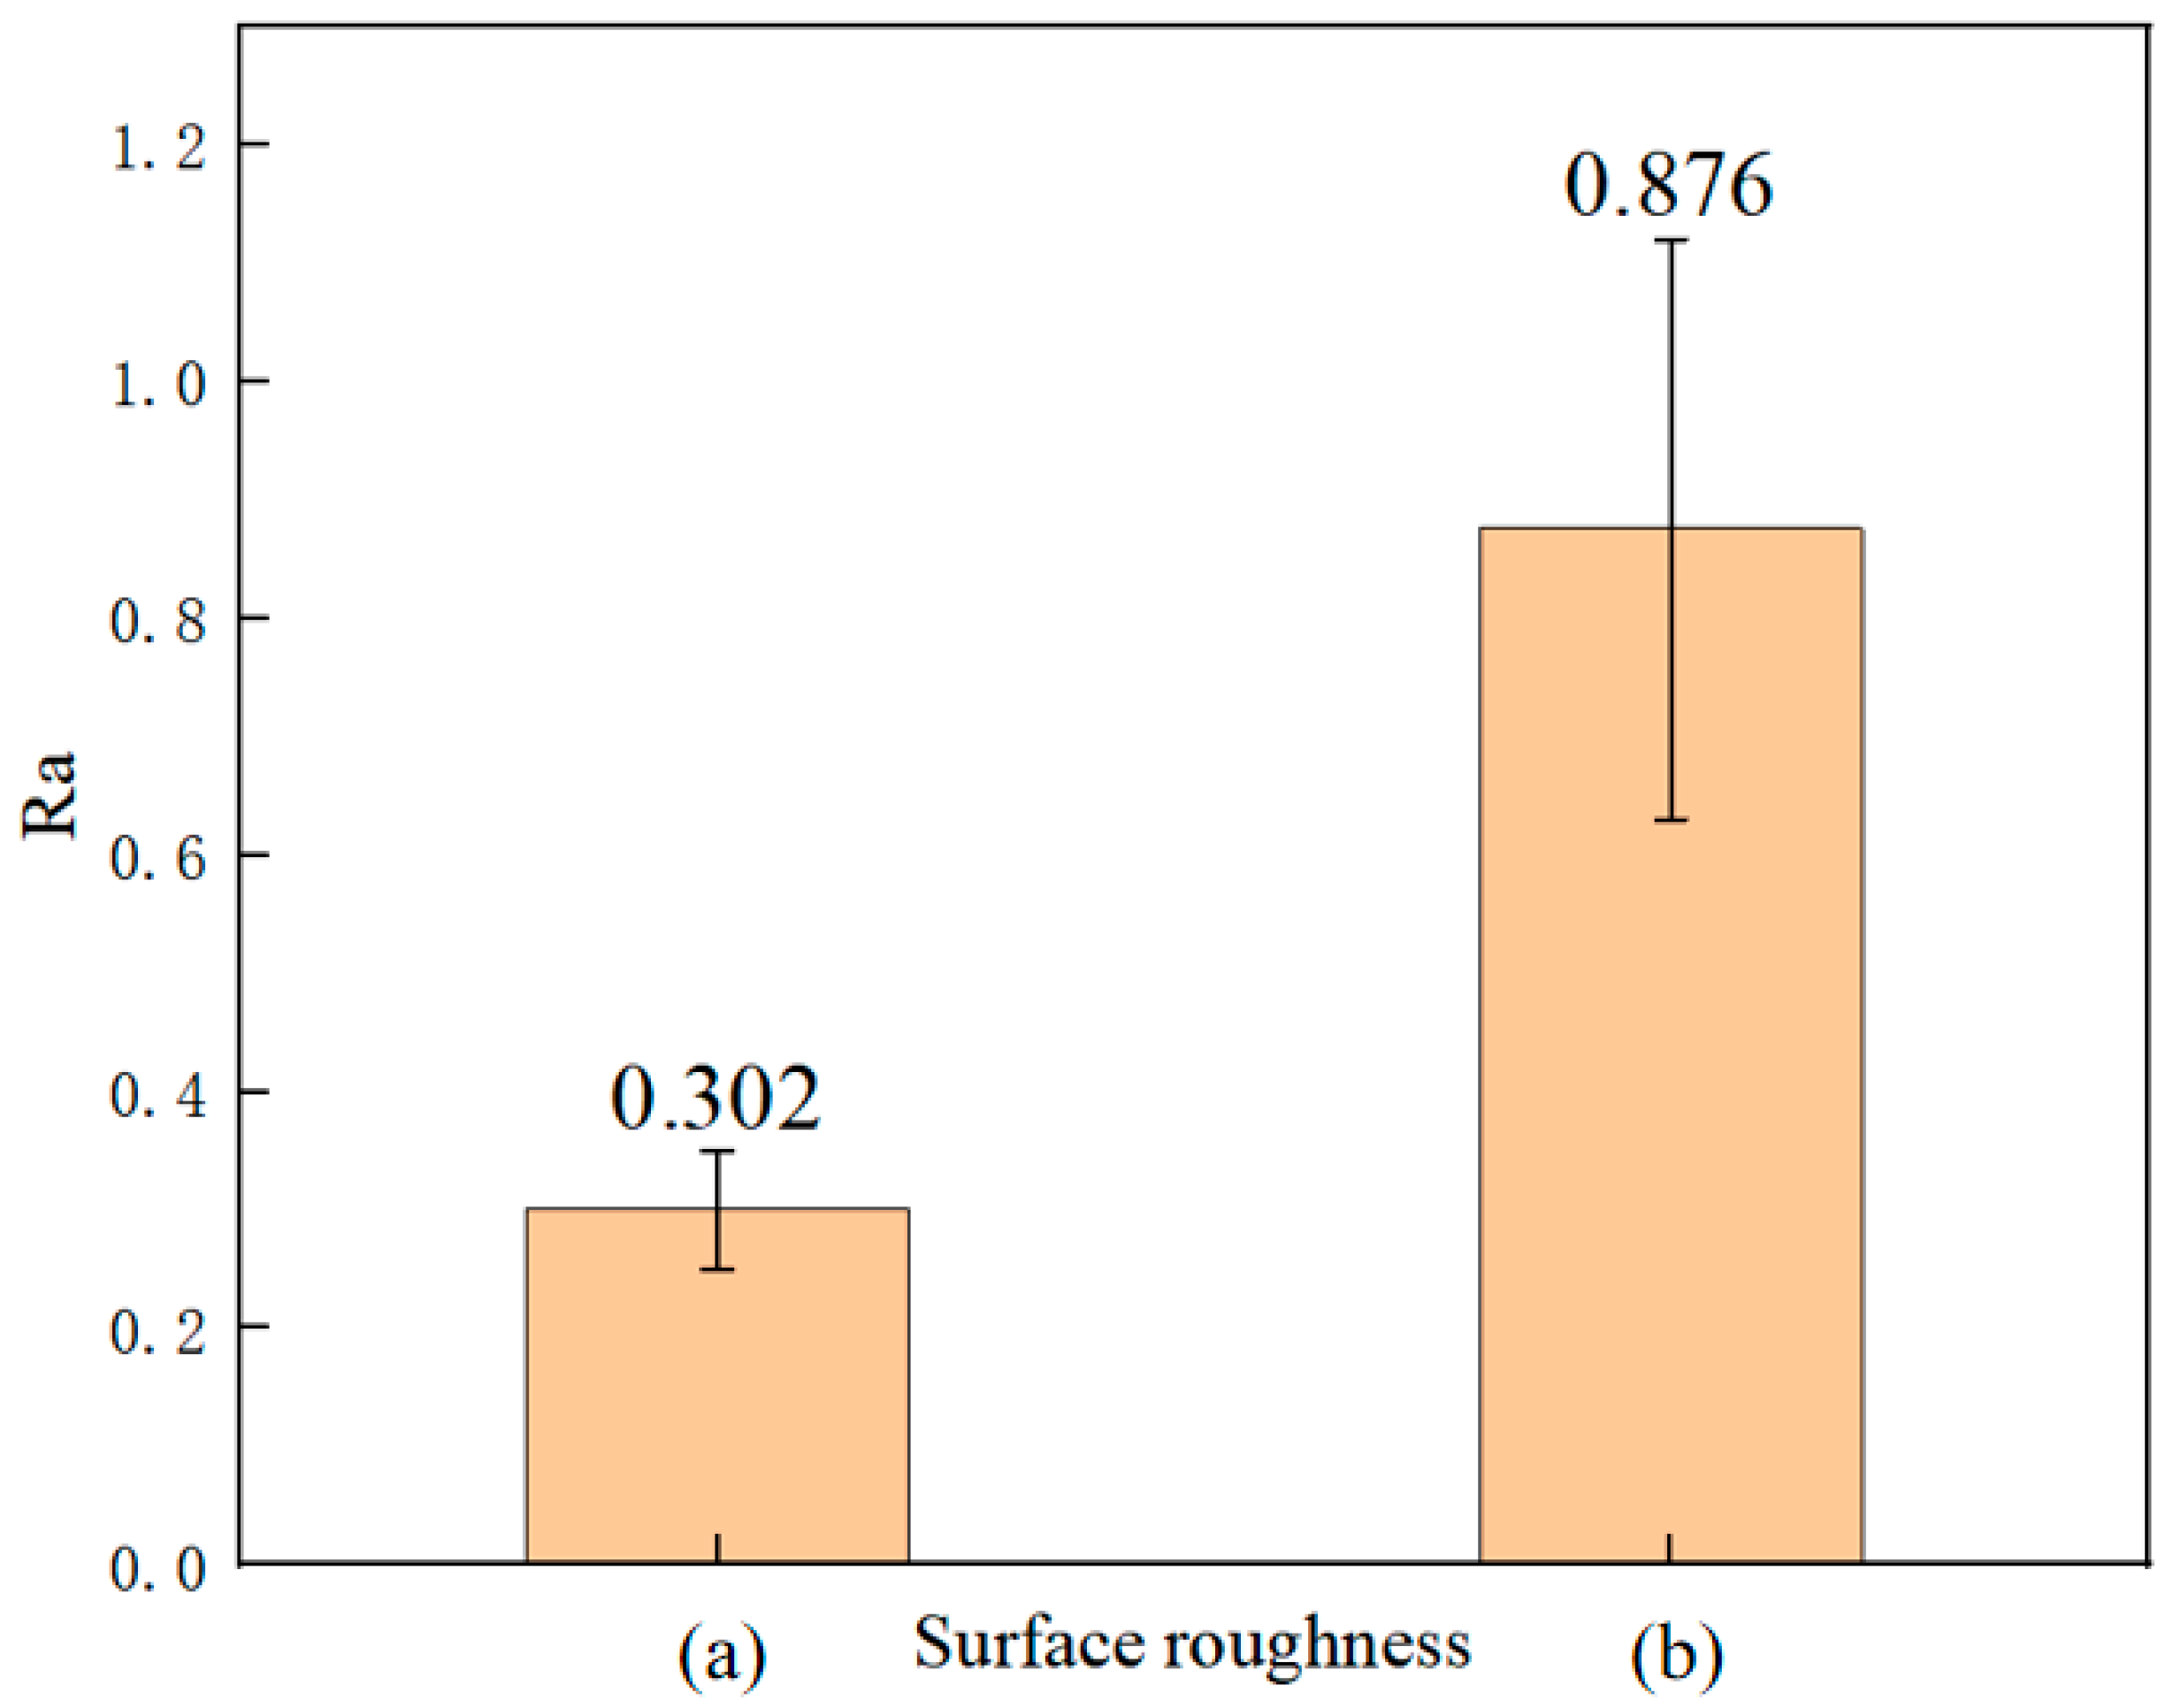
A quantitative inspection was conducted on the surface quality of the profiles processed with different gaps using an Era TR110 portable roughness meter. The obtained data are shown in the following figure. The data are the average values of five sets of measurements. In Figure 17a represents the surface roughness of the profiles without gap processing, and Figure 17b represents the surface roughness of the profiles with gap processing. Evidently, the surface quality of the profile improved significantly.
4. Conclusions
An orthogonal experimental design was used to investigate different roller clearances, and a range analysis of the results was performed to determine the optimal clearances. The results showed that the optimal clearance for the roller and upper surface of the profile was 0.4 mm, and the optimal clearance for the roller and lower surface of the profile was also 0.3 mm. Based on these optimal clearances, a new fixture design for rollers was implemented. The surface quality of the profile was significantly improved compared to that processed without clearances. This analysis method provides a more scientific approach for determining roller clearances in profile roll-bending research.
- This study analyzed and addressed issues such as increased scratching and poor quality on the surface of the profile during bending using regular rollers. It was determined that the inconsistent linear velocities between the upper and lower surfaces of the profile were the main cause of poor surface quality. The proposed solution involved maintaining clearances at the contact interface between the roller and profile.
- Finite element simulation was used to simulate the different experiments, and a range analysis was performed on the simulation results. The gap between the upper roller and the surface is 0.4 mm, and the gap between the lower roller and the surface is 0.3 mm. Compared with no gap left, the maximum stress decreases from 225.6 to 204.1 MPa, and the equivalent plastic strain decreases from 0.032 to 0.019. It can be seen that the surface quality of the profile processed with a gap has been improved. It has been proven that leaving gaps between the roller and the upper and lower surfaces can reduce the equivalent plastic strain on the surface of the profile, thereby reducing damage to the surface of the profile.
- Based on the optimal clearances, a new fixture design for rollers was implemented. A VMA251 optical measuring instrument was used to observe the surface of the profile after processing with improved rollers. The quality of the profile processed with improved rollers was significantly better than that of the profile processed without improvements. The results indicate that using a finite element simulation to determine roller clearances is a scientifically sound method. Compared with traditional experimental methods, it reduces material waste, improves clearance optimization, and enhances processing efficiency.
In the future, we will focus on a combination of theory and practice, improve the self-designed and manufactured four-roll CNC bending machine, analyze methods that can improve the accuracy of profile forming, and better apply finite element simulation methods to solve engineering problems.
Author Contributions
Y.J. contributed to the study conception and design, material preparation, model establishment, and data analysis. Supervision and modifications were conducted by Q.S. and Y.Z. The first draft of the manuscript was written by Y.J., and all the authors commented on the previous versions of the manuscript. All authors have read and agreed to the published version of the manuscript.
Funding
Liaocheng’s key R&D plan was developed to create a special project to tackle common technical problems (No. 2021GGJBG005). This study was supported by the Discipline with Strong Characteristics of Liaocheng University—Intelligent Science and Technology, under Grant 319462208.
Data Availability Statement
The datasets used and/or analyzed during the current study are available from the corresponding author upon reasonable request.
Conflicts of Interest
The authors declare no conflict of interest.
References
- Mercuri, A.; Fanelli, P.; Giorgetti, F.; Rubino, G.; Stefanini, C. Experimental and numerical analysis of roll bending process of thick metal sheets. In Proceedings of the IOP Conference Series: Materials Science and Engineering, Sanya, China, 12–14 November 2021; IOP Publishing: Bristol, UK, 2021; Volume 1038, p. 012067. [Google Scholar]
- Fu, Z.; Mo, J.; Zhang, W. Study on multiple-step incremental air-bending forming of sheet metal with springback model and FEM simulation. Int. J. Adv. Manuf. Technol. 2009, 45, 448–458. [Google Scholar] [CrossRef]
- Paralikas, J.; Salonitis, K.; Chryssolouris, G. Investigation of the effect of roll forming pass design on main redundant deformations on profiles from AHSS. Int. J. Adv. Manuf. Technol. 2011, 56, 475–491. [Google Scholar] [CrossRef]
- Feng, Z.; Champliaud, H. Comparison between numerical simulation and experimentation of asymmetrical three-roll bending process. In Proceedings of the ASME International Mechanical Engineering Congress and Exposition, Vancouver, BC, Canada, 12–18 November 2010; Volume 44274, pp. 33–37. [Google Scholar]
- Yu, J.; Zhao, G.; Chen, L. Investigation of interface evolution, microstructure and mechanical properties of solid-state bonding seams in hot extrusion process of aluminum alloy profiles. J. Mater. Process. Technol. 2016, 230, 153–166. [Google Scholar] [CrossRef]
- Lou, S.; Zhao, G.; Wang, R.; Wu, X. Modeling of aluminum alloy profile extrusion process using finite volume method. J. Mater. Process. Technol. 2008, 206, 481–490. [Google Scholar] [CrossRef]
- Hua, M.; Baines, K.; Cole, I.M. Bending mechanisms, experimental techniques and preliminary tests for the continuous four-roll plate bending process. J. Mater. Process. Technol. 1995, 48, 159–172. [Google Scholar] [CrossRef]
- Cai, Z.Y.; Li, M.Z.; Lan, Y.W. Three-dimensional sheet metal continuous forming process based on flexible roll bending: Principle and experiments. J. Mater. Process. Technol. 2012, 212, 120–127. [Google Scholar] [CrossRef]
- Baek, G.Y.; Shim, D.S. FE Simulation-based process design for manufacturing structural members of commercial vehicle using pipes with rectangular Cross-Sections. Int. J. Precis. Eng. Manuf. 2015, 16, 723–733. [Google Scholar] [CrossRef]
- Wan, L.; Liu, R.; Deng, Y.; Tang, J.; Zhang, Y. The effect of aging process on the crushing performance of 6061 aluminum alloy profiles for automobiles. Mater. Introd. 2021, 35, 8099–8102. [Google Scholar]
- Dong, L.; Xie, F.; Chen, L.; Liu, Z.; Meng, X.; Li, Q.; Li, P. The effect of trace elements on the bending performance of aluminum alloy anti-collision beams. Non Ferr. Mater. Eng. 2021, 42, 37–41. [Google Scholar]
- Li, C.; Zhou, W.; Deng, Y.; Li, J. Bending and Forming Manufacturing Technology of Aluminum Alloy Shapes for Rail Transit and Automobiles. In Proceedings of the 2018 China Aluminum Processing Industry Annual Conference, Foshan, China, 26–27 June 2018; China Nonferrous Metal Processing Industry Association: Beijing, China, 2018. [Google Scholar]
- Hua, M.; Baines, K.; Cole, I.M. Continuous four-roll plate bending: A production process for the manufacture of single seamed tubes of large and medium diameters. Int. J. Mach. Tools Manuf. 1999, 39, 905–935. [Google Scholar] [CrossRef]
- Hua, M.; Lin, Y.H. Large deflection analysis of elastoplastic plate in steady continuous four-roll bending process. Int. J. Mech. Sci. 1999, 41, 1461–1483. [Google Scholar] [CrossRef]
- Zhou, Y. Improvement of the roller structure for profile rolling and bending processing. Technol. Inf. Acad. Res. 2007, 36, 424–426. [Google Scholar]
- Luo, Z.; Wen, S.; Hu, Y.; Chen, Z.; Wu, J. Roll bending forming and roller design of aluminum lithium alloy I-shaped profiles. Mold Manuf. 2015, 15, 77–80. [Google Scholar] [CrossRef]
- Hu, Z.; Chen, M.; Xie, L. Skew bending control of 4-axis rolling bending of aluminum lithium alloy profiles in 1999-T83. Rare Met. Mater. Eng. 2017, 46, 2957–2962. [Google Scholar]
- Chen, P.; Xue, H.; Wang, J.; Zhang, X.; Liu, P. Uniform-curvature arc approximation algorithm and its implementation of CNC rollbending for Z-shaped variable curvature profiles. Mater. Sci. Technol. 2014, 22, 68–73. [Google Scholar]
- Li, F. Study on Mathematical Model for Roll-Bending Plastic Forming of Sheet Metal; Fudan University: Shanghai, China, 2002. [Google Scholar]
- Zeng, G.; Lai, X.M.; Yu, Z.Q.; Lin, Z.Q. Numerical simulation and sensitivity analysis of parameters for multi-stand roll forming of channel section with outer edge. J. Iron Steel Res. Int. 2009, 16, 32–37. [Google Scholar] [CrossRef]
- Bettaieb, M.B.; Lemoine, X.; Duchêne, L.; Habraken, A.M. Simulation of the bending process of hardening metallic sheets using damage model. Part I: Theoretical development and numerical implementation. Mater. Sci. Eng. A 2010, 528, 434–441. [Google Scholar] [CrossRef]
- Chen, G.; Wang, Y. Simulation of profile roll-bending and analysis of stress strain. J. Shaanxi Univ. Sci. Technol. Nat. Sci. Ed. 2012, 30, 94–96. [Google Scholar]
- Wang, A.; Xue, H.; Bayraktar, E.; Yang, Y.; Saud, S.; Chen, P. Analysis and control of twist defects of aluminum profiles with large z-section in roll bending process. Metals 2019, 10, 31. [Google Scholar] [CrossRef] [Green Version]
- Zhan, M.; Yang, H.; Huang, L.; Gu, R. Springback analysis of numerical control bending of thin-walled tube using numerical-analytic method. J. Mater. Process. Technol. 2006, 177, 197–201. [Google Scholar] [CrossRef]
- Panthi, S.K.; Ramakrishnan, N.; Pathak, K.K.; Chouhan, J.S. An analysis of springback in sheet metal bending using finite element method (FEM). J. Mater. Process. Technol. 2007, 186, 120–124. [Google Scholar] [CrossRef]
- Yu, H.Q.; Chen, J.D. Principles of Metal Plastic Forming; China Machine Press: Beijing, China, 1999. [Google Scholar]
- Wang, Y.; Hu, J.; Xu, G.; Li, S.; Xiong, W. Numerical simulation and experimental verification of three roll asymmetric rolling forming. China Mech. Eng. 2016, 27, 2085–2090. [Google Scholar]
- Wang, Y.; Hu, J.; Xu, G.; Wang, J.; Li, S. Mechanism and experimental analysis of four roll pre bending and continuous roll bending forming. J. Plast. Eng. 2016, 23, 69–75. [Google Scholar]
- Zhou, C.; Sun, Y.; Liu, Q.; Chang, X.; Wu, K.; Sheng, Y. Calculation and Numerical Simulation of Side Roll Displacement in Four Roll Continuous Rolling Bending. Forg. Technol. 2017, 42, 36–42. [Google Scholar] [CrossRef]
- Tian, Y.; Zhu, L.; Luo, J.; Hui, W.; Que, Y.; Wu, G.; Zhou, H. Study on stress and strain characteristics of composite scratch dent zone of X80 pipeline. J. Plast. Eng. 2021, 28, 177–182. [Google Scholar]
- Zhang, C. Experimental Design and Data Processing; Chemical Industry Press: Beijing, China, 2009. [Google Scholar]
Figure 1.
Four-roller CNC roll-bending machine.

Figure 2.
(a–c) Roll-bending process flow(the arrows in the figure represent the forward direction of each roller).
Figure 2.
(a–c) Roll-bending process flow(the arrows in the figure represent the forward direction of each roller).
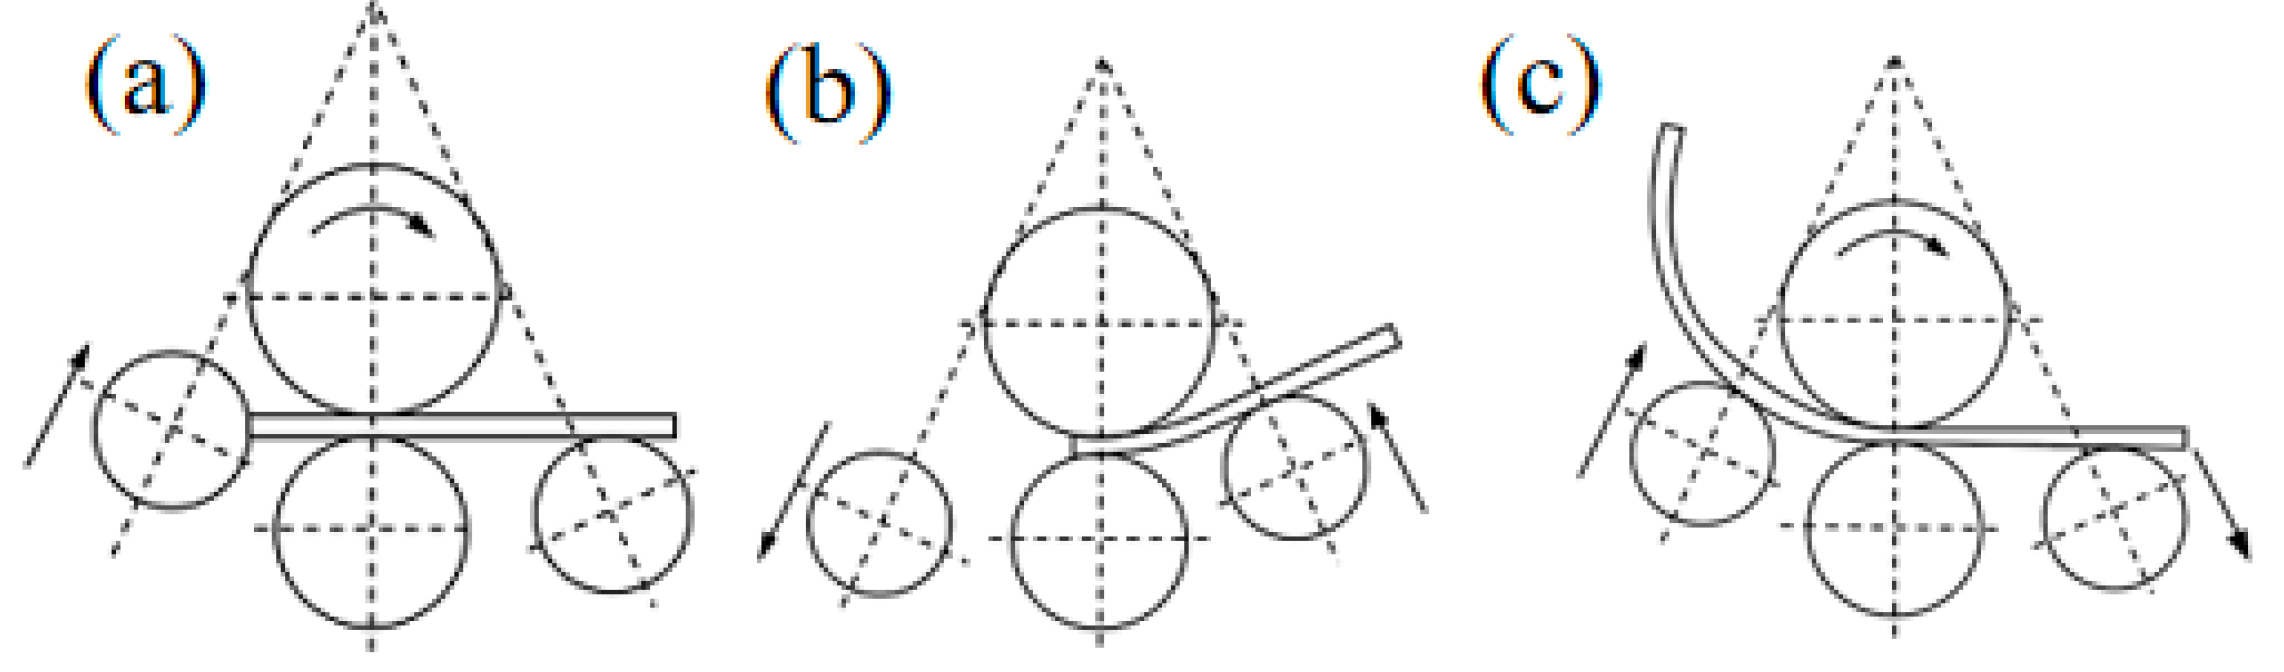
Figure 3.
Profile section data.
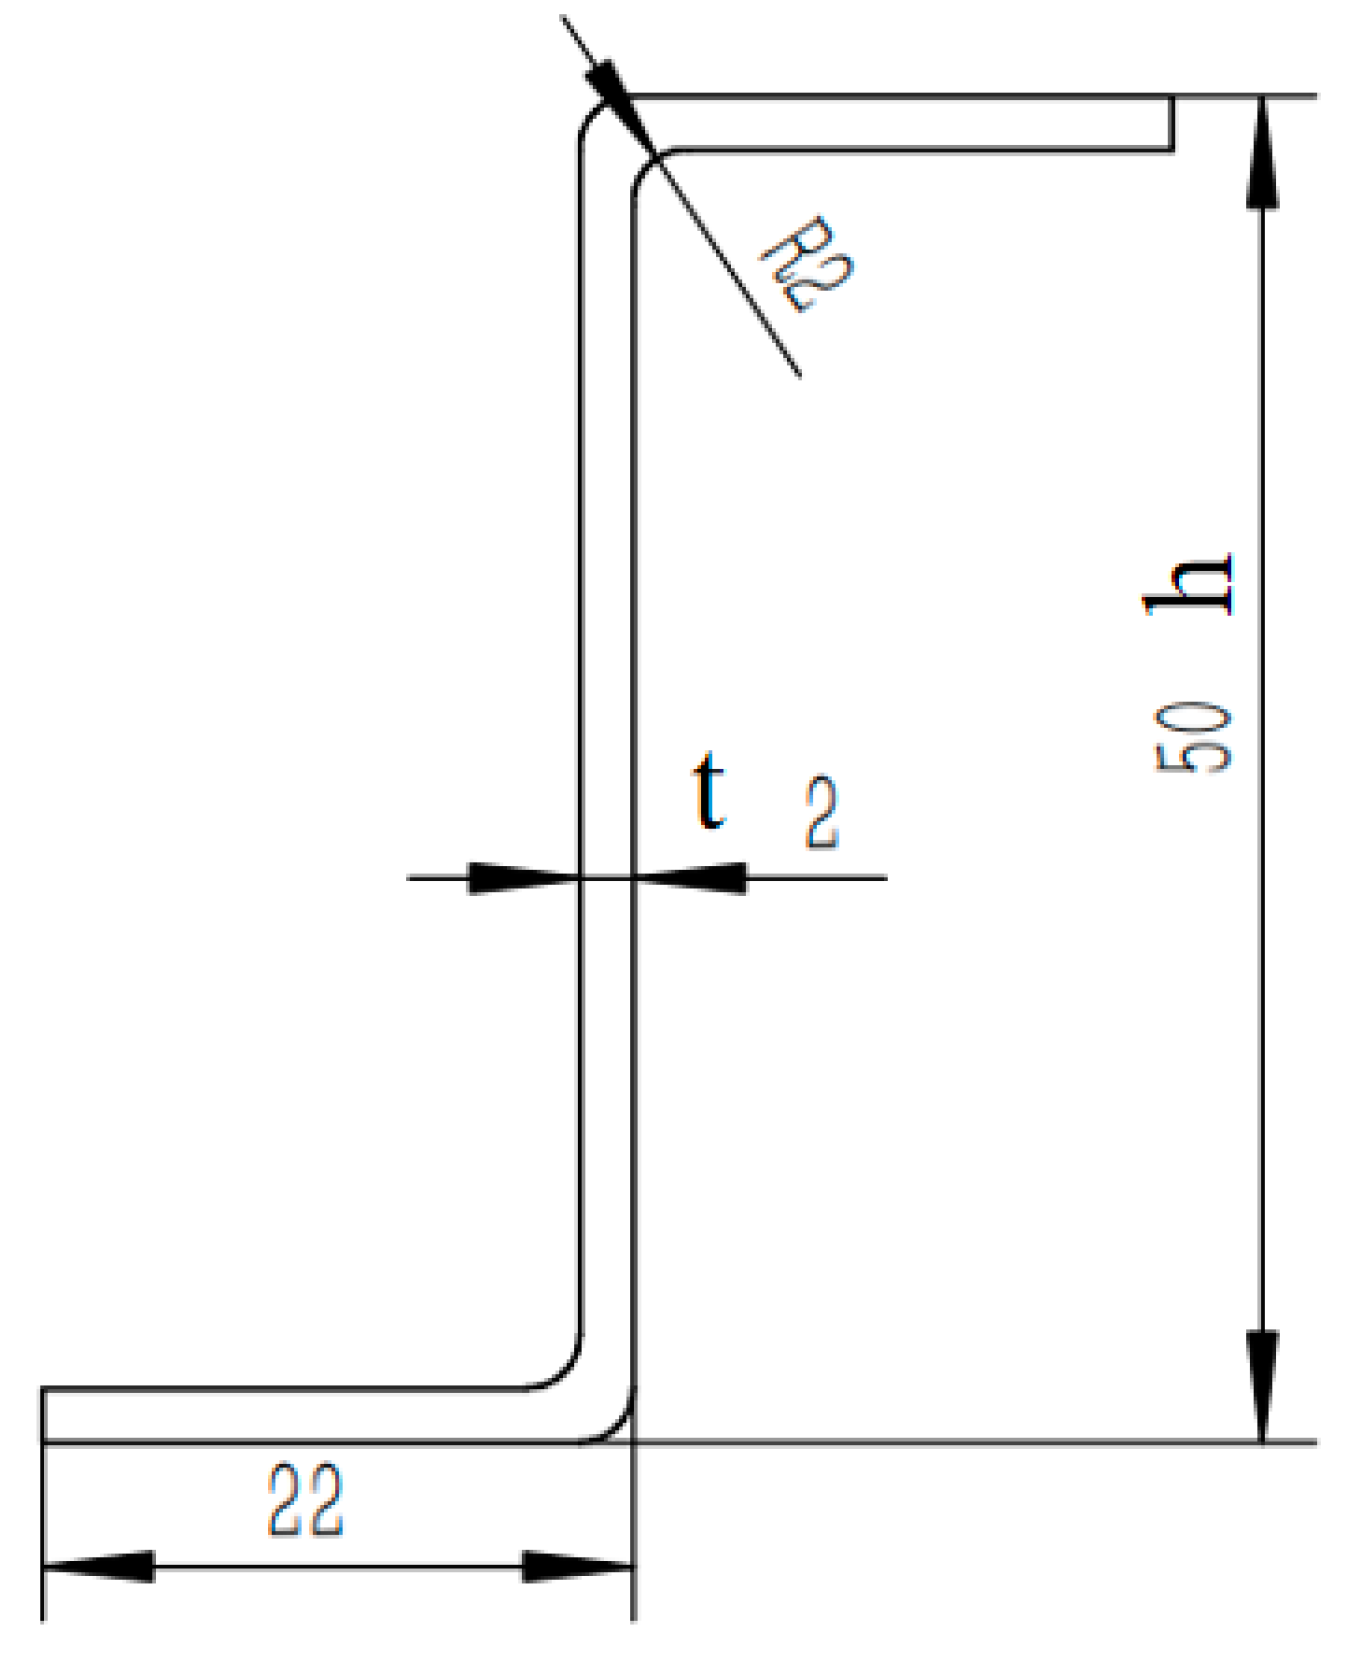
Figure 4.
Contact roller.(a) Three-dimensional model; (b) Roller section size.

Figure 5.
(a) Processed profiles (the red circle represents the observation position); (b) 0.2 mm local observation; (c) 0.1 mm local observation.
Figure 5.
(a) Processed profiles (the red circle represents the observation position); (b) 0.2 mm local observation; (c) 0.1 mm local observation.

Figure 6.
Roller design with retained gaps.
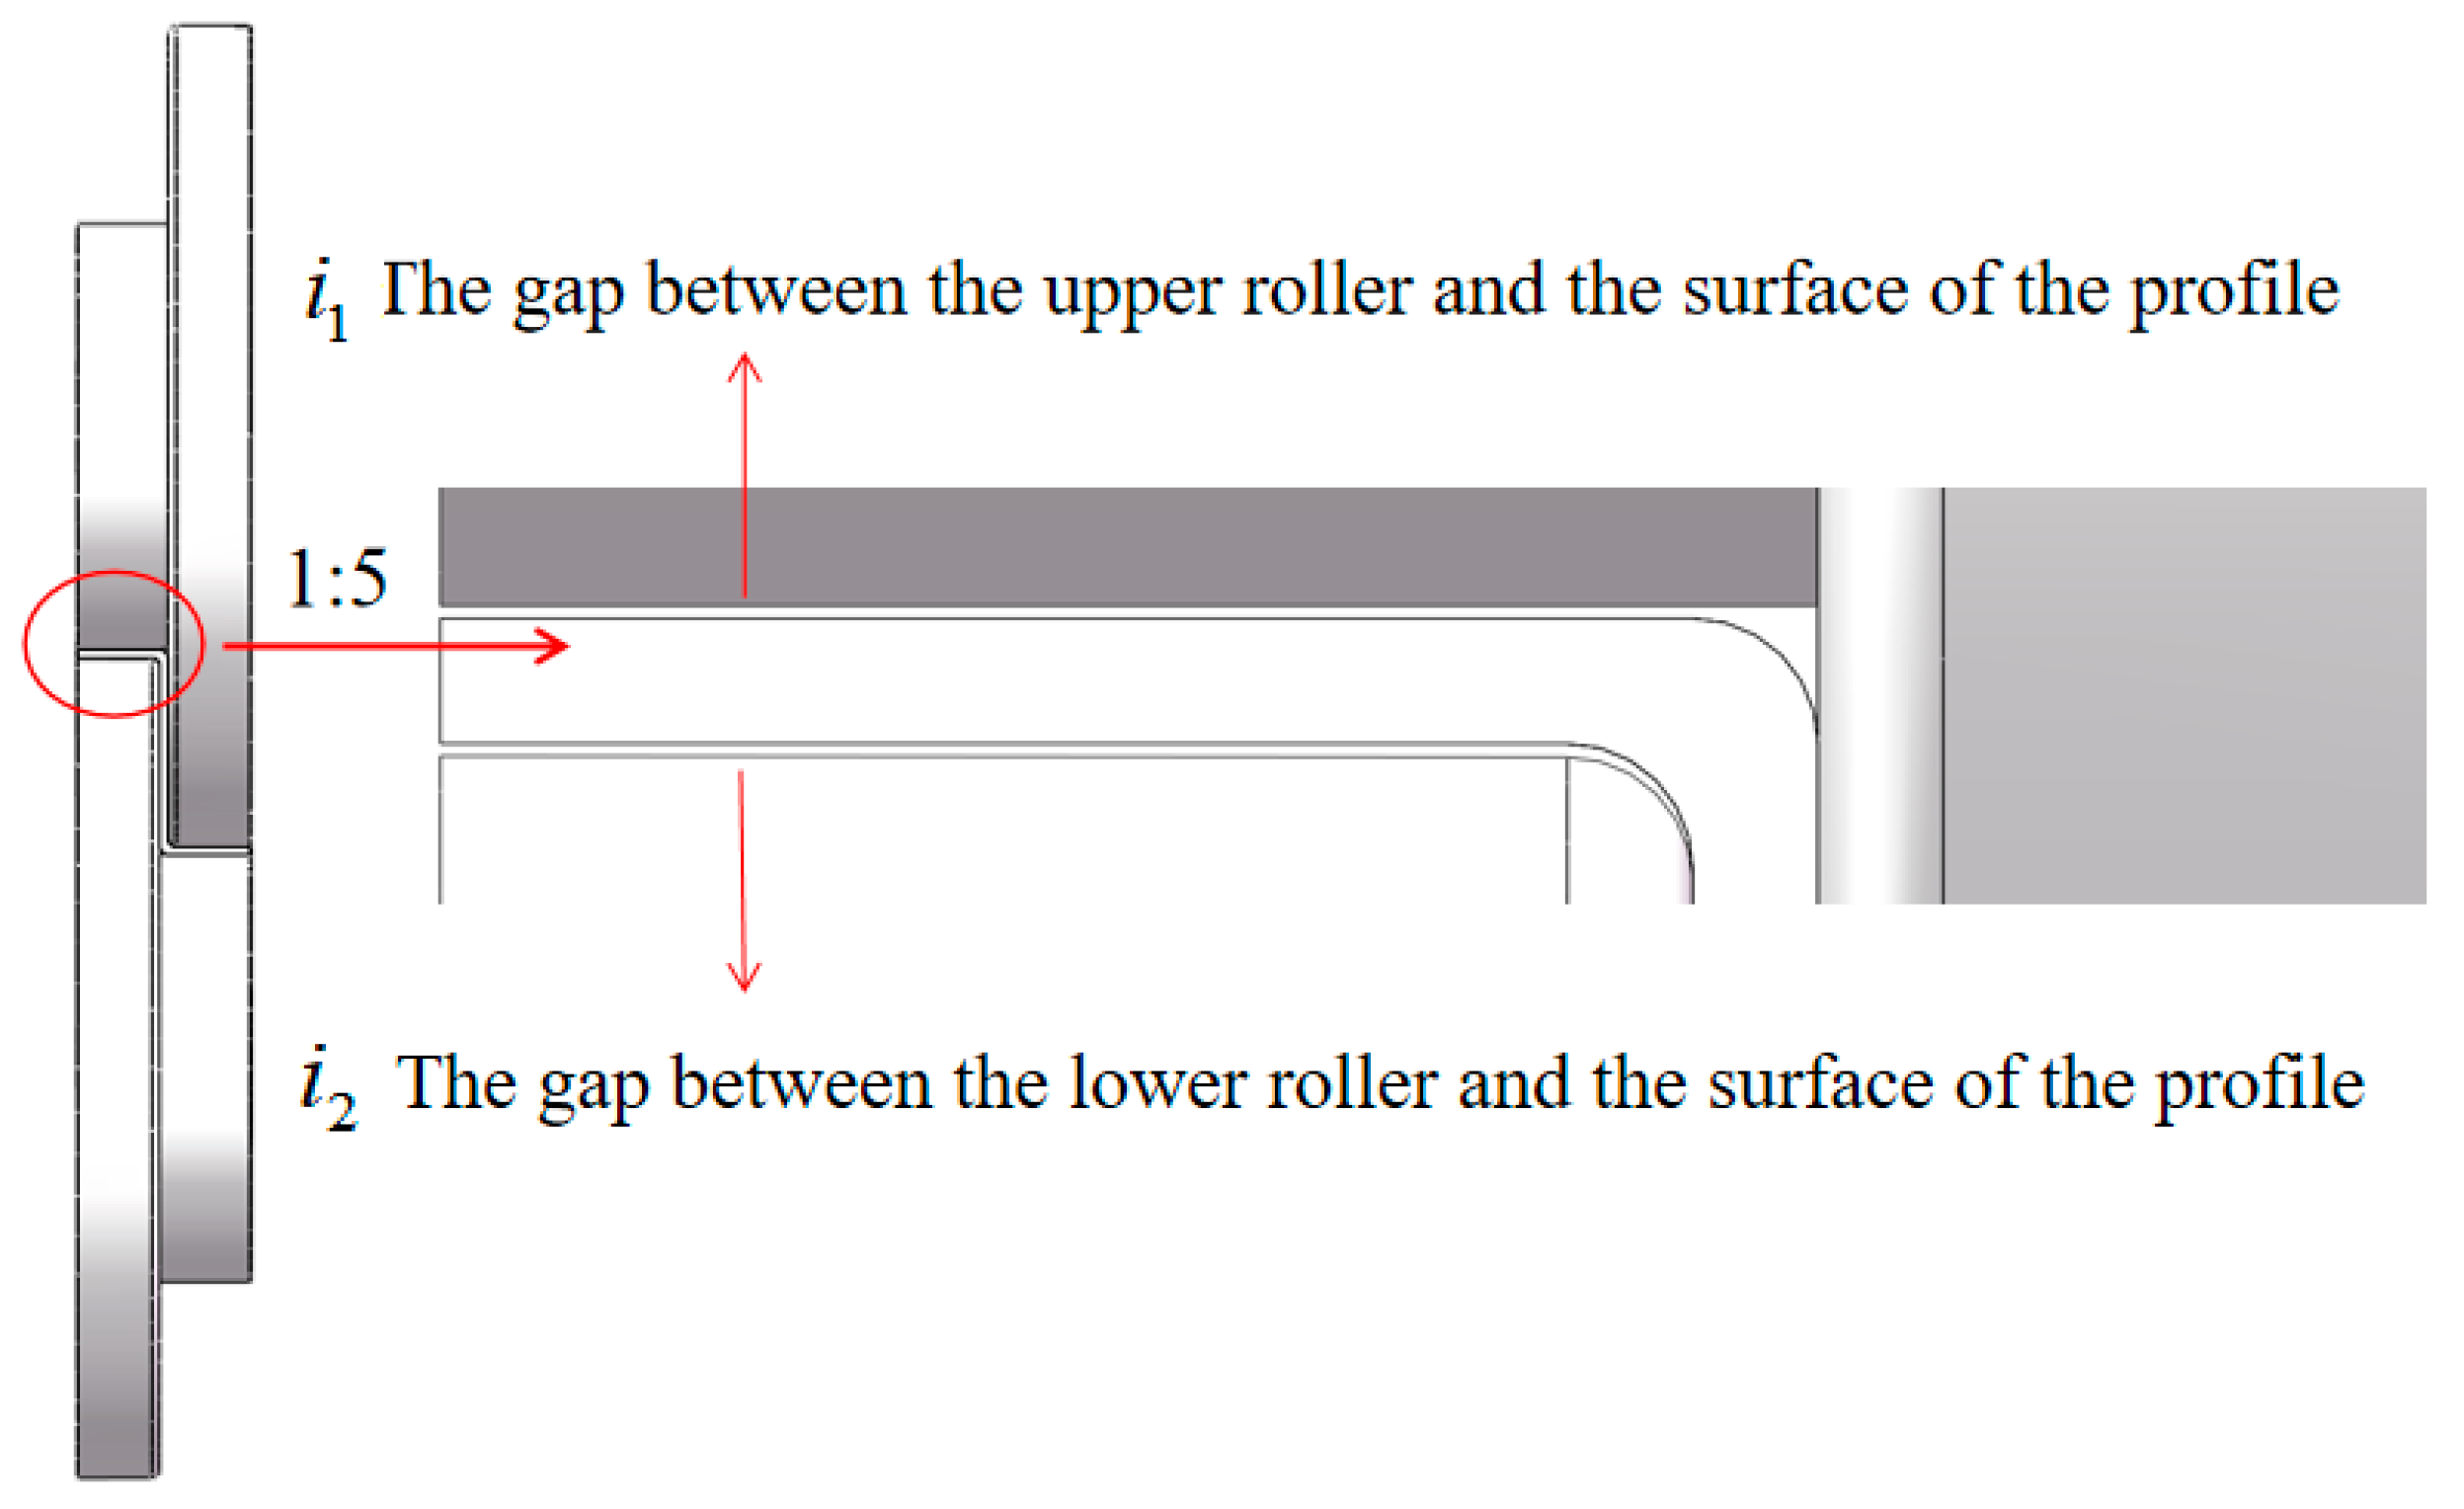
Figure 7.
Tensile specimen.

Figure 8.
Finite element model of four-roll-bending profile.
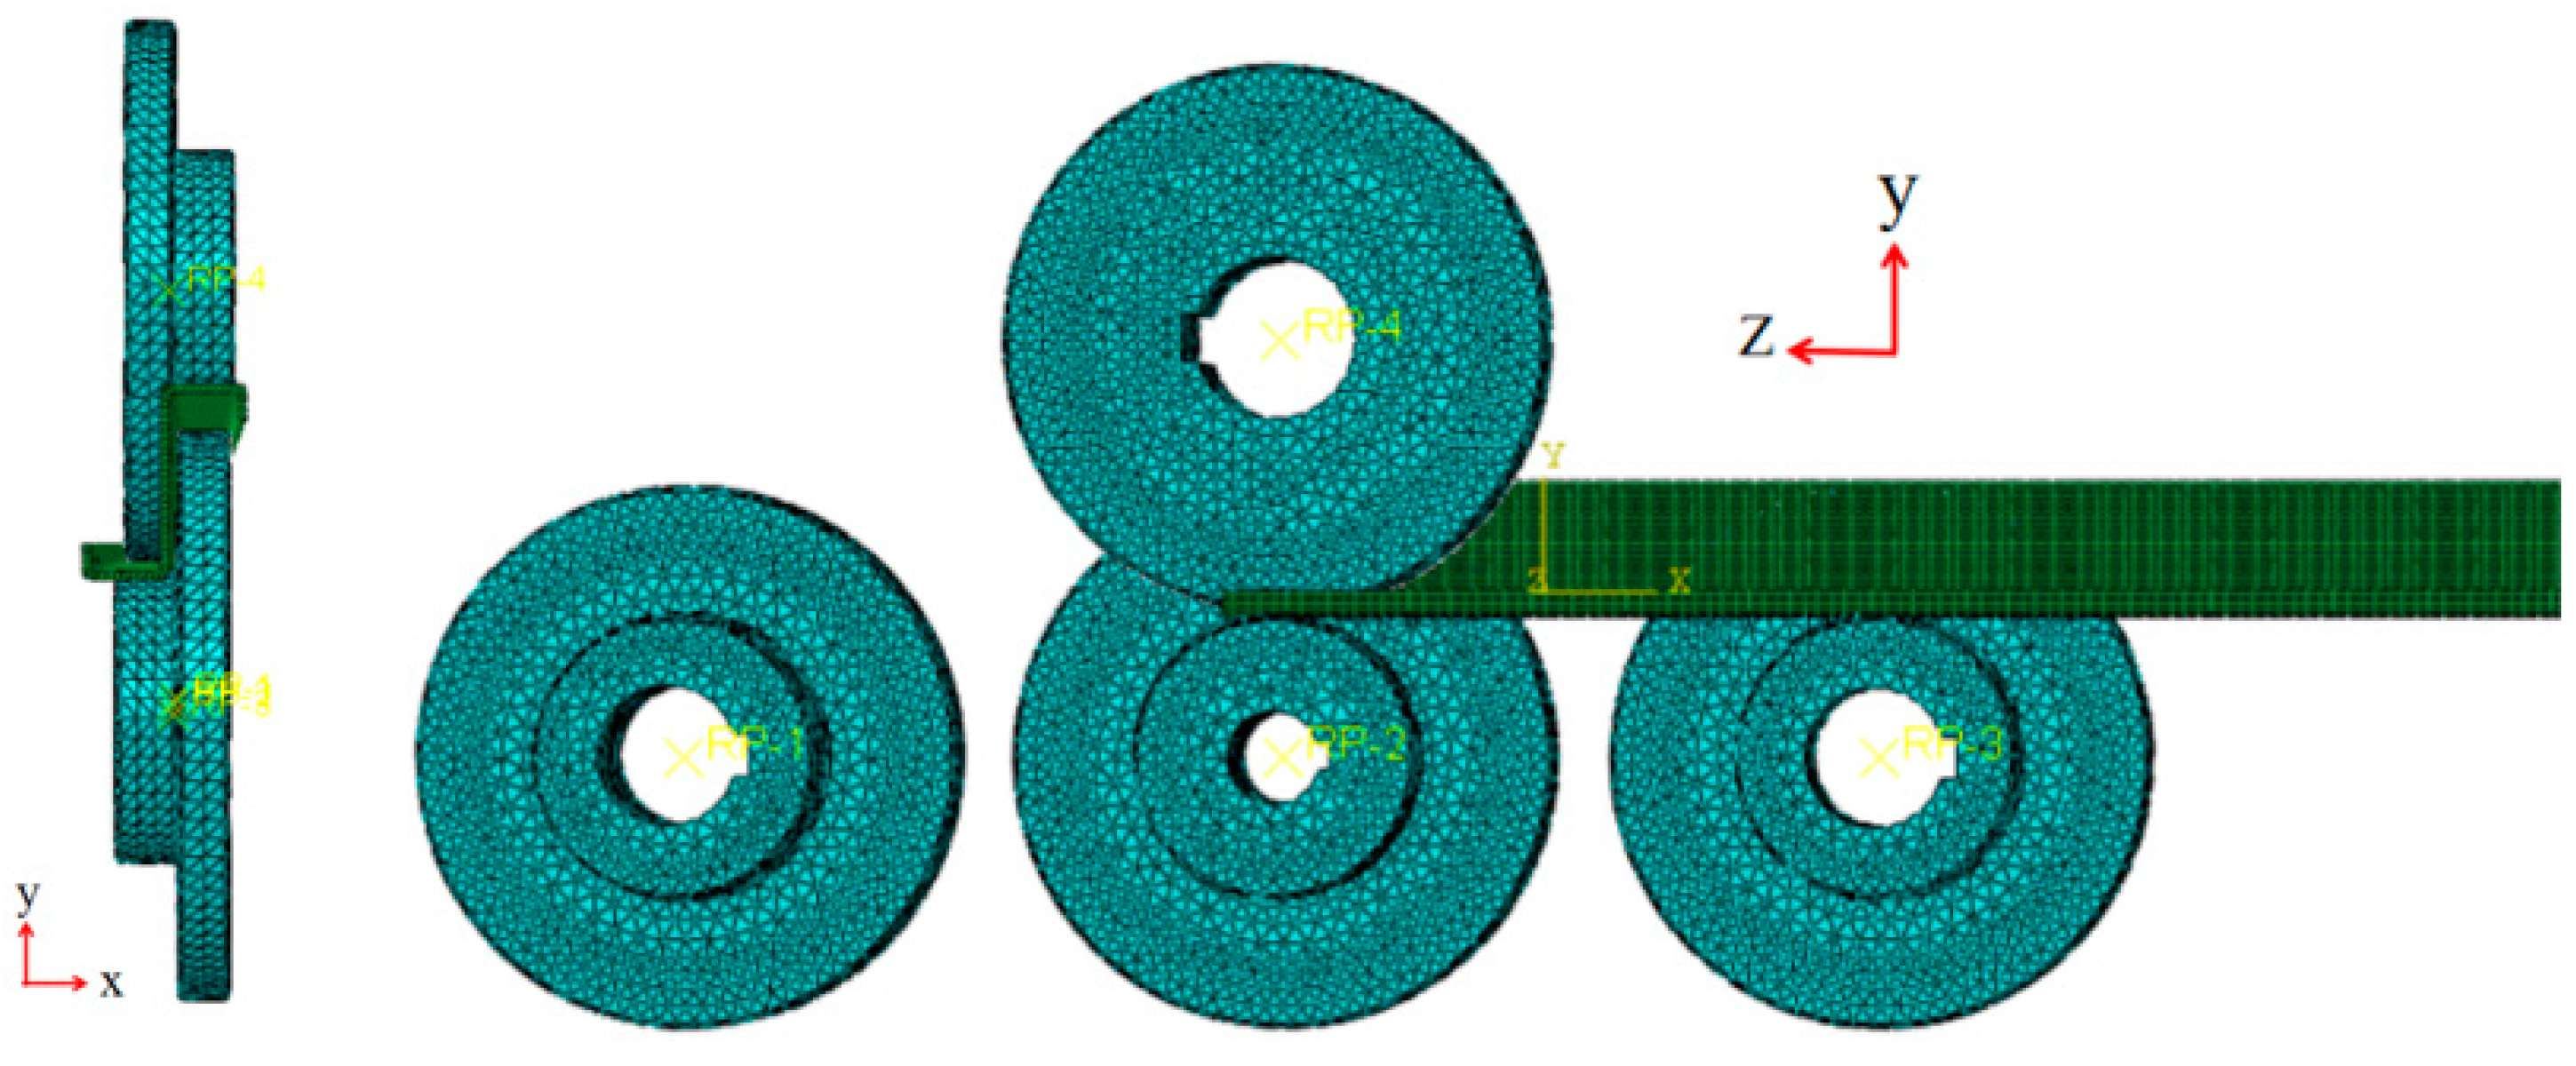
Figure 9.
(a) Unilateral loading; (b) Bilateral loading.

Figure 10.
Equivalent plastic strain under different loading modes.
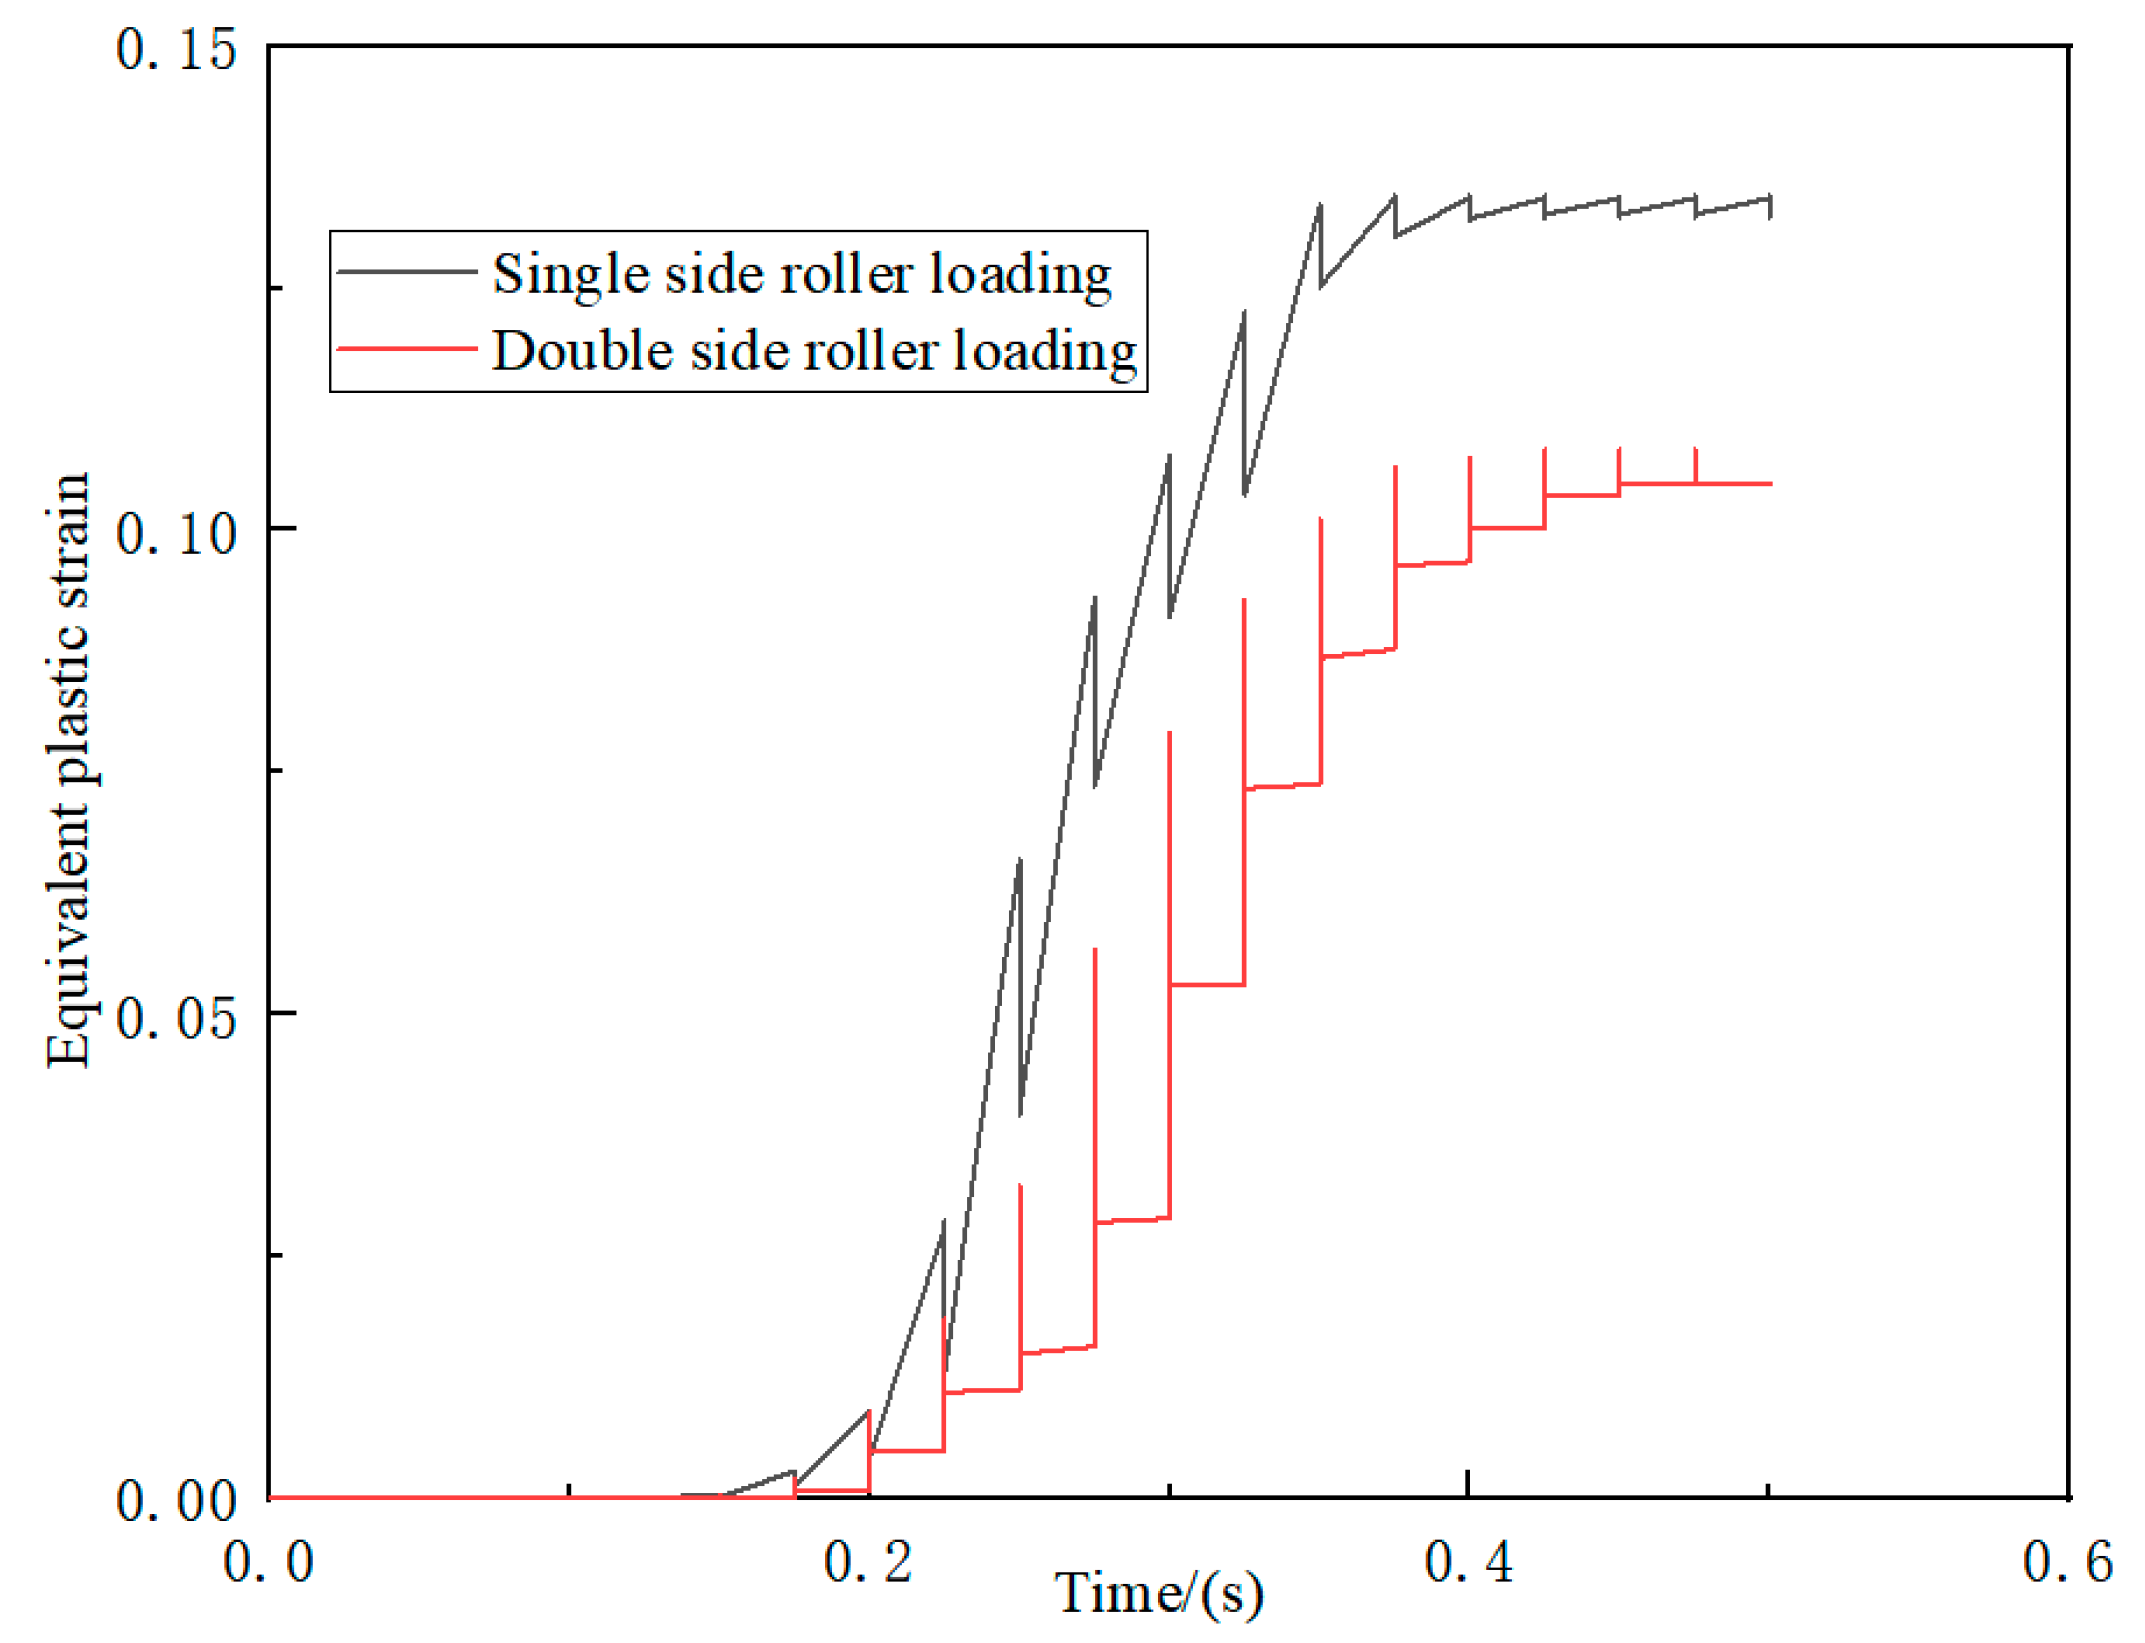
Figure 11.
(a) Profile coated reflective lenses; (b) Scanned profiles.
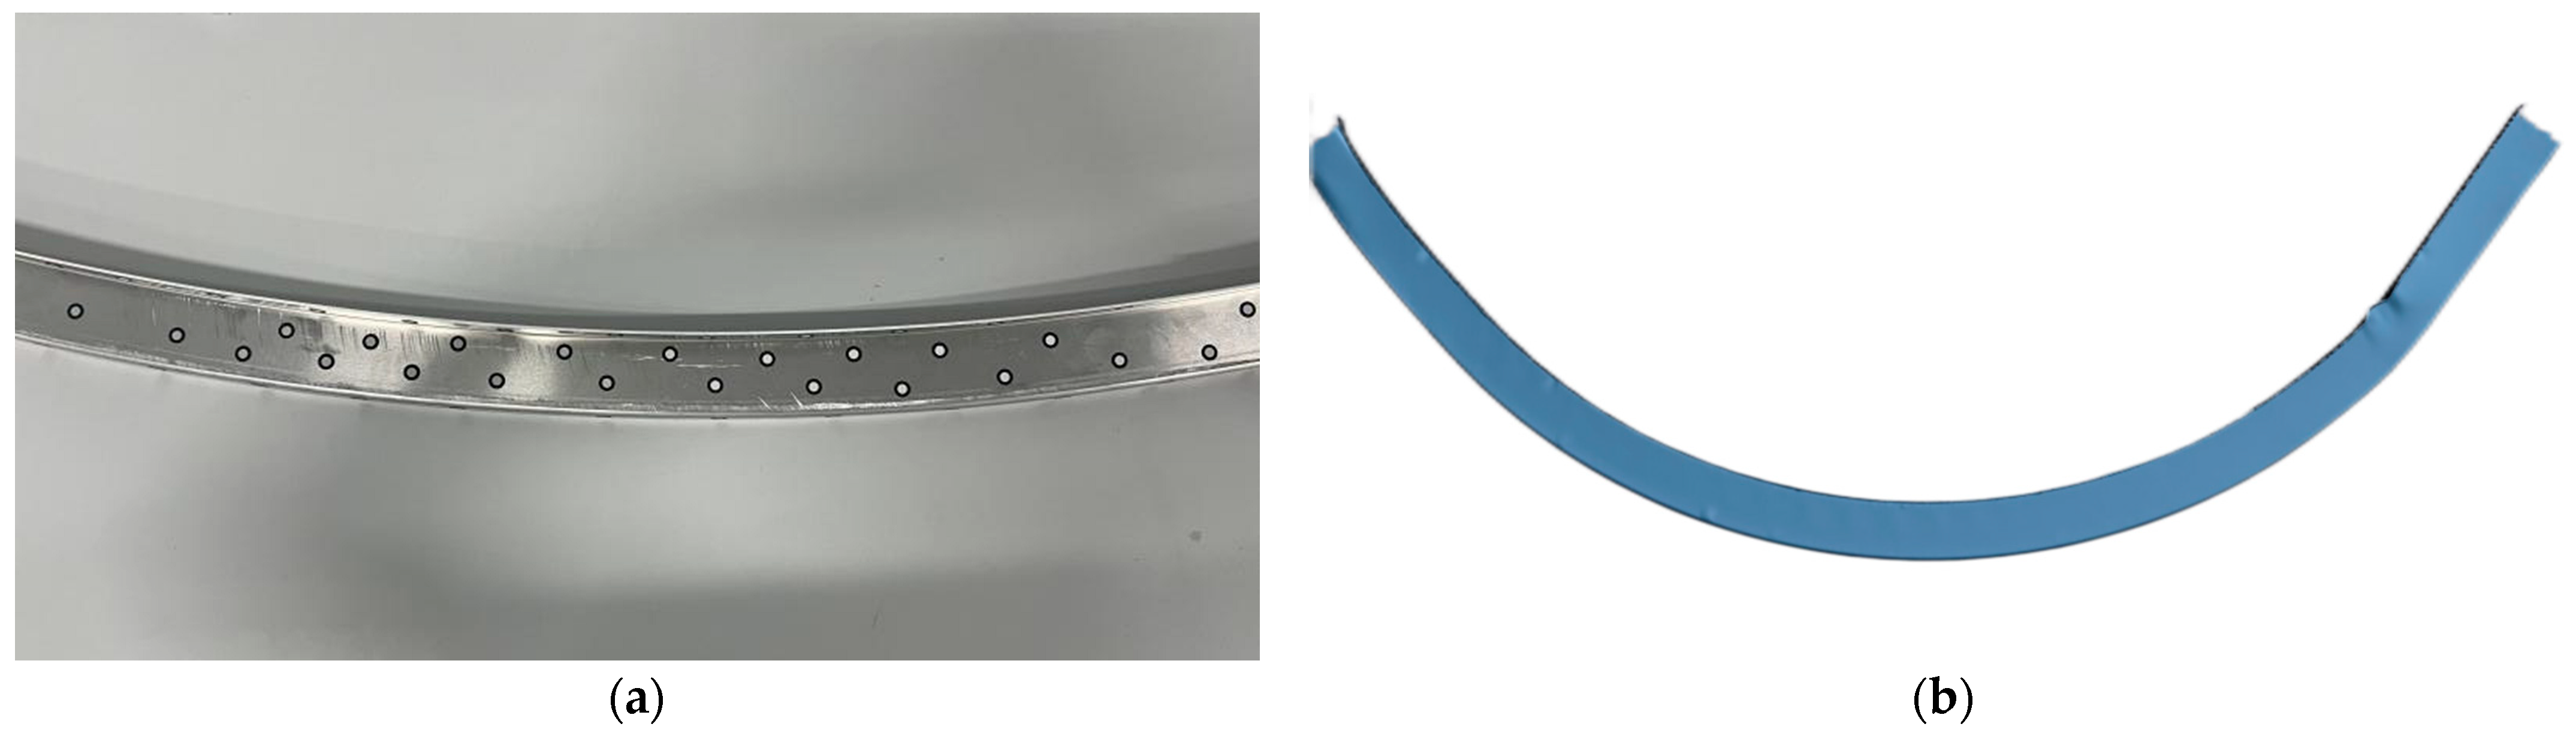
Figure 12.
Node location.

Figure 13.
(a) Impact of upper and lower roller gaps on stress; (b) Description of impact of upper and lower roller gaps on equivalent plastic strain.
Figure 13.
(a) Impact of upper and lower roller gaps on stress; (b) Description of impact of upper and lower roller gaps on equivalent plastic strain.
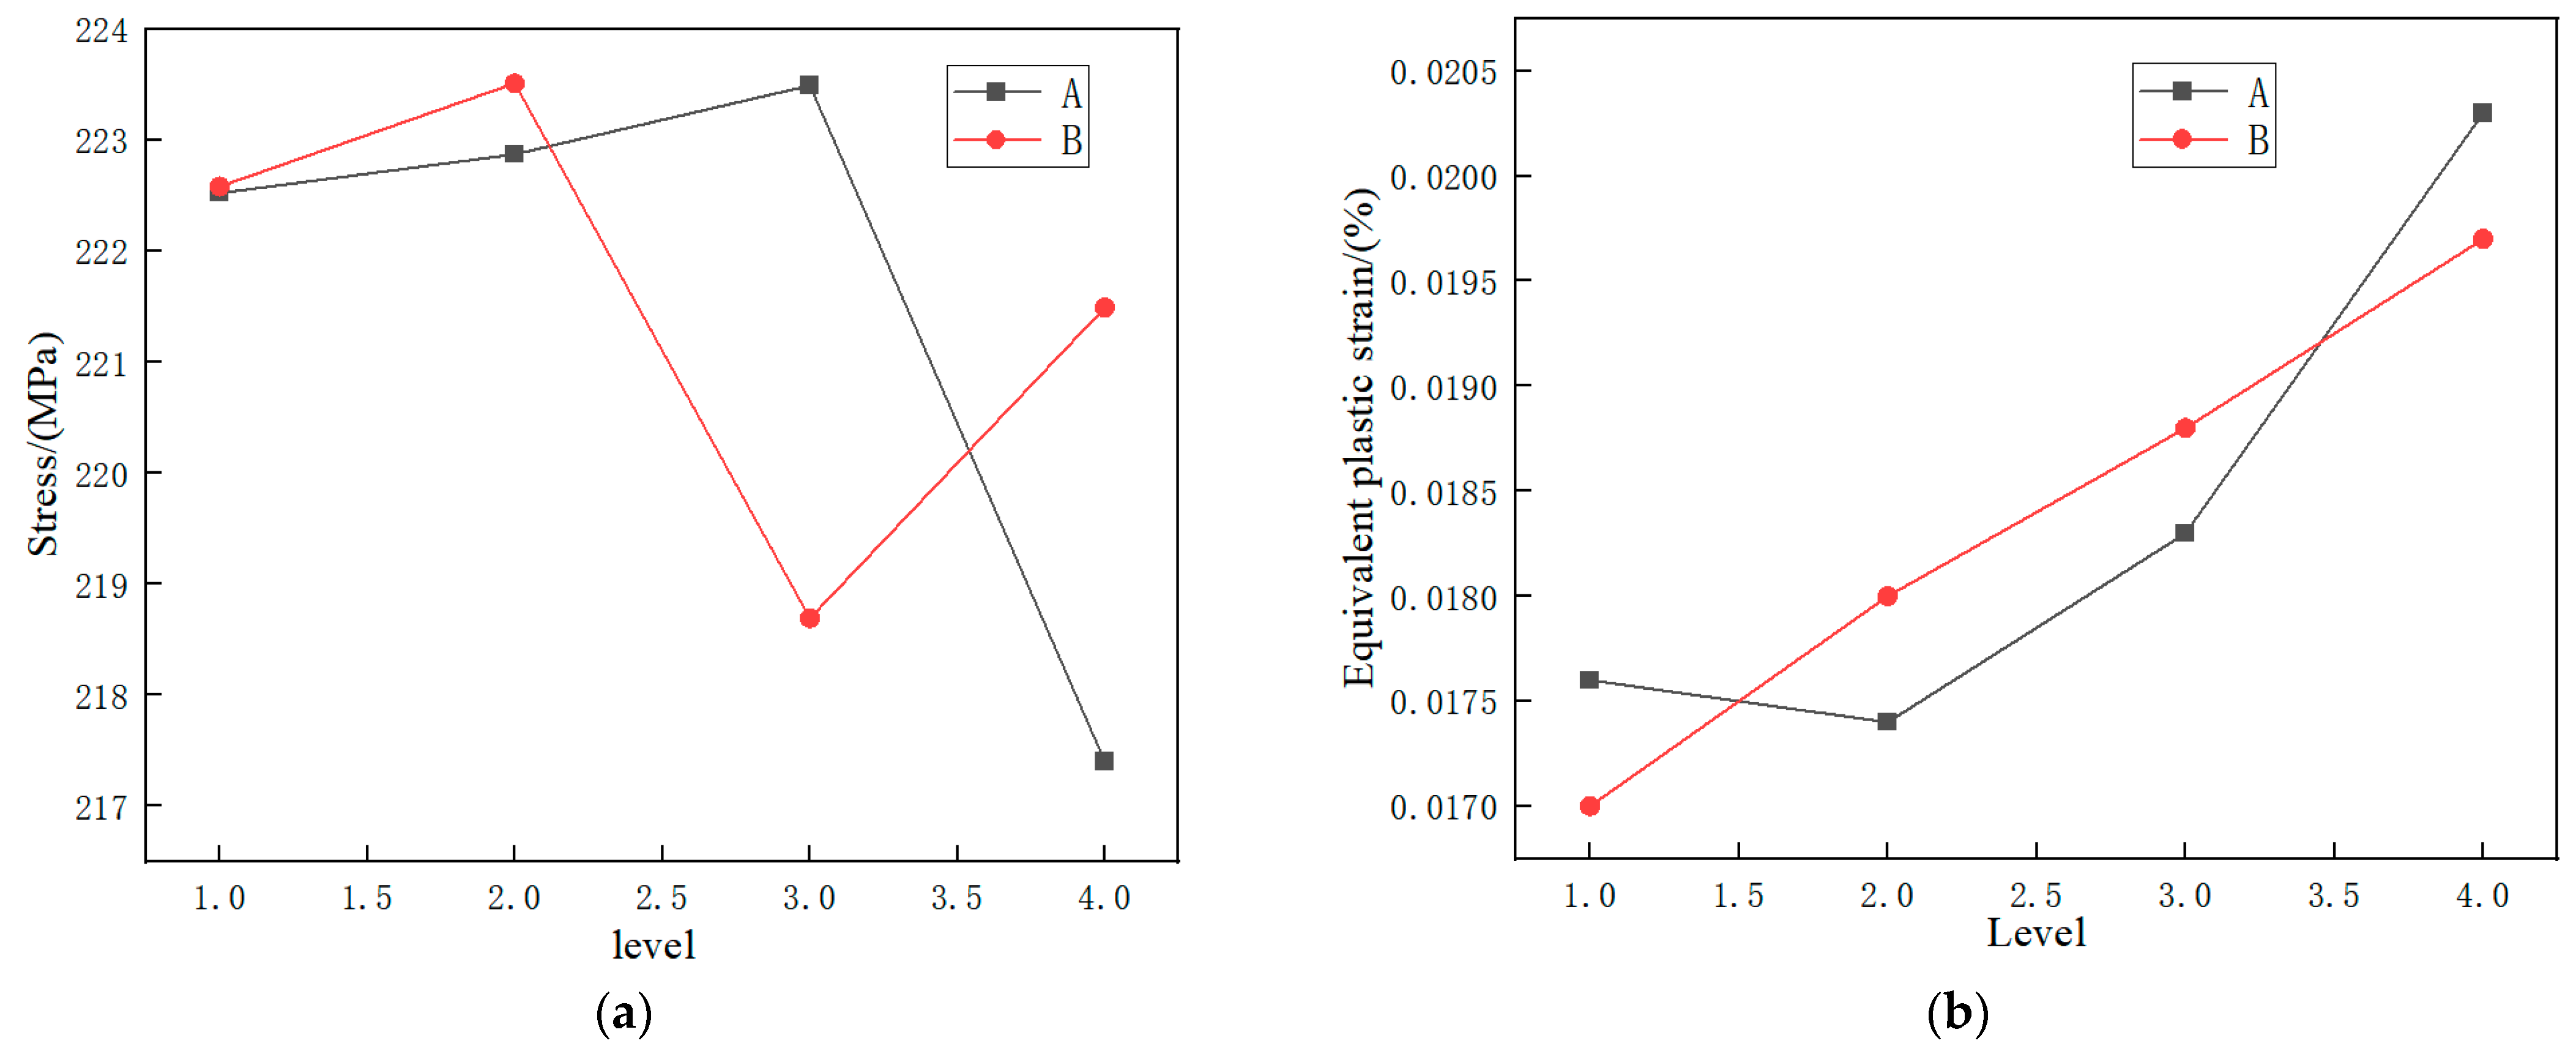
Figure 14.
Roller with retained clearance.

Figure 15.
(a) Stress at different gaps; (b) Equivalent plastic strain of different gaps.
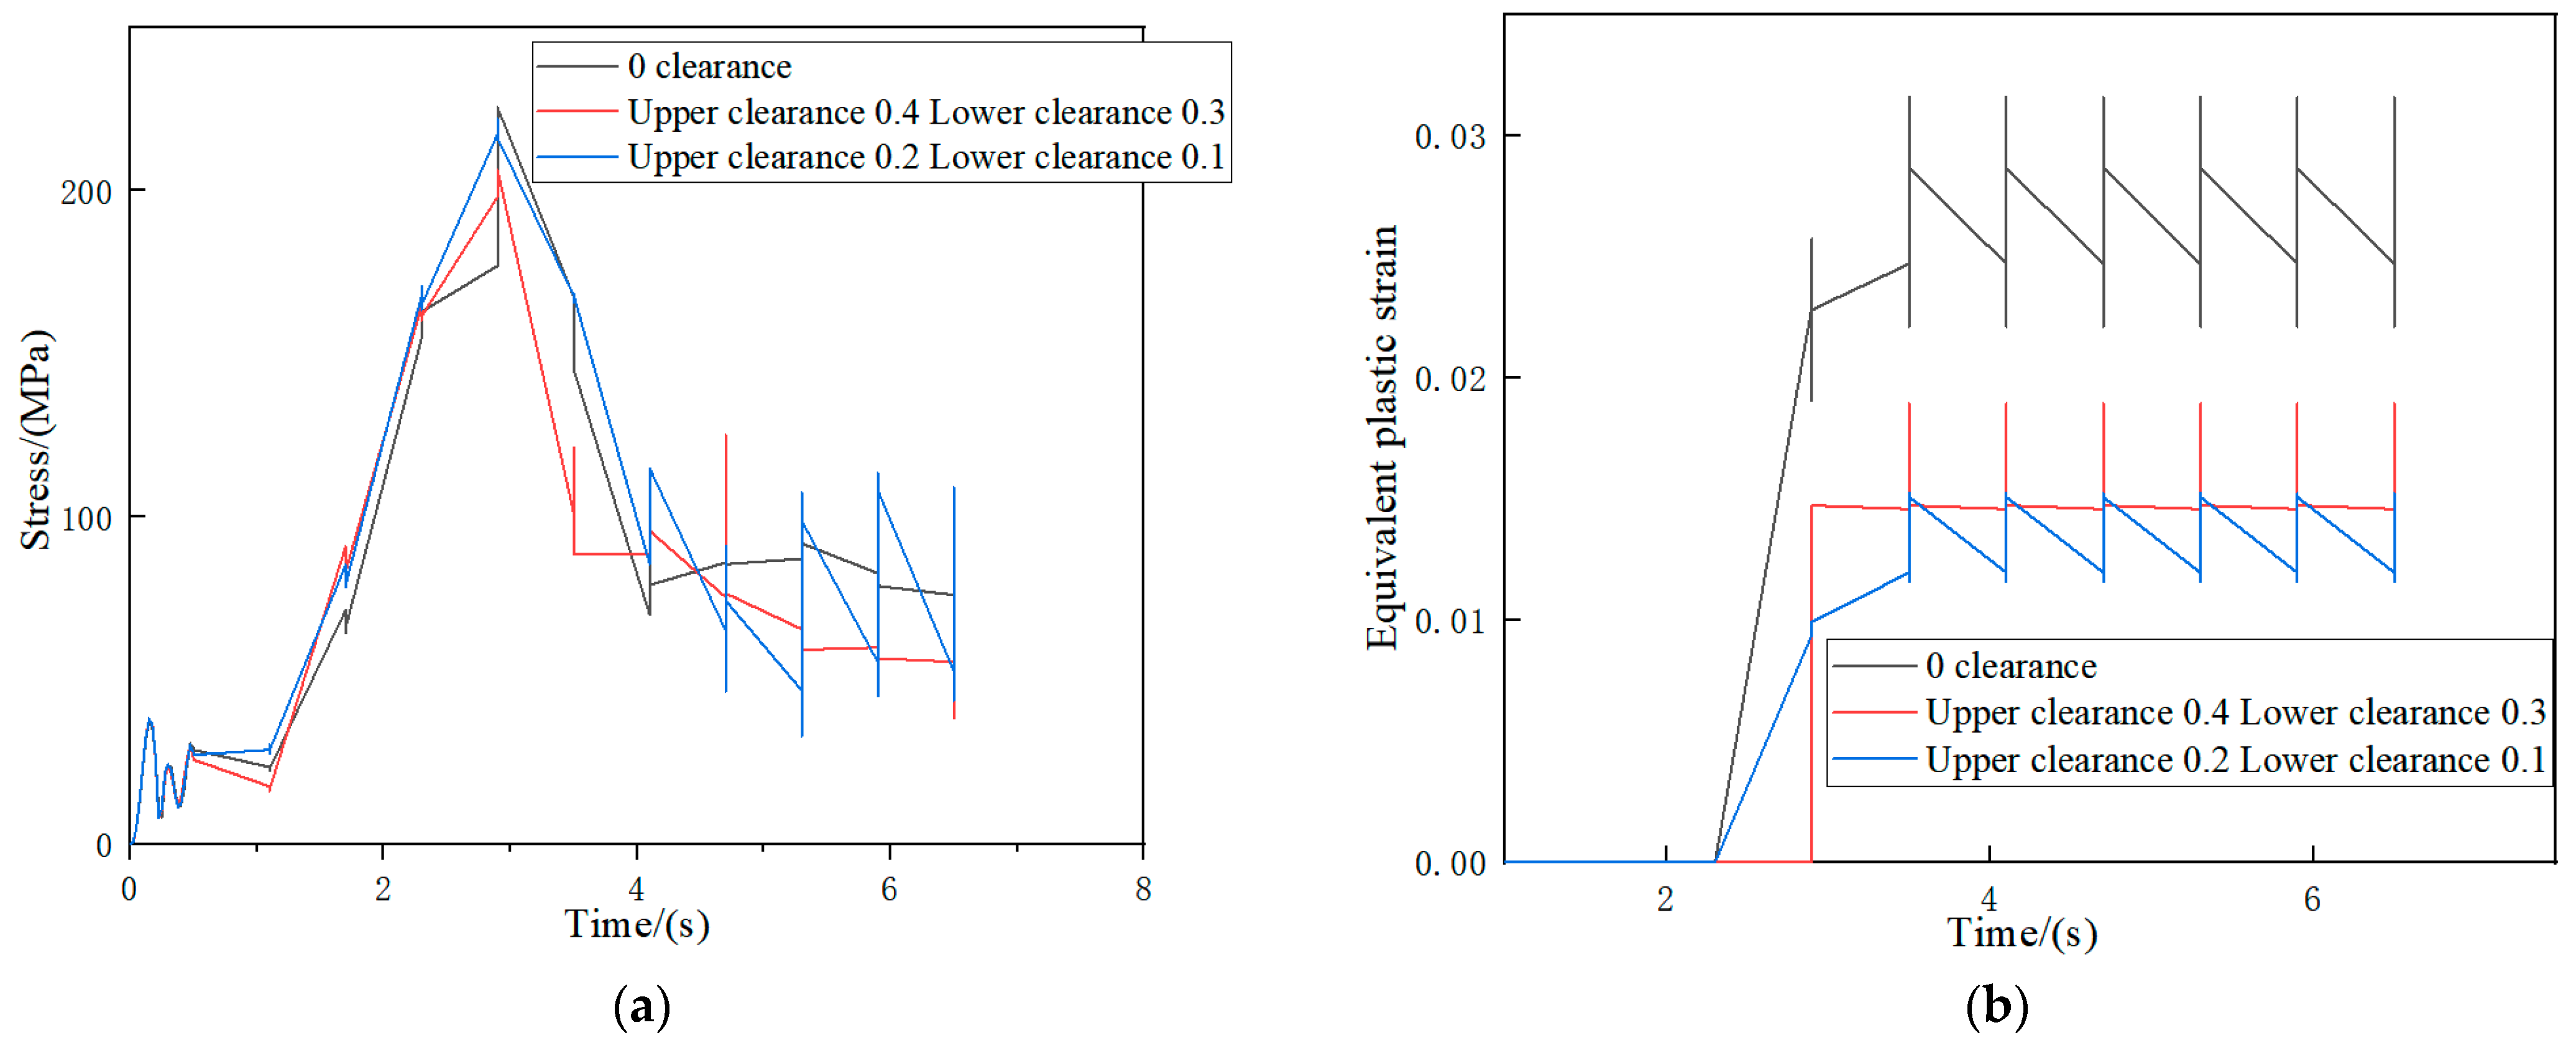
Figure 16.
(a) Processed profiles;(b) Profile machined with clearance rollers;(c) Profile not processed with gap rollers (the position circled in red is the area with obvious scratches).
Figure 16.
(a) Processed profiles;(b) Profile machined with clearance rollers;(c) Profile not processed with gap rollers (the position circled in red is the area with obvious scratches).

Figure 17.
Surface roughness (a) using clearance machining and (b) not using clearance machining.

Table 1.
Roller size without clearance.
| Code Name | Roller Radius (mm) | Roller Width (mm) | ||||
|---|---|---|---|---|---|---|
| Numeric value | 100 | 100 | 52 | 52 | 20 | 22 |
Table 2.
The 6063-T5 material properties.
| 156 | 70,000 | 0.33 | 2700 | 9 |
is tensile strength, is Young’s modulus, is Poisson’s ratio, is density.
Table 3.
Roller constraint.
| Constraint Type | Upper Roller | Lower Roller | Left Roller | Right Roller |
|---|---|---|---|---|
| Move constraint | X, Y, Z | X, Y, Z | X | X |
| Rotational constraint | Y, Z | Y, Z | Y, Z | Y, Z |
Table 4.
Error comparison between actual data and simulation data.
| Side Roll Displacement (mm) | Experimental Result Curvature of Profile Forming (mm) | Simulation Result Curvature of Profile Forming (mm) | Error |
|---|---|---|---|
| 20 | 17,873 | 17,464 | 2.2% |
| 30 | 10,021 | 9776 | 2.4% |
| 40 | 7341 | 6982 | 4.8% |
| 50 | 5105 | 4888 | 4.2% |
Table 5.
List of factor levels.
| Factor | 1 Level (mm) | 2 Level (mm) | 3 Level (mm) | 4 Level (mm) |
|---|---|---|---|---|
| (A) Upper roller clearance | 0.1 | 0.2 | 0.3 | 0.4 |
| (B) Lower roller clearance | 0.1 | 0.2 | 0.3 | 0.4 |
Table 6.
Experimental data.
| Experiment No | Factors and Levels | Maximum Stress (MPa) | Equivalent Plastic Strain | |
|---|---|---|---|---|
| 1 | 1 | 1 | 223.27 | 0.0168 |
| 2 | 1 | 2 | 222.68 | 0.0174 |
| 3 | 1 | 3 | 221.44 | 0.0177 |
| 4 | 1 | 4 | 222.71 | 0.0183 |
| 5 | 2 | 1 | 221.75 | 0.0152 |
| 6 | 2 | 2 | 223.50 | 0.0180 |
| 7 | 2 | 3 | 223.20 | 0.0182 |
| 8 | 2 | 4 | 223.02 | 0.0180 |
| 9 | 3 | 1 | 222.75 | 0.0171 |
| 10 | 3 | 2 | 224.02 | 0.0172 |
| 11 | 3 | 3 | 224.03 | 0.0202 |
| 12 | 3 | 4 | 223.16 | 0.0185 |
| 13 | 4 | 1 | 222.57 | 0.0190 |
| 14 | 4 | 2 | 223.85 | 0.0192 |
| 15 | 4 | 3 | 206.11 | 0.0189 |
| 16 | 4 | 4 | 217.07 | 0.0240 |
Table 7.
Range data analysis.
| Order Number | A | B | |
|---|---|---|---|
| Stress | K11 | 222.52 | 222.58 |
| K12 | 222.87 | 223.51 | |
| K13 | 223.49 | 218.69 | |
| K14 | 217.4 | 221.49 | |
| R1 | 6.09 | 4.82 | |
| Equivalent plastic strain | K21 | 0.0176 | 0.0170 |
| K22 | 0.0174 | 0.0180 | |
| K23 | 0.0183 | 0.0188 | |
| K24 | 0.0203 | 0.0197 | |
| R2 | 0.0029 | 0.0027 | |
Table 8.
Roller size.
| Code Name | Roller Radius (mm) | Roller Width (mm) | ||||
|---|---|---|---|---|---|---|
| Numeric value | 100 | 99.6 | 52 | 51.7 | 20 | 22 |
Disclaimer/Publisher’s Note: The statements, opinions and data contained in all publications are solely those of the individual author(s) and contributor(s) and not of MDPI and/or the editor(s). MDPI and/or the editor(s) disclaim responsibility for any injury to people or property resulting from any ideas, methods, instructions or products referred to in the content. |
© 2023 by the authors. Licensee MDPI, Basel, Switzerland. This article is an open access article distributed under the terms and conditions of the Creative Commons Attribution (CC BY) license (https://creativecommons.org/licenses/by/4.0/).
Share and Cite
MDPI and ACS Style
Jing, Y.; Sun, Q.; Zhao, Y. Design of Z Profile Roller Tooling and Research on Roller Clearance. Machines 2023, 11, 767. https://doi.org/10.3390/machines11070767
AMA Style
Jing Y, Sun Q, Zhao Y. Design of Z Profile Roller Tooling and Research on Roller Clearance. Machines. 2023; 11(7):767. https://doi.org/10.3390/machines11070767
Chicago/Turabian StyleJing, Yigang, Qun Sun, and Ying Zhao. 2023. "Design of Z Profile Roller Tooling and Research on Roller Clearance" Machines 11, no. 7: 767. https://doi.org/10.3390/machines11070767
Note that from the first issue of 2016, this journal uses article numbers instead of page numbers. See further details here.