
Integration of Deep Learning for Automatic Recognition of 2D Engineering Drawings
by
 ,
,
Yi-Hsin Lin
1,2,3,*,
Yu-Hung Ting
1,2,3,
Yi-Cyun Huang
1,
Kai-Lun Cheng
1,2,3 and
Wen-Ren Jong
1,2,3 1
Department of Mechanical Engineering, Chung Yuan Christian University, Taoyuan City 320, Taiwan
2
R&D Center for Smart Manufacturing, Chung Yuan Christian University, Taoyuan City 320, Taiwan
3
R&D Center for Semiconductor Carrier, Chung Yuan Christian University, Taoyuan City 320, Taiwan
*
Author to whom correspondence should be addressed.
Machines 2023, 11(8), 802; https://doi.org/10.3390/machines11080802
Submission received: 25 June 2023
/
Revised: 12 July 2023
/
Accepted: 1 August 2023
/
Published: 4 August 2023
(This article belongs to the Special Issue Smart Manufacturing and Industrial Automation)
Abstract
:In an environment where manufacturing precision requirements are increasing, complete project plans can consist of hundreds of engineering drawings. The presentation of these drawings often varies based on personal preferences, leading to inconsistencies in format and symbols. The lack of standardization in these aspects can result in inconsistent interpretations during subsequent analysis. Therefore, proper annotation of engineering drawings is crucial as it determines product quality, subsequent inspections, and processing costs. To reduce the time and cost associated with interpreting and analyzing drawings, as well as to minimize human errors in judgment, we developed an engineering drawing recognition system. This study employs geometric dimensioning and tolerancing (GD&T) in accordance with the ASME (American Society of Mechanical Engineers) Y14.5 2018 specification to describe the language of engineering drawings. Additionally, PyTorch, OpenCV, and You Only Look Once (YOLO) are utilized for training. Existing 2D engineering drawings serve as the training data, and image segmentation is performed to identify objects such as dimensions, tolerances, functional frames, and geometric symbols in the drawings using the network model. By reading the coordinates corresponding to each object, the correct values are displayed. Real-world cases are utilized to train the model with multiple engineering drawings containing mixed features, resulting in recognition capabilities surpassing those of single-feature identification. This approach improves the recognition accuracy of deep learning models and makes engineering drawing and image recognition more practical. The recognition results are directly stored in a database, reducing product verification time and preventing errors that may occur due to manual data entry, thereby avoiding subsequent quality control issues. The accuracy rates achieved are as follows: 85% accuracy in detecting views in 2D engineering drawings, 70% accuracy in detecting annotation groups and annotations, and 80% accuracy in text and symbol recognition.
1. Introduction
Computer-Aided Design (CAD) software has become increasingly powerful in recent years, allowing various 3D model annotation techniques. However, even after all these years, 3D model annotation still cannot completely replace 2D engineering drawings. There are two main reasons for this. First, there is a performance issue. More powerful 3D software requires higher computer specifications, and for complex assembly structures, the loading speed of models, software display, and operations are still not as convenient as 2D drawings in terms of performance. Second, there is a difficulty in accessing information. Although 3D annotation is intuitive and provides richer information compared to 2D drawings, it is still not as convenient as 2D drawings in terms of extracting information from the model. The core of 2D drawings lies in annotation, where designers can use appropriate areas for rotation, zooming, section views, etc., to express design intent and filter out unnecessary feature information, allowing readers to quickly obtain the information the designer intends to convey. While 3D models can also achieve similar viewing and annotation to 2D drawings, the workload for drawing is much larger, and they are also more challenging for non-professionals to interpret. Therefore, engineering drawings still play an extremely important role in the manufacturing industry.
With advancing production technology, intense market competition, and constant product innovation, the demand for design drawings is increasing. For a new product, they occupy a significant portion of the schedule during the design phase. In industrial manufacturing, interpretation of drawing information by skilled technical personnel was traditionally required for subsequent processing and quality control validation to present a complete product profile. However, manual engineering drawing analysis would consume a significant amount of time in drawing interpretation, especially when most engineers still use traditional positive and negative tolerance annotation methods, resulting in many defects in the drawings. For example, traditional dimension annotation cannot control the shape, deviation, direction, or position of the components. If each person has a different understanding of the drawing, the product functionality cannot be effectively expressed, and the inspection results will also differ. Therefore, establishing a unified drawing language can reduce manual operation time and shorten the product development cycle, providing an effective solution to this problem. By training on engineering drawings using YOLO and OpenCV, a feature recognition system can be established. Initially, features are clustered and managed, and the recognition results are stored in a database, which can effectively solve the difficulty of storing numerous drawings, eliminate the trouble of manual input, reduce human errors, and shorten the subsequent validation process.
Integrating drawing information and planning into automated systems is a future direction in the engineering drawing literature. Zhou et al. [1] noted that in engineering design, the efficiency and quality of presentation often depend on the completeness of the drawings. Therefore, feature information plays an important role in CAD drawings. Moreno-Garcia et al. [2] pointed out that engineering drawings are moving towards digitization. As engineering drawings can be used in different industries, the current focus is on how to manage these drawings in a digital format, especially since traditional paper-based management is challenging and not conducive to preserving historical information and drawings for various industries. Sun et al. [3] stated that GD&T is an important step in product design, as it has a significant impact on product manufacturing, quality, and functionality. The practice of GD&T can standardize engineering drawings, making them more accurate, and easier to understand. ASME [4] noted that the Y14.5 standard is considered the authoritative guide for geometric dimensioning and tolerancing language. The symbols, rules, definitions, requirements, default values, and recommended practices outlined in the standard can provide clearer explanations of GD&T and the associated data files used in engineering to define drawings and models. Scheibel et al. [5] noted that engineering drawings accompany the entire production process of a component. Although the manufacturing process of components is almost fully automated, the design and utilization of drawings have not yet been fully integrated into automated production. Therefore, the current challenge is how to extract dimensional information from drawings and integrate it into the production process to facilitate and optimize quality control.
From the above literature, it can be observed that some traditional manufacturing plants still rely on experienced technical personnel to interpret engineering drawings and annotate dimension tolerances according to their own habits. The presentation of drawing information varies among different engineering drawings. Without a unified format of a drawing language, this can lead to different interpretations by subsequent recipients, resulting in mutual blaming among engineers from different departments, multiple measurement results during inspection, decreased product quality, increased costs, and other issues.
In terms of automated interpretation of drawings, one possible direction is to train systems using a standard format. This allows the system to automatically extract relevant annotation information by extracting drawing features, thus facilitating drawing management and automated inspection. Text detection and recognition in images have already been widely applied in various fields. Trischler et al. [6] noted that understanding text is a major goal in natural language processing, which is a complex cognitive task requiring local text context reading and incorporating relevant background knowledge. Wan et al. [7] proposed a text feature localization method using the Maximally Stable Extremal Regions (MSER) algorithm, which can extract text positions even under image rotation and affine transformations. Epshtein et al. [8] introduced the Stroke Width Transform (SWT), a novel image operation that performs edge detection on the entire image, assigns width values to each pixel, aggregates similar width pixels, and highlights the text regions. Yu et al. [9] designed a rule-based filtering and Support Vector Machine (SVM)-based hierarchical localization method. It extracts characters using MSER, filters out non-text regions based on text features, and locates the text positions using Histogram of Oriented Gradient (HOG) features and bounding rectangles through SVM.
From the above literature, it can be understood that before the dominance of deep learning, manual text feature extraction was the main approach. The classical methods mentioned are MSER, SWT, HOG, etc. These methods involve setting up feature pyramids on images, scanning locally using sliding windows, extracting features, and performing classification through sliding windows, before finally merging into text regions.
In the deep learning literature, the field of image processing has received significant attention, especially in the development of object detection. This is attributed to the classification capabilities of Convolutional Neural Networks (CNN), which are a major driving force in deep learning. Lecun et al. [10] proposed the LeNet-5 network model for character recognition. It trained a multi-layer neural network using the back-propagation algorithm, which became a prominent example of gradient learning. It can synthesize complex drawings using gradient learning algorithms with minimal preprocessing and perform classification in high-dimensional patterns. Krizhevsky et al. [11] designed the AlexNet structure, which increased the depth of the network and enhanced its representation capabilities. They successfully introduced the Rectified Linear Unit (ReLU) activation function and the dropout technique, which alleviated the gradient vanishing problem caused by the Sigmoid function and prevented overfitting. Simonyan et al. [12] proposed the VGGNet model, which replaced the larger convolutions in previous models with consecutive 3 × 3 convolutions. This significantly reduced the number of parameters while maintaining performance, enabling deeper networks. In the 2014 ImageNet competition, the model achieved good results in localization and classification tasks. Liu et al. [13] introduced deep deconvolutional semantic image segmentation, which used VGGNet as the neural network for encoding and deconvolution and pixel prediction to construct image segmentation. Yu et al. [14] noted that image semantic segmentation is formed by an image classification model. However, prediction and classification have structural differences. Therefore, they designed the Dilated Convolution module, which combines information from different layers and reduces the resolution loss, thereby improving the overall accuracy of segmentation. Li et al. [15] and Chen et al. [16] discussed how dilated convolution can expand the receptive field, reduce training parameters and data volume, and effectively compensate for insufficient localization accuracy when properly combined with random fields. He et al. [17] proposed the Deep Residual Network (ResNet), and the key to training this network is the use of skip connections through identity mapping. It enables the current output to skip the computation of the original layer by mapping across layers, leading to a trend of deeper models with fewer parameters and alleviating the problem of gradient vanishing. Redmon et al. [18] introduced YOLO, a fast and accurate object detection framework that uses regression methods to globally predict objects in images, ensuring high precision in detection. Wang et al. [19] introduced YOLOv7, which optimizes the model architecture and training process to reduce parameters and computations. When the frames per second (FPS) range from 5 to 160, it surpasses known real-time object detectors in terms of speed and accuracy.
From the above literature, it can be concluded that various methods for graphic feature recognition have been enhanced due to the development of neural networks, which improve the recognition capabilities of machine learning. By training on large amounts of data, machines can automatically analyze and find optimal solutions. However, machine conclusions are not necessarily 100% correct. To improve recognition accuracy, besides increasing training data, image processing and adjustments to deep network model architecture may help solve the problem of poor efficiency in automatic recognition. Therefore, this study focuses on deep learning image recognition using engineering drawings. By training the system to read corresponding feature information from graphics, it can accurately segment and define the expressed categories, achieving automated drawing recognition.
2. Research Technical Background
2.1. GD&T
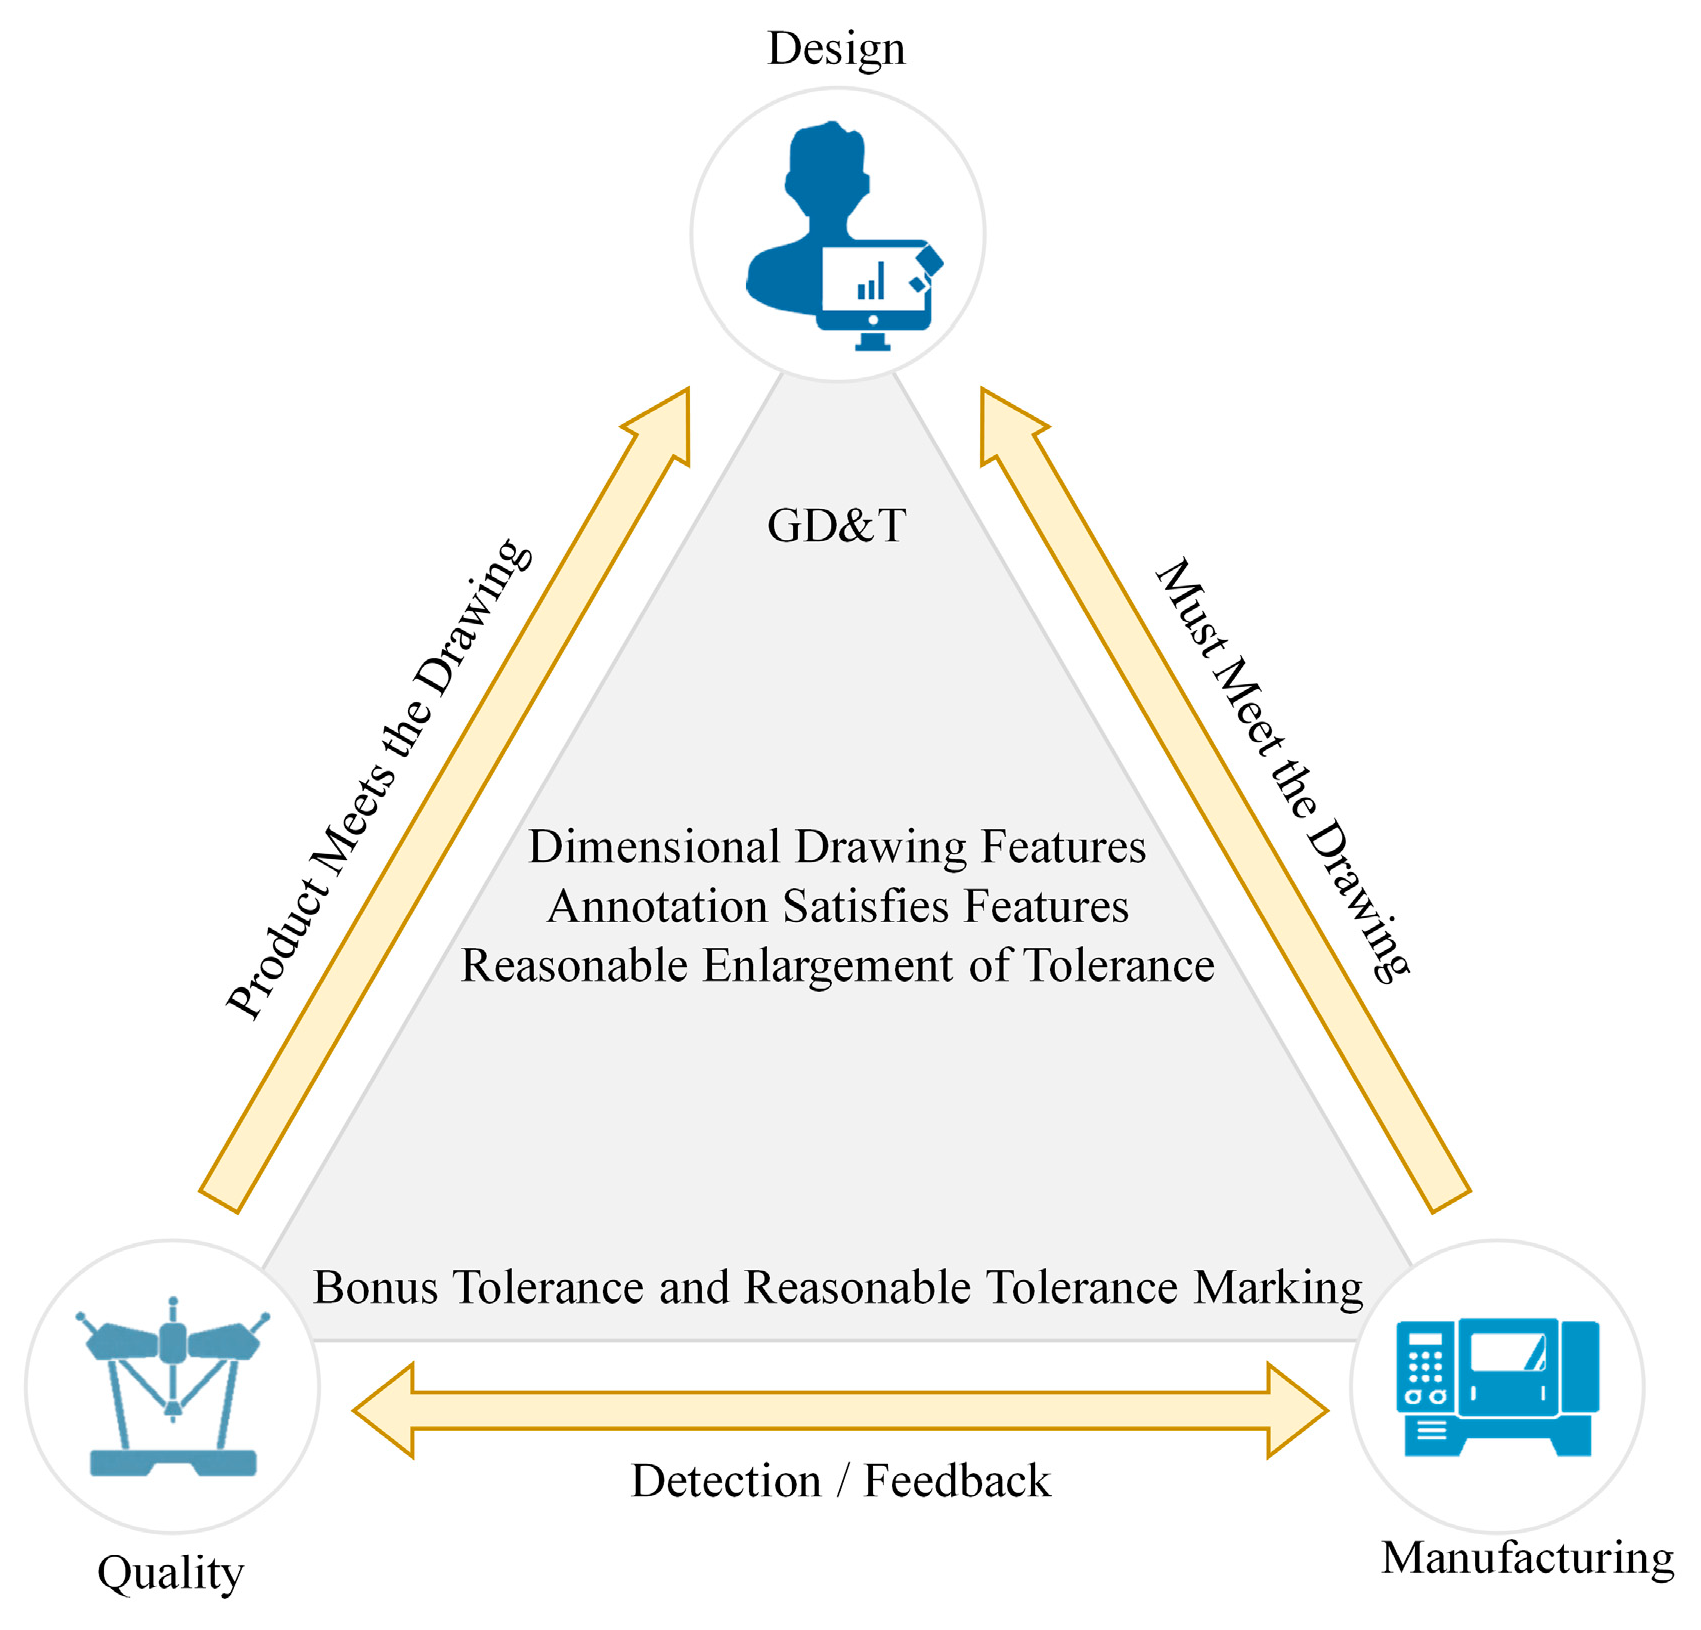
For product manufacturing processes, how to fully interpret the object on the drawing after part design is currently a major concern. Incomplete drawing design can result in defects in the production and inspection processes, leading to parts that do not accurately match the model. Therefore, in order to meet international requirements for drawing formats and symbols, a GD&T framework has been designed for assembly design and production standards, as shown in Figure 1. This framework is a universal language of engineering drawing symbols, primarily used in engineering drawings and models to define the allowable deviations of geometric elements. It can precisely express functional requirements for each feature’s position, orientation, size, shape, etc., in the design. Both production and verification personnel can use this language to understand design intent and inspection and to determine design requirements. Different companies use different GD&T standards. The two major geometric dimensioning and tolerancing standards used worldwide today are the ASME Y14.5 and ISO GPS standards. ASME Y14.5 is the American national standard, specifying dimensions and tolerances for part drawings only. ISO is the international standard, providing detailed specifications for gauge design, acceptance testing, coordinate measurement, calibration, and other procedures. Both standards aim to address issues of part interchangeability and assembly. Approximately 80% to 90% of the content in the two standards is similar. This study primarily adopts ASME Y14.5, which is widely used in the United States and globally, as shown in Figure 2. Geometric dimensioning and tolerance symbols are shown in Table 1.
2.2. Learning Model
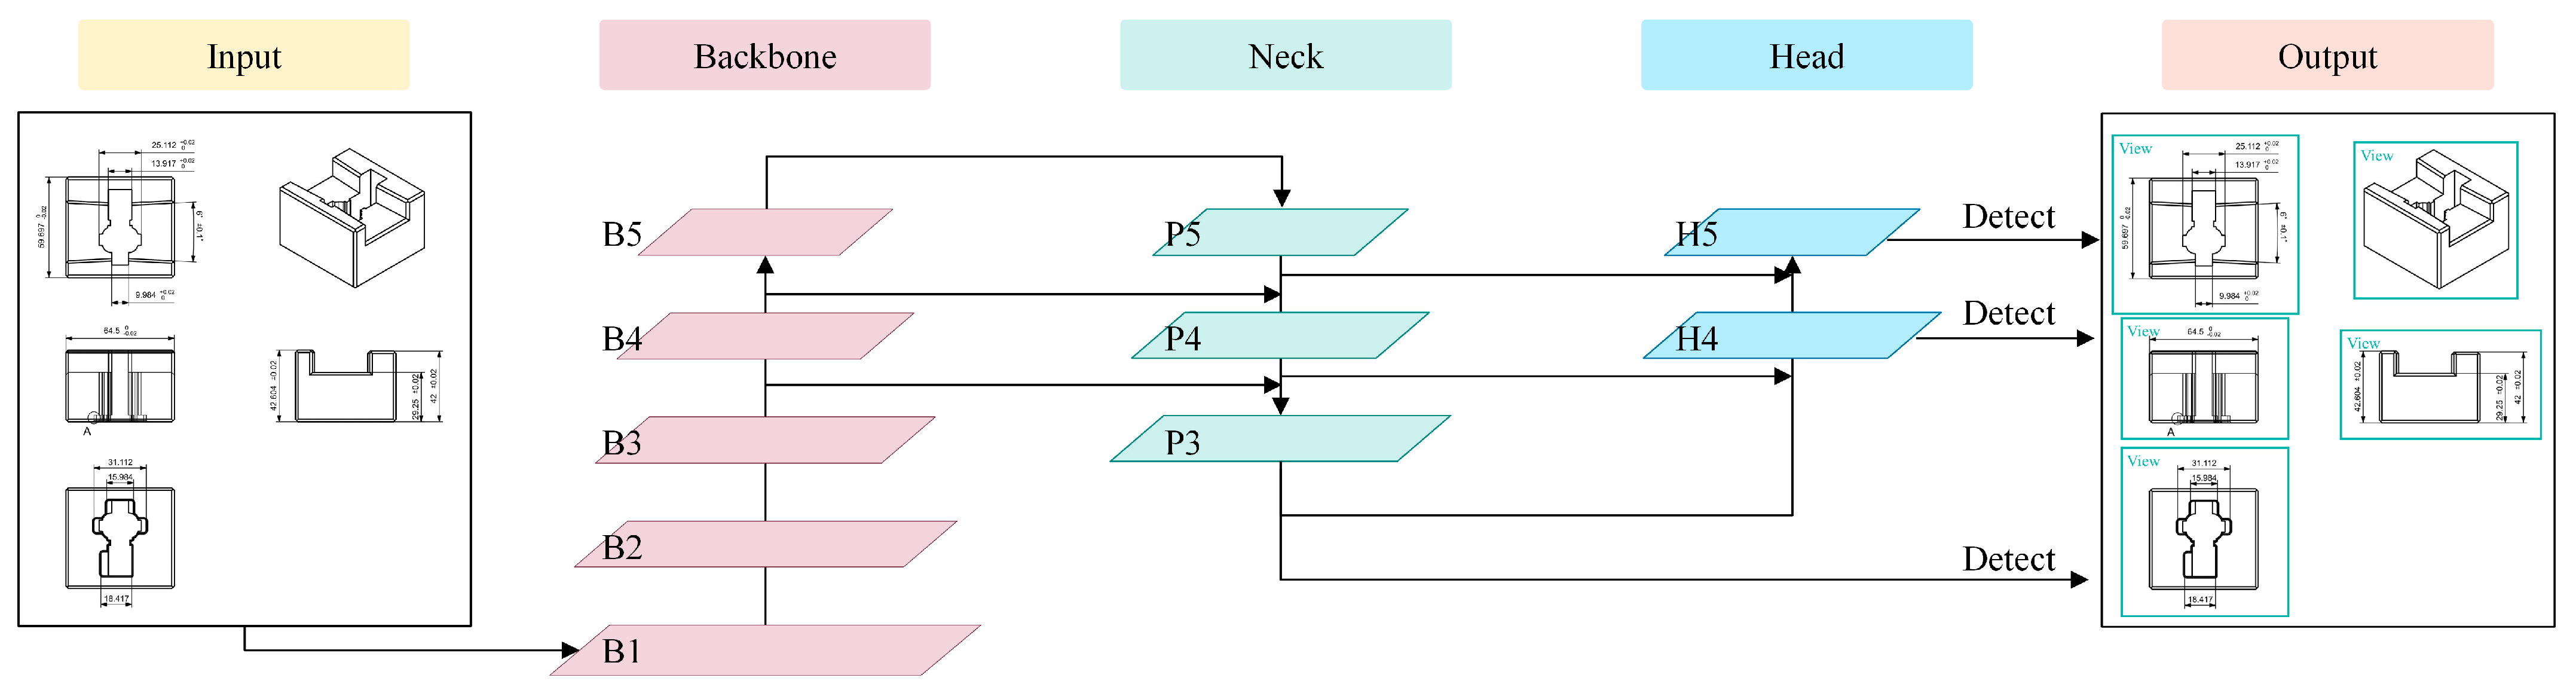
In this study, we utilized YOLOv7, which was proposed by Wang et al. [19], for the development of deep learning-based object recognition. YOLO is a fast and accurate object detection framework that treats the input image as a whole and predicts output through CNN channels. The overall architecture is depicted in Figure 3. The image is divided into multiple grid cells, and the neural network predicts the confidence, probability, and bounding boxes of objects. Finally, the Non-Maximum Suppression (NMS) algorithm is applied to filter out erroneous, overlapping, and inaccurate samples and determine the best detection locations. YOLOv7 outperforms all known object detectors in terms of both speed and accuracy within the range of 5 FPS to 160 FPS. It is primarily optimized in terms of the model architecture and training process.
For model architecture optimization, extended efficient layer aggregation networks and model scaling techniques are employed. In the training process optimization, re-parameterization techniques are used to replace the original modules, and a dynamic label assignment strategy is adopted to allocate labels more efficiently to different output layers.
In Figure 3, the Backbone is primarily responsible for feature extraction and processes the input image through the first pyramid structure. As the numbers increase from B1 to B5, the feature maps of the input image become progressively smaller. With the increasing numbers, the number of features with more channels also increases. The Neck performs upsampling from top to bottom and expands the feature maps layer by layer, reducing the numbers from P5 to P3. Through lateral connections, the Neck merges the features from different layers of the Backbone to obtain scale-rich representation information. The Head then undergoes a reverse process of the pyramid structure and is primarily used for predicting the class and position (bounding boxes) of the target.
3. Engineering Drawing Learning and Recognition
Graphical recognition and object classification are commonly applied in the field of deep learning, such as face and license plate recognition. The development of the YOLO algorithm system has enabled high-accuracy recognition of tiny cells in the medical field. However, object recognition in the engineering manufacturing domain is relatively scarce. This is mainly due to the inclusion of a large number of engineering symbols, numerical values, and terms in the drawings, making it difficult to integrate the information and express the content of engineering drawing recognition comprehensively. Therefore, this study aims to explore how to build an engineering drawing recognition system.
3.1. System Architecture
The development of this 2D engineering drawing recognition system primarily relies on machine learning to capture feature information from part views and utilize an optical character recognition engine to recognize corresponding numerical values and symbols. The system architecture is illustrated in Figure 4. It uses the Flask web framework, Python language, and platforms such as OpenCV (Open Source Computer Vision Library) and YOLOv7 to develop real-time image processing, computer vision, and image recognition training as preliminary operations. The open-source software Tesseract-OCR, developed by Google, is used for text character recognition. The system is integrated with a Relational database, Microsoft® (MS) SQL Server, to access the trained drawings and recognition-related information, facilitating efficient data adjustment and management. Through a user interface, the system displays pre-training and post-training recognition information, providing functions for adding, editing, and deleting information, allowing users to modify the data and store the modified information in the database again for further reinforcement learning.
3.2. Object Detection Process
Based on Python, PyTorch, and YOLO, this study develops the recognition of drawing features by establishing various decision criteria and loop structures, combined with image preprocessing using OpenCV, to achieve position prediction and detection. The common detection process methods are referenced during the process, as shown in Figure 5. In image recognition, the quality of the image directly affects the detection rate and recognition rate. Therefore, preprocessing of the input image is necessary. Firstly, OpenCV is used for preprocessing the images. Then, YOLO is employed to scan the images and extract features. The trained detection classifier is combined to obtain confidence values for each region within a sliding window, enabling the prediction of classification results in that region. Finally, OpenCV is utilized for post-processing the images, where the results obtained from YOLO detection are used for image cropping and classification.
3.3. Object Recognition Process
Automatically recognizing the feature information of engineering drawings presents some challenges. In terms of location, some information may be densely packed, while other information may be dispersed, making it difficult to select text regions effectively. To narrow down the detection range, the entire image is analyzed in layers, as shown in Figure 6. Firstly, the engineering drawing is segmented into individual views, separating the graphics and their annotations for each view. Then, the drawing features are categorized into five groups: dimensions, tolerances, upper tolerances, lower tolerances, and feature control frames. Dimensions express the basic size of the part, tolerances represent the allowable differences in part dimensions, and feature control frames describe the conditions and tolerances for geometric control in GD&T. Each group has its own meaning, which is one of the reasons why engineering drawings are crucial in the manufacturing domain. At this stage, the search area on the drawing has been minimized, and numerical values and symbols are recognized for each group. Clear classification predictions are made for individual characters, and the predicted information is uniformly stored in the database.
3.4. Engineering Drawing Recognition Model Training
Following the aforementioned recognition architecture, the engineering drawing is analyzed and processed in layers. In this study, three YOLO models are trained for feature recognition and Tesseract-OCR is utilized for text recognition, achieving the application of engineering drawing recognition.
3.4.1. View Detection Training
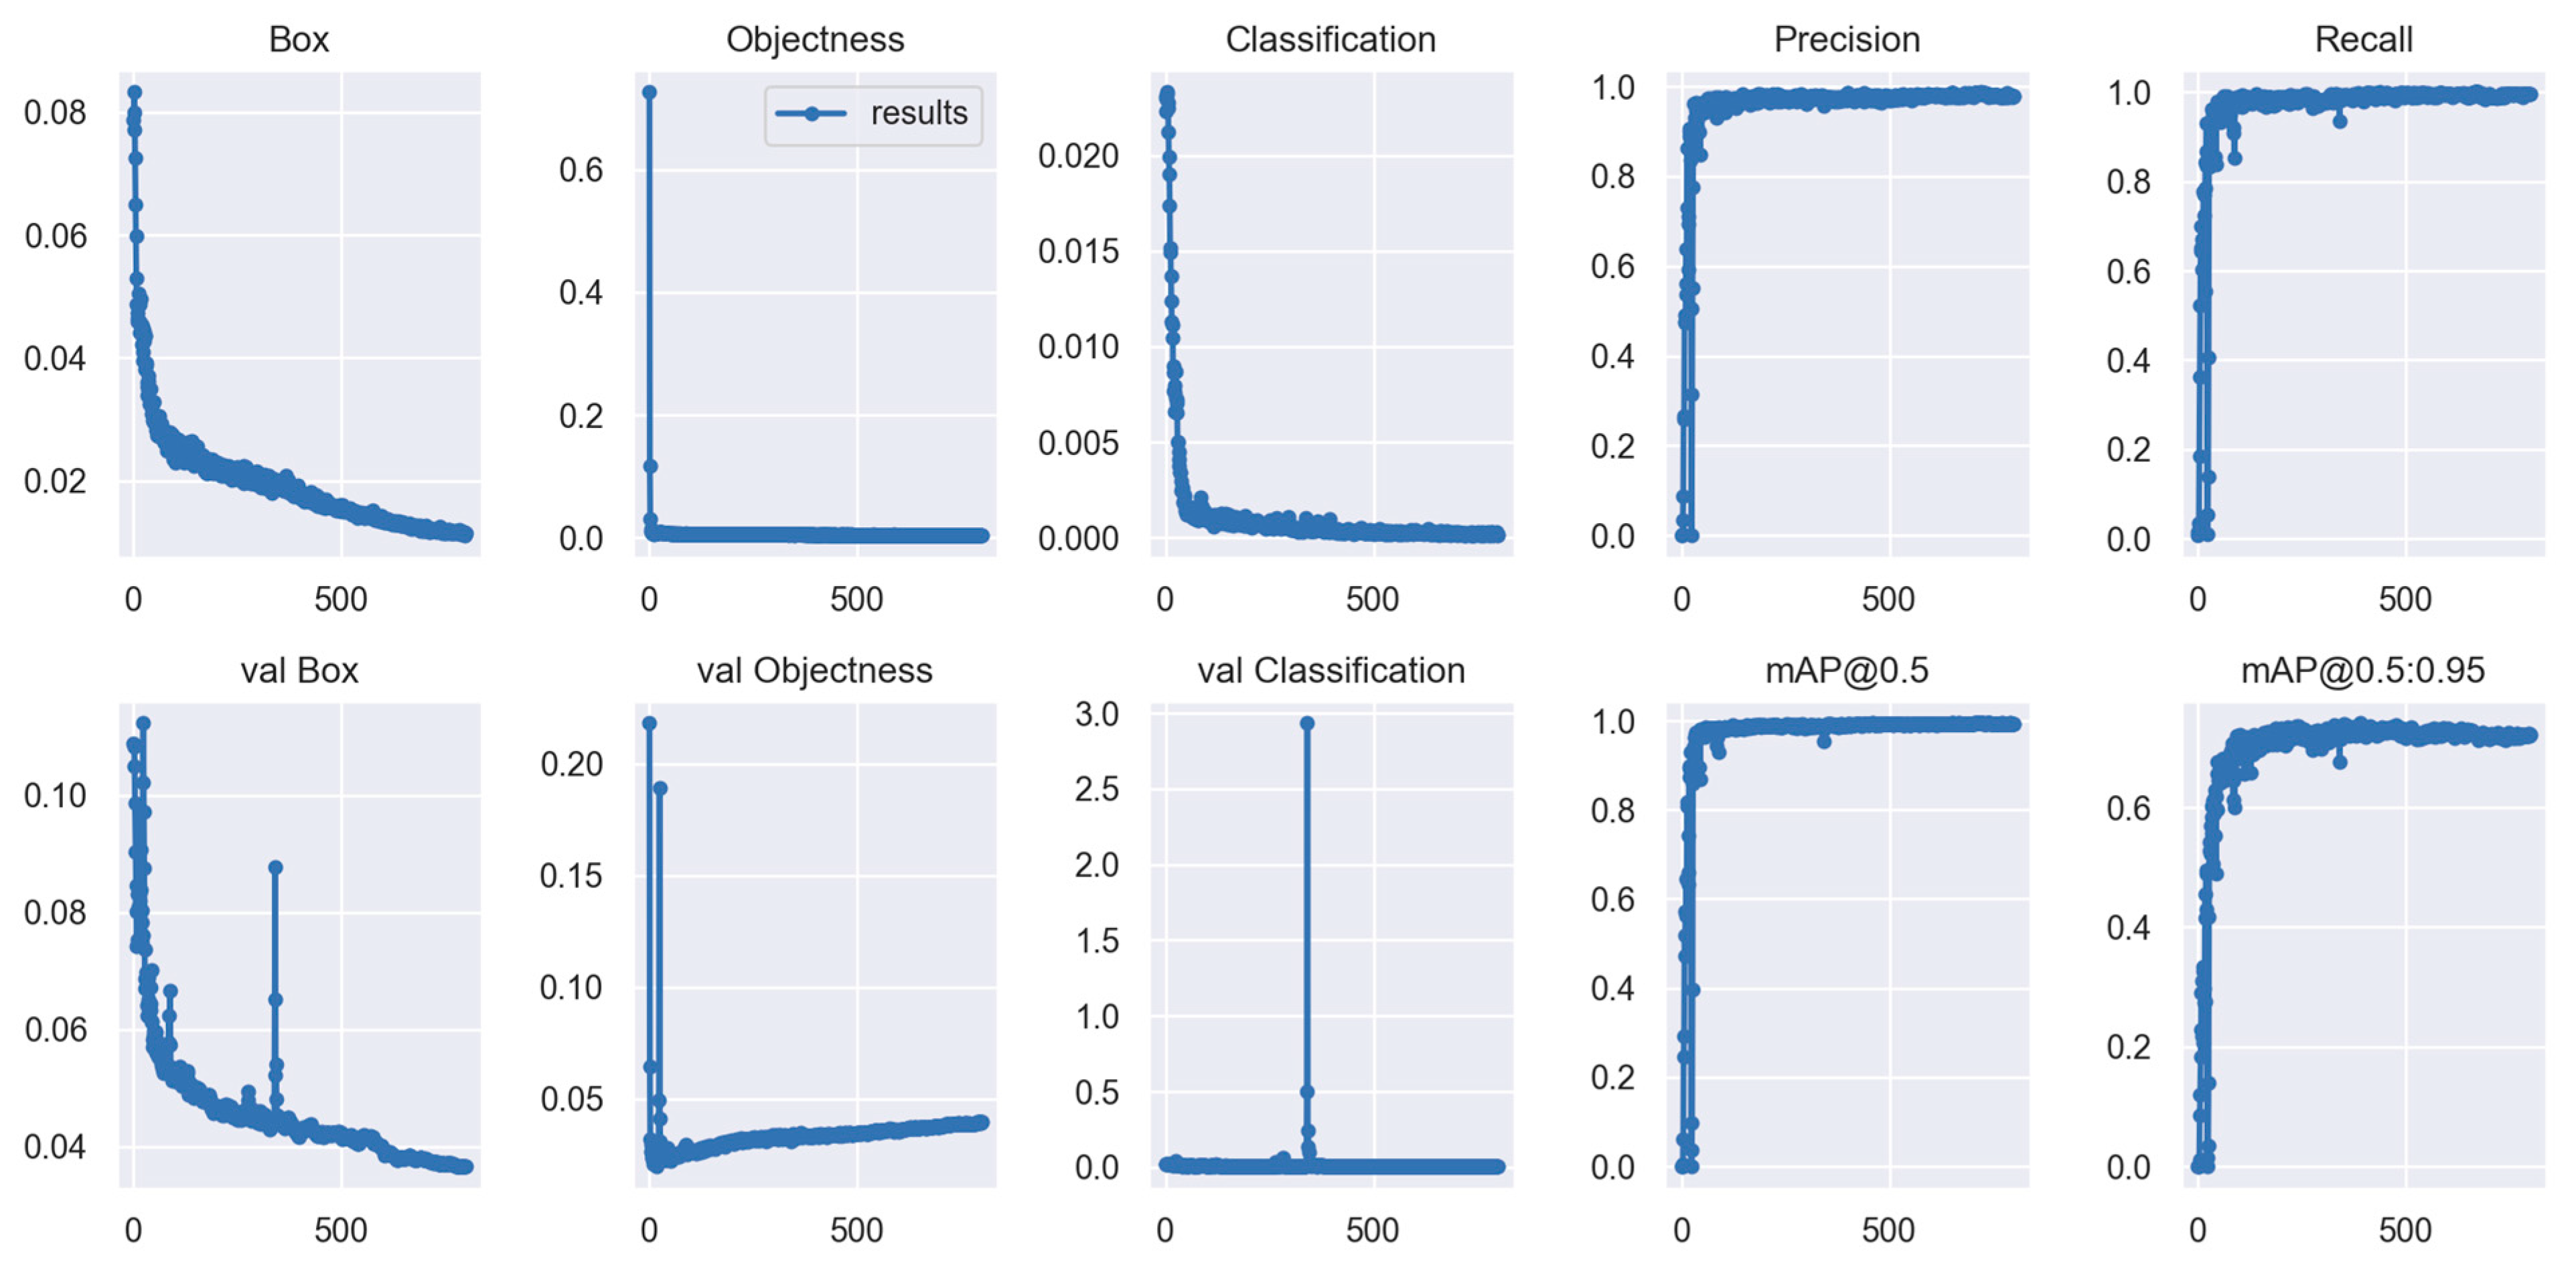
In engineering drawings, in addition to part views, features such as dimensions and tolerances marked on the same part view need to be selected. The training data annotation method for engineering drawing view recognition is shown in Figure 7. Two hundred and forty engineering drawings are used as training data, and twenty engineering drawings are used as validation data for training the view position recognition model. The training curve of the model is shown in Figure 8 and illustrates the performance metrics for the training and validation sets. The horizontal axis represents the number of training iterations. Plots of box loss, objectness loss, classification loss, precision, recall, and mean average precision (mAP) over the training epochs for the training and validation set are shown. The box loss evaluates the algorithm’s ability to accurately determine the center of an object and the extent to which the predicted bounding box covers an object. Objectness can be described as a measure of the probability that an object exists in a proposed region of interest. If the objectness is high, it indicates a higher probability that the image window contains an object. Classification loss provides an indication of the algorithm’s ability to accurately predict the correct class of a given object. In the training of view recognition, there is only one type of class, so the classification loss is 0.
3.4.2. Annotation Group Detection Training
The main annotation groups in the views are primarily divided into three types: dimension (DIM) annotation with size and tolerance, datum annotation for datum plane, and feature control frame (FCF) annotation. The feature annotation method for view recognition annotation groups is shown in Figure 9. A total of 470 views were used as training data, with 40 views used for validation. The model was trained to recognize annotation group types, and the training curve of the model is shown in Figure 10.
3.4.3. Annotation Detection Training
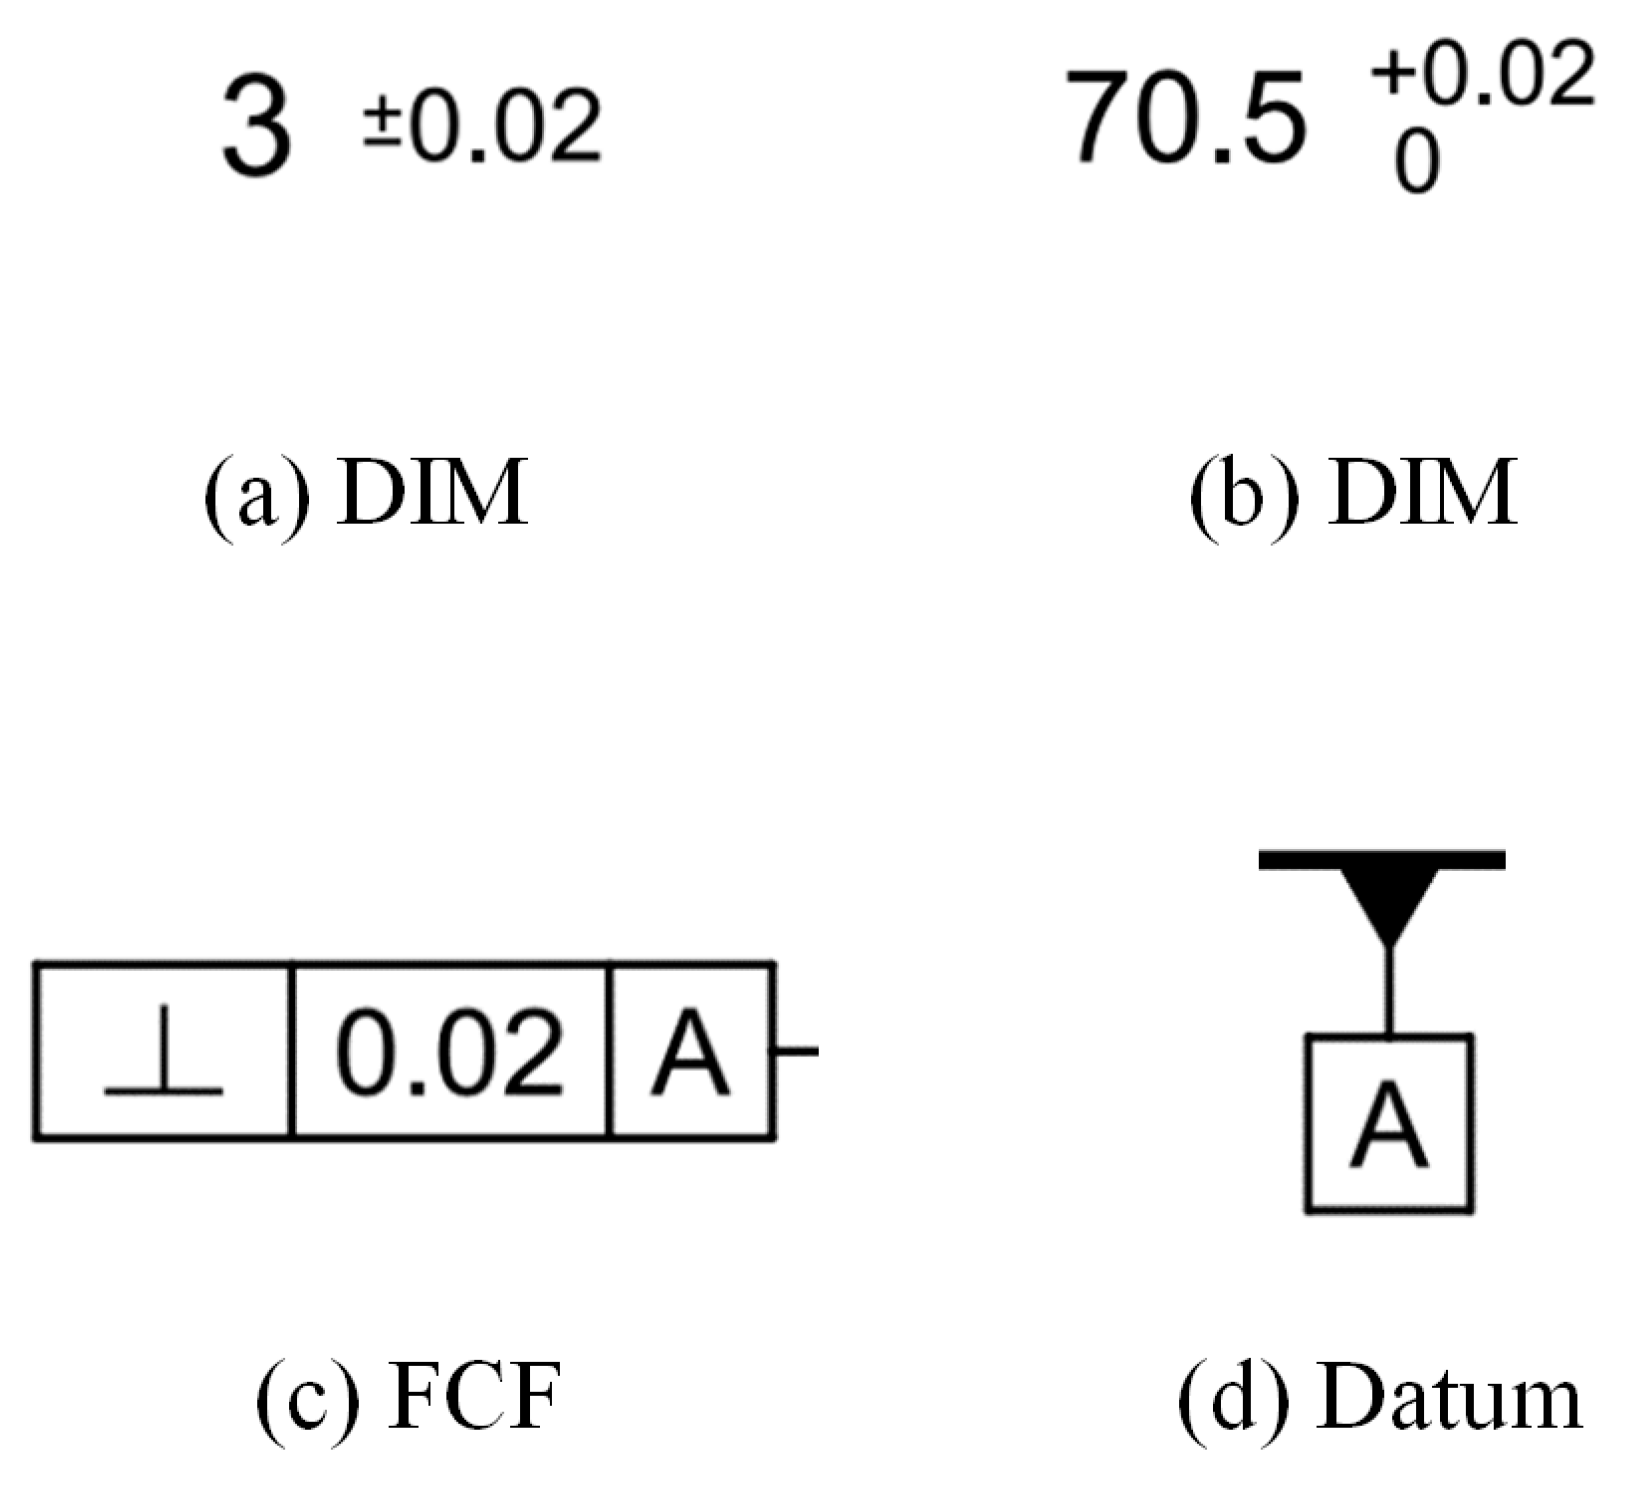
The annotation of geometric dimensions and tolerances on engineering drawings follows certain regular formats. The size annotation for dimensions can be in the form of basic dimensions with plus/minus tolerance symbols or tolerance annotation with upper and lower limits, as shown in Figure 11a,b. The content of the feature control frame annotation consists of geometric feature symbols, specified tolerances, and datums, as shown in Figure 11c. The annotation for the datum plane is relatively simple, involving only the symbol indicating the datum plane, as shown in Figure 11d. By categorizing these annotations, the values and tolerances in engineering drawings can be labeled with features, and a neural network model can be trained. The feature annotation method for training data is shown in Figure 12. A total of 285 dimension annotation images were used as training data, with 20 images used for validation. The model was trained to recognize geometric dimensions and tolerances, and the training curve of the model is shown in Figure 13.
3.4.4. Character Recognition
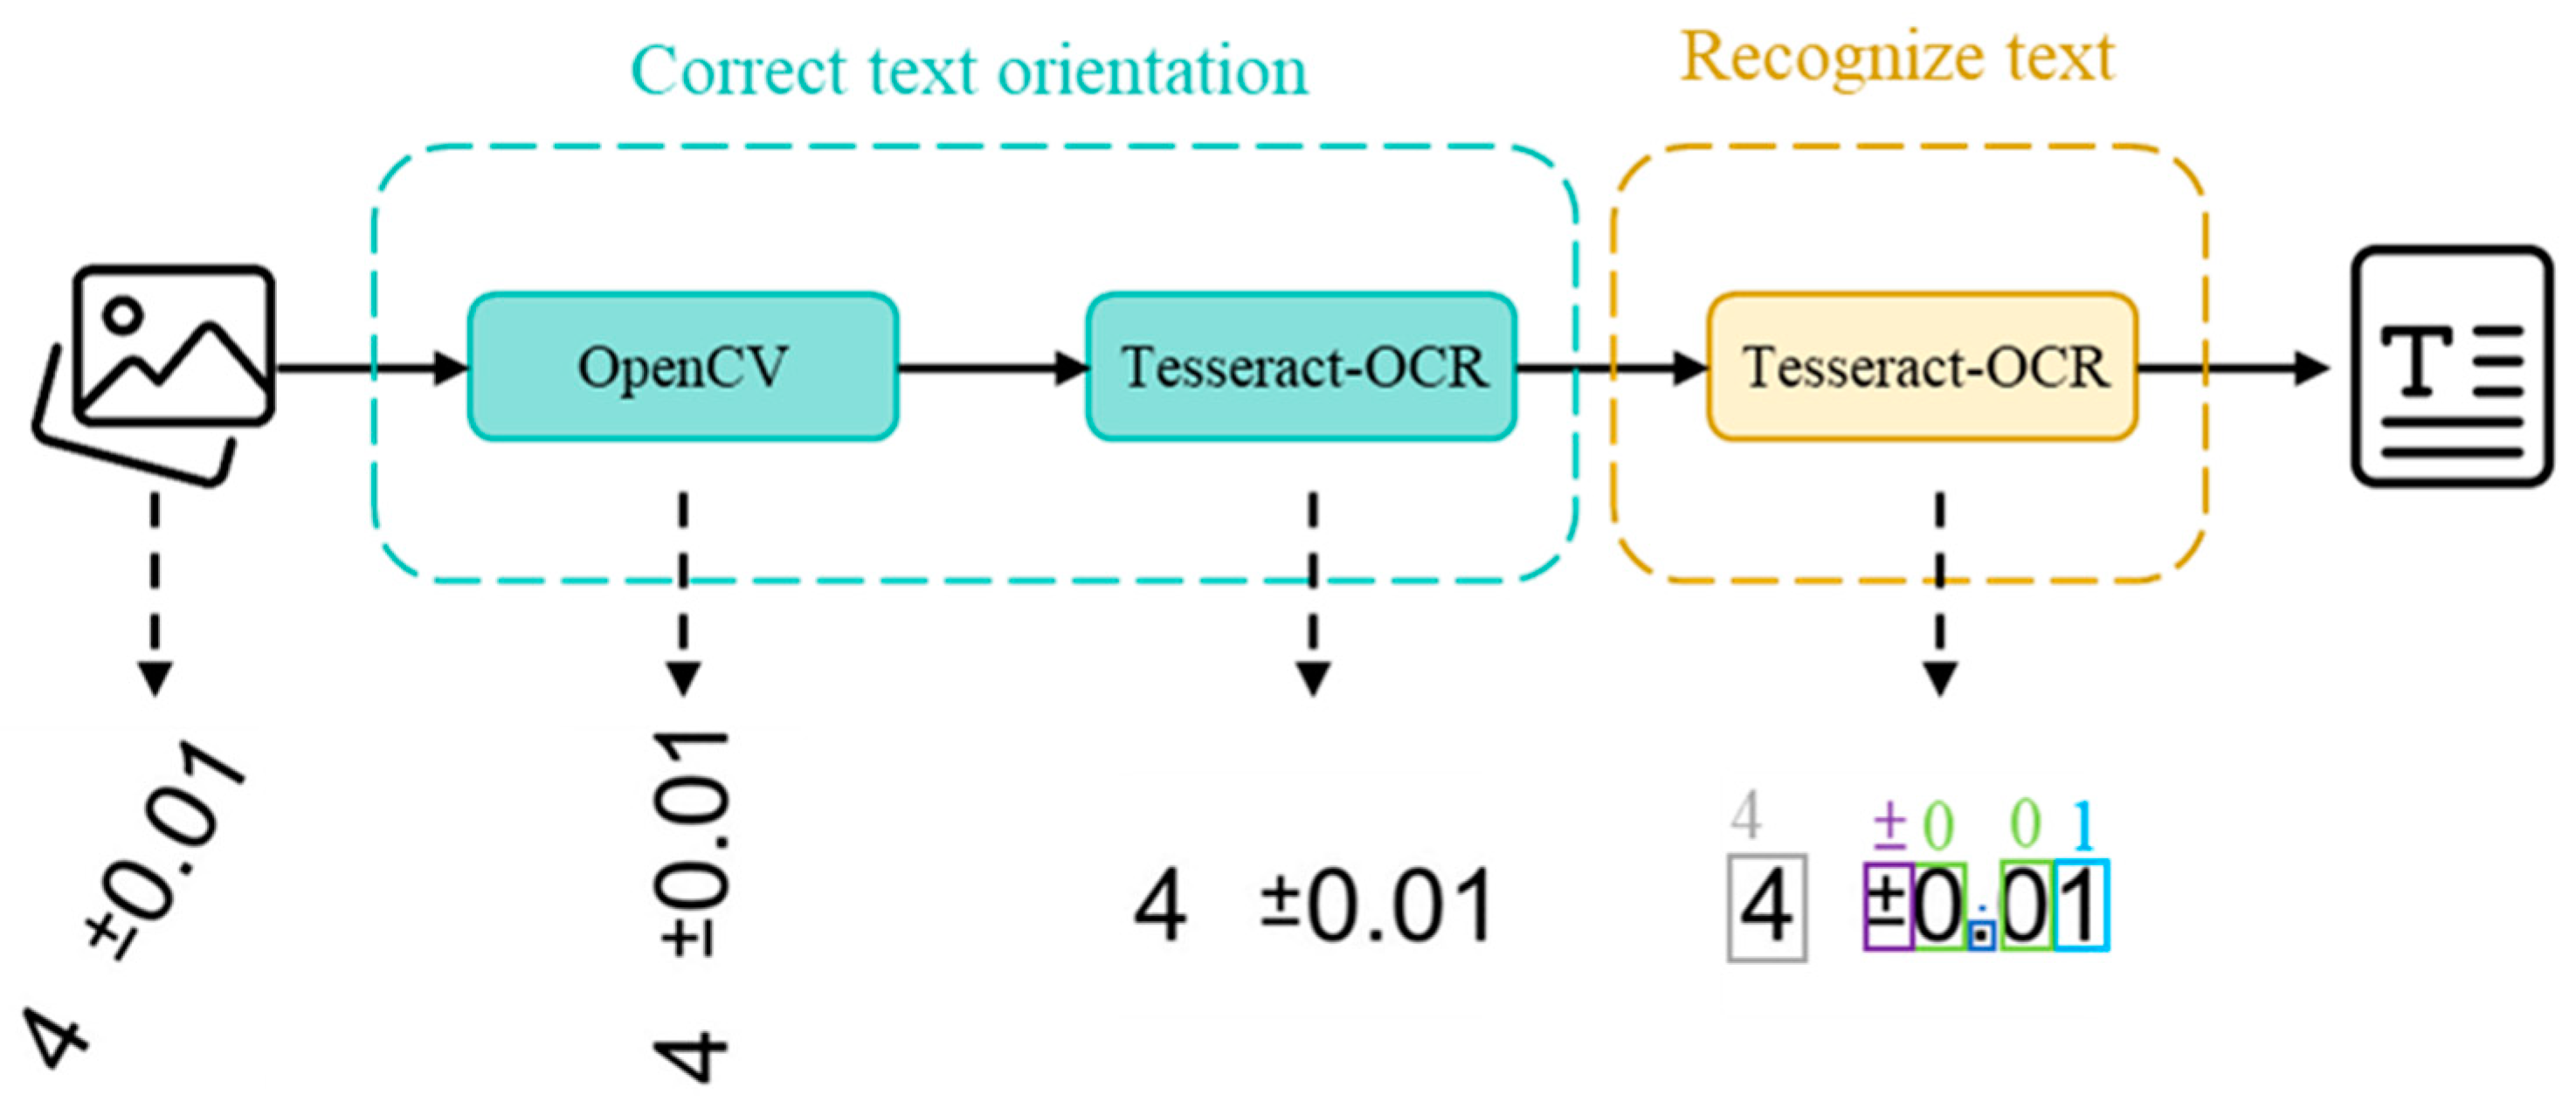
The orientation of the text in engineering drawings may not always be in the standard direction due to the type of annotation. For example, when annotating angles or radii/diameters, the rotation angle of the text may vary depending on the placement by the drafter, as shown in Figure 14. To ensure accurate character recognition and avoid the impact of text rotation angles, it is necessary to correct the text orientation of the extracted text images from the engineering drawings before performing character recognition.
The optical character recognition engine Tesseract-OCR itself has the capability to detect text angles, but it is limited to situations where the rotation angle is a multiple of 90 degrees, which is insufficient to handle all types of annotated text. OpenCV also has the ability to calculate the deviation angle and perform correction, but it is limited to angles between 0 and 90 degrees. Therefore, by combining the text orientation correction capabilities of both Tesseract-OCR and OpenCV, the text can be oriented correctly.
4. Case Study
The trained models were fine-tuned and integrated and an image classification task was planned. In this case study, an engineering drawing will be used as an example to demonstrate the process of recognizing numerical values and symbols within the drawing.
4.1. Case Discussion
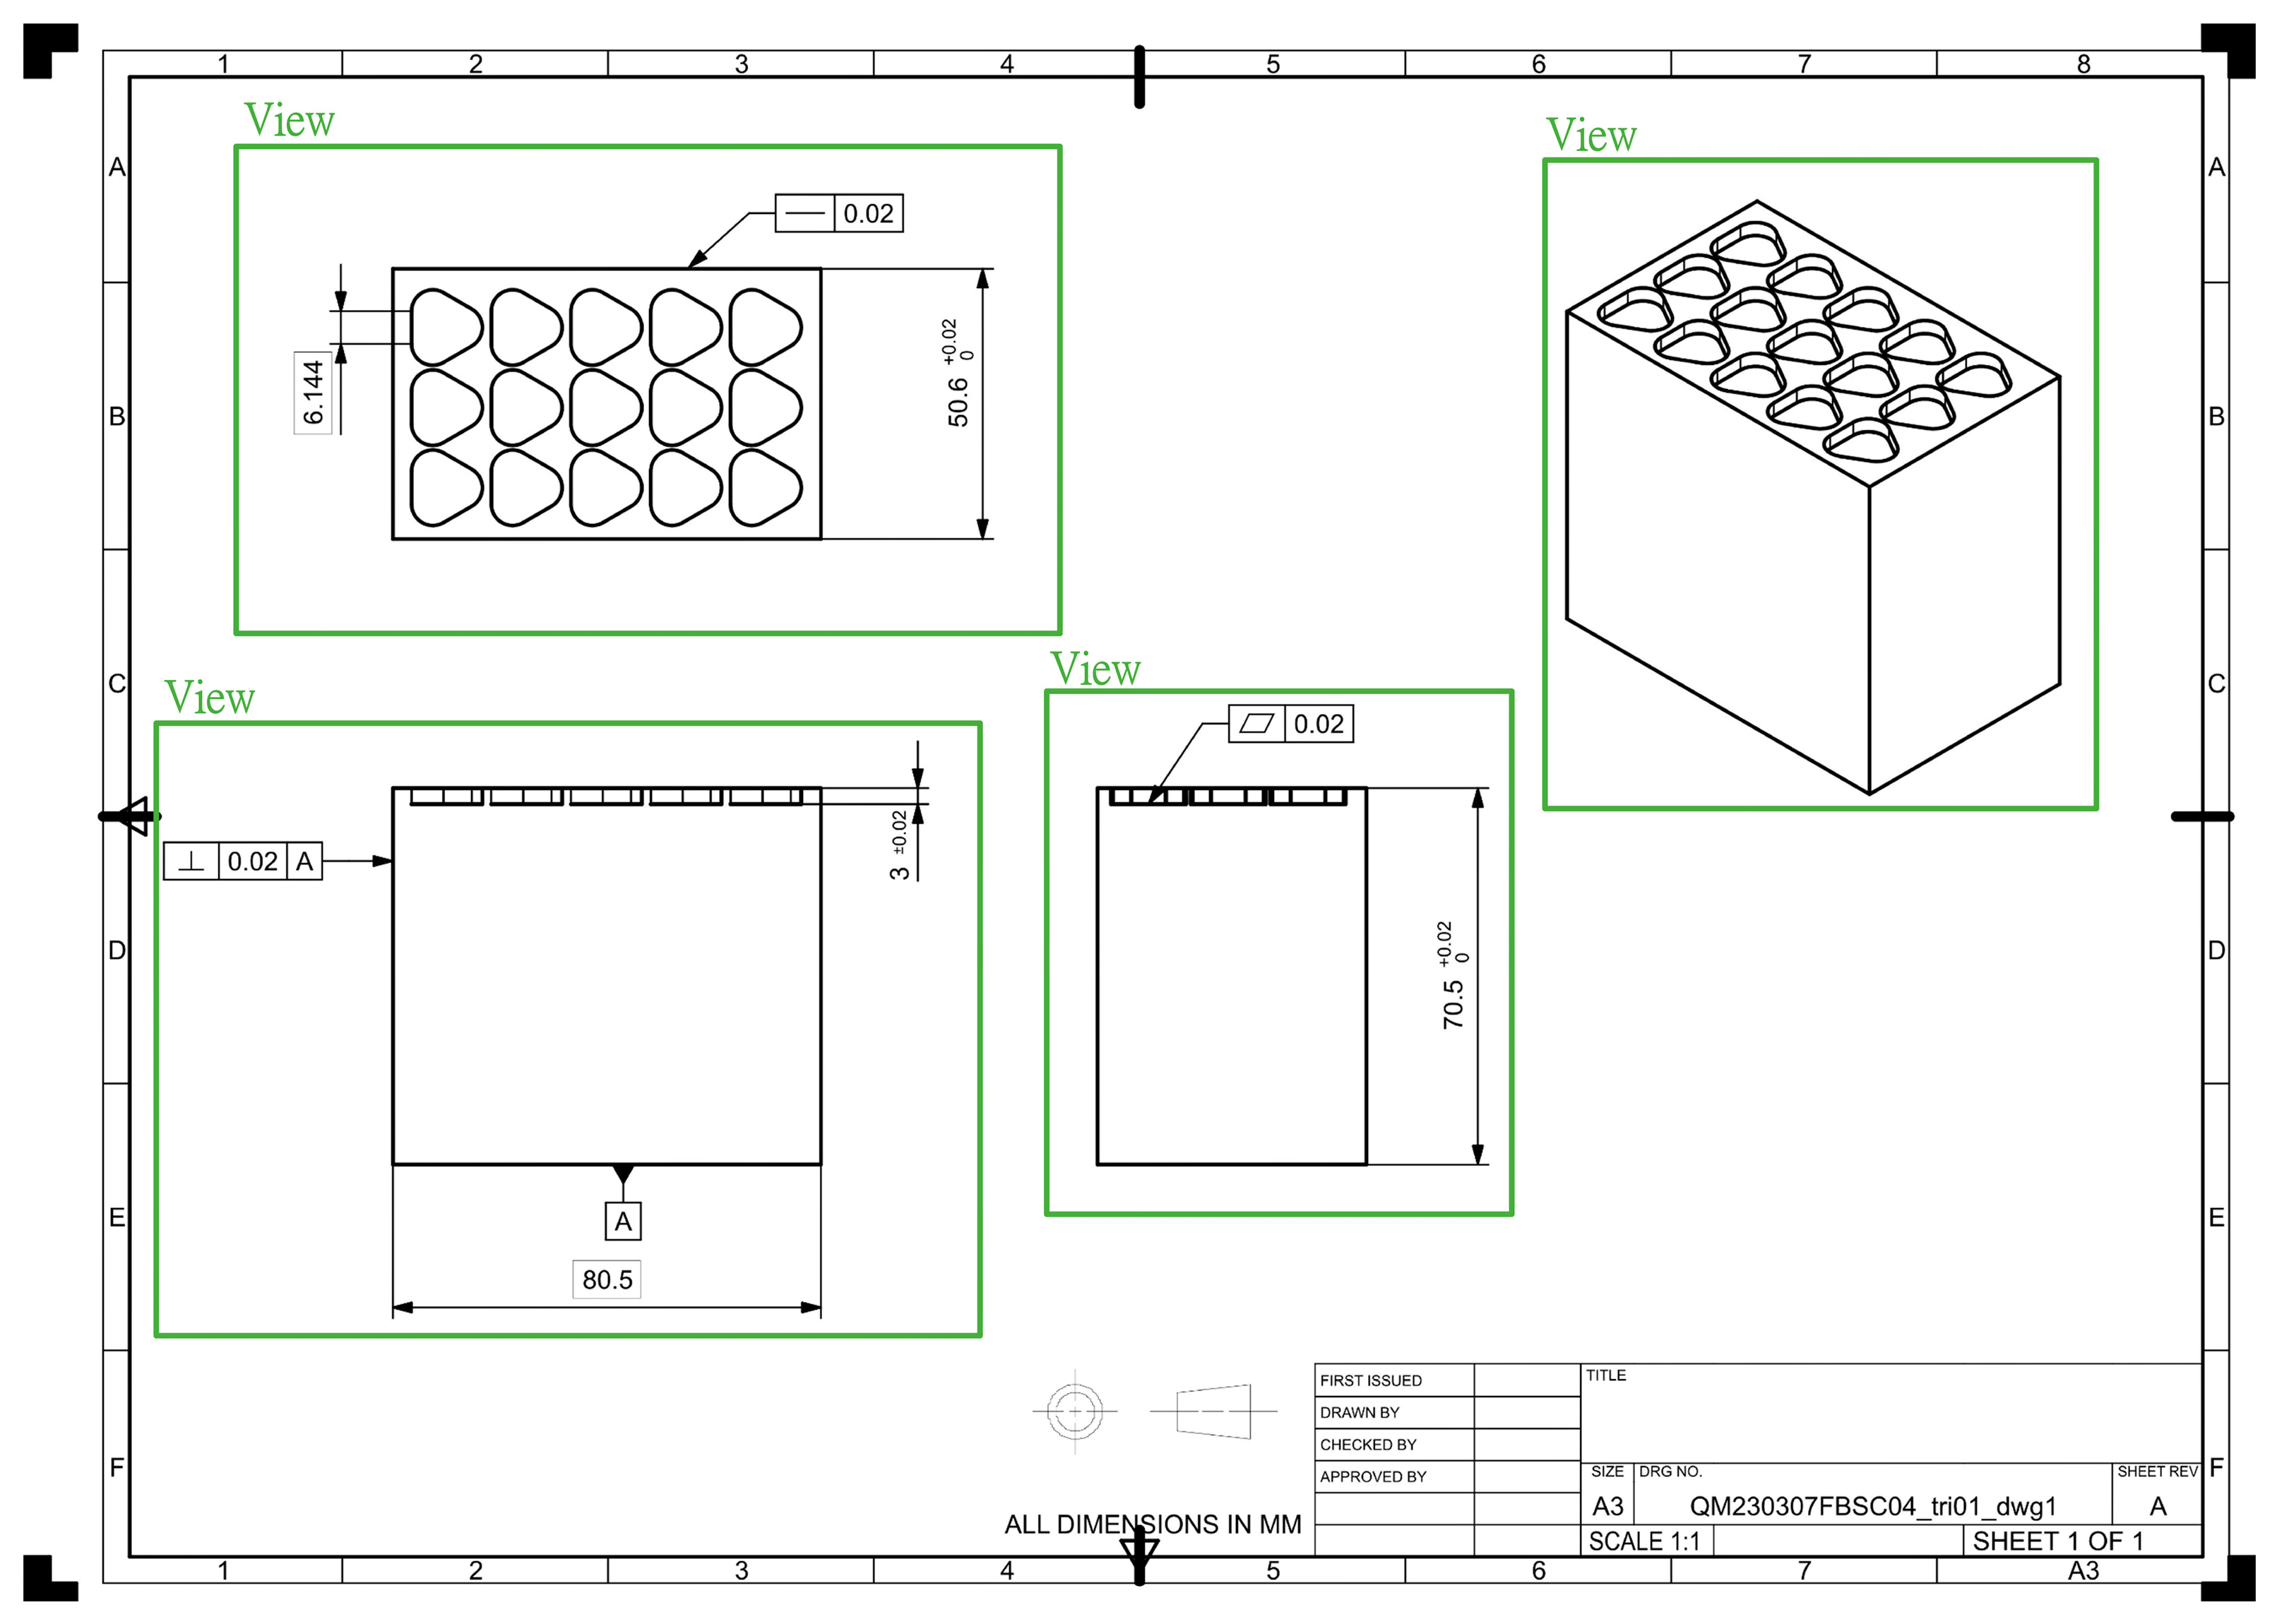
The view part of this case’s engineering drawing includes top view, front view, right-side view, and isometric view. The annotation part includes theoretical dimensions, plus/minus tolerances, upper and lower tolerance limits, feature control frames, and datum plane, as shown in Figure 17.
4.2. Test Results
The test results are divided into two parts: the detection of views in the engineering drawing and the detection and interpretation of annotations within the views.
4.2.1. Hardware Specifications and Computation Time
4.2.2. View Detection in Engineering Drawing
The web interface of the view detection in the case engineering drawing is shown in Figure 18. From the image, it can be seen that the system can accurately detect each view and all the annotated features associated with the respective views.
4.2.3. Annotation Detection in Views
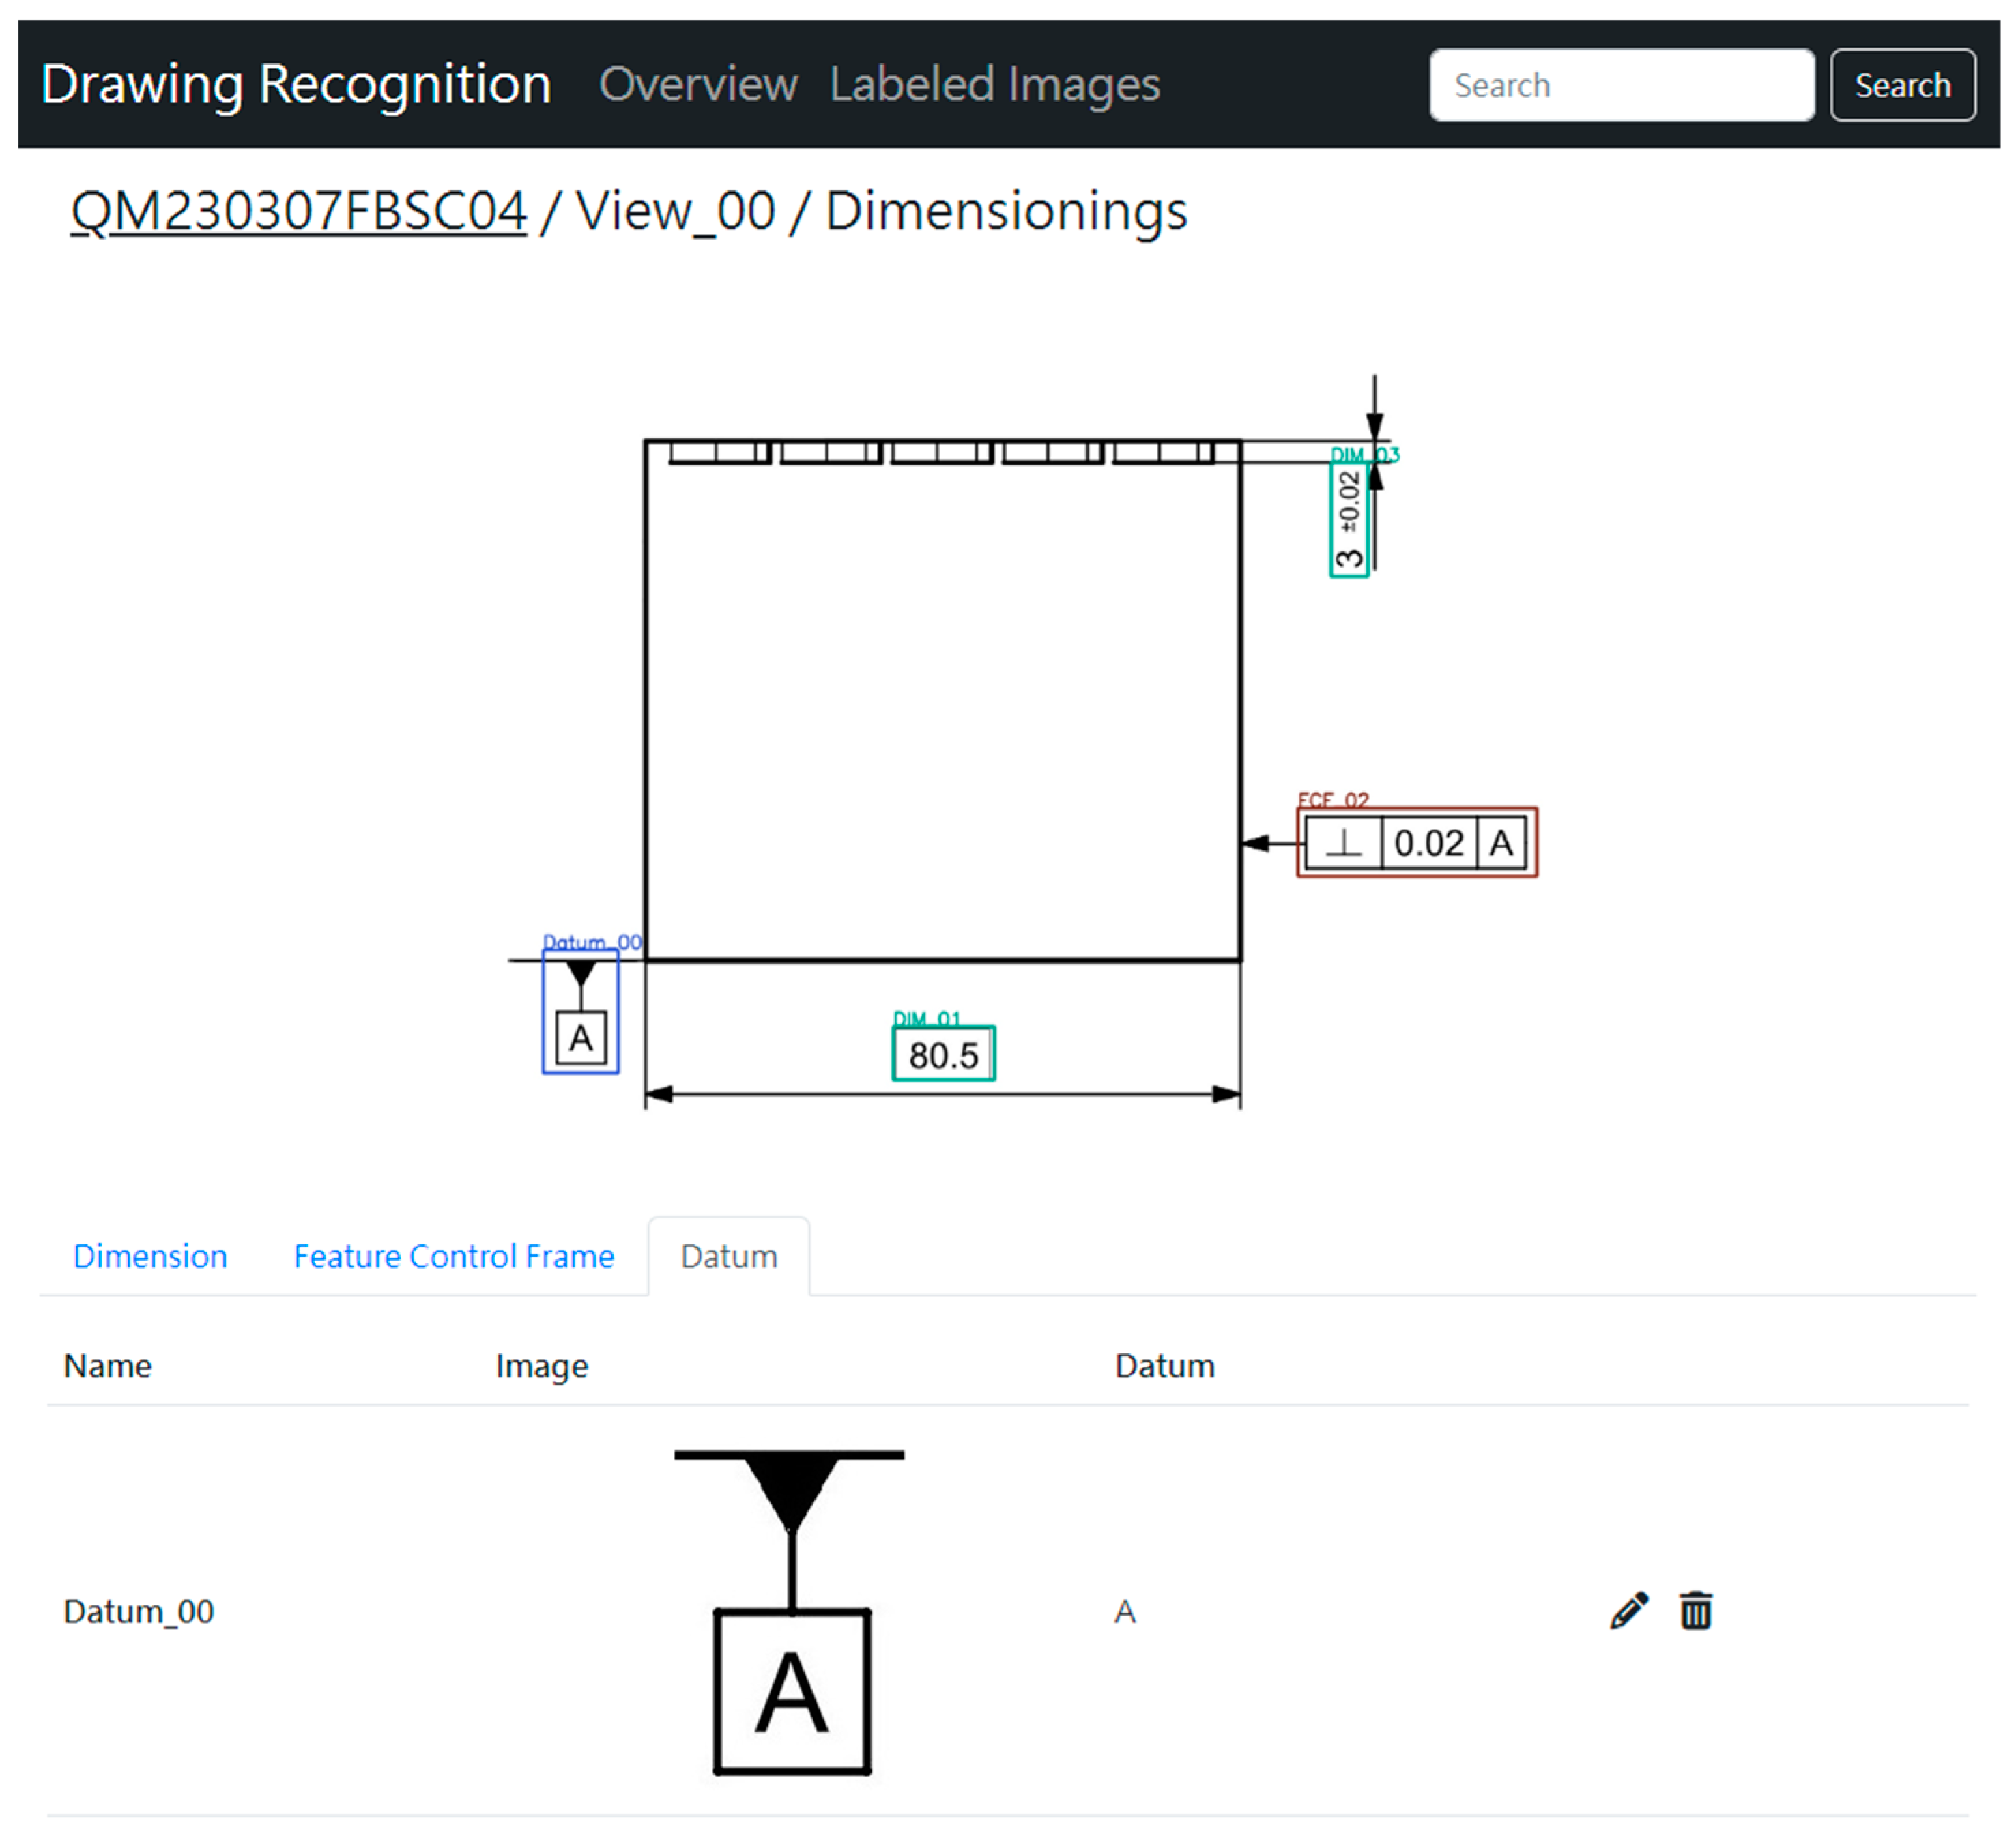
The annotation detection part includes the detection of dimension annotations, datum plane annotations, and feature control frame annotations. The web interface for detecting dimension annotations is shown in Figure 19. The system correctly detects the dimension annotation features in the views, corrects non-forward-facing annotation text, and accurately recognizes dimension and tolerance values. The web interface for detecting datum plane annotations is shown in Figure 20. The system accurately detects the datum plane annotation features in the views and correctly recognizes the datum plane text content. The web interface for detecting feature control frame annotations is shown in Figure 21. The system accurately detects the feature control frame features in the views and correctly recognizes the feature symbols, tolerances, and datums within the feature control frames.
5. Conclusions and Future Outlook
5.1. Conclusions
Engineering drawings are a primary tool for part design, effectively expressing design ideas through drawings and serving as a means of communication among designers, manufacturers, and inspectors. Therefore, engineering drawings can be considered a universal language in the industry. However, manual interpretation of drawings can be inefficient, especially when dealing with a large number of drawings. Hence, this study developed a 2D engineering drawing deep learning application integration system that utilizes the feature information of drawings to develop an efficient model recognition system. The system achieved an accuracy rate of nearly 70% in recognition, significantly reducing manual interpretation time and accurately identifying basic categories of dimensions, tolerances, and functional controls in engineering drawings.
5.2. Future Outlook
The current module for drawing feature recognition developed in this study has not been able to recognize all the specifications of GD&T. We hope to continue conducting in-depth research towards the following goals in the future:
- Model Classification Training
Currently, the model can effectively identify basic tolerance symbols and numerical feature positions in real-time predictions of 2D engineering drawings. However, symbols for modifier indications in GD&T, which represent compensatory tolerances, have not been included in the model training. This is an area that will continue to be developed in the future.
- 2.
- Group Classification
Currently, the group model classification can only detect five basic categories: dimensions, tolerances, upper tolerances, lower tolerances, and feature control frames. In the future, more advanced composite positional tolerance features, such as advanced versions of feature control frames, need to be added. This is also one of the additional tasks that need to be planned for the recognition model.
- 3.
- Automatic Construction of 3D Models
In the future, we aim to automate the construction of 3D models based on the information extracted from 2D engineering drawings. This will further enhance the efficiency and accuracy of the design process.
Author Contributions
Conceptualization, Y.-H.T. and W.-R.J.; methodology, Y.-H.L., Y.-H.T., Y.-C.H. and K.-L.C.; software, Y.-H.L., Y.-C.H. and K.-L.C.; validation, Y.-H.T., W.-R.J.; writing—original draft preparation, Y.-H.L. and Y.-C.H.; writing—review and editing, Y.-H.L.; visualization, Y.-H.L. and K.-L.C.; supervision, Y.-H.T. and W.-R.J. All authors have read and agreed to the published version of the manuscript.
Funding
This research received no external funding.
Data Availability Statement
The training data and source code are available by https://github.com/LinYiHsin/recg_drawing.git, accessed on 10 July 2023.
Conflicts of Interest
The authors declare no conflict of interest.
References
- Zhou, L.; Su, Z.; Tang, W. Topology Integrity Verification for 2D Engineering CAD Drawings. J. Comput. Aided Des. Comput. Graph. 2017, 29, 895–905. [Google Scholar]
- Moreno-Garcia, C.F.; Elyan, E.; Jayne, C. New trends on digitization of complex engineering drawings. Neural Comput. Appl. 2019, 31, 1695–1712. [Google Scholar] [CrossRef] [Green Version]
- Sun, W.; Gao, Y. A Datum-Based model for Practicing Geometric Dimensioning and Tolerancing. J. Eng. Technol. 2018, 35, 38–47. [Google Scholar]
- ASME Y14.5-2018 Dimensioning and Tolerancing. Engineering Product Definition and Related Documentation Practices; American Society of Mechanical Engineers: New York, NY, USA, 2018.
- Scheibel, B.; Mangler, J.; Rinderle-Ma, S. Extraction of dimension requirements from engineering drawings for supporting quality control in production processes. Comput. Ind. 2021, 129, 103442. [Google Scholar] [CrossRef]
- Trischler, A.; Ye, Z.; Yuan, X.; He, J. A Parallel-Hierarchical Model for Machine Comprehension on Sparse Data. Assoc. Comput. Linguist. 2016, 1, 432–441. [Google Scholar]
- Wan, Y.; Wang, X.; Lu, D. Research on Key Techniques of Chinese Text Positioning in Natural Scenes. Comput. Appl. Softw. 2018, 35, 243–249. [Google Scholar]
- Epshtein, B.; Ofek, E.; Wexler, Y. Detecting text in natural scenes with stroke width transform. In Proceedings of the 2010 IEEE Computer Society on Computer Vision and Pattern Recognition, San Francisco, CA, USA, 13–18 June 2010; pp. 2963–2970. [Google Scholar]
- Yu, B.; Wan, H. Chinese text localization in natural scene based on heuristic rules and SVM. Electron. Des. Eng. 2016, 24, 161–164. [Google Scholar]
- Lecun, Y.; Bottou, L.; Bengio, Y.; Haffner, P. Gradient-based learning applied to document recognition. Proc. IEEE 1998, 86, 2278–2324. [Google Scholar] [CrossRef]
- Krizhevsky, A.; Sutskever, I.; Hinto, G. Imagenet classification with deep convolutional neural networks. Commun. ACM 2012, 60, 84–90. [Google Scholar] [CrossRef] [Green Version]
- Simonyan, K.; Zisserman, A. Very Deep Convolutional Networks for Large-Scale Image Recognition. In Proceedings of the 2015 International Conference on Learning Representations, San Diego, CA, USA, 7–9 May 2015. [Google Scholar]
- Liu, Z.; Li, X.; Luo, P.; Loy, C.; Tang, X. Semantic Image Segmentation Via Deep Parsing Network. In Proceedings of the IEEE International Conference on Computer Vision (ICCV), Santiago, Chile, 7–13 December 2015; pp. 1377–1385. [Google Scholar]
- Yu, F.; Koltun, V. Multi-Scale Context Aggregation by Dilated Convolutions. In Proceedings of the 2016 International Conference on Learning Representations, San Juan, Puerto Rico, 2–4 May 2016. [Google Scholar]
- Lv, L.; Li, X.; Jin, J.; Li, X. Image Semantic Segmentation Method Based on Atrous Algorithm and Convolution CRF. In Proceedings of the IEEE 7th International Conference on Computer Science and Network Technology (ICCSNT), Dalian, China, 19–20 October 2019; pp. 160–165. [Google Scholar]
- Chen, L.C.; Papandreou, G.; Kokkinos, I.; Murphy, K.; Yuille, A.L. DeepLab: Semantic Image Segmentation with Deep Convolutional Nets, Atrous Convolution, and Fully Connected CRFs. IEEE Trans. Pattern Anal. Mach. Intell. 2017, 40, 834–848. [Google Scholar] [CrossRef] [PubMed] [Green Version]
- He, K.; Zhang, X.; Ren, S.; Sun, J. Deep Residual Learning for Image Recognition. In Proceedings of the IEEE Conference on Computer Vision and Pattern Recognition (CVPR), Las Vegas, NV, USA, 27–30 June 2016; pp. 770–778. [Google Scholar]
- Redmon, J.; Divvala, S.; Girshick, R.; Farhadi, A. You Only Look Once: Unified, Real-Time Object Detection. In Proceedings of the IEEE Conference on Computer Vision and Pattern Recognition (CVPR), Las Vegas, NV, USA, 27–30 June 2016; pp. 779–788. [Google Scholar]
- Wang, C.Y.; Bochkovskiy, A.; Liao, H.Y.M. YOLOv7: Trainable Bag-of-freebies Sets New State-of-the-art for Real-time Object Detectors. arXiv 2022, arXiv:2207.02696. [Google Scholar]
Figure 1.
Relationship framework of GD&T with design, manufacturing, and measurement.

Figure 2.
ASME Y14.5.

Figure 3.
YOLOv7 architecture diagram.

Figure 4.
System architecture.

Figure 5.
Detection process.

Figure 6.
Recognition process.

Figure 7.
Engineering drawing view annotation.

Figure 8.
View training curve.

Figure 9.
Feature control frame, datum, and dimension annotation in views.

Figure 10.
Annotation group detection training curve.

Figure 11.
Annotation training data.

Figure 12.
Feature annotation in training data.

Figure 13.
Annotation detection training curve.

Figure 14.
Annotated text with rotation angles.

Figure 15.
Character recognition process.

Figure 16.
Code for text angle correction.

Figure 17.
Case engineering drawing.

Figure 18.
Engineering drawing view detection results.

Figure 19.
Dimension annotation detection and content recognition.

Figure 20.
Datum plane annotation detection and content recognition.

Figure 21.
Feature control frame annotation detection and content recognition.


Table 1.
Geometric dimensioning and tolerance symbols.
| Type of Control | Geometric Characteristic | Symbol | Datums |
|---|---|---|---|
| Form | Straightness |  | Datums not allowed |
| Flatness |  | ||
| Circularity |  | ||
| Cylindricity |  | ||
| Profile | Profile of a line |  | Datums sometimes required |
| Profile of a surface |  | ||
| Orientation | Angularity |  | Datums required |
| Perpendicularity |  | ||
| Parallelism |  | ||
| Location | Position |  | |
| Run-out | Circular run-out |  | Datums required |
| Total run-out |  |
Table 2.
Hardware specifications.
| Operating System | Windows 10 64-bit |
| Processor | Intel(R) Core(TM) i7-8700K CPU @ 3.70GHz 3.70 GHz |
| Memory (RAM) | 32.0 GB |
| Graphics Card | NVIDIA Quadro P2000 |
Table 3.
Computation time.
| View Detection (s) | Group Annotation Detection (s) | Annotation Detection (s) |
|---|---|---|
| 5.82 | 12.53 | 9.73 |
Disclaimer/Publisher’s Note: The statements, opinions and data contained in all publications are solely those of the individual author(s) and contributor(s) and not of MDPI and/or the editor(s). MDPI and/or the editor(s) disclaim responsibility for any injury to people or property resulting from any ideas, methods, instructions or products referred to in the content. |
© 2023 by the authors. Licensee MDPI, Basel, Switzerland. This article is an open access article distributed under the terms and conditions of the Creative Commons Attribution (CC BY) license (https://creativecommons.org/licenses/by/4.0/).
Share and Cite
MDPI and ACS Style
Lin, Y.-H.; Ting, Y.-H.; Huang, Y.-C.; Cheng, K.-L.; Jong, W.-R. Integration of Deep Learning for Automatic Recognition of 2D Engineering Drawings. Machines 2023, 11, 802. https://doi.org/10.3390/machines11080802
AMA Style
Lin Y-H, Ting Y-H, Huang Y-C, Cheng K-L, Jong W-R. Integration of Deep Learning for Automatic Recognition of 2D Engineering Drawings. Machines. 2023; 11(8):802. https://doi.org/10.3390/machines11080802
Chicago/Turabian StyleLin, Yi-Hsin, Yu-Hung Ting, Yi-Cyun Huang, Kai-Lun Cheng, and Wen-Ren Jong. 2023. "Integration of Deep Learning for Automatic Recognition of 2D Engineering Drawings" Machines 11, no. 8: 802. https://doi.org/10.3390/machines11080802
Note that from the first issue of 2016, this journal uses article numbers instead of page numbers. See further details here.