
A Study of Frequency Domain Reflectometry Technique for High-Voltage Rotating Machine Winding Condition Assessment

1
School of Electrical Engineering and Computer Science, KTH Royal Institute of Technology, SE-100 44 Stockholm, Sweden
2
China Nuclear Power Operation Technology Co., Ltd., Minzu Road 1021, Wuhan 430073, China
*
Author to whom correspondence should be addressed.
†
These authors contributed equally to this work.
Machines 2023, 11(9), 883; https://doi.org/10.3390/machines11090883
Submission received: 5 August 2023
/
Revised: 24 August 2023
/
Accepted: 31 August 2023
/
Published: 2 September 2023
(This article belongs to the Section Machines Testing and Maintenance)
Abstract
:Detecting and locating local degradations at an incipient stage is very important for mission-critical high-voltage rotating machines. One particular challenge in the existing testing techniques is that the characteristic of a local incipient defect is not prominent due to various factors such as averaging with the healthy remainder, attenuation in signal propagation, interference, and varied operating conditions. This paper proposes and investigates the frequency domain reflectometry (FDR) technique based on the scattering parameter measurement. The FDR result presents the object length, wave impedance, and reflections due to impedance discontinuity along the measured windings. Experiments were performed on two commercial coils with artificially created defects. These defects include turn-to-turn short, surface creepage, loose coils, insufficient end-winding spacing, and local overheating, which are commonly seen in practice. Two practical water pumps in the field were also selected for investigation. The study outcome shows that FDR can identify and locate structural and insulation degradation in both shielded and unshielded objects with good sensitivity. This makes FDR a complementary technique for machine fault diagnosis and aging assessment.
1. Introduction
High-voltage induction motors are mission–critical assets in power plants and heavy industrial companies. Failures in these motors can lead to revenue loss, production disruption, and even catastrophic effects on the motors and their surroundings [1,2]. Careful monitoring of excessive thermal, electrical, ambient, and mechanical (TEAM) stresses present on rotating machines over the entire service life is therefore important. It helps to reduce unexpected failure risks and replacement costs. It is of particular interest to identify the degradation at an early stage so that preventive actions can be taken. According to statistics [3], stator winding problems account for approximately two-thirds of high–power motor failures. Although many techniques and commercial instruments are available for machine condition assessment [4], asset owners still face unexpected failures because it is impractical to adopt many testing techniques in routine maintenance activities due to limited resources and outage times. Moreover, not all machine failure mechanisms are known and can be monitored.
The most widely used testing techniques for insulation condition diagnosis are dielectric response and partial discharge (PD) testing. The dielectric response testing techniques include the insulation resistance (IR) [5], power factor/dissipation factor (PF/DF), and power factor tip-up [6,7]. A high-voltage motor fleet in a nuclear power plant was measured with these testing techniques, and the results are summarized in Table 1. The variation of the measurement results is remarkable as they are affected by a number of factors, such as the insulating material, stress control material, design, surface condition, moisture, temperature, test voltage, etc. The interpretation is difficult if the machine design and historical data are unavailable. The IEEE-43 standard recommends a minimum insulation resistance value of 100 M at 40 C for machines with form wound coils. The IEEE-62 standard states that high-power-factor tip-up results do not necessarily indicate deteriorated winding insulation, and the manufacturer should be consulted for results interpretation. The polarization/depolarization current (PDC) and dielectric frequency response (DFR) techniques are more advanced testing techniques [8]. These methods provide more sophisticated information so that the impacts of various factors can be evaluated. However, after thermal aging is initiated, the DFR and PDC results might indicate that the insulation condition is improved, and this trend covers a significant amount of the service life [9,10]. This is because the insulation system of the new winding is usually not fully cured but gradually cures during operation, which is known as the post-curing phenomenon. On the other hand, David [11] found that the difference between aged and unaged winding without a stress control material was almost negligible. As a result, aging evaluation based on the DFR and PDC results is still challenging. Moreover, the dielectric response methods represent the average winding insulation condition. The healthy remainder could dwarf the characteristic of local degradation at the early stage.
Partial discharge (PD) testing is a valuable tool for both global and local winding insulation degradation assessment [12]. Several limitations are encountered in practice: firstly, it is challenging to make conclusions from a single measurement as motors made by different manufacturers exhibit dramatically different PD activities, as suggested by Table 1. Secondly, PD signals are subject to propagation attenuation and distortion due to the capacitive and inductive coupling. The consequence is that only discharges close to the measuring terminal can be observed [13]. A stator slot coupler (SSC) installed under the slot wedge solves this problem and provides the PD source location information [14]. However, the installation cost is high, and the sensors may reduce the operation safety. Thirdly, low-cost online PD monitoring systems can easily be disturbed by external interferences, especially noise from variable speed drives [15].
The offline testing technique, sweep frequency response analysis (SFRA), has been successful in transformer winding mechanical condition evaluation [16]. However, its application for motor diagnosis is rarely seen in practice. Figure 1 shows an example of SFRA testing results on a motor. The inductive property dominates most of the measurement frequency range. Extending the upper-frequency limit is required for winding deformation assessment. However, it is not feasible as the measuring technique in the radio frequency range is fundamentally different. Vibration and motor current signature analysis (MCSA) are two widespread mechanical condition monitoring techniques [17]. However, the machine design, sensor installation, and operating conditions (e.g., motor slip) also have a significant impact on the measurement results [18,19]. False indications, low sensitivity, and difficulty in fault interpretation are often encountered.
Time domain reflectometry (TDR), line resonance analysis (LIRA), and frequency domain reflectometry (FDR) are three testing techniques in the radio frequency range. The TDR method works on the same principle as radar. A voltage pulse with an adjustable width is injected into the cable. When the pulse encounters a discontinuity spot along the cable or reaches the end, the reflection is introduced and measured by the instrument. There are two voltage generator types in TDR instruments, i.e., the step and impulse voltage generators. The step generator outputs a voltage step with a magnitude less than 20 V and a fast voltage rise time in the range of picoseconds. Such TDR instruments are usually used in the laboratory. For field testing, most TDR instruments use an impulse voltage generator so that the magnitude can be increased up to more than 100 V. A higher output voltage improves the signal-to-noise ratio and extends the measurement distance. There is a long history of using TDR for cable fault pre-locating but rarely for condition diagnosis. The research work of the Pacific Northwest National Laboratory describes that the TDR method is relatively insensitive to subtle changes in insulation properties (thermal and radiation aging, water trees, cuts, and cracking), and it is challenging to obtain clean signals with a high signal-to-noise ratio [20]. The reason is analyzed in Section 2.
The use of the FDR technique for cable fault location and aging assessment is relatively new, starting around 2004 in the Halden Reactor Project [21]. The LIRA instrument was patented and commercialized by Wirescan AS in Norway. It performs a frequency sweep in the range of 100 kHz–100 MHz and measures the line input impedance at the testing terminal. The CHAR system is manufactured by the Analysis and Measurement Service (AMS) in the US. It performs a frequency sweep in the range of 9 kHz–4.5 GHz and measures the magnitude and phase of the reflected voltage at the testing terminal. The measured data are then transformed into the time domain, and the TDR-like traces are obtained for further analysis. Although the results obtained from FDR testing offer a similar outlook to TDR, this method has higher accuracy and better sensitivity than the TDR method for subtle mechanical and insulation condition change detection.
It is known that no single testing technique can detect all defects in various machine types. The confidence of the corrective action improves if an abnormality can be verified by two or more techniques. This work aims to study whether the non-destructive, non-intrusive, and easy-to-perform FDR technique can be used as an complementary winding condition evaluation technique. Experiments were performed on two coils of a type found in commercial 10 kV motors, with artificially-made defects that are similar to those practical defects. The core slot was simulated using conductive copper tape, so the coils had much lower inductance than practical windings. Two water pumps in a nuclear plant were also selected for the investigation of the inductance impact.
2. Theory and Modeling
2.1. Coils for the Experiment
The structure of the stator winding coil rated at 6.6 kV is shown in Figure 2. There are six turns in total, and each turn consists of two copper strands. The overall length consists of two sections, the straight and overhang (end-winding) sections. Covering half of the coil, the straight section (wrapped by ECP and SCP) has a length of 1.4 m. The two overhang sections beside it amount to 1.0 m. The total coil length is 28.8 m, and the straight section length adds up to 16.8 m.
Most of the straight section is placed in the stator core slot; this part is wrapped with the conductive tape for slot corona protection (SCP). A stress-grading coating known as end corona protection (ECP), made from the nonlinear conduction of silicon carbide grains, is wrapped around the slot exit area. ECP reduces the local surface stress to prevent surface discharge around the slot exit area. The conductivity is negligible when the applied voltage is low but increases exponentially when the voltage approaches the nominal value [22]. With a high test voltage, the impact of ECP sometimes dominates the dielectric response and partial discharge activity, which makes the results interpretation difficult [23]. As the FDR testing uses a low voltage signal, the impact of ECP is not significant.
2.2. TDR vs. FDR
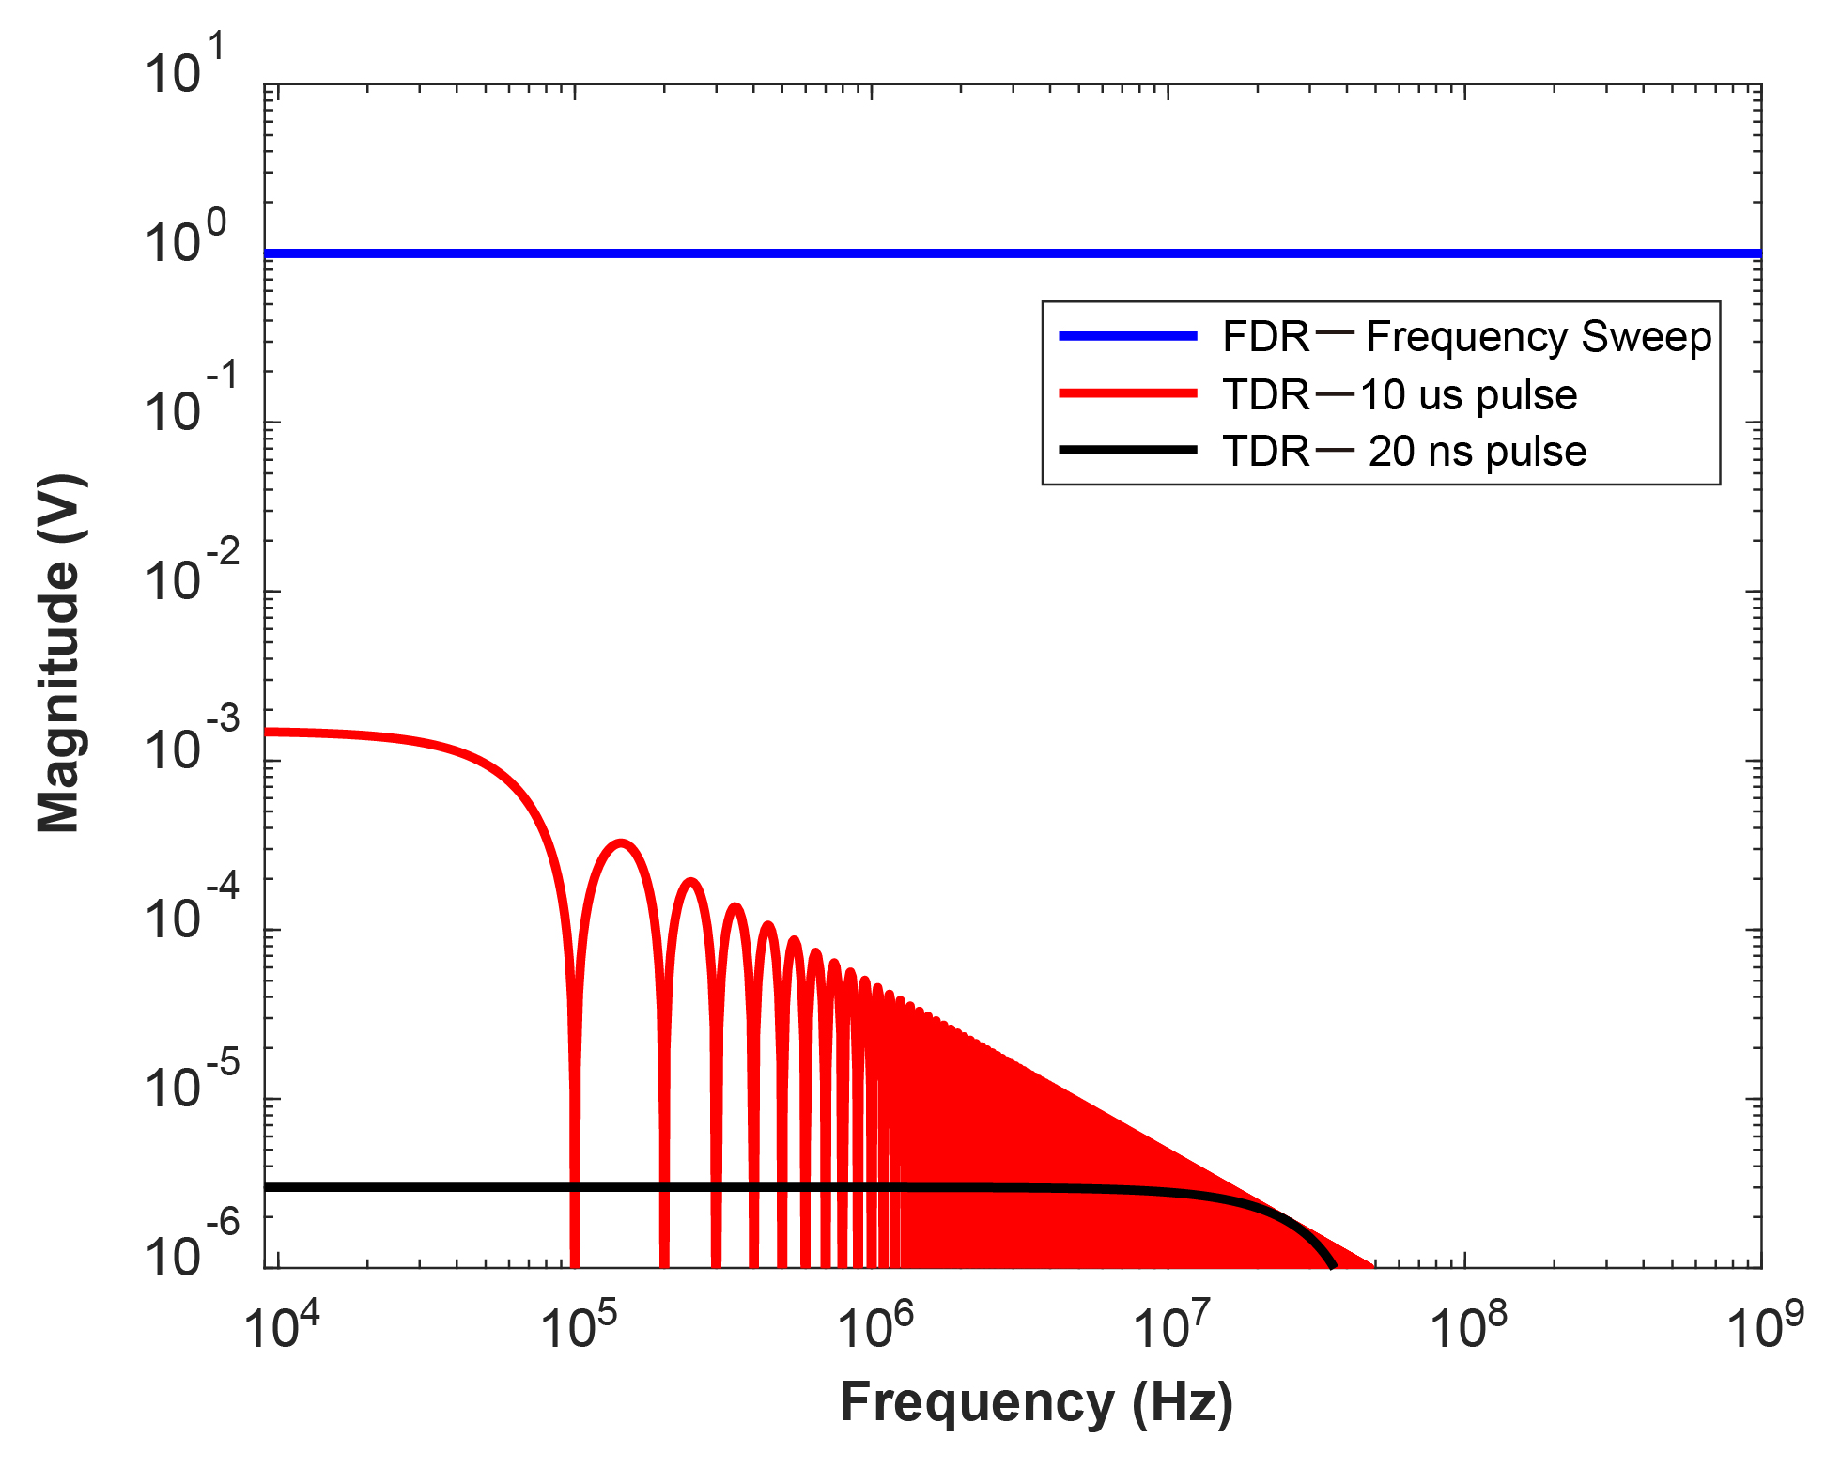
The premium TDR instruments for field testing can output a voltage pulse with an adjustable width from 20 ns to 10 s and magnitude up to 150 V (e.g., Teleflex VX manufactured by Megger). The spectra of two rectangular pulses with a pulse width of 20 ns and 10 s, respectively, are shown in Figure 3. The voltage pulse with a larger pulse width contains more energy and travels further, but the spatial resolution decreases. As it takes a certain amount of time to launch the TDR pulse, there is a blind spot near the test terminal with a length from several meters to several hundred meters, depending on the pulse width [24], which is not suitable for measuring short objects.
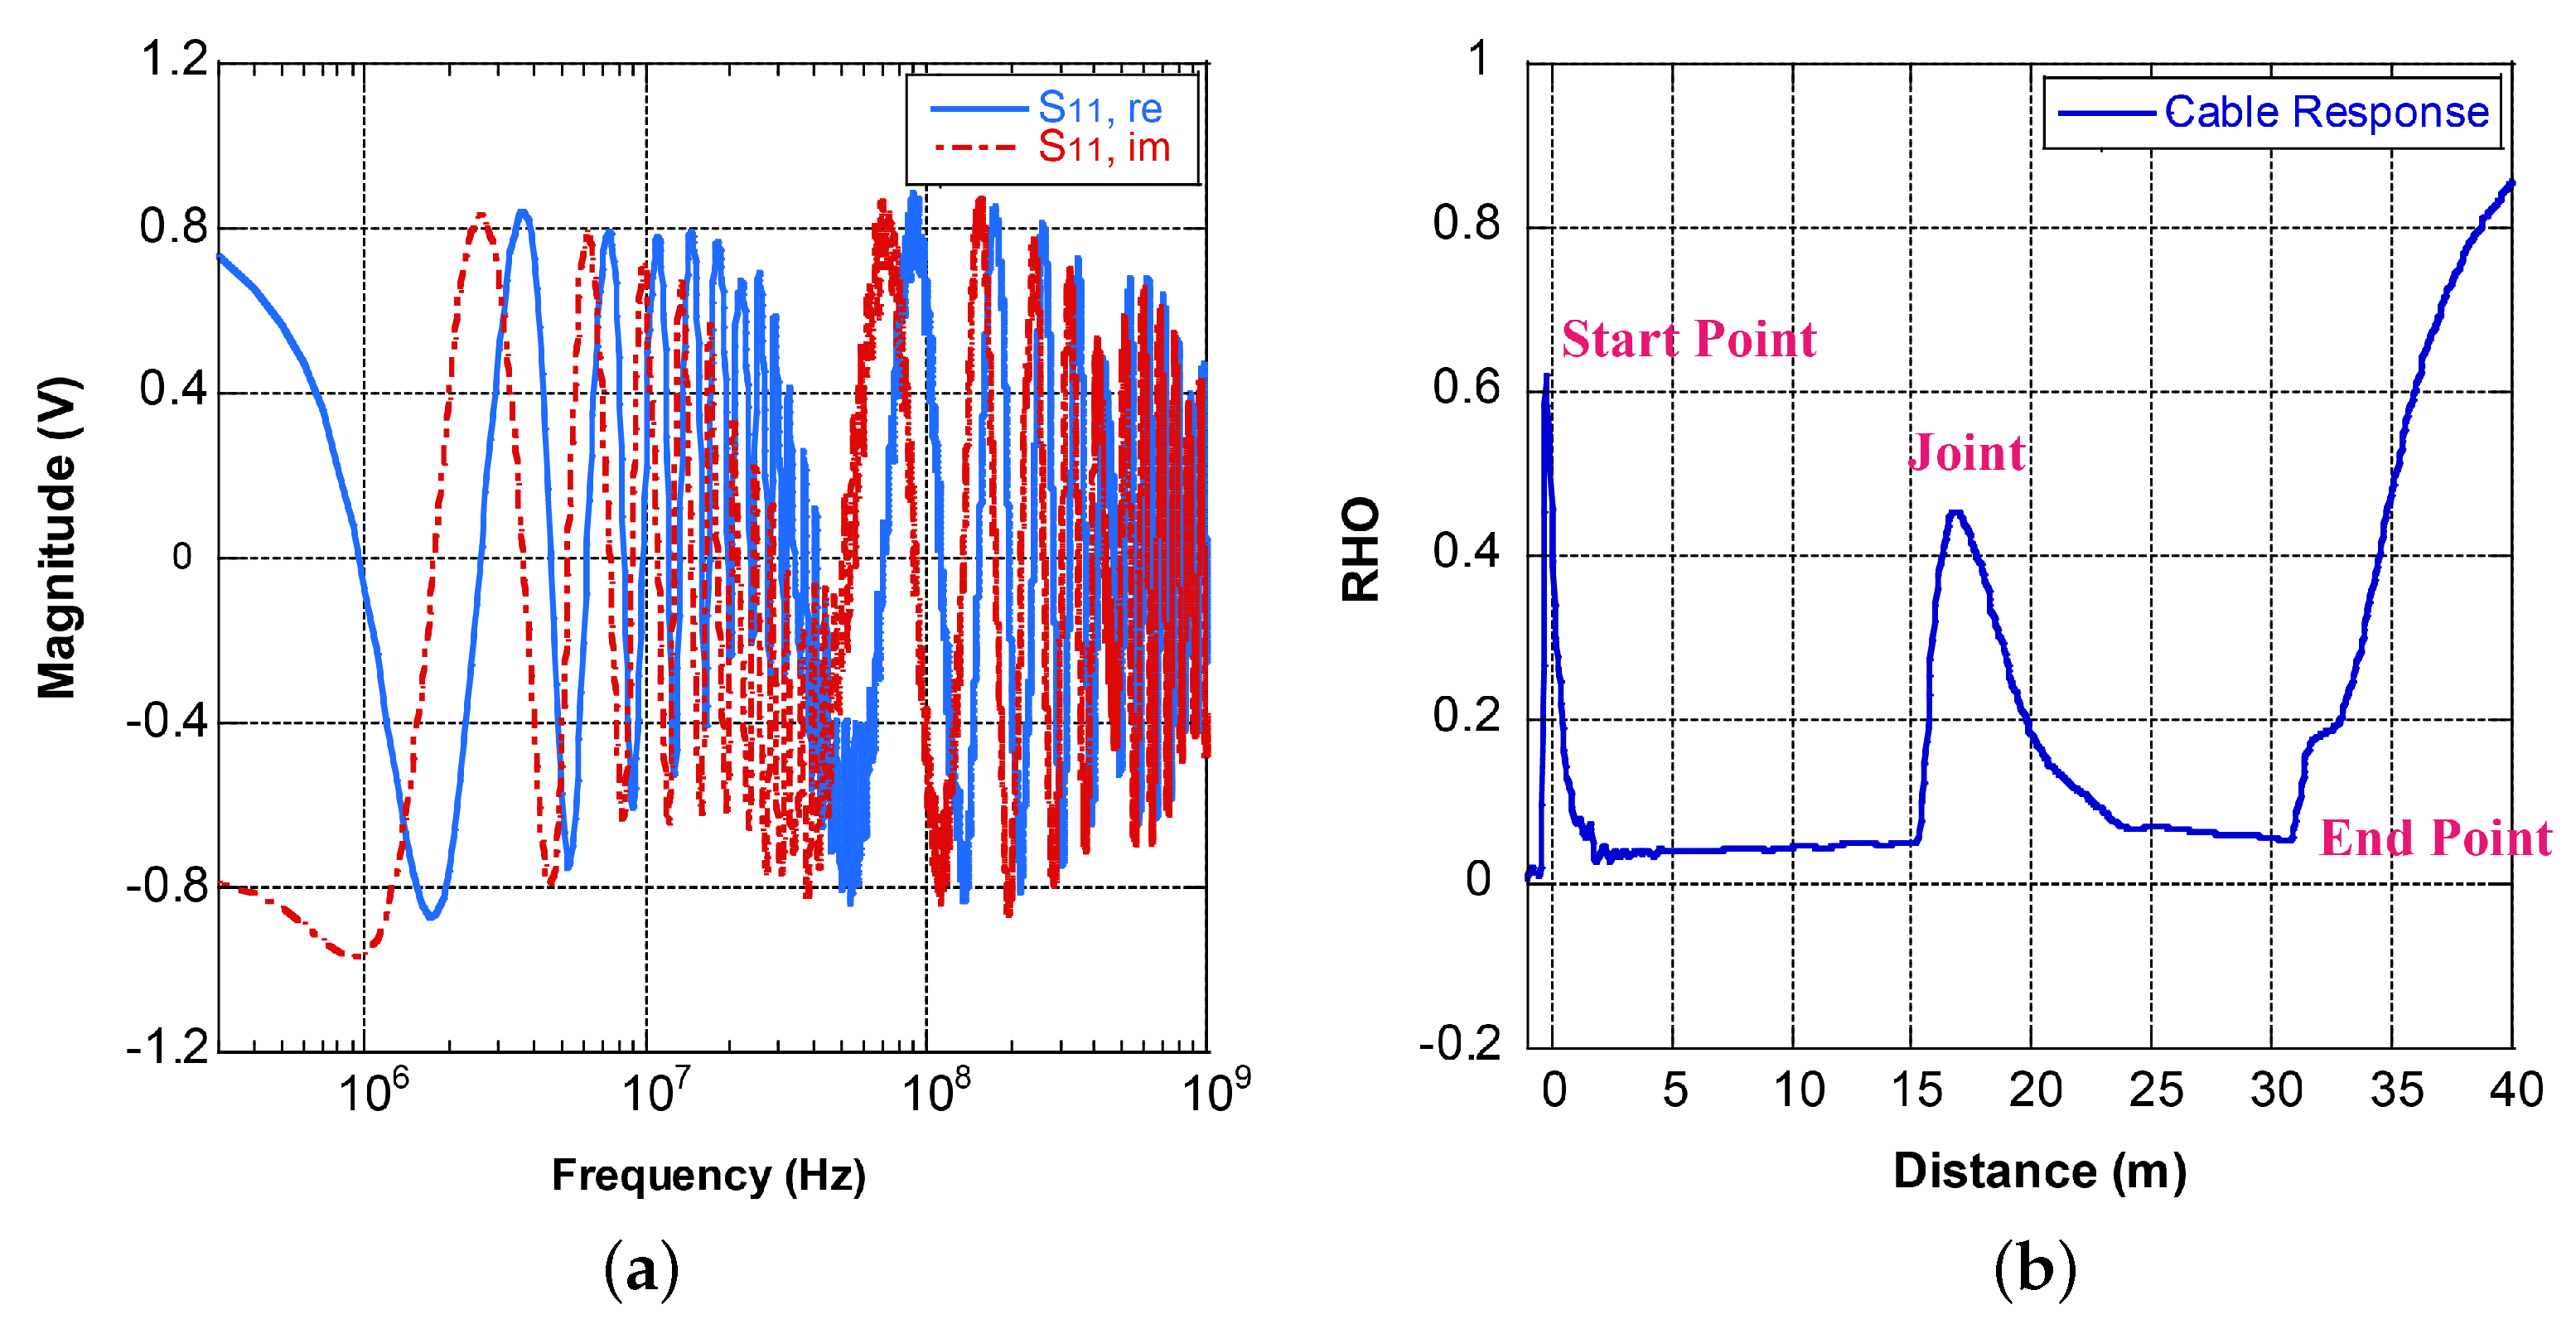
The FDR measurement is based on the vector network analyzer (VNA) technology. The instrument injects a series of sinusoidal voltages in a broad frequency range into the test object. The scattering parameter is measured, which is defined as the ratio of the reflected voltage and incident voltage. Then, the data in the frequency domain are transformed into the time domain to form a TDR-like display, as shown in Figure 4. The transformation can be achieved by the fast Fourier transformation (FFT) or chirp–Z algorithm [25,26]. Some commercial VNAs (e.g., Keysight M9800A) are integrated with the time domain analysis function, which performs the transformation automatically after the data are obtained. The TDR-like display provides a more intuitive representation of the discontinuities in the test object. The distance is calculated by multiplying the time (x-axis after transformation) by half of the wave propagation speed. The FDR resolution and range are given by the following equations [27]:
where is the propagation speed for the test object (expressed as a faction of the light speed c), is the bandwidth of the measurement, and N is the number of data points acquired.
Compared with TDR, the FDR technique has three major advantages. Firstly, the sweep frequency approach significantly increases the output energy, thus reducing the impact of propagation attenuation. Secondly, the measurement circuit with band–pass filters improves the signal-to-noise ratio [28] to achieve a much higher dynamic range. Thirdly, the spatial resolution can reach around 10 cm if the 1 GHz bandwidth is used. These advantages give FDR sufficient sensitivity in detecting and locating subtle condition changes.
2.3. Transmission Line Model
In the RF frequency range, the wavelength of the injected signal is comparable with or shorter than the physical size of the test object. Thus, the transmission line model with distributed circuit elements has to be used for results analysis. The transmission line model of the winding coil is illustrated in Figure 5. Each section of four elements , , , and represents an infinitesimally short length of the shielded or unshielded section, which is then cascaded to the actual length. The circuit elements of the shielded and unshielded sections are different. This leads to the periodic change of the wave propagation mode along the coil.
The per-unit length inductance and capacitance of a coaxial line are given by [29]:
where a is the inner conductor radius, b is the outer insulation radius, and and are the permittivity and permeability of the surrounding materials, respectively. Equations (3) and (4) can only be referred to as rough approximations of the actual coil model because two factors are not taken into account. Firstly, each coil turn partially and asymmetrically fills the space between shields, which leads to a complicated wave propagation mode [30]. Secondly, the capacitive coupling between coil turns (turn-to-turn capacitance) is not included in the model.
The unshielded sections have weak coupling with the shield/ground and can be approximated by the wire over a ground plane model. The per-unit length inductance and capacitance are given by [31]:
where is the vacuum permeability, h is the height of the conductor to the ground plane, and is the average permittivity of the mica paper and air mixture.
Neglecting the insulation loss (), the characteristic impedances of the motor coil can be written as:
The wave propagation speeds are given by:
The wave propagation speed in the shielded sections is proportional to of the light speed in free space. The propagation speed in the unshielded sections with mainly air in the surroundings is close to the free-space light speed [32].
The time and magnitude are obtained after the transformation of the frequency domain data. Multiplying the time by half of the propagation speed changes the time into distance. The relationship between the magnitude (RHO) and wave impedance can be expressed by Equation (11). The reflection is equal to when the test terminal is open (infinite impedance), when the test terminal is short (zero impedance), and 0 if the test object impedance perfectly matches the instrument and its test leads ().
There are three typical ways to present the FDR results. The first is the step response, as expressed by Equation (11). It represents the wave impedance information, which is determined by the local mechanical and insulation properties. The second format is the impulse response, i.e., the derivative of the step response, which emphasizes the location where the wave impedance change happens. The impulse response is similar to those TDR results where a voltage pulse is used. The third format is the impulse response in logarithmic scale, which can better represent the characteristic with a small magnitude.
2.4. Experimental Setups
The instrument used in this project is the CHAR system manufactured by the Analysis and Measurement Corporation (AMS), as shown in Figure 6. The high–performance Keysight M9800A VNA module is the key hardware for the measurement. The WinCharm V4.1 software automatically performs the transformation and presents the TDR-like results after the measurement. The frequency range of M9800A is 9 kHz to 4.5 GHz, and the typical system dynamic range reaches 140 dB. The dynamic range is defined as the source maximum output power minus the receiver noise floor. It is an important parameter as signals lower than the noise floor cannot be measured by the VNA. The higher dynamic range improves the measurement sensitivity and accuracy, which is suitable for unshielded object testing.
The experimental setup for the stator winding coils is shown in Figure 7. The straight sections were wrapped with the copper tape and grounded. The shielded and unshielded lengths for each turn were 2.6 m and 2.2 m, respectively. The test signal was injected into one of the coil terminals via a coaxial cable. The FDR instrument ground, coaxial cable shield, and the copper tape shared the same ground. The software had a calibration function to reduce the impact of the test lead. By performing a test with the test object unconnected and test clips shorted, the test lead length was recorded and automatically compensated for the successive measurements.
Five typical faults that are commonly seen in practice [33] were artificially-created in the coils:
- End-winding discharge caused by main insulation damage, physically located at 2.4 m from the near end terminal;
- Turn-to-turn short between the first and second turns, physically located at 2.4 m (first turn) and 7.2 m (second turn) from the the near end terminal;
- Loose coil, simulated by loosening copper shield by 20 cm, physically located at 4.5 m from the near end terminal;
- Local overheating at 3.5 m from the near end terminal;
- Tracking between coils at the winding-end section, between the remote end terminal of the first coil and the overhang section of the second coil.
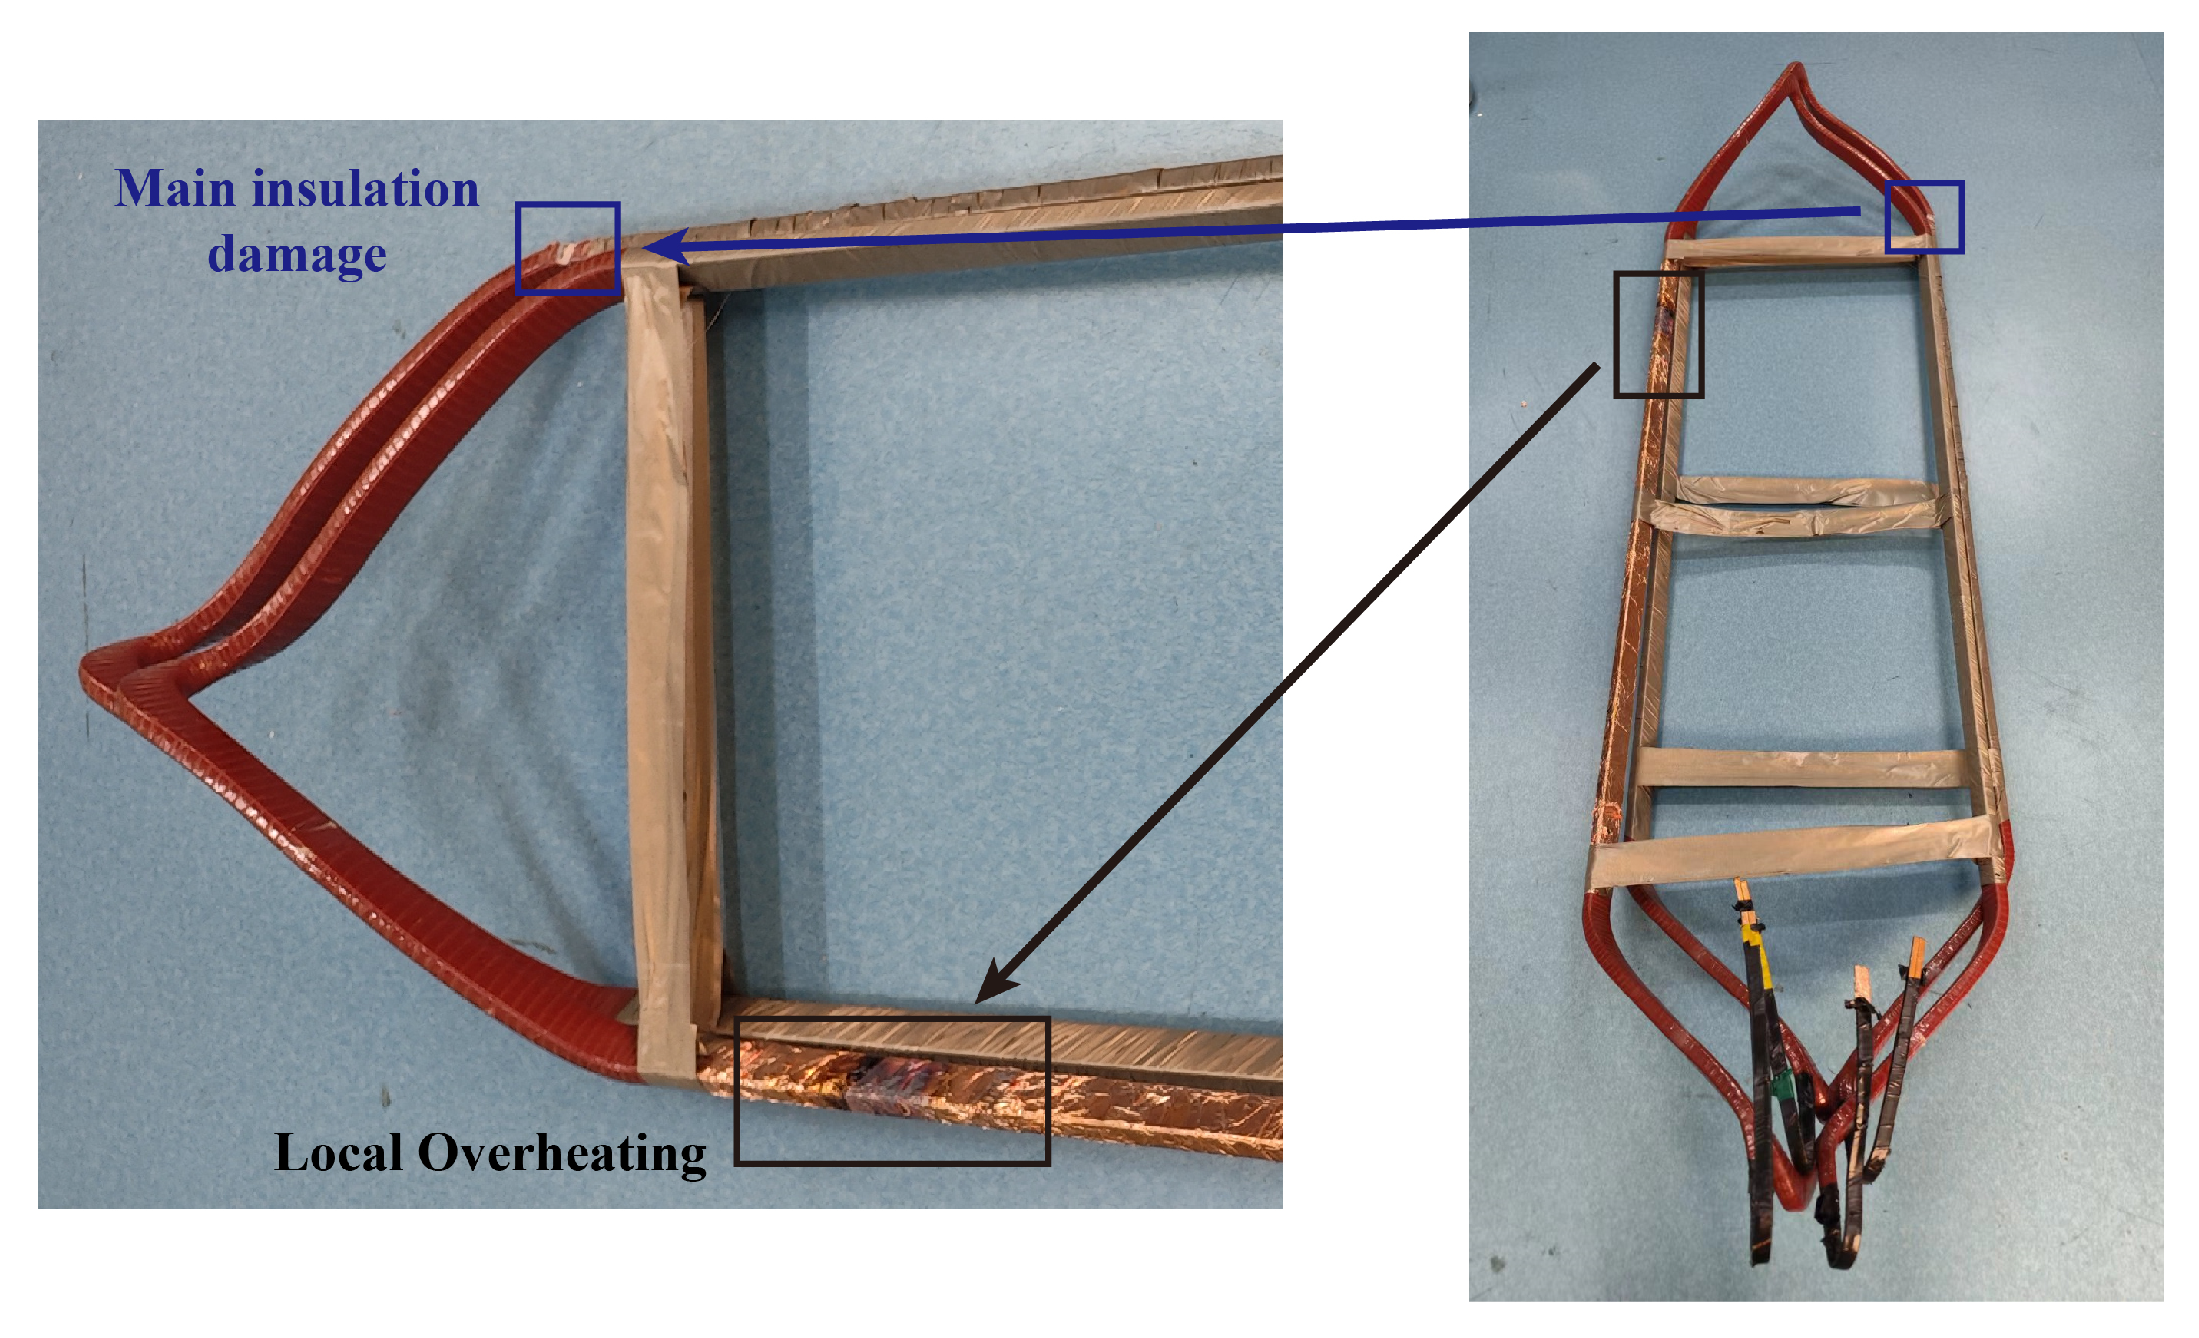
The end-winding discharge usually happens at the core exit area due to the ECP problem. The spot adjacent to the shield (2.4 m from the near end terminal) was selected as the discharge location. The insulation coating of the first turn was scratched to simulate the fault. For the short turn-to-turn fault, the spot below the damaged insulation of the first turn was selected. Overheating is more likely to happen within the slot, so the spot 3.5 m from the near end terminal was selected, as shown in Figure 8. A low resistive path from the conductor to the shield was created for the end-winding discharge and tracking between coil faults. For the shorted turn-to-turn fault, two adjacent coil turns were connected by a thin wire.
The distributed elements , , and of practical machines are not identical to the individual coils due to the existence of the stator core and shell. The core permeability is much higher than that of air at power frequency but decays to a low level in the radio frequency range [34]. The overhang sections are also shielded by the machine shell. Two water pumps of the same type in a nuclear power plant were also tested during the outage. These pumps were manufactured by Safonovo Russia in 2002. The voltage rating was 6 kV, and the power rating was 250 kW. The pumps were aged but passed all routine testings. The test clips were connected to the phase terminal and shell ground from the terminal board, as suggested in Figure 9. Either phase terminal could be selected, with the other open (floating) or short to ground.
3. Results
3.1. FDR Results of Good Coils
The coil in good condition was measured by the CHAR system as the first step. The voltage was injected to the near end terminal, with the far end terminal open and shorted to ground (shield), respectively. The time–magnitude results are shown as the step response in Figure 10 and the impulse response in Figure 11. The traces with the far end terminal open and short, respectively, start to diverge after 161 ns, which indicates the location of the remote end. The deviation can be observed clearly from the traces of the step response and impulse response with the logarithm scale y-axis. The impulse response with the linear scale y-axis needs to be magnified significantly before the differences can be observed. As a result, the step response and impulse response in the logarithm scale are selected for results presentation.
Given the designed coil conductor length of m and the shielded section length of m, the reflection at 161 indicates that the wave propagates with an average speed of 179 m/s. If the propagation speed in the unshielded section is assumed to be equal to the free-space light speed, then the propagation speed in the shielded section would be 133 m/s. This implies that the relative permittivity of the epoxy–mica insulation is around 5, which is a reasonable value. Multiplying the x-axis data (time) with the average propagation speed (179 m/s) changes the x-axis into distance starting from the test terminal.
The frequency bandwidth has a significant impact on the measurement results [35]. The test frequency range of the M9800A VNA module is 9 kHz–4.5 GHz. The ideal transformation requires precise frequency domain measurement performed from DC to . Applying a higher upper frequency limit improves the spatial resolution, i.e., the sensitivity of identifying minor discontinuities, but the magnitude of the reflected voltage is more attenuated. After the reflected voltage drops below the noise floor, the discontinuity cannot be detected anymore, and a transformation error might occur. Figure 12 shows the time–transformed results using four frequency bands. The step response traces become almost identical after the upper frequency limit reaches 90 MHz. The 9 kHz–90 MHz impulse response trace has a similar trend to the traces of a broader bandwidth. However, minor variations are not observable. The 9 kHz–450 MHz trace provides the same details as the 9 kHz–1 GHz while exhibiting less attenuation, so the 9 kHz–450 MHz frequency band was selected for the subsequent experiments.
3.2. Coil Fault Study
End-winding discharge can happen due to ECP degradation, insulation aging, or contamination. A low resistive path from the coil conductor to shield was created at the location approximately 2.4 m from the near end terminal. FDR measurements were then performed at the near end and remote end terminal, respectively, and the results are shown in Figure 13. The step and impulse responses of the near end measurement show that the fault distance is 2.6 m from the near end terminal. For the remote end measurement, the most remarkable deviation in the impulse response starts at 25 m (equivalent to 3.8 m for the near end measurement). This characteristic is more prominent when the measurement is performed at the near end terminal, which is closer to the fault location.
Stresses due to transient overvoltage in the supply are a factor that contributes to turn-to-turn short failure over time [36]. The first and second coil turns were shorted at 2.4 m and 7.2 m, respectively. The corresponding FDR results are shown in Figure 14. The existence of the fault can be clearly observed from both the near end and remote end measurement results. The response has an obvious drop in magnitude at the fault location, and the apparent coil length is reduced. Although the deviation in the step response trace of the remote end measurement begins at around 17 m, the trend deviation starts at 21 m, which is very close to the actual value. The impulse response shows an obvious deviation at 19.5 m.
The loose slot wedge and SCP coating abrasion can happen due to machine vibration. This fault was simulated by loosening the copper tape in a 20 cm section, starting from the location of 4.5 m. In such a fault condition, the distributed capacitance reduces, so the wave impedance increases. As suggested by the results shown in Figure 15, the step response magnitude increases at the fault location. The impulse response exhibits some mild changes at the fault location, but the apparent coil length becomes shorter as the propagation speed increases.
Local overheating thermally stresses the winding insulation, contributing to main insulation delamination. A small segment in the shielded section was heated by burning. The IR results before and after overheating changed from 187.3 G to 127.8 G. The insulation resistance of this coil is quite high as it does not have the ECP coating (the coil with ECP had been damaged for the previous fault experiment). The resistance change might be negligible if the ECP coating (a small parallel resistor) would be present. A periodic oscillation pattern is observed from the impulse response trace as shown in Figure 16 because there are six overheated spots. The apparent coil length remains constant, and the change in the step response is minor.
Tracking between coils can happen due to insufficient spacing between end windings and/or contamination. In the experiment, two coils were connected in series, and a low resistive path was created between two overhang sections of each coil. Figure 17 indicates that the fault changed both the step and impulse responses at the tracking spot.
3.3. Water Pump Investigation
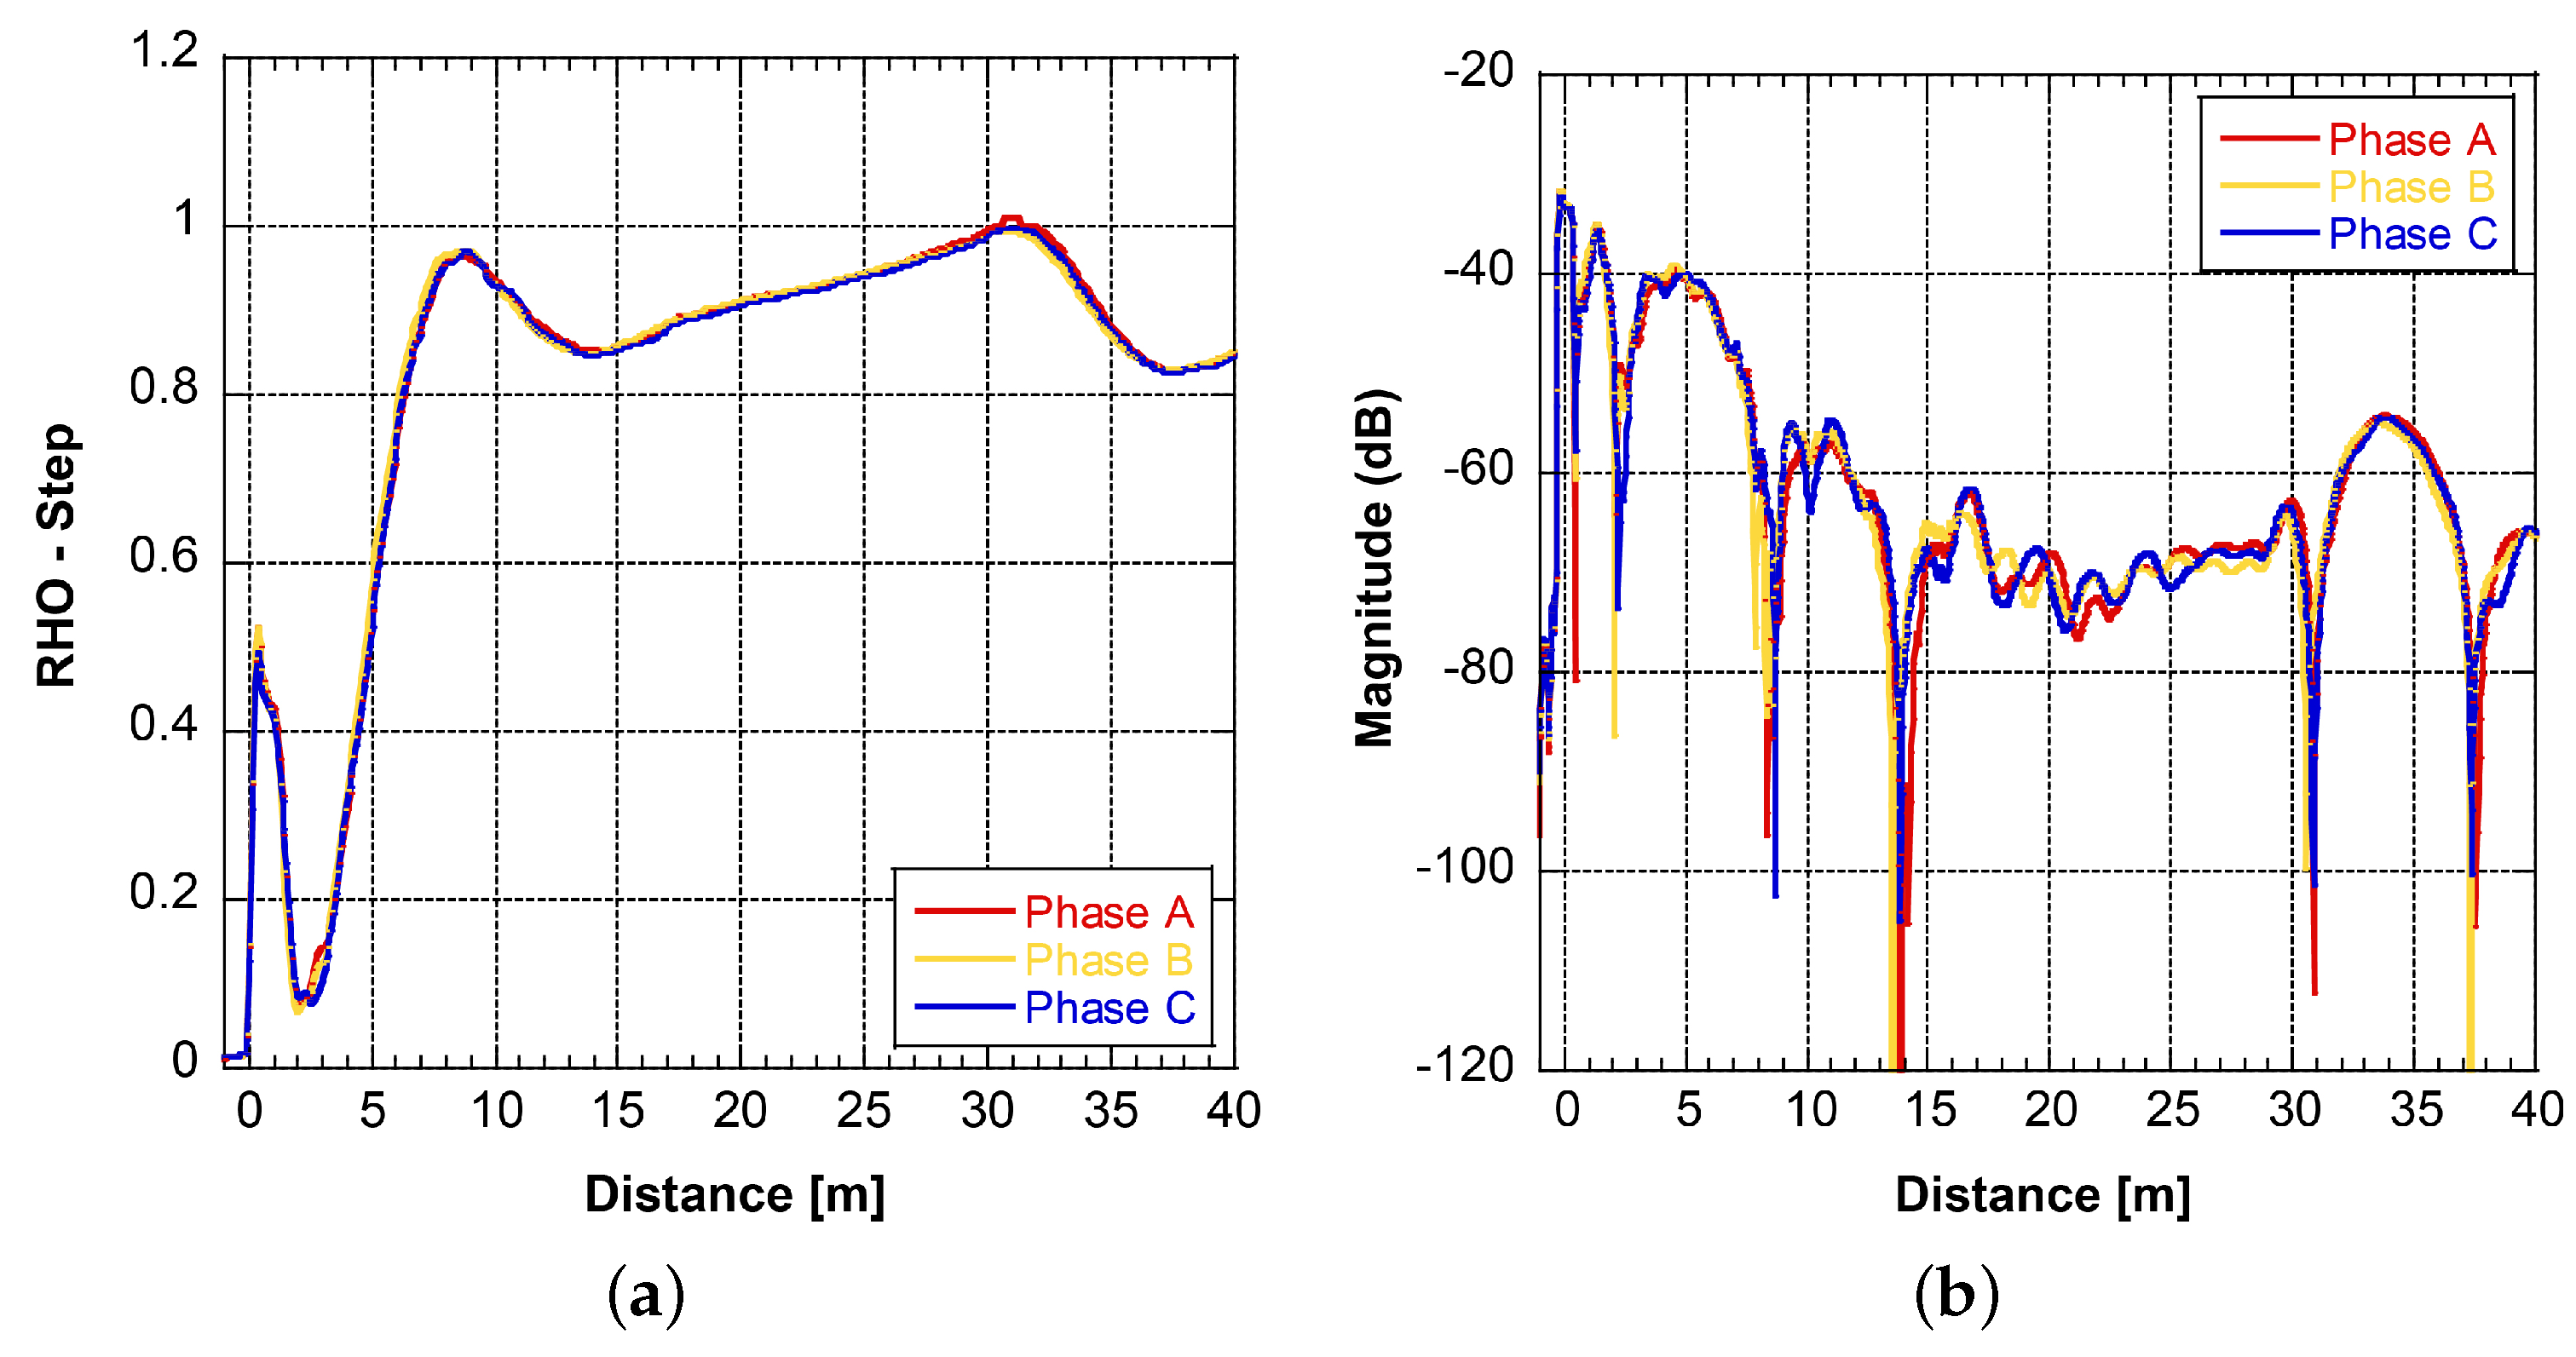
Two water pumps were removed from service for maintenance. The distributed circuit elements of practical machines are different from the individual coils because all the winding sections are shielded, and the core material has a higher permeability. These pumps had been used in a harsh environment for around 20 years. FDR measurements were performed on three phases, as illustrated in Figure 9. Results are shown in Figure 18 and Figure 19. The total conductor length of each phase was approximately 30 m. One more reflection peak was observed from the pump results compared to the coils, which could be the core impact.
Despite the long service period of these pumps, the good agreement of the three–phase results suggests that the health condition is good. Because it is very rare that the three phases are all deteriorated to the same extent, this supports the decision to place these pumps back in service. Connector-like reflections exist at the locations of 18 m for Phase B of Motor #1 and 9 m for Phase C of Motor #2. Trending will be helpful for decision–making after successive measurements are performed.
4. Discussion
High–voltage rotating machines have a complex design in terms of structure and material. A combination of different testing techniques for condition monitoring helps to reduce the failure risk of high-voltage rotating machines. Machine fault locating is of interest as faults in the resin-cured slots might be difficult to verify by visual inspection. It is also useful in identifying the root causes of the deterioration. The FDR technique is specialized in identifying and locating degradations by presenting the wave impedance discontinuities along the measured object. This paper aimed to investigate whether the FDR technique could be used as an effective complementary technique for machine condition diagnosis. The technique is applicable for form–wound bars or windings but not for random–wound machines.
Compared with TDR, FDR has the advantages of higher output energy, a broader frequency bandwidth, and a very high dynamic range can be achieved. These advantages make it ideal for testing short and/or unshielded objects. Using a higher upper frequency limit is helpful in detecting minor condition changes, but higher–frequency components suffer more propagation attenuation. If the reflected signal magnitude attenuates below the noise floor, a transformation error might occur. In the experiment, four different frequency bands were compared, and a suitable one (9 kHz–450 MHz) was selected.
Table 2 is a summary of the FDR testing results of the winding coils with various defects. The diagnosis of the FDR results is based on the changes in the magnitude and apparent coil length. The FDR has good sensitivity in identifying most defect types, except the local overheating. The deviation caused by local overheating can be observed, but the magnitude difference is not prominent. All the fault locations on a single coil are correctly identified. The tracking between coils creates a high–resistance parallel branch in parallel with the original circuit. The pattern starts to change from the location of 28.8 m, but the difference before 37 m is too small to be treated as a defect.
FDR results interpretation is based on comparison. The comparison can be made over time, using three phases, or between apparatus of a similar type. The complex coil geometry, as shown in Figure 5, makes the precise transmission line model very difficult to establish. The simplified model does not take the capacitive coupling between coil turns into consideration. It is fortunate that the impact of the coupling does not cause problems in identifying and locating the defects. The coupling will be further studied in the simulation software (e.g., COMSOL Multiphysics 6.1).
For an unshielded object with an unknown propagation speed, measurements with the remote end terminal open and shorted, respectively, are recommended. It is also advisable to perform the test on both terminals, as the characteristic is more prominent if the test terminal is closer to the fault, and the locating accuracy also improves. The extensive field testing results of cables and the experiment conducted in this project suggest that the change in local inductance and/or capacitance causes a reflection most of the time. However, in cases of high resistance defects, determining the fault type and its severity can be tricky, especially when several reflections are presented along the object length. The FDR testing and results interpretation need expertise, and more research is needed.
5. Conclusions
FDR testing performs a broadband frequency sweep, measures the scattering parameter , and then transforms the data into the time domain for analysis. Two winding coils with artificially-created defects that are commonly seen in practice and two water pumps in the field were investigated in this paper. The interpretation of the FDR results was based on comparison. For the coils, the baseline was established when they were new. The outcome shows that FDR has sufficient sensitivity in detecting and locating coil defects. The magnitude, resonating characteristic, and/or the apparent coil length will change according to the fault type and severity. For the field pumps without any available historical data, the comparison between the three phases was performed. Good agreement between the three phases supports the decision to put the pumps back into service. The simplified transmission line model of the winding was proposed. It has some uncertainties that do not affect the condition diagnosis so far. Although further investigations are required to validate the effectiveness of FDR, adopting the technique as a complementary machine diagnostic technique would be beneficial.
Author Contributions
J.C. initiated this research project and coordinated all activities. J.C., Y.Z., H.Y. and L.W. planned and performed the lab work and field measurements together. N.T. provided tutorials on the modeling approach and helped with the results analysis. All authors have read and agreed to the published version of the manuscript.
Funding
This research received no external funding.
Data Availability Statement
The datasets used in this paper can be downloaded via https://pan.baidu.com/s/197-sd7jMcH0_a0rp8rjTdQ?pwd=coa9 (accessed on 20 August 2023).
Acknowledgments
The authors gratefully acknowledge Björn Holmgren from ABB Motors for designing and making the motor coils for the experiment, and Darrell Mitchell and Casey Sexton from the AMS Corporation for providing the CHAR system and invaluable tutorials on the FDR subject.
Conflicts of Interest
The authors declare no conflict of interest.
References
- Thorsen, O.V.; Dalva, M. Failure identification and analysis for high voltage induction motors in petrochemical industry. In Proceedings of the 1998 IEEE Industry Applications Conference, Thirty-Third IAS Annual Meeting, St. Louis, MO, USA, 12–18 October 1998; pp. 291–298. [Google Scholar]
- Ertugrul, N.; Soong, W.; Dostal, G.; Saxon, D. Fault tolerant motor drive system with redundancy for critical applications. In Proceedings of the IEEE 33rd Annual IEEE Power Electronics Specialists Conference, Cairns, QLD, Australia, 23–27 June 2002; pp. 1457–1462. [Google Scholar]
- Rodriguez, P.; Sahoo, S.; Pinto, C.; Sutowicz, M. Field Current Signature Analysis for Fault Detection in Synchronous Motors. In Proceedings of the IEEE 10th International Symposium on Diagnostics for Electrical Machines, Power Electronics and Drives (SDEMPED), Guarda, Portugal, 1–4 September 2015; pp. 246–252. [Google Scholar]
- Tallam, R.M.; Lee, S.B.; Stone, C.G.; Kliman, G.B.; Yoo, J.; Habetler, T.G.; Harley, R.G. A survey of methods for detection of stator related faults in induction machines. In Proceedings of the IEEE International Symposium on Diagnostics for Electric Machines, Power Electronics and Drives(SDEMPED), Atlanta, GA, USA, 24–26 August 2003; pp. 35–46. [Google Scholar]
- IEEE 43-2013; IEEE Recommended Practice for Testing Insulation Resistance of Electric Machinery. Institute of Electrical and Electronics Engineers, Inc.: New York, NY, USA, 2013.
- IEEE 286-2000; IEEE Recommended Practice for Measurement of Power Factor Tip–Up of Electric Machinery Stator Coil Insulation. Institute of Electrical and Electronics Engineers, Inc.: New York, NY, USA, 2000.
- IEEE 62.2-2004; IEEE Guide for Diagnostic Field Testing of Electric Power Apparatus—Electrical Machinery. Institute of Electrical and Electronics Engineers, Inc.: New York, NY, USA, 2004.
- David, E.; Lamarre, L. Progress in DC Testing of Generator Stator Windings: Theoretical Considerations and Laboratory Tests. IEEE Trans. Energy Convers. 2010, 25, 49–58. [Google Scholar] [CrossRef]
- Farahani, M.; Borsi, H.; Gockenbach, E. Dielectric response studies on insulating system of high voltage rotating machines. IEEE Trans. Dielectr. Electr. Insul. 2006, 13, 212–226. [Google Scholar] [CrossRef]
- Helgeson, A. Analysis of Dielectric Response Measurement Methods and Dielectric Properties of Resin-Rich Insulation During Processing. Ph.D. Thesis, KTH Royal Institute of Technology, Stockholm, Sweden, 2000. [Google Scholar]
- David, E.; Lamarre, L. Low–frequency dielectric response of epoxy-mica insulated generator bars during multi-stress aging. IEEE Trans. Dielectr. Electr. Insul. 2007, 14, 212–226. [Google Scholar] [CrossRef]
- Farahani, M.; Borsi, H.; Gockenbach, E.; Kaufhold, M. Partial discharge and dissipation factor behavior of model insulating systems for high voltage rotating machines under different stresses. IEEE Electr. Insul. Mag. 2005, 21, 5–19. [Google Scholar] [CrossRef]
- Pemen, A.J.M.; van der Laan, P.C.T. Wout de Leeuw Propagation of partial discharge signals in stator windings of turbine generators. IEEE Trans. Energy Convers. 2006, 21, 155–161. [Google Scholar] [CrossRef]
- Stone, G.C.; Sedding, H.G.; Costello, M.J. Application of partial discharge testing to motor and generator stator winding maintenance. IEEE Trans. Ind. Appl. 1996, 32, 459–464. [Google Scholar] [CrossRef]
- Renforth, L.; Giussani, R.; Knutsen, T.; Aardal, B.; Kienner, T.E. A novel solution for the reliable online partial discharge monitoring (olpd) of vsd–operated EX/ATEX HV motors. In Proceedings of the 2016 Petroleum and Chemical Industry Conference Europe (PCIC Europe), Berlin, Germany, 14–16 June 2016; pp. 1–9. [Google Scholar]
- IEC 60076-18:2012; Power transformers—Part 18: Measurement of Frequency Response, Edition 1.0. The International Electrotechnical Commission (IEC): Geneva, Switzerland, 2012.
- Cusido, J.; Romeral, L.; Ortega, J.A.; Rosero, J.A.; Garcia, E.A. Fault Detection in Induction Machines Using Power Spectral Density in Wavelet Decomposition. IEEE Trans. Ind. Electron. 2008, 55, 633–643. [Google Scholar] [CrossRef]
- Lee, S.B.; Stone, G.C.; Daviu, K.A.; Gyftakis, K.N.; Strangas, E.G.; Maussion, P.; Platero, C.A. Condition Monitoring of Industrial Electric Machines: State of the Art and Future Challenges. IEEE Ind. Electron. Mag. 2020, 14, 158–167. [Google Scholar] [CrossRef]
- Zhang, Y.; Yun, H.; Cheng, J.; Taylor, N. An Intelligent and Automated Online System for Condition Monitoring of Mission–Critical Induction Motors. In Proceedings of the International Council on Electrical Engineering Conference (ICEE), Seoul, Republic of Korea, 28 June–2 July 2022; pp. 934–939. [Google Scholar]
- Glass, S.W.; Jones, A.M.; Fifield, L.S.; Hartman, T.S. Bulk and Distributed Electrical Cable Non-Destructive Examination Methods for Nuclear Power Plant Cable Aging Management Programs; Pacific Northwest National Laboratory: Washington, DC, USA, 2016. [Google Scholar]
- Fantoni, P.F. NPP Wire System Aging Assessment and Condition Monitoring State–of–the–Art Report; Institutt for Energiteknikk, OECD Halden Reactor Project: Halden, Norway, 2004. [Google Scholar]
- Roberts, A. Stress grading for high voltage motor and generator coils. IEEE Electr. Insul. Mag. 1995, 11, 26–31. [Google Scholar] [CrossRef]
- Cheng, J.; Taylor, N.; Werelius, P. Nonlinear Dielectric Properties of the Stator and Transformer Insulation Systems. IEEE Trans. Dielectr. Electr. Insul. 2022, 29, 240–246. [Google Scholar] [CrossRef]
- Radiodetection Application Note: TDR Metallic Time Domain Reflectometer Guide. Available online: https://www.rjmcompany.com/cable-pipe-locators/TDR-metallic-time-domain-reflectometer-guide.pdf (accessed on 20 August 2023).
- Frickey, D.A. Using the Inverse Chirp–Z Transform for Time–Domain Analysis of Simulated Radar Signals; Idaho National Engineering Laboratory Reports: Washington, DC, USA, 1995. [Google Scholar]
- Maier, T.; Leibfried, T.; Elcheroth, E. Mathematical–detection-algorithms for cable diagnostics and investigations with Line–Resonance–Analysis. In Proceedings of the International Conference on Condition Assessment Techniques in Electrical Systems (CATCON), Bangalore, India, 10–12 December 2015; pp. 40–45. [Google Scholar]
- MOHR Test and Measurement LLC Application Note: TDR vs. FDR: Distance to Fault. Available online: https://www.mohr-engineering.com/TDR_vs_FDR_Distance_to_Fault-A.php (accessed on 31 July 2023).
- Keysight Technologies Application Note: Time Domain Analysis Using a Network Analyzer. Available online: https://www.keysight.com/us/en/assets/7018-01451/application-notes/5989-5723.pdf (accessed on 31 July 2023).
- Pozar, M.D. Microwave Engineering, 3rd ed.; Wiley: Hoboken, NJ, USA, 2012; pp. 49–64. [Google Scholar]
- Huang, R.; Zhang, D. Application of Mode Matching Method to Analysis of Axisymmetric Coaxial Discontinuity Structures Used in Permeability and/OR Permittivity Measurement. Prog. Electromagn. Res. 2007, 67, 205–230. [Google Scholar] [CrossRef]
- Paul, R.C. Introduction to Electromagnetic Compatibility, 2nd ed.; John Wiley & Sons Inc.: Hoboken, NJ, USA, 2006; pp. 192–198. [Google Scholar]
- Alam, M.N.; Coats, D.; Dougal, R.A.; Ali, M. Surface wave propagation measurements in unshielded XLPE power cables. In Proceedings of the IEEE Antennas and Propagation Society International Symposium (APSURSI), Orlando, FL, USA, 7–13 July 2013; pp. 1770–1771. [Google Scholar]
- Stone, C.G. Electrical Insulation For Rotating Machines—Design, Evaluation, Aging, Testing and Repair; IEEE Press: Piscataway, NJ, USA, 2004; pp. 137–174. [Google Scholar]
- Abeywickrama, N.; Serdyuk, Y.; Gubanski, S. High–Frequency Modeling of Power Transformers for Use In Frequency Response Analysis. IEEE Trans. Power Deliv. 2008, 23, 2042–2049. [Google Scholar] [CrossRef]
- Glass, S.W.; Fifield, L.S.; Jones, A.M.; Hartman, T.S. Frequency domain reflectometry modeling and measurement for nondestructive evaluation of nuclear power plant cables. In Proceedings of the 18th International Conference on Environmental Degradation of Materials in Nuclear Power Systems—Water Reactors, Online, 20 April 2017; pp. 1267–1280. [Google Scholar]
- Kumar, S.; Mukherjee, D.; Guchhait, P.K.; Banerjee, R.; Srivastava, A.K.; Vishwakarma, D.N.; Saket, R.K. A Comprehensive Review of Condition Based Prognostic Maintenance (CBPM) for Induction Motor. IEEE Access 2019, 7, 90690–90704. [Google Scholar] [CrossRef]
Figure 1.
SFRA results of a motor.
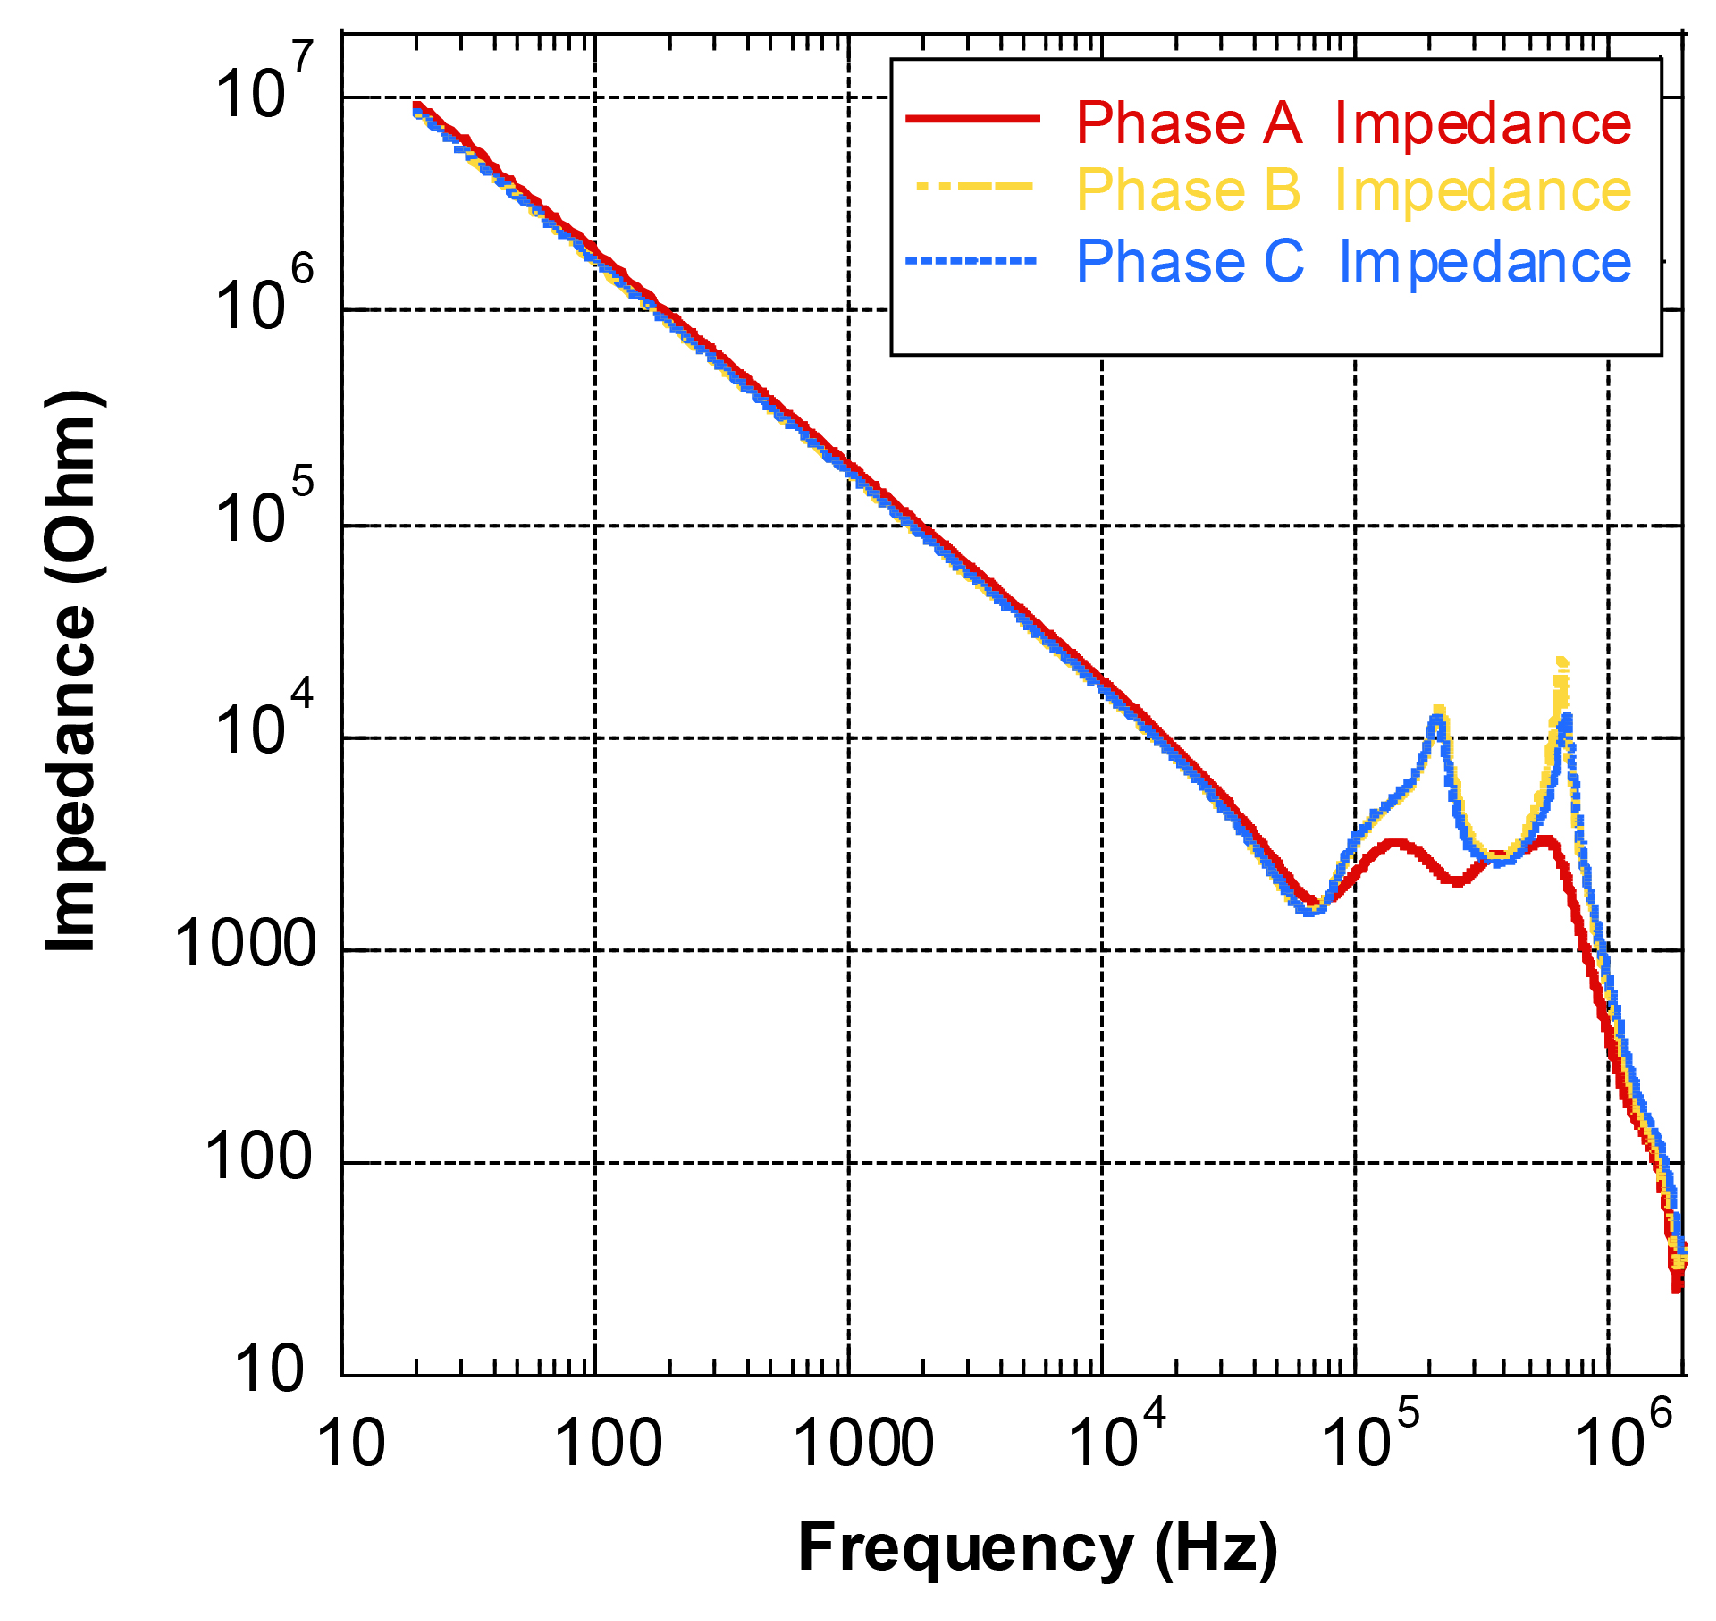
Figure 2.
Structure and dimension overview of the stator coil under investigation—left: cross-section of the coil cut, right: coil geometry and dimension.
Figure 2.
Structure and dimension overview of the stator coil under investigation—left: cross-section of the coil cut, right: coil geometry and dimension.
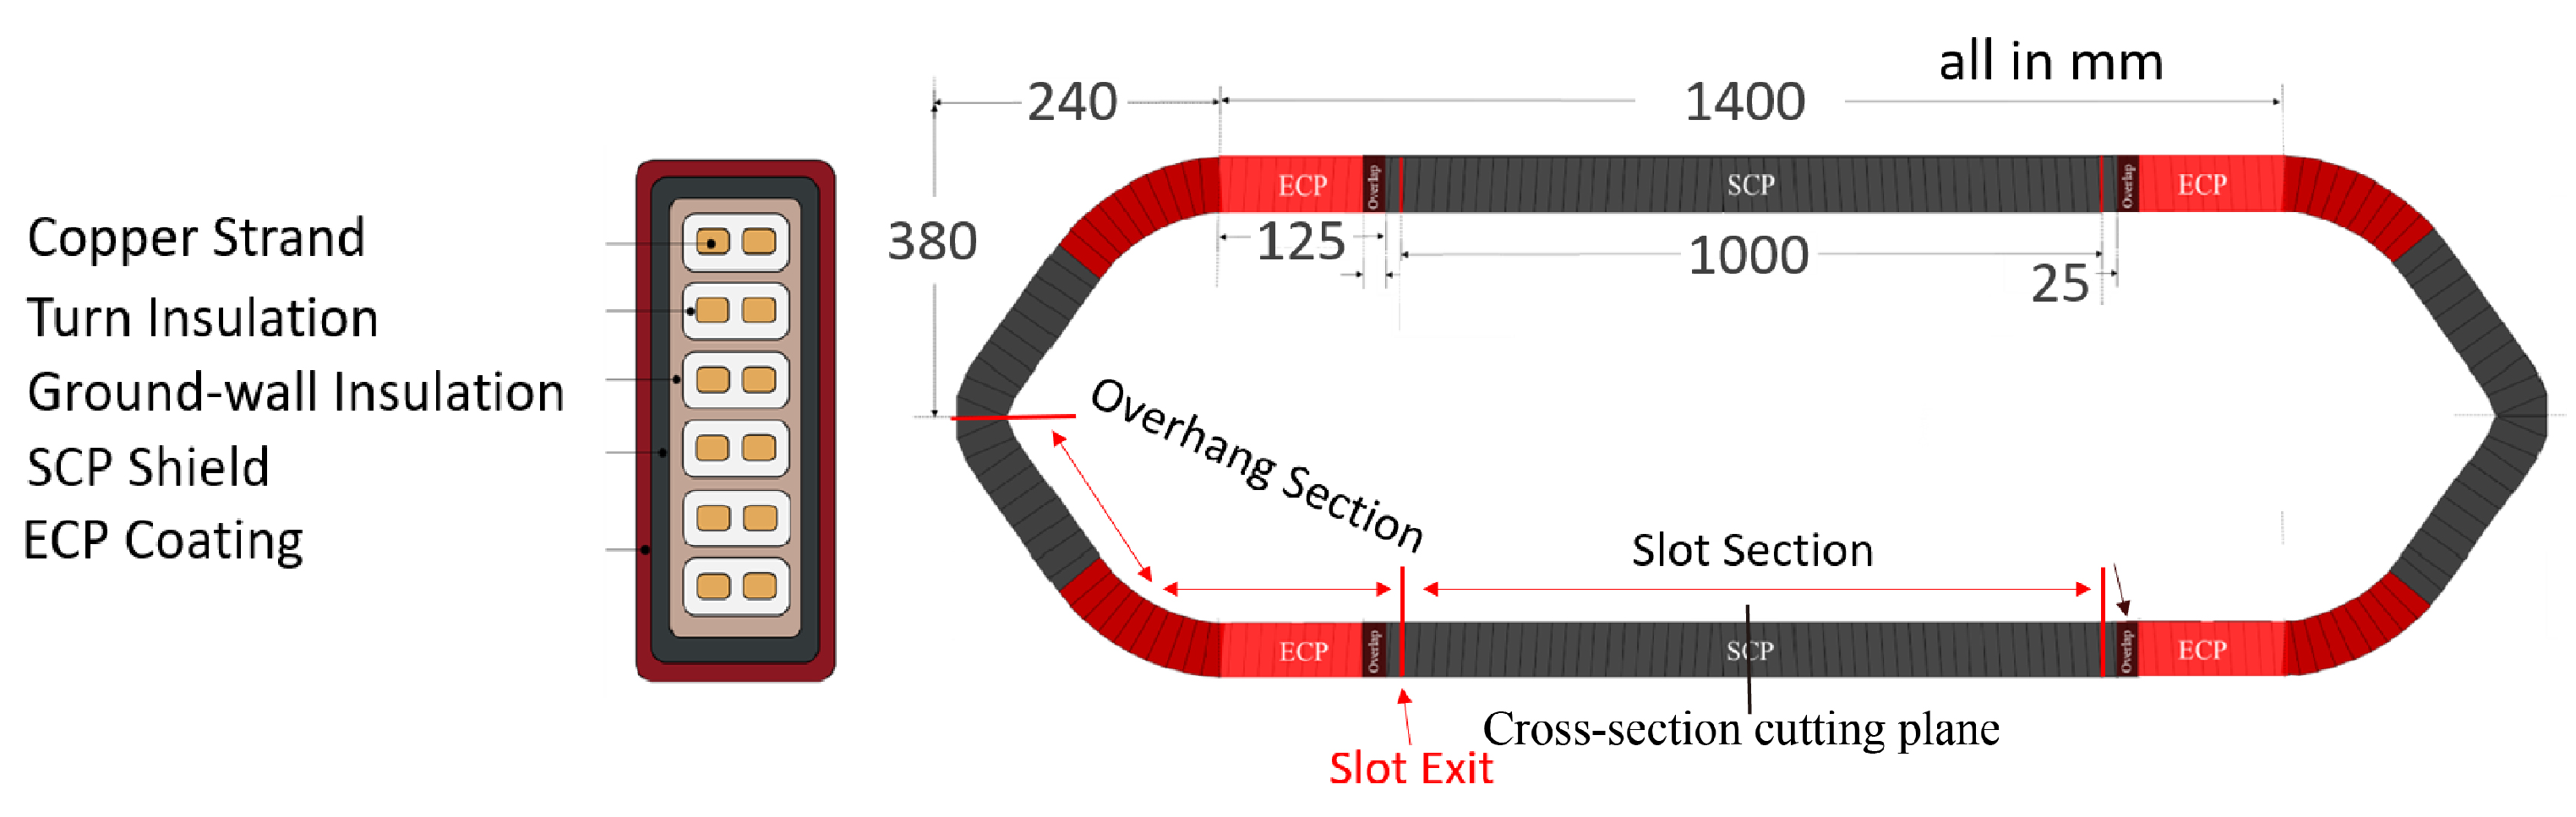
Figure 3.
The spectra of the output signals: FDR frequency sweep signal with a magnitude of 1 V; two rectangular TDR pulses with the magnitude of 150 V, and pulse widths of 20 ns and 10 s, respectively.
Figure 3.
The spectra of the output signals: FDR frequency sweep signal with a magnitude of 1 V; two rectangular TDR pulses with the magnitude of 150 V, and pulse widths of 20 ns and 10 s, respectively.

Figure 4.
Illustration of the reflected signal: (a) frequency domain—voltage magnitude (or phase) vs. frequency, (b) time domain—magnitude vs. distance.
Figure 4.
Illustration of the reflected signal: (a) frequency domain—voltage magnitude (or phase) vs. frequency, (b) time domain—magnitude vs. distance.

Figure 5.
Transmission line model of the winding coil: (a) equivalent geometry, (b) lumped circuit elements.
Figure 5.
Transmission line model of the winding coil: (a) equivalent geometry, (b) lumped circuit elements.
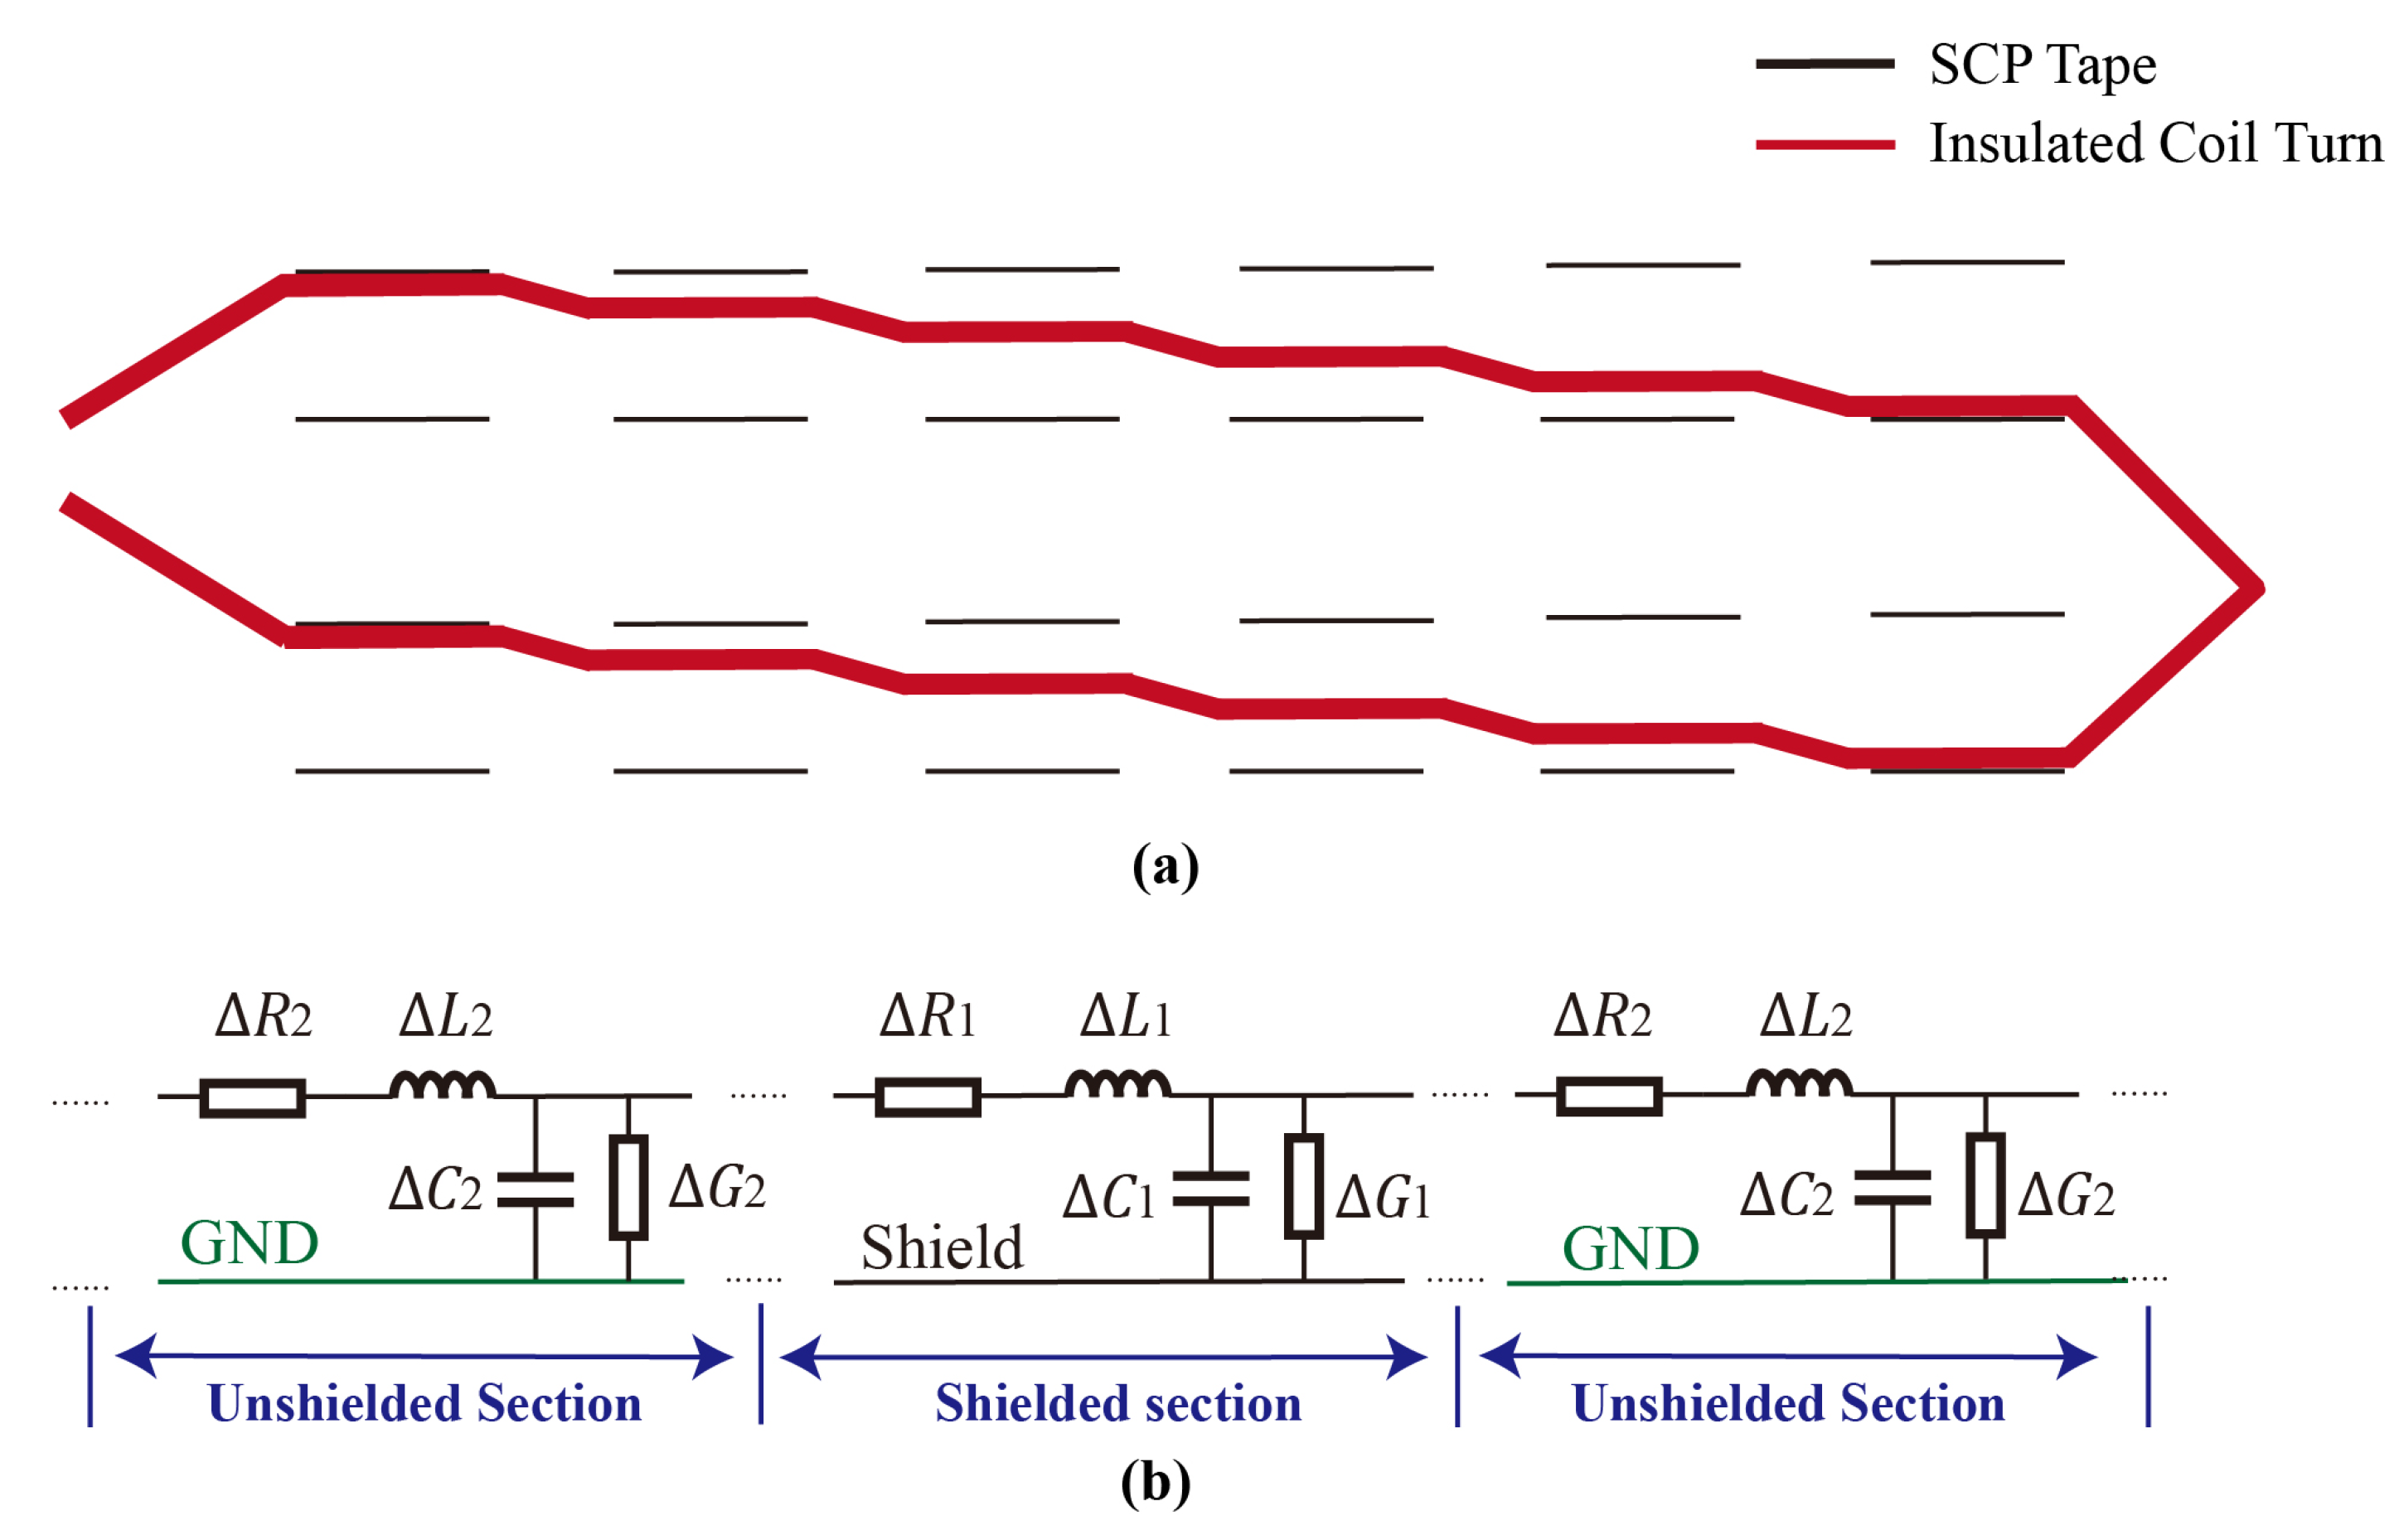
Figure 6.
AMS CHAR system hardware and software.
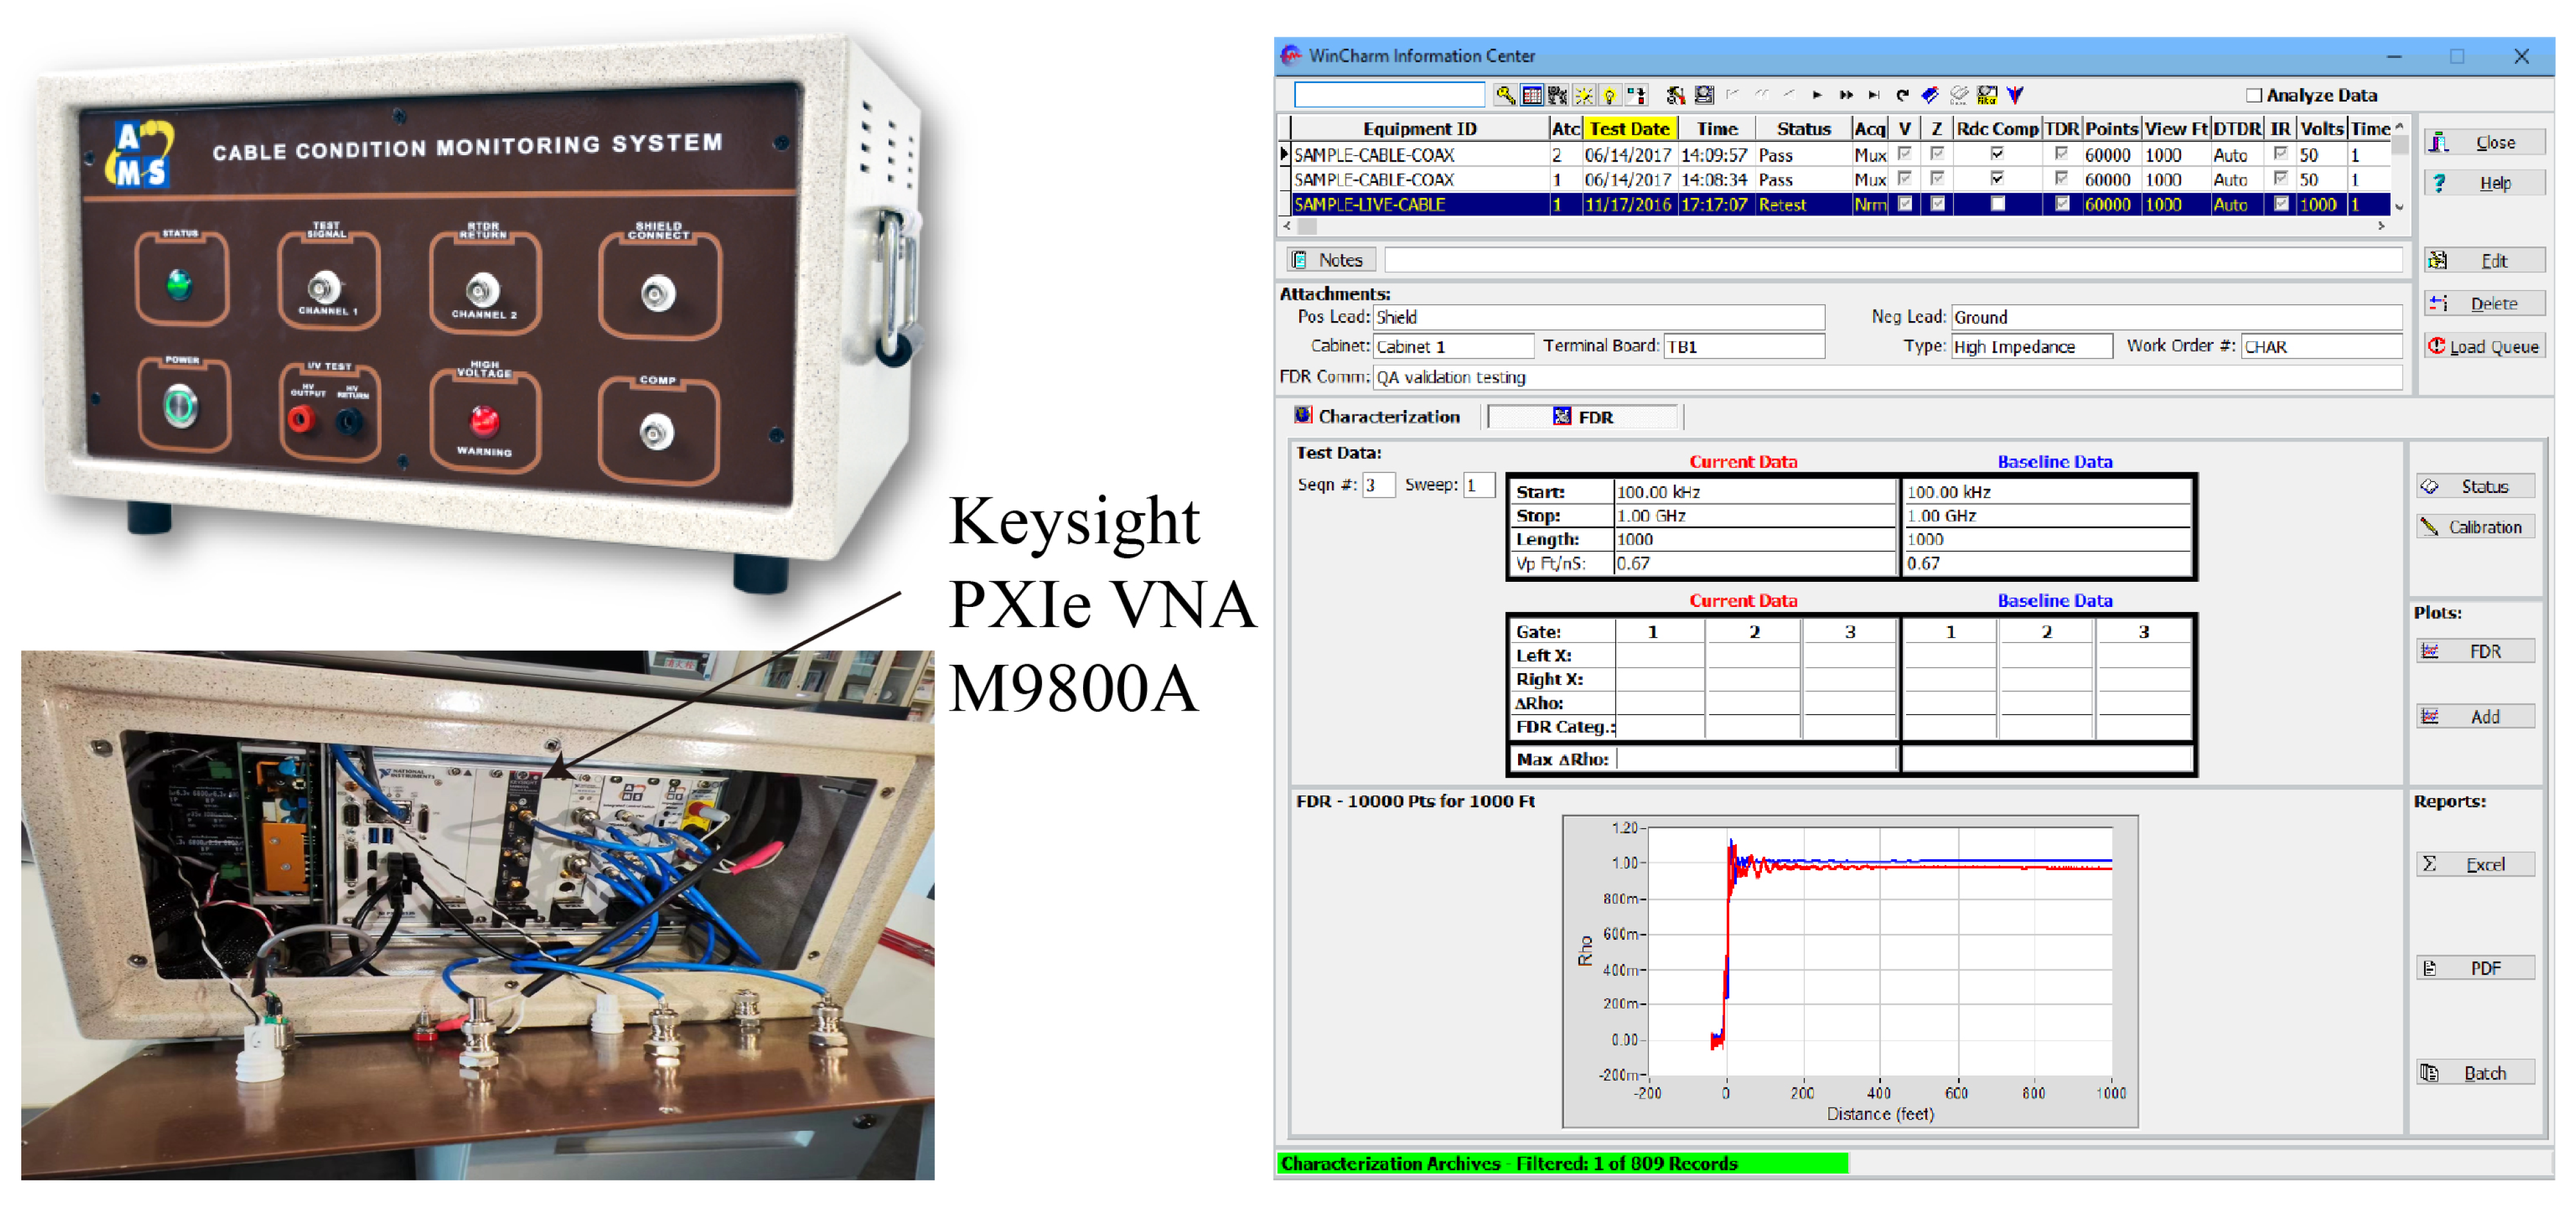
Figure 7.
FDR measurement setup for the stator coils: (a) connection diagram, (b) schematic diagram.
Figure 7.
FDR measurement setup for the stator coils: (a) connection diagram, (b) schematic diagram.
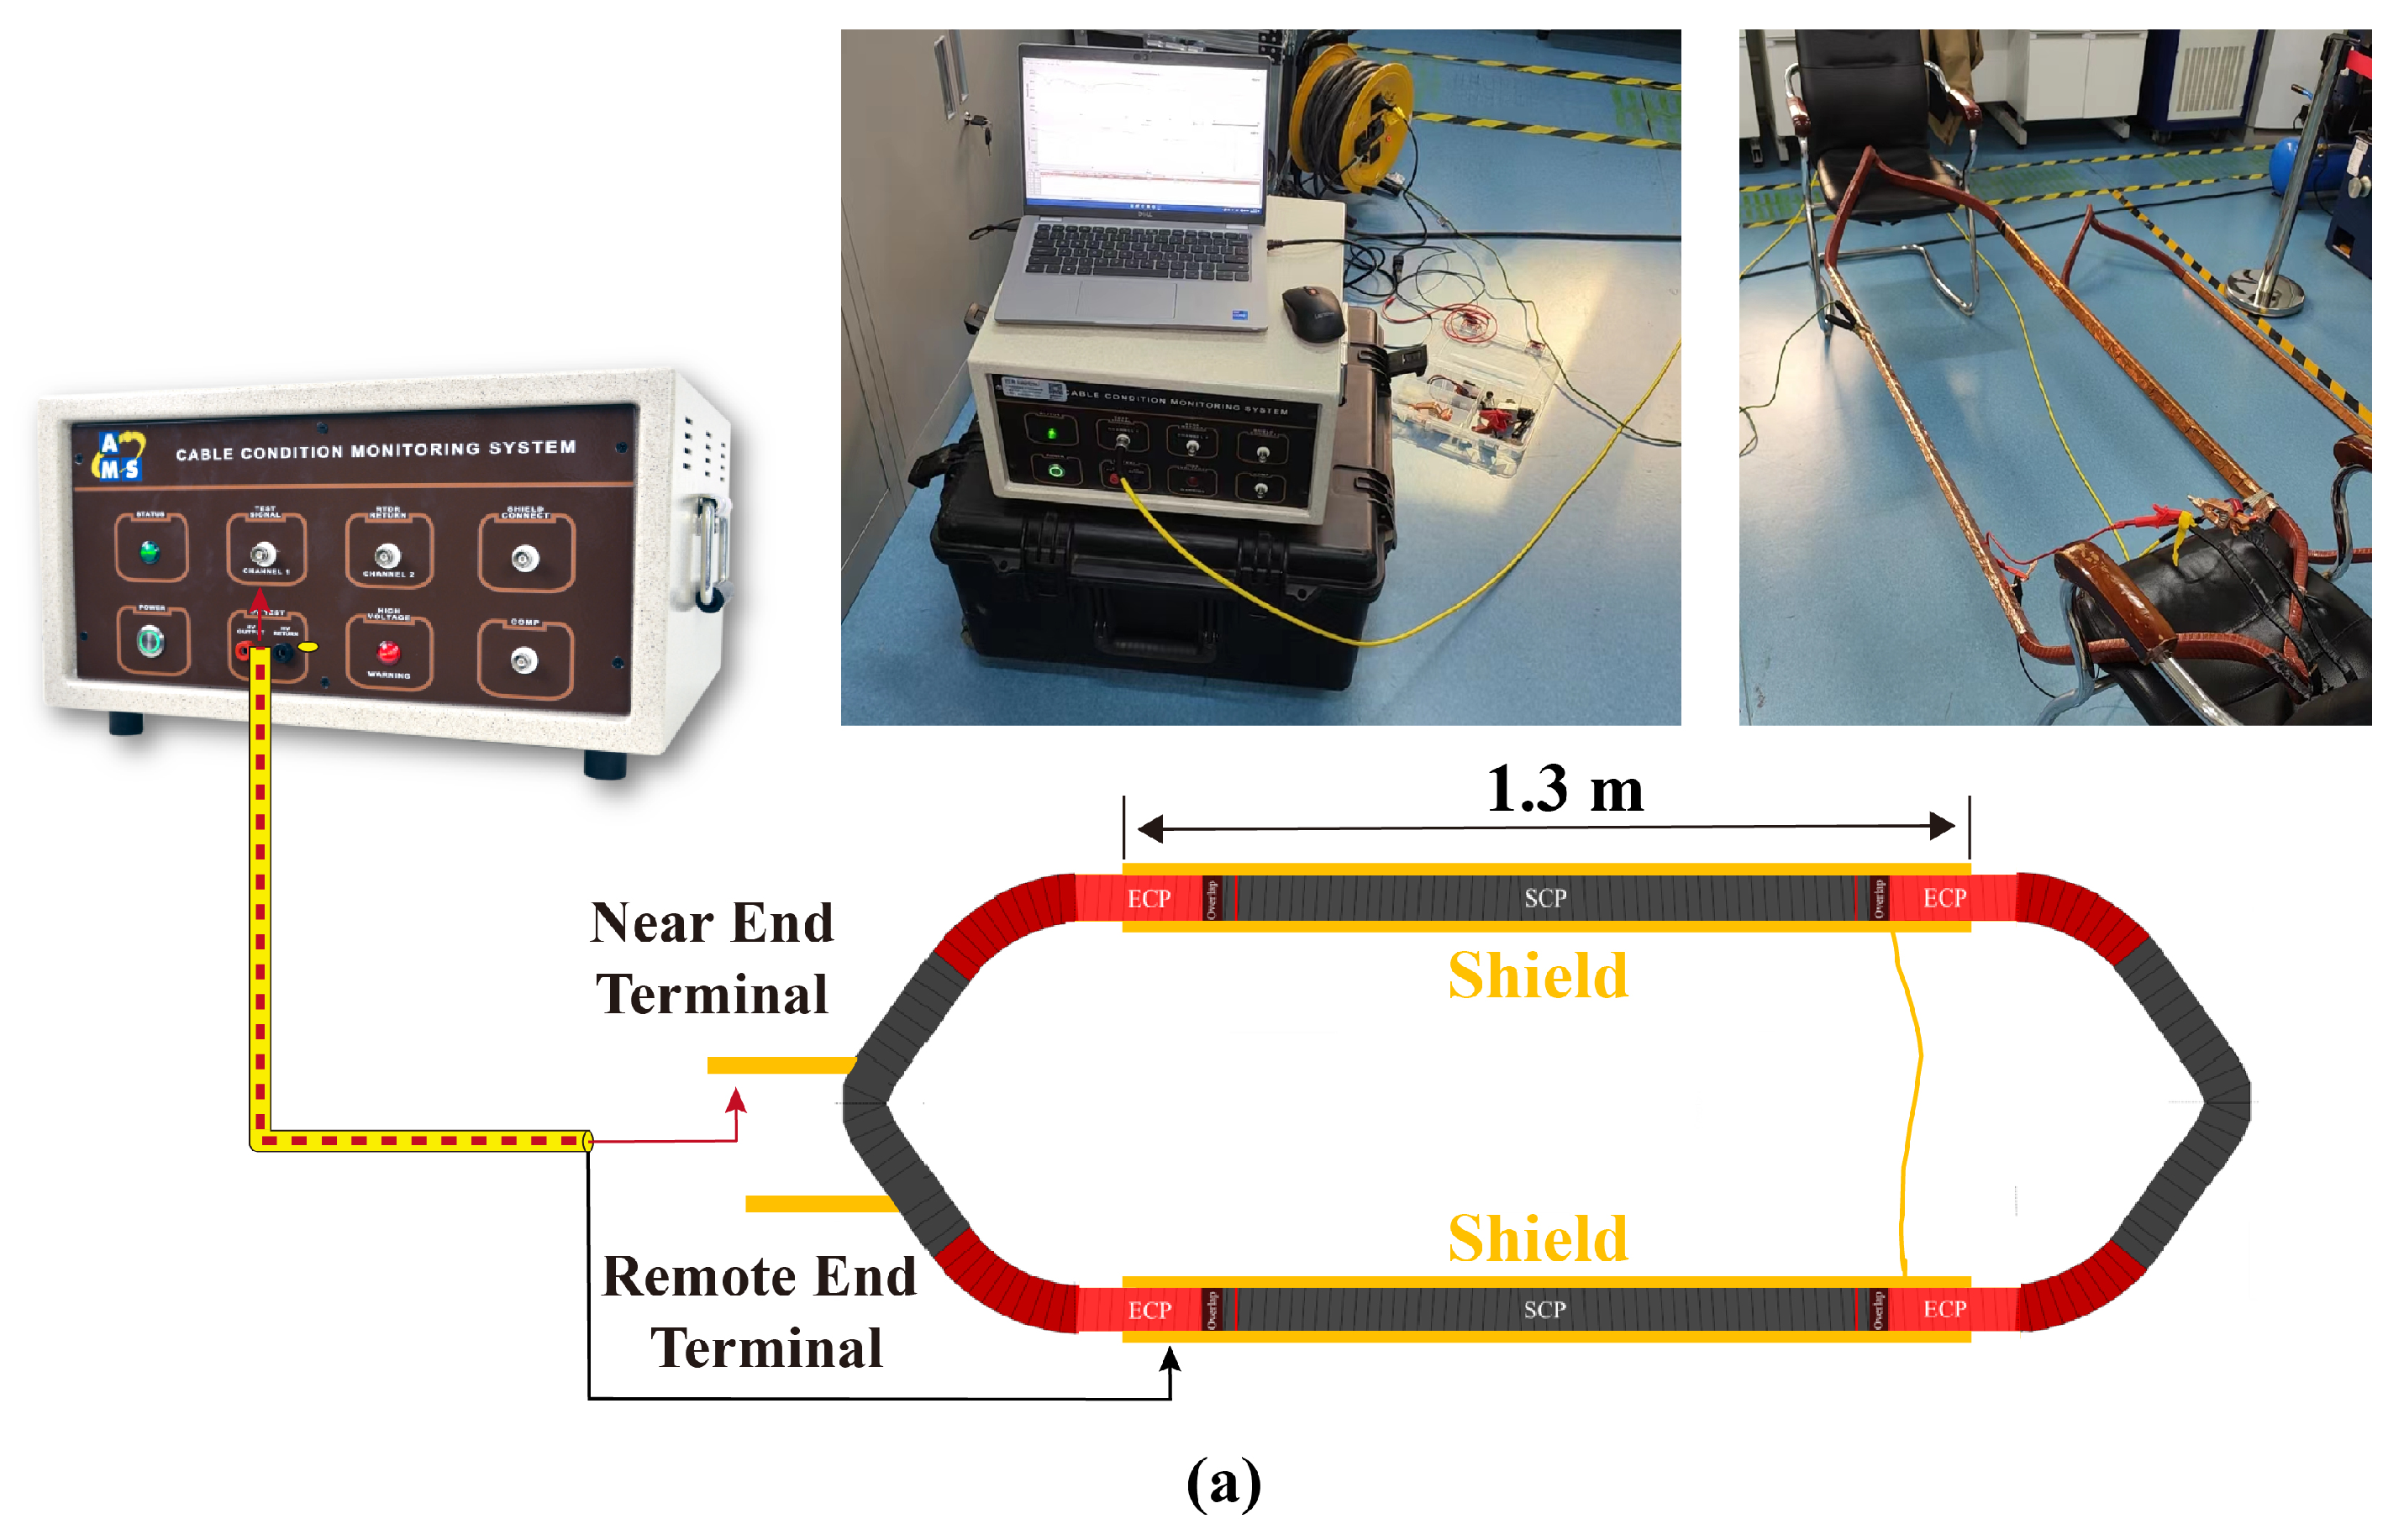
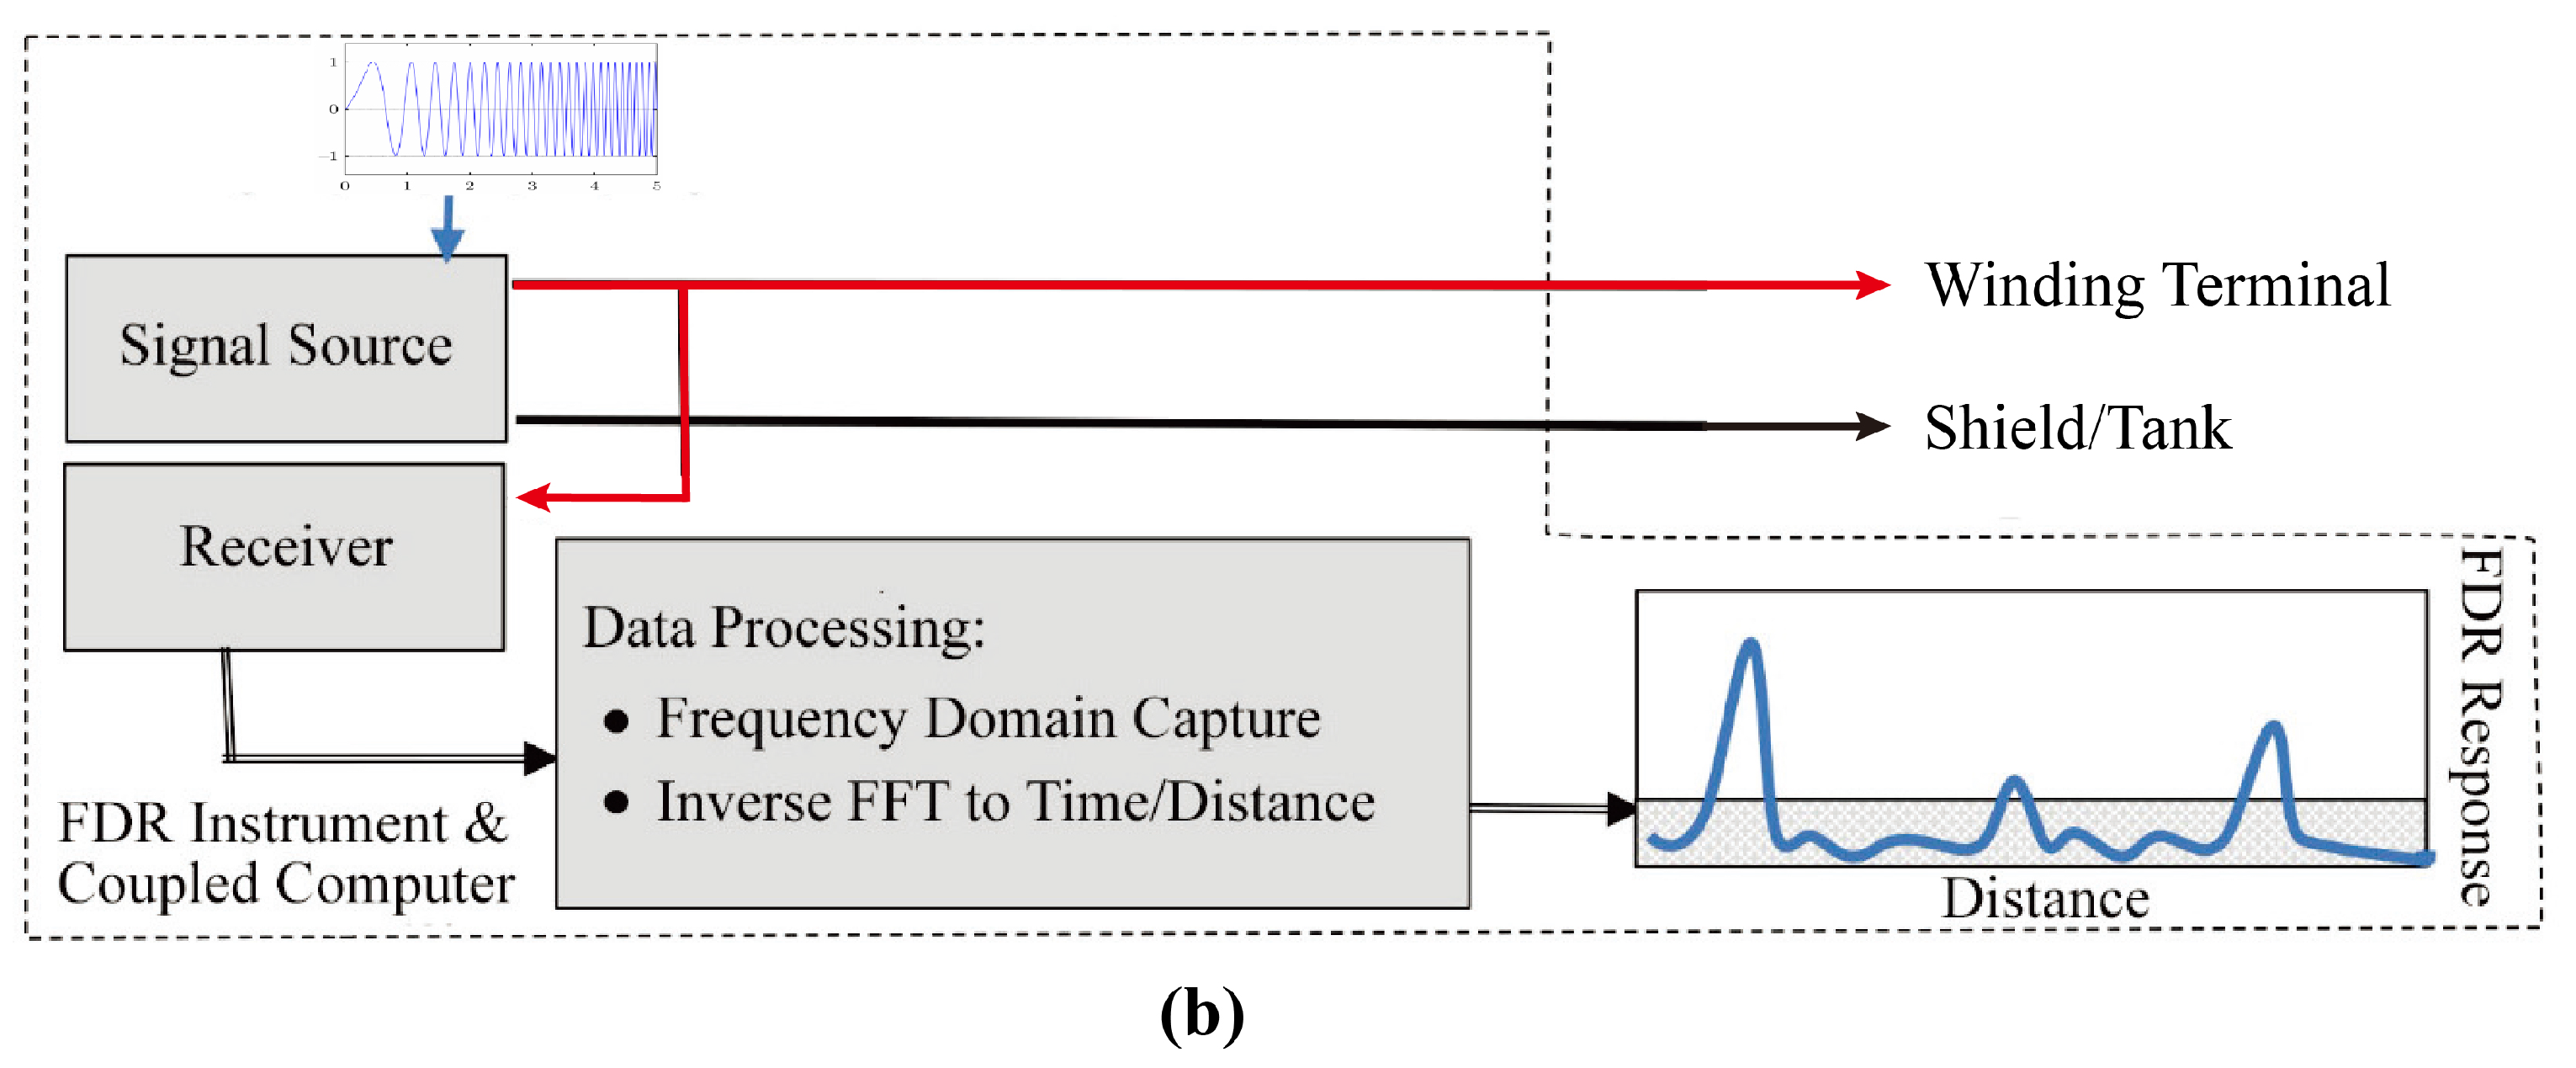
Figure 8.
Artificially-made winding coil degradations.

Figure 9.
Schematic diagram of motor FDR testing in the field.
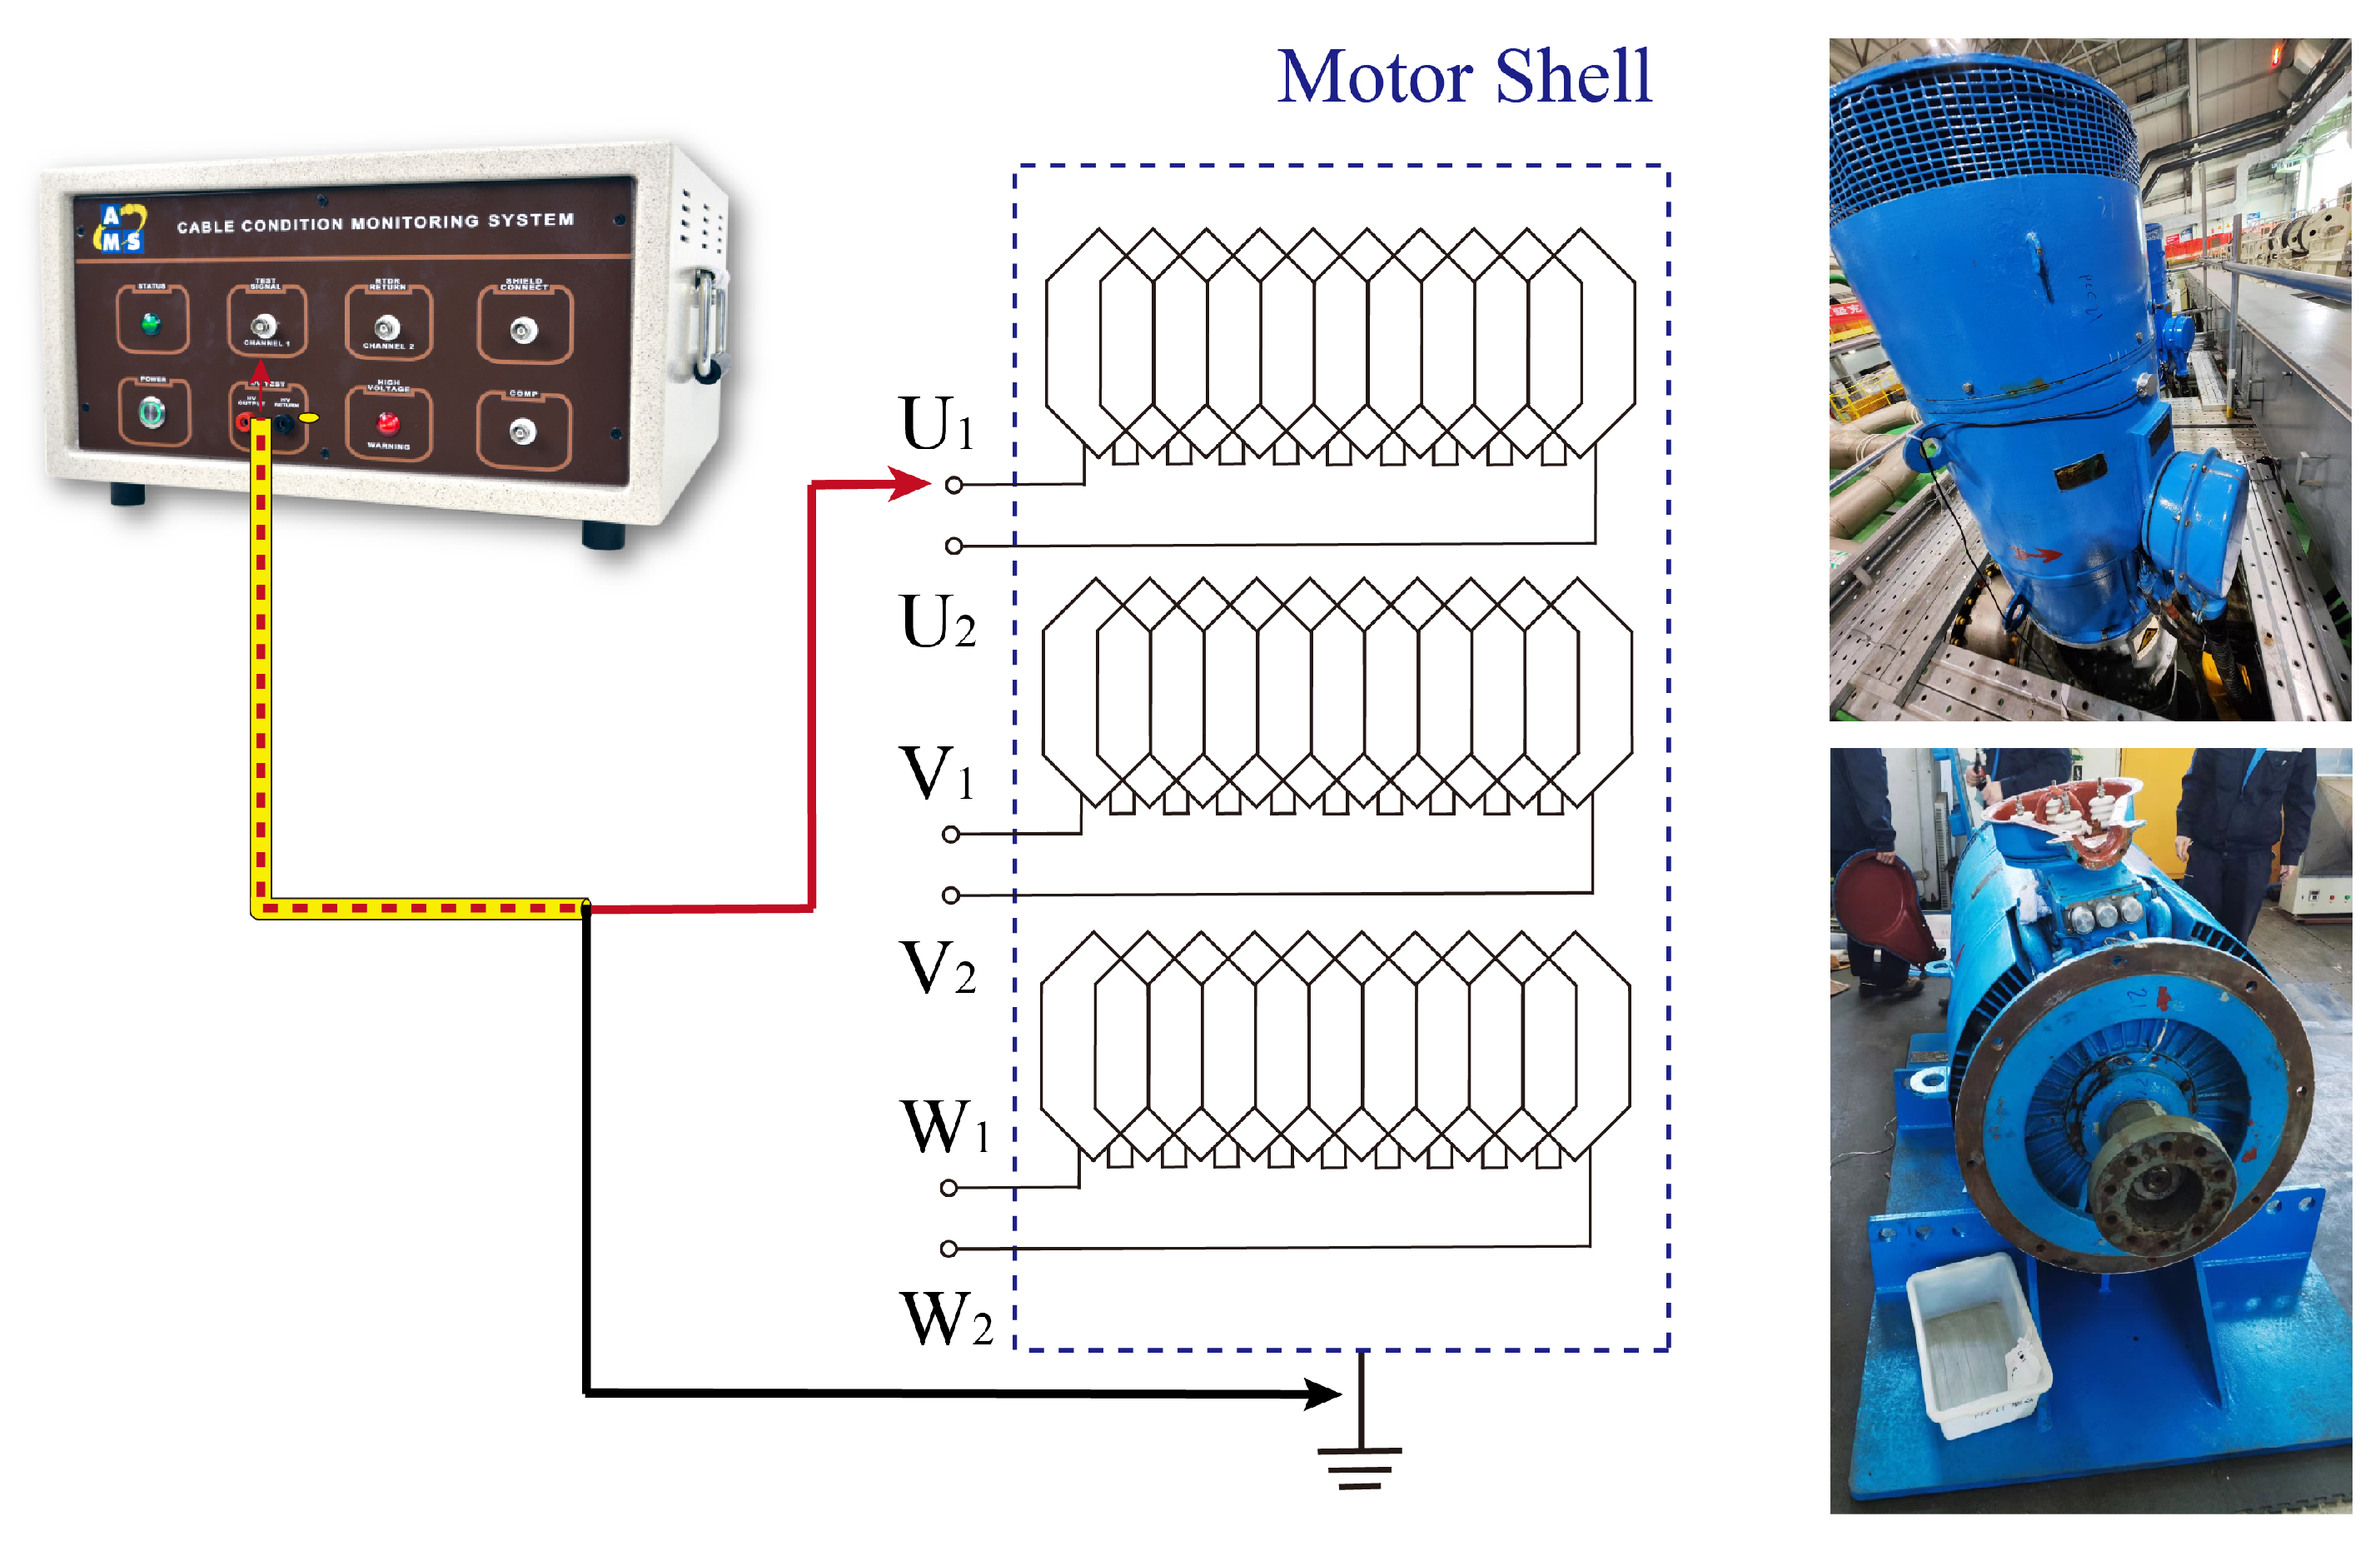
Figure 10.
Step response of the coil in good condition—blue trace: remote end open, red trace: remote end short.
Figure 10.
Step response of the coil in good condition—blue trace: remote end open, red trace: remote end short.
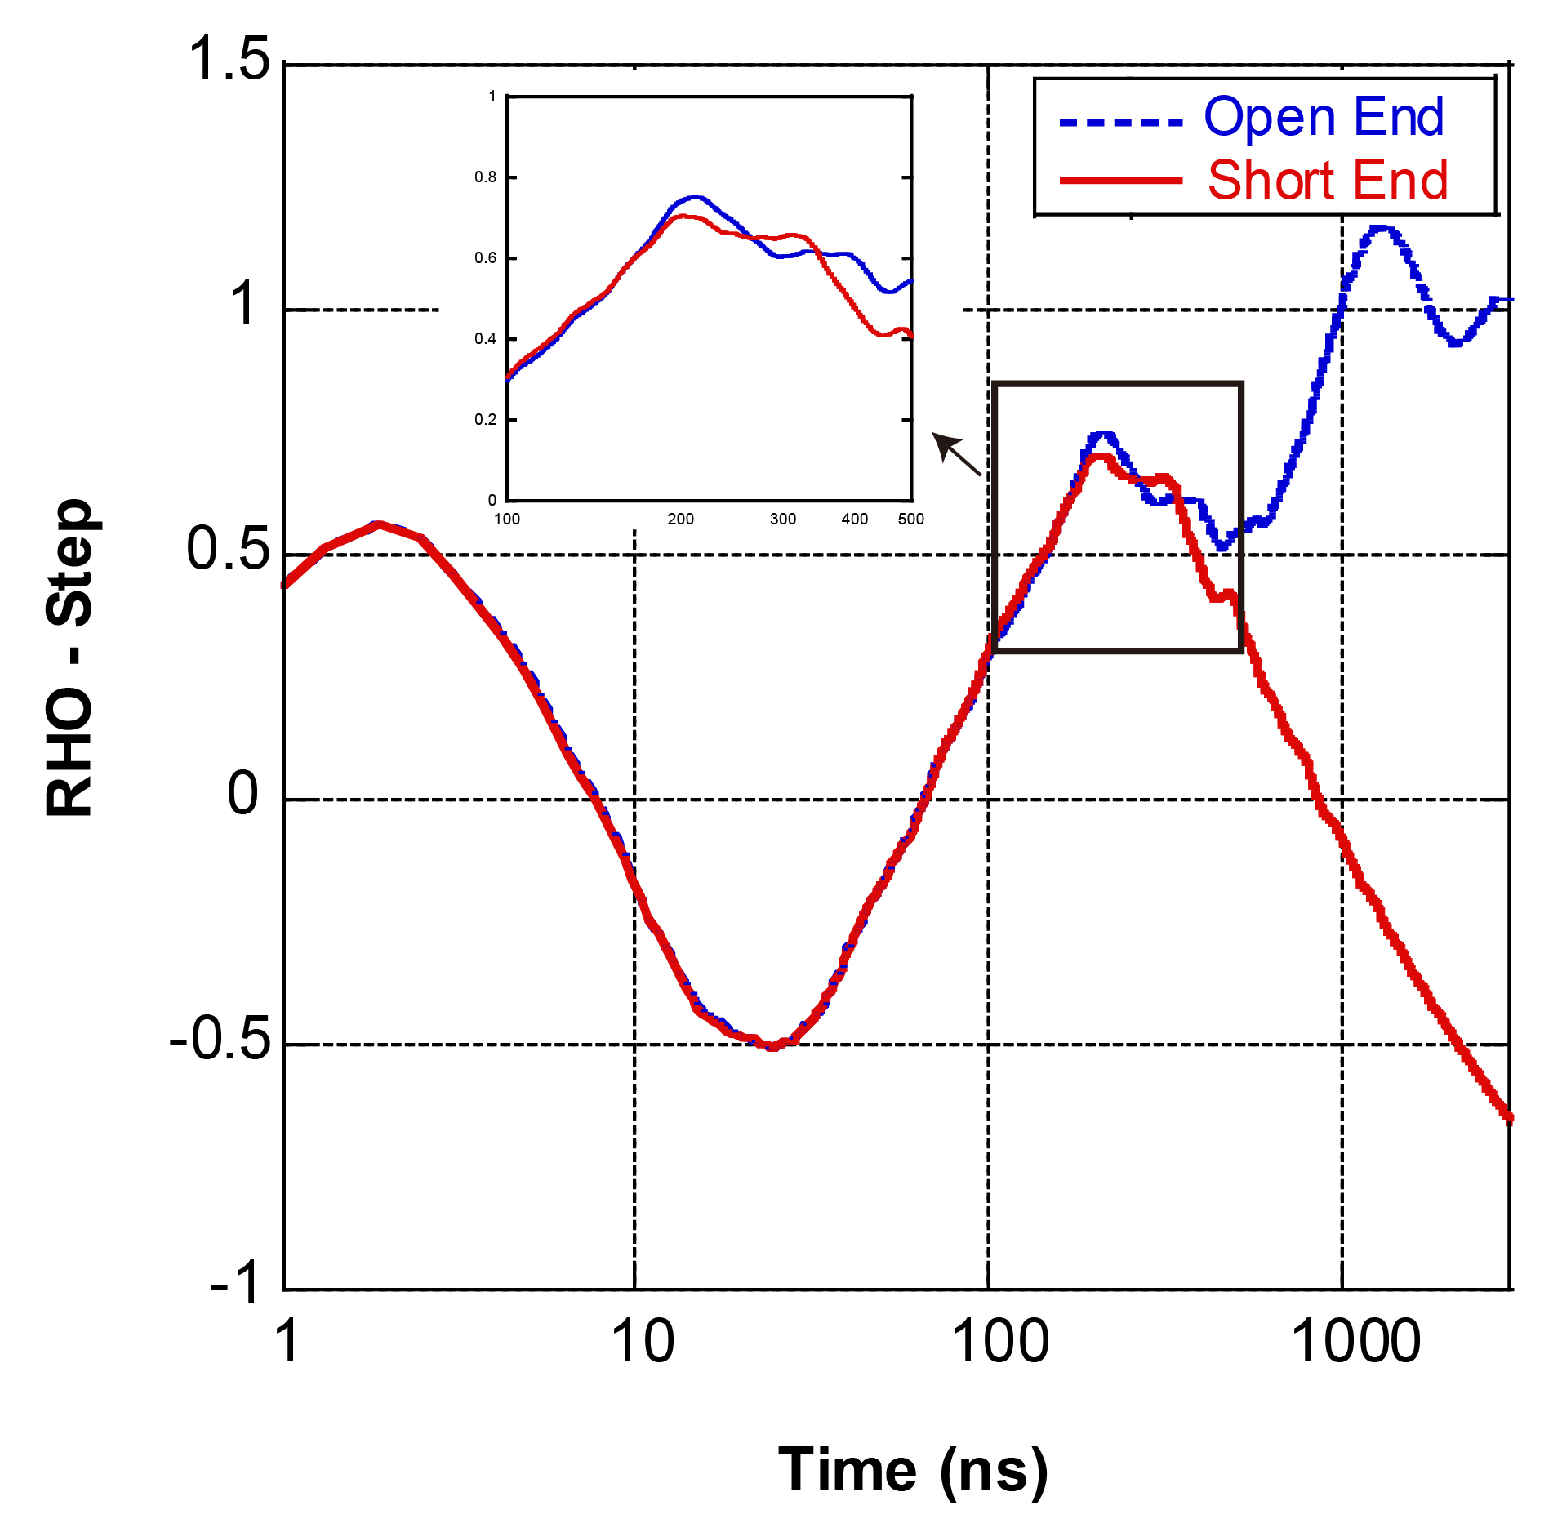
Figure 11.
Impulse response of the coil in good condition: (a) y-axis in linear scale, (b) y-axis in logarithm scale.
Figure 11.
Impulse response of the coil in good condition: (a) y-axis in linear scale, (b) y-axis in logarithm scale.
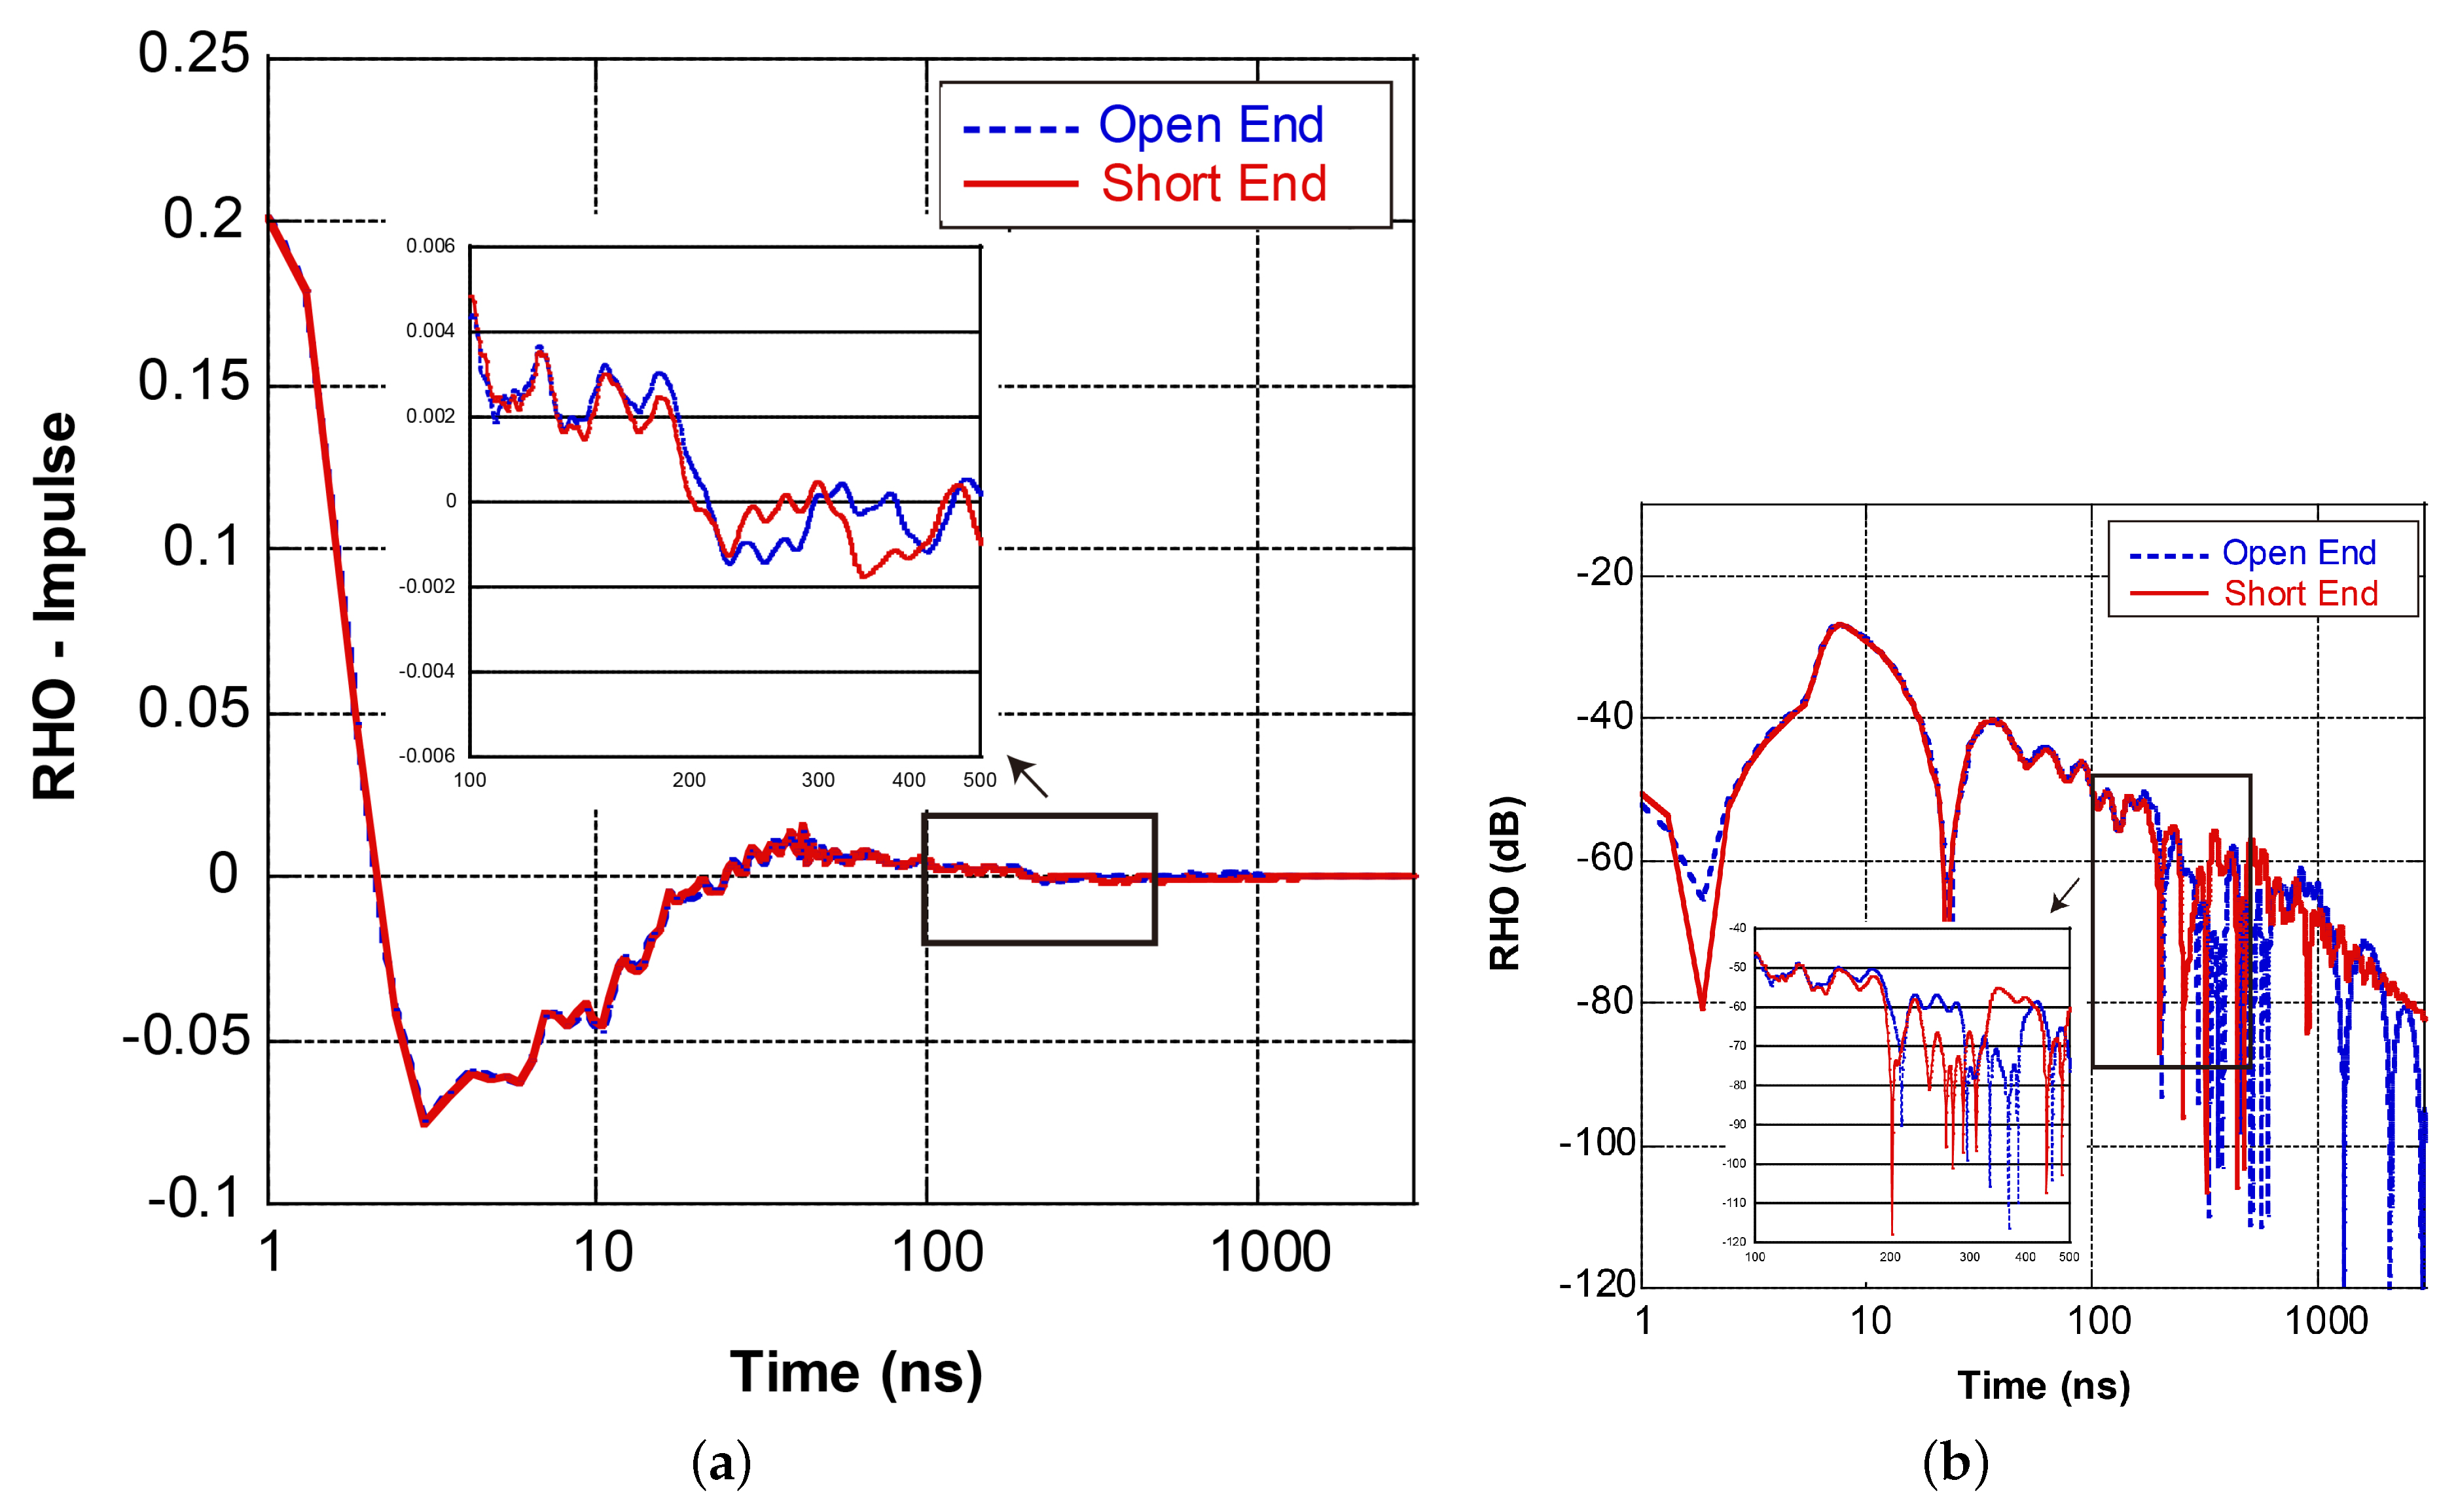
Figure 12.
Impact of the test frequency band on the FDR results (the x-axis is changed to distance by multiplying the propagation speed): (a) step response, (b) impulse response in logarithm scale.
Figure 12.
Impact of the test frequency band on the FDR results (the x-axis is changed to distance by multiplying the propagation speed): (a) step response, (b) impulse response in logarithm scale.
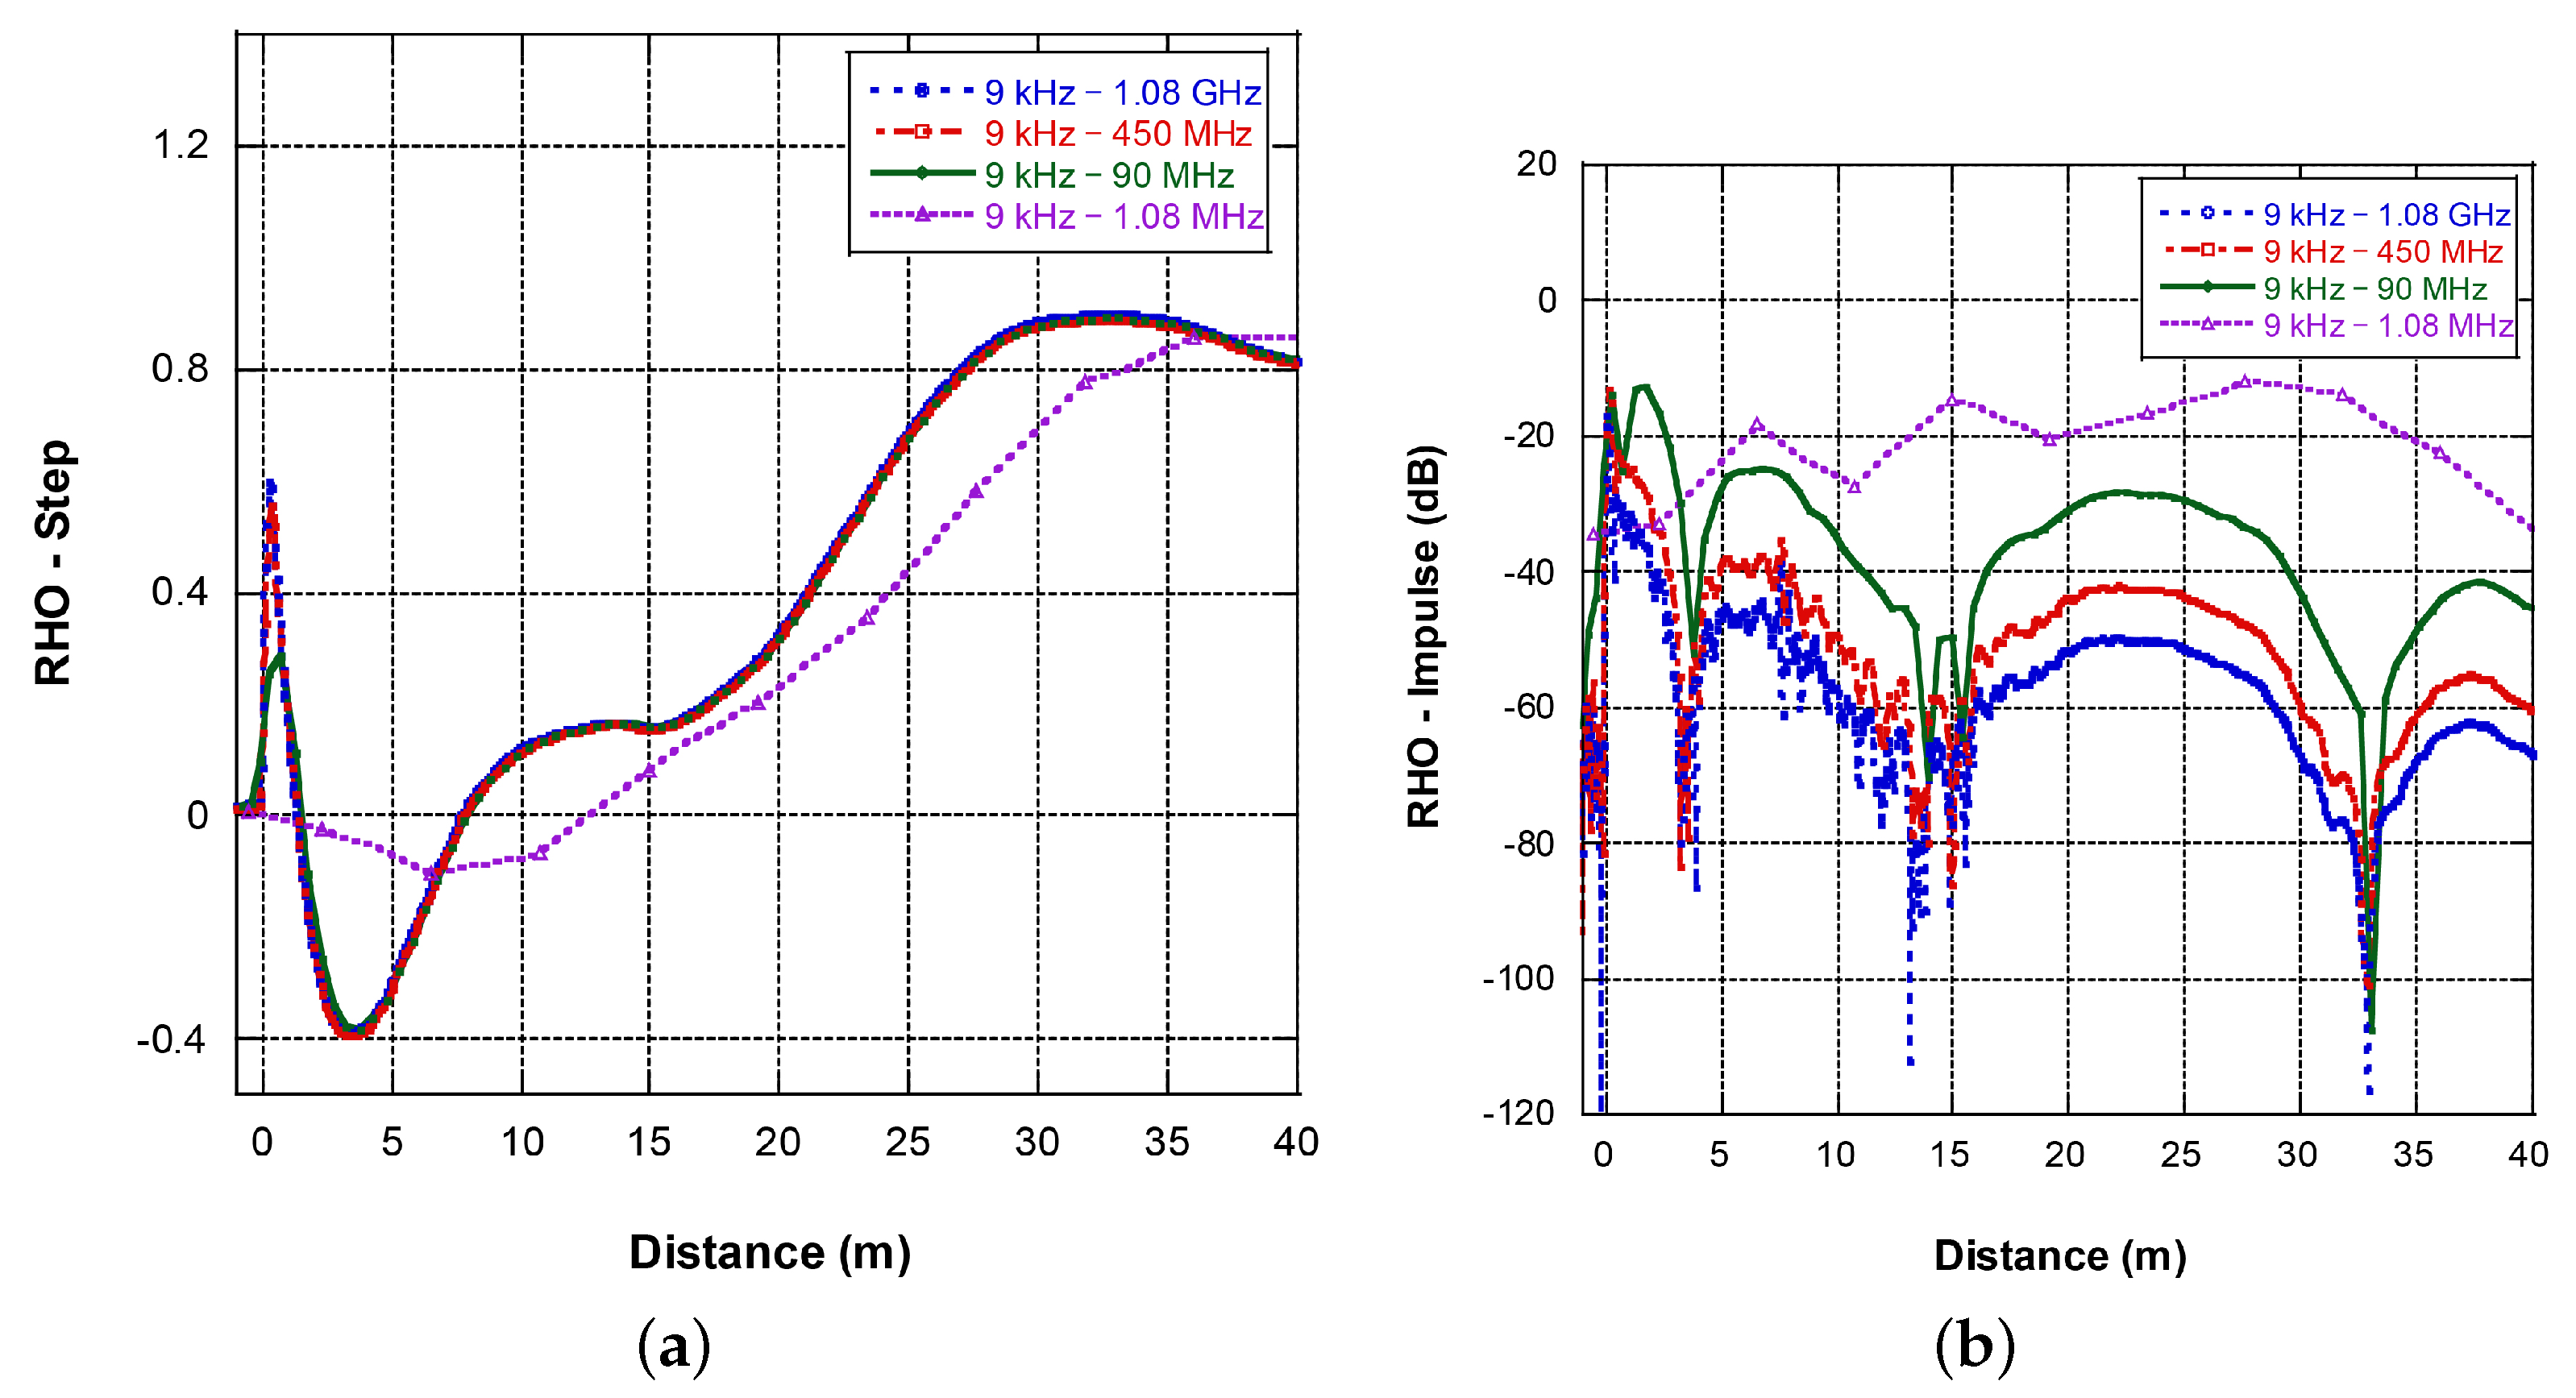
Figure 13.
FDR results of the coil with the end-winding discharge fault, measured at the near end and remote end terminal, respectively: (a) step response, (b) impulse response in logarithm scale.
Figure 13.
FDR results of the coil with the end-winding discharge fault, measured at the near end and remote end terminal, respectively: (a) step response, (b) impulse response in logarithm scale.
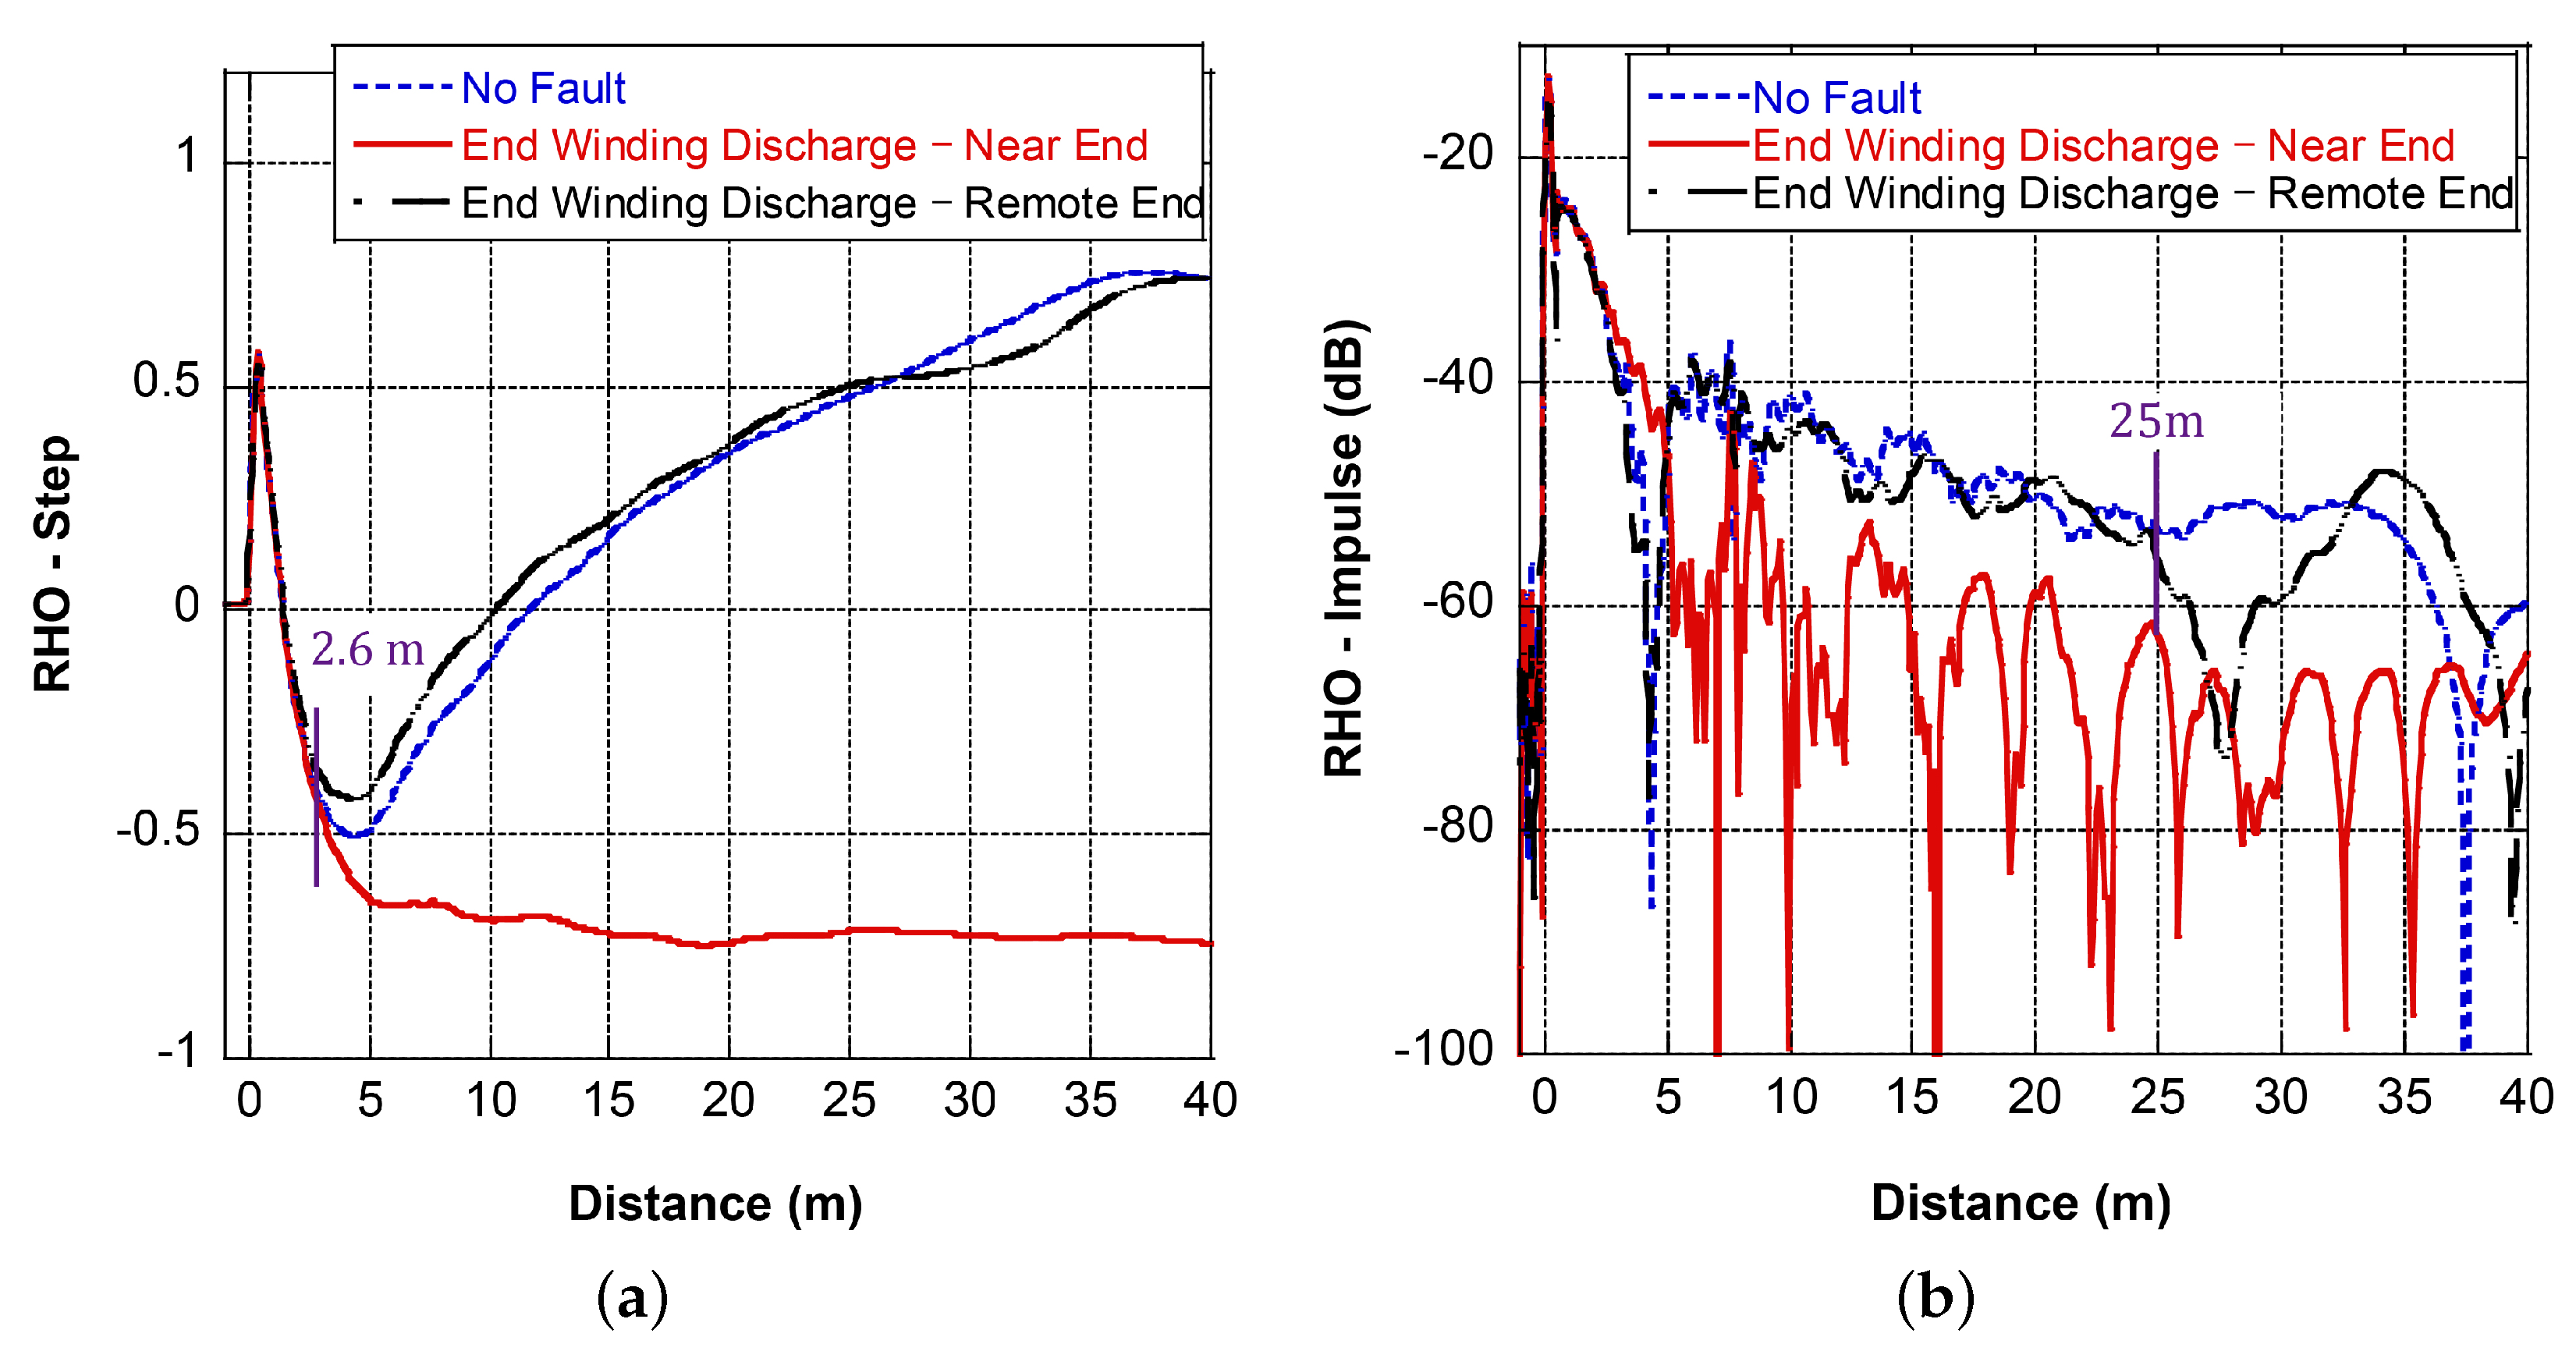
Figure 14.
FDR results of the coil with the short turn-to-turn fault, measured at the near end and remote end terminal, respectively: (a) step response, (b) impulse response in logarithm scale.
Figure 14.
FDR results of the coil with the short turn-to-turn fault, measured at the near end and remote end terminal, respectively: (a) step response, (b) impulse response in logarithm scale.

Figure 15.
FDR results of the coil with the loose slot wedge defect: (a) step response, (b) impulse response in logarithm scale.
Figure 15.
FDR results of the coil with the loose slot wedge defect: (a) step response, (b) impulse response in logarithm scale.
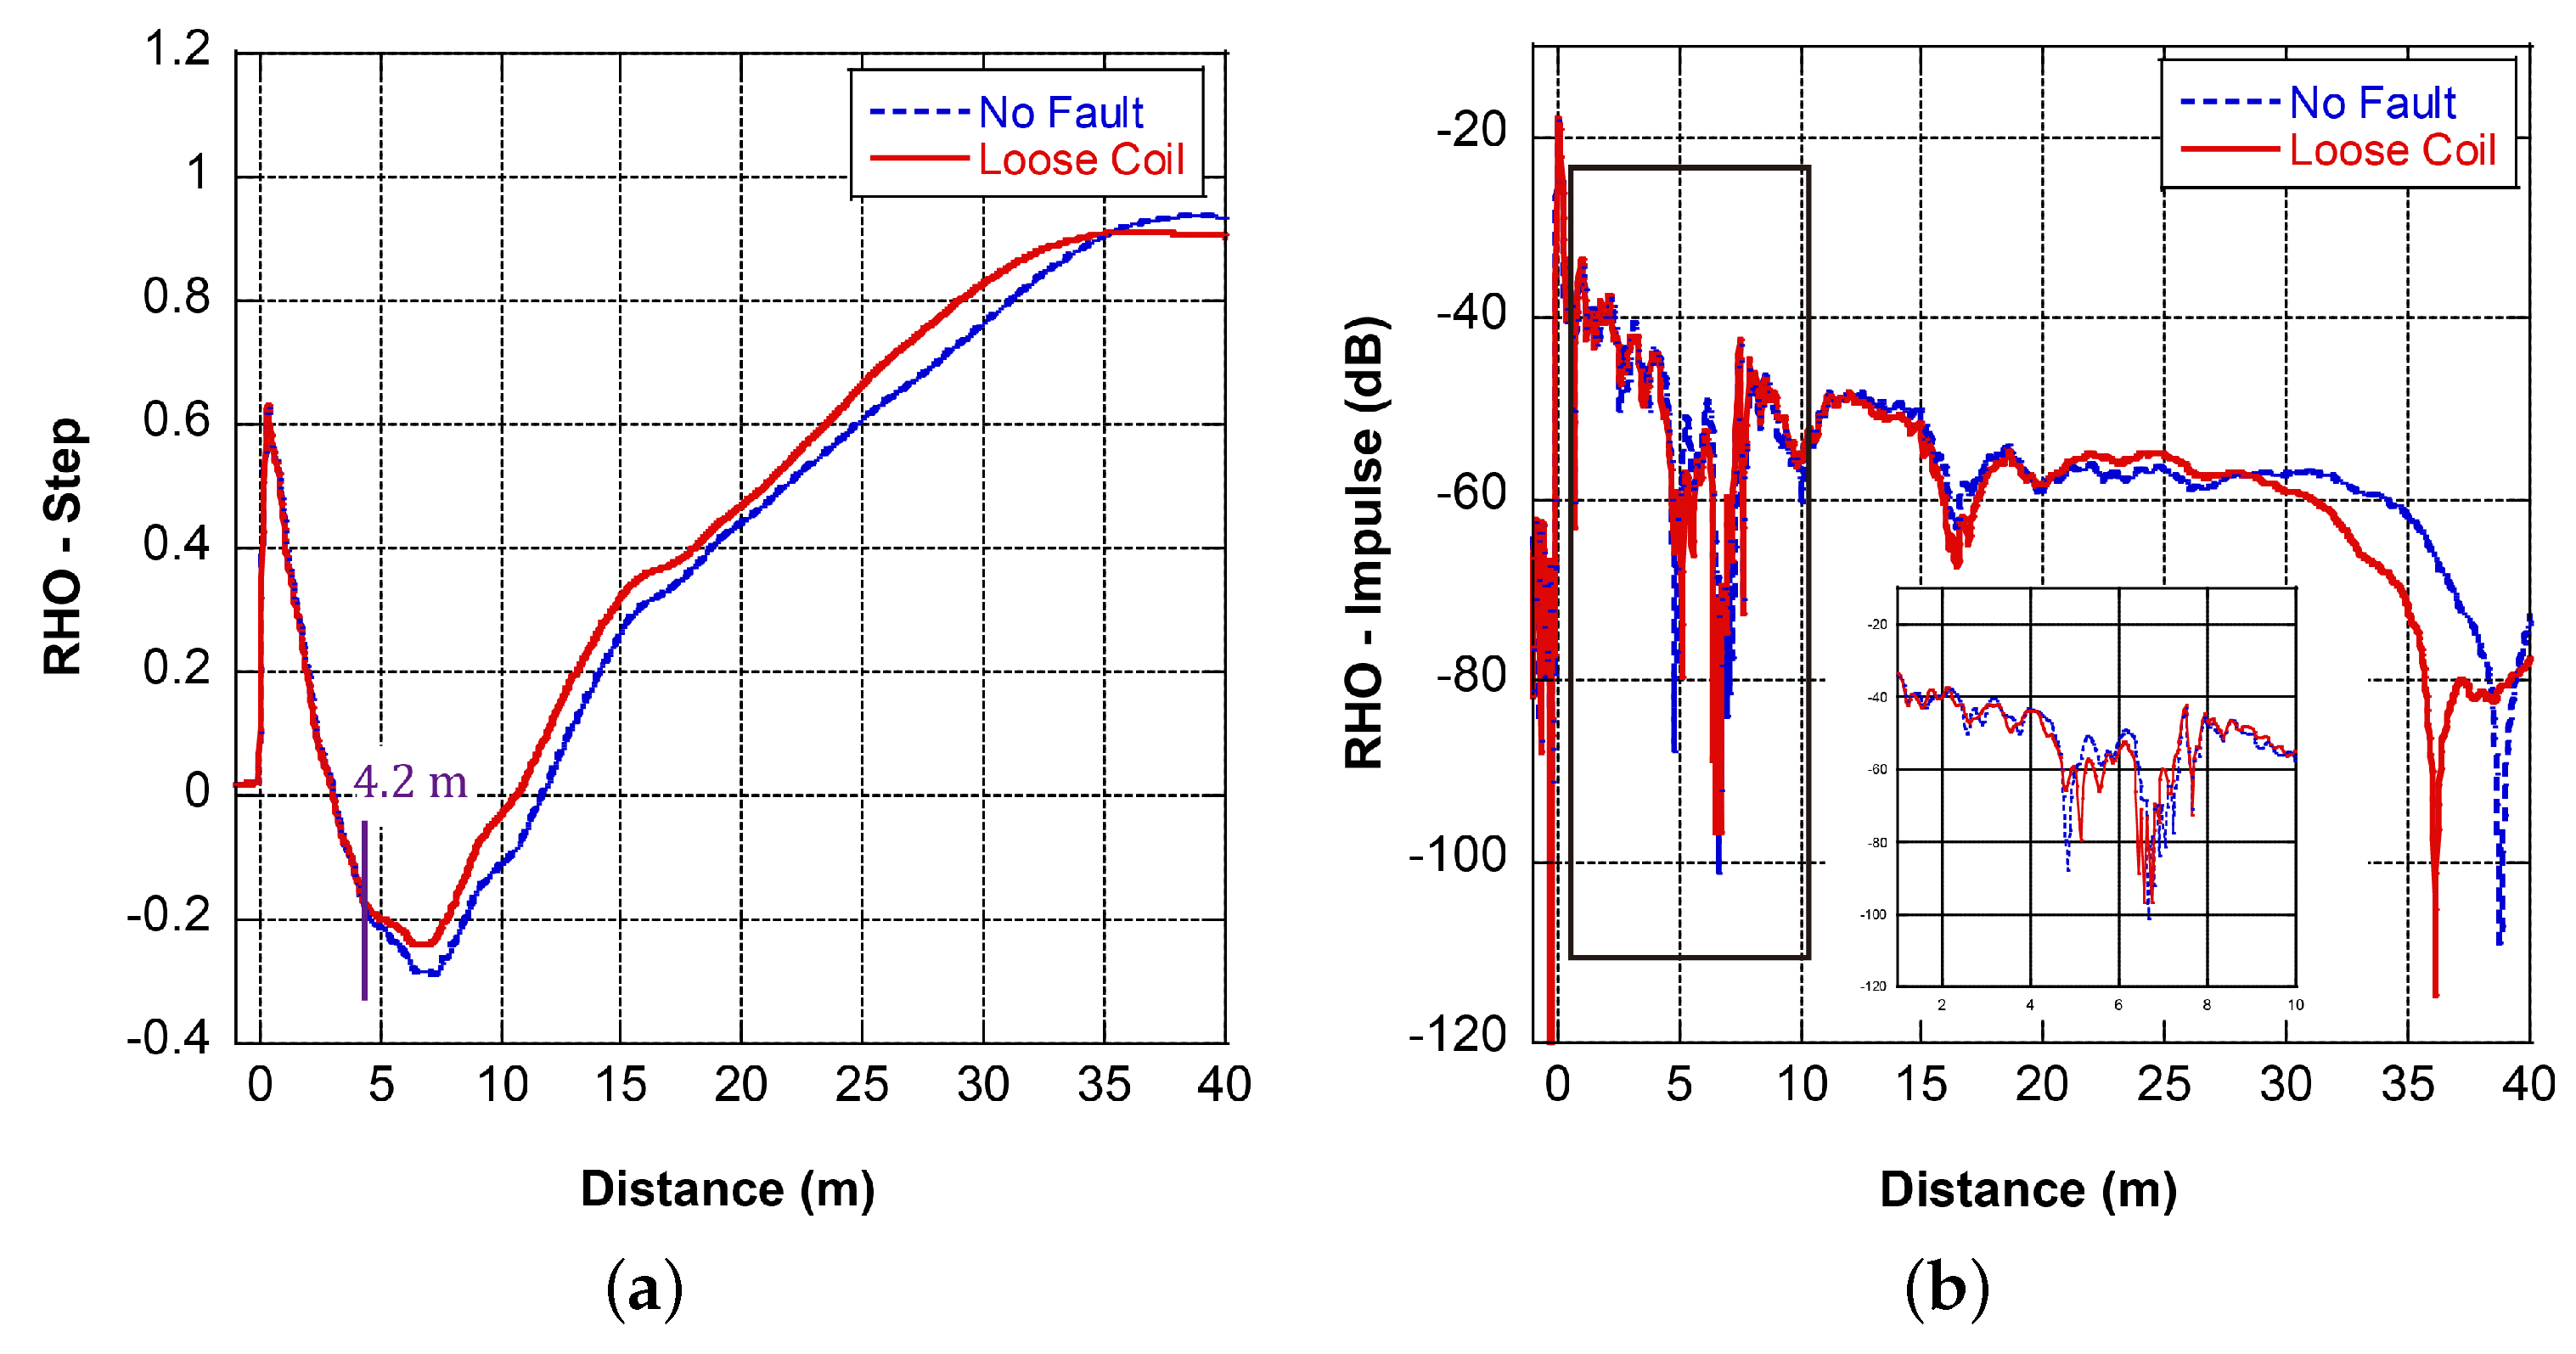
Figure 16.
FDR results of the coil with the local overheating defect: (a) step response, (b) impulse response in logarithm scale.
Figure 16.
FDR results of the coil with the local overheating defect: (a) step response, (b) impulse response in logarithm scale.
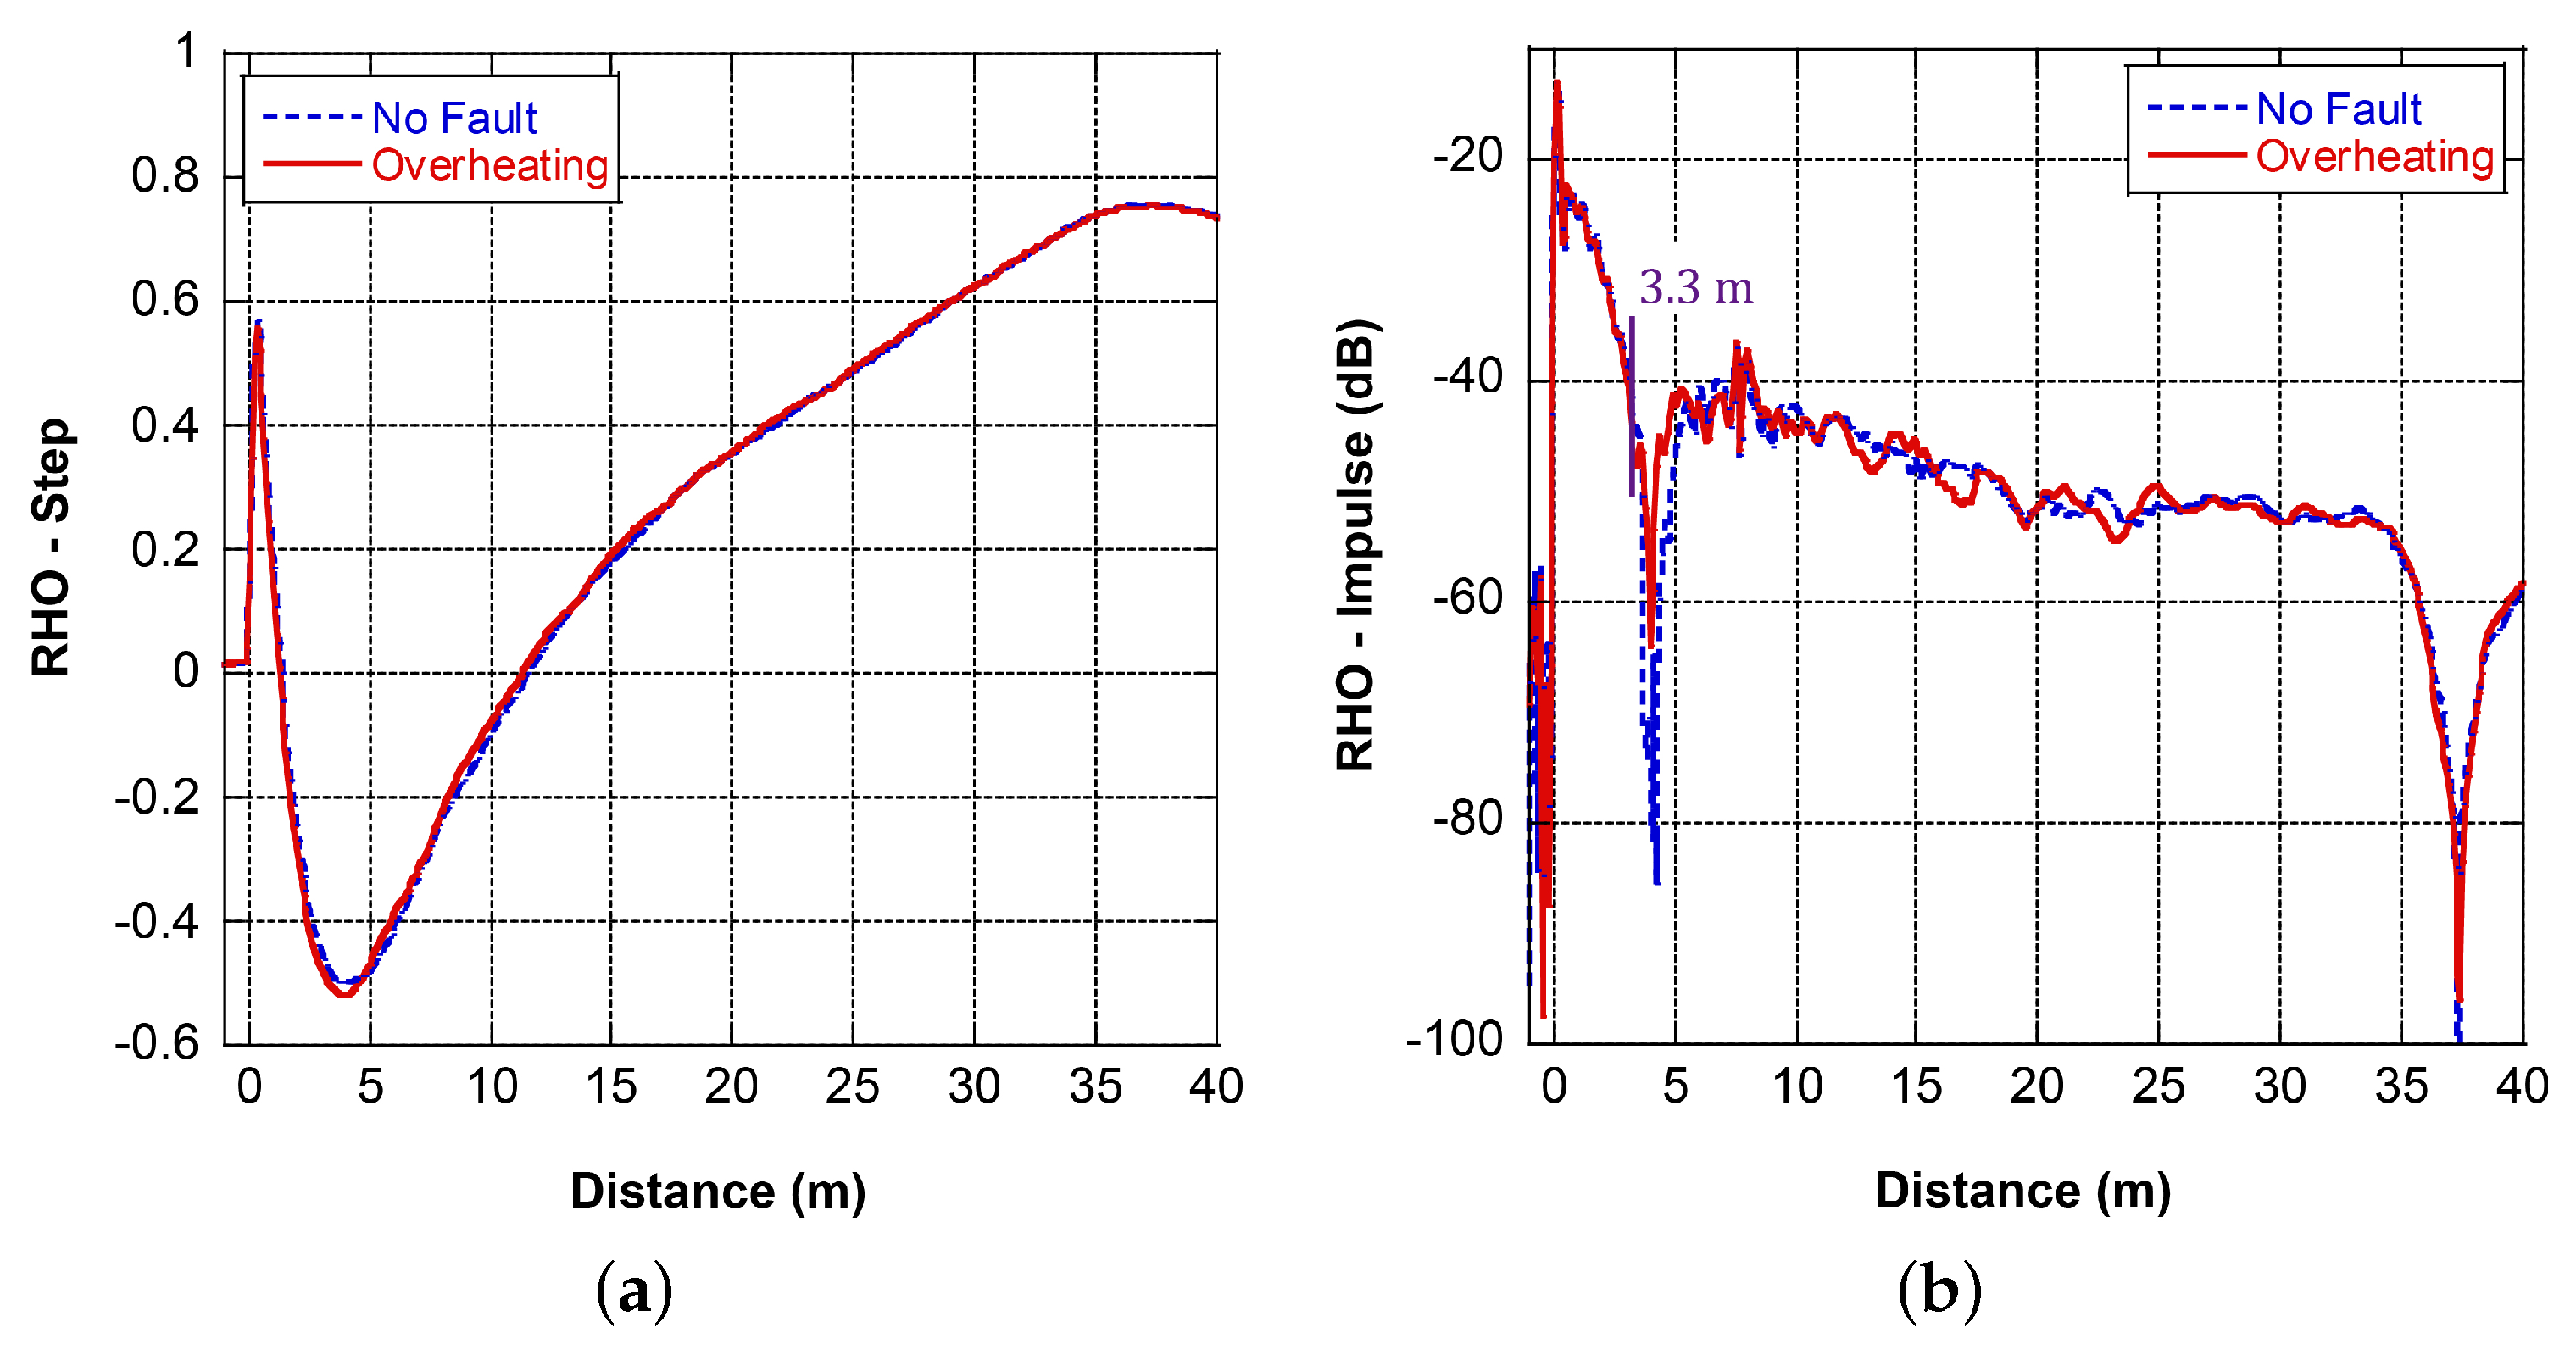
Figure 17.
FDR results of two coils in series with the tracking fault: (a) step response, (b) impulse response in logarithm scale.
Figure 17.
FDR results of two coils in series with the tracking fault: (a) step response, (b) impulse response in logarithm scale.
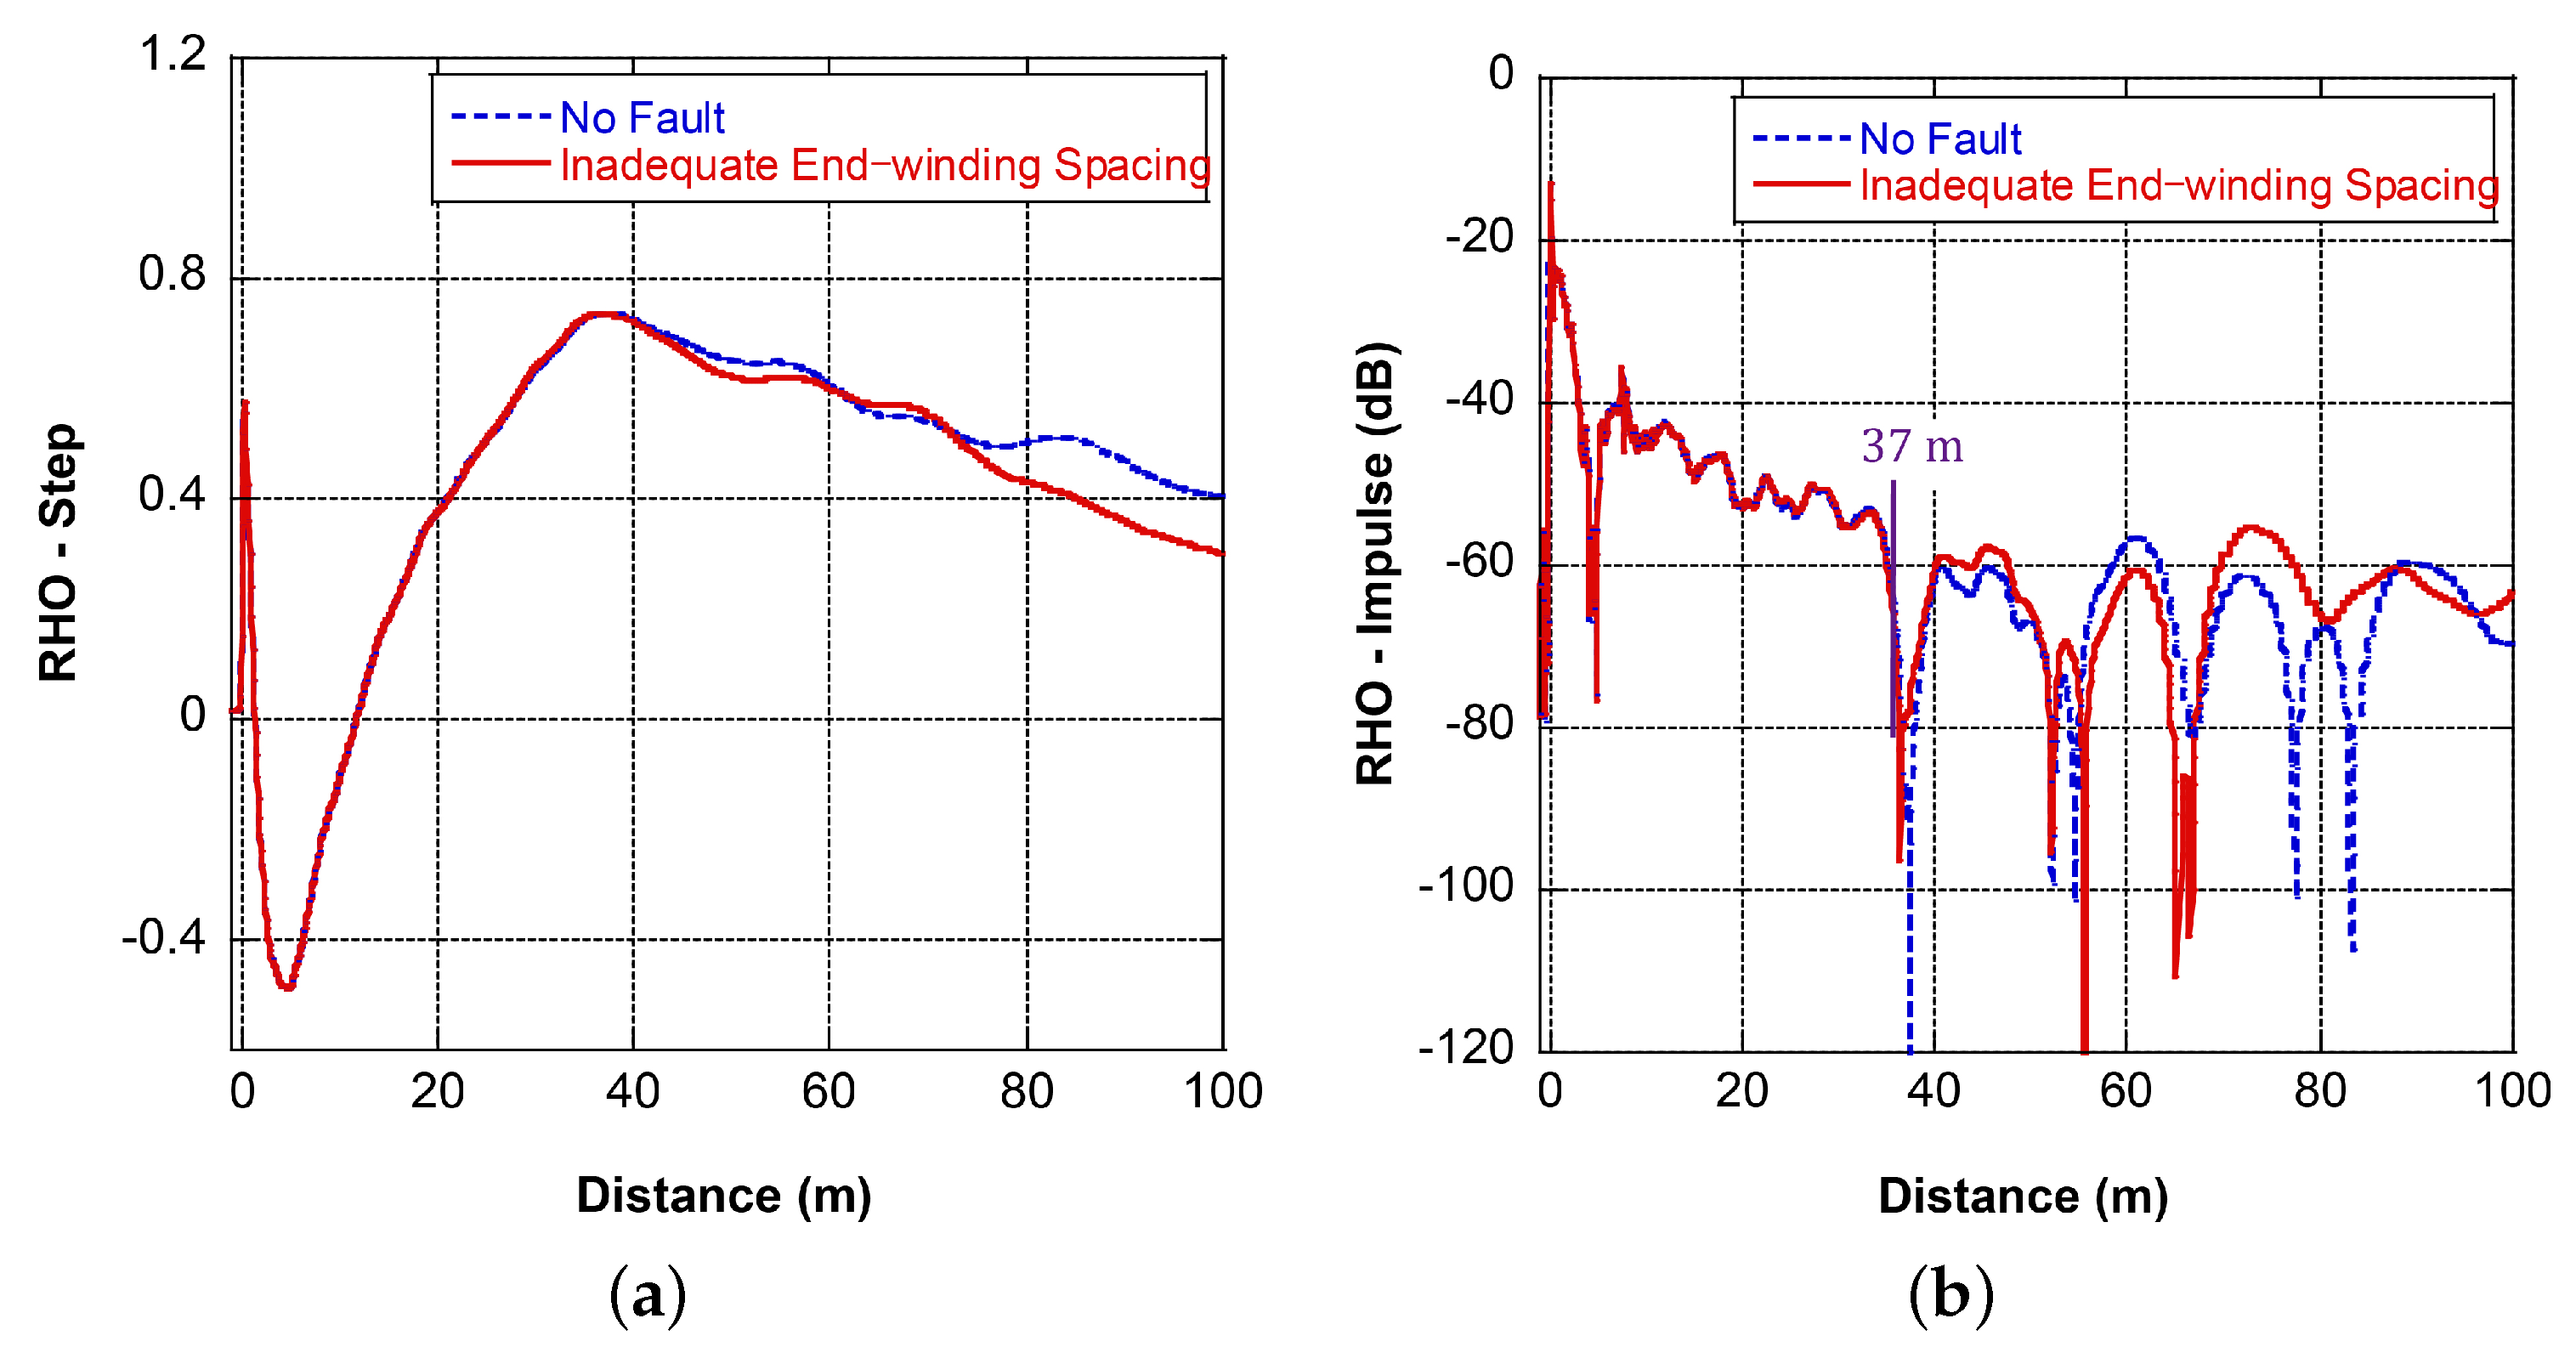
Figure 18.
Three–phase FDR results of pump #1: (a) step response, (b) impulse response in logarithm scale.
Figure 18.
Three–phase FDR results of pump #1: (a) step response, (b) impulse response in logarithm scale.

Figure 19.
Three–phase FDR results of pump #2: (a) step response, (b) impulse response in logarithm scale.
Figure 19.
Three–phase FDR results of pump #2: (a) step response, (b) impulse response in logarithm scale.

Table 1.
Dielectric response and PD measurement results of a motor fleet in a nuclear power plant.
| No. | Power Rating (kW) | IR () | (%) | 1 (%) | 2 PD (pC) |
|---|---|---|---|---|---|
| 1 | 400 | 0.42 | 8.00 | 6.43 | 3760 |
| 2 | 400 | 4.50 | 6.49 | 6.80 | 1780 |
| 3 | 400 | 1.20 | 6.19 | 7.25 | 1000 |
| 4 | 315 | 0.012 | 13.08 | 1.64 | 630 |
| 5 | 315 | 0.049 | 13.95 | 1.13 | 460 |
| 6 | 315 | 0.041 | 18.78 | 1.52 | 820 |
| 7 | 3200 | 32 | 0.90 | 1.69 | 680 |
| 8 | 3200 | 45 | 0.85 | 1.29 | 5140 |
| 9 | 3200 | 7.1 | 2.23 | 1.54 | 15,900 |
| 10 | 4500 | 11 | 1.41 | 0.31 | 3820 |
| 11 | 4500 | 9.4 | 1.35 | 0.34 | 5350 |
| 12 | 4500 | 9.9 | 1.42 | 0.39 | 4120 |
| 13 | 300 | 34 | 0.76 | 12.92 | 15,800 |
| 14 | 300 | 49 | 0.67 | 1.72 | 9650 |
1 Difference in the power factor results measured at 20% and 80% of the rated phase voltage. 2 Measured at the rated phase voltage 6.6 kV for three phases.
Table 2.
Winding coil FDR results summary.
| Problems | FDR Characteristic | Fault Location (Detected/Actual) | FDR Sensitivity |
|---|---|---|---|
| End-winding discharge | A prominent drop in the magnitude at the fault location | 2.6 m/2.4 m | High |
| Turn-to-turn short | A prominent drop in the magnitude at the fault location; reduced apparent length | 2.6 m/2.4 m | High |
| Loose slot wedge | Slight increase in the step response magnitude at the fault location; reduced apparent length | 4.2 m/4.5 m | High/Medium |
| Local overheating | Periodic oscillation of the impulse response trace | 3.3 m/3.5 m | Medium |
| Tracking between coils | Obvious trace pattern change | 37 m/28.8 m | High |
Disclaimer/Publisher’s Note: The statements, opinions and data contained in all publications are solely those of the individual author(s) and contributor(s) and not of MDPI and/or the editor(s). MDPI and/or the editor(s) disclaim responsibility for any injury to people or property resulting from any ideas, methods, instructions or products referred to in the content. |
© 2023 by the authors. Licensee MDPI, Basel, Switzerland. This article is an open access article distributed under the terms and conditions of the Creative Commons Attribution (CC BY) license (https://creativecommons.org/licenses/by/4.0/).
Share and Cite
MDPI and ACS Style
Cheng, J.; Zhang, Y.; Yun, H.; Wang, L.; Taylor, N. A Study of Frequency Domain Reflectometry Technique for High-Voltage Rotating Machine Winding Condition Assessment. Machines 2023, 11, 883. https://doi.org/10.3390/machines11090883
AMA Style
Cheng J, Zhang Y, Yun H, Wang L, Taylor N. A Study of Frequency Domain Reflectometry Technique for High-Voltage Rotating Machine Winding Condition Assessment. Machines. 2023; 11(9):883. https://doi.org/10.3390/machines11090883
Chicago/Turabian StyleCheng, Jialu, Yizhou Zhang, Hao Yun, Liang Wang, and Nathaniel Taylor. 2023. "A Study of Frequency Domain Reflectometry Technique for High-Voltage Rotating Machine Winding Condition Assessment" Machines 11, no. 9: 883. https://doi.org/10.3390/machines11090883
Note that from the first issue of 2016, this journal uses article numbers instead of page numbers. See further details here.